Australasian sky islands act as a diversity pump ... · PDF fileAustralasian sky islands act...
19
Australasian sky islands act as a diversity pump facilitating peripheral speciation and complex reversal from narrow endemic to widespread ecological supertramp Emmanuel F. A. Toussaint 1 , Katayo Sagata 2 , Suriani Surbakti 3 , Lars Hendrich 1 & Michael Balke 1,4 1 Zoological State Collection, M€ unchhausenstraße 21, Munich, 81247, Germany 2 Papua New Guinea Institute for Biological research (PNG-IBR), Goroka, Papua New Guinea 3 Jurusan Biology, FMIPA-Universitas Cendrawasih, Kampus Baru, Jayapura, Papua, Indonesia 4 GeoBioCenter, Ludwig-Maximilians-University, Munich, Germany Keywords Australian region, diversity pump, highlands, New Guinea, New Zealand, peripheral speciation. Correspondence Emmanuel F.A. Toussaint, Zoological State Collection, M€ unchhausenstraße 21, Munich, 81247, Germany. Tel: +49 898107155; Fax: +49 898107300; E-mail: [email protected] Funding Information This study was supported by German Science Foundation (DFG) grants BA2152/6-1, 7-1 and 11-1. Received: 11 January 2013; Revised: 29 January 2013; Accepted: 1 February 2013 doi: 10.1002/ece3.517 Abstract The Australasian archipelago is biologically extremely diverse as a result of a highly puzzling geological and biological evolution. Unveiling the underlying mechanisms has never been more attainable as molecular phylogenetic and geo- logical methods improve, and has become a research priority considering increasing human-mediated loss of biodiversity. However, studies of finer scaled evolutionary patterns remain rare particularly for megadiverse Melanesian biota. While oceanic islands have received some attention in the region, likewise insu- lar mountain blocks that serve as species pumps remain understudied, even though Australasia, for example, features some of the most spectacular tropical alpine habitats in the World. Here, we sequenced almost 2 kb of mitochondrial DNA from the widespread diving beetle Rhantus suturalis from across Austral- asia and the Indomalayan Archipelago, including remote New Guinean high- lands. Based on expert taxonomy with a multigene phylogenetic backbone study, and combining molecular phylogenetics, phylogeography, divergence time estimation, and historical demography, we recover comparably low geo- graphic signal, but complex phylogenetic relationships and population structure within R. suturalis. Four narrowly endemic New Guinea highland species are subordinated and two populations (New Guinea, New Zealand) seem to consti- tute cases of ongoing speciation. We reveal repeated colonization of remote mountain chains where haplotypes out of a core clade of very widespread hapl- otypes syntopically might occur with well-isolated ones. These results are cor- roborated by a Pleistocene origin approximately 2.4 Ma ago, followed by a sudden demographic expansion 600,000 years ago that may have been initiated through climatic adaptations. This study is a snapshot of the early stages of lineage diversification by peripatric speciation in Australasia, and supports New Guinea sky islands as cradles of evolution, in line with geological evidence sug- gesting very recent origin of high altitudes in the region. Introduction Deciphering the mechanisms of species formation is one of the most fascinating and challenging areas of evolu- tionary biology (Darwin and Wallace 1858; Darwin 1859; Mayr and Diamond 2001; Coyne and Orr 2004; Fitzpa- trick et al. 2009; Santini et al. 2012). Many studies on bi- ogeographic and ecological factors promoting speciation have helped to establish the separation by physical barri- ers (“vicariance”) followed by genomic isolation as the null hypothesis that begets new species (Lynch 1989; Bar- raclough and Vogler 2000; Mayr and Diamond 2001; Johannesson 2010; Santini et al. 2012). However, although restriction of gene flow and allopatric speciation appear to be the most common mechanisms, different processes have also been documented through the years (White 1968; de Aguiar et al. 2009; Johannesson 2010). For instance, sympatric speciation, suggested already by ª 2013 The Authors. Published by Blackwell Publishing Ltd. This is an open access article under the terms of the Creative Commons Attribution License, which permits use, distribution and reproduction in any medium, provided the original work is properly cited. 1
Transcript of Australasian sky islands act as a diversity pump ... · PDF fileAustralasian sky islands act...

Australasian sky islands act as a diversity pump facilitatingperipheral speciation and complex reversal from narrowendemic to widespread ecological supertrampEmmanuel F. A. Toussaint1, Katayo Sagata2, Suriani Surbakti3, Lars Hendrich1 & Michael Balke1,4
1Zoological State Collection, M€unchhausenstraße 21, Munich, 81247, Germany2Papua New Guinea Institute for Biological research (PNG-IBR), Goroka, Papua New Guinea3Jurusan Biology, FMIPA-Universitas Cendrawasih, Kampus Baru, Jayapura, Papua, Indonesia4GeoBioCenter, Ludwig-Maximilians-University, Munich, Germany
Keywords
Australian region, diversity pump, highlands,
New Guinea, New Zealand, peripheral
speciation.
Correspondence
Emmanuel F.A. Toussaint, Zoological State
Collection, M€unchhausenstraße 21, Munich,
81247, Germany. Tel: +49 898107155; Fax:
+49 898107300;
E-mail: [email protected]
Funding Information
This study was supported by German Science
Foundation (DFG) grants BA2152/6-1, 7-1
and 11-1.
Received: 11 January 2013; Revised: 29
January 2013; Accepted: 1 February 2013
doi: 10.1002/ece3.517
Abstract
The Australasian archipelago is biologically extremely diverse as a result of a
highly puzzling geological and biological evolution. Unveiling the underlying
mechanisms has never been more attainable as molecular phylogenetic and geo-
logical methods improve, and has become a research priority considering
increasing human-mediated loss of biodiversity. However, studies of finer scaled
evolutionary patterns remain rare particularly for megadiverse Melanesian biota.
While oceanic islands have received some attention in the region, likewise insu-
lar mountain blocks that serve as species pumps remain understudied, even
though Australasia, for example, features some of the most spectacular tropical
alpine habitats in the World. Here, we sequenced almost 2 kb of mitochondrial
DNA from the widespread diving beetle Rhantus suturalis from across Austral-
asia and the Indomalayan Archipelago, including remote New Guinean high-
lands. Based on expert taxonomy with a multigene phylogenetic backbone
study, and combining molecular phylogenetics, phylogeography, divergence
time estimation, and historical demography, we recover comparably low geo-
graphic signal, but complex phylogenetic relationships and population structure
within R. suturalis. Four narrowly endemic New Guinea highland species are
subordinated and two populations (New Guinea, New Zealand) seem to consti-
tute cases of ongoing speciation. We reveal repeated colonization of remote
mountain chains where haplotypes out of a core clade of very widespread hapl-
otypes syntopically might occur with well-isolated ones. These results are cor-
roborated by a Pleistocene origin approximately 2.4 Ma ago, followed by a
sudden demographic expansion 600,000 years ago that may have been initiated
through climatic adaptations. This study is a snapshot of the early stages of
lineage diversification by peripatric speciation in Australasia, and supports New
Guinea sky islands as cradles of evolution, in line with geological evidence sug-
gesting very recent origin of high altitudes in the region.
Introduction
Deciphering the mechanisms of species formation is one
of the most fascinating and challenging areas of evolu-
tionary biology (Darwin and Wallace 1858; Darwin 1859;
Mayr and Diamond 2001; Coyne and Orr 2004; Fitzpa-
trick et al. 2009; Santini et al. 2012). Many studies on bi-
ogeographic and ecological factors promoting speciation
have helped to establish the separation by physical barri-
ers (“vicariance”) followed by genomic isolation as the
null hypothesis that begets new species (Lynch 1989; Bar-
raclough and Vogler 2000; Mayr and Diamond 2001;
Johannesson 2010; Santini et al. 2012). However,
although restriction of gene flow and allopatric speciation
appear to be the most common mechanisms, different
processes have also been documented through the years
(White 1968; de Aguiar et al. 2009; Johannesson 2010).
For instance, sympatric speciation, suggested already by
ª 2013 The Authors. Published by Blackwell Publishing Ltd. This is an open access article under the terms of the Creative
Commons Attribution License, which permits use, distribution and reproduction in any medium, provided
the original work is properly cited.
1

Darwin (1859) before being tested and supported for
many metazoan taxa (e.g., Crow et al. 2010), implies that
speciation events can occur within the same population
through genetic polymorphism. Furthermore, special cases
of allopatric speciation are found in parapatric and perip-
atric models, which invoke processes at the distributional
periphery of an ancestral species, where individuals might
enter a new habitat most likely facilitated by divergent
ecological characteristics. In this case of peripheral specia-
tion, also known as “budding speciation,” either the geo-
graphic isolation, ecological factors, or a combination of
the two leads to a cessation of gene flow, thus enabling
the speciation process (Mayr 1982; Fitzpatrick and Turelli
2006).
Here, we focus on the Australasian archipelago and
surrounding areas, a region that shelters a rich yet highly
threatened biodiversity; seven biodiversity hotspots are
situated in the Indomalayan-Australasian region (Mitter-
meier et al. 2004; conservation.org). This region, despite
its highly complex geological history (e.g., Hall 2011;
Metcalfe 2011), represents an ideal laboratory to study
lineage diversification and speciation (Wallace 1860; Mayr
and Diamond 2001; Condamine et al. 2013). Thousands
of islands, many of them scattered across the Equator,
varying in size from tiny patches to continental sized
landmasses, ranging from young to geologically old and
low-lying to high altitudes including snow-capped sum-
mits, harbor hyperdiverse biota and exceptional radia-
tions. Particularly across the megadiverse Wallacea and
Melanesia, most studies to date have investigated larger
scale evolutionary patterns, whereas factors promoting
speciation remain scarcely addressed, and the evolutionary
processes involved are little known despite increased
recent efforts (e.g., Von Rintelen et al. 2004; de Bruyn
and Mather 2007; Joseph and Omland 2009; Craft et al.
2010; Deiner et al. 2011; Klaus et al. 2013). A unique fea-
ture in the Indomalayan-Australasian archipelago is its
long chain of islands often with high mountains, usually
surrounded by tropical lowland rain- or dry-forest. “Sky
island” ecosystems are isolated patches surrounded by
dramatically different lowland ecosystems (Heald 1967),
in this case, isolated further from each other by ocean.
Recently, such highland ecosystems have been shown to
act as evolutionary cradles shaping a flourishing biota in
diverse regions of the World (Hall 2005; Smith and Farr-
rell 2005; Robin et al. 2010; Schultheis et al. 2012). In the
Australasian region, sky islands are geologically young
(<5 Mya; Cloos et al. 2005), yet highly diverse (e.g., Mit-
termeier et al. 2004). Numerous studies on Australian
and New Zealand mountain ranges have investigated spe-
ciation patterns and indicate important vicariant effects
from mountain uplift per se, and climate change as fur-
ther promoter of species diversity (e.g., Trewick et al.
2000; McCulloch et al. 2010; Hawlitschek et al. 2012).
The mountains of Indonesia and northern Australasia
show especially striking altitudinal gradients, usually being
surrounded by tropical lowland rain- or dry-forest.
Within this biodiversity-rich assemblage of mountainous
ecosystems, one of the largest and most remote highland
regions is the central New Guinean cordillera, with vast
expanses of tropical montane and subalpine habitat, and
extensive areas above 3500-m altitude, including numer-
ous summits above 4500 m. Their role as a diversity
pump for the archipelago remains poorly studied and lit-
tle appreciated, despite their vast geographic extent and
extreme structuring (but see Mayr and Diamond 1976).
Here, we study pond-dwelling Rhantus diving beetles,
often abundant in tropical montane and subalpine pond
habitats across the Australasian region. There are at least
30 endemic species in the region including Oceania,
mostly narrow endemics restricted to a single high valley,
or few mountain tops. There is one striking exception,
however: Rhantus suturalis MacLeay, 1825 (Coleoptera,
Dytiscidae, Colymbetini) (Fig. 1), is a widespread ecologi-
cal supertramp, ranging from the Azores islands to New
Zealand, and inhabits diverse lentic habitats in mountain-
ous or subalpine environments, for example, high altitude
lakes (Fig. 2) and highland peat swamps (with pH around
4–5). It occurs in temperate lowland swamps, many
anthropogenic habitats (freshly dug fish ponds, reservoirs,
roadside ditches, cattle troughs), saline desert wetlands in
North African deserts, and many more. Along with its
closer relatives, it has never been found in tropical low-
lands (Balke 1993, 2001; Balke et al. 2009). Rhantus sutu-
ralis is often an early colonizer of newly available habitats,
hence referred to as a “supertramp species” (Balke et al.
2009). It is an ecological generalist, with high physiologi-
cal tolerance, for example, in terms of salinity, tempera-
ture, and acidity. A comprehensive molecular phylogeny
of R. suturalis from across its wide range revealed two
Figure 1. Habitus of Rhantus suturalis (Photo credit: Jan Hamrsk�y)
2 ª 2013 The Authors. Published by Blackwell Publishing Ltd.
Evolution of Australasian Carnivorous Diving Beetles E. F. A. Toussaint et al.
major clades – a northern one, from Portugal to Sumatra,
and a southern one from adjacent Java eastward to New
Caledonia (Fig. 3) (Balke et al. 2009). Both R. suturalis
clades contain one or more narrow-endemic species pre-
viously described based on marked morphological diver-
gence. This species paraphyly was supported by extensive
mitochondrial and nuclear DNA sampling (>7000 bp).
A recent origin of R. suturalis, c. 6.0–2.7 Ma ago, was
suggested, possibly in New Guinea, followed by an ances-
tral colonization of the Malay Archipelago and a large
part of the Australian region. The rise of a widespread
generalist out of a clade of narrow endemics not only
refutes the assumption of “specialisation as an evolution-
ary dead-end” (Mayr 1963; coined by Cope 1896 “the law
of the unspecialized”), but offers an opportunity to study
the early phases of lineage diversification across a wide
species range, which is nevertheless constrained by climate
and other ecological factors.
In this study, we use extensive sampling across the In-
domalayan-Australasian region to (1) reconstruct phylo-
genetic relationships within the southern clade of the
widespread R. suturalis, (2) investigate phylogeographic
patterns using haplotype network inferences, (3) infer the
historical demography and timing of divergence of this
group in a paleoclimatic framework, in order to test the
hypothesis of ongoing peripatric speciation in Australasia,
particularly New Guinea, sky islands, and (4) examine
whether those mountain chains act as a species pump in
a “cradle of evolution” model, or as an ancient biotic
pool, in a “museum” model.
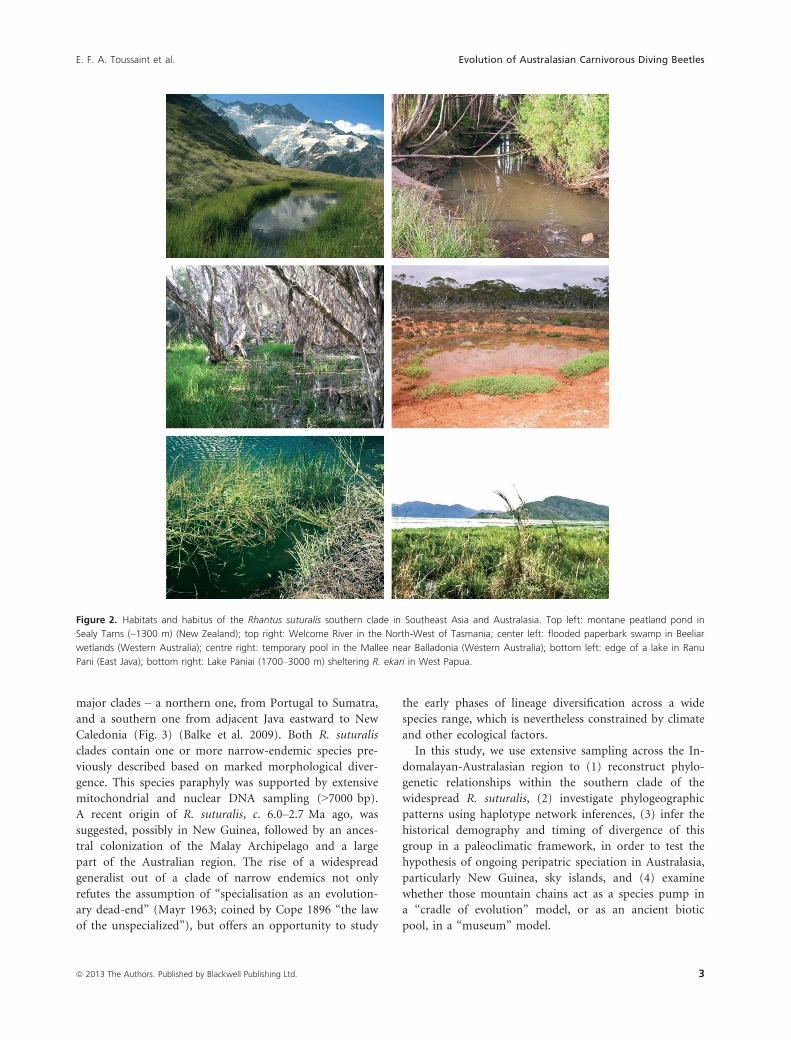
Figure 2. Habitats and habitus of the Rhantus suturalis southern clade in Southeast Asia and Australasia. Top left: montane peatland pond in
Sealy Tarns (~1300 m) (New Zealand); top right: Welcome River in the North-West of Tasmania; center left: flooded paperbark swamp in Beeliar
wetlands (Western Australia); centre right: temporary pool in the Mallee near Balladonia (Western Australia); bottom left: edge of a lake in Ranu
Pani (East Java); bottom right: Lake Paniai (1700–3000 m) sheltering R. ekari in West Papua.
ª 2013 The Authors. Published by Blackwell Publishing Ltd. 3
E. F. A. Toussaint et al. Evolution of Australasian Carnivorous Diving Beetles

Materials and Methods
Taxon sampling and molecular biology
We sequenced 133 individuals of R. suturalis from 12
regions across the range of the southern clade (Table 1,
Fig. 4) including the Sunda Islands, almost the entire
New Guinean highland chain, Australia, New Zealand,
and New Caledonia. Rhantus suturalis is known from old
Philippine (Baguio) as well as Malaysian Borneo (Mt. Ki-
nabalu) specimens (Balke 1993), but we did not manage
to obtain fresh samples. We sampled most of the New
Guinean endemic species (Fig. 5) subordinated within R.
suturalis, that is, (1) Rhantus dani, Balke 2001 (usually
shaded wetlands in an isolated montane depression, the
Baliem Valley ~1700 m), (2) Rhantus ekari, Balke and
Hendrich 1992 (swampy edge of a large montane lake,
Lake Paniai ~1900 m) (Balke and Hendrich 1992), (3)
Rhantus riedeli, Balke 2001 (same habitat but at Lake
Anggi ~1900 m), and (4) Rhantus supranubicus, Balke
2001 (alpine peat swamp pools and edge of Lake Habb-
ema as well as Mount Elit swampland, ~3300 m) (Balke
2001). Rhantus kakapupu, Balke 2001, described from old
specimens collected across Lake Paniai where R. ekari
occurs, was not found recently.
Specimens of closely related Rhantus species, that is, R.
bacchusi, R. elisabethae, Rhantus new species 1 and 2, as
well as R. suturalis from the northern clade were included
as outgroups (Balke 2001; Balke et al. 2007, 2009).
Genomic DNA was extracted from legs or thoracic tis-
sues using the DNeasy kit (Qiagen, Hilden, Germany).
We sequenced 1095 bp from the mitochondrial cyto-
chrome c oxidase subunit 1 (702 bp) and cytochrome b
(393 bp) using the primers listed in Table 2 to conduct
PCR reactions with standard protocols (http://zsm-ento-
mology.de/wiki/The_Beetle_D_N_A_Lab). Both strands of
the PCR products were then sequenced and sequences
corrected and aligned using Geneious 5.6.5 (available
from http://www.geneious.com) before being exported
under Mesquite 2.75 (available from http://www.mes-
quiteproject.org) to check the reading frame and create
three different datasets (CO1, CytB, and Combined). We
sequenced fragments of the nuclear genes 18S and argi-
nine kinase for several specimens of the southern clade,
but no molecular variation in the alignment was identi-
fied (data not shown). This is in line with Balke et al.
(2009) who used 18S rRNA, wingless, elongation factor 1
alpha (2 exons and 1 intron), and histone 3 and found
little or no informative signal within the southern clade.
Because of this lack of informative sites, we use fast evolv-
ing mitochondrial markers here. All the sequences used in
this study are deposited in Genbank under the accession
numbers KC604111 - KC604412.
Phylogeny
Different methods of phylogenetic inference were used for
the Combined dataset to infer relationships of individuals
within R. suturalis: (1) distance analyses using the Neigh-
bor-Joining method implemented in Geneious 5.6.5
(Drummond et al. 2012) with 10000 bootstrap replicates
and a HKY model of evolution (see below for a rationale
on this setting); (2) Maximum Parsimony (MP) analyses
using TNT 1.1 (Goloboff et al. 2008) with the Sectorial
Searches, Tree Ratchet, Tree Fusing and Tree Drifting
algorithms (Goloboff 1999), and 100 random additional
sequences. A Symmetric Resampling with a probability
fixed to 10 and 1000 replicates was performed as it
allows avoiding uninformative characters, character
weight, and transformation costs to affect the resampling
unlike classic Bootstrapping and Jacknifing; (3) Maximum
Likelihood (ML) analyses were performed with 1000
bootstrap replicates under RAxML (Stamatakis 2006)
with different partitioning strategies: NoPart (no parti-
tioning), ByGene (one partition for each gene), ByCodon
(one partition for each codon position), and BySix (one
partition for each codon position of each gene); and
finally, (4) Bayesian Inference (BI) analyses were per-
formed using the same strategies of partitioning, under
MrBayes 3.1.2 (Ronquist and Huelsenbeck 2003). The
datasets were analyzed with two independent runs con-
sisting of eight Markov Chains Monte Carlo (MCMC,
one cold and seven incrementally heated) sampling for
30 million generations. In order to compute support
information, the trees were sampled every 1000 genera-
tions and each MCMC started from a random topology.
The split-frequencies as long as the log-likelihood curves
were investigated to provide a good estimate of the
burn-in fraction. Once these samples were discarded, the
remaining topologies were used to yield a 50% majority
rule consensus tree. Best-fitting partitioning strategies for
the ML and BI analyses were selected using Bayes Factors
(BF; Kass and Raftery 1995) approximated under Tracer
Figure 3. Distribution of Rhantus suturalis. Sequence data were not
available for the area in red.
4 ª 2013 The Authors. Published by Blackwell Publishing Ltd.
Evolution of Australasian Carnivorous Diving Beetles E. F. A. Toussaint et al.

Table 1. Collecting localities, with code and number of specimens.
Species Country Region Code Locality Specimens
Rhantus bacchusi Papua New Guinea Eastern Highlands PNGEHP Aiyura 1
R. bacchusi Papua New Guinea Eastern Highlands PNGEHP Goroka 1
R. bacchusi Papua New Guinea Eastern Highlands PNGEHP Hogu 2
R. dani Indonesia Papua INDPAP Wamena 6
R. ekari Indonesia Papua INDPAP Enarotali 1
R. elisabethae Papua New Guinea Enga PNGENG Mt. Hagen Kumul Lodge 3
R. elisabethae Papua New Guinea Southern Highlands PNGSHP Mt. Giluwe Sopulkul 1
R. elisabethae Papua New Guinea Southern Highlands PNGSHP Tari 2
R. riedeli Indonesia Papua INDPAP Anggi 3
Rhantus sp. Papua New Guinea Central PNGCEN Myola 3
Rhantus sp. Papua New Guinea Morobe PNGMOR Huon 1
R. supranubicus Indonesia Papua INDPAP Lake Habbema 8
R. suturalis Australia New South Wales AUSNSW Bellingen 3
R. suturalis Australia New South Wales AUSNSW Braidwood 3
R. suturalis Australia New South Wales AUSNSW Casino 1
R. suturalis Australia New South Wales AUSNSW Delegate 9
R. suturalis Australia New South Wales AUSNSW Grafton 1
R. suturalis Australia New South Wales AUSNSW Kocsciousko NP 1
R. suturalis Australia New South Wales AUSNSW Nowra 3
R. suturalis Australia New South Wales AUSNSW Taraga 1
R. suturalis Australia New South Wales AUSNSW Wollongong 2
R. suturalis Australia Queensland AUSQLD Agnes 2
R. suturalis Australia Queensland AUSQLD Bundaberg 1
R. suturalis Australia Queensland AUSQLD Gladstone 3
R. suturalis Australia Southern Australia AUSSA Adelaide 1
R. suturalis Australia Southern Australia AUSSA Mt. Gambier 3
R. suturalis Australia Southern Australia AUSSA Meadows Creek 2
R. suturalis Australia Southern Australia AUSSA Penola 6
R. suturalis Australia Southern Australia AUSSA Robe 1
R. suturalis Australia Tasmania AUSTAS Geeveston 3
R. suturalis Australia Tasmania AUSTAS Togari 1
R. suturalis Australia Victoria AUSVIC Kyneton 2
R. suturalis Australia Victoria AUSVIC Tooborac 1
R. suturalis Australia Western Australia AUSWA Cataby 1
R. suturalis Australia Western Australia AUSWA Manjimup 1
R. suturalis Australia Western Australia AUSWA Manypeaks 1
R. suturalis Australia Western Australia AUSWA Northcliffe 1
R. suturalis Australia Western Australia AUSWA Pilbara 1
R. suturalis Australia Western Australia AUSWA Yanmah State For. 1
R. suturalis Belarus Minsk Oblast BEL Minsk 1
R. suturalis Czech Republic Liberec CZE Liberec 1
R. suturalis France New Caledonia NEWCAL Mt. Mou 1
R. suturalis France New Caledonia NEWCAL Poindimi�e 1
R. suturalis France New Caledonia NEWCAL Pouembout 1
R. suturalis Indonesia Flores INDFLO Mt. Ranaka/Ranamese Lake 6
R. suturalis Indonesia Java INDJAVA Dieng Plateau 6
R. suturalis Indonesia Lombok INDLOM Sumbalun Lawang 4
R. suturalis Indonesia Sulawesi INDSUL Malino 4
R. suturalis Indonesia West Sumatra INDSUM Danau di Atas 2
R. suturalis Indonesia Timor INDTIM Mt. Mutis 5
R. suturalis Japan Hokkaido JAP Tomakomai 1
R. suturalis New Zealand Auckland NEWZEA Auckland 1
R. suturalis New Zealand Nelson NEWZEA Canaan 3
R. suturalis New Zealand Southland NEWZEA Key Summit 1
R. suturalis Papua New Guinea Central PNGCEN Myola 2
R. suturalis Papua New Guinea Eastern Highlands PNGEHP Aiyura 3
ª 2013 The Authors. Published by Blackwell Publishing Ltd. 5
E. F. A. Toussaint et al. Evolution of Australasian Carnivorous Diving Beetles

1.5 (Rambaut and Drummond 2007). The substitution
models of evolution for each partition used in ML and
BI analyses were selected under jModelTest 0.1.1 (Posada
2008), using the Bayesian information criterion (BIC)
rather than the corrected Akaike information criterion
(AICc) as advocated by Brown and Lemmon (2007). The
HKY model was set for the NJ analysis as it is the closest
one to the model selected for the Combined dataset
implemented in Geneious 5.6.5.
Phylogeography and historical demography
The phylogeographic pattern within the southern clade
was analyzed for all the Combined dataset through haplo-
type network inferred from the 133 specimens of the
southern clade in addition to 3 specimens of the northern
clade included as outgroups. The sequences were col-
lapsed into haplotypes under DnaSP 5.10 (Librado and
Rozas 2009) and a network was inferred using Hapstar
0.7 (Teacher and Griffiths 2011) based on the connection
lengths obtained in Arlequin 3.11 (Excoffier et al. 2005).
Historical demography was investigated with the south-
ern clade specimens only using Tajima’s D, Fu’s Fs, and
Harpending’s raggedness index (Hri). Tajima’s D (Tajima
1989) and Fu’s Fs (Fu 1997) statistics were calculated
using Arlequin 3.11 (Excoffier et al. 2005) with 10,000
permutations to assess whether the mitochondrial data
shows evidence of deviation from the neutral theory of
molecular evolution holding that stochastic processes such
as molecular drift and mutation explain most of the
genetic variation found in living organisms. In addition,
these statistics can unveil demographic events such as
population expansion (significant negative values) or con-
traction (significant positive values) (Tajima 1989; Fu
1997). The Harpending’s raggedness index (Hri, Har-
pending 1994) based on mismatch distributions, was cal-
culated using 1000 bootstrap replicates to investigate
whether the population deviates from a sudden expansion
model (Schneider and Excoffier 1999). A significant Hri
(P < 0.05) indicates a poor fit to the model and therefore
does not support a sudden demographic expansion (Har-
pending 1994).
The magnitude of historical demographic events was
investigated using Bayesian Skyline Plots (BSP, Drum-
mond et al. 2005) as well as Extended Bayesian Skyline
Plots (EBSP, Heled and Drummond 2008) under BEAST
1.7.4 (Drummond et al. 2012). BSPs allow the inference
of population historical demography in a Bayesian
framework based on a coalescent model of evolution.
The EBSPs are a slightly different method based on BSPs
permitting the analyses of multiple loci separately (see
Ho and Shapiro 2011 for a review). The.xml files were
created with a partition for each gene and the respective
models of evolution set according to the results obtained
in jModelTest (Posada 2008). The applicability of a
molecular clock was tested using PAUP* (Swofford
2003), and as the molecular clock hypothesis was not
statistically supported (P < 0.05), we used a relaxed
clock that allows rate variation among lineages. There-
fore, The Coalescent: Bayesian Skyline and Extended
Bayesian Skyline models were implemented with an esti-
mated relaxed clock (uncorrelated lognormal) based on
the rate of evolution calculated by Balke et al. (2009)
regarding the evolution of the R. suturalis complex,
including the 95% confidence interval (r = 0.019, 95%
interval I = 0.011–0.028). The rate was set under a nor-
mal distribution with the following parameters: initial
value = 0.0195, mean = 0.0195, and SD = 0.00435. Two
Table 1. Continued.
Species Country Region Code Locality Specimens
R. suturalis Papua New Guinea Enga PNGENG Wabag 1
R. suturalis Papua New Guinea Madang PNGMAD Mts. Finisterre 3
R. suturalis Papua New Guinea Sandaun PNGSAN Mianmin 4
R. suturalis Papua New Guinea Sandaun PNGSAN Telefomin 1
R. suturalis Papua New Guinea Southern Highlands PNGSHP Mt. Ambua 4
R. suturalis Papua New Guinea Western Highlands PNGWHP Giluwe 2
R. suturalis Papua New Guinea Western Highlands PNGWHP Mt. Hagen Town 2
R. suturalis Papua New Guinea Western Highlands PNGWHP Mt. Hagen Kumul Lodge 2
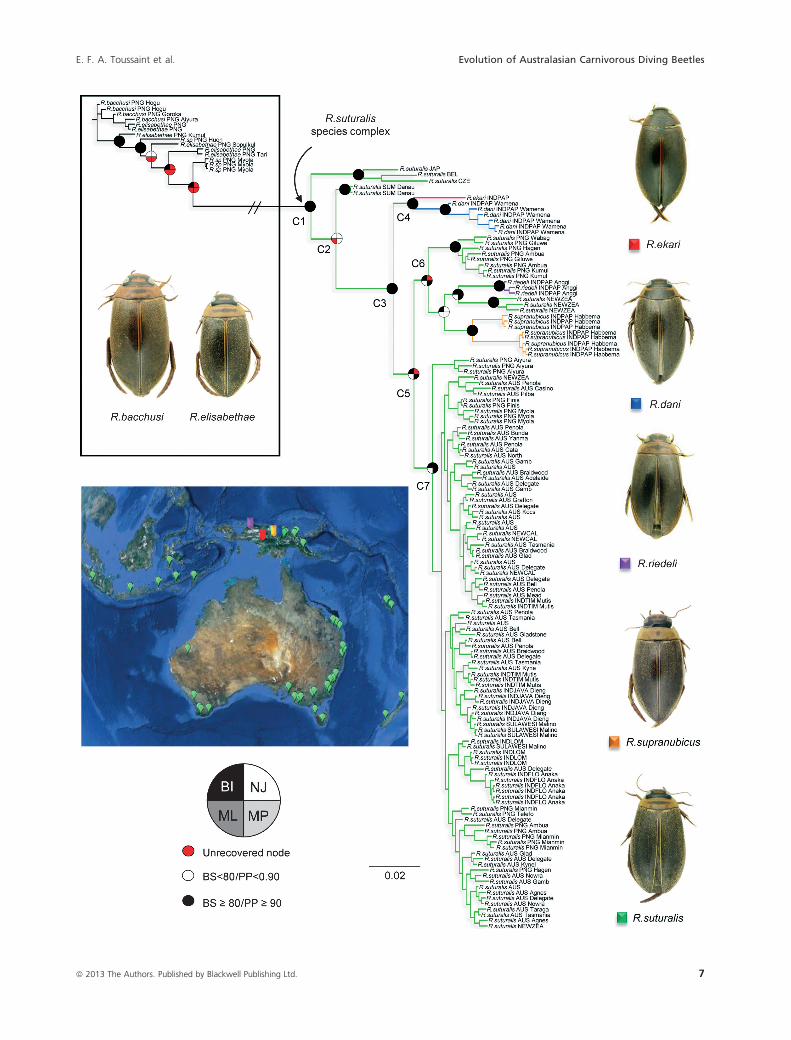
Figure 4. Phylogenetic relationships of the Rhantus suturalis species complex Combined dataset with the best-fitting strategy of partitioning
under Bayesian Inference. Supports for each node are indicated according to the caption inserted in the figure (BI, Bayesian inference; NJ,
neighbor-joining; MP, maximum parsimony; ML, maximum likelihood). A map highlighting collection localities is shown, in which the colors of the
spots refer to the respective colored squares underneath the habitus of the different species (e.g., R. riedeli in purple). The major clades are
labeled C1 to C7. Names of the species for which a habitus is displayed are specified under the pictures.
6 ª 2013 The Authors. Published by Blackwell Publishing Ltd.
Evolution of Australasian Carnivorous Diving Beetles E. F. A. Toussaint et al.
ª 2013 The Authors. Published by Blackwell Publishing Ltd. 7
E. F. A. Toussaint et al. Evolution of Australasian Carnivorous Diving Beetles

distinct runs of 50 million generations sampled every
1000 generations were performed for each model (BSP
or EBSP). After discarding 10% of the samples as burn-
in, the convergence of runs was assessed according to
the ESS (Effective Sample Size) criterion and the plots
were inferred under Tracer 1.5 (Rambaut and Drum-
mond 2007) for the BSP and a graphic program for the
EBSP.
Estimation of divergence times
As the fossil record is scarce for water beetles, and this
study focuses on inter- as well as intra-specific levels, we
chose to use the previously introduced evolutionary rate
(Balke et al. 2009) with different models and parameters
as advocated by previous studies (e.g., Ho and Phillips
2009) to infer diversification ages. A.xml file based on
the Combined dataset was created with the following
non-default settings and priors: the Site Model was cho-
sen according to the models of evolution used in the
phylogenetic analyses and the MCMC parameters were
fixed to 30 million generations with sampling every 1000
generations and the first 25% discarded as burn-in.
Divergence time analyses were carried out using BEAST
1.7.4 (Drummond et al. 2012) and were performed
under both the Coalescent: Constant Size and Speciation:
Birth-Death models. We used estimated relaxed clock rate
(uncorrelated lognormal) with a normal distribution
(initial value = 0.0195, mean = 0.0195, standard
dev = 0.00435), and also a uniform distribution (initial
value = 0.0195, upper = 0.028, lower = 0.011). The best
topology obtained in BI for the Combined dataset was
fixed as the reference topology for divergence time esti-
mates by editing the.xml file manually. At the end of
each analysis, a 50% majority rule consensus tree was
created under TreeAnnotator 1.7.4. Likelihood scores
and Bayes Factors (BF) were then calculated under Tra-
cer 1.5 (Rambaut and Drummond 2007) to select the
best analysis.
Results
Phylogenetic relationships
We obtained fragments of 524–702 bps length for CO1
and 281–393 bps for CytB for 133 specimens to produce
Table 2. Primers used to amplify regions of the cytochrome oxidase subunit 1 (CO1) and cytochrome B (CytB).
Locus Primer Primer sequence Reference
CytB CB3 GAG GAG CAA CTG TAA TTA CTA A Barraclough et al. 1999
CB4 AAA AGA AA(AG) TAT CAT TCA GGT TGA AT Barraclough et al. 1999
Cox1 Pat TCC AAT GCA CTA ATC TGC CAT ATT A Simon et al. 1994
Jerry CAA CAT TTA TTT TGA TTT TTT GG Simon et al. 1994
Figure 5. Distribution of New Guinean endemic species of the Rhantus suturalis complex. The different colors refer to the distribution of each
species except R. suturalis for which they refer to the sampling localities (the distribution of R. suturalis in New Guinea is given by the green
areas). The correspondences of the colors are shown in the legend at the bottom left corner of the figure. The asterisk indicates that R. kakapupu
was not included in this study.
8 ª 2013 The Authors. Published by Blackwell Publishing Ltd.
Evolution of Australasian Carnivorous Diving Beetles E. F. A. Toussaint et al.

an alignment of 1905 bps without stop codons or frame-
shift mutations. The best-fitting evolutionary models for
each partition are given in Table 3, and a phylogenetic
hypothesis is shown in Figure 4, based on the best BI
topology for the Combined dataset after selection under
the BF criterion (Table 4) (for the best topologies recov-
ered in NJ, MP, and ML, see Figs S1, S2, and S3 of the
electronic supplementary materials, respectively).
Within the R. suturalis species complex, most of the
internal nodes were well to strongly supported by boot-
strap (BS � 80) or posterior probability (PP � 0.90)
values. The monophyly of R. suturalis species complex
labeled “C1” in Figure 4 was always retrieved (BS = 100/
PP = 1.0). The next clade (C2) contains the southern
clade and specimens from Sumatra, which are recovered
as sister group of all remaining specimens. This clade was
retrieved in all methods of inference except in the ML
analysis in which they were the first branch of C1.
The next clade (C3) is the southern clade of R. suturalis
of Balke et al. (2009), here always recovered with strong
support (BS � 98/PP = 1.0). Rhantus ekari and R. dani
form clade C4 (BS � 89/PP = 0.99) as the sister group
of all the remaining specimens from the southern R. sutu-
ralis clade (C5). The next clade, C5, recovered in all anal-
yses (BS � 79/PP = 1.0) but in NJ, comprises the clades
C6 (R. riedeli, R. supranubicus, and several specimens of
R. suturalis from Papua New Guinea and New Zealand),
and C7 (with all remaining specimens of R. suturalis,
mainly from across Australia).
Strikingly, the Papua New Guinean specimens in C6
(all from Mt. Hagen-Ambua highlands region) were
recovered in a well-supported, monophyletic, and geneti-
cally well-separated clade, the same is true for the New
Zealand specimens recovered as the sister taxa of R. riedeli
in clade C6. This means that there are two clades with
specimens that are morphologically R. suturalis that group
among narrow endemics, morphologically moderately to
strongly divergent from R. suturalis, and these two clades
are genetically isolated from the main clade of morpho-
logical R. suturalis specimens (C7).
Overall, the topology discloses a striking, partial lack of
geographic structure. Exceptions are R. ekari, R. dani, R.
riedeli, and R. supranubicus endemic to different West
New Guinean highland regions and recovered as strongly
supported monophyletic clades (BS � 95/PP = 1.0), as
well as the Papua New Guinea and New Zealand speci-
mens in clade C6. Australian specimens are scattered in
clade C7 without geographic signal, whereas specimens
from Papua New Guinea (PNG) are found in small and
scattered internal groups in C7, the ones from Eastern
Highlands (Aiyura) and Huon-Papuan Peninsula being
monophyletic (Fig. 5). Furthermore, Flores as well as
Javanese, Lombok, New Caledonian, New Zealand, Sulaw-
esi, or Timorese individuals were recovered as paraphylet-
ic, or in poorly supported clusters.
Phylogeography and historical demography
All DNA matrices present striking haplotype diversities
within the southern clade of R. suturalis, from 81% in the
CytB to 93% in the Combined dataset, these results being
supported by high nucleotide diversities (Table 5). Phy-
logeographic analyses based on the Combined dataset
yielded a complex network with multiple haplotype series
(Fig. 6). The species R. dani, R. ekari, R. riedeli, and R.
supranubicus from the highlands of Papua New Guinea
are well separated from the two central groups of
Table 3. Selection of the best-fitting models of sequence evolution
under the corrected Akaike (AICc) and Bayesian (BIC) information cri-
terions.
Dataset AICc BIC
Combined TrN + I + G TrN + I + G
Combined Position 1 K80 + I+G TrN + I + G
Combined Position 2 JC F81
Combined Position 3 HKY + G TrN + G
Cytochrome oxidase 1 TrN + I + G TrN + I + G
Cytochrome oxidase 1 Position 1 K80 + I+G TrN + I + G
Cytochrome oxidase 1 Position 2 JC F81
Cytochrome oxidase 1 Position 3 TrN + G TrN + I + G
Cytochrome oxidase B HKY + I + G HKY + I + G
Cytochrome oxidase B Position 1 TrN + G TrN + G
Cytochrome oxidase B Position 2 F81 F81
Cytochrome oxidase B Position 3 HKY + I + G HKY + I + G
Table 4. Best-fitting strategies of partitioning for the BI and ML phylogenetic inferences with Bayes Factors (BF) estimates, BI harmonic means,
and ML optimization likelihoods.
Partitioning scheme MrBayes harmonic mean RAxML likelihood
Bayes factors (BF)
NoPart ByGene ByCodon BySix
Combined NoPart �6317.20 �5875.28 – 0 0 0
Combined ByGene �6390.39 �5862.60 >10 – 0 0
Combined ByCodon �6197.00 �5526.02 >10 >10 – 0
Combined BySix �6184.51 �5471.57 >10 >10 >10 –
ª 2013 The Authors. Published by Blackwell Publishing Ltd. 9
E. F. A. Toussaint et al. Evolution of Australasian Carnivorous Diving Beetles

haplotypes formed by numerous specimens of R. suturalis
mainly from Australia, as well as from Flores, Java,
Lombok, New Caledonia, New Zealand, Papua New Gui-
nea, Sulawesi, and Timor. Among these central groups,
there is no predominant haplotype and there is a close
connection between haplotypes from the entire sampling
area; however, no clear geographic structure is recovered,
except for the specimens from Flores, which constitute a
unique geographic cluster (Fig. 6). This pattern of geo-
graphic mixture is less well recovered within highland
specimens from Papua New Guinea and specimens from
New Zealand, that tend to represent distinct genetic enti-
ties similar to the subordinated, formally named Papuan
species.
Eight individuals of R. suturalis from different high
mountains in the Eastern Papua New Guinea highlands
(Fig. 7) form a well-delineated clade. Strikingly, one spec-
imen from the valley at the foot of Mt. Hagen, from
Mount Hagen town, is in the main haplotype group in
one of the star-bursts, and even more strikingly, so are
two specimens collected from the high altitude Mt. Am-
bua locality, taken from the same pool as the specimens
in the genetically well-delineated Mt.Hagen-Ambua clade
(Fig. 7). These two Ambua specimens cluster with speci-
mens from more western PNG-Papuan highlands locali-
ties (Min area in PNG west into Indonesian Papua in the
Aipo area) (Fig. 5). Min area specimens are, however,
also in a second, geographically proximate clade as well
(Fig. 4). PNG specimens from Aiyura, Eastern highlands,
form their own clade, as do the Huon Peninsula and Pap-
uan Peninsula specimens. R. suturalis specimens from the
northern clade are retrieved with a deep genetic diver-
gence highlighted by very long connecting branches, and
a geographic continuum, as the Sumatran specimens are
more closely related to the southern clades than the Pale-
arctic ones.
The non-significant negative values of Tajima’s D
obtained for all datasets suggest a demographic expansion
statistically supported by highly significant negative values
of Fu’s Fs. The hypothesis of population expansion is
supported by Harpending’s raggedness index as well, as
the values for all datasets are very low and non-significant
(Table 5).
All the ESBP and BSP runs converged well according
to the log-likelihood curves and ESS checked under Tra-
cer 1.5 (Rambaut and Drummond 2007). The EBSP anal-
ysis based on the rate of Balke et al. (2009) highlights a
scenario divided into a phase of constant population size,
followed by a sudden demographic expansion, likely start-
ing approximately 600,000 years ago during the Late
Pleistocene (Fig. 8). The results of the BSP analysis high-
light a demographic expansion as well (Fig. 8), with a
later approximate age of 450,000 years ago.
Estimation of divergence times
The analysis based on the rate of Balke et al. (2009) opti-
mized with a normal distribution and a Birth-Death
model of speciation was selected under the BF, ESS, and
likelihood criterions as the most likely, and the chrono-
gram derived from this analysis is presented in Figure 9.
The divergence time estimates obtained for the two best
runs (BDBalkeNorm and BDBalkeUni, see Table 6 for
abbreviations) were highly similar with a maximum diver-
gence of less than 4% (~0.2 Ma) for the mean age of the
root (Table 6). Our results show that the most recent
common ancestor (MRCA) of the R. suturalis southern
clade originated approximately 2.3 Ma ago (95% credibil-
ity interval: 1.2–3.6 Ma) during the Pliocene–Pleistocenetransition. Interestingly, most of the intra-specific nodes
within the southern clade radiation are young, with ages
spanning a period of time from the Early Calabrian
(~1.7 Ma) to the Tarantian (~100 kyr). The node C4 (R.
dani and R. ekari) is dated to the Early Calabrian
(~1.7 Ma), approximately the same age as the clade C6
(R. riedeli, R. supranubicus, the Papua New Guinean Mt.
Hagen-Ambua clade, and one clade including some of the
New Zealand specimens).
Table 5. Genetic structure of each marker and results of demographic index calculations.
Dataset Cytochrome oxidase 1 Cytochrome B Combined
Length (bp) 702 393 1095
Mean number of pairwise differences 13.25 � 6.00 6.37 � 3.04 19.61 � 8.73
Nucleotide diversity (Pi) 0.0219 � 0.01 0.0241 � 0.01 0.0225 � 0.01
Number of haplotypes 107 106 122
Tajima’s D �1.201 NS (0.09) �0.648 NS (0.30) �1.068 NS (0.12)
Fu’s Fs �24.102 *** (0.0008) �24.987 *** (0.0000) �23.883 *** (0.0001)
Harpending’s raggedness index 0.00320 NS (0.63) 0.00654 NS (0.96) 0.00174 NS (1.00)
NS indicates not significant values. *** indicates highly significant values.
10 ª 2013 The Authors. Published by Blackwell Publishing Ltd.
Evolution of Australasian Carnivorous Diving Beetles E. F. A. Toussaint et al.

Figure 6. Network based on the Combined dataset. The locality and the number of specimen(s) are indicated according to the caption. The
black dots indicate missing haplotypes.
ª 2013 The Authors. Published by Blackwell Publishing Ltd. 11
E. F. A. Toussaint et al. Evolution of Australasian Carnivorous Diving Beetles

Discussion
Phylogenetic relationships
We retrieve relationships congruent with the multi-gene
mtDNA and nDNA study of Balke et al. (2009), with a
robustly supported paraphyly of R. suturalis. The split
between the northern and southern clades is also recov-
ered here even though our placement of specimens from
Sumatra is ambiguous, probably due to the scarce sam-
pling for the northern clade. We find a lack of resolution
for most of the R. suturalis radiation in the clade C5,
except for R. riedeli, R. supranubicus, and for several indi-
viduals from New Guinea and New Zealand, which are
grouped in C6 as the sister group of all remaining R. sut-
uralis specimens from the entire archipelago. Rhantus ek-
ari and Rhantus dani are recovered sister species, and
they are indeed morphologically similar to each other as
well as to R. suturalis, whereas the other New Guinea en-
demics R. supranubicus and R. riedeli are morphologically
(male genital, color, for claws) more deviating. Even
though Balke et al. (2009) proposed the inclusion of New
Guinean highland specimens of R. suturalis among a clade
comprising R. supranubicus and R. riedeli, the placement
of specimens from southern New Zealand in this New
Guinean clade was highly unexpected. Concerning the
New Guinean specimens, the collection localities (remote
alpine habitats) seem to indicate that these beetles belong
to a well-differentiated population that may represent at
least one new putative species. The New Zealand speci-
mens, on the other hand, are recovered in a basal clade
that is thought to be the ancestral clade of the R. suturalis
as recovered by Balke et al. (2009). We suggest that iso-
lated specimens from southern New Zealand are likely a
relict population from a first colonization wave through
the archipelago, and have most likely been evolving inde-
pendently from the rest of the radiation for a long period
of time. This population from mid-altitude lakes, well-
separated from other New Zealand populations, might
represent a new species, similar to the New Guinean spec-
imens of the clade C6. More generally, the lack of resolu-
tion in C7 and the short branches within the different
clades of the topology support a very recent radiation of
the southern clade.
Phylogeographic network
The partial lack of geographic structure seen in the phylo-
genetic inference is recovered in the haplotype network
(Fig. 6). The Papuan species, the Mt. Hagen-Ambua high-
Figure 7. Simplified network based on the Combined dataset highlighting the New Guinean specimens. The locality and the number of specimen(s)
are indicated according to the caption. The black dots indicate missing haplotypes.
12 ª 2013 The Authors. Published by Blackwell Publishing Ltd.
Evolution of Australasian Carnivorous Diving Beetles E. F. A. Toussaint et al.

land specimens from Papua New Guinea and some New
Zealand specimens are separated from the core of other
haplotypes by a large number of mutational steps. The
numerous connections seem to indicate a star-like archi-
tecture even though there are some deviations. A star-like
network suggests range expansion leading to the evolution
of numerous closely related genotypes derived from a
wide, central, and often ancestral haplotype (Avise 2000).
Here, the lack of one central and widespread haplotype
along with the general absence of geographic structuring
in the main clades seem to suggest either (1) ongoing but
moderate gene flow driven by dispersion within the wider
area of distribution, therefore allowing the mixture of
genotypes from different localities while avoiding com-
plete homogenization, or (2) the recent cessation of gene
flow across the Archipelago, thus leading to the isolation
of populations that start to diverge genetically (e.g., Ri-
bera et al. 2011). In the latter case, we suggest that the
Figure 8. Extended Bayesian Skyline Plot based on the rate calculated by Balke et al. (2009). A 500-kyr timescale is shown at the bottom of the
chronogram and spans a period of time from the late Pliocene to the present. Result of the Bayesian Skyline Plot is given in the right part of the
figure. Demographic expansion and 95%HPD are shown according to the caption.
Table 6. Mean ages (in Ma) and 95% credibility intervals for the different analyses.
Root C1 C2 C3 C4 C5 C6 C7
1.BDBalkeN 6.1 (3.0–9.9) 3.0 (1.5–4.7) 2.8 (1.4–4.4) 2.3 (1.2–3.6) 1.6 (0.6–2.8) 2.0 (1.0–3.1) 1.7 (0.8–2.7) 1.5 (0.8–2.4)
2.BDBalkeU 5.9 (3.0–10.1) 2.9 (1.5–4.8) 2.7 (1.3–4.5) 2.2 (1.1–3.7) 1.6 (0.6–2.8) 1.9 (1.0–3.2) 1.6 (0.8–2.8) 1.5 (0.7–2.5)
5.COALBalkeN 8.8 (4.0–14.9) 3.8 (1.8–6.2) 3.5 (1.7–5.7) 2.8 (1.3–4.6) 1.9 (0.6–3.5) 2.4 (1.1–3.9) 2.0 (1.0–3.3) 1.7 (0.8–2.9)
6.COALBalkeU 9.9 (4.4–17.1) 4.1 (2.0–6.8) 3.7 (1.8–6.3) 3.0 (1.4–5.0) 2.1 (0.7–3.7) 2.5 (1.2–4.2) 2.1 (1.0–3.6) 1.8 (0.8–3.1)
BD, Birth-Death model; COAL, Coalescent model; N, Normal law of distribution with uncorrelated lognormal clock model; U, Uniform law of dis-
tribution with uncorrelated lognormal clock model.
The text of the best run based on BF, ESS, and likelihood criterions is bold.
ª 2013 The Authors. Published by Blackwell Publishing Ltd. 13
E. F. A. Toussaint et al. Evolution of Australasian Carnivorous Diving Beetles

14 ª 2013 The Authors. Published by Blackwell Publishing Ltd.
Evolution of Australasian Carnivorous Diving Beetles E. F. A. Toussaint et al.

populations are not clustered in well-distinguished geo-
graphic groups because of the recency of the event. Even
though there is a lack of clear geographic correlation, all
specimens of some localities are closely related (e.g., Flo-
res, New Caledonia, Timor, PNG Telefomin-Min area,
PNG Aiyura area etc., Figs 6, 7), indicating the initiation
of geographic structuring or colonization from the same
or related sources. Interestingly, New Zealand specimens
in a distinct clade in the phylogeny are not recovered
close to New Guinean specimens, but are connected to a
central and unique Javanese haplotype, most likely the
result of incomplete lineage sorting. The deep divergence
between these specimens and the central haplotype group,
including the rest of the specimens from New Zealand,
supports our hypothesis of an older isolation and
restricted gene flow hinting toward ongoing speciation, a
similar pattern as the one observed for the Papuan high-
land species. In agreement with the phylogenetic infer-
ence, the group of specimens from Papua recovered in C6
is separated from the central haplotype group and clusters
with R. riedeli, while still exhibiting a deep genetic diver-
gence between the two. In addition, most of the speci-
mens from Papua New Guinea are restricted to small
groups in the periphery of the phylogeographic networks,
suggesting colonization or ongoing geographic isolation
from the rest of the populations.
More importantly, it was astonishing to find syntop-
ically occurring Mt. Ambua (Papua New Guinea) speci-
mens in isolated clades C6 and C7 (Figs 6, 7). Specimens
in C6 form a well-delineated clade in the network as well
as in the phylogenetic trees. The Ambua specimens from
the main clade C7 group with individuals from the
mountain chain west of the Mt. Hagen-Ambua area, that
is, the Telefomin-Mianmin-Aipo area (the wider Star
Mountains, Fig. 7 map). The presence of two genetically
very distinct populations of R. suturalis in the same local-
ity suggests longer isolation of a population in the Mt.
Hagen-Ambua area (Figs 6, 7), and recent secondary con-
tact with dispersers out of the widespread clade C7. It is
striking to note that the single specimen we obtained
from the foot of Mountain Hagen, from the valley close
to Mt. Hagen Town, also belongs to the large clade C7
and has no closer relatives, supported in both tree and
network inference.
Pleistocene evolution in the R. suturaliscomplex
The divergence time estimates support an Early Pleistocene
origin of the R. suturalis southern clade, while the branch-
ing pattern indicates that the radiation of the group started
more recently, most likely in the Middle Pleistocene
(~1 Ma). Furthermore, the sudden demographic expansion
during the late Pleistocene, c. 600 kyr ago, corroborates
this scenario of recent radiation during the Quaternary ice
ages (2.4 Ma until present) (Hewitt 2000). By then, the
high mountains of New Guinea and their (peat) swamps
existed already, meaning that vast, highly structured high-
lands and associated habitats were available.
During the last decades, the impact of Pleistocene gla-
ciations on tropical regions has been widely acknowledged,
including global cooling, rising aridity, rainforest deple-
tion, and ecosystem fragmentation associated with refugial
budding especially in highlands (Hewitt 2000; Hope et al.
2004; Rull 2011). On the other hand, the dispersal or
adaptation of taxa driven by habitat loss or alteration has
been increasingly highlighted recently for several insect
groups, assuming that the type of response to climate
shifts lies on the timescale considered (e.g., Smith and
Farrrell 2005; Winkler et al. 2009; Hawlitschek et al. 2012;
Toussaint et al. 2012). Interestingly, our findings support
the hypothesis that diversification and dispersal of R.sutu-
ralis started during the Plio-Pleistocene transition
(~2.5 Ma), as advocated by Balke et al. (2009). Moreover,
the placement of New Guinean species suggests a first
transgression of Wallace’s line during the early Pleistocene
(~2.4 Ma) followed by a settlement in New Guinean high-
lands. Dispersal across the Australian region possibly out
of New Guinea, toward New Zealand, New Caledonia,
Sahul, and Wallacea, with secondary transgression of
Wallace’s line into Java occurred at the same time as the
ongoing cooling of the region in the Pliocene (Figs 4, 9).
During this period, the sharp reduction in temperatures
in New Guinean highlands may have led to altitudinal
migration implying downward dispersion of most of the
species, but also the adaptation of some populations to
cooler climate, therefore promoting isolation by vicariance
(Rull 2011). At this time, New Guinea had a similar relief
to today, with extremely rugged highlands surrounded by
Figure 9. Maximum credibility tree with mean ages (Ma) from the BEAST analysis. A 1-Ma timescale is shown at the bottom of the chronogram
and spans a period of time from the late Miocene to the present. The 95%HPD intervals of divergence times are shown between square brackets
for the three major nodes of the chronogram. The vertical bands and pastilles at the nodes of different colors referring to the color of the clades
highlight groups of interest for which the names are provided in the top left of the figure. A map with bathymetric information (light blue
indicates shallow sea/dark blue indicates deep sea) is shown along with a graphic presenting the evolution of sea level and temperature during
the last 7 Ma.
ª 2013 The Authors. Published by Blackwell Publishing Ltd. 15
E. F. A. Toussaint et al. Evolution of Australasian Carnivorous Diving Beetles

lowland tropical rainforests on either side, and often inter-
spersed with chains of lowland forests in-between. There-
fore, and even though forest expanse was declining,
different geographic localities would have had significantly
different microclimates during glacial maxima (Hewitt
2000; Hope et al. 2004), with the likely presence of multi-
ple suitable refugia. Populations trapped in these sky
islands then likely evolved in a similar way to the classic
case of oceanic island isolation (Gillespie and Roderick
2002), while the downward migration of the New Guinean
highland biota and its dispersion in Australasia might have
promoted speciation in lowlands. As advocated by Verstap-
pen (1997) and Hewitt (2000), the Pleistocene glaciations,
even though driving global cooling, nevertheless consti-
tuted a succession of warmer and cooler periods known as
the Milankovitch cycles. Therefore, highland populations
might have been separated in times of cooling, promoting
genetic isolation in sky islands, before being reconnected to
other populations during warmer climatic phases.
Interestingly, our results underpin the different
expected prospective stages of an early lineage diversifica-
tion: (1) within the widespread morphologically delin-
eated R. suturalis, there are different narrow-endemic
species, which are morphologically quite distinct from
R. suturalis (R. riedeli, R. supranubicus, with differences in
male genitalia and male fore claws, the latter also display-
ing different coloration); (2) there are different narrow-
endemic species with differences in male genitalia, but
otherwise rather similar to R. suturalis (R. dani, R. ekari,
and R. kakapupu, the latter not sequenced here); (3) there
are genetically isolated groups morphologically, however,
assigned to R. suturalis (e.g., the Mt. Hagen-Ambua clade,
as well as an isolated New Zealand clade); and (4) within
R. supranubicus, we find deep divergence between speci-
mens from the same puddles, collected over a decade.
The latter case, as well as the syntopical presence of the
Mt. Hagen-Ambua clade with individuals from a distant
clade, strongly support the idea that isolation of popula-
tions after dispersal can be comparably long, but second-
ary contact of populations might occur at any time.
Here, we suggest that this budding speciation might
represent a good example of peripatric speciation, as the
populations were not only geographically separated but
also had to adapt to local ecological conditions in the
periphery of the species distributional range. While this
ongoing speciation process occurred in highlands, the
Australian lowland populations obviously remained con-
nected by strong gene flow as indicated by the low diver-
gence levels of the haplotypes among the southern clades.
Populations in Sunda and the Wallacean mountains, with
the exception of Flores, were not monophyletic (Fig. 6),
indicating incomplete lineage sorting after very recent
arrival, or continuous gene flow across tropical lowland
and oceanic barriers. The syntopic occurrence of beetles
from distinct clades, as illustrated by New Guinea and
New Zealand highland communities, might indicate that
these parts of the R. suturalis species complex are at the
end of an isolation stage. Interestingly, the exclusion of
Sumatran specimens from the southern clade confirms
the hypothesis of Balke et al. (2009), suggesting that the
northern and southern clades are now separated by only a
few 100 km between Sumatra and Java.
There might be another interpretation of these macro-
evolutionary patterns. The northern and southern clades
of R. suturalis could represent two morphologically highly
similar yet different species. We did not consider assign-
ing two species names because we lack samples from
southern Sumatra and mainland Southeast Asia and the
Philippines, which we suggest might help to better under-
stand species limits in this complex. If there were indeed
two distinct species, and depending on the topology of
the undersampled northern group, the supertramp trait
might either still be ancestral in the R. suturalis complex,
or has originated twice. In the southern group, this would
be the origin of a supertramp (R. suturalis, which has its
type locality in Java) out of the New Guinea clade of nar-
row-endemic species. Colonization of the Australasian
region would have led to the formation of a paraphyletic
series of narrow-endemic species, and then origin of the
widespread New Guinea-Australian region-Wallacean su-
pertramp. Peripheral speciation would, in that case, be
ongoing in the rather deviating New Guinea and possibly
Flores clades within R. suturalis.
Conclusion
R. suturalis is a morphologically rather uniform, very
widespread, dispersive species and ecological generalist,
occurring from saline ponds in oasis up to high altitude
peat swamps, although being absent from tropical low-
lands. Populations of R. suturalis across the Australasian-
Indomalayan region are well connected by ongoing dis-
persal while peripheral speciation processes occur in high-
land ecosystems. Mountains of New Zealand and much
more, so in the extremely rugged vast highlands of New
Guinea, apparently harbor different stages of speciation.
There are four narrow endemics, morphologically and
genetically distinct species emerging from within the
widespread genealogy. Furthermore, there are several
genetically more or less divergent, isolated clades that
agree morphologically, however, with the widespread
form. We suggest that reproductive isolation has been
shaped by Quaternary glaciations that promoted periph-
eral budding especially in New Guinea sky island ecosys-
tems. The general cooling since the Pliocene might have
promoted the demographic expansion and wide disper-
16 ª 2013 The Authors. Published by Blackwell Publishing Ltd.
Evolution of Australasian Carnivorous Diving Beetles E. F. A. Toussaint et al.

sion observed in R. suturalis, out of a clade of narrow en-
demics. Rhantus suturalis illustrates the reversal or switch
of endemic species to widespread generalists, and then
toward narrow-endemism (presumably with loss of physi-
ological tolerance) again. This is an element of the taxon
cycle (Wilson 1959, 1961), which predicts that higher
physiological tolerance might occur at some stage in line-
age evolution and promote colonization of new areas, and
ultimately diversify into more specialized habitats. The
high mountains of New Guinea act as a diversity pump
for the region and therefore represent an evolutionary
cradle of diversity, certainly deserving further investiga-
tion based on more extensive taxon and character
sampling.
Acknowledgments
We thank Mark de Bruyn, Oliver Hawlitschek, Ignacio
Ribera, Thomas von Rintelen, and two anonymous
reviewers for the fruitful comments that considerably
helped to improve this article. We also thank Jan Ham-
rsk�y for the stunning photography of habitus illustrating
this study. This study was supported by German Science
Foundation (DFG) grants BA2152/6-1, 7-1 and 11-1.
Authors Contributions
Conceived and designed the experiments: EFAT MB. Col-
lected the samples: KS LH MB SS. Analyzed the data:
EFAT. Designed the figures: EFAT. Wrote the paper:
EFAT MB. Contributed substantially to the modifications
of manuscript drafts: LH.
Conflict of Interest
None declared.
References
de Aguiar, M. A. M., M. Baranger, E. M. Baptestini, L.
Kaufman, and Y. Bar-Yam. 2009. Global patterns of
speciation and diversity. Nature, 460:384–387.
Avise, J. C. 2000 Phylogeography. The history and formation
of species. Harvard University Press, Cambridge, MA.
Balke, M. 1993. Taxonomische Revision der pazifischen,
australischen und indonesischen Arten der Gattung Rhantus
Dejean, 1833 (Coleoptera: Dytiscidae). Koleopterol.
Rundsch., 63:39–84.
Balke, M.. 2001. Biogeography and classification of New
Guinea Colymbetini (Coleoptera: Dytiscidae). Invertebr.
Taxon., 15:259–275.
Balke, M., and L. Hendrich. 1992. Ein neuer Rhantus Dejean
aus West-Neuguinea (Coleoptera: Dytiscidae). Entomol. Z.
102:37–39.
Balke, M., G. Wewalka, Y. Alarie, and I. Ribera. 2007.
Molecular phylogeny of Pacific island Colymbetinae:
radiation of New Caledonian and Fijian species (Coleoptera,
Dytiscidae). Zool. Scr. 36:173–200.
Balke, M., I. Ribera, M. Miller, L. Hendrich, K. Sagata, A.
Posman, et al. 2009. New Guinea highland origin of a
widespread arthropod supertramp. Proc. R. Soc. B Bio. Sci.
276:2359–2367.
Barraclough, T. G., and A. P. Vogler. 2000. Detecting the
geographical pattern of speciation from species level
phylogenies. Am. Nat. 155:419–434.
Barraclough, T. G., J. E. Hogan, and A. P. Vogler. 1999.
Testing whether ecological factors promote cladogenesis in a
group of tiger beetles (Coleoptera: Cicindelidae). Proc. R.
Soc. B Bio. Sci. 266:1061–1067.
Brown, J. M., and A. R. Lemmon. 2007. The importance of
data partitioning and the utility of Bayes factors in Bayesian
phylogenetics. Syst. Biol., 56:643–655.
de Bruyn, M., and P. B. Mather. 2007. Molecular signatures of
Pleistocene sea-level changes that affected connectivity
among freshwater shrimp in Indo-Australian waters. Mol.
Ecol., 16:4295–4307.
Cloos, M., B. Sapiie, A. Q. van Ufford, R. J. Weiland, P. Q.
Warren, and T. P. McMahon. 2005. Collisonal delamination
in New Guinea: the geotectonics of subducting slab
breakoff. Geol. S. Am. S. Paper, 400:1–51.
Condamine, F. L., E. F. A. Toussaint, A. M. Cotton, G. S.
Genson, F. A. H. Sperling, and G. J. Kergoat. 2013. Fine-
scale biogeographical and temporal diversification processes
of peacock swallowtails (Papilio subgenus Achillides) in the
Indo-Australian Archipelago. Cladistics, 29:88–111.
Cope, E. D. 1896. The primary factors of organic evolution.
Open Court Publishing Company, Chicago.
Coyne, J. A., and H. A. Orr. 2004. Speciation. Sinauer
Associates, Inc., Sunderland, MA.
Craft, K. J., S. U. Pauls, K. Darrow, S. E. Miller, P. D. N. Hebert,
L. E. Helgen, et al. 2010. Population genetics of ecological
communities with DNA barcodes: an example from New
Guinea Lepidoptera. Proc. Natl. Acad. Sci.USA, 107:5041–6.
Crow, K. D., H. Munehara, and G. Bernardi. 2010. Sympatric
speciation in a genus of marine reef fishes. Mol. Ecol.,
19:2089–2105.
Darwin, C. 1859. The Origin of Species by Means of Natural
Selection. Penguin Classics, Harmondsworth, UK.
Darwin, C., and A. Wallace. 1858. On the tendency of species
to form varieties, and on the perpetuation of varieties and
species by natural means of selection. J. Linn. Soc. London,
Zool. 3:45–62.
Deiner, K., A. R. Lemmon, A. L. Mack, R. C. Fleisher, and
J. P. Dumbacher. 2011. A passerine bird’s evolution
corroborates the geological history of the island of New
Guinea. PLoS ONE, 6:e19479.
Drummond, A. J., A. Rambaut, B. Shapiro, and O. Pybus.
2005. Bayesian coalescent inference of past population
ª 2013 The Authors. Published by Blackwell Publishing Ltd. 17
E. F. A. Toussaint et al. Evolution of Australasian Carnivorous Diving Beetles

dynamics from molecular sequences. Mol. Biol. Evol.
22:1185–1192.
Drummond, A. J., M. A. Suchard, D. Xie, and A. Rambaut.
2012. Bayesian phylogenetics with BEAUti and the BEAST
1.7. Mol. Biol. Evol. 29:1969–1973.
Excoffier, L., G. Laval, and S. Schneider. 2005. Arlequin ver.
3.0: An integrated software package for population genetics
data analysis. Evol. Bioinform. Online 1:47–50.
Fitzpatrick, B. M., and M. Turelli. 2006. The geography of
mammalian speciation: mixed signals from phylogenies and
range maps. Evolution 60:601–615.
Fitzpatrick, B. M., J. A. Fordyce, and S. Gavrilets. 2009
Pattern, process and geographic modes of speciation.
J. Evol. Biol., 22:2342–2347.
Fu, Y. 1997. Statistical tests of neutrality of mutations against
population growth, hitchhiking and background selection.
Genetics 147:915–925.
Gillespie, R. G., and G. K. Roderick. 2002. Arthropods on
islands: colonization, speciation, and conservation. Ann.
Rev. Entomol. 47:595–632.
Goloboff, P. A.. 1999. Analyzing large data sets in reasonable
times: solutions for composite optima. Cladistics 15:415–
428.
Goloboff, P. A., J. S. Farris, and K. C. Nixon. 2008. TNT, a
free program for phylogenetic analysis. Cladistics 24:774–786.
Hall, J. P.. 2005. Montane speciation patterns in Ithomiola
butterflies (Lepidoptera: Rhiodinidae). Proc. Roy. Soc. B
Biol. Sci., 272:2457–2466.
Hall, R. 2011. Australia-SE Asia collision: plate tectonics and
crustal flow. Pp. 75–109 in R. Hall, M. A. Cottam and M. E. J.
Wilson, eds. The SE Asian Gateway: History and Tectonics of
Australia-Asia Collision. Geol. Soc. Lond., London.
Harpending, H. 1994. Signature of ancient population growth
in a low resolution mitochondrial DNA mismatch
distribution. Human Biol., 66:591–600.
Hawlitschek, O., L. Hendrich, M. Espeland, E. F. A. Toussaint,
M. J. Genner, and M. Balke. 2012. Pleistocene climate
change promoted rapid diversification of aquatic
invertebrates in Southeast Australia. BMC Evol. Biol. 12:142.
Heald, W. 1967. Sky Island. Van Nostrand, Princeton, NJ.
Heled, J., and A. J. Drummond. 2008. Bayesian inference of
population size history from multiple loci. BMC Evol. Biol. 8:289.
Hewitt, G. 2000. The genetic legacy of the quaternary ice ages.
Nature, 405:907–913.
Ho, S. Y. W., and M. J. Phillips. 2009. Accounting for
calibration uncertainty in phylogenetic estimation of
evolutionary divergence times. Syst. Biol. 58:367–380.
Ho, S. Y. W., and B. Shapiro. 2011. Skyline-plot methods for
estimating demographic history from nucleotide sequences.
Mol. Ecol. Resour. 11:423–434.
Hope, G., A. P. Kershaw, S. van der Kaars, S. Xiangjun, P.
Liew, L. E. Heusser, et al. 2004. History of vegetation and
habitat change in the Austral-Asian region. Quaternary
International, 118-119 10:3–126.
Johannesson, K. 2010. Are we analyzing speciation without
prejudice? Ann. NY. Acad. Sci. 1206:143–149.
Joseph, L., and K. E. Omland. 2009. ROWLEY REVIEW
Phylogeography: its development and impact in Australo-
Papuan ornithology with special reference to paraphyly in
Australian birds. Emu 109:1–23.
Kass, R., and A. Raftery. 1995. Bayes factors and model
uncertainty. J. Amer. Statist. Assoc. 90:773–795.
Klaus, S., S. Selvandran, J. W. Goh, D. Wowor, D. Brandis, P.
Koller, et al. 2013. Out of Borneo : Neogene diversification
of Sundaic freshwater crabs (Crustacea: Brachyura:
Gecacinucidae: Parathelphusa). J. Biogeogr. 40:63–74.
Librado, P., and J. Rozas. 2009. DnaSP v5: A software for
comprehensive analysis of DNA polymorphism data.
Bioinformatics 25:1451–1452.
Lynch, J. D. 1989. The gauge of speciation: on the frequencies
of modes of speciation. Pp. 527–553 in D. Otte and J. A.
Endler, eds. Speciation and Its Consequences . Sinauer
Associates, Sunderland, Mass.
Mayr, E. 1963. Animal Species and Evolution. Harvard
University Press, Cambridge.
Mayr, E. 1982. The growth of biological thought: diversity,
evolution, and inheritance. Belknap Press, Cambridge, MA.
Mayr, E., and J. M. Diamond. 1976. Birds on islands in the
sky: origin of the montane avifauna of northern Melanesia.
Proc. Nat. Acad. Sci. USA 73:1765–1769.
Mayr, E., and J. M. Diamond. 2001. The Birds of Northern
Melanesia: Speciation, Ecology and Biogeography. Oxford
Univ. Press, New York.
McCulloch, G. A., G. P. Wallis, and J. M. Waters. 2010. Onset
of glaciation drove simultaneous vicariant isolation of alpine
insects in New Zealand. Evolution 64:2033–2043.
Metcalfe, I.. 2011. Tectonic framework and Phanerozoic
evolution of Sundaland. Gondwana Res. 19:3–21.
Miller, K. G., M. A. Kominz, J. V. Browning, J. D. Wright, G.
S. Mountain, M. E. Katz, et al. 2005. The Phanerozoic
record of global sea-level change. Science 310:1293–1298.
Mittermeier, R. A., P. R. Gil, M. Hoffmann, J. Pilgrim, T.
Brooks, C. G. Mittermeier, et al. 2004. Hotspots revisited:
Earth’s Biologically Richest and Most Threatened
Ecoregions. CEMEX, Mexico City, Mexico.
Posada, D. 2008. JModelTest: Phylogenetic Model Averaging.
Mol. Biol. Evol. 25:1253–1256.
Rambaut, A., and A. J. Drummond. 2007. Tracer v1.4,
Available at: http://beast.bio.ed.ac.uk/Tracer.
Ribera, I., A. Castro, J. A. D�ıaz-Pazos, J. Garrido, A. Izquierdo,
M. A. J€ach, et al. 2011. The geography of speciation in
narrow range endemics of the ‘‘Haenydra’’ lineage
(Coleoptera, Hydraenidae, Hydraena). J. Biogeogr. 38:502–
516.
Robin, V. V., A. Sinha, and U. Ramakrishnan. 2010. Ancient
geographical gaps and paleo-climate shape the
phylogeography of an endemic bird in the sky islands of
southern India. PLoS ONE 5:e13321.
18 ª 2013 The Authors. Published by Blackwell Publishing Ltd.
Evolution of Australasian Carnivorous Diving Beetles E. F. A. Toussaint et al.

Ronquist, F., and J. P. Huelsenbeck. 2003. MrBayes 3: Bayesian
phylogenetic inference under mixed models. Bioinformatics
19:1572–1574.
Rull, V. 2011. Neotropical biodiversity: Timing and potential
drivers. Trends Ecol. Evol. 26:508–513.
Santini, F., M. P. Miglietta, and A. Faucci. 2012. Speciation:
where are we now? An introduction to a special issue on
speciation. Evol. Biol. 39:141–147.
Schneider, S., and L. Excoffier. 1999. Estimation of past
demographic parameters from the distribution of pairwise
differences when the mutation rates very among sites:
application to human mitochondrial DNA. Genetics,
152:1079–1089.
Schultheis, A. S., J. Y. Booth, L. R. Perlmutte, J. E. Bond, and
A. L. Sheldon. 2012. Phylogeography and species
biogeography of montane great basin stoneflies. Mol. Ecol.
21:3325–3340.
Simon, C., F. Frati, A. T. Beckenbach, B. Crespi, H. Liu, and
P. Flook. 1994. Evolution, weighting, and phylogenetic
utility of mitochondrial gene sequences and a compilation
of conserved polymerase chain reaction primers. Ann.
Entomol. Soc. Am. 87:651–701.
Smith, C. I., and B. D. Farrrell. 2005. Phylogeography of the
longhorn cactus beetle Moneilema appressum LeConte
(Coleoptera: Cerambycidae): was the differentiation of the
Madrean sky islands driven by Pleistocene climate changes?
Mol. Ecol. 14:3049–3065.
Stamatakis, A.. 2006. raxml-vi-hpc: maximum likelihood-based
phylogenetic analyses with thousands of taxa and mixed
models. Bioinformatics 22:2688–2690.
Swofford, D. L. 2003. PAUP*. Phylogenetic Analysis Using
Parsimony (*and Other Methods). Version 4. Sinauer
Associates, Sunderland, Massachusetts.
Tajima, F. 1989. Statistical method for testing the neutral
mutation hypothesis by DNA polymorphism. Genetics
123:585–595.
Teacher, A. G. F., and D. J. Griffiths. 2011. HapStar:
automated haplotype network layout and visualization. Mol.
Ecol. Resour. 11:151–153.
Toussaint, E. F. A., F. L. Condamine, G. J. Kergoat, C.
Capdevielle-Dulac, J. Barbut, J. Silvain, et al. 2012.
Palaeoenvironmental shifts drove the adaptive radiation of a
noctuid stemborer tribe (Lepidoptera, Noctuidae, Apameini)
in the Miocene. PLoS ONE 7:e41377.
Trewick, S. A., G. P. Wallis, and M. Morgan-Richards. 2000.
Phylogeographical pattern correlates with Pliocene mountain
building in the alpine scree weta (Orthoptera,
Anostostomatidae). Mol. Ecol. 9:657–666.
Verstappen, H. T. 1997. The effect of climatic change on
Southeast Asian geomorphology. J. Quaternary Sci. Rev.
12:413–418.
Von Rintelen, T., A. B. Wilson, A. Meyer, and M. Glaubrecht.
2004. Escalation and trophic specialization drive adaptive
radiation of freshwater gastropods in ancient lakes on Sulawesi,
Indonesia. Proc. Roy. Soc. B Biol. Sci. 271:2541–2549.
Wallace, A. R. 1860. On the Zoological Geography of the
Malay Archipelago. Journal of the Proceedings of the
Linnean Society of London, Zoology, 4:172–184.
White, M. J. D. 1968. Models of speciation. Science, 159:1065–
1070.
Wilson, E. O. 1959. Adaptive shift and dispersal in a tropical
ant fauna. Evolution, 13:122–144.
Wilson, E. O. 1961. The nature of the taxon cycle in the
Melanesian ant fauna. American Naturalist, 95:169–193.
Winkler, I. S., C. Mitter, and S. J. Scheffer. 2009. Repeated
climate-linked host shifts have promoted diversification in a
temperate clade of leaf-mining flies. Proc. Natl Acad. Sci.
USA 106:18103–18108.
Supporting Information
Additional Supporting Information may be found in the
online version of this article:
Figure S1. Best neighbour joining topology.
Figure S2. Best maximum parsimony topology.
Figure S3. Best maximum likelihood topology.