AusNet Services Full Year 2015 Results Release and ...May 14, 2015 · 1 14 May 2015 TO: ASX...
65
14 May 2015 TO: ASX Limited Singapore Exchange Securities Trading Limited AusNet Services Full Year 2015 Results Release and Investor Presentation The following documents are attached: 1. AusNet Services Full Year 2015 Results Release; and 2. Investor Presentation. Susan Taylor Company Secretary For personal use only
Transcript of AusNet Services Full Year 2015 Results Release and ...May 14, 2015 · 1 14 May 2015 TO: ASX...

14 May 2015
TO: ASX Limited Singapore Exchange Securities Trading Limited
AusNet Services Full Year 2015 Results Release and
Investor Presentation
The following documents are attached:
1. AusNet Services Full Year 2015 Results Release; and
2. Investor Presentation.
Susan Taylor Company Secretary
For
per
sona
l use
onl
y

1
14 May 2015
TO: ASX Limited Singapore Exchange Securities Trading Limited
AusNet Services Full Year 2015 Results
AusNet Services today announced its full year results for the period ending 31 March 2015, reporting a 1.9% increase in
revenues to $1,833.9m, a 2.9% increase in Earnings Before Interest, Tax, Depreciation and Amortisation (EBITDA) to
$1,047.2m and a Net Profit After Tax (NPAT) of $22.6m. NPAT variance to the prior corresponding period is principally due
to several items including:
$183.3m impact due to a binding agreement with the Australian Taxation Office (ATO) to settle all matters
concerning the intra-group financing review (Division 974 audit and related reviews) and rights to future income
issues;
$84.1m recognition of net exposure in relation to Intellectual Property dispute with the ATO
$60.6m Advanced Metering Infrastructure Program (AMI) charges relating to customer rebates provision
($32.5m) and asset write-off ($28.1m);
Prior period inclusion of $57.7m termination of the Management Services Agreement (MSA) and associated
costs, performance fees in relation to the MSA of $22.2m and $86.7m recognition of amounts potentially payable
under the Section 163AA ATO impost dispute.
Adjusted EBITDA includes the $28.1m AMI asset write-off and decreased by 1.6% to $1079.7m. Adjusted NPAT
decreased by 2.5% to $312.8m. The Directors declared a final 2015 distribution of 4.18 Australian cents per security, a
total of 8.36 cents per security for FY15. The final 2015 distribution will be 60% franked, if the restructure and simplification
proposal (Proposal) is implemented before the next distribution payment date of 26 June 2015.
A$M FY 2015 FY 2014 Variance
Statutory Result Revenue 1,833.9 1,799.4 up 1.9%
EBITDA 1,047.2 1,017.4 up 2.9%
EBIT 668.0 647.7 up 3.1%
PBT 354.4 305.4 up 16.0%
NPAT 22.6 178.3 down -87.3%
Adjusted EBITDA 1,3 1,079.7 1,097.3 down -1.6%
Adjusted NPAT 2,3 312.8 320.9 down -2.5%
Final distribution 4.18 4.18 unchanged 0.0%
1. Adjusted EBITDA excludes the recognition of a provision for Advanced Metering Infrastructure (AMI) customer rebates of $32.5 million for the year ended 31 March 2015 and $50.0 million payable for the termination of the Management Services Agreement (MSA), $22.2 million of performance fees under the MSA and $7.7 million in restructuring costs associated with the Termination Deed for the year ended 31 March 2014.
2. As well as the after-tax impact of the items listed for adjusted EBITDA above, Adjusted NPAT also excludes recognition of $183.3 million in incoe tax expense for the settlement with the ATO in relation to the intra-group financing audit for the year ended 31 March 2015; excludes $84.1 million recognition of net exposure relating to Intellectual Property dispute with the ATO for the period ended 31 March 2015 and; excludes a net charge of $86.7 million for the amount potentially payable in respect of the Section 163AA dispute for the year ended 31 March 2014.
3. Adjusted EBITDA and Adjusted NPAT are non-IFRS measures that have not been subject to audit or review.
For
per
sona
l use
onl
y

2
Operational Review
Electricity distribution
31 March 2015
31 March 2014
Movement %
Segment revenue ($M) 879.6 815.1 64.5 7.9%
Segment result – EBITDA ($M) 453.7 451.6 2.1 0.5%
Volume (GWh) 7,361 7,483 (122) (1.6%)
Connections 679,213 668,603 10,610 1.6%
Capital expenditure ($M) 486.9 568.6 (81.7) (14.4%)
Adjusted segment result ($M)1 486.2 465.3 20.9 4.5%
1. Adjusted segment result excludes $32.5 million of AMI rebates for 31 March 2015 and $13.7 million of performance fees for 31 March 2014. Adjusted segment result is a non-IFRS measure that has not been subject to audit or review.
Despite the slight decline in volumes distributed, AusNet Services’ electricity distribution business achieved an increase in
revenue, primarily driven by regulated price increases for both electricity distribution and AMI. The electricity distribution
price increase is due to a combination of regulated price path, as well as higher revenues under incentive schemes, partially
offset by a price reduction for the pass-through of transmission use of system charges.
An increase in EBITDA has been achieved despite $60.6 million in AMI charges relating to customer rebates ($32.5 million)
and write-off of assets ($28.1 million) and $11.1 million of higher transmission use of system charges, which will be
recovered in next year’s revenues. The prior year included $13.7 million of SPI Management Services performance fees.
Of the total electricity distribution capital expenditure of $486.9 million, $119.3 million was spent on asset replacement while
a further $114.3 million relates to various safety programs, including those highlighted in the Victorian Bushfire Royal
Commission. The decrease in capital expenditure from the previous year is due to AMI, with completion of the meter and
communication rollouts, principally occurring in the previous year.
Gas distribution
31 March 2015
31 March 2014
Movement %
Segment revenue ($M) 187.3 219.5 (32.2) (14.7%)
Segment result – EBITDA ($M) 142.0 168.1 (26.1) (15.5%)
Volume (PJ) 64.2 67.0 (2.8) (4.2%)
Connections 647,536 633,184 14,352 2.3%
Capital expenditure ($M) 99.0 112.2 (13.2) (11.8%)
The reduction in gas distribution segment revenue is largely the result of price reductions following a lower WACC in the
latest gas regulatory determination, with a 15 per cent price reduction on 1 July 2013, and a further 4 per cent price
reduction on 1 January 2014, driving regulated revenues down $19 million. In addition, customer contributions reduced
$13.3 million due to the prior year recognition of $20.9 million of gifted distribution network assets as part of the Regional
Rail Link project.
Lower industrial volumes contributed to almost 80 per cent of the volume decline. Weather conditions accounted for the
For
per
sona
l use
onl
y

3
remainder of the decline as weather normalised residential consumption increased 1.4 per cent.
The gas distribution business contributed $142.0 million to EBITDA for the year, a decrease of $26.1 million over the
previous year primarily as a result of lower revenues, partially offset by prior year expenses containing a $7.9 million
increase in the environmental provision for the remediation of contaminated former gas sites.
AusNet Services remains committed to allocating its resources to ensure a safe and reliable supply of natural gas to
existing customers and bringing more gas to Victorians through efficient investment. In addition to ongoing expansion of
the network, AusNet Services has agreed to extend its gas network to several towns identified in the Victorian
Government’s Energy for the Regions program. To date, AusNet Services has an agreement with Regional Development
Victoria for the supply and reticulation of natural gas to Huntly, Avoca, Bannockburn and Winchelsea with Huntly
completed during the financial year and work underway in the other three towns.
Electricity transmission
31 March 2015
31 March 2014
Movement %
Segment revenue ($M) 619.8 628.3 (8.5) (1.3%)
Segment result – EBITDA ($M) 434.5 436.9 (2.4) (0.6%)
Capital expenditure ($M) 212.3 232.7 (20.4) (8.8%)
The decrease in electricity transmission revenues is as a result of the reduction in regulatory WACC arising from the
Transmission Revenue Reset (TRR) Final Determination for the 2014-17 period, which commenced on 1 April 2014.
The electricity transmission business contributed $434.5 million to EBITDA for the year, a decrease of $2.4 million over the
previous year. The impact of lower revenues was offset by the removal of Management Services performance fees in the
current year.
The decline in capital expenditure is a result of the completion of several major terminal station upgrades. The TRR
provides funding for key transmission projects, particularly the replacement and refurbishment of several major CBD
terminal stations, including Richmond and West Melbourne, which underpin electricity supply to the Melbourne central
business district. In addition, AusNet Services is undertaking an upgrade of the Brunswick terminal station.
Select Solutions
31 March 2015
31 March 2014
Movement %
Segment revenue ($M) 158.9 150.7 8.2 5.4%
Segment result – EBITDA ($M) 17.0 18.5 (1.5) (8.1%)
Select Solutions provides asset intelligence and end to end metering solutions to external parties and AusNet Services.
Select Solutions' customers are primarily businesses operating in the essential infrastructure sector such as electricity,
water and gas utility owners, (including Jemena, which is considered a related party as it is controlled by State Grid) and
telecommunications companies.
For
per
sona
l use
onl
y

4
Select Solutions revenues increased by 5.4 per cent largely due to Geomatic Technologies (GT), which was acquired in
February 2014. Select Solutions contributed $17.0 million to EBITDA for the year, a decrease of $1.5 million on the prior
period primarily due to a change in revenue recognition treatment in communications revenues, resulting in a $3.8 million
adjustment, partially offset by the GT contribution.
Outlook
AusNet Services remains committed to growing, modernising and transforming its existing networks. Despite increasing
pressures on cost efficiencies from both the regulator and customers, AusNet Services is focused on delivering value to
securityholders by moving to more efficient operating model. To assist this objective, AusNet Services is considering a
restructure and simplification Proposal.
Under the Proposal, a new company called AusNet Services Ltd would become the single head entity of AusNet Services
in place of the current triple stapled structure. There will be no capital raising as part of the Proposal and securityholders
will not be required to pay any cash consideration. AusNet Services is targeting an implementation date of 18 June
2015.
The final FY 2015 distribution will comprise a 60% franked dividend and 40% unfranked dividend, assuming the Proposal is
implemented prior to the final distribution payment date of 26 June 2015. If the Proposal is not implemented prior to the
final distribution payment date of 26 June 2015, the final distribution will comprise a 53% franked dividend and 47% interest
income.
AusNet Services will continue to determine future distribution amounts from operating cash flows after servicing all of its
maintenance capital expenditure and a portion of its growth capital expenditure. For the 2016 financial year, AusNet
Services expects to increase distributions to 8.53 cents per security. AusNet Services expects the interim 2016 distribution
to be 75% franked, if the Restructure Proposal is implemented.
AusNet Services expects capital expenditure in FY 2016 to be around $900m. AusNet Services continues to assess
acquisition opportunities and other corporate transactions as they arise, along with pursuing opportunities for further
organic growth in existing and related businesses.
Distribution key dates
The 2015 final distribution of 4.18 Australian cents per security comprises 2.51 cents from a franked dividend (60.0%) and
1.67 cents from an unfranked dividend (40.0%).
Important dates:
9 June 2015 ASX & SGX-ST ex-date for final distribution
11 June 2015 Record date to identify securityholders entitled to final distribution
12 June 2015 Last election date for participation in DRP for final distribution
26 June 2015 Payment of final distribution
For
per
sona
l use
onl
y

5
The Distribution Reinvestment Plan (DRP) will be in operation for the 2015 final distribution at a 2% discount to the
average trading price. The average trading price will be the average of the volume weighted average price of securities
sold in ordinary market transactions on the ASX between 12 June 2015 and 18 June 2015 (inclusive). For further
information please refer to the DRP Rules at www.ausnetservices.com.au.
About AusNet Services
AusNet Services is the largest diversified energy network business in Victoria, owning and operating over $12 billion of
electricity and gas distribution assets, including the state-wide electricity transmission network. The company also has a
non-regulated division, Select Solutions, providing utility services.
Headquartered in Melbourne, Australia, AusNet Services employs more than 2,600 people to service over 1.3m consumers
and is listed on the Australian Securities Exchange (ASX: AST) and the Singapore Stock Exchange (SGX-ST: X04). For
more information visit AusNet Services’ website, www.ausnetservices.com.au.
Susan Taylor Company Secretary
5
For
per
sona
l use
onl
y

Full Year 2015 Results
For the financial period ended 31 March 2015
14 May 2015
For
per
sona
l use
onl
y

Disclaimer
The AusNet Services Group (AusNet Services) comprises AusNet Services (Transmission) Ltd (AusNet Services Transmission), AusNet Services (Distribution) Ltd (AusNet Services Distribution) (together, the Companies) and their subsidiaries, AusNet Services Finance Trust and the responsible entity for the AusNet Services Finance Trust, AusNet Services (RE) Ltd (Responsible Entity), which is the holder of the Australian Financial Services Licence No. 294117. Shares in each of the Companies are stapled to units in the AusNet Services Finance Trust.
The information in this presentation is not a prospectus, product disclosure statement or other offering document and does not constitute an offer, invitation or recommendation to subscribe for, retain or purchase any securities in AusNet Services. The information is an overview (in summary form) and does not purport to be complete or contain all the information necessary to make an investment decision. This presentation is not financial product advice and does not take into consideration the investment objectives, financial situation or particular needs of any particular person. You should consider the appropriateness of the information having regard to your individual objectives, financial situation (including taxation position) and needs, and seek independent professional advice. This presentation, and the information in this presentation, will not form the basis of any contract or commitment.
This presentation has been prepared by AusNet Services on the information available. To the maximum extent permitted by law, no representation or warranty, express or implied, is made as to the fairness, accuracy, completeness or correctness of the information, opinions and conclusions in this presentation and AusNet Services, its directors, officers, employees, agents and advisers disclaim all liability and responsibility (including for negligence) for any direct or indirect loss or damage which may be suffered by any recipient through use or reliance on anything contained in or omitted from this presentation.
This presentation contains certain “forward-looking statements” and prospective financial information. These forward looking statements and information are based on the reasonably held beliefs of AusNet Services management as well as reasonable assumptions made by and information currently available to AusNet Services management, and are current only as of the date of this presentation. All statements other than statements of historical facts included in this presentation, including without limitation, statements regarding AusNet Services forecasts, business strategy, synergies, plans and objectives, are forward-looking statements. In addition, when used in this presentation, the words “guidance”, “forecast”, “estimate”, “expect”, “anticipated” and similar expressions are intended to identify forward looking statements. Such statements are subject to significant assumptions, risks and uncertainties, many of which are outside the control of AusNet Services and are not reliably predictable, which could cause actual results to differ materially, in terms of quantum and timing, from those described in this presentation. In receiving this presentation, you agree to the above restrictions and limitations.
2
For
per
sona
l use
onl
y

Note: All references to ‘$’ are Australian dollars unless otherwise stated.
Introduction & Summary
Financial Performance
Operational Review
Strategy & Outlook
For
per
sona
l use
onl
y

Our missionZERO journey continues
Safety is our number one priority
Performance
Safety mission & performance
About missionZero
› Symbolises our safety vision and values. When it comes to the safety of our people our target is ZERO injuries
› Underpinned by a strategy focused on strong safety leadership, safe behaviour, the creation of safe work environments and improved systems and measurement
missionZero progress
› Stronger line management accountability
› Focus on elimination and/or minimisation of risk
26% improvement in Hazard and near miss
reporting
78% improvement in corrective action close
out by due date
FY15 Recordable Injury Frequency Rate
(RIFR) = 6.7
Contractors account for 65% of recordable
injuries
4
10.2
7.1 6.7 6.7
0.0
2.0
4.0
6.0
8.0
10.0
12.0
FY12 FY13 FY14 FY15
For
per
sona
l use
onl
y

Broadening the Investment appeal Substantial progress on de-risking and resolving legacy issues in FY15
5
Reached settlement on Kilmore
East & Murrindindi bushfire class
actions (without admission of
liability). Contributions and costs
have been, or will be, met under
insurance cover.
Settled bushfire class actions
Restructure Proposal
AMI completion Plan
Transformation
Announced and progressed proposal to
simplify corporate structure. Securityholder
Booklet issued in April 2015.
Securityholder meetings to be held on 29
May 2015.
Went ‘live’ with SAP platform on 4 May 2015, SAP is
key enabler of more efficient and sustainable operating
model, providing enhanced information management
and processing. Implementation completed on time and
on budget.
Tax Certainty
Settled intra-group financing audit
(Division 974 audit and related
reviews), providing tax certainty
over historical capital structure.
Developed plan to complete the
Advanced Metering Infrastructure
(AMI) program. Silver Spring
Networks contracted to develop
complementary mesh technology.
For
per
sona
l use
onl
y

AusNet
Services
Restructure Proposal
- Proposed ownership structure
6
If the Proposal is implemented:
New listed entity (AusNet Services Ltd)
will become single head entity of the group
All eligible securityholders will receive one share in AusNet Services Ltd for each stapled security held
No cash payment or capital raising as part
of the Proposal
No change to the composition of the
Board (as a consequence of the Proposal) or to the underlying business and assets
The distribution reinvestment plan will apply to the next distribution in the usual way
AusNet Services Securityholders
AusNet Services Ltd
AusNet
Services (Transmission)
Ltd
AusNet
Services
Finance
Trust
AusNet
Services
(Distribution)
Ltd
For
per
sona
l use
onl
y

Restructure Proposal
The AusNet Services Directors believe that the complexity of the current corporate
structure is no longer appropriate and that the Proposal achieves a number of key benefits:
• Simplification and potential broader investor appeal
• Reduced administration
• Greater certainty of tax position in relation to capital structure
• Facilitates the efficient repayment of AusNet Services Trust Loans
• Improved ability to distribute available franking credits
› also has a number of disadvantages and risks including:
• Profile of future distributions may not suit all investors and no ability to make tax deferred
distributions
• Transaction costs
• Potential stamp duty liability triggered by any further restructure of AusNet Services
subsequent to this Proposal (no such restructure is currently expected)
• Cancellation of AusNet Services’ pre-2005 tax losses but this is expected to be offset by an
increase in the tax base of certain assets as a consequence of tax consolidation
7
Because the benefits outweigh disadvantages and risks, the AusNet Services
Directors believe that the Proposal is in the best interests of Securityholders.
Therefore the Directors unanimously recommend that Securityholders vote in favour
of the Resolutions.
For
per
sona
l use
onl
y

FY 2015 Investment highlights
60% Final FY15
Distribution
franked *
2% Growth in net
operating
cash flows
Revenue ↑ 2%,
EBITDA ↑ 3%
PBT ↑ 16%
Notes
*Assuming restructure implemented prior to final distribution payment date, 26 June 2015
Maintained
‘A’ range credit rating
5% growth in
Regulated & Contracted
Asset Base to
$8.6bn
Guidance for
FY 2016
distribution
growth, to 8.53
cps
Growth in after tax
distributions for
domestic
Securityholders
5%
18.5%
12 month total
Securityholder
return to 31
March 2015
net debt to Regulated &
Contracted Asset Base
2.8x interest cover
68% Stronger
Credit
Metrics
For
per
sona
l use
onl
y

FY14
Distribution growth
9
8.36
cents
8.36
cents
FY15
Full Year Distribution ¢
75% franked dividend expected for Interim 2016 distribution, if the Restructure Proposal is
implemented
FY16
8.53
cents Forecasting
2% growth
For
per
sona
l use
onl
y
Final
FY15
Interest Income
Franked Dividend
Return of Capital
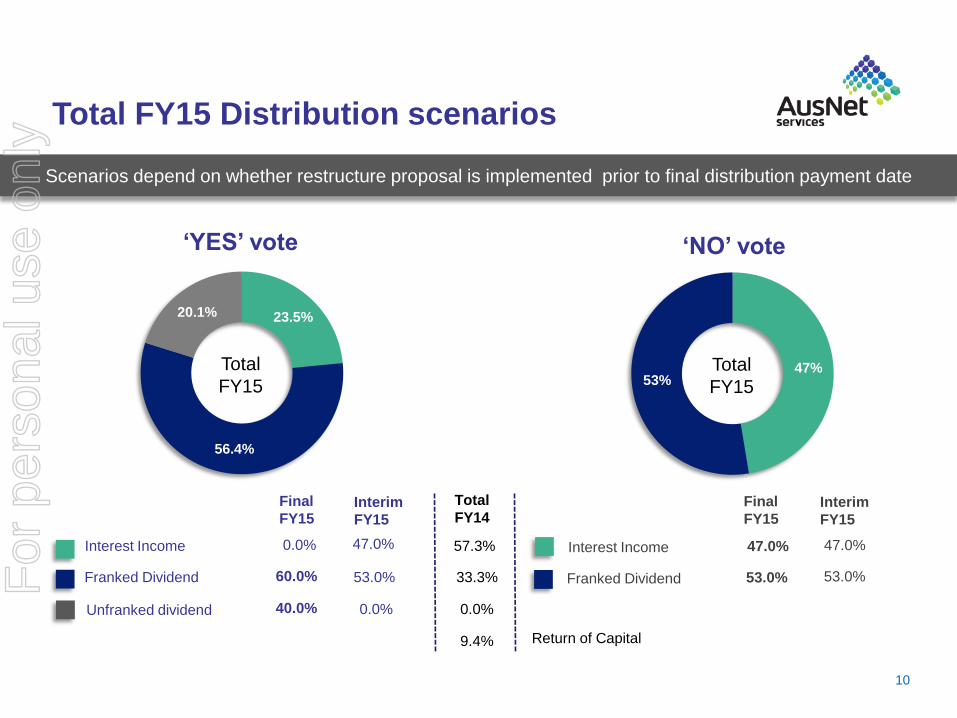
Total FY15 Distribution scenarios
10
8.36cents 8.44
cents
47.0%
53.0%
Final
FY15
Total
FY14
Interest Income
Franked Dividend 33.3%
0.0%
0.0%
60.0%
40.0%
57.3%
Unfranked dividend
9.4%
23.5%
56.4%
20.1%
47% 53%
Interim
FY15
Total
FY15 Total
FY15
Interim
FY15
47.0%
53.0%
0.0%
47.0%
53.0%
‘YES’ vote
Scenarios depend on whether restructure proposal is implemented prior to final distribution payment date
‘NO’ vote
For
per
sona
l use
onl
y

4.12
3.47
2.72
3.94
4.47
3.68
2.79
3.93
0
1
2
3
4
5
Domestic Fund @ 15% Domestic Corporate @ 30% Domestic Individual @ 47% Non Resident @ 15%
Ce
nts
pe
r se
cu
irty
Final FY14 after tax distribution Final FY15 after tax distribution
11
+6.1%
+2.3%
-0.3%
Comparison of final after tax distribution FY15 vs FY14
Notes
• Assumes restructure proposal is implemented prior to final distribution payment date of 26 June 2015
• Withholding tax @ 15% for non-resident in a tax treaty jurisdiction
+8.4%
For
per
sona
l use
onl
y

Note: All references to ‘$’ are Australian dollars unless otherwise stated.
Introduction & Summary
Financial Performance
Operational Review
Strategy & Outlook
For
per
sona
l use
onl
y

Financial performance
13
Higher revenues from electricity
distribution regulated price path
and from AMI
EBITDA impacted by recognition of
AMI customer rebate ($33m) and
AMI asset write-off ($28m)
Higher income tax expense due to:
• ($183m) ATO Audit
settlement (intra-group
financing audit) and;
• ($84m) potential exposure
relating to Intellectual
Property dispute with the
ATO
Full Year to 31 March 2015 (A$M)
A$M FY 2015 FY 2014 Variance
Statutory Result
Revenues 1,833.9 1,799.4 1.9%
EBITDA 1,047.2 1,017.4 2.9%
EBIT 668.0 647.7 3.1%
PBT 354.4 305.4 16.0%
NPAT 22.6 178.3 -87.3%
Final distribution 4.18 4.18 0.0%
Adjusted EBITDA 1,079.7 1,097.3 -1.6%
Adjusted NPAT 312.8 320.9 -2.6%
Notes
Refer to appendices for reconciliation to statutory result
For
per
sona
l use
onl
y

Adjusted results
14
MSA
termination
expense ($58m)
Performance fees
($22m)
1,080 Adjusted EBITDA 1,097
313 Adjusted NPAT 321
FY15 FY14
AMI rebates
($33m)
ATO settlement ($183m)
Section163AA tax
charge ($87m)
Intellectual
Property
charge
($84m) For
per
sona
l use
onl
y

Financial performance
Adjusted result
15
Notes
Refer to appendices for reconciliation to statutory result
Full Year to 31 March 2015 (A$M)
321 313
35 24
28
10
29
10
200
220
240
260
280
300
320
340
360
380
NPAT FY14(adjusted)
OperatingRevenues
Operating Costs AMI asset write-off
Depreciation &Amortisation
Net FinanceCharges
Income TaxExpense
NPAT FY15(adjusted)
$M
F
or p
erso
nal u
se o
nly

Cash flow from operations
16
Full Year to 31 March 2015 (A$M)
Notes: FY14 cash flow includes $22m in performance fees, no longer payable from 31 March 2014
730
768
29
35 19
39 32
550
600
650
700
750
800
850
FY14 Cash flow EBITDA Net FinanceCosts
Income Taxpaid
MSA terminationfee
Change in WorkingCapital
FY15 Cash flow
$M
F
or p
erso
nal u
se o
nly

442 449
135 49
233
212
112
99
0
100
200
300
400
500
600
700
800
900
1000
FY2014 FY2015
$M
Electricity distribution AMI Electricty Transmission Gas distribution
Full Year to 31 March 2015 (A$M)
Gross capital expenditure
FY 2015 capex down 12% as a result of:
› lower AMI program spend due
to completion of meter
installations in previous period
› lower transmission customer
initiated capex
FY 2016 capex guidance of around $900m
Step-up in AMI program spend expected in FY 2016
17
Total $809m
Total $922m
For
per
sona
l use
onl
y
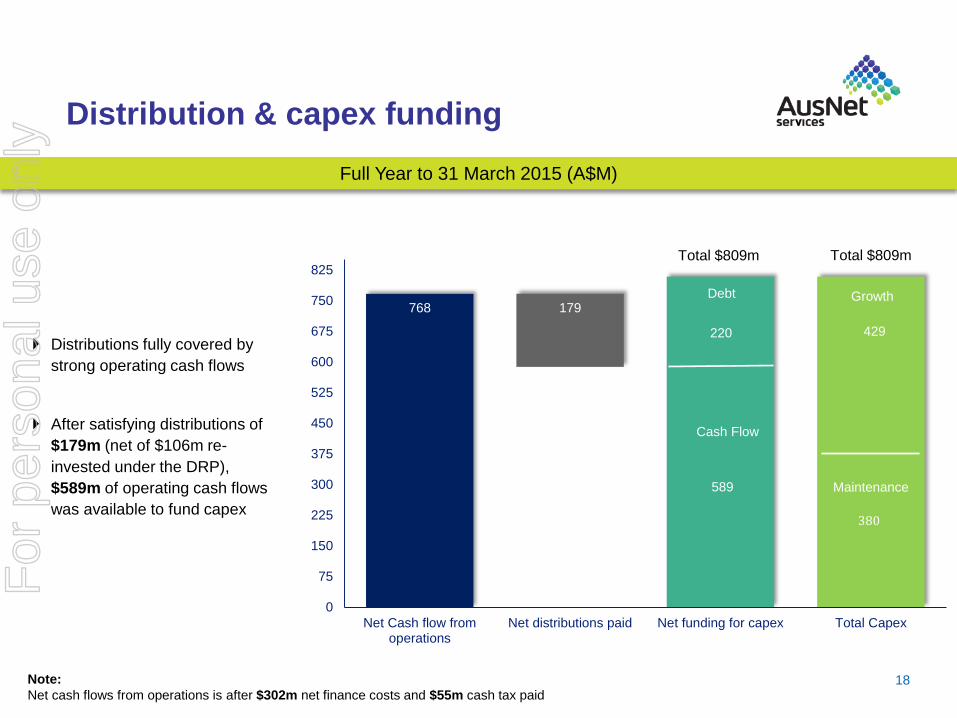
768 179
220
0
75
150
225
300
375
450
525
600
675
750
825
Net Cash flow fromoperations
Net distributions paid Net funding for capex Total Capex
Debt Growth
Maintenance
Cash Flow
589
380
429 Distributions fully covered by
strong operating cash flows
After satisfying distributions of
$179m (net of $106m re-
invested under the DRP),
$589m of operating cash flows
was available to fund capex
Distribution & capex funding
18
Total $809m Total $809m
Full Year to 31 March 2015 (A$M)
Note:
Net cash flows from operations is after $302m net finance costs and $55m cash tax paid
For
per
sona
l use
onl
y

Diversified debt portfolio
19
Debt maturity profile as at 31 March 2015 – Net debt approx. $5,818 (A$M)
As at 31 Mar 2015, AusNet
Services had A$364m of
undrawn, committed bank
debt facilities and A$883m in
cash
Net Debt hedged against
movements in interest rates
(FY15 net debt hedging @
99%)
Raised €560m ($A825m) 12
year bond, third Euro issue in
two years
Notes: Net debt = Debt at face value ($6,701M) less cash / cash equivalents of $883M. Offshore debt shown at hedged rates.
131
325
150
300
400
250 335
125
485
538
520
272
283
100
51
136
63
710
543
825
160
0
200
400
600
800
1,000
A$'M
WCF/CP Bank Debt A$ MTNs US$ GBP CHF HKD JPY EUR NOK
For
per
sona
l use
onl
y

30 Sep 12
Notes
1. Net debt is debt at carrying value.
2. Calculated as net debt at carrying value divided by net debt at carrying value plus equity.
3. Debt at face value less cash divided by Regulated / Contracted Asset Base. Demonstrates how AusNet Services funds its capex in terms of debt vs. income generating assets.
4. Calculated as EBITDA less customer contributions and tax paid, divided by net interest expense. This is how interest cover is measured for internal management purposes, as
it provides an accurate reflection of how after-tax operating cash flows are used to meet interest payments.
Sound fundamentals
20
Financial Metrics 31-Mar-15 31-Mar-14
Total Assets $12.1bn $10.6bn
Total Borrowings $7.2bn $6.1bn
Net Debt 1 $6.3bn $5.7bn
Net Gearing (CV) 2 66% 62%
Net Debt (FV) to Regulated / Contracted Asset Base 3 68% 69%
Interest Cover 4 2.8x 2.5x
Market Metrics @ 31 Mar 15 ASX SGX
Security Price A$1.46 S$1.50
Market Capitalisation A$5.1bn S$5.2bn
For
per
sona
l use
onl
y

Note: All references to ‘$’ are Australian dollars unless otherwise stated.
Introduction & Summary
Financial Performance
Operational Review
Strategy & Outlook
For
per
sona
l use
onl
y
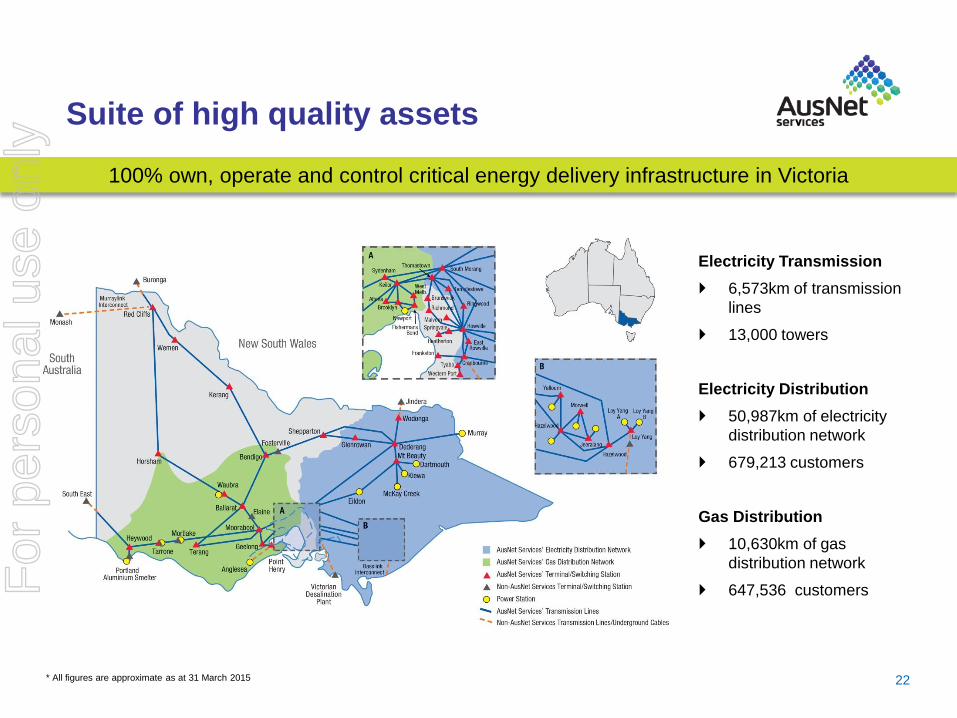
Suite of high quality assets
22
100% own, operate and control critical energy delivery infrastructure in Victoria
* All figures are approximate as at 31 March 2015
Electricity Transmission
6,573km of transmission
lines
13,000 towers
Electricity Distribution
50,987km of electricity
distribution network
679,213 customers
Gas Distribution
10,630km of gas
distribution network
647,536 customers
For
per
sona
l use
onl
y
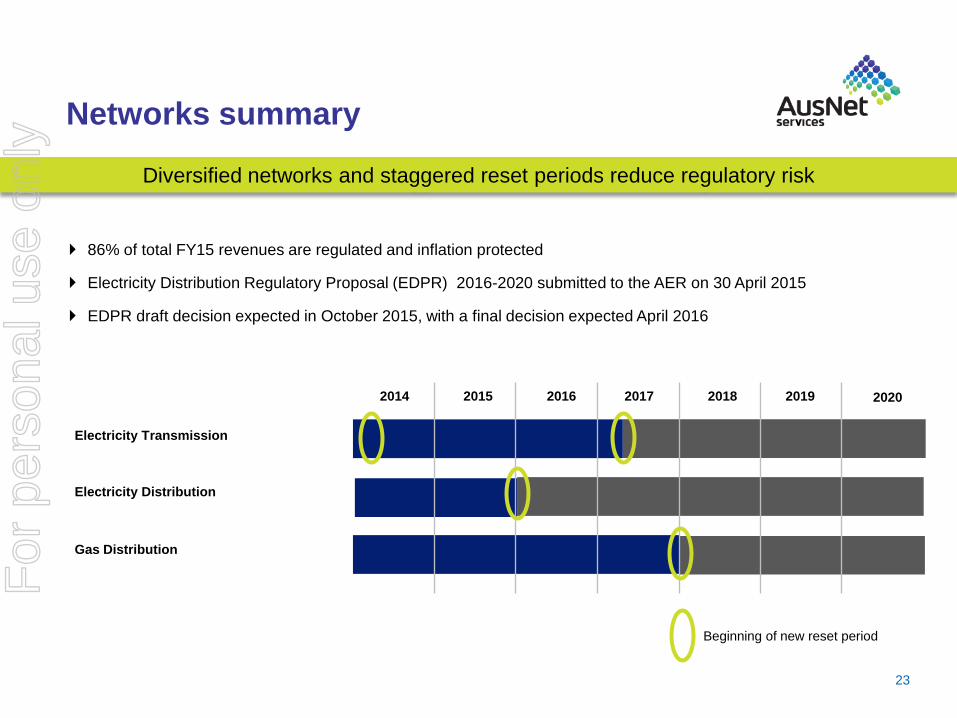
Beginning of new reset period
2020 2014 2015 2016 2017 2018
Gas Distribution
Electricity Distribution
Electricity Transmission
2019
Networks summary
86% of total FY15 revenues are regulated and inflation protected
Electricity Distribution Regulatory Proposal (EDPR) 2016-2020 submitted to the AER on 30 April 2015
EDPR draft decision expected in October 2015, with a final decision expected April 2016
23
Diversified networks and staggered reset periods reduce regulatory risk
For
per
sona
l use
onl
y

Key regulatory reforms and issues
Cost reflective distribution network tariffs
› A tool to facilitate long run efficient use and investment in the network
› Implementation depends on Victorian government policy position, currently under consideration
Establishment of national smart metering framework
› The AEMC proposes transition to a new framework from mid 2017 (introducing the potential for meter churn)
› Distributors are expected to be compensated for the removal of their meter
› There is a high risk of impact on the significant benefits that Victorian customers and distributors derive from AMI
Electricity supply transformation
› New technology, environmental considerations and the high price of delivered energy are driving increased customer involvement and growth in distributed energy resources
› Several policy development projects are examining the implications for the current framework
› The role of networks is evolving in response to these factors. Uneconomic network bypass is a risk and decisions should reflect the value invested in network assets
A longer term vision for the electricity sector is highly desirable
› AusNet Services is engaging with policymakers and other stakeholders on future framework options
24
For
per
sona
l use
onl
y

Electricity transmission network
25
For
per
sona
l use
onl
y

480
233 212
423 437 435
604 628 620
0
100
200
300
400
500
600
700
FY13 FY14 FY15
$A
M
Capex EBITDA Revenue
Electricity transmission network
Lower revenue and EBITDA due to
price path commencing on 1 April 2014
under TRR 2014-17
Recovered $11m from Transmission
Service target performance incentive
scheme (STPIS) (FY14:$8.4m) and
expecting $13m recovery in FY16
AER benchmarking highlights strong
performance, particularly in opex
Continued to develop a pipeline of
unregulated transmission opportunities
26
*
Full Year Highlights (A$M)
31-Mar-15 31-Mar-14 Variance %
Revenue 619.8 628.3 -1.3%
EBITDA 434.5 436.9 -0.6%
EBITDA Margin 70.1% 69.5% 0.6%
For
per
sona
l use
onl
y
Electricity distribution network
27
For
per
sona
l use
onl
y

543 569
497
365
452 454
694
815 880
0
200
400
600
800
1,000
FY13 FY14 FY15
Capex EBITDA Revenue
Electricity distribution network
Higher revenues from regulated
price increases (13.75% in CY14
and 8.4% in CY15), partially offset
by lower Transmission charges
($31m lower TUOS pass through
revenue)
Margins impacted by recognition of
$32.5m AMI rebate and $28.1m AMI
asset write-off
FY15 AMI revenue $134m
(FY14:$107m)
28
Full Year Highlights (A$M)
31-Mar-15 31-Mar-14 Variance %
Revenue 879.6 815.1 7.9%
EBITDA 453.7 451.6 0.5%
EBITDA Margin 51.6% 55.4% -3.8%
Volume (GWh) 7,361 7,483 -1.6%
Connections 679,213 668,603 1.6%
For
per
sona
l use
onl
y

Electricity distribution network
29
AusNet Services has
pioneered the development of
innovative network
management tools including:
• Distribution Feeder
Automation
• Network Management
Automation
• Distribution Outage
Management System
• Grid Energy Storage
Systems
• $40m, two-year HV aerial
bundled cable (HV ABC)
replacement program in
heavily vegetated, high
fire risk areas
FY15 Network Statistics
For
per
sona
l use
onl
y

$0
$10,000
$20,000
$30,000
$40,000
$50,000
$60,000
$70,000
0 20 40 60 80 100 120 140
TO
TE
X p
er
KM
of
Ro
ute
Lin
e
Customer Density (Customers / route line length km)
30
EDPR 2016-20 Objective
Stabilising prices and
network investment are a
priority to ensure distribution
network provides viable
service to customers in the
face of potential alternatives.
Seeking right balance by
continuing to invest
significant network capital to
meet customers’
expectations and improve
community safety.
Seeking to deliver a network
service that is sustainable in
the long term.
Electricity Distribution Price Review (EDPR) 2016-20
Industry
Average
Source Data: AER RIN Submissions
AusNet Services distribution
network outperforms NEM
benchmark
For
per
sona
l use
onl
y

EDPR 2016-20 and recent AER Decisions
Recent AER decisions for NSW/ACT and Draft for Qld/SA
› Revenues cut by 23% to 33% compared to proposals
Low WACC outcomes given low interest rate environment and AER approach
AusNet Services benchmark business for distribution opex.
AusNet Services Proposal not exposed to:
› Depreciation adjustment made to SAPN
› Opex base year adjustments made to NSW business
› Opex step changes rejection
AER rejected bushfire mitigation capex
› Victoria’s circumstances and safety regulations differ
31
For
per
sona
l use
onl
y

Advanced Metering Infrastructure Update
Previously announced instability in AMI systems and $175m to complete the AMI program.
Over 700,000 advanced meters now installed with around 420,000 communicating to market.
› Improved system stability allowed further meter conversions by 31 March 2015.
Priority vendors now engaged following an initial delay in program mobilisation
› Took time to establish robust commercial terms with the right vendors
› Adopted the same Silver Spring Networks mesh technology as other Victorian Distribution Businesses to provide a complementary communications network
› Acquired infrastructure to stabilise end-to-end systems
Wider mesh coverage than originally planned provides higher level of program certainty
› Contributes to forecast increase in costs of $45m
Metering Program technology upgrade to be complete by late 2016
› 95% of meters expected to be communicating to market by March 2017
32
For
per
sona
l use
onl
y
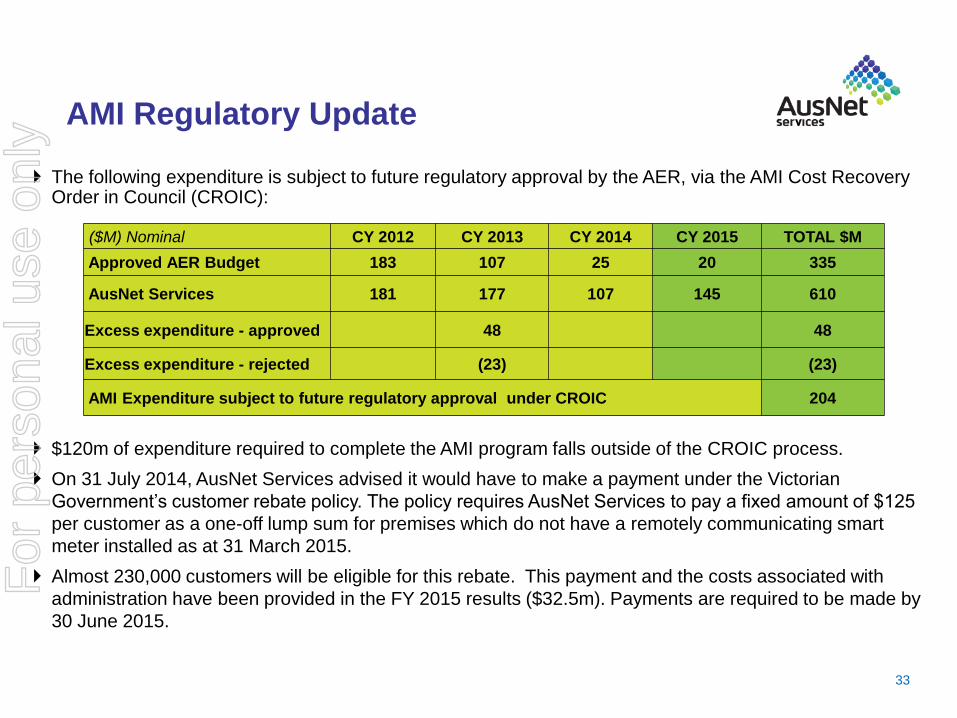
AMI Regulatory Update
The following expenditure is subject to future regulatory approval by the AER, via the AMI Cost Recovery Order in Council (CROIC):
$120m of expenditure required to complete the AMI program falls outside of the CROIC process.
On 31 July 2014, AusNet Services advised it would have to make a payment under the Victorian
Government’s customer rebate policy. The policy requires AusNet Services to pay a fixed amount of $125
per customer as a one-off lump sum for premises which do not have a remotely communicating smart
meter installed as at 31 March 2015.
Almost 230,000 customers will be eligible for this rebate. This payment and the costs associated with
administration have been provided in the FY 2015 results ($32.5m). Payments are required to be made by
30 June 2015.
33
($M) Nominal CY 2012 CY 2013 CY 2014 CY 2015 TOTAL $M
Approved AER Budget 183 107 25 20 335
AusNet Services 181 177 107 145 610
Excess expenditure - approved 48 48
Excess expenditure - rejected (23) (23)
AMI Expenditure subject to future regulatory approval under CROIC 204
For
per
sona
l use
onl
y
Gas distribution network
34
For
per
sona
l use
onl
y
89
112 99
167 168
142
216 220
187
0
50
100
150
200
250
FY13 FY14 FY15
Capex EBITDA Revenue
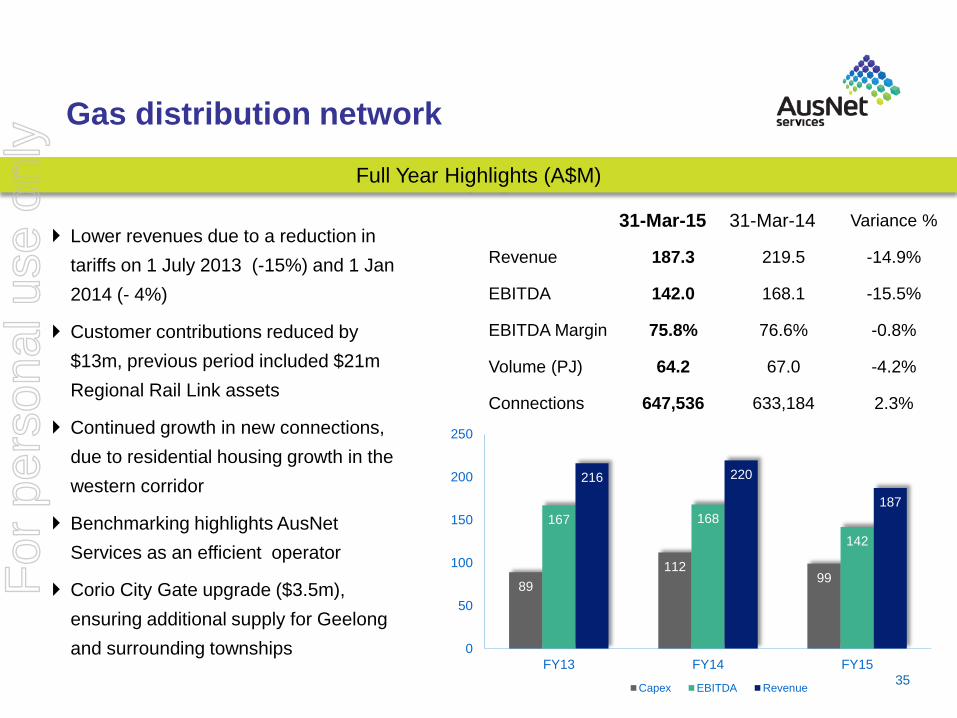
Gas distribution network
Lower revenues due to a reduction in
tariffs on 1 July 2013 (-15%) and 1 Jan
2014 (- 4%)
Customer contributions reduced by
$13m, previous period included $21m
Regional Rail Link assets
Continued growth in new connections,
due to residential housing growth in the
western corridor
Benchmarking highlights AusNet
Services as an efficient operator
Corio City Gate upgrade ($3.5m),
ensuring additional supply for Geelong
and surrounding townships
35
Full Year Highlights (A$M)
31-Mar-15 31-Mar-14 Variance %
Revenue 187.3 219.5 -14.9%
EBITDA 142.0 168.1 -15.5%
EBITDA Margin 75.8% 76.6% -0.8%
Volume (PJ) 64.2 67.0 -4.2%
Connections 647,536 633,184 2.3%
For
per
sona
l use
onl
y
Select Solutions
36
For
per
sona
l use
onl
y
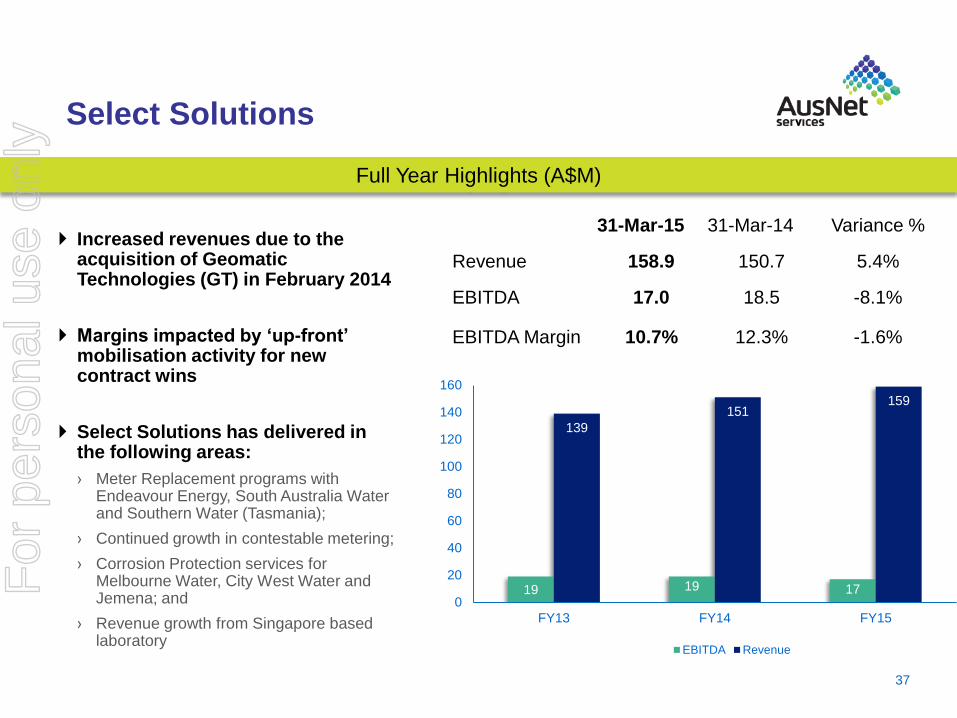
Select Solutions
Increased revenues due to the acquisition of Geomatic Technologies (GT) in February 2014
Margins impacted by ‘up-front’ mobilisation activity for new contract wins
Select Solutions has delivered in the following areas:
› Meter Replacement programs with Endeavour Energy, South Australia Water and Southern Water (Tasmania);
› Continued growth in contestable metering;
› Corrosion Protection services for Melbourne Water, City West Water and Jemena; and
› Revenue growth from Singapore based laboratory
37
Full Year Highlights (A$M)
31-Mar-15 31-Mar-14 Variance %
Revenue 158.9 150.7 5.4%
EBITDA 17.0 18.5 -8.1%
EBITDA Margin 10.7% 12.3% -1.6%
19 19 17
139
151 159
0
20
40
60
80
100
120
140
160
FY13 FY14 FY15
EBITDA Revenue
For
per
sona
l use
onl
y

Select Solutions
38
Secured significant contracts with
‘blue-chip’ customers in essential
infrastructure sectors in Qld, NSW,
Vic, SA and Tasmania.
80%
Received
‘Best Employer’
accreditation
with employee
engagement at
Achieved record
Customer Satisfaction
(85%) and Net Promoter
(52) scores
(source Wallis Market & Social
Research)
13 May 2015
Integration of GT successfully progressed,
enhancing Select’s service offerings to
secure contracts with Endeavour Energy,
Essential Energy, UnityWater and Jemena
For
per
sona
l use
onl
y

Note: All references to ‘$’ are Australian dollars unless otherwise stated.
Introduction & Summary
Financial Performance
Operational Review
Strategy & Outlook
For
per
sona
l use
onl
y
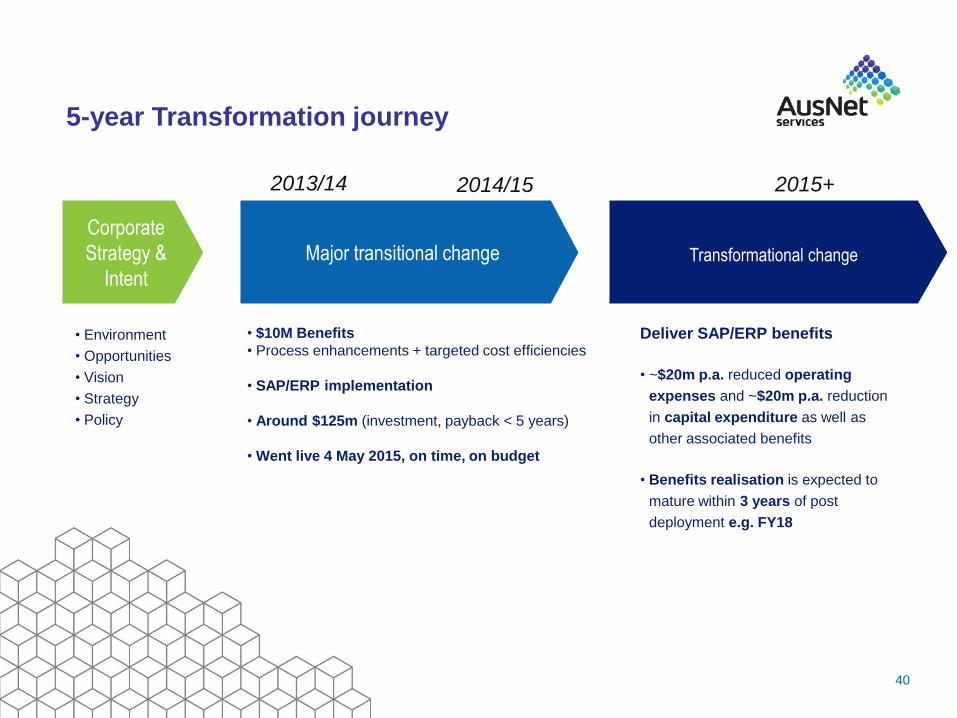
5-year Transformation journey
Transformational change Major transitional change
2013/14 2015+
Corporate
Strategy &
Intent
• Environment
• Opportunities
• Vision
• Strategy
• Policy
• $10M Benefits
• Process enhancements + targeted cost efficiencies
• SAP/ERP implementation
• Around $125m (investment, payback < 5 years)
• Went live 4 May 2015, on time, on budget
2014/15
40
Deliver SAP/ERP benefits
• ~$20m p.a. reduced operating
expenses and ~$20m p.a. reduction
in capital expenditure as well as
other associated benefits
• Benefits realisation is expected to
mature within 3 years of post
deployment e.g. FY18
For
per
sona
l use
onl
y
41
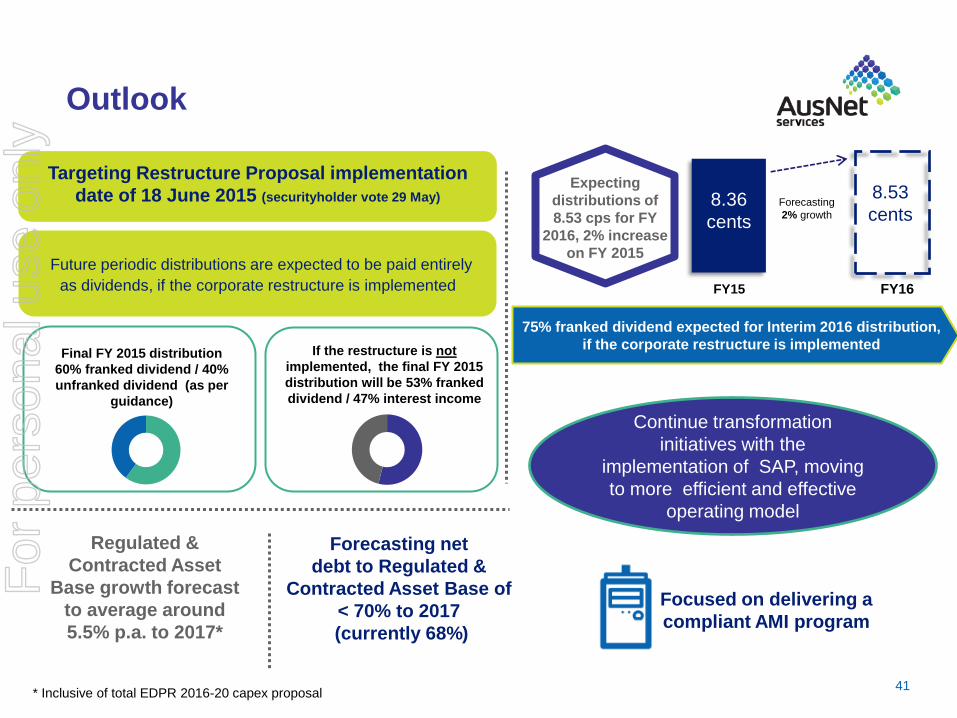
Outlook
Targeting Restructure Proposal implementation
date of 18 June 2015 (securityholder vote 29 May)
FY15
FY16
8.53
cents Forecasting
2% growth
Expecting
distributions of
8.53 cps for FY
2016, 2% increase
on FY 2015
Future periodic distributions are expected to be paid entirely
as dividends, if the corporate restructure is implemented
Focused on delivering a
compliant AMI program
Regulated &
Contracted Asset
Base growth forecast
to average around
5.5% p.a. to 2017*
If the restructure is not
implemented, the final FY 2015
distribution will be 53% franked
dividend / 47% interest income
Final FY 2015 distribution
60% franked dividend / 40%
unfranked dividend (as per
guidance)
Forecasting net
debt to Regulated &
Contracted Asset Base of
< 70% to 2017
(currently 68%)
8.36
cents
* Inclusive of total EDPR 2016-20 capex proposal
75% franked dividend expected for Interim 2016 distribution,
if the corporate restructure is implemented
Continue transformation
initiatives with the
implementation of SAP, moving
to more efficient and effective
operating model
For
per
sona
l use
onl
y

Questions
For
per
sona
l use
onl
y

Appendices
For
per
sona
l use
onl
y
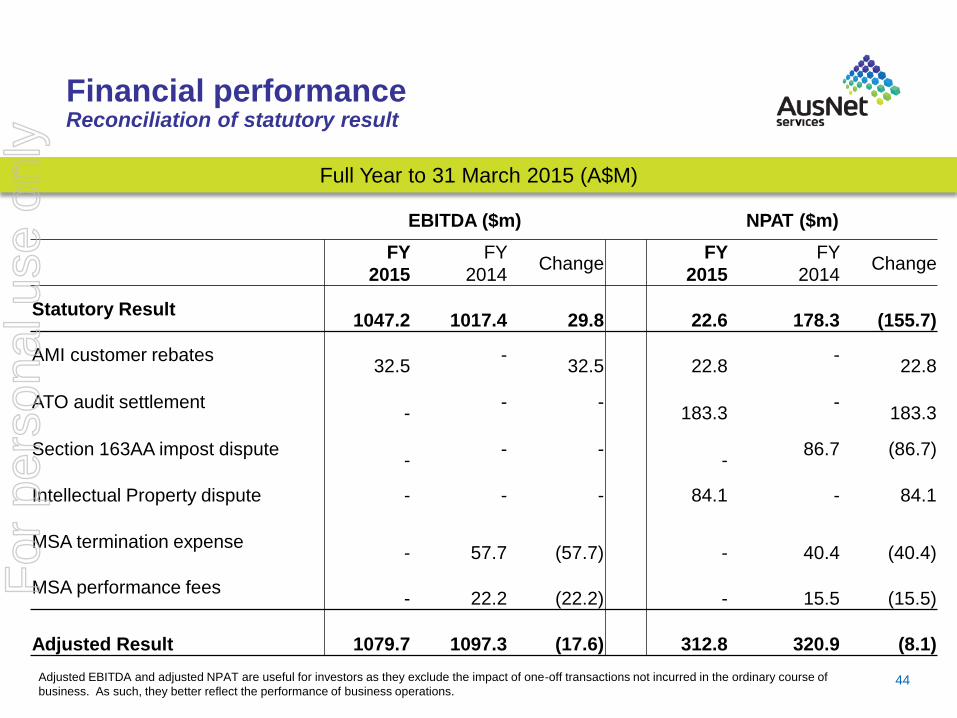
Financial performance Reconciliation of statutory result
44
EBITDA ($m) NPAT ($m)
FY
2015
FY
2014 Change
FY
2015
FY
2014 Change
Statutory Result
1047.2
1017.4
29.8
22.6
178.3
(155.7)
AMI customer rebates
32.5 -
32.5
22.8 -
22.8
ATO audit settlement
- - -
183.3 -
183.3
Section 163AA impost dispute
- - -
- 86.7 (86.7)
Intellectual Property dispute - - - 84.1 - 84.1
MSA termination expense
-
57.7
(57.7)
-
40.4
(40.4)
MSA performance fees
-
22.2
(22.2)
-
15.5
(15.5)
Adjusted Result
1079.7
1097.3
(17.6)
312.8
320.9
(8.1)
Adjusted EBITDA and adjusted NPAT are useful for investors as they exclude the impact of one-off transactions not incurred in the ordinary course of
business. As such, they better reflect the performance of business operations.
Full Year to 31 March 2015 (A$M)
For
per
sona
l use
onl
y

2.8 2.9 2.7 2.9 2.93
2.3 2.6 3.0
3.3 3.60
1.2 1.2
1.3
1.4 1.42 0.61
0.68 0.67
-
1.0
2.0
3.0
4.0
5.0
6.0
7.0
8.0
9.0
10.0
FY11 FY12 FY13 FY14 FY15
Electricity transmission Electricity distribution Gas distribution Contracted Electricity Transmission
45
Regulated & Contracted Asset Base Growth
Opening regulated & contracted asset base $8.19bn
add capex $0.72bn
less regulatory depreciation ($0.4bn)
add indexation $0.11bn
Closing regulated & contracted asset base $8.62bn
Notes: Chart excludes shortfall recovery for AMI 2012-15 budget and charges application, customer contributions and capitalised interest
6.25 6.64
7.56
8.19
8.62
$Bn
~8% historical CAGR
For
per
sona
l use
onl
y

Regulatory period
Current Period
2011-15
AusNet Services
2016-2020 Proposal
Beta 0.8 0.89
Risk Free Rate 5.14% 2.64%
Debt Risk Premium 4.22% 2.75%
Gamma 0.25 0.25
Market Risk Premium 6.50% 8.17%
Nominal Vanilla WACC 9.75% 7.19%
Return on Equity 10.34% 9.90%
Net Capex (Nominal) $1,579m $1,867m
Opex (Nominal) $928m $1,356m
Revenue (Nominal) $2,533m $3,566m
All figures updated for relevant appeals
EDPR 2016-2020
46
For
per
sona
l use
onl
y

Regulatory period
Gas Distribution
2013-17
Electricity Distribution
2011-15
Electricity Transmission
2014-17
Beta 0.8 0.8 0.8
Risk Free Rate 3.14% 5.14% 4.31%
Debt Risk Premium 3.35% 4.22% 2.48%
Gamma 0.25 0.25 0.65
Market Risk Premium 6.00% 6.50% 6.50%
Nominal Vanilla WACC 7.07% 9.75% 7.87%
Return on Equity 7.94% 10.34% 9.51%
Net Capex (Nominal) $512m $1579m $552m
Opex (Nominal) $277m $928m $591m
Revenue (Nominal) $952m $2533m $1600m
All figures updated for relevant appeals
Current regulatory determinations
47
For
per
sona
l use
onl
y

Tax Audit Resolution of ATO intra-group financing review (Division 974 audit and related reviews)
AusNet Services and the Australian Taxation Office (“ATO”) signed a binding agreement to
settle all matters concerning the Division 974 audit and related reviews. Key details of the
agreement include:
› Resolution provides tax certainty, with the ATO ceasing all audit activity for years up to and including
31 March 2014;
› AusNet Services made a primary tax payment of $23.5m and an interest payment of $1.5m,
following execution of a binding settlement deed in March 2015;
› AusNet Services cancelled carry forward tax losses, amounting to $475m (in respect of the 2008-14
financial years) and $31.5m in respect of the 2005 financial year, following execution of a binding
settlement deed;
› Post loss cancellation, AusNet Services has $765m of carry forward tax losses, as at 31 March
2015;
› AusNet Services ceased taking interest deductions in respect of AusNet Services Finance Trust
loans from 1 April 2014;
48
For
per
sona
l use
onl
y

Tax Litigation
Intellectual Property
› Relates to deductions for intellectual property (copyright), claimed in 1998-2011 tax years. The disputed items amount to
$93.5m as at 31 March 2015, as illustrated below:
› Of the total $93.5m exposure, $17.1m was paid to the ATO in October 2011 as part of a ‘50/50’ payment arrangement and
$40.1m represents deductions that have not yet been claimed and carried as a deferred tax asset, leaving a net cash tax
exposure of $26.9m, net of deductible interest.
› In Mar 14, the Federal Court found in favour of AusNet Services. The ATO appealed the decision, which was heard in the
Full Court of the Federal Court of Australia in Dec 14.
› In May 15, The Full Court of the federal Court allowed the ATO appeal in respect of the pre tax consolidation years, other
than for the $2.3m penalty imposed, which was not overturned.
› In relation to the post tax consolidation years, the Full Court ordered that the matter be remitted back to the primary judge of
the Federal Court for further hearing and determination.
› AusNet Services is seeking legal advice regarding the Full Court’s decision and will decide whether to seek special leave to
appeal to the High Court of Australia, in relation to the pre tax consolidation years. AusNet Services has 28 days to file any
such application.
49 * Deductible interest component and penalty remission results in an after tax exposure of $84.1m. Although the dispute relates to intellectual
property deductions claimed over the 1998 to 2011 tax years, separate proceedings were required for tax years falling pre and post tax
consolidation of AusNet Services (Transmission) Ltd, which occurred on 19 October 2005.
Pre-
consolidation
Years
Post-
consolidation
Years
Total
Primary Tax 18.7 8.7 27.4
Interest 21.4 2.3 23.7
Future Deductions 40.1 40.1
Penalties 2.3 Nil 2.3
Gross exposure 42.4 51.1 93.5*
For
per
sona
l use
onl
y

Tax Litigation
Section 163AA impost
› Relates to deductions for licence fees imposed under Section 163AA of the Electricity Industry Act 1993, claimed
in the 1999 to 2001 tax years
› Federal Court proceedings initiated by AusNet Services in Oct 12, appealing ATO assessments of $86.7m (being
$54m of primary tax, plus interest of $32.7m).
› Accumulated exposure ($105.2m) less deduction for interest charges ($15.4m) less part-payment made to ATO
($30.6m) equals net additional cash exposure of $59.2m
› Federal Court trial in Jul 13, with judgment against AusNet Services handed down in Sep 13. Appeal against
judgment lodged in Oct 13
› In Apr 14, the Full Court of the Federal Court of Australia found against AusNet Services by a split decision of 2:1
› An appeal to the High Court of Australia was heard on 9 April 15. A judgment is not expected prior to 30 June
2015.
50
For
per
sona
l use
onl
y

Bushfire litigation
51
• AusNet Services was a defendant in litigation brought in connection with the 7 February 2009 bushfires located at
Beechworth, Kilmore East, and Murrindindi, respectively. The Beechworth class action was settled in March 2012.
• On 22 December 2014, the Supreme Court of Victoria formally approved the settlement deed for the Kilmore East
bushfire class action. Under the terms of the settlement, the parties involved in the litigation have paid approximately
$494.7 million with AusNet Services contributing $378.6 million which was paid in full by AusNet Services’ liability
insurers.
• On 6 February 2015, AusNet Services announced that the parties to the Murrindindi bushfire class action had agreed
to settle the action. The settlement agreement is subject to the approval of the Supreme Court of Victoria. Under the
terms of the settlement, the parties involved in the litigation have agreed to pay $300 million with AusNet Services
contributing $260.9 million which will be paid in full by AusNet Services’ liability insurers. This amount has been
recognised in the financial statements for the year ended 31 March 2015 as both a liability and a corresponding asset
to be received from insurers.
• In all three matters settlement was reached without admission of liability by AusNet Services or any other party.
For
per
sona
l use
onl
y

Metering Program
52
Integration
Stability
Comms
Scalability
Metering Business
established with
process reviews
underway
Infrastructure acquired to
enable improvement in
end to end system
stability
Ongoing system
improvements have
enabled further logical
conversions of existing
meters
Mesh solution chosen
for complementary
comms based on similar
system to other Victorian
Distributers
For
per
sona
l use
onl
y
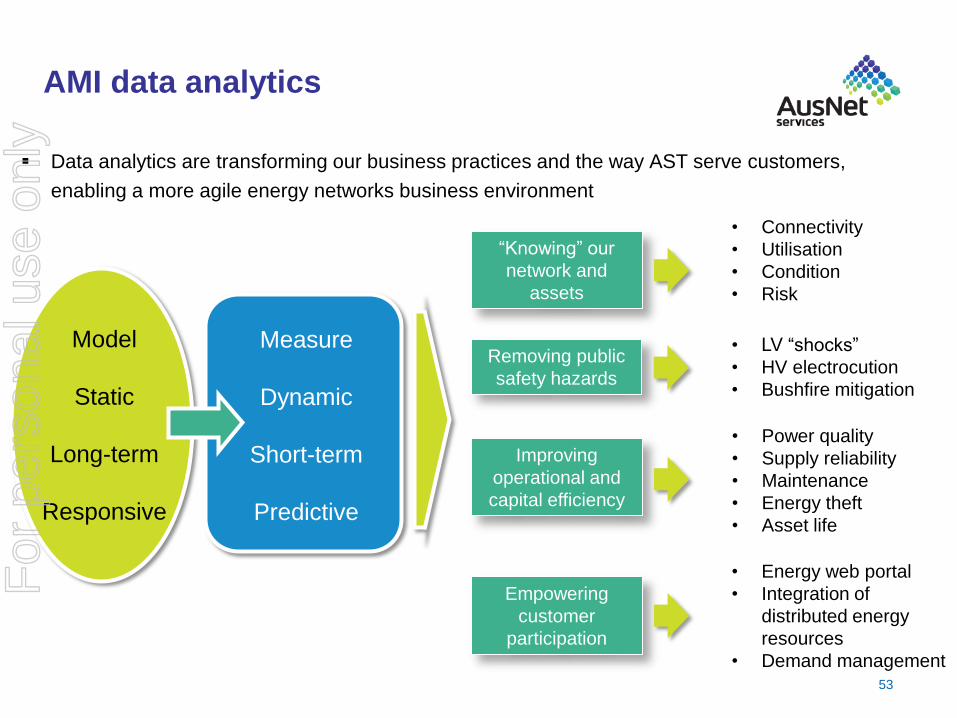
AMI data analytics
53
Model
Static
Long-term
Responsive
Measure
Dynamic
Short-term
Predictive
Empowering
customer
participation
Removing public
safety hazards
“Knowing” our
network and
assets
Data analytics are transforming our business practices and the way AST serve customers,
enabling a more agile energy networks business environment
Improving
operational and
capital efficiency
• Connectivity
• Utilisation
• Condition
• Risk
• LV “shocks”
• HV electrocution
• Bushfire mitigation
• Power quality
• Supply reliability
• Maintenance
• Energy theft
• Asset life
• Energy web portal
• Integration of
distributed energy
resources
• Demand management
For
per
sona
l use
onl
y

54
Strategy
Our Purpose
Corporate Objectives
• High performing leadership,
capability & culture
• Sustainable earnings and growth in
security holder value
• Expansive and accretive growth
• An efficient business model
• Develop and promote advanced
regulatory framework
• Safe, resilient and reliable networks
• A highly developed customer
service capability
• Industry leader in safety
performance
For
per
sona
l use
onl
y

Restructure & simplification proposal timeline
55
Events Indicative Time
Date of the First Court Hearing at which the Court ordered the convening of the Scheme Meetings Tuesday, 21 April 2015
For CDP Account Holders: latest time and date by which the orange CDP Voting Instruction Form must be
received by CDP
5.00pm (Singapore time) on
Wednesday, 20 May
2015
Last day for requests to transfer AusNet Services Stapled Securities between ASX and SGX-ST, to be received
by the Registry or CDP (as relevant)
Monday, 25 May 2015
Latest time and date by which the blue Scheme Meetings Proxy Form and the green General Meetings Proxy
Form must be received by the Registry
10.00am on Wednesday, 27
May 2015
Time and date for determining eligibility to vote at the Meetings 7.00pm on Wednesday, 27
May 2015
Scheme Meetings to be held at Meeting Room 220, Melbourne Convention & Exhibition Centre, 2 Clarendon
Street, South Wharf
From 9.30am on Friday, 29
May 2015
General Meetings to be held at Meeting Room 220, Melbourne Convention & Exhibition Centre, 2 Clarendon
Street, South Wharf
10.00am (or as soon
thereafter as the Scheme
Meetings have
concluded or been adjourned)
on Friday, 29 May 2015
For
per
sona
l use
onl
y

Restructure & simplification proposal timeline
56
Events Indicative Time
Inquiry hearing before the Court Monday, 1 June 2015
Date of the Second Court Hearing for approval of the Schemes and grant of judicial advice Thursday, 4 June 2015
Effective Date
Last day of trading in AusNet Services Stapled Securities on ASX and SGX-ST
Friday, 5 June 2015
NewCo Shares commence trading on a deferred settlement basis on ASX and “when issued basis” on
SGX-ST
Tuesday, 9 June 2015
Record Date
All Securityholders on the Register at this time will be entitled to Participate in the Proposal unless they
are Ineligible Foreign Securityholders
CDP Account Holders’ eligibility to Participate in the Proposal through CDP will be assessed based on the
CDP Register at the same time
7.00pm (Melbourne time)
5.00pm (Singapore time) on
Thursday, 11 June 2015
Implementation Date
Eligible Securityholders receive NewCo Shares
Thursday, 18 June 2015
Despatch of holding statements for NewCo Shares to Securityholders and notification letters to CDP
Account Holders
NewCo Shares commence trading on a normal T+3 settlement basis on ASX and SGX-ST
Friday, 19 June 2015
Settlement of on-market trades conducted on a deferred settlement basis on ASX and on a “when issued
basis” on SGX-ST and first settlement of trades conducted on a normal T+3 settlement basis on ASX and
SGX-ST
Wednesday, 24 June 2015
For
per
sona
l use
onl
y
AusNet
Services AusNet
Services
(Finance)
Trust
AusNet Services
(Distribution) Ltd
AusNet Services
(Transmission)
Ltd
100% 100% 100%
Singapore Power International
Pte Ltd
31.1%
Public investors
49%
State Grid International
Development
Limited 19.9%
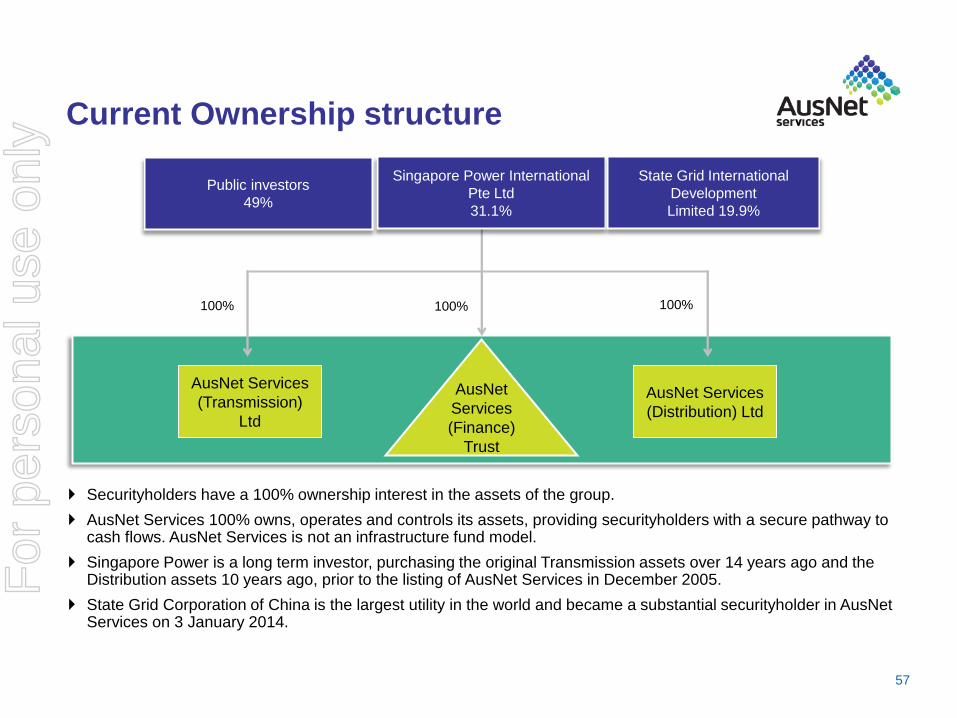
Current Ownership structure
Securityholders have a 100% ownership interest in the assets of the group.
AusNet Services 100% owns, operates and controls its assets, providing securityholders with a secure pathway to cash flows. AusNet Services is not an infrastructure fund model.
Singapore Power is a long term investor, purchasing the original Transmission assets over 14 years ago and the Distribution assets 10 years ago, prior to the listing of AusNet Services in December 2005.
State Grid Corporation of China is the largest utility in the world and became a substantial securityholder in AusNet Services on 3 January 2014.
57
For
per
sona
l use
onl
y

58
Jul 2004
Singapore Power
acquired TXU
Australia:
Electricity & Gas
distribution
businesses and
Merchant Energy
Business (MEB)
Jun 2000
SPI Powernet
acquired the
electricity
transmission
business in
Australia from
GPU Electric
Dec 2005
IPO of SP
AusNet
Feb 1999
TXU Corporation
acquired the gas
distribution and
retail businesses,
Westar and Kinetic
Energy, from the
Victorian
Government
Nov 1997
US based GPU
Electric, Inc.
acquired Victorian
electricity
transmission
business from the
Victorian
Government
Dec 1995
US based TXU
Corporation
purchased the
electricity
distribution and
retail business,
Eastern Energy,
from the Victorian
Government
Jun 2005
Launch of
SP AusNet
brand
April 2009
Establishment of
Select Solutions
division within the
SP AusNet Group
Feb 2014
SP AusNet
purchases
Geomatic
Technologies
The Evolution of AusNet Services
March 2005
Divestment of
retail assets to
China Light &
Power
May-Aug 2005
Singapore Power
merged the TXU
electricity and gas
distribution with
the electricity
transmission
business
May 2013
SGID enters agreement
with SP to acquire
19.9% of SP AusNet
Jan 2014
SGID acquires
19.9% of SP AusNet
August 2014
The new AusNet
Services brand is
officially launched
For
per
sona
l use
onl
y

For further information contact:
Manager, Investor Relations
Media Relations
Jonathon Geddes
External Relations Manager
+61 3 9695 6401 or +61 410 573 278
AusNet Services
AusNet Services (Distribution) Ltd
ABN 37 108 788 245
AusNet Services (Transmission) Ltd
ABN 48 116 124 362
AusNet Services Finance Trust
ARSN 116 783 914
AusNet Services
ABN 46 109 977 371
AFS Licence No. 294117 as responsible entity
for AusNet Services Finance Trust
Level 31
2 Southbank Boulevard Southbank
Victoria 3006 Australia
Locked Bag 14051
Melbourne City Mail Centre
Victoria 8001 Australia
Tel: +61 3 9695 6000
Fax: +61 3 9695 6666
John Nicolopoulos
+61 3 9695 6301 or +61 409 672 912
Investor Relations
Further Information and Contacts
AusNet Services is the largest diversified energy network business in Victoria, owning and operating around $12 billion of electricity and gas distribution assets, including the state-wide electricity transmission network. The company also has a non-regulated division, Select Solutions, providing utility services.
Headquartered in Melbourne, Australia, AusNet Services employs more than 2,600 people to service over 1.3 million consumers and is listed on the Australian Securities Exchange (ASX: AST) and the Singapore Stock Exchange (SGX-ST: X04).
For more information visit www.ausnetservices.com.au
59
For
per
sona
l use
onl
y