AURAMINE ‘O’ DYE ADSORPTION ONTO GANGA … ‘O’ DYE ADSORPTION ONTO GANGA IMLI...
23
________________________________________ * Author for correspondence; E-mail: [email protected], [email protected], [email protected]; Mo.: 91 8821001865, 91 9617776363, 91 9861285425; Fax: 0771-2253104 Int. J. Chem. Sci.: 14(4), 2016, 2116-2138 ISSN 0972-768X www.sadgurupublications.com AURAMINE ‘O’ DYE ADSORPTION ONTO GANGA IMLI (PITHECELLOBIUM DULCE) WOOD BIOCHAR: PROCESS OPTIMIZATION USING RSM V. K. SINGH a,* , A. B. SONI a and R. K. SINGH b a Department of Chemical Engineering, National Institute of Technology, RAIPUR – 492010 (Chhattisgarh) INDIA b Department of Chemical Engineering, National Institute of Technology, ROURKELA – 769008 (Orissa) INDIA ABSTRACT Biochar produced from the pyrolysis of Ganga Imli (Pithecellobium dulce) wood particles was used as an adsorbent for the removal of Auramine ‘O’ dye from the aqueous solutions by varying the different physicochemical parameters such as initial dye concentration, contact time, pH, temperature and adsorbent dose. The biochar was characterized using scanning electron microscopy, Fourier transform infrared spectroscopy and X-ray diffraction. Pseudo-second-order kinetic model was the most suitable for describing Auramine ‘O’ adsorption on the biochar in comparison with the pseudo first-order model. Auramine ‘O’ adsorption on the biochar followed well the Temkin isotherm model. The maximum adsorption capacity was found to be 90.91 mg/g at 30°C temperature. The values for thermodynamic parameters indicate that the adsorption was endothermic showing monolayer adsorption of dye. Five different non-linear error functions were used to analyze the equilibrium data for evaluating the best fit of the isotherm equations. The concentration, pH, adsorbent dose and temperature were optimized using response surface methodology to maximize the adsorbate removal. The rate of Auramine ‘O’ dye adsorption was mathematically described as a function of experimental parameters and was modeled through Box-Behnken design. Key words: Ganga Imli wood, Auramine ‘O’, Adsorption, Langmuir isotherm, Pseudo-second-order kinetic model, Response surface methodology. INTRODUCTION Dyes are mostly used in industries like textile industries, paper and pulp industries, dye and dye intermediates industries, pharmaceutical industries, tannery, and kraft bleaching
Transcript of AURAMINE ‘O’ DYE ADSORPTION ONTO GANGA … ‘O’ DYE ADSORPTION ONTO GANGA IMLI...

________________________________________
*Author for correspondence; E-mail: [email protected], [email protected], [email protected]; Mo.: 91 8821001865, 91 9617776363, 91 9861285425; Fax: 0771-2253104
Int. J. Chem. Sci.: 14(4), 2016, 2116-2138 ISSN 0972-768X
www.sadgurupublications.com
AURAMINE ‘O’ DYE ADSORPTION ONTO GANGA IMLI (PITHECELLOBIUM DULCE) WOOD BIOCHAR: PROCESS
OPTIMIZATION USING RSM
V. K. SINGHa,*, A. B. SONIa and R. K. SINGHb
aDepartment of Chemical Engineering, National Institute of Technology, RAIPUR – 492010 (Chhattisgarh) INDIA
bDepartment of Chemical Engineering, National Institute of Technology, ROURKELA – 769008 (Orissa) INDIA
ABSTRACT
Biochar produced from the pyrolysis of Ganga Imli (Pithecellobium dulce) wood particles was used as an adsorbent for the removal of Auramine ‘O’ dye from the aqueous solutions by varying the different physicochemical parameters such as initial dye concentration, contact time, pH, temperature and adsorbent dose. The biochar was characterized using scanning electron microscopy, Fourier transform infrared spectroscopy and X-ray diffraction. Pseudo-second-order kinetic model was the most suitable for describing Auramine ‘O’ adsorption on the biochar in comparison with the pseudo first-order model. Auramine ‘O’ adsorption on the biochar followed well the Temkin isotherm model. The maximum adsorption capacity was found to be 90.91 mg/g at 30°C temperature. The values for thermodynamic parameters indicate that the adsorption was endothermic showing monolayer adsorption of dye. Five different non-linear error functions were used to analyze the equilibrium data for evaluating the best fit of the isotherm equations. The concentration, pH, adsorbent dose and temperature were optimized using response surface methodology to maximize the adsorbate removal. The rate of Auramine ‘O’ dye adsorption was mathematically described as a function of experimental parameters and was modeled through Box-Behnken design.
Key words: Ganga Imli wood, Auramine ‘O’, Adsorption, Langmuir isotherm, Pseudo-second-order kinetic model, Response surface methodology.
INTRODUCTION
Dyes are mostly used in industries like textile industries, paper and pulp industries, dye and dye intermediates industries, pharmaceutical industries, tannery, and kraft bleaching
Int. J. Chem. Sci.: 14(4), 2016 2117
industries to impart colour to the final products. The discharge of effluents from these industries into the water resources is undesirable, because many of the dyes released and their breakdown products are toxic, carcinogenic or mutagenic in nature1. The dyes can hamper the life-cycle of aquatic animals and plants by inhibiting the sunlight penetration into the water stream2. Auramine-O (C17H22ClN3), bis [4-(dimethylamino) phenyl] methaniminium chloride, is a dye used traditionally for dyeing leather, silk, linen, cotton, bamboo and paper. The dyes bearing wastewaters have high chemical oxygen demand (COD) to biochemical oxygen demand (BOD) ratio and offer considerable resistance to biodegradation due to thermo- and photo-stability of the dyes3.
The dyes are highly stable molecules and show resistance against degradation by almost all the methods including chemical and biological4. Due to this, the waste water generated from the processes like washing and bleaching of natural fibres and dyeing and finishing steps, are chemically complex and diverse in nature and are difficult to be treated by conventional methods of oxidation or biodegradation. Still the procedures like coagulation and flocculation, nano-filtration, electro-dialysis and reverse osmosis can be applied but most of these processes are not used on large scale because of being expensive and inefficient. Adsorption is given preference over these processes and is widely used because of low cost and high performance5.
Activated carbon is the most commonly used as adsorbent. It has small and low-volume pores that increase the surface area available for adsorption. However, due to its high cost, adsorption using cheaper materials is preferable. Agricultural products and wastes like ginger waste6, coconut husk7, bamboo waste8, sugarcane bagasse9, rice husk10, apricot11, Sugarcane bagasse pith12, jute processing waste13, mustard de-oiled seed cake14, orange peel15, saw dust16 etc. are the low cost materials, which can be utilised to produce biochar (adsorbent) for the adsorption process. One of the processes for manufacturing biochar from these materials is pyrolysis.
Pyrolysis is the process of heating of the biomass in the absence of air/oxygen at high temperature of 500-1100oC to produce the products like bio oil and biochar. The bio-oil consists of two phases-continuous and discontinuous. The continuous phase is an aqueous solution of the products of cellulose and hemicelluloses decomposition, and small molecules from lignin decomposition. The discontinuous phase is largely composed of pyrolytic lignin macro molecules. The bio oil can be used as fuel for transportation purpose. The remaining solid residue is known as biochar having higher calorific value of about 32 MJ/Kg17 than the bio mass and bio oil, easy to transport, store and distribute and more efficient in burning and has a characteristic feature of creating less pollution. Primarily, it is carbon (~85%), but can

V. K. Singh et al.: Auramine ‘O’ Dye Adsorption onto…. 2118
also contain some oxygen and hydrogen. The char can be used as an adsorbent in waste water treatment.
The biomass source for the present study was wood, obtained from the Ganga imli (Pithecellobium dulce) tree. The other commonly known names of Gangaimli are Jungle Jalebi, Madras Thorn, Manila Tamrind, and Vilayati Ambli etc. It is native to Mexico, Central America, and Northern South America and being drought resistant it can survive in dry lands. The short spines and irregular crooked growth make it less attractive for wood uses. Mostly it is used as solid fuel, therefore to maximize its utility it was preferred biomass for production of biochar.
This study aims to (i) investigate the effect of different variables like pH, initial dye concentration, adsorbent dosage, contact time and temperature on the adsorption of Auramine ‘O’ onto bio-char derived from Ganga imli wood (ii) utilize response surface methodology (RSM) using Box-Behnken design (BBD) for the optimization of process parameters. RSM is a collection of mathematical and statistical techniques useful for analyzing the effects of several parameters on response based on the fit of polynomial equation to the experimental data18, and also one of the multivariate techniques. The major steps involved in the RSM process are performing statistically designed experiments, estimating the coefficients in a mathematical model and predicting the response and checking the adequacy of the model19.
EXPERIMENTAL
Materials and methods
Ganga Imli wood and Auramine ‘O’ (AR-grade) were purchased from local market.
Preparation of adsorbent
Ganga imli wood was first washed with water to remove sand and silt and then sun dried for seven days. It was broken into small pieces, dried in air oven at 50°C for 24 h and further crushed and sieved into 532 micron size particles. These particles were subjected to pyrolysis for 1 hr wherein the temperature was raised to 600oC at a rate of 20oC/min. The resultant solid product, biochar (GIWBC) was stored in an air tight container for further use as adsorbent.
Preparation of dye stock solution
A dye stock solution of 1000 ppm was prepared and diluted to get the solutions of

Int. J. Chem. Sci.: 14(4), 2016 2119
required concentrations. A calibration curve was plotted by analysing the different concentrated solutions of Auramine ‘O’ dye using UV-visible spectrophotometer at 431 nm.
Characterisation of biochar
The characterization of the biochar produced was done by using scanning electron micrographs (SEM), Fourier transform infrared spectrum (FTIR) and X-ray powder diffraction (XRD) analysis. The SEM images of GIWBC were taken by ZEISS EVO Series Scanning Electron Microscope (Model EVO 18 instrument) in vacuum environment. For FTIR analysis, pellets were obtained from the mixture of KBr and biochar. The pellet thus obtained was analysed between frequency ranges of 500 to 4000 cm-1 by averaging 16 scans for each spectrum. XRD data were collected on a PANalytical 3 KW X’pert Powder diffractometer using Cu Kαl radiation.
Batch adsorption experiment
The adsorption experiments were performed in 100 mL conical flasks. A quantity of 50 ml dye solution of varying initial concentrations (25-100 mg/L) was taken for each experiment. Accurately weighed GIWBC was added to dye solutions and kept in an orbital shaker (30 ± 1oC) for 3 h to reach equilibrium of the solid-solution mixture. pH of the solution was measured by using a pH meter (Eutech Scientific Instruments) and adjusted using 0.1 N HCL or 0.1 N NaOH. The samples were filtered prior to analysis in order to minimize interference of the carbon fines with the solution and the filtrate was analyzed using UV/VIS spectrometer at 431 nm. Each experiment was conducted under identical set of conditions. The percentage removal of the dye and the adsorption capacity of GIWBC were calculated using the following formulas,
Percentage removal = 100CCC
i
fi ×− …(1)
Adsorption capacity, Qe = m
)VC(C fi − …(2)
Where Ci and Cf are the initial and final concentrations (mg/l) of dye, respectively, m is the mass (g) of adsorbent, V is the volume of dye solution (L) and Qe is adsorption capacity (mg/g)
The parameters under study were pH, initial dye concentration, temperature and adsorbent dose.

V. K. Singh et al.: Auramine ‘O’ Dye Adsorption onto…. 2120
Design of experiments
RSM using BBD is utilized for the optimization of process parameters. The parameters considered for optimization are pH (A), concentration of adsorbate (B), adsorbent dose (C) and temperature (D) while the response variable is percent removal (Y) of adsorbate. The BBD recommends 27 experiments for a four factor design. The upper, centre and lower level values of the parameters are pH - (3, 6.5, 10), concentration- (25, 62.5, 100 mg/L), adsorbent dose – (1,3,5 g/L) and temperature – (30, 40, 50oC), respectively. The experimental conditions with their results are shown in Table 1.
Table 1: Experimental data
Run Factor
Y (% R) A B C D
1 2 3 4 5 6 7 8 9 10 11 12 13 14 15 16 17 18 19
3 10 3
10 3
10 3
10 3
10 3
10 3
10 3
10 3
10 6.5
25 25
100 100 25 25
100 100 25 25
100 100 25 25
100 100 62.5 62.5 25
1 1 1 1 5 5 5 5 1 1 1 1 5 5 5 5 3 3 3
30 30 30 30 30 30 30 30 50 50 50 50 50 50 50 50 40 40 40
38 69 32 53 46 87 41 67 40 72 34 55 48 90
42.5 69 44 71 67
Cont…

Int. J. Chem. Sci.: 14(4), 2016 2121
Run Factor
Y (% R) A B C D
20 21 22 23 24 25 26 27 28 29 30
6.5 6.5 6.5 6.5 6.5 6.5 6.5 6.5 6.5 6.5 6.5
100 62.5 62.5 62.5 62.5 62.5 62.5 62.5 62.5 62.5 62.5
3 1 5 3 3 3 3 3 3 3 3
40 40 40 30 50 40 40 40 40 40 40
53 74 82 73 75
73.2 72.8 73.4 72.9 73.9 73.6
An empirical second degree polynomial equation which correlates the response to the process variables, as represented below, was utilized.
1
20
1 1 1 1
n n n n
i i ij i j ii ii i j i i
Y X X X Xβ β β β−
= = = + =
= + + +∑ ∑ ∑ ∑ …(3)
Where Y is the predicted response, β0 is a constant, βi is the linear coefficient, βij is the interaction coefficients, βii is the quadratic coefficients, and Xi and Xj are the coded values of the process variables. The results of experiments were analyzed using statistical computing software Design expert utilizing the model equation and the analysis of variance (ANOVA).
RESULTS AND DISCUSSION
Characterisation of adsorbent
Scanning electron microscopy (SEM)
SEM images of GIWBC at two different magnifications i.e. 1.0 K X and 1.5 K X, respectively are shown in Fig. 1. The porous and heterogeneous structure seen in the images was responsible for high percentage of dye removal.

V. K. Singh et al.: Auramine ‘O’ Dye Adsorption onto…. 2122
(a)
(b)
Fig. 1: SEM image of GIWBC at (a) 1.0 K X magnification, (b) 1.5 K X magnification
FTIR and X-ray diffraction analysis
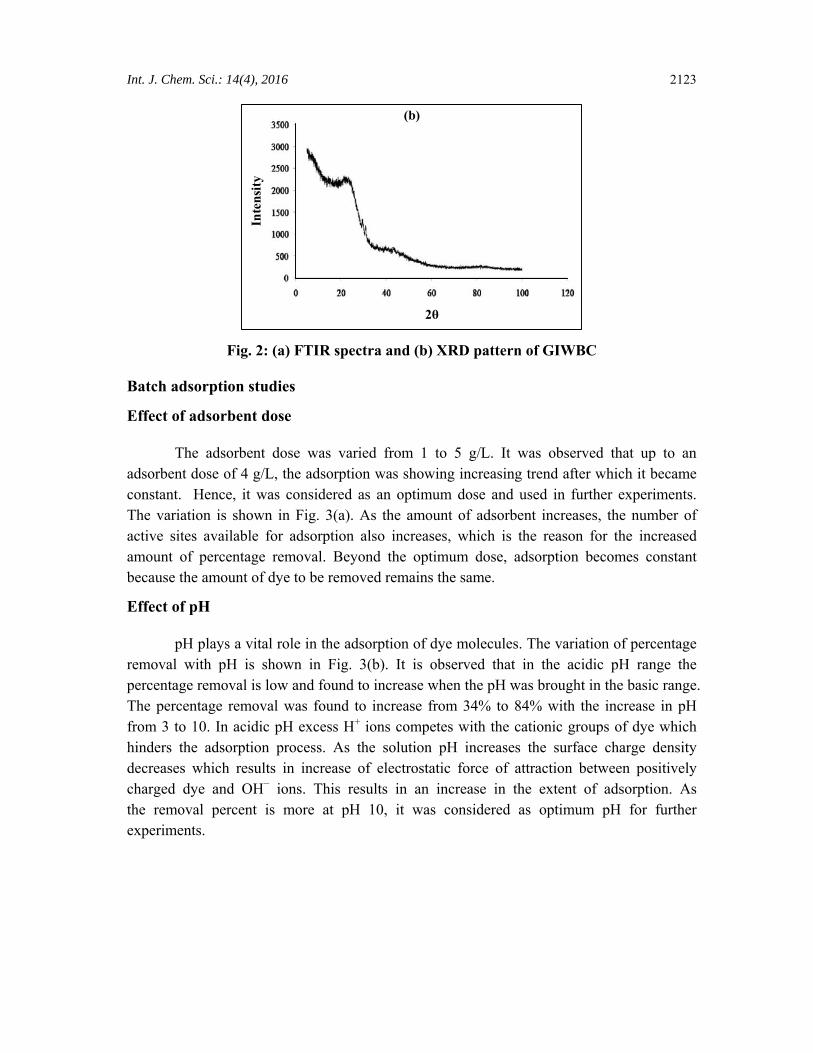
Fig. 2(a) displays the FTIR spectra obtained for the prepared biochar. Each peak in the spectrum corresponds to different bond of different functional groups. Peak between 3640 and 3610 cm-1 indicates the presence of O-H stretch bonds of alcohols and phenols. Presence of C=O stretch bond of aldehydes and saturated aliphatic functional groups is represented by peaks between 1740 and 1720 cm-1. Peaks between 1690 and 1630 cm-1 indicate the C=O stretch bond of esters. Peaks between 690 and 515 cm-1 indicates C–Br stretch bonds of alkyl halides. Fig. 2(b) shows the X-ray diffraction pattern of GIWBC and the broad nature of the curve shows the amorphous nature of the adsorbent.
Wavenumber (cm )-1
Tran
smitt
ance
(%)
120
110
100
90
80
70
3500 3000 2500 2000 1500 1000 500
(a)
Cont…
Int. J. Chem. Sci.: 14(4), 2016 2123
2θ
Inte
nsity
(b)
Fig. 2: (a) FTIR spectra and (b) XRD pattern of GIWBC
Batch adsorption studies
Effect of adsorbent dose
The adsorbent dose was varied from 1 to 5 g/L. It was observed that up to an adsorbent dose of 4 g/L, the adsorption was showing increasing trend after which it became constant. Hence, it was considered as an optimum dose and used in further experiments. The variation is shown in Fig. 3(a). As the amount of adsorbent increases, the number of active sites available for adsorption also increases, which is the reason for the increased amount of percentage removal. Beyond the optimum dose, adsorption becomes constant because the amount of dye to be removed remains the same.
Effect of pH
pH plays a vital role in the adsorption of dye molecules. The variation of percentage removal with pH is shown in Fig. 3(b). It is observed that in the acidic pH range the percentage removal is low and found to increase when the pH was brought in the basic range. The percentage removal was found to increase from 34% to 84% with the increase in pH from 3 to 10. In acidic pH excess H+ ions competes with the cationic groups of dye which hinders the adsorption process. As the solution pH increases the surface charge density decreases which results in increase of electrostatic force of attraction between positively charged dye and OH− ions. This results in an increase in the extent of adsorption. As the removal percent is more at pH 10, it was considered as optimum pH for further experiments.

V. K. Singh et al.: Auramine ‘O’ Dye Adsorption onto…. 2124
Effect of contact time
Effect of contact time on percentage removal of dye is shown in Fig. 3(c). Percentage removal of dye was found to increase with increase in contact time. At earlier stages the amount of dye to be adsorbed is high and as the process progresses the dye concentration decreases. Hence percentage removal increases rapidly at the initial stage and gradually the equilibrium is attained. After 80 min the percentage removal almost reaches at a constant value of 85%. So the optimum time needed for 50 mg/L of dye solution was considered to be 80 min and this time was taken in further experiments.
% D
ye r
emov
al
Adsorbent dose (g/L)
(a)
% D
ye r
emov
al
pH
(b)
% D
ye r
emov
al
Time (min)
(c)
% D
ye r
emov
al
Initial conc. (mg/L)
(d)
Fig. 3: (a) Effect of adsorbent dose (b) Effect of pH (c) Effect of contact time
(d) Effect of initial dye concentration
Effect of initial dye concentration
Effect of initial dye concentration was studied by varying initial dye concentration as 25 mg/L, 50 mg/L, 75 mg/L and 100 mg/L. Percentage removal was found to decrease with

Int. J. Chem. Sci.: 14(4), 2016 2125
increase in initial dye concentration [Fig. 3(d)]. The percentage of dye removal was 83% at 25 mg/L of initial dye concentration, whereas it was decreased to 59% for 100 mg/L. The reason behind this change is that as the initial dye concentration increases while maintaining the constant amount of adsorbent, the availability of active sites for adsorption gets reduced to almost zero resulting in an amount of dye unadsorbed.
Effect of temperature
Effect of temperature on percentage removal of dye is shown in Fig. 4. Temperature determines the endothermic or exothermic nature of the process. The results show that the percentage removal and hence adsorption capacity are increasing with temperature. At 303 K, adsorption capacity was 14.106 mg/g of adsorbent which increased to 18.799 mg/g of adsorbent when the temperature was increased by 20oC. The solubility of dye molecule decreases with increasing temperature, thereby resulting in increase of the adsorption20. Furthermore, at higher temperature, external boundary layer thickness is small and kinetic energy of the molecule is high21. These two effects together increase the mobility of dye molecule through the boundary layer hence molecule gets sufficient energy for adsorption. It concludes that the adsorption process was endothermic in nature.
Ads
orpt
ion
capa
city
(mg/
g)
Conc. (mg/L)
Fig. 4: Effect of temperature
Kinetic studies
Kinetic studies are important since it gives the solute uptake rate, which determines the residence time required for completion of adsorption reaction. Also, the performance of adsorption systems is established by the information given by these studies. The kinetics of adsorption was analysed by two models i.e. pseudo first order and pseudo second order models.

V. K. Singh et al.: Auramine ‘O’ Dye Adsorption onto…. 2126
The equation of pseudo first order was given by Lagergren22 as –
ln (qe – qt) = ln (qe) – k1t …(4)
Where qe and qt are the amounts of Auramine ‘O’ adsorbed (mg/g) at equilibrium and at time t (min), respectively, and k1 (min-1) is the rate constant of adsorption. Values of k1 and qe were calculated from the slope and intercept of plot ln (qe – qt) versus t [Fig. 5(a)] and the results are tabulated in Table 2. The calculated qe and experimental qe values obtained from the linear plot; do not agree with each other.
On the other hand, pseudo second order equation can be expressed as –
e
2e2t q
tqk1
qt
+= …(5)
Where k2 (g/mg min) is pseudo-second-order rate constant. A linear plot of t/qt and t [Fig. 5 (b)] gives a good R2 value above 0.99 and also the calculated qe values (Table 2) are in agreement with the experimental qe value. This indicates that the adsorption of Auramine ‘O’ dye follows the pseudo second order model.
log
(q-q
)e
t
Time (min)
(a)
t/qt
Time (min)
(b)
Fig. 5: (a) Pseudo first order kinetic model (b) Pseudo second order kinetic model
Adsorption isotherms
The purpose of the isotherms is to relate the adsorbate concentration in the bulk and the adsorbed amount at the interface. Relation between adsorption capacity and equilibrium concentration is described by each isotherm. Langmuir, Freundlich, and Temkin isotherms

Int. J. Chem. Sci.: 14(4), 2016 2127
were analysed using experimental data obtained from adsorption of Auramine ‘O’ on GIWBC.
Table 2: Kinetic constants for Auramine ‘O’ adsorption on GIWBC
Temp. (K)
Qe,exp
(mg/g)
Pseudo first order Pseudo second order
Qe,calc
(mg/g) K1
(min-1) R2 Error
Qe,calc
(mg/g)K2
(mg/g1min-1) R2 Error
303 15.243 3.058 0.056 0.880 79.9 % 16.39 0.0189 0.999 7.52%
313 16.192 2.798 0.041 0.942 82.7% 17.54 0.015 0.998 8.32%
323 17.716 2.968 0.039 0.909 83.2% 19.23 0.0125 0.996 8.54%
Langmuir adsorption isotherm
It is based on the assumption that there will be formation of a monolayer adsorbate on the outer surface of the adsorbent, and thereafter no further adsorption takes place. Thus, the Langmuir represents the equilibrium distribution of ions between the solid and liquid phases. The Langmuir isotherm is valid for the monolayer adsorption onto a surface containing a finite number of sites. Based on these assumptions, Langmuir equation is represented as:
m
e
mLe
e
qC
qK1
qC
+= …(6)
Where Ce (mg/L) is any liquid phase concentration of the dye in equilibrium with the adsorbent, qe (mg/g) is equilibrium adsorption capacity of the adsorbent, qm (mg/g) is monolayer capacity and KL is Langmuir adsorption constant.
Freundlich adsorption isotherm
It is commonly used to describe the adsorption characteristics of a heterogeneous surface. These data often fit the empirical equation proposed by Freundlich:
eFe Cln n1Kln qln += …(7)
Where Ce (mg/L) is any liquid phase concentration of the dye in equilibrium with the adsorbent, qe (mg/g) is equilibrium adsorption capacity of the adsorbent, KF is Freundlich

V. K. Singh et al.: Auramine ‘O’ Dye Adsorption onto…. 2128
constant for relative adsorption capacity of adsorbent and n is adsorption intensity. The constant KF is an approximate indicator of adsorption capacity, while 1/n is a function of the strength of adsorption in the adsorption process23. If the value of n > 1, it indicates a normal adsorption. On the other hand the value of n < 1 indicates cooperative adsorption.
Temkin adsorption isotherm
It contains a factor that explicitly taking adsorbent-adsorbate interactions into the account. This model assumes that heat of adsorption of all molecules in the layer would decrease linearly with coverage of surface with adsorbent. As implied in the equation, its derivation is characterized by a uniform distribution of binding energies. It was carried out by plotting the quantity sorbed qe against lnCe and the constants were determined from the slope and intercept. The model is given by the following equation24:
qe = BT ln AT + BT ln Ce …(8)
Where Ce (mg/L) is any liquid phase concentration of the dye in equilibrium with the adsorbent, qe (mg/g) is equilibrium adsorption capacity of the adsorbent, AT is the Temkin isotherm equilibrium binding constant (L/g) and BT is the Temkins heat of adsorption.
Graphs are shown in Fig. 6 and all the data values are tabulated in Table 3, and it was observed that Temkin adsorption isotherm best fits the process.
Table 3: Freundlich, Langmuir and Temkin coefficients for the adsorption of Auramine ‘O’ dye
Langmuir isotherm
Temp. R2 qm (mg/g) KL
303 K 0.976 90.91 0.0356
313 K 0.977 90.91 0.0504
323 K 0.996 71.428 0.1102
Freundlich isotherm
Temp. R2 n KF (l/g)
303 K 0.976 1.513 2.011
313 K 0.956 1.636 2.307
323 K 0.984 2.083 2.860

Int. J. Chem. Sci.: 14(4), 2016 2129
Temkin isotherm
Temp. R2 BT (J/mol) AT (l/mg)
303 K 0.993 19.51 0.363
313 K 0.994 19.28 0.503
323 K 0.998 15.79 1.049
C/q e
e
Ce
(a)
log
q elog Ce
(b)
q e
ln Ce
(c)
Fig. 6: Isotherm plots for adsorption of Auramine ‘O’ dye on GIWBC (a) Langmuir isotherm (b) Freundlich isotherm (c) Temkin isotherm
Error analysis
The use of coefficient of determination (R2) is limited to solve linear forms of isotherm equation, which measures the difference between experimental and theoretical data in linearized plots only, but not the errors in non-linear form of isotherm curves. For that

V. K. Singh et al.: Auramine ‘O’ Dye Adsorption onto…. 2130
reason, we used five error functions for determining of optimum isotherm parameters in this study which were the errors EABS, ERRSQ, ARE, HYBRID and MPSD25, respectively.
The sum of the absolute errors (EABS)
It is similar to the sum of the squares of the errors. Isotherm parameters found out using this error function provides a better fit as the magnitude of the error increases, favouring the fit towards the high concentration data.
, ,
1| |
n
e meas e calci
EABS q q=
= −∑ …(9)
Where qe,calc is the theoretical adsorbed solid phase concentrations of adsorbate on adsorbent, that have been calculated from one of the isotherm equations, and qe,meas is the experimental adsorbed solid phase concentrations of adsorbate on adsorbent and n is number of data points.
The sum of the squares of errors (ERRSQ)
The function will result in the calculated isotherm parameters providing a better fit at the higher end of the liquid phase concentration range. Hence, the squares of errors increase as concentration increases26.
2, ,
1( )
n
e meas e calci
ERRSQ q q=
= −∑ …(10)
The average relative error (ARE)
This error function attempts to minimize the fractional error distribution across the entire concentration range 25.
, ,
1 ,
100 ne meas e calc
i e meas
q qARE
n q=
−= ∑ …(11)
The hybrid fractional error function (HYBRID)
This error function improves the fit of the ERRSQ method at low concentrations by dividing it by the measured value. It also uses the degrees of freedom of the system i.e. (n-p) as a divisor, where n is the number of data point and p is number of parameters of the isotherm.

Int. J. Chem. Sci.: 14(4), 2016 2131
2, ,
1 ,
( )100 ne meas e calc
i e meas
q qHYBRID
n p q=
⎡ ⎤−= ⎢ ⎥
− ⎢ ⎥⎣ ⎦∑ …(12)
Marquart’s percentage standard deviation (MPSD)
In this error function, geometric mean error distribution is modified according to the number of degrees of freedom of the system.
2
, ,
1 ,
1100n
e meas e calc
i e meas
q qMPSD
n p q=
⎡ ⎤−= ⎢ ⎥
− ⎢ ⎥⎣ ⎦∑ …(13)
Table 4: The values of seven different error analysis of adsorption isotherm models of Auramine ‘O” on GIWBC
Error functions
Langmuir Freundlich Temkin
303 K 313 K 323 K 303 K 313 K 323 K 303 K 313 K 323 K
EABS 4.272 1.99 7.21 4.18 3.368 6.69 2.60 1.41 3.87
ERRSQ 10.664 3.17 14.96 5.74 4.098 14.78 2.011 1.101 13.8
ARE 9.17 4.39 10.73 13.66 11.24 10.515 9.066 3.38 8.35
HYBRID 37.62 13.88 42.92 38.15 29.08 42.74 12.65 11.814 38.45
MPSD 16.8 11.03 15.97 23.834 21.95 16.96 13.67 6.24 15.33
RSM modelling
Regression analysis was performed to fit the percentage adsorption of Auramine ‘O’. The regression model developed represent responses as function of temperature, dye concentration, pH and adsorbent dose. An empirical relationship between the response and input variables developed from the design of experiments is expressed by the following response surface reduced cubic model equation (in coded terms as mentioned in Table 1):
2 2 2 2
% Removal 72.51 14.86*A 6.14*B 5.86*C 1.08*D 3.22*A*B 1.91*A*C 0.16*A*D 0.41*B*C - 0.16*B*D 0.031*C*D 14.22*A 11.72*B +6.28*C 2.28*D
= + − + + − + +
− − − − + ...(14)
The significance of model terms included in the regression equations were evaluated by the F-test for analysis of variance (ANOVA). The lower the value of P or higher the

V. K. Singh et al.: Auramine ‘O’ Dye Adsorption onto…. 2132
value of F, the more significant are the model parameters27. The ANOVA analysis for the response is shown in Table 5. Values of "Prob > F" less than 0.05 indicates that the model terms are statistically significant. In this case A, B, C, D, AB, AC, A2, B2, C2, D2 are significant model terms. Values greater than 0.05 indicates that the model terms are not significant.
Table 5: ANOVA of the second-order polynomial equation
Source Sum of Squares Df Mean
Square F Value Prob > F
Model 7861.88 14 561.56 288.32 < 0.0001
A-pH 3975.35 1 3975.35 2041.03 < 0.0001
B-Conc. 678.35 1 678.35 348.28 < 0.0001
C- Adsor.Dose 618.35 1 618.35 317.47 < 0.0001
D-Temper. 21.12 1 21.12 10.85 0.0049
AB 165.77 1 165.77 85.11 < 0.0001
AC 58.14 1 58.14 29.85 < 0.0001
AD 0.39 1 0.39 0.2 0.6607
BC 2.64 1 2.64 1.36 0.2625
BD 0.39 1 0.39 0.2 0.6607
CD 0.016 1 0.016 8.02E-03 0.9298
A2 524.11 1 524.11 269.09 < 0.0001
B2 356.05 1 356.05 182.81 < 0.0001
C2 102.09 1 102.09 52.42 < 0.0001
D2 13.44 1 13.44 6.9 0.0191
Residual 29.22 15 1.95
Lack of Fit 28.34 10 2.83 16.1 0.0034
Pure Error 0.88 5 0.18
Cor Total 7891.09 29
The three-dimensional response surface plots as a function of two factors, and maintaining all other factors constant, are helpful in understanding both the main effects and

Int. J. Chem. Sci.: 14(4), 2016 2133
the interaction effects of the respective two factors28. The corresponding contour plots, represented by the projection of the response surfaces in the X-Y plane, provide a straightforward determination of the effects of the independent variables on the dependent variable29.
The three-dimensional response surface plots and related contour plots obtained are depicted in Fig. 7(a) - adsorbate removal with respect to the concentration and pH, 7(b) - adsorbate removal with respect to the pH and adsorbent dose, 7(c) - adsorbate removal with respect to the pH and temperature and 7(d) - adsorbate removal with respect to the concentration and adsorbent dose respectively.
Fig. 7: 3D - surface plots
Normality of the residuals was also checked. A normal probability plot of these residuals is shown in Fig. 8a. The data points which lie reasonably close to a diagonal line

V. K. Singh et al.: Auramine ‘O’ Dye Adsorption onto…. 2134
indicate the even distribution of errors. Fig. 8(b) shows the relationship between the actual and predicted values of response. The equality plot [Fig. 8(b)] shows the satisfactory relation between the experimental and predicted values, wherein, the points lying close to the diagonal line indicate the best fit of the model.
Nor
mal
% p
roba
bilit
y
Internally studentized residuals
(a)
Pr
edic
ted
% r
emov
al
Actual % removal
(b)
Fig. 8: Actual versus predicted % dye removal
Process optimization
The optimum process conditions were estimated using the optimizer tool in Design Expert. The optimum process conditions estimated are pH- 6.5, concentration – 62.5 mg/L, adsorbent dose – 3 g/L and temperature- 300C to achieve maximum removal. Fig. 8 (b) shows the comparison of predicted removal with experimental removal of the adsorbate. The linear regression correlation coefficient value (R2 = 0.996), which is close to unity, indicates that the regression equation follows the experimental data with good accuracy.
Thermodynamic studies
The measurement of thermodynamic parameters such as the standard free energy of adsorption (ΔG0), the standard enthalpy of adsorption (ΔH0), and the standard entropy of adsorption (ΔS0) are done using adsorption isotherms. By calculating the thermodynamic parameters stated above one can interpret about the adsorption process for a particular adsorbent-adsorbate system whether the adsorption is spontaneous or whether it endothermic or exothermic. The Langmuir constant KL (Lmole-1) was used to calculate these parameters from the following equations.
0 ln LG RT KΔ = − …(15)
Int. J. Chem. Sci.: 14(4), 2016 2135
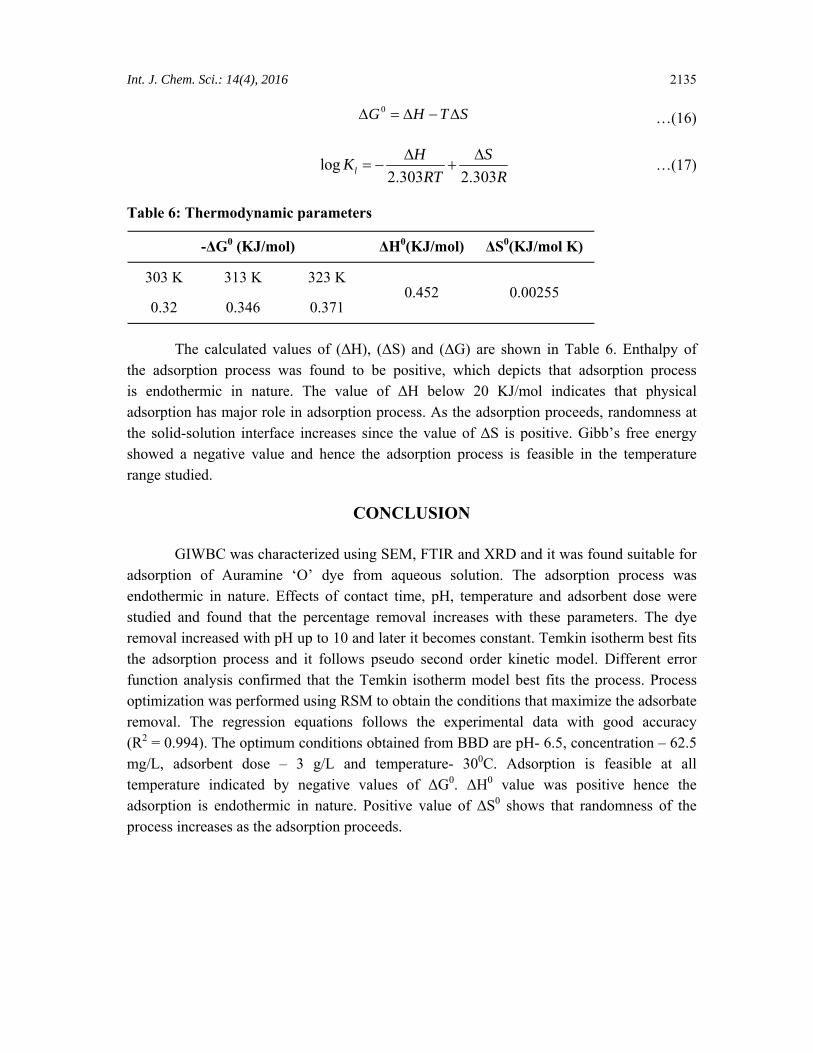
0G H T SΔ = Δ − Δ …(16)
log
2.303 2.303lH SK
RT RΔ Δ
= − + …(17)
Table 6: Thermodynamic parameters
-ΔG0 (KJ/mol) ΔH0(KJ/mol) ΔS0(KJ/mol K)
303 K 313 K 323 K 0.452 0.00255
0.32 0.346 0.371
The calculated values of (ΔH), (ΔS) and (ΔG) are shown in Table 6. Enthalpy of the adsorption process was found to be positive, which depicts that adsorption process is endothermic in nature. The value of ΔH below 20 KJ/mol indicates that physical adsorption has major role in adsorption process. As the adsorption proceeds, randomness at the solid-solution interface increases since the value of ΔS is positive. Gibb’s free energy showed a negative value and hence the adsorption process is feasible in the temperature range studied.
CONCLUSION
GIWBC was characterized using SEM, FTIR and XRD and it was found suitable for adsorption of Auramine ‘O’ dye from aqueous solution. The adsorption process was endothermic in nature. Effects of contact time, pH, temperature and adsorbent dose were studied and found that the percentage removal increases with these parameters. The dye removal increased with pH up to 10 and later it becomes constant. Temkin isotherm best fits the adsorption process and it follows pseudo second order kinetic model. Different error function analysis confirmed that the Temkin isotherm model best fits the process. Process optimization was performed using RSM to obtain the conditions that maximize the adsorbate removal. The regression equations follows the experimental data with good accuracy (R2 = 0.994). The optimum conditions obtained from BBD are pH- 6.5, concentration – 62.5 mg/L, adsorbent dose – 3 g/L and temperature- 300C. Adsorption is feasible at all temperature indicated by negative values of ΔG0. ΔH0 value was positive hence the adsorption is endothermic in nature. Positive value of ΔS0 shows that randomness of the process increases as the adsorption proceeds.

V. K. Singh et al.: Auramine ‘O’ Dye Adsorption onto…. 2136
REFERENCES
1. Z. Carmen and S. Daniela, Textile Organic Dyes–Characteristics, Polluting Effects and Separation/Elimination Procedures from Industrial Effluents–A Critical Overview, Organic Pollutants Ten Years after the Stockholm Convention-Environmental and Analytical Update, InTech: Croatia (2012).
2. B. Zehra, S. Yoldaş and C. Levent, Removal of Malachite Green by Using an Invasive Marine Alga Caulerpa Racemosa Var. Cylindracea, J. Hazard. Mater., 161(2-3), 1454 (2009).
3. I. D. Mall, V. C. Srivastava and N. K. Agarwal, Adsorptive Removal of Auramine-O: Kinetic and Equilibrium Study, J. Hazard. Mater., 143, 386 (2007).
4. E. N. EI-Qada, S. J. Allen and G. M. Walker, Adsorption of Basic Dyes from Aqueous Solution onto Activated Carbons, Chem. Eng. J., 135, 174 (2008).
5. R. Gottipati and S. Mishra, Application of Biowaste (Waste Generated in Biodiesel Plant) as an Adsorbent for the Removal of Hazardous Dye - Methylene Blue -from Aqueous Phase, Braz. J. Chem. Eng., 27, 2 (2010).
6. R. Ahmad and R. Kumar, Adsorption Studies of Hazardous Malachite Green onto Treated Ginger Waste, J. Environ. Manage., 91, 1032 (2010).
7. J. D. S. Macedo, N. D. C. J. Bezerra, L. E. Almedia, E. d. S. V. Fragoso, A. R. Cestari, I. D. F. Gimenez, N. L. V. Carreno and L. S. Barreto, Kinetic and Calorimetric Study of the Adsorption of Dyes on Mesoporous Activated Carbon Prepared from Coconut Coir Dust, J. Colloid Interface Sci., 298, 515 (2006).
8. Y. Yang, X. Lin, B. Wel, Y. Zhao and J. Wang, Evaluation of Adsorption Potential of Bamboo Biochar for Metal-Complex Dye: Equilibrium, Kinetics and Artificia Neural Network Modelingl, Int. J. Environ. Sci. Technol., 11, 1093 (2013).
9. A. A. Said, A. A. M. Aly, M. M. M. Abd El-Wahab, S. A. Soliman, A. A. Abd El-Hafez, V. Helmey and M. N. Goda, Potential Application of Propionic Acid Modified Sugarcane Bagasse for Removal of Basic and Acid Dyes from Industrial Wastewater, Resources and Environ., 2(3), 93 (2012).
10. V. K. Gupta, A. Mittal, R. Jain, M. Mathur and S. Sikarwar, Adsorption of Safranin T from Wastewater Using Waste Materials-Activated Carbon and Activated Rice Husk, J. Coll. Interface Sci., 303(1), 80 (2006).
Int. J. Chem. Sci.: 14(4), 2016 2137
11. C. A. Basar, Applicability of the Various Adsorption Models of Three Dyes Adsorption onto Activated Carbon Prepared Waste Apricot. J. Hazard. Mater., B135, 232 (2006).
12. N. K. Amin, Removal of Reactive Dye from Aqueous Solutions by Adsorption onto Activated Carbons Prepared from Sugarcane Bagasse Pith, Desalination, 223, 152 (2008).
13. S. Banerjee and M. G. Dastidar, Use of Jute Processing Wastes for Treatment of Wastewater Contaminated with Dye and Other Organics, Bioresource Technol., 96(17), 1919 (2005).
14. R. Jain and S. Sikarwar, Adsorption and Desorption Studies of Congo Red Using Low-Cost Adsorbent: Activated De-Oiled Mustard, Desalination and Water Treatment, 52, 7400 (2014).
15. M. R. Mafra, L. Igarashi-Mafra, D. R. Zuim, É. C. Vasques and M. A. Ferreira, Adsorption of Remazol Brilliant Blue on an Orange Peel Adsorbent, Braz. J. Chem. Eng., 30, 3 (2013).
16. K. Vijayaraghavan, S. W. Won and Y. Yun, Treatment of Complex Remazol Dye Effluent Using Sawdust and Coal-Based Activated Carbons, J. Hazard. Mater., 167, 790 (2009).
17. V. K. Singh, A. B. Soni, Sachin Kumar and R. K Singh, Characterization of Liquid Product Obtained by Pyrolysis of Cottonseed De-oiled Cake, J. Biobased Mater. Bioenergy, 8(3), 3, 338 (2014).
18. M. Jain, V. K. Garg and K. Kadirvelu, Investigation of Cr(VI) Adsorption onto Chemically Treated Helianthus Annuus: Optimization Using Response Surface Methodology, Bioresource Technol., 102(2), 600 (2011).
19. Y. Liu, Y. Zheng and A. Wang, Response Surface Methodology for Optimizing Adsorption Process Parameters for Methyelene Blue Removal by a Hydrogel Composite, Adsorpt. Sci. Technol., 28, 913 (2010).
20. S. Kaur, S. Rani and R. K. Mahajan, Adorption Kinetics for the Removal of Hazardous Dye Congo Red by Biowaste Material as Adsorbent, J. Chem., 2013, 1 (2012).
21. D. K. Mahmod, M. A. Mohmd Salleh, W. A. W. A. Karim, A. Idris and Z. Z. Abidin, Batch Adsorption of Basic Dye Using Acid Treated Kenaf Fibre Char: Equilibrium, Kinetic and Thermodynamic Studies, Chem. Eng. J., 181-182, 449 (2012).
V. K. Singh et al.: Auramine ‘O’ Dye Adsorption onto…. 2138
22. H. Qiu, L. L. V, B.C. Pan, Q. J. Zhang, W. M. Zhang and Q. X. Zhang, Critical Review in Adsorption Kinetic Models, J. Zhejiang University Sci. A, 10(6), 716 (2009).
23. N. Rajamohan, Equilibrium Studies on Sorption of an Anionic Dye onto Acid Activated Water Hyacinth Roots, African J. Environ. Sci. Technol., 3(11), 399 (2009).
24. C. Duran, D. Ozdes, A. Gundogdu and H. B. Senturk, Kinetics and Isotherm Analysis of Basic Dyes Adsorption onto Almond Shell (Prunus dulcis) as a Low Cost Adsorbent, J. Chem. Eng. Data, 56(5), 2136 (2011).
25. E. Demirbas, M. Kobya and A. E. S. Konukman, Error Analysis of Equilibrium Studies for the Almond Shell Activated Carbon Adsorption of Cr(VI) from Aqueous Solutions, J. Hazard. Mater., 154, 787 (2008).
26. V. S. Mane, I. D. Mall and V. C. Srivastava, Kinetic and Equilibrium Isotherm Studies for the Adsorptive Removal of Brilliant Green Dye from Aqueous Solution by Rice Husk Ash, J. Environ. Manage., 84(4), 390 (2007).
27. Y. Liu, Y. Zheng and A. Wang, Response Surface Methodology for Optimizing Adsorption Process Parameters for Methyelene Blue Removal by a Hydrogel Composite. Adsorpt. Sci. Technol., 28, 913 (2010).
28. M. Asif, A. Hussain, M. A. Ali and M. Rasool, Scale Up Studies for the Production of Protease Enzyme using Bacillus Subtilis Adopting Response Surface Methodology, African J. Microbiol. Res., 6(9), 2120 (2012).
29. D. Wu, J. Zhou and Y. Li, Effect of the Sulfidation Process on the Mechanical Properties of a Comop/Al2O3 Hydrotreating Catalyst, Chem. Eng. Sci., 64, 198 (2009).
Revised : 24.07.2016 Accepted : 25.07.2016