
AUl1 1~iJClU 1)c /~ 0; /3$ - DNREC Plans Proposed and... · PRP's agreed to design and ... the...
52
AMENDED PROPOSED PLAN OF REMEDIAL ACTION For the SCANNED Potts Property Site AUl1 0 1 Wilmington, Delaware 1)c 0; /3$ . DNREC Project DE-O 169 Prepared by: Delaware Department of Natural Resources & Environmental Control Division of Air and Waste Management Site Investigation & Restoration Branch
Transcript of AUl1 1~iJClU 1)c /~ 0; /3$ - DNREC Plans Proposed and... · PRP's agreed to design and ... the...
AMENDED PROPOSED PLAN OF REMEDIAL ACTION
For the
SCANNEDPotts Property Site AUl1 0 1~iJClU
Wilmington Delaware 1)c ~ 0
3$
DNREC Project DE-O169
Prepared by Delaware Department of Natural Resources amp Environmental Control
Division of Air and Waste Management Site Investigation amp Restoration Branch
10 INTRODUCTION
In 1996 the Department ofNatural Resources and Environmental Control (DNREC or the Department) entered into a Consent Decree with Port Contractors Inc and The Pyrites Company Inc (known hereinafter as the potentially responsible parties or PRP s) under the authority granted by the Hazardous Substance Cleanup Act (HSCA) 7 Del C Chapter 91 The PRPs agreed to design and perform a Remedial Investigation and Feasibility Study (RIfFS) of the site known as the Potts Property with oversight by DNREC F A Potts and Company was also issued a notice of liability by the Department but did not participate in the Consent Decree In May 1997 Bethlehem Steel was noticed as an additional PRP
The final report of the RIfFS was submitted to DNREC in September 1998 The study has been performed in accordance with the Delaware Regulations Governing Hazardous Substance Cleanup (Regulations) Hazardous Substance Cleanup Act Guidance Manual the Delaware Standard Operating Procedures for Chemical Analytical Program July 1994 and the Consent Decree It has been approved by DNREC
The Proposed Plan ofRemedial Action for the Potts Property Site was issued for public comment on February 6 1999 The public comment period was extended beyond the minimum regulatory requirement to March 24 Several written comments were received and are included with the Departments responses in Section 9 of this document
In June 2000 the responsible parties proposed to substitute a I-foot layer of compacted crushed stone for the asphalt or concrete pavement on a ten acre parcel of the site The responsible parties indicate that the compacted crushed stone surface will be more readily maintained when the parcel is used for trailer parking The Department has determined that the crushed stone surface described herein as a low permeability cover is as protective of human health and the environment as the asphalt pavement of the original Proposed Plan There are no other differences between the Revised and the original Proposed Plans
In summary the Amended Proposed Plan for the remediation of the Site includes a passive collection system to contain and remove petroleum contamination from the subsurface and a soil or low permeability cover over the entire Site to prevent contact with contaminated surface soils and reduce migration of contamination to the Christina River The remedial measures will be coordinated with pending action by the US EPA at the Halby Superfund Site
20 SITE DESCRIPTION AND HISTORY
The Potts Property Site comprises approximately 66 acres on Christina Avenue near the Port of Wilmington and just east of the 1-495 bridge over the Christina River The site is roughly rectangular in shape and is bounded by a Conrail line on the southwest and the Christina River on the northeast Christina Avenue divides the site into two parcels The Lobdell Canal about 1200 feet long forms the southeastern boundary of the site (See Figure 1)
The ground surface at the site is relatively flat The elevation is approximately five feet above mean sea level Earthen berms 5 to 10 feet in height have been constructed along the riverbank and elsewhere on the site A tidal marsh occupies approximately eight acres in the southwest
1
TABLE OF CONTENTS
10 INTRODUCTION 1
20 SITE DESCRIPTION AND HISTORY 1
30 THE RELATIONSHIP BETWEEN THE HALBY AND POTTS PROPERTY SITES 2
40 REMEDIAL INVESTIGATION 3
41 SOIL AND GROUNDWATER 3 42 CHRISTINA RIvER 4
50 SITE RISK EVALUATION 4
51 APPLICABLE STANDARDS 4 511 Soil Groundwater and Sediment 4
512 Surface Water 5
52 RISKS ASSOCIATED WITH IMPACTS OF CONTAMINATION ON SOIL AND GROUNDWATER 6 53 RISKS ASSOCIATED WITH POTENTIAL IMPACTS ON THE CHRISTINA RIvER 6
60 REMEDIAL ACTION OBJECTIVES 7
61 QUALITATIVE OBJECTIVES 7
62 QUANTITATIVE OBJECTIVES 7
70 EVALUATION OF POTENTIAL REMEDIAL ALTERNATIVES 7
71 CONTAMINATED SOIL (OTHER THAN PETROLEUM PRODUCT) 7
711 Screening Criteria 7
712 Further Evaluation 8 72 EVALUATION OF POTENTIAL REMEDIAL ALTERNATIVES FOR PETROLEUM PRODUCT IN SUBSURFACE SOILS 11
80 REMEDIAL PLAN 11
90 PUBLIC PARTICIPATION 12
91 PUBLIC MEETINGS 12 92 PUBLIC COMMENT AND RESPONSES 12
921 Comments from Eastern Environmental Law Center March 23 1999 12
922 Comments from Wilmington Waterfront Watch February 19 1999 14
100 DECLARATION 15
FIGURES
1 Site Area Sketch 2 Halby Site Selected Remedy 3 Estimated Extent of Free Petroleum Product 4 Potts Property Proposed Extent of Cover and Capping
TABLES
Table 1 Comparison of Remedial Alternatives for Site Soils
ATTAcHMENT Evaluation ofImpacts on the Christina River
1
comer of the site and is fed by a drainage ditch extending along the railroad tracks Historical photos indicate that virtually all of the Potts Property was tidal wetlands before extensive filling which began prior to 1915 The wetlands and drainage ditches now total about fourteen acres
The Lobdell Canal was constructed in the mid-1880s Apparently some material from the canal was placed on the Potts Property
Land use in the area is predominantly heavy industrial However there are two residences on Terminal Avenue approximatey two hundred feet from the Potts Property The location of the residences is shown on Figure 2 There is a residential neighborhood near the intersection ofIshy495 and Terminal Avenue approximately 2500 feet to the west of the site All residences are served by the public water supply
Historically several industrial facilities have operated on the site and in the immediate area The Halby Superfund Site the former location of a chemical production facility is immediately adjacent to the Potts Property on the southwest Features of the Halby Site are shown on Figure 2 The Pyrites Company Inc operated an ore refining facility on the Potts Property from 1916 to 1974 The Lobdell Car and Wheel Company operated a railroad wheel manufacturing plant immediately southeast of the Potts Property from 1881 to the 1940s
The ore refining facility was demolished over a period of time ending in the 1970s Since then the Potts Property has been used for parking and materials storage Most notably large quantities of petroleum coke in unconfined piles were stored in two different areas of the site until 1997 Presently a concrete rubble recycler operates between Christina Avenue and the Conrail tracks A pallet wood recycler also began operation on the parcel between the Christina Avenue and Christina River At this writing the business owner is under an enforcement action to cease operations and remove woodpiles
30 THE RELATIONSHIP BETWEEN THE HALBY AND POTTS PROPERTY SITES
Plans for the Halby Site located immediately to the southwest of the Potts Property are documented in the Record of Decision (ROD) issued by the US EPA in March 1998 The EPA has been involved in the investigation of the Halby Site since 1984 During this time the EPA successfully eliminated immediate risks caused by the chemical production and storage facilities and carbon disulfide contaminated soil on the Halby Site In general the objective of the EPAs remedial plan is to restore the Halby Site to use as an industrial facility while controlling the remaining health and environmental risks through a combination of removal containment and institutional controls
The investigations performed by EPA suggested that some contaminants notably arsenic in soils originated at the industrial operations formerly located on the Potts Property or the adjacent Lobdell plant Apparently waste material containing elevated levels of arsenic was used for fill on part of the Halby Site The chemical production facilities located on the Halby Site contributed to arsenic contamination too however The highest concentrations of arsenic on the Halby site are thought to have originated with the chemical plant on the Halby Site
2
As part of its project the EPA investigated the presence of arsenic in the soil of residential neighborhoods and a public park near the Halby and Potts sites The Halby remedial plan includes the removal of a small area of arsenic contaminated soil on a residential lot adjacent to the Halby Site No elevated levels of arsenic were found in the other residential areas
The chemical production facilities located on the Halby Site discharged liquid waste to a lagoon located immediately to the east of the Conrail tracks and adjacent to the Potts Property The lagoon drained to the Christina River via a network of ditches and natural wetland areas on Potts Thus substances originating from the Halby Site contaminated the Potts Property As part of its investigation the EPA performed extensive sampling of water and sediment in ditches and marsh areas The EPA remedial plan for the Halby site includes removing sediment from ditches on the north side of the Potts Property and filling approximately 7 acres of contaminated Potts Property wetlands The hydraulic function ofthe existing wetlands will be replaced with an engineered system using surface grading storm water retention and outfall structures Federallaw requires the creation or enhancement of wetlands offsite to compensate for the natural wetlands lost on the site through this remedial action Due to the environmentally degraded condition of the onshysite marsh and its surroundings the off-site creation of wetlands preferably within the Christina River watershed will provide a wetland habitat of better ecological function and value
Since the EPAs ROD addresses the wetlands area of the Potts Property this area will not be addressed under HSCA However construction for the remediation of the Potts Property must be compatible with the storm water management system to be designed as part of the Halby project Figure 2 shows the EPAs selected remedy including back filling wetlands and paving on the Halby Site
The EPAs remedial plan for the Halby Site also addressed groundwater impacted by site related contaminants It includes institutional controls (implemented by DNREC) to prevent the placement of water supply wells which might be contaminated It also acknowledges that groundwater from the Halby Site apparently moves beneath the Potts Property toward the Christina River Impact to the river from this groundwater contamination will therefore be addressed as part of the remedial plan for the Potts Property site
40 REMEDIAL INVESTIGATION
41 Soil and Groundwater
Duffield Associates consultant to the PRPs performed the Remedial Investigation of the Potts Property under a work plan approved by DNREC The investigation began in July 1996 and consisted of three phases For the first and second phases sixty-four soil samples were taken from 9 soil borings and 19 test pits Eight temporary wells were constructed and sampled three permanent wells constructed for the Halby Site project were also sampled
The first two phases of investigation were designed to determine the extent and character of soil and groundwater contamination by substances associated with the known past activities on the Site Surface and sub-surface soil samples were analyzed for metals (arsenic lead cobalt copper calcium beryllium iron manganese mercury nickel selenium thallium zinc and cadmium) semi-volatile organic compounds (SYOCs) and volatile organic compounds (YOCs) including benzene ethylbenzene toulene and xylene
3
During the collection of subsurface samples a thin layer of petroleum product was discovered on the southwest side of Christina Avenue Consequently a third phase of investigation was begun to determine the source and extent of this contamination Thirty-one soil samples were taken from 28 test pits Figure 3 shows the estimated extent of the petroleum contamination
42 Christina River
DNREC supplemented the Duffield RI Report with its own evaluation of site impacts on the Christina River It is attached to the Final Plan and provides more detail than the summary here
The Duffield RI Report evaluated the migration of dissolved metals in shallow ground water at the Potts Property to the Christina River In order to assess the potential impact on the Christina River from shallow groundwater at the Potts Property Site based on the data obtained from the RI site parameters regarding the movement of groundwater from the site to the river precipitation runoff infiltration and the hydrogeological characteristics of the fill material were estimated The resulting worst case calculation of contaminant loading to the river was combined with the flow rate of the river at low flow conditions to estimate the concentrations of select metals in the river water
Groundwater contaminated by the Halby Site also reaches the Christina River The potential contaminant contribution from Halby was not included in the RI report DNREC has estimated the impact to the Christina using groundwater data from the Halby Site investigation
Impacts to the river can also be evaluated by sampling river water and sediment The analysis of water indicates current impact on river water quality both of the site and other sources Analysis of sediment samples reveals the history of contaminant discharges to the river Direct sampling of river water and sediment was not part of the Remedial Investigation performed by Duffield Associates However DNREC has been able to assemble adequate data from other studies to evaluate current water and sediment quality conditions
50 SITE RISK EVALUATION
Environmental and health impacts of contamination present on the site were evaluated by comparing the concentrations of chemicals present on the site to standards developed or recognized by DNREC These standards were developed to provide consistency among the level of contamination at a site the degree of cleanup needed and the long-term use of the property Applicable standards for the Potts Property Site risk evaluation are described below
51 Applicable Standards
511 Soil Groundwater and Sediment
The screening standard for site soils and groundwater is from the Remediation Standards Guidance (DNREC February 1998) Application of this guidance requires the development of objectives related to the long-term use of the site and the suitability of site ground and surface water as drinking water supplies
4
The proposed long-term use of the Potts Property is as an industrial site This is consistent with its current zoning and surrounding land uses This risk evaluation then assumes that future exposure to site contaminants by human beings will be in an occupational setting Therefore the restricted use Uniform Risk Standard (URS) would be applicable Furthermore since the Potts Property will be included in a Groundwater Management Zone developed as an institutional control for the Halby Superfund Site and the Christina River does not serve as a drinking water supply the URS for Non-Critical Water Resource Area would apply
The Remediation Standards Guidance contains a URS list for contaminant concentrations in sediment Sediments in the lower Christina River are commonly contaminated with zinc and arsenic from a variety of sources The concentrations frequently exceed the URS screening level Therefore the evaluation of sediment contamination considered informal guidance developed by the US National Oceanic and Atmospheric Administration (NOAA) and published in 1991 The guidance uses two thresholds of chemical concentration--the Effects Range-Low (ER-L) and the Effects Range-Median (ER-M) to identify three ranges of potential adverse biological effects At concentrations below the ER-L no effects are apparent Between the ERshyL and the ER-M adverse effects are possible Above the ER-M adverse effects are probable The guidance cautions that the measurement of adverse effects is subjective and the threshold values do not represent official NOAA standards In addition the guidance was developed from a number of studies including marine and estuarine conditions as well as relatively fresh water conditions like the Christina River
512 Surface Water
The applicable standards for evaluation of surface water are found in Surface Water Quality Standards (DNREC 1993) The Standards designate desired beneficial uses of streams in the state and establish chemical specific surface water quality criteria (SWQC) depending on that designation and other stream characteristics The criteria are for the protection of aquatic life (further broken down into fresh and marine water and acute and chronic effects) and for the protection of health of humans consuming fish andor water The Christina River at the Potts Property is designated for the following uses
bull Industrial water supply bull Secondary contact recreation (wading boating fishing) bull Fish aquatic life and wildlife bull Agricultural water supply
The Department does not expect that it will be used for primary contact recreation (swimming) public water supply nor is it designated to be of exceptional recreational or ecological significance Fish from this part of the Christina may be consumed by recreational or subsistence fishermen However the criteria for Potts Property related substances (which are inorganic) are generally lower for protection of aquatic life rather than of human health Therefore the criteria for the protection of aquatic life would apply
There are several substances at the Potts and Halby Sites for which there are no SWQCs In some of these instances comparison has been made to lowest observable effect levels established as guidance by NOAA
5
52 Risks Associated with Impacts of Contamination on Soil and Groundwater
Arsenic is widespread on the site and present at concentrations that warrant concern in an industrial land use setting In nine borings surface soil samples were analyzed for arsenic lead and other metals The average concentration of arsenic was 226 milligramskilogram (mgkg) compared to the relevant DRS of 61 mgkg Of 28 total surface soils sampled from both borings and test pits eight exceeded the 610 mgkg level (ten times the URS) The Remedial Investigation report states that no general patterns were observed in the distribution of arsenic in surface soils Arsenic in sub-surface soils is present at somewhat higher concentrations than surface soil The average of samples taken in borings is 244 mgkg
The applicable URS for lead is 1000 mgkg Two samples of surface soil substantially exceed this level Lead is elevated above background levels throughout the site Other inorganics do not appear to contribute to human health risks at the site
The third phase of the Remedial Investigation focused on petroleum product contamination in subsurface soil on the western portion of the site between Christina AvenUe and the Conrail tracks A layer of phase separated petroleum product varying in thickness from a sheen to about 1 inch was found to be present over an area approximately 100 by 400 feet The petroleum product was identified as weathered No2 fuel oil motor oil or lubricating oil and may have come from a tank or other vessel that was buried with the fill material
Groundwater samples taken from the Columbia and the Upper Potomac aquifers showed widespread contamination by site related organic and inorganic chemicals The Groundwater Management Zone established as part of the EPAs Halby Superfund project has eliminated the risk to human health by restricting use of this water
53 Risks Associated with Potential Impacts on the Christina River
None of the river water samples available exhibited exceedence of the relevant Surface Water Quality Criteria of the State of Delaware Samples taken in the Lobdell Canal and the 1-495 drainage ditches exhibit exceedences of the criteria for copper zinc and lead Ammonia is also present at significant levels in the canal and ditch water although there is no SWQC for ammoma
The site as well as other upstream sources has apparently affected sediment in the Christina River Sediment samples taken by the EPA for the Halby Site from the wetlands ditches Lobdell Canal and three samples in the Christina River all exceed the URS for zinc arsenic and copper They are also found to exceed the Effects Range-Low in the river near the site for arsenic lead zinc and copper The three sediment samples taken in the Lobdell Canal exceeded the Effects Range-Low for zinc and Effects Range-Median for copper The extent of exceedences of the Effects Range-Median is limited to the canal This has lead DNREC to conclude that sediment contamination in the canal is not a significant impact on the river The Army Corps of Engineers dredges the Port of Wilmington to maintain the channel depth The dredged area extends to the Lobdell Canal Samples taken from the dredged area show a significant reduction in sediment contamination See the attachment for more detail
60 REMEDIAL ACTION OBJECTIVES
The Regulations require that objectives to be clearly established for actions taken under HSCA Objectives should consider current and potential land use resource use proximity of human populations use of surrounding properties and the level of contamination of surrounding properties Qualitative objectives describe in general terms the ultimate result of remedial action Quantitative objectives define specific levels of remedial action to achieve protection of public health welfare and the environment The following objectives have been established by DNREC and are also consistent with the EPAs objectives for the Halby Site
61 Qualitative Objectives
bull To restore the Potts Property for industrial use as is consistent with its zoning and the surrounding land uses
bull Limit exposure to site soils contaminated by metals or petroleum products bull Eliminate or reduce impacts to the river from contaminated site soils through soil loss
erosion infiltration and discharge
62 Quantitative Objectives
bull Eliminate exposure of workers on the site to soil with concentrations of arsenic greater than 38 mglkg or lead greater than 1000 mgkg (The proposed cleanup level has been selected to be consistent with that established by the EPA for the Halby Site Arsenic at 38 mglkg in surface soil corresponds to an increased lifetime cancer risk of 1 in 10000 according to EPAs guidance)
bull Eliminate the mobility of petroleum product beyond its present boundaries bull Reduce the discharge of contaminated shallow groundwater to the Christina River by 75
(as projected by the method described in the RI Report by Duffield Associates)
Note that components of the EPA remedial action will significantly reduce the migration of contaminated sediments from the site to the Christina River and Lobdell Canal
70 EVALUATION OF POTENTIAL REMEDIAL ALTERNATIVES
71 Contaminated Soil (other than Petroleum Product)
711 Screening Criteria
To meet the remedial objectives for site soils the following remedial alternatives were screened for contaminated surface and subsurface soil
bull No action bull Containment with capping or covering bull Removal and off-site disposal
7
Initial screening of remedial alternatives under HSCA (Section 9 of the Regulations) is based on (1) Effectiveness in meeting cleanup levels for the protection of public health welfare and the environment and (2) Acceptable engineering practices (applicability feasibility reliability and cost effectiveness)
The no action alternative is not effective in meeting the cleanup levels and was therefore eliminated from further consideration
Containment of site soils is an acceptable engineering practice and is potentially effective in meeting cleanup levels It also meets the objective of reducing the discharge of shallow contaminated groundwater to the river It is retained for further consideration
Removal and off-site disposal of fill material from the entire site (approximately 700000 cubic yards in volume) would meet clean-up levels but would involve inapplicable or infeasible engineering practices including demolition of site buildings arranging for disposal of the material and replacing with clean fill The cost of disposal (estimated at $35 million) and clean fill replacement ($98 million) render this alternative not cost effective However removal and off-site disposal of the free phase petroleum product is a potentially feasible and effective engineering practice
712 Further Evaluation
After screening remedial approaches to soil contamination at the site only the containment option appears to be protective applicable feasible and reliable
According to the HSCA Regulations after the initial screening is performed an evaluation shall be conducted of the remaining alternatives using the following criteria
1 Protectiveness 2 Compliance with all applicable local state and federal laws and regulations 3 Community acceptance 4 Provision for monitoring the success of the alternative 5 Technical feasibility 6 Ability to be implemented 7 Practicability from a cost standpoint 8 A reasonable restoration time frame 9 Reduction of toxicity mobility and volume 10 Long term effectiveness 12 Short term effectiveness
Four forms of containment--Alternatives A through D--will be compared using the twelve- (12) HSCA criteria Common to all of them is the interruption of the exposure pathway by placing material between the contamination and site workers The remedial alternatives are briefly described below and compared with the criteria on Table 1
8
A Clean fills and topsoil
This alternative consists of the removal and disposal of the existing site vegetative cover and placement of clean fill material and a 4-inch topsoil layer on the site The quantities of fill material would be dictated by the final grade The new fill and topsoil would reduce risk by isolating the site contaminants from future site workers A vegetative cover would be maintained to control erosion Four inches of topsoil is considered the minimum topsoil cover to support a robust community of turf grasses
B Permeable fabric and clean fill
This alternative would involve removal ofthe existing vegetative cover as above and installation of a synthetic filter fabric clean fill and a 4 inch topsoil layer on the site As in alternative A the thickness of the layer of clean fill would be determined by the final grades The permeable fabric layer would result in containment of the contaminants below the liner and would prevent direct human contact with contaminated soils The liner would server as a marker between the clean soil cover and the contaminated soil However some controls would have to be instituted to maintain the integrity of the liner
C Impermeable liner and clean fill
For this alternative site vegetation would be removed as above Layers of sand approximately 6 inches deep would be placed on the surface of the site An impermeable liner similar to the type of liner used in sanitary landfills would cover the sand layer The liner would be seamed water tight and topped with clean fill and topsoil The impermeable liner would prevent not only contact between workers and contaminated soils but also percolation of precipitation through the contaminated soil Drainage would be collected in a perimeter drain system with appropriately sized retention structures
D Low permeability cap
In this alternative existing site vegetation would be removed and the surface graded The surface would be prepared with stone or other suitable base material and the surface would be paved with asphalt or concrete or compacted crushed stone (The pavement section material and thickness would be determined during the detailed design stage) Drainage would be collected in a perimeter drain system with appropriately sized retention structures designed to be compatible with the drainage system installed at the Halby Site Like the impermeable liner discussed above the cap would prevent contact between workers and contaminated soils
9
Table 1 C fR dial Alt f forSite SolI s Alternative A Alternative B Alternative C Alternative D
HSCA Criteria Clean fill and top soil Permeable fabric Impenneable liner Low penneability and clean fill and clean fill cap
Protectiveness Meets minimum requirement for protectiveness
Protective Protective Protective
Compliance with applicable Compliant Compliant Compliant Compliant requirements Community Acceptance
Potentially acceptable Potentially acceptable Potentially acceptable Acceptability more likely
Monitoring Required Required Required Required Potential problems with
Feasibility Feasible Feasible tying in liner to existing Feasible buildings Implementable but Implementable but
Implementation Easiest implementation Implementable significantly more difficult than B (liner tie-
additional design and construction
in and drainage) for water drainage Cost (sqft) $85 $200 $400 $250
Time Frame Fastest-6 months construction time
Longer design and construction
Longest design and construction
Somewhat shorter design period than C Significant
Reduction of toxicity mobility and volume
Minimal reduction in mobility no reduction in toxicity or volume
Some reduction in mobility no reduction in toxicity or volume
Significant reduction in mobility no reduction in toxicity or volume
reduction in mobility no reduction in toxicity or volume
Long term effectiveness
Potential for damage caused by surface or intrusive activities
Potential for damage caused by surface or intrusive activities
Potential for damage caused by surface or intrusive activities
Readily designed for anticipated loads
Short term effectiveness
Effective Effective Effective Effective
10
72 Evaluation of Potential Remedial Alternatives for Petroleum Product in Subsurface Soils
Three potential remedies for the areas of petroleum products in subsurface soils are
bull No action bull Passive collection using absorbent or vacuum technologies bull Active collection using pumping welles) and product collection equipment
The No Action remedy does not meet the remedial objectives discussed above or the requirements of HSCA
Both active and passive collection potentially meet the screening criteria of effectiveness in providing protection for human health and the environment and in use of acceptable engineering practices Both are well-established technologies and would potentially meet the HSCA criteria Passive approaches would take a longer time to complete but the start-up costs would be somewhat less than active approaches Duffield estimates that the installation costs of a passive system would be $40000 Duffield has proposed additional monitoring of the area of contamination prior to design and implementation of a collection system
80 REMEDIAL PLAN
Based on the remedial objectives and the evaluation criteria ofHSCA the DNREC adopts a remedy for the Site consisting of the following
bull The first is a low permeability cover consisting of asphalt or concrete paving over most of the site (Alternative D) Some limited areas--approximately 35 of the surface area--will receive a clean-fill and topsoil cover (Alternative A) rather than paving The proposed extent of the paved area is shown in Figure 4 The estimated cost of the combination asphalt cap and soil cover is $2970000
bull The second component of the remediation will be a recovery system for subsurface petroleum product to be designed based on further investigation The collection system may be either active or passive depending on the results of monitoring The system will however significantly reduce the volume of petroleum on the site and prevent further migration of any petroleum left in the soil
bull A ground water management zone covering the Potts Property has already been established as part of the Halby Superfund Site remediation This will prevent the installation of drinking water supply wells drawing potentially contaminated ground water Additional institutional controls on activities on the property including building construction excavation maintenance of the cap and recovery system will be implemented by the PRPs and enforced by the Department The institutional controls will be noted on the deed to the property Procedures for conducting controlled activities will be detailed in an Operations and Maintenance Plan which will be part of the proposed remedial action
11
90 PUBLIC PARTICIPATION
91 Public Meetings
Prior to publishing the Proposed Plan the DNREC held two informational meetings with the City of Wilmington administrative staff and elected officials Representatives of citizens groups were also represented
A public meeting was held on February 18 at the William Hicks Anderson Community Center In response to a request made at that meeting an additional public meeting was held on March 9 at Neighborhood House
Release of the Proposed Plan and the public meetings were publicized in advertisements in the Wilmington News Journal and in flyers distributed in the residential areas near the Site Radio Station WILM aired an interview with DNREC and announced the first meeting
92 Public Comment and Responses
921 Comments from Eastern Environmental Law Center March 23 1999
1 What is the status of the investigation to determine the source and extent of the petroleum product that was discovered at the southwest side of Christina Ave
The extent ofthe subsurface petroleum product area was determined in a series of28 test pits (designated PTP1 through PTP-28 in the Duffield RI Report) dug on June 45 and 6 1997 While this effort was adequate to establish that free product is present and to estimate its extent additional investigation will be required to design a recovery system The pre-design investigation may consist ofsmall diameter shallow monitoring wells which can be tested with an interface probe to determine the presence and thickness of free product Such wells could be installed before or after the capcover is constructed
2 Are there any water lines running through the Site and if so how will they be re-routed
There is reportedly a water main along Christina Avenue and a supply line to the office building There are no plans to re-route the lines Contaminated soil would only come in contact with the inside ofa water line if it should break In that event the line would be flushed to remove soil and debris after it is repaired As part ofthe Final Plan a deed restriction will be placed on the Potts Property Site that requires notification ofDNREC prior to excavation for construction or utility purposes
3 What is the water related impacts to the river with respect to contaminants Have these been factored into the Plan
Impacts ofPottsHalby related contaminants on the Christina River are discussed in the Attachment to the Final Plan Water quality sample results are summarized in Table
12
A4 Contaminants ofpotential concern appear to be the heavy metals No PCBs have been found in extensive sampling ofsoil on both sites for the Halby RI Organic substances ofconcern including thiocyanate and carbon disulfide at Halby and Potts have not been found in the river water samples An exception is ammonia which was detected in SW-10 11 and 12 The concentrations ofammonia present in river water are not thought to be significant and may be occurring naturally Byfar the most impacted water sample was taken from the Lobdell Canallocation--SW-10 The concentration of zinc in that sample (filtered) was 117 ugL while the relevant water quality criterion (fresh chronic) is 589 ugL
The impact ofsite contaminants on river sediment is more obvious and is probably due in part to past releases from the site However there does not appear to be any contamination in river sediment that is exclusive to Potts and Halby
The caplcover remedy recommendedfor the Potts and Halby sites will prevent human contact with contaminated soils and also reduce the discharge ofcontaminated water to the river So in that sense water related impacts have been factored into the Proposed Plan
4 How will the contaminant sources being released be integrated into the Piedmont Whole Basin Management Plan for the State of Delaware
Management plans for the Christina and other watersheds in Delaware include the identification and cleanup ofsites like Halby Chemical and Potts Property The DNREC Watershed Assessment Section is responsible for determining the total maximum daily loadfor particular water bodies in the State
5 What are other sources of contaminants that exist within the water shed
The question is very general Literally hundreds ofcontamination sources exist in the water shed Small business factories petroleum storage facilities underground tanks landfills farms abandoned industrial sites septic systems tire piles and salvage yards salt piles dredge disposal areas and recyclingfacilities are all potential sources The Piedmont Basin Preliminary Assessment describes and itemizes known sources on pages 111 to 135
6 With respect to 5 above what kind of model is being used to assess the background levels
Please see the discussion ofsurface water quality trends beginning on page 19 of Piedmont Basin Preliminary Assessment Report Its conclusions are based on analysis of22 parameters from 34 stations in the watershed The closest monitoring station to the PottsHalby site is the Route 13 3rd Street Bridge in Wilmington approximately two miles upstream from the site In this study contamination trends are related to water quality criteria rather than natural background levels
7 What is the status of the Piedmont contaminant source database If completed what is the significance of the collective ground water discharge relative to the total daily load to the River
13
The site index database has not been completed but the Piedmont Basin Preliminary Assessment Report contains much ofthe information identifYing contaminant sources that will eventually be listed in the database
8 Does the site lie within a flood plain If so what plans have been developed to deal with flooding of this area
Part ofthe site lies within the hundred-year flood plain Presently flooding ofthis area could carry contaminated soil to the wetlands and river The remedy will reduce this mechanism oftransport
9 EELC understands that the Agency for Toxic Substances and Disease Registry has been conducting interviews with citizens who may have been exposed to hazardous substances released by the Halby and Potts sites since the 1950s Has there been any evaluation ofthe employees of the Port of Wilmington or any of the surrounding communities for any human health effects related to exposure to the pollutants identified in the Plan
The Potts HSCA project did not include health screening ofPort ofWilmington employees To evaluate the potential for past human exposure to site contaminants the EPA Halby project did include sampling surface soils in nearby residential communities andpublic parks The results indicated that those soils do not contain elevated levels of site related contaminants except in the residential lot on Terminal Avenue which is directly acijacent to the Halby site
922 Comments from Wilmington Waterfront Watch February 19 1999
1 Remedial Action Concerns The age of the Halby RI (1988) Army Corps of Engineers (1994) Table A-4 Water Quality (1995) Sediment Quality Studies (Table A-5) We feel that a current testing of surface water and sediment by DNREC or EPA at SW 10 11 12 S-I Sediment 22-23-17 would show a clear picture of conditions at the site and the impact to the river As the Army Corps of Engineers may soon be involved in dredging operations their involvement in sampling would be questioned
In response to the concerns raised in this comment DNREC met with representatives of the Wilmington Waterfront Watch and Wilmington River-City Committee Inc to discuss the issue ofimpact on the Christina River As a result ofthis meeting DNREC agreed to perform additional sediment sampling in the river The field effort will consist ofnine surface sediment samples and one field duplicate Three transects shall be established across the river upstream ofthe 1-495 bridge directly across from the Potts Property site and downstream ofthe discharge from the dredge disposal site This single sampling event is not anticipated to result in a clear determination ofthe contaminant contribution from the Potts Property Site because there are many other sources ofthe same contaminants on the Christina However it will give a snap shot picture ofcurrent sediment quality in this stretch ofthe river
14
The Army Corps ofEngineers performs maintenance dredging in the Wilmington ship channel every eight months under a permit issued by DNREC At this writing the Corps is in compliance with its permits requirements The permits require extensive sampling ofthe elutriate from the dredged material that discharges to the river The Corps has also sampled sediment and river water up and down stream from the dredged area and performed toxicity testing DNREC believes that on balance the dredging is beneficial environmentally because while it does cause a temporary increase in turbidity it removes contaminated sedimentfrom the riverbed
2 We feel that one more meeting should be held before the March deadline our choices are Rose Hill Community Center The Neighborhood House 7 PM time frame
An additional public meeting was held at Neighborhood House on March 9
100 DECLARATION
This Final Plan of Remedial Action for the Potts Property Site is protective of human health welfare and the environment and is consistent with the requirements of the Delaware Hazardous Substance Cleanup Act
Denise Ferguson-Southard Director Division of Air and Waste Management Department of Natural Resources and Environmental Control
SFJrm SFJ00040doc DE 0169 B9
15
I
11 I
II
I I
~ I
I I
I I
I I
I I
I
~ I
I I
I I I I
1 JO I I
1 I I
J I
J J 1 J
I ~
I
I I
I I
~
~ THIS LOCATION SKETCH IS ADAPTED FROM TriE USGS TOPOGRAPHIC MAP 75 MINUTE SERIES fOR WILMINGTON SOUTH DEL-NJ
AREA SKETCH
pons PROPERTY WILWIHGTOH
NEW CASTLE COUNrt DELAWARE
DUFFIELD ASSOCIATES INC CONSULTANTS IN THE GEOSC1ENCES WIlMINGTON DELAWARE ElKTON MARYtANO
1 MARCH 1994Date wo 5-40ED
Drawn OSH Chkd Scale 18 =20001
FtGtJRE 1File No A-640ED-1
~ --- ~=c__O_UFmD_ ASSOCJA1S INCshy
-shy_0-o 0-=
I
I~ -
LEGEND ----- H-L8Y 0EW1CA SITE
- bullbull - bullbull - FClAWEA ~SS degPLtItT Ntpound- ~-r
Figure 2 SITE-Wloe SELECTED ROeMEOY
Halby ~enic3I Site
0400
Date nGURE 3
10 DECEMBBR 1817
---shy
~
Reriloa
Chkd JJl1 II I Dale 1shy =100 110 A-a40EB-3
HOm 1HlS LOCA11ON SKETCH IS ADAPIED fROU A PlM EHll1lED ~IC PlNf fREDERICK It POllS bull CO INC PREPARED ftI YAtl)8lARl( bull LtNCH INC RE4ISION DATED 10 OCTOBER tilDRAWING NO 30837-8
No
Drawn DS
File No
Scale
----------- -shy-----shy --shy---shy
I I I I I I
L1
PTP-24shy~ o
lP-13tA n 12
-shy -shy-_=shy
~ -I
I
_J
( ESTttfATED AREA or rREE PETROLEUtC
PRODUCT _ )
shy~
--shy ---shy
)
V
P~25
-
ESTIMATED EXTENT OF FREE PETROLEUM PRODUCT
POTTS PROPERTY RIFS 1I1UlING1ON
NEW CASTLE COUNTY N DELAWARE
u pu J17834 1103J1f etnl f2 J I
1 - - liUWshy ~ I - 6 Gft
- shy - MEe shy eIa i AC ~I d - - ~1 87500 - ~-_-___ ~ lt bullbull - 1F51f2 k gt P - --- = -
bull N 2 Z115 w -shy _ ~ __ -ii- -gt--=--- shy - - - ~------
1007 DUFFIELD ASSOCIATES I~C
DUFFIELD g~~08A~ J~gSClINClS 6400 UWISTONW ROAD
AOS~S~O=-C~IA~T=E~S--fWCINCTON DEURE 1118011-1232 TIL (302)2311-801 fU (I02)2111-0tll6 -W1L Dorfll~WDUPPHITCOY
wnEi THIS LOCATION SKETCH IS ADAP1ED FROM A PUN
~ ENTITlED TOPOGRAPHIC PlAN FREDERICK A POllS ~~~
c~S~~
DUFFIELD ~~~o~u~ ~~SC1ENCES CHOO UYr3fOHB tOAD
AS=S~O~C~I=A~TE=-S7 WILWIHGTON DIlUnRB 111808-1232 bull IU (304)4ID-8113C tU (302)2311-lICllli
E-1UJ1 OUfrUIWeOUltNlrlCOW
1007 DUFFIELD ASSOCIATES INC
amp CO INCmiddot PREPARED BY VANDEMARK lYNCH INC REVISION DATED 10 OCTOBER 1996 DRAWING NO 30637-Bbull
KEY
ltCamp PROPOSED CpKgtltgtQltJ ~laquolt r-- --- --- PROPOSED COVER
( ~ ~lt
0
Qp)~
~ ~4
~ amp~
~~ 1IfIt ~
n o
Filll No A-081-4
SCalll - 300
Dra0 DSU Chk41 Jj Dale 23 ftBRUABY 1888PRE-DESIGNED PROPOSED EXTENT 10 14011OF COVER amp CAPPING
nGURB POTTS PROPERTY RIFS No Reftltoo ote
JlUlINGTON NEW CASTIJ COIINJY - llUJAHE
shy _-------- shy
(
Attachment
Evaluation of Impacts on the Christina River
TABLE OF CONTENTS
10 LOADING CALCULATIONS _ ~_bullbullbullbullbullbullbullbullbullbull 1
TABLE Al CHRISTINA RIvER FLOW VOLUME 1 TABLE A2 IMPAcr OF GROUNDWATER ON CONTAMINANT CONCENTRATION IN TIlE CHRISTINA RIvER (ActrrE EXPOSURE) 3 TABLE A3 IMPAcrOF GROUNDWATER ON CONTAMINANT CONCENTRATION IN TIlE CHRISTINA RIVER (CHRONIC EXPOSURE) 4
20 WATER QUALITY STUDIES IN TIlE CHRISTINA RIVER __ S
TABLE A4 RESULTS OF WATER QUALITY SAMPLES IN TIlE CHRISTINA RIvER (uGIL) 6
30 SEDIMENT QUALITY STUDIES ~bullbullbull~ bullbullbullbullbullbullbullbullbullbullbullbullbullbullbullbullbullbullbullbullbullbullbullbullbullbullbullbullbullbullbull 7
TABLE A 5 SELECTED RESULTS OF SEDIMENT SAMPLES FROM THREE STUDIES (MGKG) 8
40 CONCLUSIONS 8
APPENDIX
1 Duffield Tables 8A to 8C 2 Groundwater Discharge 3 Calculation of Dilution of Factors 4 Duffield Table 6 5 Concentrations of Selected Chemicals in Surface Water 6 Surface Water Quality Sample Locations 7 Sediment SampleLocations
1
10 LOADING CALCULATIONS
The Duffield RI Report identified metals and petroleum as substances of potential concern for impact to the river Arsenic lead cobalt copper selenium calcium iron manganese mercury -nickel potassium thallium and zincmiddotare present above expected background concentrations on at least some portions of the site According to the report the transport of metals dissolved in water is the primary mode of migration for metals in the site subsurface soils to the river This fonn of transport is dependent on the types of metal present the texture and geochemical character of the soil the volume of water infiltrating through the soils and the dynamics of the local groundwater flow regimes
The calculation of loading to the river assumes that all shallow groundwater discharges to the river and the total discharge is controlled by the rate of precipitation minus runoff and evaporation The discharge could be either direct to the river on the northeast side of the site or via surface drainage features Using this method Duffield Associates calculated that approximately 17 million gallons of water fall on the 607 acres per year and percolate through the contaminated soil Under the assumptions used in the method this volume of water becomes contaminated at concentrations equal to the average concentration of all of the groundwater wells sampled for the RI Groundwater movement from the site is further qualified by the hydrogeologic properties of the fill soils A Darcy velocity was calculated using the parameters of hydraulic conductivity and hydraulic gradient Using this velocity a flow was then estimated by assuming an average width and saturated thickness of the fill soils
Duffield calculated that the median flow of the Christina River at the site is 523 cubic feet per second Concentrations of contaminants are more critical under low flow conditions State regulations (State of Delaware Surface Water Quality Criteria 1993) recognize three different low flow conditions characterized by duration and frequency as well as the median flow Critical flows are expressed in tenns of days of duration and recurrence interval in years For example the lowest flow of a 7-day duration with a 10-year occurrence interval is known as 7QlO The resulting concentration of the mixed water can then be compared with the Water Quality Criteria for aquatic life and human health established by DNREC Table Al below gives the critical flow relevant to each set ofquality criteria and the result of Duffields calculation of Christina River flow at the Potts Property site
Table Al Christina River flow volume
Critical Flow
Median 30Q5 1Q10 7Q10
IState of Delaware Surface Water Quality Standalds February 1993 2Calculated by Duffield Associates
1
Duffield concluded tha~ after complete mixing with the river water the contaminant contribution from the Potts Property would by itself not cause an exceedence of the surface water quality criteria (See Duffield Tables SA to 8e attached) Based on the data obtained during the RI the shallow groundwater system at the Potts site is indicated to be a perched unconfined aquifer which is hydrologically isolated from adjacent shallow groundwater systems For this reason Duffield assumed that there was no flow through shallow groundwater component at the Potts site
The assumption that discharge to the river is driven by precipitation would not be affected by the drought conditions that caused critical flow in the river is quite conservative The State of Delaware typically assumes that the mixing zone area shall not occupy more than 25 of the receiving water area based on thermal mixing ofline discharges with surface water bodies This regulatory requirement is partially based on ~e assumed differences in density and temperature of the mixed line discharge water and the surface water body Duffield concluded that since the parameters of temperature and density of shallow groundwater at the Potts site and the Christina River are likely to be similar this requirement is not applicable to the Potts site
In order to evaluate the potential loading of inorganic contaminants from groundwater beneath andor adjacent to the shallow groundwater system at the Potts site DNREC estimated discharges from the Columbia and Upper Potomac formations to the Christina River Based on these calculations (attached) groundwater is discharged from the Columbia and Upper Potomac at approximately 222 and 435 cubic feet per day (00025 and 0005 cubic feetsec) respectively Using the formational groundwater quality data obtained from the Halby RI Report and the estimated dilution factors for 1Q10 and 7Q I0 flows the estimated concentrations in the Christina River were compared to the Water Quality Standards (For this calculation DNREC used 25 of the estimated volume of both 1QlO and 7QlO flows) Criteria for both fresh and marine water have been included on Tables A2 and A3 The result of the loading calculation for discharge of contaminated groundwater to the river suggests that neither of the groundwater systems evaluated
bull The Shallow Perched Groundwater System at the Potts Site
bull The Unconfined Columbia Aquifer and the Upper Potomac Aquifer at Potts and Halby
appear to impact surface water quality in the Christina River significantly The contaminant that most nearly approaches its SWQC in fresh water is zinc for chronic exposure However combining the zinc contribution from the perched system (2 ugIL) the Columbia and the Upper Potomoc (21 ugIL) the resulting concentrations in the Christina are below the criterion (59 ugIL)
2
Table A2 Impact ofgroundwater on contaminant concentration in the Christina River (Acute Exposure)
Upper Columbia Potomac Christina SWQS (acute) Formation Formation River
29E+01 0003 5100 5300 60E+01 97E+00 0009 62E+01 0007 22E+01 0003 224000 11600 29E+01 0003 67E+02 0079 6300 15E+01 0002 2000 54E+01 0006 22440005
86E+04 13856
23E+01 0003
26E+02 71 E+OO 360 12E+02
0032 69 0014
17E+00 14E+00 0001 88E+01 179 38E+00
33E+OO 430011 16
39E+03 11000000
78E+03 2290 14E+01 22 54E+04
0002 22E+04 11508
30E+02 53E+02 789 27E+00
0160 75 20
80E+00 0001 300
13E+01 23 12E+01
0004 1400
87E+04 20E+01 0006 2130 49E+03 11367 66E+01 0016
61 E+04 800E+04 659525951 1 Ground water concentration from the Halby RI Report Table E-GW05 2 A blank in columns 2 and 3 indicates that the contaminant was not considered a potential contaminant of concern because of
concentration or frequency of detection A blank in columns 5 and 6 indicates that no Water Quality Criterion has been established by DNREC
middotNo Water Quality Criterion has been established The value is the NOM no observable effects concentration
3
Table A3 Impact ofgroundwater on contaminant concentration in the Christina River (Chronic Exposure)
Columbia Formation
Upper Potomac
Formation Christina
River SWQS (chronic)
29E+01 0003 700 60E+01 97E+00 0007 62E+01 0006 22E+01 0002 29E+01 0003 450 840 67E+02 0063 5000 15E+01 0001 21900 54E+01 0005
86E+04
23E+01
26E+02 12E+02 17E+00 88E+01 38E+00 39E+03-shy14E+01 54E+04 30E+02
80E+00 itbaUiuroEi~L 12E+01 ~ibio~yaha~e 87E+04
71E+00
14E+00 33E+00
8E+03
22E+04 53E+02 27E+00 13E+01 20E+01 49E+03
11106
0002
0026 0011
00004 0009 00004 1835 0001 9224 0128 0001 0003 0005 9111
36 190
50 93
11 066
1
83 71
88 5
012 40
1 Ground water concentration from the Halby RI Report Table EmiddotGW05 2 A blank in columns 2 and 3 indicates that the contaminant was not considered a potential contaminant of concern because of
concentration or frequency of detection A blank in columns 5 and 6 indicates that no Water Quality Criterion has been established by DNREC
No Water Quality Criterion has been established The value is the NOAA no observable effects concentration
4
20 WATER QUALITY STUDIES IN THE CHRISTINA RIVER
Surface water data is available from the Halby RI Report and from studies done for t1te Anny Corps ofEngineers maintenance dredging projects
Surface water data cited in the Halby RI Report shows that a number of contaminants associated exclusively with the Halby Site are present in the lagoon and marsh areas These include ammonia cyanide and thiocyanate Arsenic which is also associated with the Potts Property is elevated in the lagoon and marsh areas Most of the surface water samples for the Halby RI were taken in these contaminated areas However two samples were taken in the Christina River near the 1-495 drainage ditch (sample SW 11 and SW 12) and one in the Lobdell Canal (SW 10) All three had detectable levels ofammonia ranging from 300 to 900 ugIL Arsenic was not detected in any of them A figure showing water contaminant distribution from the Halby RI is attached
Other water quality data IS available from studies performed by the Anny Corps of Engineers for dredging activity in the area of the Port of Wilmington (Final Report Water Quality Monitoring for Wilmington Harbor Maintenance Dredging Operations Winter 1994 prepared by The Greeley-Polhemus Group Inc October 1994) A map of the sample locations is attached
Table A4 below shows analytical results of the EPA and Anny Corps ofEngineers studies with the Surface Water Criteria for Protection of Aquatic Life (chronic) in fresh and marine water Of the five samples the highest concentrations of contamination are found at location SWI0 in the Lobdell Canal At that location however arsenic and nickel were not detected Copper was present at 99 ugIL (estimated) in the filtered sample which is slightly above the SWQC Zinc was present at 117 uglL in the filtered sample All three unfiltered samples from the Halby RI
approach or exceed the standard for iron about two times the SWQC The filtered samples are much lower in iron concentration-below the SWQC
Copper and nickel were absent in all four of the river samples Arsenic was absent in all but location S-1 where it was present at 2 ugIL significantly below the SWQC of 190 ugIL Unfortunately the Halby RI sample analysis for zinc was compromised by contamination in the blank sample but it appears that there is a zinc contribution from the Potts Property which may be transported through the 1-495 drainage ditch and the Lobdell Canal At location S1 where the river water would reflect a more mixed condition than at SWl1 and SWI2 zinc was not detected in two samples
5
I middotmiddotmiddot1
Table A4 Results of water quality samples in the Christina River (uglL)
HALSY RI (1988) middotmiddotmiddotmiddotAiffifcpf9~rgl~r-middot-)1middot~ h-
Parameters SW11 SW10 SW 12 S 1 S 1 Flood Tide Ebb Tide
FILTERED UNFILTERED FILTERED UNFILTERED UNFILTERED UNFILTERED
Suite ofDdawan Surface Water Quality Standards February 1993
NR shy 8Ralysis requested but not reported J - Estimated Some fresh water criteria are calculated using hardness value of SO mglL (- indicates hat no standard has been determined)
R- Rejected L - Lower th8R actual value B - Analyte is found in the blanks as well as a sample K- Higher th8R IICtual value ( bull Estimated value below Contract Required Detection Limit
6
30 SEDIMENT QUALITY STUDIES
In 1995 the Department invetigated sediment contamination problems in the Christina River Sediment samples were taken approximately every 500 feet from near the confluence of the Christina and Delaware Rivers to 15 river miles upstream Contaminants ofconcern at the Potts Site such as arsenic and were found throughout river The mouth of the river where the Potts Property Site is located was identified as one ofeight areas where sediment contamination reaches levels that could impact aquatic life Three samples taken near the Potts Property site were analyzed for some of the inorganic and organic contaminants which have been assooiated with site soils The results are reported in Table AS below and are labeled DNREC samples
Sediment samples were taken for the Halby RI in the lagoon marshes and ditches on the Halby and Potts Sites A limited n~ber were also taken in the Christina River and Lobdell Canal They are designated EPA on Table AS Sediment samples taken in the marsh and ditches on the Potts Property show high levels ofsite related contamination including arsenic cadmium copp~r and zinc (These areas will be remediated as part of the Halby project)
The Army Corps of Engineers Report referenced above also included composite sediment samples from two areas immediately downstream from the Potts Property Site They are labeled on Table A5 as ACE
Sediment contaminant concentrations are compared to sediment quality guidelines known as Effect Range-Low (ERL) and Effect Range-Median (ERM) (See The Potentialfor Biological Effects ofSediment-sorbed Contaminants Tested in the National Status and Trends Program NOAA Technical Memorandum NOS OMA 52 by the US National Oceanic and Atmospheric Administration) At concentrations below the ERL contaminants are not expected to have adverse biological affects Between the ERL and the ERM adverse effects are possible and occasionally occur Adverse affects occur frequently when contamination is present at concentrations above the ERM
The data shown in Table A5 suggests that adverse affects are possible from arsenic lead zinc and copper concentrations in sediment both upstream and downstream from the Potts Property Although the data is limited it appears that the most heavily contaminated sediment immediately adjacent to the river is in the Lobdell Canal There is a significant exceedence of the ERM there for copper as documented in the Halby RI report Sediment in the marsh immediately upstream of the Lobdell Canal sample shows high levels ofarsenic cadmium and zinc It is apparent that there has been transport of contamination in suspended solids from the marsh system to the sediment of the Lobdell Canal The area dredged by the Army Corps of Engineers for the Port of Wilmington from the river has much lower concentrations in sediment
7
Table A 5 Selected results of sediment samples from three studies (mglkg)
Sample Location
Right bank opposite Port of Wilmington
Arsenic
162
40 CONCLUSIONS
This evaluation of impacts of the Potts and Halby Sites on the Christina River considered calculated loading from contamination in the shallow perched groundwater system of the Potts Property Site and in the Columbia and Upper Potomoc aquifers It also reviewed surface water and sediment data from studies performed by the EPA the Anny Corps of Engineers and DNREC
The loading calculations indicated that groundwater at the Potts and Halby sites is a source of zinc contamination in the Christina River However the contribution of the sites to zinc contamination in the river is less than half of the SWQC There is not a known exceedence of any SWQC in the study area of the river There are exceedences for copper and zinc in the Lobdell Canal
The surface water data review showed that the surface water flowing through the drainage system across the Potts and Halby Sites is a probable source of water contamination by zinc and copper in the Lobdell Canal which joins the Christina River These contaminants are not present at detectable levels in center of the river immediately downstream of the Lobdell Canal
8
shy(
Ten sediment samples from locations in the Christina River and Lobdell Canal showed extensive contamination by arsenic lead zinc and copper at levels that possibly affect aquatic life Adverse biological effects are probable in the Lobdell Canal due to copper contamination Sediment contamination in the areas dredged by the Army Corps ofEngineeers is not expected to adversely affect aquatic life
SFJrm SFJ98070doc DE-lOll II B8
9
middot _ _a _ _4 bull _middot_a __ - - shy
DUFFIELD TABLES
8AT08C
~
Table 8A Pre-Remedial Action Impact to Surface Water Quality
Marine and Fresh Water Acute
AQUATIC LIFE NORTH SOUTH NORTH SOUTH
SITE SITE SITE SITE SITE SITE AVERAGE AVERAGEiAVERAGE AVERAGE AVERAGE AVERAGE MARINE ACUTE FRESH ACUTE
PARAMETER I (ugll) (ugll) (ugll) (ugll) (ugll) (ugll) (1 Q 10) (ugll) (1 Q 10) (ugll) Arsenic (III) 1280 1840 140 00541 00389 00030 69 360
PREMIXING POSTMIXING
- -- -- _-- - _ - --- --- - - - 00015- -------- 43- ----~-- ----1--79(4)--shyCadmium 176 194 70 00074 00041
- - ---- __ - -_ -- -_ - -_ -------_-- --shy~_-_
Chromlum(II1Y -- 65 - 65 NO 00003 00001 NO NL 98432 NO ----- ---------1100----- ----- 16---shy
----- --- -- - --- -- - - -__------- -------- -shyef~~-~i~IjlI~ij -- 1~~~0~+-26~~Ori 5~1~0 0~~~3 O~~01 ------ NL NL NL
00082--- -------140----- -----337--8--shy~~~d - ----j_3_l __ ~ 53_ 390 00052 I 00032 bullbull _ _ bull - __ bull ~ __ bullbull bullbull __ 0 bullbull _ _
2~~_~~ryJI_L NO___ _ ND NO ___ _ NO __ I _NO I NO 21 24 ----- _----_- -_ -- --- ---_ ------ - --__ _~-----
00011 75 789~~~el ----~~~o--- ~~~~ 6~~6 ~~~~~ ~~l~~ 01407--- - -- -----95------- --------65~04---
Notes 1 NL = Not Listed 2 NO =Not Detected 3 Apportioned Flow Rate (1 Q 10) = 8516 cubic feeUsecond 4 Numbers in BOLD are calculated freshwater criteria based on an assumed water hardness of
50 mgll (CaCOJ )
5 North Side Max Q (flow rate) = 312798 cubic feet per day South Side Max Q = 309722 cubic feet per day
WO 640EE
EXCEL0640EE4BXLS Duffield Associates IncJanuary 1999
Table 8B Pre-Remedial Action Impact to Surface Water Quality
Marine and Fresh Water Chronic
PREMIXING I POSTMIXING I AQUATIC LIFE
I
NORTH SOUTH NORTH SOUTH SITE SrrE I SITE SITE SITE SITE MARINE
AVERAGE i AVERAGE iAVERAGE AVERAGE AVERAGE I AVERAGE CHRONIC (7010) FRESH CHRONIC IPARAMETER (ugJl) (ugJl) (ugll) (ugll) (ugtl) (ugl) (ugtl) (7010) (ugl)i
lArsenic(llI) 1280 1840 140 00434 00312 00024 36 190Cadmium ---- - 176 1- - - ~ 70 00060 00033 00012----------93------------06-6--(4) shy194 I
- -- ------- ------------ - - I -- I i -- -- - - --- - - - --- - ------ shy
Chromium (III) 65 65 NO 00002 00001 NO NL 1 11732 ------------------ -- --- ------- ------ I ---_ ---- ---- ------------------------------------------
Chromium (VI) 65 I 65 ND 00002 00001 NO 50 11Iron-- ----- - 195800 I 265700 - 56100 66328 45019 i- 0950~5 --- -----NL ---- - ------1-00--0-middot shyLeBeC- -- --- - 123 153 390 00042 I 00026 - 00066- ----- ----56middot--- ---- --------32shyM~~cury(i-I) --- -- ND2 i---ND--- NO ND ND i ND- -----0025middot-------- -----O~012 Nickel------ -7550----1--10370--- 50 --- - - 02558 I 0175700008--- ----------83 ---~--- - ---- 8771 IZlnc 54260--1-78070- 6660--- 18381 1322ffmiddot 01128-----------86------- --------=--
Notes 1 NL = Not Listed 2 NO =Not Detected 3 Apportioned Flow Rate (7 0 10) = 10625 cubic feetsecond 4 Numbers in BOLD are calculated freshwater criteria based on an assumed water hardness of
50 mgtl (CaC03)
5 North Side Max 0 (flow rate) = 312798 cubic feet per day South Side Max 0 = 309722 cubic feet per day
WO 640EE
EXCEl0640EE4BXlS Duffield Associates IncJanuary 1999
Table Be Pre-Remedial Action Impact to Surface Water Quality
Human Health
PREMIXING I POSTMIXING HUMAN HEALTH NORTH SOUTH NORTH I SOUTH i SITE I SITE I SITE SITE I SITE I SITE MARINE IFRESHWATER FRESHWATER HUMAN
ESTUARINEi (Fish Ingestion (Fish and Water HEALTH PARAMETER I (ugl) (ugl) (ugl) (ugl) (ugl) (ugl)
AVERAGEAVERAGEIAVERAGE AVERAGE AVERAGElmiddot AVERAGE (ugll) Only) (ugll) Ingestion) (ugll) CONCERN NL NL I 50 CA 2
I
Arsenic (III) __1_280 1 18401_ 140 00274 00197 I 00015 -- 1middotmiddotmiddotmiddotmiddotmiddotmiddot_- -----0middot- --__shyNL NLmiddot 10 ST 1g~d~ium 1gt _194 ___7deg 00038 j 00021 I 00007
120000middot1 840000 - 3(000 --sr-Chromium (III) 65 65 NO 00001 I 00001 NO Chromium (VI) 65 65 NO 00001 i 00001 NO 590 i _4200_ X70__ ST____ -middoto-- - -_ - - - I I Iron 195800 265700 56100 NL 3 i NL NLI
~~ middotmiddotmiddotmiddotI--~-~~------ ----~k_- -~k-~ea-d----1~3 _- ~_j~3~--~middot~middot3-90_ O0026_l00016_ 00042 ----__ _shy15 71
~-_
2 ST 810 --- -sfoltf---middot middot-middotmiddot~-620-~- -Srshy
- __- ----- shy-yenIIL -ipound f~~~ middotmiddot=~aiij O~f5t=Omiddot~r09 middot1 05 NL NL NL NL
Notes 1 ST (Systemic) = 30 Q 5 2 CA (Carcin~genic) = Median Flow 3 NL =Not Li$ted 4 NO =Not Detected 5 Apportioned Flow Rate (30 Q 5) =16827 cubic feetsecond
Apportioned Flow Rate (Median Flow) =52380 cubic feetsecond 6 North Side Max Q (flow rate) =312798 cubic feet per day
South Side Max Q =309722 cubic feet per day
WO 640EE Duffield Associates
EXCEL0640EE4BXLS January 1999
GROUNDWATER DISCHARGE
Discharge of Columbia and Upper Potomoc Formations
Columbia
where
A =22 fl x 1600 fl
K = 42 ftIday
dh -= 00015ft1ft dl
Q = 222 cubic feetday =00025 cubic feetsecond
Upper Potomoc Formation
where
A =25 ft x 1600 ft
K = 87 ftIday
~~ =000125 ftlfl
Q =435 cubic feetday =0005 cubic feetsecond
to the Christina River
[Darcy Law]
[cross sectional area of discharge] Halby RI Report Figure 5-1
[hydraulic conductivity] Halby RI Report page 3-45
[hydraulic gradient] Halby RI Report Figure 3-13
[Darcy Law]
[cross sectional area of discharge] Halby RI Report Figure 5-1
[hydraulic conductivity] Halby RI Report page 3-45
[hydraulic gradient] Halby RI Report Figure 3-15
( Lower Potomac Water-Bearing middotUnit Representative groundwater levels in the lower Potomac water-bearing unit are shown in figures 3-17 and 3-18 maps from all rounds of water-level measurement are in Appendix C The groundwater appears to flow primarily to the south The average hydraulic gradient in the lower Potomac is 00014 ftft The groundwater-flow direction and average hydraulic conductivity are consistent with those reported by EBASCO (1990) At least one water-supply pumping center is located about 2 miles south of the site pumping at this location probably is affecting water levels in this unit beneath the study area
Water-level maps for September 24 1993 and for February 3 and March 11 1994 show a slight diversion in flow direction to the southeast in the southern part of the study area Groundwater in the lower Potomac may be diverted to the southeast if pumping south of the site is suspended temporarily In this case groundwater in the lower Potomac would be expected to flow toward the southeast and potential discharge into the Delaware River or toward pumping centers in New Jersey east of the river The flow diversion toward the southeast may be observed only in the southern part of the study area because in the northeastern part of the study area (near wells SMW-12 and IMW-12) the lower Potomac appears to be nearly truncated by low-permeability Recent sediment The sediment would restrict or even prevent flow in this unit toward the east in the northeastern part of the study area
3534 Hydraulic Characteristics
A previous investigation (EBASCO 1990) estimated the hydraulic conductivity in the study area the results are in Table 3-5 The current RI estimated the hydraulic properties of wells at either three or four locations in each water-bearing unit The hydraulic properties are shown in Table 3-6 Data from the individual tests are in TM 3 Monitoring-Well Installation in Appendix A
The ranges and geometric means of the hydraulic conductivity for each unit using the data in tables 3-5 and 3-6 are
bull Columbia Range 092 to 12 feet per day (ftJday) Geometric mean 42 ftJday
bull Upper Potomac Range 11 to 32 ftJday Geometric mean 87 ftJday
bull Lower Potomac Range 018 to 43 ftlday Geometric mean 14ftJday
--
3-45
~ bullbull
CALCULATION
OF
DILUTION FACTORS
Dilution Factor Calculation
OF (dilution factor) =River flowgroundwater discharge
7010 (chronic exposure)
= 025 10625OF (Columbia) 00025
= 10625
025 10625OF (Potomoc) = 005
= 5312
1010 (acute exposure)
= 025 8516DF (Columbia) 00025
=8516
= 025 8516DF (Potomoc) 0005
= 4258
Note Dilution factors are calculated using 25 of the volume of the river flow to reflect partial mixing of the groundwater discharge with the river
bull I bull Tabl
Computed and Apportioned Critical Low Flows In the Christina River at the Potts Property Site
Station Name 01478000 01479000 01479197 01480015 01481500 Total Location Christina llhite Clay Mill Creek Red Clay Brandywine
Upper Drainage Area 2050 8910 366 5240 31400 47966 Square Miles Computed Median 1300 7600 150 5000 33200 47250 CFS Computed 7010 170 1500 012 1000 7200 9882 CFS Computed 1010 046 1300 010 600 6200 8156 CFS Computed 3005 330 2460 037 2100 10500 15427 CFS
Lower Drainage Area 5493 521 1021 209 553 7797 Square Miles Percentage 26795 585 27896 399 176 1626 Apportioned Median 3483 444 418 199 585 5130 CFS Apportioned 7010 456 088 033 040 127 743 CFS Apportioned 1010 123 076 028 024 109 360 CFS Apportioned 3005 884 144 103 084 185 1400 CFS
Total Drainage Area 7543 9431 1387 5449 31953 55763 Square Miles Median Flow 4783 8044 568 5199 33785 52380 CFS 7010 Flow 626 1588 045 1040 7327 10625 CFS 1010 Flow 169 1376 038 624 6309 8516 CFS 3005 Flow 1214 2604 140 2184 10685 16827 CFS
WO 0840EE Duffield Aaloclatea Inc
EXCEL0640EE3XLS September 1988
Table E - GW05 Offslte Groundwater Concentration Calculations
Halbv Chemical Site
Chemical
Ranae of Detected Values Maximum MinImum
Value Value (uaL (uaU
Normal Mean (uQL)
Normal Standard Deviation
Transformed Mean tuaIL
Transformed Standard Deviation
H Statistic
Results of
W-teat
Normal 95 UCL
(ualU
Lognormal 95shy
UCL hiaIL)
MaxImum or
95UCL (uQL
Columbia Water-Bearlna Unit Volatllbullbull Benzene 10E+OO 10E+OO 29E+01 71Et01 21EtOO 14EtOa 1BEtOO I 66EtOl 96Et01 10EtOO 2-Butanone 18Et02 15Et02 32Et01 62EtOl 22EtOO 13EtOO 18E+OO t 64E+Ol 10Et02 10E+02 Carbon disullide 2 1Et02 10EtOO 60EtOl BBEtOl 28EtOO 18EtOO 24EtOO I 11Et02 11Et03 21 Et02 t 1middotDlchloroethane 35Eit02 34Et02 62EtOl t3Et02 24E+OO t6EtOO t8EtOO I t3Et02 32Et02 32E+02 1 ImiddotDlchloroelhene 11 Et02 96EtOl 22EtOl 38E+Ol 22EtOO t 2EtOO tBEtOO t 42E+01 54E+01 54E+Ol Tetrachloroethene 50E+OO 60E-Ot 29EtOl 71E+Ol t9EtOO 16EtOO 41EtOO I 66E+Ol 16E+02 50EtOO Toluene 66Et03 90E-Ol 67E+02 19Et03 25EtOO 27EtOO a5EtOO I middot17E+03 96E+04 66E+03 Trlchtoroethene 12Et02 10E+OO 15E+Ol 33EtOl 16EtOO 13EtOO 35EtOO l 32EtOl 49E+01 49E+Ol Vlnvl chloride 23E+02 79EtOl 54EtOl 90EtOl 27EtOO 16E+OO 41EtOO I tOE+02 40E+02 23Et02 Pesticide Aldrin I 14EmiddotOl I 14E-01 I 35Emiddot02 I 33E-02 I -35EtOO 50E-Ot 22EtOO I 52E-02 45E-02 52E-02 InorRanlcs Ammonia 39Et05 27Et03 86Et04 15Et05 34Et03 16Et03 66EtOO l 21E+05 14Et07 39E+OS Antimonv 20EtOl 20E+Ot 23E+Ol B5EtOO 30E+OO 48E-Ol 21EtOO I 27E+01 32Et01 20EtOl Arsenic 14Et03 27EtOO 26Et02 52E+02 35EtOO 21EtOO 52EtOO L 53Et02 88Et03 14Et03 Barium 54Et02 22EtOl 12Et02 17E+02 3BEtOO 16EtOO 40E+OO L 21Et02 96Et02 54Et02 Bervlllum 40E+OO 53E-Ol t7E+OO 14E+OO -12Emiddot02 12EtOO 33EtOO I 24E+OO 6BEtOO 40EtOO Cadmium 57Et02 B9E+OO aaEt01 20E+02 1BE+OO 21EtOO 52EtOO I 19E+02 14Et03 57Et02 Chromium 12EtOl 26E+OO 38EtOO 3 I E+OO 11 EtOO 75E-Ol 25E+OO I 54E+OO 6BEtOO 68EtOO Cobalt 14Et04 5BEtOO 39Et03 54Et03 56EtOO 35EtOO a3EtOO L 67E+03 NA 14Et04 Cvanlde 48EtOl 14E+Ol 14Et01 17Et01 22E+OO 93E-01 41E+OO I 28E+Ol 73EtOl 48Et01 Manaanesamp 18Et05 91E+Ol 54Et04 76Et04 8BE+OO 27EtOO 6SEtOO L 93E+04 47Et07 1BEt05 Nickel 96Et02 98E+OO 30Et02 41Et02 41EtOO 21E+OO 52E+OO L 52E+02 16E+04 96Et02 Silver 28Et01 l4EtOl 80EtOO 10EtOl 1AEtOO 12EtOO 34EtOO L 13EtOl 30EtOl 28E+01 Thallium 64EtOl 68E+OO 12EtOt 19EtOl 1tEtOO 19EtOO 48EtOO L 22Et01 33Et02 64Et01 Thlocvanate 28EtOS 20Et02 87Et04 11EtOS 82EtOO 42EtOO 17Et01 N 1BEt05 NA 18E+05 Zinc 22Et05 76E+01 61Et04 B9Et04 73EtOO 44E+OO IOEtOl I 11E+OS NA 11Et05
Upper Potomac Water-Bearing Unit Volatllbullbull Carbon disulfide I 71E+01 I 71EtOl I 97EtOO I 1BEtOt I 18EtOO I 71E-01 I 24E+OO I I I 18EtOl I 12EtOl I 18EtOl Inoraanlcs Ammonia 78E+04 20Et02 16Et04 2BE+04 96E+02 26Et03 87E+OO L 37Et04 9 1EtOB 78E+Q4 Arsenic 32Et01 1BE+OO 71E+OO 94EtOO 13EtOO 12EtOO 32E+OO l 12Et01 23EtOl 23E+01 Bervllium 45E+OO 81Emiddot01 l4EtOO 14EtOO -35E-Ol 13EtOO 34E+OO I 20EtOO 60EtOO 45EtOO Cadmium 13E+Olmiddot 13EtOl 33EtOO 33EtOO 94E-01 B3E-01 23EtOO I 48E+DO 46EtOO 48E+OO Coball 49Et04 51EtOO 7BEt03 17Et04 50E+OO 39E+OO 87EtOO L 16E+04 NA 49Et04 Manoanese 9BEt04 70Et01 22E+04 33E+04 83EtOO 25EtOO 57EtOO L 38E+04 46Et06 98Et04 Nickel 29Et03 38EtOO 53Et02 10Et03 38EtOO 25EtOO 5BEtOO I 10Et03 66Et04 29Et03 Selenium 80EtOO 70E+OO 27EtOO 24EtOO BSE-01 91E-Ol 27E+OO l 39EtOO 57EtOO 57EtOO
filename GRNDWROFXLS 112796 works 95 UCLOF Par 1 of 2 730AM
Table E - GW05 Offslte Groundwater Concentration Calculations
Halby Chemical Site
ChemIcal
Ranae of Detected Values Maximum Minimum
Value Value Normal Mean
Normal Siandard Deviation
Transformed Transformed Siandard
Mean Deviation H
Slatlslle
Results
0Wmiddotles
Normal 95 UCL
Lognormal 95 UCL
Maximum or
95UCL luaL lualU lualU luaIL luaIL luaIL luaIL
Sliver 13E+02 19E+01 13E+01 33E+01 12E+OO 15E+OO 3 E+OO I 28E+01 46E+01 46E+01 Thallium 21E+02 3SE+OO 20E+01 57E+01 87EmiddotOl 19E+OO 4 E+OO I 46E+01 18E+02 18E+02 Thlocvanate 29E+04 11E+02 49E+03 11E+04 60E+oo 25E+OO 8 E+OO L 13E+04 30E+07 29E+04 Vanadium 82E+02 69E+OO 66E+01 22E+02 16E+OO 20E+OO 46E+OO I 17E+02 42E+02 42E+02 Zinc 36E+OS 10E+01 80E+04 13E+05 65E+OO 45E+OO 10E+01 I 14E+05 NA 14E+05
L bull lognormal distribution based on wmiddottest results N bull Normal distribution based on wmiddottest results I bull Inconclusive based on wmiddottest reSUlts Maximum UCl 0 either the normal or lognormal (not to exceed maximum concentration) used per guidance rom Nancy Rlos-Jaolla I Nil bull Could not be determined based on distribution
flename GRNDWROFXlS 730AMworksheet 95 UCLOF Page 2 of 2
112796
DUFFIELD TABLE 6
Table 6 WATER QUALITY DATA
Christina River Vicinity of 1-495 Crossing
DATE
Water
Temperature DC
pH
Total Total Hardness Suspended
mgll Solids mgI
Specific
Conductivity (25C) uSem
(field)
Specific
Conductivity (t) uScm
(calc)
Rt Temperature
Factor ISalinity ppt ISalinity ppt IFresh or
(calc) (field) Marine (1
9511114 6 _ - _ 95112112 1
- -shy 9601130 3 --- 960213 3
- -shy - shy _ -shy - 96031~ 35 9604ha _ ----shy
14 ---9605hj-- shy 14 _-shy 24960611 - 9607i1Ef shy
---- shy24
-96JCi918 shy ---19shy -
_ 961119 shy_ bullbull __ bullbull ___0
9 -970114 -shy
4 _____ bullbull _
1 --9770318 - shy
__ __shy _ 76
- 970528 _shy__--_ ~
18 - middot9707115shy
- __-_ -shy -shy28
- 970916shy--_--- _shy
23 - - -97i111a ----7----shy
72 64 42 110
71 94 24 118 62 68 46 105
68 80 8 114
51 80 28 152 67 80 12 175
- - - ---- shy
73 70 15 175 84 3157 22 - -shy shy - shy - -shy _shy ---shy
74 78 27 190 77 98 49 348
- _ - - __ A - - bull
72 74 14 120 73 106 9 165 78 76 13 268
-~- -shy shy - _ - _ -- shy -----shy -- 73 82 16 253
- --- --shy -shy -- 83 248 19 1767 -shy - _ ~ - -- --shy -shy78 336 36 2618
- 21fi - -shy ---_ _shy ----1577--shy71 25
70081 639088 60879
660972 895812 1382325- ---~ _ -
1382325 3089835
186371 - - _- 3081192 - -
83328 ~
89364 17893268
-----_ -shy _ shy2191739 18682491_-_ _shy -shy
25179924 _shy ----shy10348274
0001633 - ------shy
0001489 __ bull ___ 4 _ bull
0001419 000154 - -_ -shy
0002087 0003221
- _ -shy ~ -shy -0003221 00072
0-004343 - -shy - -shy -----
000718-----__- _- 0001942 0002082
-shy _- --_ _-shy000417 -- --- - _-shy
0005107 0043535 - -shy _ -shy0058675 0024114-shy
-
-10536174 - -shy -shy
-1810657 -shy ---shy
-1489573 ---shy _ __-
-1489573 _--__- -14132973
_ --
-10164668 ----gt-------shy
-10164668 785477300shy
----__-shy785477396-shy ------_shy
3756574 [6459903shy- ~18~10657-
--~840Y9444 -
middot266095747 -107364768shy___ shy -----shy
708215297 --91911765shy
0022299 0 F F0006963 0 F0010908 0 - -_ -- - - -
0013148 0 F - - -shy -
F0025182 0 0 F0078651
_-----~-- 1=shy0078651 0 0206749 0 F --OT29361 shy
0 F-----_shy -- -=- _ 0194391 0
6~035956 -- F-shy
0 --- - shy
0017586 2 F ---_ --shy - _shy - -shy F---middotshy0084657 0 ----__--shy - shy - -_ --middotmiddot-F-shy0137056 01
----shy -----shy - Fmiddot shy122597 09
- --__-- -shy - -1=-shy1654113 14 0612462 -O~8 ----Fshy
NOTES 1 DC =degrees CelsiUS 2 mgll =milligrams per liter
3 uScm =micro Siemens per centimeter (uSem at 25degC) which is equivalent to micro mhos per em (umhoslcm at 25degC) 4 Rt =Ratio of the sample conductivity at original sample temperature divided by the condutivity of standard seawater
at a salinity of 35 and a temperature of 15DC (lewis 1980 Hill et AI 1986 APHA 1989) 5 ppt = parts per thousand 6 Christina River water quality data obtained from the State of Delaware Department of Natural Resources and Environmental Control
(DNREC) Watershed Assessment Section Christina STORET No 106291 CONRAil BRIDGE (near Port of Wilmingtonll-495 crossing)
wo 640EE Duffield AIOCItea Inc
EXCEl0640EE5XlS September 1998
CONCENTRATIONS
OF
SELECTEDCHENllCALS
IN
SURFACE WATER
--
I~(
v
I - eM
1CAd fn
lEGENgt ~_IE aIlfAQ-WAWI __ LOCATIClH
__ HOlIIi__
yCHII _T ~_
+-- HOiIaampR _
bull IE_ ulCTIClH DO INJIlOST -a
HOlEl ALL UNITS _ WIalOGIUMIAllEftr-~
LJ ~ ~=COAC~~ _DE~-
8 bull CHMICAL DElEClED AIIClClAlIO -u IG bull NIlT DElECIEIi bull HOT AVALAILpound
M-UU_TR=C_R MCIlEATIClHM CAI_1-shyPlAJ ~ fJIlAJ a1 Du
3-U to~ Ul 12-0 -a_a1IIll ~
F9Se 4-11 CONCENTRATIONS OF SELECTED CHEMICALS IN SURFACE WATER bullbullbulli_bull -1
Hdly 0lIRicII Si8 G1llIDll3 17-AN-1l97
--
SURFACE WATER QUALITY
SAMPLE LOCATIONS
~
~J~ IEIJ~ ~~ jf
if ~~ ~ ~ WILMINGTON HARBOR 1 ~lDISPOSAL AREA
~~~ Jt EDGEMOOR ~~~ if
1amp DISPOSAL AREA
l raquo~~ j ~q ~~ Jf We Siroctu
gtfftJ ~
I ~~ I ~~~ Markor Ugh ~ S1 ~~ I OUll( _ ~
f lt~~~ num 0TT1
Cti$I ft
Te QJ -c ~ II
ii ~
~
~rtr I
cf ~
Ir- _fb- Surface Water Quality Sample Locations SPRING CITY PAI1lMJ
tMlflllHMEHTAl (215)9484700 SERVICES(See Table A4)
SEDIMENT
SAMPLE LOCATIONS
---
I
if ~ t
$ Q
II II
II
1I I
Key
bull Sediment composite sample polnta
bull Bulkwater sample
EDGEMOOR
DISPOSAL AREA
jE
I
QJ ~ ~
tr
~ _lbshyshy
~~
fJ~ ~~ if ~~ 3~ N HARBOR ~ WILMINGTO AREA (it~~ DISPOSAL
j ~~t
~~ fmiddot1 ~~~ jlV gtO~ gt-gt~~ jf
~ l ~~~ jf Weir Structure I $ raquo fJ~V -~~
I I lb--
1 ----ft_-1 ~~~ Marker Light II - II I
6 I~ OV~lall bull ~ ~
bull I 1 IDNIlECj ~ioiiiiilucJ~(STATION 2 I CJ
I IS(ACE) ra 11bullbull
I I
I
SPRING CITY PAI1lMISediment Sample Locations tNVIRONMEHTAl (215)940middot4700
(See Table AS) SERVICES

TABLE OF CONTENTS
10 INTRODUCTION 1
20 SITE DESCRIPTION AND HISTORY 1
30 THE RELATIONSHIP BETWEEN THE HALBY AND POTTS PROPERTY SITES 2
40 REMEDIAL INVESTIGATION 3
41 SOIL AND GROUNDWATER 3 42 CHRISTINA RIvER 4
50 SITE RISK EVALUATION 4
51 APPLICABLE STANDARDS 4 511 Soil Groundwater and Sediment 4
512 Surface Water 5
52 RISKS ASSOCIATED WITH IMPACTS OF CONTAMINATION ON SOIL AND GROUNDWATER 6 53 RISKS ASSOCIATED WITH POTENTIAL IMPACTS ON THE CHRISTINA RIvER 6
60 REMEDIAL ACTION OBJECTIVES 7
61 QUALITATIVE OBJECTIVES 7
62 QUANTITATIVE OBJECTIVES 7
70 EVALUATION OF POTENTIAL REMEDIAL ALTERNATIVES 7
71 CONTAMINATED SOIL (OTHER THAN PETROLEUM PRODUCT) 7
711 Screening Criteria 7
712 Further Evaluation 8 72 EVALUATION OF POTENTIAL REMEDIAL ALTERNATIVES FOR PETROLEUM PRODUCT IN SUBSURFACE SOILS 11
80 REMEDIAL PLAN 11
90 PUBLIC PARTICIPATION 12
91 PUBLIC MEETINGS 12 92 PUBLIC COMMENT AND RESPONSES 12
921 Comments from Eastern Environmental Law Center March 23 1999 12
922 Comments from Wilmington Waterfront Watch February 19 1999 14
100 DECLARATION 15
FIGURES
1 Site Area Sketch 2 Halby Site Selected Remedy 3 Estimated Extent of Free Petroleum Product 4 Potts Property Proposed Extent of Cover and Capping
TABLES
Table 1 Comparison of Remedial Alternatives for Site Soils
ATTAcHMENT Evaluation ofImpacts on the Christina River
1
comer of the site and is fed by a drainage ditch extending along the railroad tracks Historical photos indicate that virtually all of the Potts Property was tidal wetlands before extensive filling which began prior to 1915 The wetlands and drainage ditches now total about fourteen acres
The Lobdell Canal was constructed in the mid-1880s Apparently some material from the canal was placed on the Potts Property
Land use in the area is predominantly heavy industrial However there are two residences on Terminal Avenue approximatey two hundred feet from the Potts Property The location of the residences is shown on Figure 2 There is a residential neighborhood near the intersection ofIshy495 and Terminal Avenue approximately 2500 feet to the west of the site All residences are served by the public water supply
Historically several industrial facilities have operated on the site and in the immediate area The Halby Superfund Site the former location of a chemical production facility is immediately adjacent to the Potts Property on the southwest Features of the Halby Site are shown on Figure 2 The Pyrites Company Inc operated an ore refining facility on the Potts Property from 1916 to 1974 The Lobdell Car and Wheel Company operated a railroad wheel manufacturing plant immediately southeast of the Potts Property from 1881 to the 1940s
The ore refining facility was demolished over a period of time ending in the 1970s Since then the Potts Property has been used for parking and materials storage Most notably large quantities of petroleum coke in unconfined piles were stored in two different areas of the site until 1997 Presently a concrete rubble recycler operates between Christina Avenue and the Conrail tracks A pallet wood recycler also began operation on the parcel between the Christina Avenue and Christina River At this writing the business owner is under an enforcement action to cease operations and remove woodpiles
30 THE RELATIONSHIP BETWEEN THE HALBY AND POTTS PROPERTY SITES
Plans for the Halby Site located immediately to the southwest of the Potts Property are documented in the Record of Decision (ROD) issued by the US EPA in March 1998 The EPA has been involved in the investigation of the Halby Site since 1984 During this time the EPA successfully eliminated immediate risks caused by the chemical production and storage facilities and carbon disulfide contaminated soil on the Halby Site In general the objective of the EPAs remedial plan is to restore the Halby Site to use as an industrial facility while controlling the remaining health and environmental risks through a combination of removal containment and institutional controls
The investigations performed by EPA suggested that some contaminants notably arsenic in soils originated at the industrial operations formerly located on the Potts Property or the adjacent Lobdell plant Apparently waste material containing elevated levels of arsenic was used for fill on part of the Halby Site The chemical production facilities located on the Halby Site contributed to arsenic contamination too however The highest concentrations of arsenic on the Halby site are thought to have originated with the chemical plant on the Halby Site
2
As part of its project the EPA investigated the presence of arsenic in the soil of residential neighborhoods and a public park near the Halby and Potts sites The Halby remedial plan includes the removal of a small area of arsenic contaminated soil on a residential lot adjacent to the Halby Site No elevated levels of arsenic were found in the other residential areas
The chemical production facilities located on the Halby Site discharged liquid waste to a lagoon located immediately to the east of the Conrail tracks and adjacent to the Potts Property The lagoon drained to the Christina River via a network of ditches and natural wetland areas on Potts Thus substances originating from the Halby Site contaminated the Potts Property As part of its investigation the EPA performed extensive sampling of water and sediment in ditches and marsh areas The EPA remedial plan for the Halby site includes removing sediment from ditches on the north side of the Potts Property and filling approximately 7 acres of contaminated Potts Property wetlands The hydraulic function ofthe existing wetlands will be replaced with an engineered system using surface grading storm water retention and outfall structures Federallaw requires the creation or enhancement of wetlands offsite to compensate for the natural wetlands lost on the site through this remedial action Due to the environmentally degraded condition of the onshysite marsh and its surroundings the off-site creation of wetlands preferably within the Christina River watershed will provide a wetland habitat of better ecological function and value
Since the EPAs ROD addresses the wetlands area of the Potts Property this area will not be addressed under HSCA However construction for the remediation of the Potts Property must be compatible with the storm water management system to be designed as part of the Halby project Figure 2 shows the EPAs selected remedy including back filling wetlands and paving on the Halby Site
The EPAs remedial plan for the Halby Site also addressed groundwater impacted by site related contaminants It includes institutional controls (implemented by DNREC) to prevent the placement of water supply wells which might be contaminated It also acknowledges that groundwater from the Halby Site apparently moves beneath the Potts Property toward the Christina River Impact to the river from this groundwater contamination will therefore be addressed as part of the remedial plan for the Potts Property site
40 REMEDIAL INVESTIGATION
41 Soil and Groundwater
Duffield Associates consultant to the PRPs performed the Remedial Investigation of the Potts Property under a work plan approved by DNREC The investigation began in July 1996 and consisted of three phases For the first and second phases sixty-four soil samples were taken from 9 soil borings and 19 test pits Eight temporary wells were constructed and sampled three permanent wells constructed for the Halby Site project were also sampled
The first two phases of investigation were designed to determine the extent and character of soil and groundwater contamination by substances associated with the known past activities on the Site Surface and sub-surface soil samples were analyzed for metals (arsenic lead cobalt copper calcium beryllium iron manganese mercury nickel selenium thallium zinc and cadmium) semi-volatile organic compounds (SYOCs) and volatile organic compounds (YOCs) including benzene ethylbenzene toulene and xylene
3
During the collection of subsurface samples a thin layer of petroleum product was discovered on the southwest side of Christina Avenue Consequently a third phase of investigation was begun to determine the source and extent of this contamination Thirty-one soil samples were taken from 28 test pits Figure 3 shows the estimated extent of the petroleum contamination
42 Christina River
DNREC supplemented the Duffield RI Report with its own evaluation of site impacts on the Christina River It is attached to the Final Plan and provides more detail than the summary here
The Duffield RI Report evaluated the migration of dissolved metals in shallow ground water at the Potts Property to the Christina River In order to assess the potential impact on the Christina River from shallow groundwater at the Potts Property Site based on the data obtained from the RI site parameters regarding the movement of groundwater from the site to the river precipitation runoff infiltration and the hydrogeological characteristics of the fill material were estimated The resulting worst case calculation of contaminant loading to the river was combined with the flow rate of the river at low flow conditions to estimate the concentrations of select metals in the river water
Groundwater contaminated by the Halby Site also reaches the Christina River The potential contaminant contribution from Halby was not included in the RI report DNREC has estimated the impact to the Christina using groundwater data from the Halby Site investigation
Impacts to the river can also be evaluated by sampling river water and sediment The analysis of water indicates current impact on river water quality both of the site and other sources Analysis of sediment samples reveals the history of contaminant discharges to the river Direct sampling of river water and sediment was not part of the Remedial Investigation performed by Duffield Associates However DNREC has been able to assemble adequate data from other studies to evaluate current water and sediment quality conditions
50 SITE RISK EVALUATION
Environmental and health impacts of contamination present on the site were evaluated by comparing the concentrations of chemicals present on the site to standards developed or recognized by DNREC These standards were developed to provide consistency among the level of contamination at a site the degree of cleanup needed and the long-term use of the property Applicable standards for the Potts Property Site risk evaluation are described below
51 Applicable Standards
511 Soil Groundwater and Sediment
The screening standard for site soils and groundwater is from the Remediation Standards Guidance (DNREC February 1998) Application of this guidance requires the development of objectives related to the long-term use of the site and the suitability of site ground and surface water as drinking water supplies
4
The proposed long-term use of the Potts Property is as an industrial site This is consistent with its current zoning and surrounding land uses This risk evaluation then assumes that future exposure to site contaminants by human beings will be in an occupational setting Therefore the restricted use Uniform Risk Standard (URS) would be applicable Furthermore since the Potts Property will be included in a Groundwater Management Zone developed as an institutional control for the Halby Superfund Site and the Christina River does not serve as a drinking water supply the URS for Non-Critical Water Resource Area would apply
The Remediation Standards Guidance contains a URS list for contaminant concentrations in sediment Sediments in the lower Christina River are commonly contaminated with zinc and arsenic from a variety of sources The concentrations frequently exceed the URS screening level Therefore the evaluation of sediment contamination considered informal guidance developed by the US National Oceanic and Atmospheric Administration (NOAA) and published in 1991 The guidance uses two thresholds of chemical concentration--the Effects Range-Low (ER-L) and the Effects Range-Median (ER-M) to identify three ranges of potential adverse biological effects At concentrations below the ER-L no effects are apparent Between the ERshyL and the ER-M adverse effects are possible Above the ER-M adverse effects are probable The guidance cautions that the measurement of adverse effects is subjective and the threshold values do not represent official NOAA standards In addition the guidance was developed from a number of studies including marine and estuarine conditions as well as relatively fresh water conditions like the Christina River
512 Surface Water
The applicable standards for evaluation of surface water are found in Surface Water Quality Standards (DNREC 1993) The Standards designate desired beneficial uses of streams in the state and establish chemical specific surface water quality criteria (SWQC) depending on that designation and other stream characteristics The criteria are for the protection of aquatic life (further broken down into fresh and marine water and acute and chronic effects) and for the protection of health of humans consuming fish andor water The Christina River at the Potts Property is designated for the following uses
bull Industrial water supply bull Secondary contact recreation (wading boating fishing) bull Fish aquatic life and wildlife bull Agricultural water supply
The Department does not expect that it will be used for primary contact recreation (swimming) public water supply nor is it designated to be of exceptional recreational or ecological significance Fish from this part of the Christina may be consumed by recreational or subsistence fishermen However the criteria for Potts Property related substances (which are inorganic) are generally lower for protection of aquatic life rather than of human health Therefore the criteria for the protection of aquatic life would apply
There are several substances at the Potts and Halby Sites for which there are no SWQCs In some of these instances comparison has been made to lowest observable effect levels established as guidance by NOAA
5
52 Risks Associated with Impacts of Contamination on Soil and Groundwater
Arsenic is widespread on the site and present at concentrations that warrant concern in an industrial land use setting In nine borings surface soil samples were analyzed for arsenic lead and other metals The average concentration of arsenic was 226 milligramskilogram (mgkg) compared to the relevant DRS of 61 mgkg Of 28 total surface soils sampled from both borings and test pits eight exceeded the 610 mgkg level (ten times the URS) The Remedial Investigation report states that no general patterns were observed in the distribution of arsenic in surface soils Arsenic in sub-surface soils is present at somewhat higher concentrations than surface soil The average of samples taken in borings is 244 mgkg
The applicable URS for lead is 1000 mgkg Two samples of surface soil substantially exceed this level Lead is elevated above background levels throughout the site Other inorganics do not appear to contribute to human health risks at the site
The third phase of the Remedial Investigation focused on petroleum product contamination in subsurface soil on the western portion of the site between Christina AvenUe and the Conrail tracks A layer of phase separated petroleum product varying in thickness from a sheen to about 1 inch was found to be present over an area approximately 100 by 400 feet The petroleum product was identified as weathered No2 fuel oil motor oil or lubricating oil and may have come from a tank or other vessel that was buried with the fill material
Groundwater samples taken from the Columbia and the Upper Potomac aquifers showed widespread contamination by site related organic and inorganic chemicals The Groundwater Management Zone established as part of the EPAs Halby Superfund project has eliminated the risk to human health by restricting use of this water
53 Risks Associated with Potential Impacts on the Christina River
None of the river water samples available exhibited exceedence of the relevant Surface Water Quality Criteria of the State of Delaware Samples taken in the Lobdell Canal and the 1-495 drainage ditches exhibit exceedences of the criteria for copper zinc and lead Ammonia is also present at significant levels in the canal and ditch water although there is no SWQC for ammoma
The site as well as other upstream sources has apparently affected sediment in the Christina River Sediment samples taken by the EPA for the Halby Site from the wetlands ditches Lobdell Canal and three samples in the Christina River all exceed the URS for zinc arsenic and copper They are also found to exceed the Effects Range-Low in the river near the site for arsenic lead zinc and copper The three sediment samples taken in the Lobdell Canal exceeded the Effects Range-Low for zinc and Effects Range-Median for copper The extent of exceedences of the Effects Range-Median is limited to the canal This has lead DNREC to conclude that sediment contamination in the canal is not a significant impact on the river The Army Corps of Engineers dredges the Port of Wilmington to maintain the channel depth The dredged area extends to the Lobdell Canal Samples taken from the dredged area show a significant reduction in sediment contamination See the attachment for more detail
60 REMEDIAL ACTION OBJECTIVES
The Regulations require that objectives to be clearly established for actions taken under HSCA Objectives should consider current and potential land use resource use proximity of human populations use of surrounding properties and the level of contamination of surrounding properties Qualitative objectives describe in general terms the ultimate result of remedial action Quantitative objectives define specific levels of remedial action to achieve protection of public health welfare and the environment The following objectives have been established by DNREC and are also consistent with the EPAs objectives for the Halby Site
61 Qualitative Objectives
bull To restore the Potts Property for industrial use as is consistent with its zoning and the surrounding land uses
bull Limit exposure to site soils contaminated by metals or petroleum products bull Eliminate or reduce impacts to the river from contaminated site soils through soil loss
erosion infiltration and discharge
62 Quantitative Objectives
bull Eliminate exposure of workers on the site to soil with concentrations of arsenic greater than 38 mglkg or lead greater than 1000 mgkg (The proposed cleanup level has been selected to be consistent with that established by the EPA for the Halby Site Arsenic at 38 mglkg in surface soil corresponds to an increased lifetime cancer risk of 1 in 10000 according to EPAs guidance)
bull Eliminate the mobility of petroleum product beyond its present boundaries bull Reduce the discharge of contaminated shallow groundwater to the Christina River by 75
(as projected by the method described in the RI Report by Duffield Associates)
Note that components of the EPA remedial action will significantly reduce the migration of contaminated sediments from the site to the Christina River and Lobdell Canal
70 EVALUATION OF POTENTIAL REMEDIAL ALTERNATIVES
71 Contaminated Soil (other than Petroleum Product)
711 Screening Criteria
To meet the remedial objectives for site soils the following remedial alternatives were screened for contaminated surface and subsurface soil
bull No action bull Containment with capping or covering bull Removal and off-site disposal
7
Initial screening of remedial alternatives under HSCA (Section 9 of the Regulations) is based on (1) Effectiveness in meeting cleanup levels for the protection of public health welfare and the environment and (2) Acceptable engineering practices (applicability feasibility reliability and cost effectiveness)
The no action alternative is not effective in meeting the cleanup levels and was therefore eliminated from further consideration
Containment of site soils is an acceptable engineering practice and is potentially effective in meeting cleanup levels It also meets the objective of reducing the discharge of shallow contaminated groundwater to the river It is retained for further consideration
Removal and off-site disposal of fill material from the entire site (approximately 700000 cubic yards in volume) would meet clean-up levels but would involve inapplicable or infeasible engineering practices including demolition of site buildings arranging for disposal of the material and replacing with clean fill The cost of disposal (estimated at $35 million) and clean fill replacement ($98 million) render this alternative not cost effective However removal and off-site disposal of the free phase petroleum product is a potentially feasible and effective engineering practice
712 Further Evaluation
After screening remedial approaches to soil contamination at the site only the containment option appears to be protective applicable feasible and reliable
According to the HSCA Regulations after the initial screening is performed an evaluation shall be conducted of the remaining alternatives using the following criteria
1 Protectiveness 2 Compliance with all applicable local state and federal laws and regulations 3 Community acceptance 4 Provision for monitoring the success of the alternative 5 Technical feasibility 6 Ability to be implemented 7 Practicability from a cost standpoint 8 A reasonable restoration time frame 9 Reduction of toxicity mobility and volume 10 Long term effectiveness 12 Short term effectiveness
Four forms of containment--Alternatives A through D--will be compared using the twelve- (12) HSCA criteria Common to all of them is the interruption of the exposure pathway by placing material between the contamination and site workers The remedial alternatives are briefly described below and compared with the criteria on Table 1
8
A Clean fills and topsoil
This alternative consists of the removal and disposal of the existing site vegetative cover and placement of clean fill material and a 4-inch topsoil layer on the site The quantities of fill material would be dictated by the final grade The new fill and topsoil would reduce risk by isolating the site contaminants from future site workers A vegetative cover would be maintained to control erosion Four inches of topsoil is considered the minimum topsoil cover to support a robust community of turf grasses
B Permeable fabric and clean fill
This alternative would involve removal ofthe existing vegetative cover as above and installation of a synthetic filter fabric clean fill and a 4 inch topsoil layer on the site As in alternative A the thickness of the layer of clean fill would be determined by the final grades The permeable fabric layer would result in containment of the contaminants below the liner and would prevent direct human contact with contaminated soils The liner would server as a marker between the clean soil cover and the contaminated soil However some controls would have to be instituted to maintain the integrity of the liner
C Impermeable liner and clean fill
For this alternative site vegetation would be removed as above Layers of sand approximately 6 inches deep would be placed on the surface of the site An impermeable liner similar to the type of liner used in sanitary landfills would cover the sand layer The liner would be seamed water tight and topped with clean fill and topsoil The impermeable liner would prevent not only contact between workers and contaminated soils but also percolation of precipitation through the contaminated soil Drainage would be collected in a perimeter drain system with appropriately sized retention structures
D Low permeability cap
In this alternative existing site vegetation would be removed and the surface graded The surface would be prepared with stone or other suitable base material and the surface would be paved with asphalt or concrete or compacted crushed stone (The pavement section material and thickness would be determined during the detailed design stage) Drainage would be collected in a perimeter drain system with appropriately sized retention structures designed to be compatible with the drainage system installed at the Halby Site Like the impermeable liner discussed above the cap would prevent contact between workers and contaminated soils
9
Table 1 C fR dial Alt f forSite SolI s Alternative A Alternative B Alternative C Alternative D
HSCA Criteria Clean fill and top soil Permeable fabric Impenneable liner Low penneability and clean fill and clean fill cap
Protectiveness Meets minimum requirement for protectiveness
Protective Protective Protective
Compliance with applicable Compliant Compliant Compliant Compliant requirements Community Acceptance
Potentially acceptable Potentially acceptable Potentially acceptable Acceptability more likely
Monitoring Required Required Required Required Potential problems with
Feasibility Feasible Feasible tying in liner to existing Feasible buildings Implementable but Implementable but
Implementation Easiest implementation Implementable significantly more difficult than B (liner tie-
additional design and construction
in and drainage) for water drainage Cost (sqft) $85 $200 $400 $250
Time Frame Fastest-6 months construction time
Longer design and construction
Longest design and construction
Somewhat shorter design period than C Significant
Reduction of toxicity mobility and volume
Minimal reduction in mobility no reduction in toxicity or volume
Some reduction in mobility no reduction in toxicity or volume
Significant reduction in mobility no reduction in toxicity or volume
reduction in mobility no reduction in toxicity or volume
Long term effectiveness
Potential for damage caused by surface or intrusive activities
Potential for damage caused by surface or intrusive activities
Potential for damage caused by surface or intrusive activities
Readily designed for anticipated loads
Short term effectiveness
Effective Effective Effective Effective
10
72 Evaluation of Potential Remedial Alternatives for Petroleum Product in Subsurface Soils
Three potential remedies for the areas of petroleum products in subsurface soils are
bull No action bull Passive collection using absorbent or vacuum technologies bull Active collection using pumping welles) and product collection equipment
The No Action remedy does not meet the remedial objectives discussed above or the requirements of HSCA
Both active and passive collection potentially meet the screening criteria of effectiveness in providing protection for human health and the environment and in use of acceptable engineering practices Both are well-established technologies and would potentially meet the HSCA criteria Passive approaches would take a longer time to complete but the start-up costs would be somewhat less than active approaches Duffield estimates that the installation costs of a passive system would be $40000 Duffield has proposed additional monitoring of the area of contamination prior to design and implementation of a collection system
80 REMEDIAL PLAN
Based on the remedial objectives and the evaluation criteria ofHSCA the DNREC adopts a remedy for the Site consisting of the following
bull The first is a low permeability cover consisting of asphalt or concrete paving over most of the site (Alternative D) Some limited areas--approximately 35 of the surface area--will receive a clean-fill and topsoil cover (Alternative A) rather than paving The proposed extent of the paved area is shown in Figure 4 The estimated cost of the combination asphalt cap and soil cover is $2970000
bull The second component of the remediation will be a recovery system for subsurface petroleum product to be designed based on further investigation The collection system may be either active or passive depending on the results of monitoring The system will however significantly reduce the volume of petroleum on the site and prevent further migration of any petroleum left in the soil
bull A ground water management zone covering the Potts Property has already been established as part of the Halby Superfund Site remediation This will prevent the installation of drinking water supply wells drawing potentially contaminated ground water Additional institutional controls on activities on the property including building construction excavation maintenance of the cap and recovery system will be implemented by the PRPs and enforced by the Department The institutional controls will be noted on the deed to the property Procedures for conducting controlled activities will be detailed in an Operations and Maintenance Plan which will be part of the proposed remedial action
11
90 PUBLIC PARTICIPATION
91 Public Meetings
Prior to publishing the Proposed Plan the DNREC held two informational meetings with the City of Wilmington administrative staff and elected officials Representatives of citizens groups were also represented
A public meeting was held on February 18 at the William Hicks Anderson Community Center In response to a request made at that meeting an additional public meeting was held on March 9 at Neighborhood House
Release of the Proposed Plan and the public meetings were publicized in advertisements in the Wilmington News Journal and in flyers distributed in the residential areas near the Site Radio Station WILM aired an interview with DNREC and announced the first meeting
92 Public Comment and Responses
921 Comments from Eastern Environmental Law Center March 23 1999
1 What is the status of the investigation to determine the source and extent of the petroleum product that was discovered at the southwest side of Christina Ave
The extent ofthe subsurface petroleum product area was determined in a series of28 test pits (designated PTP1 through PTP-28 in the Duffield RI Report) dug on June 45 and 6 1997 While this effort was adequate to establish that free product is present and to estimate its extent additional investigation will be required to design a recovery system The pre-design investigation may consist ofsmall diameter shallow monitoring wells which can be tested with an interface probe to determine the presence and thickness of free product Such wells could be installed before or after the capcover is constructed
2 Are there any water lines running through the Site and if so how will they be re-routed
There is reportedly a water main along Christina Avenue and a supply line to the office building There are no plans to re-route the lines Contaminated soil would only come in contact with the inside ofa water line if it should break In that event the line would be flushed to remove soil and debris after it is repaired As part ofthe Final Plan a deed restriction will be placed on the Potts Property Site that requires notification ofDNREC prior to excavation for construction or utility purposes
3 What is the water related impacts to the river with respect to contaminants Have these been factored into the Plan
Impacts ofPottsHalby related contaminants on the Christina River are discussed in the Attachment to the Final Plan Water quality sample results are summarized in Table
12
A4 Contaminants ofpotential concern appear to be the heavy metals No PCBs have been found in extensive sampling ofsoil on both sites for the Halby RI Organic substances ofconcern including thiocyanate and carbon disulfide at Halby and Potts have not been found in the river water samples An exception is ammonia which was detected in SW-10 11 and 12 The concentrations ofammonia present in river water are not thought to be significant and may be occurring naturally Byfar the most impacted water sample was taken from the Lobdell Canallocation--SW-10 The concentration of zinc in that sample (filtered) was 117 ugL while the relevant water quality criterion (fresh chronic) is 589 ugL
The impact ofsite contaminants on river sediment is more obvious and is probably due in part to past releases from the site However there does not appear to be any contamination in river sediment that is exclusive to Potts and Halby
The caplcover remedy recommendedfor the Potts and Halby sites will prevent human contact with contaminated soils and also reduce the discharge ofcontaminated water to the river So in that sense water related impacts have been factored into the Proposed Plan
4 How will the contaminant sources being released be integrated into the Piedmont Whole Basin Management Plan for the State of Delaware
Management plans for the Christina and other watersheds in Delaware include the identification and cleanup ofsites like Halby Chemical and Potts Property The DNREC Watershed Assessment Section is responsible for determining the total maximum daily loadfor particular water bodies in the State
5 What are other sources of contaminants that exist within the water shed
The question is very general Literally hundreds ofcontamination sources exist in the water shed Small business factories petroleum storage facilities underground tanks landfills farms abandoned industrial sites septic systems tire piles and salvage yards salt piles dredge disposal areas and recyclingfacilities are all potential sources The Piedmont Basin Preliminary Assessment describes and itemizes known sources on pages 111 to 135
6 With respect to 5 above what kind of model is being used to assess the background levels
Please see the discussion ofsurface water quality trends beginning on page 19 of Piedmont Basin Preliminary Assessment Report Its conclusions are based on analysis of22 parameters from 34 stations in the watershed The closest monitoring station to the PottsHalby site is the Route 13 3rd Street Bridge in Wilmington approximately two miles upstream from the site In this study contamination trends are related to water quality criteria rather than natural background levels
7 What is the status of the Piedmont contaminant source database If completed what is the significance of the collective ground water discharge relative to the total daily load to the River
13
The site index database has not been completed but the Piedmont Basin Preliminary Assessment Report contains much ofthe information identifYing contaminant sources that will eventually be listed in the database
8 Does the site lie within a flood plain If so what plans have been developed to deal with flooding of this area
Part ofthe site lies within the hundred-year flood plain Presently flooding ofthis area could carry contaminated soil to the wetlands and river The remedy will reduce this mechanism oftransport
9 EELC understands that the Agency for Toxic Substances and Disease Registry has been conducting interviews with citizens who may have been exposed to hazardous substances released by the Halby and Potts sites since the 1950s Has there been any evaluation ofthe employees of the Port of Wilmington or any of the surrounding communities for any human health effects related to exposure to the pollutants identified in the Plan
The Potts HSCA project did not include health screening ofPort ofWilmington employees To evaluate the potential for past human exposure to site contaminants the EPA Halby project did include sampling surface soils in nearby residential communities andpublic parks The results indicated that those soils do not contain elevated levels of site related contaminants except in the residential lot on Terminal Avenue which is directly acijacent to the Halby site
922 Comments from Wilmington Waterfront Watch February 19 1999
1 Remedial Action Concerns The age of the Halby RI (1988) Army Corps of Engineers (1994) Table A-4 Water Quality (1995) Sediment Quality Studies (Table A-5) We feel that a current testing of surface water and sediment by DNREC or EPA at SW 10 11 12 S-I Sediment 22-23-17 would show a clear picture of conditions at the site and the impact to the river As the Army Corps of Engineers may soon be involved in dredging operations their involvement in sampling would be questioned
In response to the concerns raised in this comment DNREC met with representatives of the Wilmington Waterfront Watch and Wilmington River-City Committee Inc to discuss the issue ofimpact on the Christina River As a result ofthis meeting DNREC agreed to perform additional sediment sampling in the river The field effort will consist ofnine surface sediment samples and one field duplicate Three transects shall be established across the river upstream ofthe 1-495 bridge directly across from the Potts Property site and downstream ofthe discharge from the dredge disposal site This single sampling event is not anticipated to result in a clear determination ofthe contaminant contribution from the Potts Property Site because there are many other sources ofthe same contaminants on the Christina However it will give a snap shot picture ofcurrent sediment quality in this stretch ofthe river
14
The Army Corps ofEngineers performs maintenance dredging in the Wilmington ship channel every eight months under a permit issued by DNREC At this writing the Corps is in compliance with its permits requirements The permits require extensive sampling ofthe elutriate from the dredged material that discharges to the river The Corps has also sampled sediment and river water up and down stream from the dredged area and performed toxicity testing DNREC believes that on balance the dredging is beneficial environmentally because while it does cause a temporary increase in turbidity it removes contaminated sedimentfrom the riverbed
2 We feel that one more meeting should be held before the March deadline our choices are Rose Hill Community Center The Neighborhood House 7 PM time frame
An additional public meeting was held at Neighborhood House on March 9
100 DECLARATION
This Final Plan of Remedial Action for the Potts Property Site is protective of human health welfare and the environment and is consistent with the requirements of the Delaware Hazardous Substance Cleanup Act
Denise Ferguson-Southard Director Division of Air and Waste Management Department of Natural Resources and Environmental Control
SFJrm SFJ00040doc DE 0169 B9
15
I
11 I
II
I I
~ I
I I
I I
I I
I I
I
~ I
I I
I I I I
1 JO I I
1 I I
J I
J J 1 J
I ~
I
I I
I I
~
~ THIS LOCATION SKETCH IS ADAPTED FROM TriE USGS TOPOGRAPHIC MAP 75 MINUTE SERIES fOR WILMINGTON SOUTH DEL-NJ
AREA SKETCH
pons PROPERTY WILWIHGTOH
NEW CASTLE COUNrt DELAWARE
DUFFIELD ASSOCIATES INC CONSULTANTS IN THE GEOSC1ENCES WIlMINGTON DELAWARE ElKTON MARYtANO
1 MARCH 1994Date wo 5-40ED
Drawn OSH Chkd Scale 18 =20001
FtGtJRE 1File No A-640ED-1
~ --- ~=c__O_UFmD_ ASSOCJA1S INCshy
-shy_0-o 0-=
I
I~ -
LEGEND ----- H-L8Y 0EW1CA SITE
- bullbull - bullbull - FClAWEA ~SS degPLtItT Ntpound- ~-r
Figure 2 SITE-Wloe SELECTED ROeMEOY
Halby ~enic3I Site
0400
Date nGURE 3
10 DECEMBBR 1817
---shy
~
Reriloa
Chkd JJl1 II I Dale 1shy =100 110 A-a40EB-3
HOm 1HlS LOCA11ON SKETCH IS ADAPIED fROU A PlM EHll1lED ~IC PlNf fREDERICK It POllS bull CO INC PREPARED ftI YAtl)8lARl( bull LtNCH INC RE4ISION DATED 10 OCTOBER tilDRAWING NO 30837-8
No
Drawn DS
File No
Scale
----------- -shy-----shy --shy---shy
I I I I I I
L1
PTP-24shy~ o
lP-13tA n 12
-shy -shy-_=shy
~ -I
I
_J
( ESTttfATED AREA or rREE PETROLEUtC
PRODUCT _ )
shy~
--shy ---shy
)
V
P~25
-
ESTIMATED EXTENT OF FREE PETROLEUM PRODUCT
POTTS PROPERTY RIFS 1I1UlING1ON
NEW CASTLE COUNTY N DELAWARE
u pu J17834 1103J1f etnl f2 J I
1 - - liUWshy ~ I - 6 Gft
- shy - MEe shy eIa i AC ~I d - - ~1 87500 - ~-_-___ ~ lt bullbull - 1F51f2 k gt P - --- = -
bull N 2 Z115 w -shy _ ~ __ -ii- -gt--=--- shy - - - ~------
1007 DUFFIELD ASSOCIATES I~C
DUFFIELD g~~08A~ J~gSClINClS 6400 UWISTONW ROAD
AOS~S~O=-C~IA~T=E~S--fWCINCTON DEURE 1118011-1232 TIL (302)2311-801 fU (I02)2111-0tll6 -W1L Dorfll~WDUPPHITCOY
wnEi THIS LOCATION SKETCH IS ADAP1ED FROM A PUN
~ ENTITlED TOPOGRAPHIC PlAN FREDERICK A POllS ~~~
c~S~~
DUFFIELD ~~~o~u~ ~~SC1ENCES CHOO UYr3fOHB tOAD
AS=S~O~C~I=A~TE=-S7 WILWIHGTON DIlUnRB 111808-1232 bull IU (304)4ID-8113C tU (302)2311-lICllli
E-1UJ1 OUfrUIWeOUltNlrlCOW
1007 DUFFIELD ASSOCIATES INC
amp CO INCmiddot PREPARED BY VANDEMARK lYNCH INC REVISION DATED 10 OCTOBER 1996 DRAWING NO 30637-Bbull
KEY
ltCamp PROPOSED CpKgtltgtQltJ ~laquolt r-- --- --- PROPOSED COVER
( ~ ~lt
0
Qp)~
~ ~4
~ amp~
~~ 1IfIt ~
n o
Filll No A-081-4
SCalll - 300
Dra0 DSU Chk41 Jj Dale 23 ftBRUABY 1888PRE-DESIGNED PROPOSED EXTENT 10 14011OF COVER amp CAPPING
nGURB POTTS PROPERTY RIFS No Reftltoo ote
JlUlINGTON NEW CASTIJ COIINJY - llUJAHE
shy _-------- shy
(
Attachment
Evaluation of Impacts on the Christina River
TABLE OF CONTENTS
10 LOADING CALCULATIONS _ ~_bullbullbullbullbullbullbullbullbullbull 1
TABLE Al CHRISTINA RIvER FLOW VOLUME 1 TABLE A2 IMPAcr OF GROUNDWATER ON CONTAMINANT CONCENTRATION IN TIlE CHRISTINA RIvER (ActrrE EXPOSURE) 3 TABLE A3 IMPAcrOF GROUNDWATER ON CONTAMINANT CONCENTRATION IN TIlE CHRISTINA RIVER (CHRONIC EXPOSURE) 4
20 WATER QUALITY STUDIES IN TIlE CHRISTINA RIVER __ S
TABLE A4 RESULTS OF WATER QUALITY SAMPLES IN TIlE CHRISTINA RIvER (uGIL) 6
30 SEDIMENT QUALITY STUDIES ~bullbullbull~ bullbullbullbullbullbullbullbullbullbullbullbullbullbullbullbullbullbullbullbullbullbullbullbullbullbullbullbullbullbullbull 7
TABLE A 5 SELECTED RESULTS OF SEDIMENT SAMPLES FROM THREE STUDIES (MGKG) 8
40 CONCLUSIONS 8
APPENDIX
1 Duffield Tables 8A to 8C 2 Groundwater Discharge 3 Calculation of Dilution of Factors 4 Duffield Table 6 5 Concentrations of Selected Chemicals in Surface Water 6 Surface Water Quality Sample Locations 7 Sediment SampleLocations
1
10 LOADING CALCULATIONS
The Duffield RI Report identified metals and petroleum as substances of potential concern for impact to the river Arsenic lead cobalt copper selenium calcium iron manganese mercury -nickel potassium thallium and zincmiddotare present above expected background concentrations on at least some portions of the site According to the report the transport of metals dissolved in water is the primary mode of migration for metals in the site subsurface soils to the river This fonn of transport is dependent on the types of metal present the texture and geochemical character of the soil the volume of water infiltrating through the soils and the dynamics of the local groundwater flow regimes
The calculation of loading to the river assumes that all shallow groundwater discharges to the river and the total discharge is controlled by the rate of precipitation minus runoff and evaporation The discharge could be either direct to the river on the northeast side of the site or via surface drainage features Using this method Duffield Associates calculated that approximately 17 million gallons of water fall on the 607 acres per year and percolate through the contaminated soil Under the assumptions used in the method this volume of water becomes contaminated at concentrations equal to the average concentration of all of the groundwater wells sampled for the RI Groundwater movement from the site is further qualified by the hydrogeologic properties of the fill soils A Darcy velocity was calculated using the parameters of hydraulic conductivity and hydraulic gradient Using this velocity a flow was then estimated by assuming an average width and saturated thickness of the fill soils
Duffield calculated that the median flow of the Christina River at the site is 523 cubic feet per second Concentrations of contaminants are more critical under low flow conditions State regulations (State of Delaware Surface Water Quality Criteria 1993) recognize three different low flow conditions characterized by duration and frequency as well as the median flow Critical flows are expressed in tenns of days of duration and recurrence interval in years For example the lowest flow of a 7-day duration with a 10-year occurrence interval is known as 7QlO The resulting concentration of the mixed water can then be compared with the Water Quality Criteria for aquatic life and human health established by DNREC Table Al below gives the critical flow relevant to each set ofquality criteria and the result of Duffields calculation of Christina River flow at the Potts Property site
Table Al Christina River flow volume
Critical Flow
Median 30Q5 1Q10 7Q10
IState of Delaware Surface Water Quality Standalds February 1993 2Calculated by Duffield Associates
1
Duffield concluded tha~ after complete mixing with the river water the contaminant contribution from the Potts Property would by itself not cause an exceedence of the surface water quality criteria (See Duffield Tables SA to 8e attached) Based on the data obtained during the RI the shallow groundwater system at the Potts site is indicated to be a perched unconfined aquifer which is hydrologically isolated from adjacent shallow groundwater systems For this reason Duffield assumed that there was no flow through shallow groundwater component at the Potts site
The assumption that discharge to the river is driven by precipitation would not be affected by the drought conditions that caused critical flow in the river is quite conservative The State of Delaware typically assumes that the mixing zone area shall not occupy more than 25 of the receiving water area based on thermal mixing ofline discharges with surface water bodies This regulatory requirement is partially based on ~e assumed differences in density and temperature of the mixed line discharge water and the surface water body Duffield concluded that since the parameters of temperature and density of shallow groundwater at the Potts site and the Christina River are likely to be similar this requirement is not applicable to the Potts site
In order to evaluate the potential loading of inorganic contaminants from groundwater beneath andor adjacent to the shallow groundwater system at the Potts site DNREC estimated discharges from the Columbia and Upper Potomac formations to the Christina River Based on these calculations (attached) groundwater is discharged from the Columbia and Upper Potomac at approximately 222 and 435 cubic feet per day (00025 and 0005 cubic feetsec) respectively Using the formational groundwater quality data obtained from the Halby RI Report and the estimated dilution factors for 1Q10 and 7Q I0 flows the estimated concentrations in the Christina River were compared to the Water Quality Standards (For this calculation DNREC used 25 of the estimated volume of both 1QlO and 7QlO flows) Criteria for both fresh and marine water have been included on Tables A2 and A3 The result of the loading calculation for discharge of contaminated groundwater to the river suggests that neither of the groundwater systems evaluated
bull The Shallow Perched Groundwater System at the Potts Site
bull The Unconfined Columbia Aquifer and the Upper Potomac Aquifer at Potts and Halby
appear to impact surface water quality in the Christina River significantly The contaminant that most nearly approaches its SWQC in fresh water is zinc for chronic exposure However combining the zinc contribution from the perched system (2 ugIL) the Columbia and the Upper Potomoc (21 ugIL) the resulting concentrations in the Christina are below the criterion (59 ugIL)
2
Table A2 Impact ofgroundwater on contaminant concentration in the Christina River (Acute Exposure)
Upper Columbia Potomac Christina SWQS (acute) Formation Formation River
29E+01 0003 5100 5300 60E+01 97E+00 0009 62E+01 0007 22E+01 0003 224000 11600 29E+01 0003 67E+02 0079 6300 15E+01 0002 2000 54E+01 0006 22440005
86E+04 13856
23E+01 0003
26E+02 71 E+OO 360 12E+02
0032 69 0014
17E+00 14E+00 0001 88E+01 179 38E+00
33E+OO 430011 16
39E+03 11000000
78E+03 2290 14E+01 22 54E+04
0002 22E+04 11508
30E+02 53E+02 789 27E+00
0160 75 20
80E+00 0001 300
13E+01 23 12E+01
0004 1400
87E+04 20E+01 0006 2130 49E+03 11367 66E+01 0016
61 E+04 800E+04 659525951 1 Ground water concentration from the Halby RI Report Table E-GW05 2 A blank in columns 2 and 3 indicates that the contaminant was not considered a potential contaminant of concern because of
concentration or frequency of detection A blank in columns 5 and 6 indicates that no Water Quality Criterion has been established by DNREC
middotNo Water Quality Criterion has been established The value is the NOM no observable effects concentration
3
Table A3 Impact ofgroundwater on contaminant concentration in the Christina River (Chronic Exposure)
Columbia Formation
Upper Potomac
Formation Christina
River SWQS (chronic)
29E+01 0003 700 60E+01 97E+00 0007 62E+01 0006 22E+01 0002 29E+01 0003 450 840 67E+02 0063 5000 15E+01 0001 21900 54E+01 0005
86E+04
23E+01
26E+02 12E+02 17E+00 88E+01 38E+00 39E+03-shy14E+01 54E+04 30E+02
80E+00 itbaUiuroEi~L 12E+01 ~ibio~yaha~e 87E+04
71E+00
14E+00 33E+00
8E+03
22E+04 53E+02 27E+00 13E+01 20E+01 49E+03
11106
0002
0026 0011
00004 0009 00004 1835 0001 9224 0128 0001 0003 0005 9111
36 190
50 93
11 066
1
83 71
88 5
012 40
1 Ground water concentration from the Halby RI Report Table EmiddotGW05 2 A blank in columns 2 and 3 indicates that the contaminant was not considered a potential contaminant of concern because of
concentration or frequency of detection A blank in columns 5 and 6 indicates that no Water Quality Criterion has been established by DNREC
No Water Quality Criterion has been established The value is the NOAA no observable effects concentration
4
20 WATER QUALITY STUDIES IN THE CHRISTINA RIVER
Surface water data is available from the Halby RI Report and from studies done for t1te Anny Corps ofEngineers maintenance dredging projects
Surface water data cited in the Halby RI Report shows that a number of contaminants associated exclusively with the Halby Site are present in the lagoon and marsh areas These include ammonia cyanide and thiocyanate Arsenic which is also associated with the Potts Property is elevated in the lagoon and marsh areas Most of the surface water samples for the Halby RI were taken in these contaminated areas However two samples were taken in the Christina River near the 1-495 drainage ditch (sample SW 11 and SW 12) and one in the Lobdell Canal (SW 10) All three had detectable levels ofammonia ranging from 300 to 900 ugIL Arsenic was not detected in any of them A figure showing water contaminant distribution from the Halby RI is attached
Other water quality data IS available from studies performed by the Anny Corps of Engineers for dredging activity in the area of the Port of Wilmington (Final Report Water Quality Monitoring for Wilmington Harbor Maintenance Dredging Operations Winter 1994 prepared by The Greeley-Polhemus Group Inc October 1994) A map of the sample locations is attached
Table A4 below shows analytical results of the EPA and Anny Corps ofEngineers studies with the Surface Water Criteria for Protection of Aquatic Life (chronic) in fresh and marine water Of the five samples the highest concentrations of contamination are found at location SWI0 in the Lobdell Canal At that location however arsenic and nickel were not detected Copper was present at 99 ugIL (estimated) in the filtered sample which is slightly above the SWQC Zinc was present at 117 uglL in the filtered sample All three unfiltered samples from the Halby RI
approach or exceed the standard for iron about two times the SWQC The filtered samples are much lower in iron concentration-below the SWQC
Copper and nickel were absent in all four of the river samples Arsenic was absent in all but location S-1 where it was present at 2 ugIL significantly below the SWQC of 190 ugIL Unfortunately the Halby RI sample analysis for zinc was compromised by contamination in the blank sample but it appears that there is a zinc contribution from the Potts Property which may be transported through the 1-495 drainage ditch and the Lobdell Canal At location S1 where the river water would reflect a more mixed condition than at SWl1 and SWI2 zinc was not detected in two samples
5
I middotmiddotmiddot1
Table A4 Results of water quality samples in the Christina River (uglL)
HALSY RI (1988) middotmiddotmiddotmiddotAiffifcpf9~rgl~r-middot-)1middot~ h-
Parameters SW11 SW10 SW 12 S 1 S 1 Flood Tide Ebb Tide
FILTERED UNFILTERED FILTERED UNFILTERED UNFILTERED UNFILTERED
Suite ofDdawan Surface Water Quality Standards February 1993
NR shy 8Ralysis requested but not reported J - Estimated Some fresh water criteria are calculated using hardness value of SO mglL (- indicates hat no standard has been determined)
R- Rejected L - Lower th8R actual value B - Analyte is found in the blanks as well as a sample K- Higher th8R IICtual value ( bull Estimated value below Contract Required Detection Limit
6
30 SEDIMENT QUALITY STUDIES
In 1995 the Department invetigated sediment contamination problems in the Christina River Sediment samples were taken approximately every 500 feet from near the confluence of the Christina and Delaware Rivers to 15 river miles upstream Contaminants ofconcern at the Potts Site such as arsenic and were found throughout river The mouth of the river where the Potts Property Site is located was identified as one ofeight areas where sediment contamination reaches levels that could impact aquatic life Three samples taken near the Potts Property site were analyzed for some of the inorganic and organic contaminants which have been assooiated with site soils The results are reported in Table AS below and are labeled DNREC samples
Sediment samples were taken for the Halby RI in the lagoon marshes and ditches on the Halby and Potts Sites A limited n~ber were also taken in the Christina River and Lobdell Canal They are designated EPA on Table AS Sediment samples taken in the marsh and ditches on the Potts Property show high levels ofsite related contamination including arsenic cadmium copp~r and zinc (These areas will be remediated as part of the Halby project)
The Army Corps of Engineers Report referenced above also included composite sediment samples from two areas immediately downstream from the Potts Property Site They are labeled on Table A5 as ACE
Sediment contaminant concentrations are compared to sediment quality guidelines known as Effect Range-Low (ERL) and Effect Range-Median (ERM) (See The Potentialfor Biological Effects ofSediment-sorbed Contaminants Tested in the National Status and Trends Program NOAA Technical Memorandum NOS OMA 52 by the US National Oceanic and Atmospheric Administration) At concentrations below the ERL contaminants are not expected to have adverse biological affects Between the ERL and the ERM adverse effects are possible and occasionally occur Adverse affects occur frequently when contamination is present at concentrations above the ERM
The data shown in Table A5 suggests that adverse affects are possible from arsenic lead zinc and copper concentrations in sediment both upstream and downstream from the Potts Property Although the data is limited it appears that the most heavily contaminated sediment immediately adjacent to the river is in the Lobdell Canal There is a significant exceedence of the ERM there for copper as documented in the Halby RI report Sediment in the marsh immediately upstream of the Lobdell Canal sample shows high levels ofarsenic cadmium and zinc It is apparent that there has been transport of contamination in suspended solids from the marsh system to the sediment of the Lobdell Canal The area dredged by the Army Corps of Engineers for the Port of Wilmington from the river has much lower concentrations in sediment
7
Table A 5 Selected results of sediment samples from three studies (mglkg)
Sample Location
Right bank opposite Port of Wilmington
Arsenic
162
40 CONCLUSIONS
This evaluation of impacts of the Potts and Halby Sites on the Christina River considered calculated loading from contamination in the shallow perched groundwater system of the Potts Property Site and in the Columbia and Upper Potomoc aquifers It also reviewed surface water and sediment data from studies performed by the EPA the Anny Corps of Engineers and DNREC
The loading calculations indicated that groundwater at the Potts and Halby sites is a source of zinc contamination in the Christina River However the contribution of the sites to zinc contamination in the river is less than half of the SWQC There is not a known exceedence of any SWQC in the study area of the river There are exceedences for copper and zinc in the Lobdell Canal
The surface water data review showed that the surface water flowing through the drainage system across the Potts and Halby Sites is a probable source of water contamination by zinc and copper in the Lobdell Canal which joins the Christina River These contaminants are not present at detectable levels in center of the river immediately downstream of the Lobdell Canal
8
shy(
Ten sediment samples from locations in the Christina River and Lobdell Canal showed extensive contamination by arsenic lead zinc and copper at levels that possibly affect aquatic life Adverse biological effects are probable in the Lobdell Canal due to copper contamination Sediment contamination in the areas dredged by the Army Corps ofEngineeers is not expected to adversely affect aquatic life
SFJrm SFJ98070doc DE-lOll II B8
9
middot _ _a _ _4 bull _middot_a __ - - shy
DUFFIELD TABLES
8AT08C
~
Table 8A Pre-Remedial Action Impact to Surface Water Quality
Marine and Fresh Water Acute
AQUATIC LIFE NORTH SOUTH NORTH SOUTH
SITE SITE SITE SITE SITE SITE AVERAGE AVERAGEiAVERAGE AVERAGE AVERAGE AVERAGE MARINE ACUTE FRESH ACUTE
PARAMETER I (ugll) (ugll) (ugll) (ugll) (ugll) (ugll) (1 Q 10) (ugll) (1 Q 10) (ugll) Arsenic (III) 1280 1840 140 00541 00389 00030 69 360
PREMIXING POSTMIXING
- -- -- _-- - _ - --- --- - - - 00015- -------- 43- ----~-- ----1--79(4)--shyCadmium 176 194 70 00074 00041
- - ---- __ - -_ -- -_ - -_ -------_-- --shy~_-_
Chromlum(II1Y -- 65 - 65 NO 00003 00001 NO NL 98432 NO ----- ---------1100----- ----- 16---shy
----- --- -- - --- -- - - -__------- -------- -shyef~~-~i~IjlI~ij -- 1~~~0~+-26~~Ori 5~1~0 0~~~3 O~~01 ------ NL NL NL
00082--- -------140----- -----337--8--shy~~~d - ----j_3_l __ ~ 53_ 390 00052 I 00032 bullbull _ _ bull - __ bull ~ __ bullbull bullbull __ 0 bullbull _ _
2~~_~~ryJI_L NO___ _ ND NO ___ _ NO __ I _NO I NO 21 24 ----- _----_- -_ -- --- ---_ ------ - --__ _~-----
00011 75 789~~~el ----~~~o--- ~~~~ 6~~6 ~~~~~ ~~l~~ 01407--- - -- -----95------- --------65~04---
Notes 1 NL = Not Listed 2 NO =Not Detected 3 Apportioned Flow Rate (1 Q 10) = 8516 cubic feeUsecond 4 Numbers in BOLD are calculated freshwater criteria based on an assumed water hardness of
50 mgll (CaCOJ )
5 North Side Max Q (flow rate) = 312798 cubic feet per day South Side Max Q = 309722 cubic feet per day
WO 640EE
EXCEL0640EE4BXLS Duffield Associates IncJanuary 1999
Table 8B Pre-Remedial Action Impact to Surface Water Quality
Marine and Fresh Water Chronic
PREMIXING I POSTMIXING I AQUATIC LIFE
I
NORTH SOUTH NORTH SOUTH SITE SrrE I SITE SITE SITE SITE MARINE
AVERAGE i AVERAGE iAVERAGE AVERAGE AVERAGE I AVERAGE CHRONIC (7010) FRESH CHRONIC IPARAMETER (ugJl) (ugJl) (ugll) (ugll) (ugtl) (ugl) (ugtl) (7010) (ugl)i
lArsenic(llI) 1280 1840 140 00434 00312 00024 36 190Cadmium ---- - 176 1- - - ~ 70 00060 00033 00012----------93------------06-6--(4) shy194 I
- -- ------- ------------ - - I -- I i -- -- - - --- - - - --- - ------ shy
Chromium (III) 65 65 NO 00002 00001 NO NL 1 11732 ------------------ -- --- ------- ------ I ---_ ---- ---- ------------------------------------------
Chromium (VI) 65 I 65 ND 00002 00001 NO 50 11Iron-- ----- - 195800 I 265700 - 56100 66328 45019 i- 0950~5 --- -----NL ---- - ------1-00--0-middot shyLeBeC- -- --- - 123 153 390 00042 I 00026 - 00066- ----- ----56middot--- ---- --------32shyM~~cury(i-I) --- -- ND2 i---ND--- NO ND ND i ND- -----0025middot-------- -----O~012 Nickel------ -7550----1--10370--- 50 --- - - 02558 I 0175700008--- ----------83 ---~--- - ---- 8771 IZlnc 54260--1-78070- 6660--- 18381 1322ffmiddot 01128-----------86------- --------=--
Notes 1 NL = Not Listed 2 NO =Not Detected 3 Apportioned Flow Rate (7 0 10) = 10625 cubic feetsecond 4 Numbers in BOLD are calculated freshwater criteria based on an assumed water hardness of
50 mgtl (CaC03)
5 North Side Max 0 (flow rate) = 312798 cubic feet per day South Side Max 0 = 309722 cubic feet per day
WO 640EE
EXCEl0640EE4BXlS Duffield Associates IncJanuary 1999
Table Be Pre-Remedial Action Impact to Surface Water Quality
Human Health
PREMIXING I POSTMIXING HUMAN HEALTH NORTH SOUTH NORTH I SOUTH i SITE I SITE I SITE SITE I SITE I SITE MARINE IFRESHWATER FRESHWATER HUMAN
ESTUARINEi (Fish Ingestion (Fish and Water HEALTH PARAMETER I (ugl) (ugl) (ugl) (ugl) (ugl) (ugl)
AVERAGEAVERAGEIAVERAGE AVERAGE AVERAGElmiddot AVERAGE (ugll) Only) (ugll) Ingestion) (ugll) CONCERN NL NL I 50 CA 2
I
Arsenic (III) __1_280 1 18401_ 140 00274 00197 I 00015 -- 1middotmiddotmiddotmiddotmiddotmiddotmiddot_- -----0middot- --__shyNL NLmiddot 10 ST 1g~d~ium 1gt _194 ___7deg 00038 j 00021 I 00007
120000middot1 840000 - 3(000 --sr-Chromium (III) 65 65 NO 00001 I 00001 NO Chromium (VI) 65 65 NO 00001 i 00001 NO 590 i _4200_ X70__ ST____ -middoto-- - -_ - - - I I Iron 195800 265700 56100 NL 3 i NL NLI
~~ middotmiddotmiddotmiddotI--~-~~------ ----~k_- -~k-~ea-d----1~3 _- ~_j~3~--~middot~middot3-90_ O0026_l00016_ 00042 ----__ _shy15 71
~-_
2 ST 810 --- -sfoltf---middot middot-middotmiddot~-620-~- -Srshy
- __- ----- shy-yenIIL -ipound f~~~ middotmiddot=~aiij O~f5t=Omiddot~r09 middot1 05 NL NL NL NL
Notes 1 ST (Systemic) = 30 Q 5 2 CA (Carcin~genic) = Median Flow 3 NL =Not Li$ted 4 NO =Not Detected 5 Apportioned Flow Rate (30 Q 5) =16827 cubic feetsecond
Apportioned Flow Rate (Median Flow) =52380 cubic feetsecond 6 North Side Max Q (flow rate) =312798 cubic feet per day
South Side Max Q =309722 cubic feet per day
WO 640EE Duffield Associates
EXCEL0640EE4BXLS January 1999
GROUNDWATER DISCHARGE
Discharge of Columbia and Upper Potomoc Formations
Columbia
where
A =22 fl x 1600 fl
K = 42 ftIday
dh -= 00015ft1ft dl
Q = 222 cubic feetday =00025 cubic feetsecond
Upper Potomoc Formation
where
A =25 ft x 1600 ft
K = 87 ftIday
~~ =000125 ftlfl
Q =435 cubic feetday =0005 cubic feetsecond
to the Christina River
[Darcy Law]
[cross sectional area of discharge] Halby RI Report Figure 5-1
[hydraulic conductivity] Halby RI Report page 3-45
[hydraulic gradient] Halby RI Report Figure 3-13
[Darcy Law]
[cross sectional area of discharge] Halby RI Report Figure 5-1
[hydraulic conductivity] Halby RI Report page 3-45
[hydraulic gradient] Halby RI Report Figure 3-15
( Lower Potomac Water-Bearing middotUnit Representative groundwater levels in the lower Potomac water-bearing unit are shown in figures 3-17 and 3-18 maps from all rounds of water-level measurement are in Appendix C The groundwater appears to flow primarily to the south The average hydraulic gradient in the lower Potomac is 00014 ftft The groundwater-flow direction and average hydraulic conductivity are consistent with those reported by EBASCO (1990) At least one water-supply pumping center is located about 2 miles south of the site pumping at this location probably is affecting water levels in this unit beneath the study area
Water-level maps for September 24 1993 and for February 3 and March 11 1994 show a slight diversion in flow direction to the southeast in the southern part of the study area Groundwater in the lower Potomac may be diverted to the southeast if pumping south of the site is suspended temporarily In this case groundwater in the lower Potomac would be expected to flow toward the southeast and potential discharge into the Delaware River or toward pumping centers in New Jersey east of the river The flow diversion toward the southeast may be observed only in the southern part of the study area because in the northeastern part of the study area (near wells SMW-12 and IMW-12) the lower Potomac appears to be nearly truncated by low-permeability Recent sediment The sediment would restrict or even prevent flow in this unit toward the east in the northeastern part of the study area
3534 Hydraulic Characteristics
A previous investigation (EBASCO 1990) estimated the hydraulic conductivity in the study area the results are in Table 3-5 The current RI estimated the hydraulic properties of wells at either three or four locations in each water-bearing unit The hydraulic properties are shown in Table 3-6 Data from the individual tests are in TM 3 Monitoring-Well Installation in Appendix A
The ranges and geometric means of the hydraulic conductivity for each unit using the data in tables 3-5 and 3-6 are
bull Columbia Range 092 to 12 feet per day (ftJday) Geometric mean 42 ftJday
bull Upper Potomac Range 11 to 32 ftJday Geometric mean 87 ftJday
bull Lower Potomac Range 018 to 43 ftlday Geometric mean 14ftJday
--
3-45
~ bullbull
CALCULATION
OF
DILUTION FACTORS
Dilution Factor Calculation
OF (dilution factor) =River flowgroundwater discharge
7010 (chronic exposure)
= 025 10625OF (Columbia) 00025
= 10625
025 10625OF (Potomoc) = 005
= 5312
1010 (acute exposure)
= 025 8516DF (Columbia) 00025
=8516
= 025 8516DF (Potomoc) 0005
= 4258
Note Dilution factors are calculated using 25 of the volume of the river flow to reflect partial mixing of the groundwater discharge with the river
bull I bull Tabl
Computed and Apportioned Critical Low Flows In the Christina River at the Potts Property Site
Station Name 01478000 01479000 01479197 01480015 01481500 Total Location Christina llhite Clay Mill Creek Red Clay Brandywine
Upper Drainage Area 2050 8910 366 5240 31400 47966 Square Miles Computed Median 1300 7600 150 5000 33200 47250 CFS Computed 7010 170 1500 012 1000 7200 9882 CFS Computed 1010 046 1300 010 600 6200 8156 CFS Computed 3005 330 2460 037 2100 10500 15427 CFS
Lower Drainage Area 5493 521 1021 209 553 7797 Square Miles Percentage 26795 585 27896 399 176 1626 Apportioned Median 3483 444 418 199 585 5130 CFS Apportioned 7010 456 088 033 040 127 743 CFS Apportioned 1010 123 076 028 024 109 360 CFS Apportioned 3005 884 144 103 084 185 1400 CFS
Total Drainage Area 7543 9431 1387 5449 31953 55763 Square Miles Median Flow 4783 8044 568 5199 33785 52380 CFS 7010 Flow 626 1588 045 1040 7327 10625 CFS 1010 Flow 169 1376 038 624 6309 8516 CFS 3005 Flow 1214 2604 140 2184 10685 16827 CFS
WO 0840EE Duffield Aaloclatea Inc
EXCEL0640EE3XLS September 1988
Table E - GW05 Offslte Groundwater Concentration Calculations
Halbv Chemical Site
Chemical
Ranae of Detected Values Maximum MinImum
Value Value (uaL (uaU
Normal Mean (uQL)
Normal Standard Deviation
Transformed Mean tuaIL
Transformed Standard Deviation
H Statistic
Results of
W-teat
Normal 95 UCL
(ualU
Lognormal 95shy
UCL hiaIL)
MaxImum or
95UCL (uQL
Columbia Water-Bearlna Unit Volatllbullbull Benzene 10E+OO 10E+OO 29E+01 71Et01 21EtOO 14EtOa 1BEtOO I 66EtOl 96Et01 10EtOO 2-Butanone 18Et02 15Et02 32Et01 62EtOl 22EtOO 13EtOO 18E+OO t 64E+Ol 10Et02 10E+02 Carbon disullide 2 1Et02 10EtOO 60EtOl BBEtOl 28EtOO 18EtOO 24EtOO I 11Et02 11Et03 21 Et02 t 1middotDlchloroethane 35Eit02 34Et02 62EtOl t3Et02 24E+OO t6EtOO t8EtOO I t3Et02 32Et02 32E+02 1 ImiddotDlchloroelhene 11 Et02 96EtOl 22EtOl 38E+Ol 22EtOO t 2EtOO tBEtOO t 42E+01 54E+01 54E+Ol Tetrachloroethene 50E+OO 60E-Ot 29EtOl 71E+Ol t9EtOO 16EtOO 41EtOO I 66E+Ol 16E+02 50EtOO Toluene 66Et03 90E-Ol 67E+02 19Et03 25EtOO 27EtOO a5EtOO I middot17E+03 96E+04 66E+03 Trlchtoroethene 12Et02 10E+OO 15E+Ol 33EtOl 16EtOO 13EtOO 35EtOO l 32EtOl 49E+01 49E+Ol Vlnvl chloride 23E+02 79EtOl 54EtOl 90EtOl 27EtOO 16E+OO 41EtOO I tOE+02 40E+02 23Et02 Pesticide Aldrin I 14EmiddotOl I 14E-01 I 35Emiddot02 I 33E-02 I -35EtOO 50E-Ot 22EtOO I 52E-02 45E-02 52E-02 InorRanlcs Ammonia 39Et05 27Et03 86Et04 15Et05 34Et03 16Et03 66EtOO l 21E+05 14Et07 39E+OS Antimonv 20EtOl 20E+Ot 23E+Ol B5EtOO 30E+OO 48E-Ol 21EtOO I 27E+01 32Et01 20EtOl Arsenic 14Et03 27EtOO 26Et02 52E+02 35EtOO 21EtOO 52EtOO L 53Et02 88Et03 14Et03 Barium 54Et02 22EtOl 12Et02 17E+02 3BEtOO 16EtOO 40E+OO L 21Et02 96Et02 54Et02 Bervlllum 40E+OO 53E-Ol t7E+OO 14E+OO -12Emiddot02 12EtOO 33EtOO I 24E+OO 6BEtOO 40EtOO Cadmium 57Et02 B9E+OO aaEt01 20E+02 1BE+OO 21EtOO 52EtOO I 19E+02 14Et03 57Et02 Chromium 12EtOl 26E+OO 38EtOO 3 I E+OO 11 EtOO 75E-Ol 25E+OO I 54E+OO 6BEtOO 68EtOO Cobalt 14Et04 5BEtOO 39Et03 54Et03 56EtOO 35EtOO a3EtOO L 67E+03 NA 14Et04 Cvanlde 48EtOl 14E+Ol 14Et01 17Et01 22E+OO 93E-01 41E+OO I 28E+Ol 73EtOl 48Et01 Manaanesamp 18Et05 91E+Ol 54Et04 76Et04 8BE+OO 27EtOO 6SEtOO L 93E+04 47Et07 1BEt05 Nickel 96Et02 98E+OO 30Et02 41Et02 41EtOO 21E+OO 52E+OO L 52E+02 16E+04 96Et02 Silver 28Et01 l4EtOl 80EtOO 10EtOl 1AEtOO 12EtOO 34EtOO L 13EtOl 30EtOl 28E+01 Thallium 64EtOl 68E+OO 12EtOt 19EtOl 1tEtOO 19EtOO 48EtOO L 22Et01 33Et02 64Et01 Thlocvanate 28EtOS 20Et02 87Et04 11EtOS 82EtOO 42EtOO 17Et01 N 1BEt05 NA 18E+05 Zinc 22Et05 76E+01 61Et04 B9Et04 73EtOO 44E+OO IOEtOl I 11E+OS NA 11Et05
Upper Potomac Water-Bearing Unit Volatllbullbull Carbon disulfide I 71E+01 I 71EtOl I 97EtOO I 1BEtOt I 18EtOO I 71E-01 I 24E+OO I I I 18EtOl I 12EtOl I 18EtOl Inoraanlcs Ammonia 78E+04 20Et02 16Et04 2BE+04 96E+02 26Et03 87E+OO L 37Et04 9 1EtOB 78E+Q4 Arsenic 32Et01 1BE+OO 71E+OO 94EtOO 13EtOO 12EtOO 32E+OO l 12Et01 23EtOl 23E+01 Bervllium 45E+OO 81Emiddot01 l4EtOO 14EtOO -35E-Ol 13EtOO 34E+OO I 20EtOO 60EtOO 45EtOO Cadmium 13E+Olmiddot 13EtOl 33EtOO 33EtOO 94E-01 B3E-01 23EtOO I 48E+DO 46EtOO 48E+OO Coball 49Et04 51EtOO 7BEt03 17Et04 50E+OO 39E+OO 87EtOO L 16E+04 NA 49Et04 Manoanese 9BEt04 70Et01 22E+04 33E+04 83EtOO 25EtOO 57EtOO L 38E+04 46Et06 98Et04 Nickel 29Et03 38EtOO 53Et02 10Et03 38EtOO 25EtOO 5BEtOO I 10Et03 66Et04 29Et03 Selenium 80EtOO 70E+OO 27EtOO 24EtOO BSE-01 91E-Ol 27E+OO l 39EtOO 57EtOO 57EtOO
filename GRNDWROFXLS 112796 works 95 UCLOF Par 1 of 2 730AM
Table E - GW05 Offslte Groundwater Concentration Calculations
Halby Chemical Site
ChemIcal
Ranae of Detected Values Maximum Minimum
Value Value Normal Mean
Normal Siandard Deviation
Transformed Transformed Siandard
Mean Deviation H
Slatlslle
Results
0Wmiddotles
Normal 95 UCL
Lognormal 95 UCL
Maximum or
95UCL luaL lualU lualU luaIL luaIL luaIL luaIL
Sliver 13E+02 19E+01 13E+01 33E+01 12E+OO 15E+OO 3 E+OO I 28E+01 46E+01 46E+01 Thallium 21E+02 3SE+OO 20E+01 57E+01 87EmiddotOl 19E+OO 4 E+OO I 46E+01 18E+02 18E+02 Thlocvanate 29E+04 11E+02 49E+03 11E+04 60E+oo 25E+OO 8 E+OO L 13E+04 30E+07 29E+04 Vanadium 82E+02 69E+OO 66E+01 22E+02 16E+OO 20E+OO 46E+OO I 17E+02 42E+02 42E+02 Zinc 36E+OS 10E+01 80E+04 13E+05 65E+OO 45E+OO 10E+01 I 14E+05 NA 14E+05
L bull lognormal distribution based on wmiddottest results N bull Normal distribution based on wmiddottest results I bull Inconclusive based on wmiddottest reSUlts Maximum UCl 0 either the normal or lognormal (not to exceed maximum concentration) used per guidance rom Nancy Rlos-Jaolla I Nil bull Could not be determined based on distribution
flename GRNDWROFXlS 730AMworksheet 95 UCLOF Page 2 of 2
112796
DUFFIELD TABLE 6
Table 6 WATER QUALITY DATA
Christina River Vicinity of 1-495 Crossing
DATE
Water
Temperature DC
pH
Total Total Hardness Suspended
mgll Solids mgI
Specific
Conductivity (25C) uSem
(field)
Specific
Conductivity (t) uScm
(calc)
Rt Temperature
Factor ISalinity ppt ISalinity ppt IFresh or
(calc) (field) Marine (1
9511114 6 _ - _ 95112112 1
- -shy 9601130 3 --- 960213 3
- -shy - shy _ -shy - 96031~ 35 9604ha _ ----shy
14 ---9605hj-- shy 14 _-shy 24960611 - 9607i1Ef shy
---- shy24
-96JCi918 shy ---19shy -
_ 961119 shy_ bullbull __ bullbull ___0
9 -970114 -shy
4 _____ bullbull _
1 --9770318 - shy
__ __shy _ 76
- 970528 _shy__--_ ~
18 - middot9707115shy
- __-_ -shy -shy28
- 970916shy--_--- _shy
23 - - -97i111a ----7----shy
72 64 42 110
71 94 24 118 62 68 46 105
68 80 8 114
51 80 28 152 67 80 12 175
- - - ---- shy
73 70 15 175 84 3157 22 - -shy shy - shy - -shy _shy ---shy
74 78 27 190 77 98 49 348
- _ - - __ A - - bull
72 74 14 120 73 106 9 165 78 76 13 268
-~- -shy shy - _ - _ -- shy -----shy -- 73 82 16 253
- --- --shy -shy -- 83 248 19 1767 -shy - _ ~ - -- --shy -shy78 336 36 2618
- 21fi - -shy ---_ _shy ----1577--shy71 25
70081 639088 60879
660972 895812 1382325- ---~ _ -
1382325 3089835
186371 - - _- 3081192 - -
83328 ~
89364 17893268
-----_ -shy _ shy2191739 18682491_-_ _shy -shy
25179924 _shy ----shy10348274
0001633 - ------shy
0001489 __ bull ___ 4 _ bull
0001419 000154 - -_ -shy
0002087 0003221
- _ -shy ~ -shy -0003221 00072
0-004343 - -shy - -shy -----
000718-----__- _- 0001942 0002082
-shy _- --_ _-shy000417 -- --- - _-shy
0005107 0043535 - -shy _ -shy0058675 0024114-shy
-
-10536174 - -shy -shy
-1810657 -shy ---shy
-1489573 ---shy _ __-
-1489573 _--__- -14132973
_ --
-10164668 ----gt-------shy
-10164668 785477300shy
----__-shy785477396-shy ------_shy
3756574 [6459903shy- ~18~10657-
--~840Y9444 -
middot266095747 -107364768shy___ shy -----shy
708215297 --91911765shy
0022299 0 F F0006963 0 F0010908 0 - -_ -- - - -
0013148 0 F - - -shy -
F0025182 0 0 F0078651
_-----~-- 1=shy0078651 0 0206749 0 F --OT29361 shy
0 F-----_shy -- -=- _ 0194391 0
6~035956 -- F-shy
0 --- - shy
0017586 2 F ---_ --shy - _shy - -shy F---middotshy0084657 0 ----__--shy - shy - -_ --middotmiddot-F-shy0137056 01
----shy -----shy - Fmiddot shy122597 09
- --__-- -shy - -1=-shy1654113 14 0612462 -O~8 ----Fshy
NOTES 1 DC =degrees CelsiUS 2 mgll =milligrams per liter
3 uScm =micro Siemens per centimeter (uSem at 25degC) which is equivalent to micro mhos per em (umhoslcm at 25degC) 4 Rt =Ratio of the sample conductivity at original sample temperature divided by the condutivity of standard seawater
at a salinity of 35 and a temperature of 15DC (lewis 1980 Hill et AI 1986 APHA 1989) 5 ppt = parts per thousand 6 Christina River water quality data obtained from the State of Delaware Department of Natural Resources and Environmental Control
(DNREC) Watershed Assessment Section Christina STORET No 106291 CONRAil BRIDGE (near Port of Wilmingtonll-495 crossing)
wo 640EE Duffield AIOCItea Inc
EXCEl0640EE5XlS September 1998
CONCENTRATIONS
OF
SELECTEDCHENllCALS
IN
SURFACE WATER
--
I~(
v
I - eM
1CAd fn
lEGENgt ~_IE aIlfAQ-WAWI __ LOCATIClH
__ HOlIIi__
yCHII _T ~_
+-- HOiIaampR _
bull IE_ ulCTIClH DO INJIlOST -a
HOlEl ALL UNITS _ WIalOGIUMIAllEftr-~
LJ ~ ~=COAC~~ _DE~-
8 bull CHMICAL DElEClED AIIClClAlIO -u IG bull NIlT DElECIEIi bull HOT AVALAILpound
M-UU_TR=C_R MCIlEATIClHM CAI_1-shyPlAJ ~ fJIlAJ a1 Du
3-U to~ Ul 12-0 -a_a1IIll ~
F9Se 4-11 CONCENTRATIONS OF SELECTED CHEMICALS IN SURFACE WATER bullbullbulli_bull -1
Hdly 0lIRicII Si8 G1llIDll3 17-AN-1l97
--
SURFACE WATER QUALITY
SAMPLE LOCATIONS
~
~J~ IEIJ~ ~~ jf
if ~~ ~ ~ WILMINGTON HARBOR 1 ~lDISPOSAL AREA
~~~ Jt EDGEMOOR ~~~ if
1amp DISPOSAL AREA
l raquo~~ j ~q ~~ Jf We Siroctu
gtfftJ ~
I ~~ I ~~~ Markor Ugh ~ S1 ~~ I OUll( _ ~
f lt~~~ num 0TT1
Cti$I ft
Te QJ -c ~ II
ii ~
~
~rtr I
cf ~
Ir- _fb- Surface Water Quality Sample Locations SPRING CITY PAI1lMJ
tMlflllHMEHTAl (215)9484700 SERVICES(See Table A4)
SEDIMENT
SAMPLE LOCATIONS
---
I
if ~ t
$ Q
II II
II
1I I
Key
bull Sediment composite sample polnta
bull Bulkwater sample
EDGEMOOR
DISPOSAL AREA
jE
I
QJ ~ ~
tr
~ _lbshyshy
~~
fJ~ ~~ if ~~ 3~ N HARBOR ~ WILMINGTO AREA (it~~ DISPOSAL
j ~~t
~~ fmiddot1 ~~~ jlV gtO~ gt-gt~~ jf
~ l ~~~ jf Weir Structure I $ raquo fJ~V -~~
I I lb--
1 ----ft_-1 ~~~ Marker Light II - II I
6 I~ OV~lall bull ~ ~
bull I 1 IDNIlECj ~ioiiiiilucJ~(STATION 2 I CJ
I IS(ACE) ra 11bullbull
I I
I
SPRING CITY PAI1lMISediment Sample Locations tNVIRONMEHTAl (215)940middot4700
(See Table AS) SERVICES
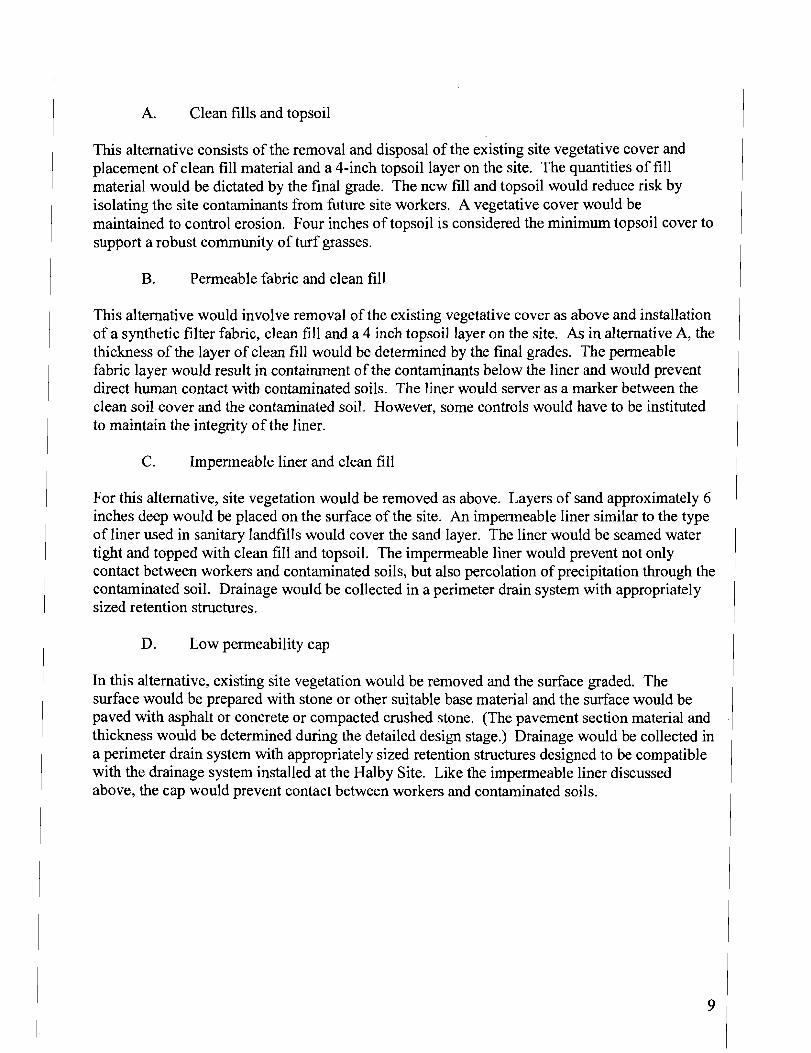

I
11 I
II
I I
~ I
I I
I I
I I
I I
I
~ I
I I
I I I I
1 JO I I
1 I I
J I
J J 1 J
I ~
I
I I
I I
~
~ THIS LOCATION SKETCH IS ADAPTED FROM TriE USGS TOPOGRAPHIC MAP 75 MINUTE SERIES fOR WILMINGTON SOUTH DEL-NJ
AREA SKETCH
pons PROPERTY WILWIHGTOH
NEW CASTLE COUNrt DELAWARE
DUFFIELD ASSOCIATES INC CONSULTANTS IN THE GEOSC1ENCES WIlMINGTON DELAWARE ElKTON MARYtANO
1 MARCH 1994Date wo 5-40ED
Drawn OSH Chkd Scale 18 =20001
FtGtJRE 1File No A-640ED-1
~ --- ~=c__O_UFmD_ ASSOCJA1S INCshy
-shy_0-o 0-=
I
I~ -
LEGEND ----- H-L8Y 0EW1CA SITE
- bullbull - bullbull - FClAWEA ~SS degPLtItT Ntpound- ~-r
Figure 2 SITE-Wloe SELECTED ROeMEOY
Halby ~enic3I Site
0400
Date nGURE 3
10 DECEMBBR 1817
---shy
~
Reriloa
Chkd JJl1 II I Dale 1shy =100 110 A-a40EB-3
HOm 1HlS LOCA11ON SKETCH IS ADAPIED fROU A PlM EHll1lED ~IC PlNf fREDERICK It POllS bull CO INC PREPARED ftI YAtl)8lARl( bull LtNCH INC RE4ISION DATED 10 OCTOBER tilDRAWING NO 30837-8
No
Drawn DS
File No
Scale
----------- -shy-----shy --shy---shy
I I I I I I
L1
PTP-24shy~ o
lP-13tA n 12
-shy -shy-_=shy
~ -I
I
_J
( ESTttfATED AREA or rREE PETROLEUtC
PRODUCT _ )
shy~
--shy ---shy
)
V
P~25
-
ESTIMATED EXTENT OF FREE PETROLEUM PRODUCT
POTTS PROPERTY RIFS 1I1UlING1ON
NEW CASTLE COUNTY N DELAWARE
u pu J17834 1103J1f etnl f2 J I
1 - - liUWshy ~ I - 6 Gft
- shy - MEe shy eIa i AC ~I d - - ~1 87500 - ~-_-___ ~ lt bullbull - 1F51f2 k gt P - --- = -
bull N 2 Z115 w -shy _ ~ __ -ii- -gt--=--- shy - - - ~------
1007 DUFFIELD ASSOCIATES I~C
DUFFIELD g~~08A~ J~gSClINClS 6400 UWISTONW ROAD
AOS~S~O=-C~IA~T=E~S--fWCINCTON DEURE 1118011-1232 TIL (302)2311-801 fU (I02)2111-0tll6 -W1L Dorfll~WDUPPHITCOY
wnEi THIS LOCATION SKETCH IS ADAP1ED FROM A PUN
~ ENTITlED TOPOGRAPHIC PlAN FREDERICK A POllS ~~~
c~S~~
DUFFIELD ~~~o~u~ ~~SC1ENCES CHOO UYr3fOHB tOAD
AS=S~O~C~I=A~TE=-S7 WILWIHGTON DIlUnRB 111808-1232 bull IU (304)4ID-8113C tU (302)2311-lICllli
E-1UJ1 OUfrUIWeOUltNlrlCOW
1007 DUFFIELD ASSOCIATES INC
amp CO INCmiddot PREPARED BY VANDEMARK lYNCH INC REVISION DATED 10 OCTOBER 1996 DRAWING NO 30637-Bbull
KEY
ltCamp PROPOSED CpKgtltgtQltJ ~laquolt r-- --- --- PROPOSED COVER
( ~ ~lt
0
Qp)~
~ ~4
~ amp~
~~ 1IfIt ~
n o
Filll No A-081-4
SCalll - 300
Dra0 DSU Chk41 Jj Dale 23 ftBRUABY 1888PRE-DESIGNED PROPOSED EXTENT 10 14011OF COVER amp CAPPING
nGURB POTTS PROPERTY RIFS No Reftltoo ote
JlUlINGTON NEW CASTIJ COIINJY - llUJAHE
shy _-------- shy
(
Attachment
Evaluation of Impacts on the Christina River
TABLE OF CONTENTS
10 LOADING CALCULATIONS _ ~_bullbullbullbullbullbullbullbullbullbull 1
TABLE Al CHRISTINA RIvER FLOW VOLUME 1 TABLE A2 IMPAcr OF GROUNDWATER ON CONTAMINANT CONCENTRATION IN TIlE CHRISTINA RIvER (ActrrE EXPOSURE) 3 TABLE A3 IMPAcrOF GROUNDWATER ON CONTAMINANT CONCENTRATION IN TIlE CHRISTINA RIVER (CHRONIC EXPOSURE) 4
20 WATER QUALITY STUDIES IN TIlE CHRISTINA RIVER __ S
TABLE A4 RESULTS OF WATER QUALITY SAMPLES IN TIlE CHRISTINA RIvER (uGIL) 6
30 SEDIMENT QUALITY STUDIES ~bullbullbull~ bullbullbullbullbullbullbullbullbullbullbullbullbullbullbullbullbullbullbullbullbullbullbullbullbullbullbullbullbullbullbull 7
TABLE A 5 SELECTED RESULTS OF SEDIMENT SAMPLES FROM THREE STUDIES (MGKG) 8
40 CONCLUSIONS 8
APPENDIX
1 Duffield Tables 8A to 8C 2 Groundwater Discharge 3 Calculation of Dilution of Factors 4 Duffield Table 6 5 Concentrations of Selected Chemicals in Surface Water 6 Surface Water Quality Sample Locations 7 Sediment SampleLocations
1
10 LOADING CALCULATIONS
The Duffield RI Report identified metals and petroleum as substances of potential concern for impact to the river Arsenic lead cobalt copper selenium calcium iron manganese mercury -nickel potassium thallium and zincmiddotare present above expected background concentrations on at least some portions of the site According to the report the transport of metals dissolved in water is the primary mode of migration for metals in the site subsurface soils to the river This fonn of transport is dependent on the types of metal present the texture and geochemical character of the soil the volume of water infiltrating through the soils and the dynamics of the local groundwater flow regimes
The calculation of loading to the river assumes that all shallow groundwater discharges to the river and the total discharge is controlled by the rate of precipitation minus runoff and evaporation The discharge could be either direct to the river on the northeast side of the site or via surface drainage features Using this method Duffield Associates calculated that approximately 17 million gallons of water fall on the 607 acres per year and percolate through the contaminated soil Under the assumptions used in the method this volume of water becomes contaminated at concentrations equal to the average concentration of all of the groundwater wells sampled for the RI Groundwater movement from the site is further qualified by the hydrogeologic properties of the fill soils A Darcy velocity was calculated using the parameters of hydraulic conductivity and hydraulic gradient Using this velocity a flow was then estimated by assuming an average width and saturated thickness of the fill soils
Duffield calculated that the median flow of the Christina River at the site is 523 cubic feet per second Concentrations of contaminants are more critical under low flow conditions State regulations (State of Delaware Surface Water Quality Criteria 1993) recognize three different low flow conditions characterized by duration and frequency as well as the median flow Critical flows are expressed in tenns of days of duration and recurrence interval in years For example the lowest flow of a 7-day duration with a 10-year occurrence interval is known as 7QlO The resulting concentration of the mixed water can then be compared with the Water Quality Criteria for aquatic life and human health established by DNREC Table Al below gives the critical flow relevant to each set ofquality criteria and the result of Duffields calculation of Christina River flow at the Potts Property site
Table Al Christina River flow volume
Critical Flow
Median 30Q5 1Q10 7Q10
IState of Delaware Surface Water Quality Standalds February 1993 2Calculated by Duffield Associates
1
Duffield concluded tha~ after complete mixing with the river water the contaminant contribution from the Potts Property would by itself not cause an exceedence of the surface water quality criteria (See Duffield Tables SA to 8e attached) Based on the data obtained during the RI the shallow groundwater system at the Potts site is indicated to be a perched unconfined aquifer which is hydrologically isolated from adjacent shallow groundwater systems For this reason Duffield assumed that there was no flow through shallow groundwater component at the Potts site
The assumption that discharge to the river is driven by precipitation would not be affected by the drought conditions that caused critical flow in the river is quite conservative The State of Delaware typically assumes that the mixing zone area shall not occupy more than 25 of the receiving water area based on thermal mixing ofline discharges with surface water bodies This regulatory requirement is partially based on ~e assumed differences in density and temperature of the mixed line discharge water and the surface water body Duffield concluded that since the parameters of temperature and density of shallow groundwater at the Potts site and the Christina River are likely to be similar this requirement is not applicable to the Potts site
In order to evaluate the potential loading of inorganic contaminants from groundwater beneath andor adjacent to the shallow groundwater system at the Potts site DNREC estimated discharges from the Columbia and Upper Potomac formations to the Christina River Based on these calculations (attached) groundwater is discharged from the Columbia and Upper Potomac at approximately 222 and 435 cubic feet per day (00025 and 0005 cubic feetsec) respectively Using the formational groundwater quality data obtained from the Halby RI Report and the estimated dilution factors for 1Q10 and 7Q I0 flows the estimated concentrations in the Christina River were compared to the Water Quality Standards (For this calculation DNREC used 25 of the estimated volume of both 1QlO and 7QlO flows) Criteria for both fresh and marine water have been included on Tables A2 and A3 The result of the loading calculation for discharge of contaminated groundwater to the river suggests that neither of the groundwater systems evaluated
bull The Shallow Perched Groundwater System at the Potts Site
bull The Unconfined Columbia Aquifer and the Upper Potomac Aquifer at Potts and Halby
appear to impact surface water quality in the Christina River significantly The contaminant that most nearly approaches its SWQC in fresh water is zinc for chronic exposure However combining the zinc contribution from the perched system (2 ugIL) the Columbia and the Upper Potomoc (21 ugIL) the resulting concentrations in the Christina are below the criterion (59 ugIL)
2
Table A2 Impact ofgroundwater on contaminant concentration in the Christina River (Acute Exposure)
Upper Columbia Potomac Christina SWQS (acute) Formation Formation River
29E+01 0003 5100 5300 60E+01 97E+00 0009 62E+01 0007 22E+01 0003 224000 11600 29E+01 0003 67E+02 0079 6300 15E+01 0002 2000 54E+01 0006 22440005
86E+04 13856
23E+01 0003
26E+02 71 E+OO 360 12E+02
0032 69 0014
17E+00 14E+00 0001 88E+01 179 38E+00
33E+OO 430011 16
39E+03 11000000
78E+03 2290 14E+01 22 54E+04
0002 22E+04 11508
30E+02 53E+02 789 27E+00
0160 75 20
80E+00 0001 300
13E+01 23 12E+01
0004 1400
87E+04 20E+01 0006 2130 49E+03 11367 66E+01 0016
61 E+04 800E+04 659525951 1 Ground water concentration from the Halby RI Report Table E-GW05 2 A blank in columns 2 and 3 indicates that the contaminant was not considered a potential contaminant of concern because of
concentration or frequency of detection A blank in columns 5 and 6 indicates that no Water Quality Criterion has been established by DNREC
middotNo Water Quality Criterion has been established The value is the NOM no observable effects concentration
3
Table A3 Impact ofgroundwater on contaminant concentration in the Christina River (Chronic Exposure)
Columbia Formation
Upper Potomac
Formation Christina
River SWQS (chronic)
29E+01 0003 700 60E+01 97E+00 0007 62E+01 0006 22E+01 0002 29E+01 0003 450 840 67E+02 0063 5000 15E+01 0001 21900 54E+01 0005
86E+04
23E+01
26E+02 12E+02 17E+00 88E+01 38E+00 39E+03-shy14E+01 54E+04 30E+02
80E+00 itbaUiuroEi~L 12E+01 ~ibio~yaha~e 87E+04
71E+00
14E+00 33E+00
8E+03
22E+04 53E+02 27E+00 13E+01 20E+01 49E+03
11106
0002
0026 0011
00004 0009 00004 1835 0001 9224 0128 0001 0003 0005 9111
36 190
50 93
11 066
1
83 71
88 5
012 40
1 Ground water concentration from the Halby RI Report Table EmiddotGW05 2 A blank in columns 2 and 3 indicates that the contaminant was not considered a potential contaminant of concern because of
concentration or frequency of detection A blank in columns 5 and 6 indicates that no Water Quality Criterion has been established by DNREC
No Water Quality Criterion has been established The value is the NOAA no observable effects concentration
4
20 WATER QUALITY STUDIES IN THE CHRISTINA RIVER
Surface water data is available from the Halby RI Report and from studies done for t1te Anny Corps ofEngineers maintenance dredging projects
Surface water data cited in the Halby RI Report shows that a number of contaminants associated exclusively with the Halby Site are present in the lagoon and marsh areas These include ammonia cyanide and thiocyanate Arsenic which is also associated with the Potts Property is elevated in the lagoon and marsh areas Most of the surface water samples for the Halby RI were taken in these contaminated areas However two samples were taken in the Christina River near the 1-495 drainage ditch (sample SW 11 and SW 12) and one in the Lobdell Canal (SW 10) All three had detectable levels ofammonia ranging from 300 to 900 ugIL Arsenic was not detected in any of them A figure showing water contaminant distribution from the Halby RI is attached
Other water quality data IS available from studies performed by the Anny Corps of Engineers for dredging activity in the area of the Port of Wilmington (Final Report Water Quality Monitoring for Wilmington Harbor Maintenance Dredging Operations Winter 1994 prepared by The Greeley-Polhemus Group Inc October 1994) A map of the sample locations is attached
Table A4 below shows analytical results of the EPA and Anny Corps ofEngineers studies with the Surface Water Criteria for Protection of Aquatic Life (chronic) in fresh and marine water Of the five samples the highest concentrations of contamination are found at location SWI0 in the Lobdell Canal At that location however arsenic and nickel were not detected Copper was present at 99 ugIL (estimated) in the filtered sample which is slightly above the SWQC Zinc was present at 117 uglL in the filtered sample All three unfiltered samples from the Halby RI
approach or exceed the standard for iron about two times the SWQC The filtered samples are much lower in iron concentration-below the SWQC
Copper and nickel were absent in all four of the river samples Arsenic was absent in all but location S-1 where it was present at 2 ugIL significantly below the SWQC of 190 ugIL Unfortunately the Halby RI sample analysis for zinc was compromised by contamination in the blank sample but it appears that there is a zinc contribution from the Potts Property which may be transported through the 1-495 drainage ditch and the Lobdell Canal At location S1 where the river water would reflect a more mixed condition than at SWl1 and SWI2 zinc was not detected in two samples
5
I middotmiddotmiddot1
Table A4 Results of water quality samples in the Christina River (uglL)
HALSY RI (1988) middotmiddotmiddotmiddotAiffifcpf9~rgl~r-middot-)1middot~ h-
Parameters SW11 SW10 SW 12 S 1 S 1 Flood Tide Ebb Tide
FILTERED UNFILTERED FILTERED UNFILTERED UNFILTERED UNFILTERED
Suite ofDdawan Surface Water Quality Standards February 1993
NR shy 8Ralysis requested but not reported J - Estimated Some fresh water criteria are calculated using hardness value of SO mglL (- indicates hat no standard has been determined)
R- Rejected L - Lower th8R actual value B - Analyte is found in the blanks as well as a sample K- Higher th8R IICtual value ( bull Estimated value below Contract Required Detection Limit
6
30 SEDIMENT QUALITY STUDIES
In 1995 the Department invetigated sediment contamination problems in the Christina River Sediment samples were taken approximately every 500 feet from near the confluence of the Christina and Delaware Rivers to 15 river miles upstream Contaminants ofconcern at the Potts Site such as arsenic and were found throughout river The mouth of the river where the Potts Property Site is located was identified as one ofeight areas where sediment contamination reaches levels that could impact aquatic life Three samples taken near the Potts Property site were analyzed for some of the inorganic and organic contaminants which have been assooiated with site soils The results are reported in Table AS below and are labeled DNREC samples
Sediment samples were taken for the Halby RI in the lagoon marshes and ditches on the Halby and Potts Sites A limited n~ber were also taken in the Christina River and Lobdell Canal They are designated EPA on Table AS Sediment samples taken in the marsh and ditches on the Potts Property show high levels ofsite related contamination including arsenic cadmium copp~r and zinc (These areas will be remediated as part of the Halby project)
The Army Corps of Engineers Report referenced above also included composite sediment samples from two areas immediately downstream from the Potts Property Site They are labeled on Table A5 as ACE
Sediment contaminant concentrations are compared to sediment quality guidelines known as Effect Range-Low (ERL) and Effect Range-Median (ERM) (See The Potentialfor Biological Effects ofSediment-sorbed Contaminants Tested in the National Status and Trends Program NOAA Technical Memorandum NOS OMA 52 by the US National Oceanic and Atmospheric Administration) At concentrations below the ERL contaminants are not expected to have adverse biological affects Between the ERL and the ERM adverse effects are possible and occasionally occur Adverse affects occur frequently when contamination is present at concentrations above the ERM
The data shown in Table A5 suggests that adverse affects are possible from arsenic lead zinc and copper concentrations in sediment both upstream and downstream from the Potts Property Although the data is limited it appears that the most heavily contaminated sediment immediately adjacent to the river is in the Lobdell Canal There is a significant exceedence of the ERM there for copper as documented in the Halby RI report Sediment in the marsh immediately upstream of the Lobdell Canal sample shows high levels ofarsenic cadmium and zinc It is apparent that there has been transport of contamination in suspended solids from the marsh system to the sediment of the Lobdell Canal The area dredged by the Army Corps of Engineers for the Port of Wilmington from the river has much lower concentrations in sediment
7
Table A 5 Selected results of sediment samples from three studies (mglkg)
Sample Location
Right bank opposite Port of Wilmington
Arsenic
162
40 CONCLUSIONS
This evaluation of impacts of the Potts and Halby Sites on the Christina River considered calculated loading from contamination in the shallow perched groundwater system of the Potts Property Site and in the Columbia and Upper Potomoc aquifers It also reviewed surface water and sediment data from studies performed by the EPA the Anny Corps of Engineers and DNREC
The loading calculations indicated that groundwater at the Potts and Halby sites is a source of zinc contamination in the Christina River However the contribution of the sites to zinc contamination in the river is less than half of the SWQC There is not a known exceedence of any SWQC in the study area of the river There are exceedences for copper and zinc in the Lobdell Canal
The surface water data review showed that the surface water flowing through the drainage system across the Potts and Halby Sites is a probable source of water contamination by zinc and copper in the Lobdell Canal which joins the Christina River These contaminants are not present at detectable levels in center of the river immediately downstream of the Lobdell Canal
8
shy(
Ten sediment samples from locations in the Christina River and Lobdell Canal showed extensive contamination by arsenic lead zinc and copper at levels that possibly affect aquatic life Adverse biological effects are probable in the Lobdell Canal due to copper contamination Sediment contamination in the areas dredged by the Army Corps ofEngineeers is not expected to adversely affect aquatic life
SFJrm SFJ98070doc DE-lOll II B8
9
middot _ _a _ _4 bull _middot_a __ - - shy
DUFFIELD TABLES
8AT08C
~
Table 8A Pre-Remedial Action Impact to Surface Water Quality
Marine and Fresh Water Acute
AQUATIC LIFE NORTH SOUTH NORTH SOUTH
SITE SITE SITE SITE SITE SITE AVERAGE AVERAGEiAVERAGE AVERAGE AVERAGE AVERAGE MARINE ACUTE FRESH ACUTE
PARAMETER I (ugll) (ugll) (ugll) (ugll) (ugll) (ugll) (1 Q 10) (ugll) (1 Q 10) (ugll) Arsenic (III) 1280 1840 140 00541 00389 00030 69 360
PREMIXING POSTMIXING
- -- -- _-- - _ - --- --- - - - 00015- -------- 43- ----~-- ----1--79(4)--shyCadmium 176 194 70 00074 00041
- - ---- __ - -_ -- -_ - -_ -------_-- --shy~_-_
Chromlum(II1Y -- 65 - 65 NO 00003 00001 NO NL 98432 NO ----- ---------1100----- ----- 16---shy
----- --- -- - --- -- - - -__------- -------- -shyef~~-~i~IjlI~ij -- 1~~~0~+-26~~Ori 5~1~0 0~~~3 O~~01 ------ NL NL NL
00082--- -------140----- -----337--8--shy~~~d - ----j_3_l __ ~ 53_ 390 00052 I 00032 bullbull _ _ bull - __ bull ~ __ bullbull bullbull __ 0 bullbull _ _
2~~_~~ryJI_L NO___ _ ND NO ___ _ NO __ I _NO I NO 21 24 ----- _----_- -_ -- --- ---_ ------ - --__ _~-----
00011 75 789~~~el ----~~~o--- ~~~~ 6~~6 ~~~~~ ~~l~~ 01407--- - -- -----95------- --------65~04---
Notes 1 NL = Not Listed 2 NO =Not Detected 3 Apportioned Flow Rate (1 Q 10) = 8516 cubic feeUsecond 4 Numbers in BOLD are calculated freshwater criteria based on an assumed water hardness of
50 mgll (CaCOJ )
5 North Side Max Q (flow rate) = 312798 cubic feet per day South Side Max Q = 309722 cubic feet per day
WO 640EE
EXCEL0640EE4BXLS Duffield Associates IncJanuary 1999
Table 8B Pre-Remedial Action Impact to Surface Water Quality
Marine and Fresh Water Chronic
PREMIXING I POSTMIXING I AQUATIC LIFE
I
NORTH SOUTH NORTH SOUTH SITE SrrE I SITE SITE SITE SITE MARINE
AVERAGE i AVERAGE iAVERAGE AVERAGE AVERAGE I AVERAGE CHRONIC (7010) FRESH CHRONIC IPARAMETER (ugJl) (ugJl) (ugll) (ugll) (ugtl) (ugl) (ugtl) (7010) (ugl)i
lArsenic(llI) 1280 1840 140 00434 00312 00024 36 190Cadmium ---- - 176 1- - - ~ 70 00060 00033 00012----------93------------06-6--(4) shy194 I
- -- ------- ------------ - - I -- I i -- -- - - --- - - - --- - ------ shy
Chromium (III) 65 65 NO 00002 00001 NO NL 1 11732 ------------------ -- --- ------- ------ I ---_ ---- ---- ------------------------------------------
Chromium (VI) 65 I 65 ND 00002 00001 NO 50 11Iron-- ----- - 195800 I 265700 - 56100 66328 45019 i- 0950~5 --- -----NL ---- - ------1-00--0-middot shyLeBeC- -- --- - 123 153 390 00042 I 00026 - 00066- ----- ----56middot--- ---- --------32shyM~~cury(i-I) --- -- ND2 i---ND--- NO ND ND i ND- -----0025middot-------- -----O~012 Nickel------ -7550----1--10370--- 50 --- - - 02558 I 0175700008--- ----------83 ---~--- - ---- 8771 IZlnc 54260--1-78070- 6660--- 18381 1322ffmiddot 01128-----------86------- --------=--
Notes 1 NL = Not Listed 2 NO =Not Detected 3 Apportioned Flow Rate (7 0 10) = 10625 cubic feetsecond 4 Numbers in BOLD are calculated freshwater criteria based on an assumed water hardness of
50 mgtl (CaC03)
5 North Side Max 0 (flow rate) = 312798 cubic feet per day South Side Max 0 = 309722 cubic feet per day
WO 640EE
EXCEl0640EE4BXlS Duffield Associates IncJanuary 1999
Table Be Pre-Remedial Action Impact to Surface Water Quality
Human Health
PREMIXING I POSTMIXING HUMAN HEALTH NORTH SOUTH NORTH I SOUTH i SITE I SITE I SITE SITE I SITE I SITE MARINE IFRESHWATER FRESHWATER HUMAN
ESTUARINEi (Fish Ingestion (Fish and Water HEALTH PARAMETER I (ugl) (ugl) (ugl) (ugl) (ugl) (ugl)
AVERAGEAVERAGEIAVERAGE AVERAGE AVERAGElmiddot AVERAGE (ugll) Only) (ugll) Ingestion) (ugll) CONCERN NL NL I 50 CA 2
I
Arsenic (III) __1_280 1 18401_ 140 00274 00197 I 00015 -- 1middotmiddotmiddotmiddotmiddotmiddotmiddot_- -----0middot- --__shyNL NLmiddot 10 ST 1g~d~ium 1gt _194 ___7deg 00038 j 00021 I 00007
120000middot1 840000 - 3(000 --sr-Chromium (III) 65 65 NO 00001 I 00001 NO Chromium (VI) 65 65 NO 00001 i 00001 NO 590 i _4200_ X70__ ST____ -middoto-- - -_ - - - I I Iron 195800 265700 56100 NL 3 i NL NLI
~~ middotmiddotmiddotmiddotI--~-~~------ ----~k_- -~k-~ea-d----1~3 _- ~_j~3~--~middot~middot3-90_ O0026_l00016_ 00042 ----__ _shy15 71
~-_
2 ST 810 --- -sfoltf---middot middot-middotmiddot~-620-~- -Srshy
- __- ----- shy-yenIIL -ipound f~~~ middotmiddot=~aiij O~f5t=Omiddot~r09 middot1 05 NL NL NL NL
Notes 1 ST (Systemic) = 30 Q 5 2 CA (Carcin~genic) = Median Flow 3 NL =Not Li$ted 4 NO =Not Detected 5 Apportioned Flow Rate (30 Q 5) =16827 cubic feetsecond
Apportioned Flow Rate (Median Flow) =52380 cubic feetsecond 6 North Side Max Q (flow rate) =312798 cubic feet per day
South Side Max Q =309722 cubic feet per day
WO 640EE Duffield Associates
EXCEL0640EE4BXLS January 1999
GROUNDWATER DISCHARGE
Discharge of Columbia and Upper Potomoc Formations
Columbia
where
A =22 fl x 1600 fl
K = 42 ftIday
dh -= 00015ft1ft dl
Q = 222 cubic feetday =00025 cubic feetsecond
Upper Potomoc Formation
where
A =25 ft x 1600 ft
K = 87 ftIday
~~ =000125 ftlfl
Q =435 cubic feetday =0005 cubic feetsecond
to the Christina River
[Darcy Law]
[cross sectional area of discharge] Halby RI Report Figure 5-1
[hydraulic conductivity] Halby RI Report page 3-45
[hydraulic gradient] Halby RI Report Figure 3-13
[Darcy Law]
[cross sectional area of discharge] Halby RI Report Figure 5-1
[hydraulic conductivity] Halby RI Report page 3-45
[hydraulic gradient] Halby RI Report Figure 3-15
( Lower Potomac Water-Bearing middotUnit Representative groundwater levels in the lower Potomac water-bearing unit are shown in figures 3-17 and 3-18 maps from all rounds of water-level measurement are in Appendix C The groundwater appears to flow primarily to the south The average hydraulic gradient in the lower Potomac is 00014 ftft The groundwater-flow direction and average hydraulic conductivity are consistent with those reported by EBASCO (1990) At least one water-supply pumping center is located about 2 miles south of the site pumping at this location probably is affecting water levels in this unit beneath the study area
Water-level maps for September 24 1993 and for February 3 and March 11 1994 show a slight diversion in flow direction to the southeast in the southern part of the study area Groundwater in the lower Potomac may be diverted to the southeast if pumping south of the site is suspended temporarily In this case groundwater in the lower Potomac would be expected to flow toward the southeast and potential discharge into the Delaware River or toward pumping centers in New Jersey east of the river The flow diversion toward the southeast may be observed only in the southern part of the study area because in the northeastern part of the study area (near wells SMW-12 and IMW-12) the lower Potomac appears to be nearly truncated by low-permeability Recent sediment The sediment would restrict or even prevent flow in this unit toward the east in the northeastern part of the study area
3534 Hydraulic Characteristics
A previous investigation (EBASCO 1990) estimated the hydraulic conductivity in the study area the results are in Table 3-5 The current RI estimated the hydraulic properties of wells at either three or four locations in each water-bearing unit The hydraulic properties are shown in Table 3-6 Data from the individual tests are in TM 3 Monitoring-Well Installation in Appendix A
The ranges and geometric means of the hydraulic conductivity for each unit using the data in tables 3-5 and 3-6 are
bull Columbia Range 092 to 12 feet per day (ftJday) Geometric mean 42 ftJday
bull Upper Potomac Range 11 to 32 ftJday Geometric mean 87 ftJday
bull Lower Potomac Range 018 to 43 ftlday Geometric mean 14ftJday
--
3-45
~ bullbull
CALCULATION
OF
DILUTION FACTORS
Dilution Factor Calculation
OF (dilution factor) =River flowgroundwater discharge
7010 (chronic exposure)
= 025 10625OF (Columbia) 00025
= 10625
025 10625OF (Potomoc) = 005
= 5312
1010 (acute exposure)
= 025 8516DF (Columbia) 00025
=8516
= 025 8516DF (Potomoc) 0005
= 4258
Note Dilution factors are calculated using 25 of the volume of the river flow to reflect partial mixing of the groundwater discharge with the river
bull I bull Tabl
Computed and Apportioned Critical Low Flows In the Christina River at the Potts Property Site
Station Name 01478000 01479000 01479197 01480015 01481500 Total Location Christina llhite Clay Mill Creek Red Clay Brandywine
Upper Drainage Area 2050 8910 366 5240 31400 47966 Square Miles Computed Median 1300 7600 150 5000 33200 47250 CFS Computed 7010 170 1500 012 1000 7200 9882 CFS Computed 1010 046 1300 010 600 6200 8156 CFS Computed 3005 330 2460 037 2100 10500 15427 CFS
Lower Drainage Area 5493 521 1021 209 553 7797 Square Miles Percentage 26795 585 27896 399 176 1626 Apportioned Median 3483 444 418 199 585 5130 CFS Apportioned 7010 456 088 033 040 127 743 CFS Apportioned 1010 123 076 028 024 109 360 CFS Apportioned 3005 884 144 103 084 185 1400 CFS
Total Drainage Area 7543 9431 1387 5449 31953 55763 Square Miles Median Flow 4783 8044 568 5199 33785 52380 CFS 7010 Flow 626 1588 045 1040 7327 10625 CFS 1010 Flow 169 1376 038 624 6309 8516 CFS 3005 Flow 1214 2604 140 2184 10685 16827 CFS
WO 0840EE Duffield Aaloclatea Inc
EXCEL0640EE3XLS September 1988
Table E - GW05 Offslte Groundwater Concentration Calculations
Halbv Chemical Site
Chemical
Ranae of Detected Values Maximum MinImum
Value Value (uaL (uaU
Normal Mean (uQL)
Normal Standard Deviation
Transformed Mean tuaIL
Transformed Standard Deviation
H Statistic
Results of
W-teat
Normal 95 UCL
(ualU
Lognormal 95shy
UCL hiaIL)
MaxImum or
95UCL (uQL
Columbia Water-Bearlna Unit Volatllbullbull Benzene 10E+OO 10E+OO 29E+01 71Et01 21EtOO 14EtOa 1BEtOO I 66EtOl 96Et01 10EtOO 2-Butanone 18Et02 15Et02 32Et01 62EtOl 22EtOO 13EtOO 18E+OO t 64E+Ol 10Et02 10E+02 Carbon disullide 2 1Et02 10EtOO 60EtOl BBEtOl 28EtOO 18EtOO 24EtOO I 11Et02 11Et03 21 Et02 t 1middotDlchloroethane 35Eit02 34Et02 62EtOl t3Et02 24E+OO t6EtOO t8EtOO I t3Et02 32Et02 32E+02 1 ImiddotDlchloroelhene 11 Et02 96EtOl 22EtOl 38E+Ol 22EtOO t 2EtOO tBEtOO t 42E+01 54E+01 54E+Ol Tetrachloroethene 50E+OO 60E-Ot 29EtOl 71E+Ol t9EtOO 16EtOO 41EtOO I 66E+Ol 16E+02 50EtOO Toluene 66Et03 90E-Ol 67E+02 19Et03 25EtOO 27EtOO a5EtOO I middot17E+03 96E+04 66E+03 Trlchtoroethene 12Et02 10E+OO 15E+Ol 33EtOl 16EtOO 13EtOO 35EtOO l 32EtOl 49E+01 49E+Ol Vlnvl chloride 23E+02 79EtOl 54EtOl 90EtOl 27EtOO 16E+OO 41EtOO I tOE+02 40E+02 23Et02 Pesticide Aldrin I 14EmiddotOl I 14E-01 I 35Emiddot02 I 33E-02 I -35EtOO 50E-Ot 22EtOO I 52E-02 45E-02 52E-02 InorRanlcs Ammonia 39Et05 27Et03 86Et04 15Et05 34Et03 16Et03 66EtOO l 21E+05 14Et07 39E+OS Antimonv 20EtOl 20E+Ot 23E+Ol B5EtOO 30E+OO 48E-Ol 21EtOO I 27E+01 32Et01 20EtOl Arsenic 14Et03 27EtOO 26Et02 52E+02 35EtOO 21EtOO 52EtOO L 53Et02 88Et03 14Et03 Barium 54Et02 22EtOl 12Et02 17E+02 3BEtOO 16EtOO 40E+OO L 21Et02 96Et02 54Et02 Bervlllum 40E+OO 53E-Ol t7E+OO 14E+OO -12Emiddot02 12EtOO 33EtOO I 24E+OO 6BEtOO 40EtOO Cadmium 57Et02 B9E+OO aaEt01 20E+02 1BE+OO 21EtOO 52EtOO I 19E+02 14Et03 57Et02 Chromium 12EtOl 26E+OO 38EtOO 3 I E+OO 11 EtOO 75E-Ol 25E+OO I 54E+OO 6BEtOO 68EtOO Cobalt 14Et04 5BEtOO 39Et03 54Et03 56EtOO 35EtOO a3EtOO L 67E+03 NA 14Et04 Cvanlde 48EtOl 14E+Ol 14Et01 17Et01 22E+OO 93E-01 41E+OO I 28E+Ol 73EtOl 48Et01 Manaanesamp 18Et05 91E+Ol 54Et04 76Et04 8BE+OO 27EtOO 6SEtOO L 93E+04 47Et07 1BEt05 Nickel 96Et02 98E+OO 30Et02 41Et02 41EtOO 21E+OO 52E+OO L 52E+02 16E+04 96Et02 Silver 28Et01 l4EtOl 80EtOO 10EtOl 1AEtOO 12EtOO 34EtOO L 13EtOl 30EtOl 28E+01 Thallium 64EtOl 68E+OO 12EtOt 19EtOl 1tEtOO 19EtOO 48EtOO L 22Et01 33Et02 64Et01 Thlocvanate 28EtOS 20Et02 87Et04 11EtOS 82EtOO 42EtOO 17Et01 N 1BEt05 NA 18E+05 Zinc 22Et05 76E+01 61Et04 B9Et04 73EtOO 44E+OO IOEtOl I 11E+OS NA 11Et05
Upper Potomac Water-Bearing Unit Volatllbullbull Carbon disulfide I 71E+01 I 71EtOl I 97EtOO I 1BEtOt I 18EtOO I 71E-01 I 24E+OO I I I 18EtOl I 12EtOl I 18EtOl Inoraanlcs Ammonia 78E+04 20Et02 16Et04 2BE+04 96E+02 26Et03 87E+OO L 37Et04 9 1EtOB 78E+Q4 Arsenic 32Et01 1BE+OO 71E+OO 94EtOO 13EtOO 12EtOO 32E+OO l 12Et01 23EtOl 23E+01 Bervllium 45E+OO 81Emiddot01 l4EtOO 14EtOO -35E-Ol 13EtOO 34E+OO I 20EtOO 60EtOO 45EtOO Cadmium 13E+Olmiddot 13EtOl 33EtOO 33EtOO 94E-01 B3E-01 23EtOO I 48E+DO 46EtOO 48E+OO Coball 49Et04 51EtOO 7BEt03 17Et04 50E+OO 39E+OO 87EtOO L 16E+04 NA 49Et04 Manoanese 9BEt04 70Et01 22E+04 33E+04 83EtOO 25EtOO 57EtOO L 38E+04 46Et06 98Et04 Nickel 29Et03 38EtOO 53Et02 10Et03 38EtOO 25EtOO 5BEtOO I 10Et03 66Et04 29Et03 Selenium 80EtOO 70E+OO 27EtOO 24EtOO BSE-01 91E-Ol 27E+OO l 39EtOO 57EtOO 57EtOO
filename GRNDWROFXLS 112796 works 95 UCLOF Par 1 of 2 730AM
Table E - GW05 Offslte Groundwater Concentration Calculations
Halby Chemical Site
ChemIcal
Ranae of Detected Values Maximum Minimum
Value Value Normal Mean
Normal Siandard Deviation
Transformed Transformed Siandard
Mean Deviation H
Slatlslle
Results
0Wmiddotles
Normal 95 UCL
Lognormal 95 UCL
Maximum or
95UCL luaL lualU lualU luaIL luaIL luaIL luaIL
Sliver 13E+02 19E+01 13E+01 33E+01 12E+OO 15E+OO 3 E+OO I 28E+01 46E+01 46E+01 Thallium 21E+02 3SE+OO 20E+01 57E+01 87EmiddotOl 19E+OO 4 E+OO I 46E+01 18E+02 18E+02 Thlocvanate 29E+04 11E+02 49E+03 11E+04 60E+oo 25E+OO 8 E+OO L 13E+04 30E+07 29E+04 Vanadium 82E+02 69E+OO 66E+01 22E+02 16E+OO 20E+OO 46E+OO I 17E+02 42E+02 42E+02 Zinc 36E+OS 10E+01 80E+04 13E+05 65E+OO 45E+OO 10E+01 I 14E+05 NA 14E+05
L bull lognormal distribution based on wmiddottest results N bull Normal distribution based on wmiddottest results I bull Inconclusive based on wmiddottest reSUlts Maximum UCl 0 either the normal or lognormal (not to exceed maximum concentration) used per guidance rom Nancy Rlos-Jaolla I Nil bull Could not be determined based on distribution
flename GRNDWROFXlS 730AMworksheet 95 UCLOF Page 2 of 2
112796
DUFFIELD TABLE 6
Table 6 WATER QUALITY DATA
Christina River Vicinity of 1-495 Crossing
DATE
Water
Temperature DC
pH
Total Total Hardness Suspended
mgll Solids mgI
Specific
Conductivity (25C) uSem
(field)
Specific
Conductivity (t) uScm
(calc)
Rt Temperature
Factor ISalinity ppt ISalinity ppt IFresh or
(calc) (field) Marine (1
9511114 6 _ - _ 95112112 1
- -shy 9601130 3 --- 960213 3
- -shy - shy _ -shy - 96031~ 35 9604ha _ ----shy
14 ---9605hj-- shy 14 _-shy 24960611 - 9607i1Ef shy
---- shy24
-96JCi918 shy ---19shy -
_ 961119 shy_ bullbull __ bullbull ___0
9 -970114 -shy
4 _____ bullbull _
1 --9770318 - shy
__ __shy _ 76
- 970528 _shy__--_ ~
18 - middot9707115shy
- __-_ -shy -shy28
- 970916shy--_--- _shy
23 - - -97i111a ----7----shy
72 64 42 110
71 94 24 118 62 68 46 105
68 80 8 114
51 80 28 152 67 80 12 175
- - - ---- shy
73 70 15 175 84 3157 22 - -shy shy - shy - -shy _shy ---shy
74 78 27 190 77 98 49 348
- _ - - __ A - - bull
72 74 14 120 73 106 9 165 78 76 13 268
-~- -shy shy - _ - _ -- shy -----shy -- 73 82 16 253
- --- --shy -shy -- 83 248 19 1767 -shy - _ ~ - -- --shy -shy78 336 36 2618
- 21fi - -shy ---_ _shy ----1577--shy71 25
70081 639088 60879
660972 895812 1382325- ---~ _ -
1382325 3089835
186371 - - _- 3081192 - -
83328 ~
89364 17893268
-----_ -shy _ shy2191739 18682491_-_ _shy -shy
25179924 _shy ----shy10348274
0001633 - ------shy
0001489 __ bull ___ 4 _ bull
0001419 000154 - -_ -shy
0002087 0003221
- _ -shy ~ -shy -0003221 00072
0-004343 - -shy - -shy -----
000718-----__- _- 0001942 0002082
-shy _- --_ _-shy000417 -- --- - _-shy
0005107 0043535 - -shy _ -shy0058675 0024114-shy
-
-10536174 - -shy -shy
-1810657 -shy ---shy
-1489573 ---shy _ __-
-1489573 _--__- -14132973
_ --
-10164668 ----gt-------shy
-10164668 785477300shy
----__-shy785477396-shy ------_shy
3756574 [6459903shy- ~18~10657-
--~840Y9444 -
middot266095747 -107364768shy___ shy -----shy
708215297 --91911765shy
0022299 0 F F0006963 0 F0010908 0 - -_ -- - - -
0013148 0 F - - -shy -
F0025182 0 0 F0078651
_-----~-- 1=shy0078651 0 0206749 0 F --OT29361 shy
0 F-----_shy -- -=- _ 0194391 0
6~035956 -- F-shy
0 --- - shy
0017586 2 F ---_ --shy - _shy - -shy F---middotshy0084657 0 ----__--shy - shy - -_ --middotmiddot-F-shy0137056 01
----shy -----shy - Fmiddot shy122597 09
- --__-- -shy - -1=-shy1654113 14 0612462 -O~8 ----Fshy
NOTES 1 DC =degrees CelsiUS 2 mgll =milligrams per liter
3 uScm =micro Siemens per centimeter (uSem at 25degC) which is equivalent to micro mhos per em (umhoslcm at 25degC) 4 Rt =Ratio of the sample conductivity at original sample temperature divided by the condutivity of standard seawater
at a salinity of 35 and a temperature of 15DC (lewis 1980 Hill et AI 1986 APHA 1989) 5 ppt = parts per thousand 6 Christina River water quality data obtained from the State of Delaware Department of Natural Resources and Environmental Control
(DNREC) Watershed Assessment Section Christina STORET No 106291 CONRAil BRIDGE (near Port of Wilmingtonll-495 crossing)
wo 640EE Duffield AIOCItea Inc
EXCEl0640EE5XlS September 1998
CONCENTRATIONS
OF
SELECTEDCHENllCALS
IN
SURFACE WATER
--
I~(
v
I - eM
1CAd fn
lEGENgt ~_IE aIlfAQ-WAWI __ LOCATIClH
__ HOlIIi__
yCHII _T ~_
+-- HOiIaampR _
bull IE_ ulCTIClH DO INJIlOST -a
HOlEl ALL UNITS _ WIalOGIUMIAllEftr-~
LJ ~ ~=COAC~~ _DE~-
8 bull CHMICAL DElEClED AIIClClAlIO -u IG bull NIlT DElECIEIi bull HOT AVALAILpound
M-UU_TR=C_R MCIlEATIClHM CAI_1-shyPlAJ ~ fJIlAJ a1 Du
3-U to~ Ul 12-0 -a_a1IIll ~
F9Se 4-11 CONCENTRATIONS OF SELECTED CHEMICALS IN SURFACE WATER bullbullbulli_bull -1
Hdly 0lIRicII Si8 G1llIDll3 17-AN-1l97
--
SURFACE WATER QUALITY
SAMPLE LOCATIONS
~
~J~ IEIJ~ ~~ jf
if ~~ ~ ~ WILMINGTON HARBOR 1 ~lDISPOSAL AREA
~~~ Jt EDGEMOOR ~~~ if
1amp DISPOSAL AREA
l raquo~~ j ~q ~~ Jf We Siroctu
gtfftJ ~
I ~~ I ~~~ Markor Ugh ~ S1 ~~ I OUll( _ ~
f lt~~~ num 0TT1
Cti$I ft
Te QJ -c ~ II
ii ~
~
~rtr I
cf ~
Ir- _fb- Surface Water Quality Sample Locations SPRING CITY PAI1lMJ
tMlflllHMEHTAl (215)9484700 SERVICES(See Table A4)
SEDIMENT
SAMPLE LOCATIONS
---
I
if ~ t
$ Q
II II
II
1I I
Key
bull Sediment composite sample polnta
bull Bulkwater sample
EDGEMOOR
DISPOSAL AREA
jE
I
QJ ~ ~
tr
~ _lbshyshy
~~
fJ~ ~~ if ~~ 3~ N HARBOR ~ WILMINGTO AREA (it~~ DISPOSAL
j ~~t
~~ fmiddot1 ~~~ jlV gtO~ gt-gt~~ jf
~ l ~~~ jf Weir Structure I $ raquo fJ~V -~~
I I lb--
1 ----ft_-1 ~~~ Marker Light II - II I
6 I~ OV~lall bull ~ ~
bull I 1 IDNIlECj ~ioiiiiilucJ~(STATION 2 I CJ
I IS(ACE) ra 11bullbull
I I
I
SPRING CITY PAI1lMISediment Sample Locations tNVIRONMEHTAl (215)940middot4700
(See Table AS) SERVICES
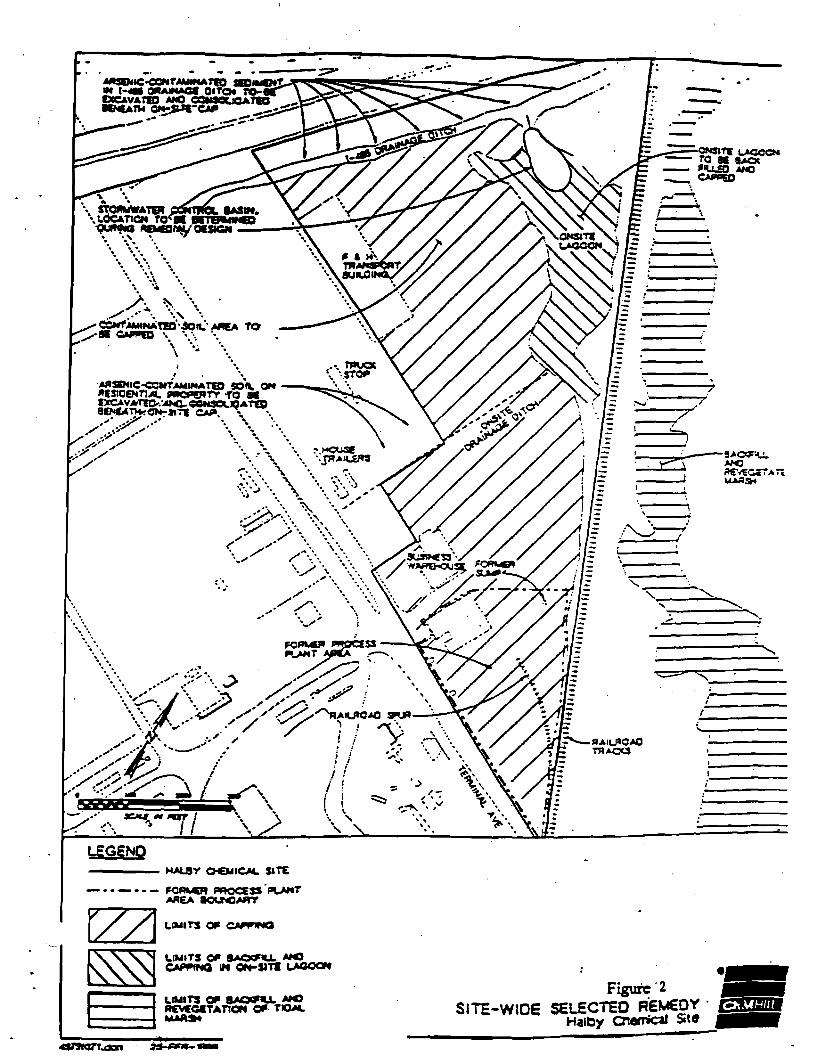

~
Table 8A Pre-Remedial Action Impact to Surface Water Quality
Marine and Fresh Water Acute
AQUATIC LIFE NORTH SOUTH NORTH SOUTH
SITE SITE SITE SITE SITE SITE AVERAGE AVERAGEiAVERAGE AVERAGE AVERAGE AVERAGE MARINE ACUTE FRESH ACUTE
PARAMETER I (ugll) (ugll) (ugll) (ugll) (ugll) (ugll) (1 Q 10) (ugll) (1 Q 10) (ugll) Arsenic (III) 1280 1840 140 00541 00389 00030 69 360
PREMIXING POSTMIXING
- -- -- _-- - _ - --- --- - - - 00015- -------- 43- ----~-- ----1--79(4)--shyCadmium 176 194 70 00074 00041
- - ---- __ - -_ -- -_ - -_ -------_-- --shy~_-_
Chromlum(II1Y -- 65 - 65 NO 00003 00001 NO NL 98432 NO ----- ---------1100----- ----- 16---shy
----- --- -- - --- -- - - -__------- -------- -shyef~~-~i~IjlI~ij -- 1~~~0~+-26~~Ori 5~1~0 0~~~3 O~~01 ------ NL NL NL
00082--- -------140----- -----337--8--shy~~~d - ----j_3_l __ ~ 53_ 390 00052 I 00032 bullbull _ _ bull - __ bull ~ __ bullbull bullbull __ 0 bullbull _ _
2~~_~~ryJI_L NO___ _ ND NO ___ _ NO __ I _NO I NO 21 24 ----- _----_- -_ -- --- ---_ ------ - --__ _~-----
00011 75 789~~~el ----~~~o--- ~~~~ 6~~6 ~~~~~ ~~l~~ 01407--- - -- -----95------- --------65~04---
Notes 1 NL = Not Listed 2 NO =Not Detected 3 Apportioned Flow Rate (1 Q 10) = 8516 cubic feeUsecond 4 Numbers in BOLD are calculated freshwater criteria based on an assumed water hardness of
50 mgll (CaCOJ )
5 North Side Max Q (flow rate) = 312798 cubic feet per day South Side Max Q = 309722 cubic feet per day
WO 640EE
EXCEL0640EE4BXLS Duffield Associates IncJanuary 1999
Table 8B Pre-Remedial Action Impact to Surface Water Quality
Marine and Fresh Water Chronic
PREMIXING I POSTMIXING I AQUATIC LIFE
I
NORTH SOUTH NORTH SOUTH SITE SrrE I SITE SITE SITE SITE MARINE
AVERAGE i AVERAGE iAVERAGE AVERAGE AVERAGE I AVERAGE CHRONIC (7010) FRESH CHRONIC IPARAMETER (ugJl) (ugJl) (ugll) (ugll) (ugtl) (ugl) (ugtl) (7010) (ugl)i
lArsenic(llI) 1280 1840 140 00434 00312 00024 36 190Cadmium ---- - 176 1- - - ~ 70 00060 00033 00012----------93------------06-6--(4) shy194 I
- -- ------- ------------ - - I -- I i -- -- - - --- - - - --- - ------ shy
Chromium (III) 65 65 NO 00002 00001 NO NL 1 11732 ------------------ -- --- ------- ------ I ---_ ---- ---- ------------------------------------------
Chromium (VI) 65 I 65 ND 00002 00001 NO 50 11Iron-- ----- - 195800 I 265700 - 56100 66328 45019 i- 0950~5 --- -----NL ---- - ------1-00--0-middot shyLeBeC- -- --- - 123 153 390 00042 I 00026 - 00066- ----- ----56middot--- ---- --------32shyM~~cury(i-I) --- -- ND2 i---ND--- NO ND ND i ND- -----0025middot-------- -----O~012 Nickel------ -7550----1--10370--- 50 --- - - 02558 I 0175700008--- ----------83 ---~--- - ---- 8771 IZlnc 54260--1-78070- 6660--- 18381 1322ffmiddot 01128-----------86------- --------=--
Notes 1 NL = Not Listed 2 NO =Not Detected 3 Apportioned Flow Rate (7 0 10) = 10625 cubic feetsecond 4 Numbers in BOLD are calculated freshwater criteria based on an assumed water hardness of
50 mgtl (CaC03)
5 North Side Max 0 (flow rate) = 312798 cubic feet per day South Side Max 0 = 309722 cubic feet per day
WO 640EE
EXCEl0640EE4BXlS Duffield Associates IncJanuary 1999
Table Be Pre-Remedial Action Impact to Surface Water Quality
Human Health
PREMIXING I POSTMIXING HUMAN HEALTH NORTH SOUTH NORTH I SOUTH i SITE I SITE I SITE SITE I SITE I SITE MARINE IFRESHWATER FRESHWATER HUMAN
ESTUARINEi (Fish Ingestion (Fish and Water HEALTH PARAMETER I (ugl) (ugl) (ugl) (ugl) (ugl) (ugl)
AVERAGEAVERAGEIAVERAGE AVERAGE AVERAGElmiddot AVERAGE (ugll) Only) (ugll) Ingestion) (ugll) CONCERN NL NL I 50 CA 2
I
Arsenic (III) __1_280 1 18401_ 140 00274 00197 I 00015 -- 1middotmiddotmiddotmiddotmiddotmiddotmiddot_- -----0middot- --__shyNL NLmiddot 10 ST 1g~d~ium 1gt _194 ___7deg 00038 j 00021 I 00007
120000middot1 840000 - 3(000 --sr-Chromium (III) 65 65 NO 00001 I 00001 NO Chromium (VI) 65 65 NO 00001 i 00001 NO 590 i _4200_ X70__ ST____ -middoto-- - -_ - - - I I Iron 195800 265700 56100 NL 3 i NL NLI
~~ middotmiddotmiddotmiddotI--~-~~------ ----~k_- -~k-~ea-d----1~3 _- ~_j~3~--~middot~middot3-90_ O0026_l00016_ 00042 ----__ _shy15 71
~-_
2 ST 810 --- -sfoltf---middot middot-middotmiddot~-620-~- -Srshy
- __- ----- shy-yenIIL -ipound f~~~ middotmiddot=~aiij O~f5t=Omiddot~r09 middot1 05 NL NL NL NL
Notes 1 ST (Systemic) = 30 Q 5 2 CA (Carcin~genic) = Median Flow 3 NL =Not Li$ted 4 NO =Not Detected 5 Apportioned Flow Rate (30 Q 5) =16827 cubic feetsecond
Apportioned Flow Rate (Median Flow) =52380 cubic feetsecond 6 North Side Max Q (flow rate) =312798 cubic feet per day
South Side Max Q =309722 cubic feet per day
WO 640EE Duffield Associates
EXCEL0640EE4BXLS January 1999
GROUNDWATER DISCHARGE
Discharge of Columbia and Upper Potomoc Formations
Columbia
where
A =22 fl x 1600 fl
K = 42 ftIday
dh -= 00015ft1ft dl
Q = 222 cubic feetday =00025 cubic feetsecond
Upper Potomoc Formation
where
A =25 ft x 1600 ft
K = 87 ftIday
~~ =000125 ftlfl
Q =435 cubic feetday =0005 cubic feetsecond
to the Christina River
[Darcy Law]
[cross sectional area of discharge] Halby RI Report Figure 5-1
[hydraulic conductivity] Halby RI Report page 3-45
[hydraulic gradient] Halby RI Report Figure 3-13
[Darcy Law]
[cross sectional area of discharge] Halby RI Report Figure 5-1
[hydraulic conductivity] Halby RI Report page 3-45
[hydraulic gradient] Halby RI Report Figure 3-15
( Lower Potomac Water-Bearing middotUnit Representative groundwater levels in the lower Potomac water-bearing unit are shown in figures 3-17 and 3-18 maps from all rounds of water-level measurement are in Appendix C The groundwater appears to flow primarily to the south The average hydraulic gradient in the lower Potomac is 00014 ftft The groundwater-flow direction and average hydraulic conductivity are consistent with those reported by EBASCO (1990) At least one water-supply pumping center is located about 2 miles south of the site pumping at this location probably is affecting water levels in this unit beneath the study area
Water-level maps for September 24 1993 and for February 3 and March 11 1994 show a slight diversion in flow direction to the southeast in the southern part of the study area Groundwater in the lower Potomac may be diverted to the southeast if pumping south of the site is suspended temporarily In this case groundwater in the lower Potomac would be expected to flow toward the southeast and potential discharge into the Delaware River or toward pumping centers in New Jersey east of the river The flow diversion toward the southeast may be observed only in the southern part of the study area because in the northeastern part of the study area (near wells SMW-12 and IMW-12) the lower Potomac appears to be nearly truncated by low-permeability Recent sediment The sediment would restrict or even prevent flow in this unit toward the east in the northeastern part of the study area
3534 Hydraulic Characteristics
A previous investigation (EBASCO 1990) estimated the hydraulic conductivity in the study area the results are in Table 3-5 The current RI estimated the hydraulic properties of wells at either three or four locations in each water-bearing unit The hydraulic properties are shown in Table 3-6 Data from the individual tests are in TM 3 Monitoring-Well Installation in Appendix A
The ranges and geometric means of the hydraulic conductivity for each unit using the data in tables 3-5 and 3-6 are
bull Columbia Range 092 to 12 feet per day (ftJday) Geometric mean 42 ftJday
bull Upper Potomac Range 11 to 32 ftJday Geometric mean 87 ftJday
bull Lower Potomac Range 018 to 43 ftlday Geometric mean 14ftJday
--
3-45
~ bullbull
CALCULATION
OF
DILUTION FACTORS
Dilution Factor Calculation
OF (dilution factor) =River flowgroundwater discharge
7010 (chronic exposure)
= 025 10625OF (Columbia) 00025
= 10625
025 10625OF (Potomoc) = 005
= 5312
1010 (acute exposure)
= 025 8516DF (Columbia) 00025
=8516
= 025 8516DF (Potomoc) 0005
= 4258
Note Dilution factors are calculated using 25 of the volume of the river flow to reflect partial mixing of the groundwater discharge with the river
bull I bull Tabl
Computed and Apportioned Critical Low Flows In the Christina River at the Potts Property Site
Station Name 01478000 01479000 01479197 01480015 01481500 Total Location Christina llhite Clay Mill Creek Red Clay Brandywine
Upper Drainage Area 2050 8910 366 5240 31400 47966 Square Miles Computed Median 1300 7600 150 5000 33200 47250 CFS Computed 7010 170 1500 012 1000 7200 9882 CFS Computed 1010 046 1300 010 600 6200 8156 CFS Computed 3005 330 2460 037 2100 10500 15427 CFS
Lower Drainage Area 5493 521 1021 209 553 7797 Square Miles Percentage 26795 585 27896 399 176 1626 Apportioned Median 3483 444 418 199 585 5130 CFS Apportioned 7010 456 088 033 040 127 743 CFS Apportioned 1010 123 076 028 024 109 360 CFS Apportioned 3005 884 144 103 084 185 1400 CFS
Total Drainage Area 7543 9431 1387 5449 31953 55763 Square Miles Median Flow 4783 8044 568 5199 33785 52380 CFS 7010 Flow 626 1588 045 1040 7327 10625 CFS 1010 Flow 169 1376 038 624 6309 8516 CFS 3005 Flow 1214 2604 140 2184 10685 16827 CFS
WO 0840EE Duffield Aaloclatea Inc
EXCEL0640EE3XLS September 1988
Table E - GW05 Offslte Groundwater Concentration Calculations
Halbv Chemical Site
Chemical
Ranae of Detected Values Maximum MinImum
Value Value (uaL (uaU
Normal Mean (uQL)
Normal Standard Deviation
Transformed Mean tuaIL
Transformed Standard Deviation
H Statistic
Results of
W-teat
Normal 95 UCL
(ualU
Lognormal 95shy
UCL hiaIL)
MaxImum or
95UCL (uQL
Columbia Water-Bearlna Unit Volatllbullbull Benzene 10E+OO 10E+OO 29E+01 71Et01 21EtOO 14EtOa 1BEtOO I 66EtOl 96Et01 10EtOO 2-Butanone 18Et02 15Et02 32Et01 62EtOl 22EtOO 13EtOO 18E+OO t 64E+Ol 10Et02 10E+02 Carbon disullide 2 1Et02 10EtOO 60EtOl BBEtOl 28EtOO 18EtOO 24EtOO I 11Et02 11Et03 21 Et02 t 1middotDlchloroethane 35Eit02 34Et02 62EtOl t3Et02 24E+OO t6EtOO t8EtOO I t3Et02 32Et02 32E+02 1 ImiddotDlchloroelhene 11 Et02 96EtOl 22EtOl 38E+Ol 22EtOO t 2EtOO tBEtOO t 42E+01 54E+01 54E+Ol Tetrachloroethene 50E+OO 60E-Ot 29EtOl 71E+Ol t9EtOO 16EtOO 41EtOO I 66E+Ol 16E+02 50EtOO Toluene 66Et03 90E-Ol 67E+02 19Et03 25EtOO 27EtOO a5EtOO I middot17E+03 96E+04 66E+03 Trlchtoroethene 12Et02 10E+OO 15E+Ol 33EtOl 16EtOO 13EtOO 35EtOO l 32EtOl 49E+01 49E+Ol Vlnvl chloride 23E+02 79EtOl 54EtOl 90EtOl 27EtOO 16E+OO 41EtOO I tOE+02 40E+02 23Et02 Pesticide Aldrin I 14EmiddotOl I 14E-01 I 35Emiddot02 I 33E-02 I -35EtOO 50E-Ot 22EtOO I 52E-02 45E-02 52E-02 InorRanlcs Ammonia 39Et05 27Et03 86Et04 15Et05 34Et03 16Et03 66EtOO l 21E+05 14Et07 39E+OS Antimonv 20EtOl 20E+Ot 23E+Ol B5EtOO 30E+OO 48E-Ol 21EtOO I 27E+01 32Et01 20EtOl Arsenic 14Et03 27EtOO 26Et02 52E+02 35EtOO 21EtOO 52EtOO L 53Et02 88Et03 14Et03 Barium 54Et02 22EtOl 12Et02 17E+02 3BEtOO 16EtOO 40E+OO L 21Et02 96Et02 54Et02 Bervlllum 40E+OO 53E-Ol t7E+OO 14E+OO -12Emiddot02 12EtOO 33EtOO I 24E+OO 6BEtOO 40EtOO Cadmium 57Et02 B9E+OO aaEt01 20E+02 1BE+OO 21EtOO 52EtOO I 19E+02 14Et03 57Et02 Chromium 12EtOl 26E+OO 38EtOO 3 I E+OO 11 EtOO 75E-Ol 25E+OO I 54E+OO 6BEtOO 68EtOO Cobalt 14Et04 5BEtOO 39Et03 54Et03 56EtOO 35EtOO a3EtOO L 67E+03 NA 14Et04 Cvanlde 48EtOl 14E+Ol 14Et01 17Et01 22E+OO 93E-01 41E+OO I 28E+Ol 73EtOl 48Et01 Manaanesamp 18Et05 91E+Ol 54Et04 76Et04 8BE+OO 27EtOO 6SEtOO L 93E+04 47Et07 1BEt05 Nickel 96Et02 98E+OO 30Et02 41Et02 41EtOO 21E+OO 52E+OO L 52E+02 16E+04 96Et02 Silver 28Et01 l4EtOl 80EtOO 10EtOl 1AEtOO 12EtOO 34EtOO L 13EtOl 30EtOl 28E+01 Thallium 64EtOl 68E+OO 12EtOt 19EtOl 1tEtOO 19EtOO 48EtOO L 22Et01 33Et02 64Et01 Thlocvanate 28EtOS 20Et02 87Et04 11EtOS 82EtOO 42EtOO 17Et01 N 1BEt05 NA 18E+05 Zinc 22Et05 76E+01 61Et04 B9Et04 73EtOO 44E+OO IOEtOl I 11E+OS NA 11Et05
Upper Potomac Water-Bearing Unit Volatllbullbull Carbon disulfide I 71E+01 I 71EtOl I 97EtOO I 1BEtOt I 18EtOO I 71E-01 I 24E+OO I I I 18EtOl I 12EtOl I 18EtOl Inoraanlcs Ammonia 78E+04 20Et02 16Et04 2BE+04 96E+02 26Et03 87E+OO L 37Et04 9 1EtOB 78E+Q4 Arsenic 32Et01 1BE+OO 71E+OO 94EtOO 13EtOO 12EtOO 32E+OO l 12Et01 23EtOl 23E+01 Bervllium 45E+OO 81Emiddot01 l4EtOO 14EtOO -35E-Ol 13EtOO 34E+OO I 20EtOO 60EtOO 45EtOO Cadmium 13E+Olmiddot 13EtOl 33EtOO 33EtOO 94E-01 B3E-01 23EtOO I 48E+DO 46EtOO 48E+OO Coball 49Et04 51EtOO 7BEt03 17Et04 50E+OO 39E+OO 87EtOO L 16E+04 NA 49Et04 Manoanese 9BEt04 70Et01 22E+04 33E+04 83EtOO 25EtOO 57EtOO L 38E+04 46Et06 98Et04 Nickel 29Et03 38EtOO 53Et02 10Et03 38EtOO 25EtOO 5BEtOO I 10Et03 66Et04 29Et03 Selenium 80EtOO 70E+OO 27EtOO 24EtOO BSE-01 91E-Ol 27E+OO l 39EtOO 57EtOO 57EtOO
filename GRNDWROFXLS 112796 works 95 UCLOF Par 1 of 2 730AM
Table E - GW05 Offslte Groundwater Concentration Calculations
Halby Chemical Site
ChemIcal
Ranae of Detected Values Maximum Minimum
Value Value Normal Mean
Normal Siandard Deviation
Transformed Transformed Siandard
Mean Deviation H
Slatlslle
Results
0Wmiddotles
Normal 95 UCL
Lognormal 95 UCL
Maximum or
95UCL luaL lualU lualU luaIL luaIL luaIL luaIL
Sliver 13E+02 19E+01 13E+01 33E+01 12E+OO 15E+OO 3 E+OO I 28E+01 46E+01 46E+01 Thallium 21E+02 3SE+OO 20E+01 57E+01 87EmiddotOl 19E+OO 4 E+OO I 46E+01 18E+02 18E+02 Thlocvanate 29E+04 11E+02 49E+03 11E+04 60E+oo 25E+OO 8 E+OO L 13E+04 30E+07 29E+04 Vanadium 82E+02 69E+OO 66E+01 22E+02 16E+OO 20E+OO 46E+OO I 17E+02 42E+02 42E+02 Zinc 36E+OS 10E+01 80E+04 13E+05 65E+OO 45E+OO 10E+01 I 14E+05 NA 14E+05
L bull lognormal distribution based on wmiddottest results N bull Normal distribution based on wmiddottest results I bull Inconclusive based on wmiddottest reSUlts Maximum UCl 0 either the normal or lognormal (not to exceed maximum concentration) used per guidance rom Nancy Rlos-Jaolla I Nil bull Could not be determined based on distribution
flename GRNDWROFXlS 730AMworksheet 95 UCLOF Page 2 of 2
112796
DUFFIELD TABLE 6
Table 6 WATER QUALITY DATA
Christina River Vicinity of 1-495 Crossing
DATE
Water
Temperature DC
pH
Total Total Hardness Suspended
mgll Solids mgI
Specific
Conductivity (25C) uSem
(field)
Specific
Conductivity (t) uScm
(calc)
Rt Temperature
Factor ISalinity ppt ISalinity ppt IFresh or
(calc) (field) Marine (1
9511114 6 _ - _ 95112112 1
- -shy 9601130 3 --- 960213 3
- -shy - shy _ -shy - 96031~ 35 9604ha _ ----shy
14 ---9605hj-- shy 14 _-shy 24960611 - 9607i1Ef shy
---- shy24
-96JCi918 shy ---19shy -
_ 961119 shy_ bullbull __ bullbull ___0
9 -970114 -shy
4 _____ bullbull _
1 --9770318 - shy
__ __shy _ 76
- 970528 _shy__--_ ~
18 - middot9707115shy
- __-_ -shy -shy28
- 970916shy--_--- _shy
23 - - -97i111a ----7----shy
72 64 42 110
71 94 24 118 62 68 46 105
68 80 8 114
51 80 28 152 67 80 12 175
- - - ---- shy
73 70 15 175 84 3157 22 - -shy shy - shy - -shy _shy ---shy
74 78 27 190 77 98 49 348
- _ - - __ A - - bull
72 74 14 120 73 106 9 165 78 76 13 268
-~- -shy shy - _ - _ -- shy -----shy -- 73 82 16 253
- --- --shy -shy -- 83 248 19 1767 -shy - _ ~ - -- --shy -shy78 336 36 2618
- 21fi - -shy ---_ _shy ----1577--shy71 25
70081 639088 60879
660972 895812 1382325- ---~ _ -
1382325 3089835
186371 - - _- 3081192 - -
83328 ~
89364 17893268
-----_ -shy _ shy2191739 18682491_-_ _shy -shy
25179924 _shy ----shy10348274
0001633 - ------shy
0001489 __ bull ___ 4 _ bull
0001419 000154 - -_ -shy
0002087 0003221
- _ -shy ~ -shy -0003221 00072
0-004343 - -shy - -shy -----
000718-----__- _- 0001942 0002082
-shy _- --_ _-shy000417 -- --- - _-shy
0005107 0043535 - -shy _ -shy0058675 0024114-shy
-
-10536174 - -shy -shy
-1810657 -shy ---shy
-1489573 ---shy _ __-
-1489573 _--__- -14132973
_ --
-10164668 ----gt-------shy
-10164668 785477300shy
----__-shy785477396-shy ------_shy
3756574 [6459903shy- ~18~10657-
--~840Y9444 -
middot266095747 -107364768shy___ shy -----shy
708215297 --91911765shy
0022299 0 F F0006963 0 F0010908 0 - -_ -- - - -
0013148 0 F - - -shy -
F0025182 0 0 F0078651
_-----~-- 1=shy0078651 0 0206749 0 F --OT29361 shy
0 F-----_shy -- -=- _ 0194391 0
6~035956 -- F-shy
0 --- - shy
0017586 2 F ---_ --shy - _shy - -shy F---middotshy0084657 0 ----__--shy - shy - -_ --middotmiddot-F-shy0137056 01
----shy -----shy - Fmiddot shy122597 09
- --__-- -shy - -1=-shy1654113 14 0612462 -O~8 ----Fshy
NOTES 1 DC =degrees CelsiUS 2 mgll =milligrams per liter
3 uScm =micro Siemens per centimeter (uSem at 25degC) which is equivalent to micro mhos per em (umhoslcm at 25degC) 4 Rt =Ratio of the sample conductivity at original sample temperature divided by the condutivity of standard seawater
at a salinity of 35 and a temperature of 15DC (lewis 1980 Hill et AI 1986 APHA 1989) 5 ppt = parts per thousand 6 Christina River water quality data obtained from the State of Delaware Department of Natural Resources and Environmental Control
(DNREC) Watershed Assessment Section Christina STORET No 106291 CONRAil BRIDGE (near Port of Wilmingtonll-495 crossing)
wo 640EE Duffield AIOCItea Inc
EXCEl0640EE5XlS September 1998
CONCENTRATIONS
OF
SELECTEDCHENllCALS
IN
SURFACE WATER
--
I~(
v
I - eM
1CAd fn
lEGENgt ~_IE aIlfAQ-WAWI __ LOCATIClH
__ HOlIIi__
yCHII _T ~_
+-- HOiIaampR _
bull IE_ ulCTIClH DO INJIlOST -a
HOlEl ALL UNITS _ WIalOGIUMIAllEftr-~
LJ ~ ~=COAC~~ _DE~-
8 bull CHMICAL DElEClED AIIClClAlIO -u IG bull NIlT DElECIEIi bull HOT AVALAILpound
M-UU_TR=C_R MCIlEATIClHM CAI_1-shyPlAJ ~ fJIlAJ a1 Du
3-U to~ Ul 12-0 -a_a1IIll ~
F9Se 4-11 CONCENTRATIONS OF SELECTED CHEMICALS IN SURFACE WATER bullbullbulli_bull -1
Hdly 0lIRicII Si8 G1llIDll3 17-AN-1l97
--
SURFACE WATER QUALITY
SAMPLE LOCATIONS
~
~J~ IEIJ~ ~~ jf
if ~~ ~ ~ WILMINGTON HARBOR 1 ~lDISPOSAL AREA
~~~ Jt EDGEMOOR ~~~ if
1amp DISPOSAL AREA
l raquo~~ j ~q ~~ Jf We Siroctu
gtfftJ ~
I ~~ I ~~~ Markor Ugh ~ S1 ~~ I OUll( _ ~
f lt~~~ num 0TT1
Cti$I ft
Te QJ -c ~ II
ii ~
~
~rtr I
cf ~
Ir- _fb- Surface Water Quality Sample Locations SPRING CITY PAI1lMJ
tMlflllHMEHTAl (215)9484700 SERVICES(See Table A4)
SEDIMENT
SAMPLE LOCATIONS
---
I
if ~ t
$ Q
II II
II
1I I
Key
bull Sediment composite sample polnta
bull Bulkwater sample
EDGEMOOR
DISPOSAL AREA
jE
I
QJ ~ ~
tr
~ _lbshyshy
~~
fJ~ ~~ if ~~ 3~ N HARBOR ~ WILMINGTO AREA (it~~ DISPOSAL
j ~~t
~~ fmiddot1 ~~~ jlV gtO~ gt-gt~~ jf
~ l ~~~ jf Weir Structure I $ raquo fJ~V -~~
I I lb--
1 ----ft_-1 ~~~ Marker Light II - II I
6 I~ OV~lall bull ~ ~
bull I 1 IDNIlECj ~ioiiiiilucJ~(STATION 2 I CJ
I IS(ACE) ra 11bullbull
I I
I
SPRING CITY PAI1lMISediment Sample Locations tNVIRONMEHTAl (215)940middot4700
(See Table AS) SERVICES

Table E - GW05 Offslte Groundwater Concentration Calculations
Halby Chemical Site
ChemIcal
Ranae of Detected Values Maximum Minimum
Value Value Normal Mean
Normal Siandard Deviation
Transformed Transformed Siandard
Mean Deviation H
Slatlslle
Results
0Wmiddotles
Normal 95 UCL
Lognormal 95 UCL
Maximum or
95UCL luaL lualU lualU luaIL luaIL luaIL luaIL
Sliver 13E+02 19E+01 13E+01 33E+01 12E+OO 15E+OO 3 E+OO I 28E+01 46E+01 46E+01 Thallium 21E+02 3SE+OO 20E+01 57E+01 87EmiddotOl 19E+OO 4 E+OO I 46E+01 18E+02 18E+02 Thlocvanate 29E+04 11E+02 49E+03 11E+04 60E+oo 25E+OO 8 E+OO L 13E+04 30E+07 29E+04 Vanadium 82E+02 69E+OO 66E+01 22E+02 16E+OO 20E+OO 46E+OO I 17E+02 42E+02 42E+02 Zinc 36E+OS 10E+01 80E+04 13E+05 65E+OO 45E+OO 10E+01 I 14E+05 NA 14E+05
L bull lognormal distribution based on wmiddottest results N bull Normal distribution based on wmiddottest results I bull Inconclusive based on wmiddottest reSUlts Maximum UCl 0 either the normal or lognormal (not to exceed maximum concentration) used per guidance rom Nancy Rlos-Jaolla I Nil bull Could not be determined based on distribution
flename GRNDWROFXlS 730AMworksheet 95 UCLOF Page 2 of 2
112796
DUFFIELD TABLE 6
Table 6 WATER QUALITY DATA
Christina River Vicinity of 1-495 Crossing
DATE
Water
Temperature DC
pH
Total Total Hardness Suspended
mgll Solids mgI
Specific
Conductivity (25C) uSem
(field)
Specific
Conductivity (t) uScm
(calc)
Rt Temperature
Factor ISalinity ppt ISalinity ppt IFresh or
(calc) (field) Marine (1
9511114 6 _ - _ 95112112 1
- -shy 9601130 3 --- 960213 3
- -shy - shy _ -shy - 96031~ 35 9604ha _ ----shy
14 ---9605hj-- shy 14 _-shy 24960611 - 9607i1Ef shy
---- shy24
-96JCi918 shy ---19shy -
_ 961119 shy_ bullbull __ bullbull ___0
9 -970114 -shy
4 _____ bullbull _
1 --9770318 - shy
__ __shy _ 76
- 970528 _shy__--_ ~
18 - middot9707115shy
- __-_ -shy -shy28
- 970916shy--_--- _shy
23 - - -97i111a ----7----shy
72 64 42 110
71 94 24 118 62 68 46 105
68 80 8 114
51 80 28 152 67 80 12 175
- - - ---- shy
73 70 15 175 84 3157 22 - -shy shy - shy - -shy _shy ---shy
74 78 27 190 77 98 49 348
- _ - - __ A - - bull
72 74 14 120 73 106 9 165 78 76 13 268
-~- -shy shy - _ - _ -- shy -----shy -- 73 82 16 253
- --- --shy -shy -- 83 248 19 1767 -shy - _ ~ - -- --shy -shy78 336 36 2618
- 21fi - -shy ---_ _shy ----1577--shy71 25
70081 639088 60879
660972 895812 1382325- ---~ _ -
1382325 3089835
186371 - - _- 3081192 - -
83328 ~
89364 17893268
-----_ -shy _ shy2191739 18682491_-_ _shy -shy
25179924 _shy ----shy10348274
0001633 - ------shy
0001489 __ bull ___ 4 _ bull
0001419 000154 - -_ -shy
0002087 0003221
- _ -shy ~ -shy -0003221 00072
0-004343 - -shy - -shy -----
000718-----__- _- 0001942 0002082
-shy _- --_ _-shy000417 -- --- - _-shy
0005107 0043535 - -shy _ -shy0058675 0024114-shy
-
-10536174 - -shy -shy
-1810657 -shy ---shy
-1489573 ---shy _ __-
-1489573 _--__- -14132973
_ --
-10164668 ----gt-------shy
-10164668 785477300shy
----__-shy785477396-shy ------_shy
3756574 [6459903shy- ~18~10657-
--~840Y9444 -
middot266095747 -107364768shy___ shy -----shy
708215297 --91911765shy
0022299 0 F F0006963 0 F0010908 0 - -_ -- - - -
0013148 0 F - - -shy -
F0025182 0 0 F0078651
_-----~-- 1=shy0078651 0 0206749 0 F --OT29361 shy
0 F-----_shy -- -=- _ 0194391 0
6~035956 -- F-shy
0 --- - shy
0017586 2 F ---_ --shy - _shy - -shy F---middotshy0084657 0 ----__--shy - shy - -_ --middotmiddot-F-shy0137056 01
----shy -----shy - Fmiddot shy122597 09
- --__-- -shy - -1=-shy1654113 14 0612462 -O~8 ----Fshy
NOTES 1 DC =degrees CelsiUS 2 mgll =milligrams per liter
3 uScm =micro Siemens per centimeter (uSem at 25degC) which is equivalent to micro mhos per em (umhoslcm at 25degC) 4 Rt =Ratio of the sample conductivity at original sample temperature divided by the condutivity of standard seawater
at a salinity of 35 and a temperature of 15DC (lewis 1980 Hill et AI 1986 APHA 1989) 5 ppt = parts per thousand 6 Christina River water quality data obtained from the State of Delaware Department of Natural Resources and Environmental Control
(DNREC) Watershed Assessment Section Christina STORET No 106291 CONRAil BRIDGE (near Port of Wilmingtonll-495 crossing)
wo 640EE Duffield AIOCItea Inc
EXCEl0640EE5XlS September 1998
CONCENTRATIONS
OF
SELECTEDCHENllCALS
IN
SURFACE WATER
--
I~(
v
I - eM
1CAd fn
lEGENgt ~_IE aIlfAQ-WAWI __ LOCATIClH
__ HOlIIi__
yCHII _T ~_
+-- HOiIaampR _
bull IE_ ulCTIClH DO INJIlOST -a
HOlEl ALL UNITS _ WIalOGIUMIAllEftr-~
LJ ~ ~=COAC~~ _DE~-
8 bull CHMICAL DElEClED AIIClClAlIO -u IG bull NIlT DElECIEIi bull HOT AVALAILpound
M-UU_TR=C_R MCIlEATIClHM CAI_1-shyPlAJ ~ fJIlAJ a1 Du
3-U to~ Ul 12-0 -a_a1IIll ~
F9Se 4-11 CONCENTRATIONS OF SELECTED CHEMICALS IN SURFACE WATER bullbullbulli_bull -1
Hdly 0lIRicII Si8 G1llIDll3 17-AN-1l97
--
SURFACE WATER QUALITY
SAMPLE LOCATIONS
~
~J~ IEIJ~ ~~ jf
if ~~ ~ ~ WILMINGTON HARBOR 1 ~lDISPOSAL AREA
~~~ Jt EDGEMOOR ~~~ if
1amp DISPOSAL AREA
l raquo~~ j ~q ~~ Jf We Siroctu
gtfftJ ~
I ~~ I ~~~ Markor Ugh ~ S1 ~~ I OUll( _ ~
f lt~~~ num 0TT1
Cti$I ft
Te QJ -c ~ II
ii ~
~
~rtr I
cf ~
Ir- _fb- Surface Water Quality Sample Locations SPRING CITY PAI1lMJ
tMlflllHMEHTAl (215)9484700 SERVICES(See Table A4)
SEDIMENT
SAMPLE LOCATIONS
---
I
if ~ t
$ Q
II II
II
1I I
Key
bull Sediment composite sample polnta
bull Bulkwater sample
EDGEMOOR
DISPOSAL AREA
jE
I
QJ ~ ~
tr
~ _lbshyshy
~~
fJ~ ~~ if ~~ 3~ N HARBOR ~ WILMINGTO AREA (it~~ DISPOSAL
j ~~t
~~ fmiddot1 ~~~ jlV gtO~ gt-gt~~ jf
~ l ~~~ jf Weir Structure I $ raquo fJ~V -~~
I I lb--
1 ----ft_-1 ~~~ Marker Light II - II I
6 I~ OV~lall bull ~ ~
bull I 1 IDNIlECj ~ioiiiiilucJ~(STATION 2 I CJ
I IS(ACE) ra 11bullbull
I I
I
SPRING CITY PAI1lMISediment Sample Locations tNVIRONMEHTAl (215)940middot4700
(See Table AS) SERVICES
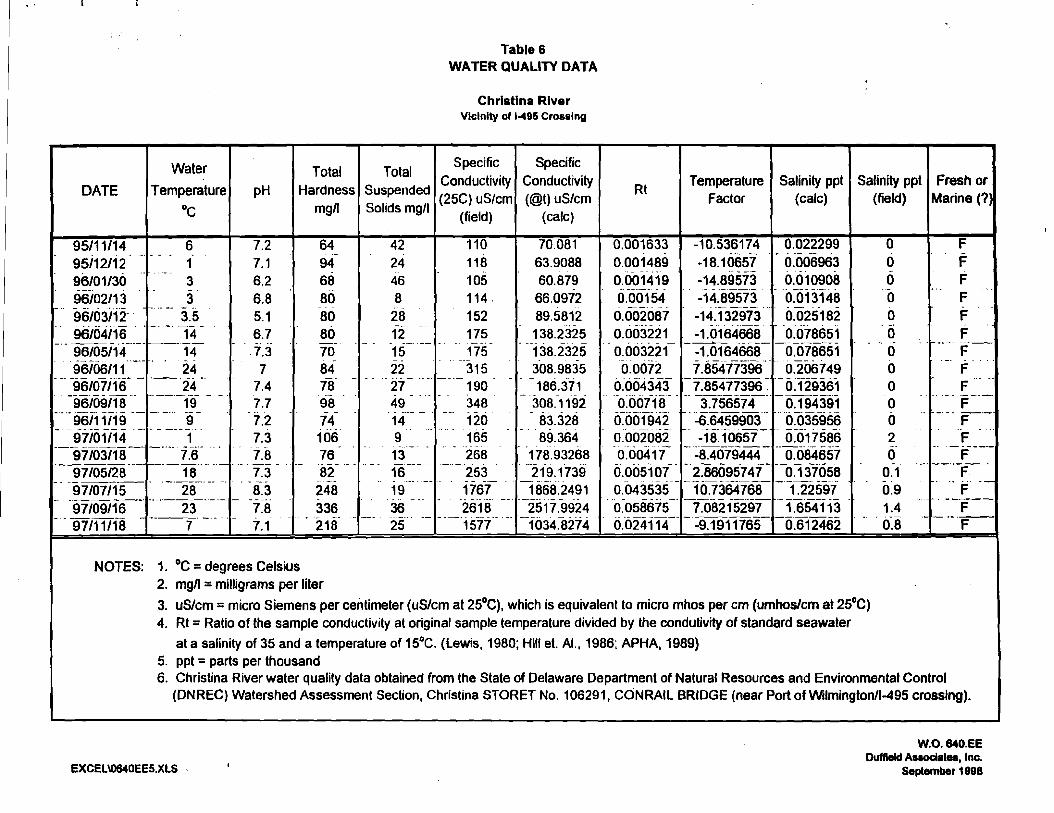

--
SURFACE WATER QUALITY
SAMPLE LOCATIONS
~
~J~ IEIJ~ ~~ jf
if ~~ ~ ~ WILMINGTON HARBOR 1 ~lDISPOSAL AREA
~~~ Jt EDGEMOOR ~~~ if
1amp DISPOSAL AREA
l raquo~~ j ~q ~~ Jf We Siroctu
gtfftJ ~
I ~~ I ~~~ Markor Ugh ~ S1 ~~ I OUll( _ ~
f lt~~~ num 0TT1
Cti$I ft
Te QJ -c ~ II
ii ~
~
~rtr I
cf ~
Ir- _fb- Surface Water Quality Sample Locations SPRING CITY PAI1lMJ
tMlflllHMEHTAl (215)9484700 SERVICES(See Table A4)
SEDIMENT
SAMPLE LOCATIONS
---
I
if ~ t
$ Q
II II
II
1I I
Key
bull Sediment composite sample polnta
bull Bulkwater sample
EDGEMOOR
DISPOSAL AREA
jE
I
QJ ~ ~
tr
~ _lbshyshy
~~
fJ~ ~~ if ~~ 3~ N HARBOR ~ WILMINGTO AREA (it~~ DISPOSAL
j ~~t
~~ fmiddot1 ~~~ jlV gtO~ gt-gt~~ jf
~ l ~~~ jf Weir Structure I $ raquo fJ~V -~~
I I lb--
1 ----ft_-1 ~~~ Marker Light II - II I
6 I~ OV~lall bull ~ ~
bull I 1 IDNIlECj ~ioiiiiilucJ~(STATION 2 I CJ
I IS(ACE) ra 11bullbull
I I
I
SPRING CITY PAI1lMISediment Sample Locations tNVIRONMEHTAl (215)940middot4700
(See Table AS) SERVICES

~
~J~ IEIJ~ ~~ jf
if ~~ ~ ~ WILMINGTON HARBOR 1 ~lDISPOSAL AREA
~~~ Jt EDGEMOOR ~~~ if
1amp DISPOSAL AREA
l raquo~~ j ~q ~~ Jf We Siroctu
gtfftJ ~
I ~~ I ~~~ Markor Ugh ~ S1 ~~ I OUll( _ ~
f lt~~~ num 0TT1
Cti$I ft
Te QJ -c ~ II
ii ~
~
~rtr I
cf ~
Ir- _fb- Surface Water Quality Sample Locations SPRING CITY PAI1lMJ
tMlflllHMEHTAl (215)9484700 SERVICES(See Table A4)
SEDIMENT
SAMPLE LOCATIONS
---
I
if ~ t
$ Q
II II
II
1I I
Key
bull Sediment composite sample polnta
bull Bulkwater sample
EDGEMOOR
DISPOSAL AREA
jE
I
QJ ~ ~
tr
~ _lbshyshy
~~
fJ~ ~~ if ~~ 3~ N HARBOR ~ WILMINGTO AREA (it~~ DISPOSAL
j ~~t
~~ fmiddot1 ~~~ jlV gtO~ gt-gt~~ jf
~ l ~~~ jf Weir Structure I $ raquo fJ~V -~~
I I lb--
1 ----ft_-1 ~~~ Marker Light II - II I
6 I~ OV~lall bull ~ ~
bull I 1 IDNIlECj ~ioiiiiilucJ~(STATION 2 I CJ
I IS(ACE) ra 11bullbull
I I
I
SPRING CITY PAI1lMISediment Sample Locations tNVIRONMEHTAl (215)940middot4700
(See Table AS) SERVICES

I
if ~ t
$ Q
II II
II
1I I
Key
bull Sediment composite sample polnta
bull Bulkwater sample
EDGEMOOR
DISPOSAL AREA
jE
I
QJ ~ ~
tr
~ _lbshyshy
~~
fJ~ ~~ if ~~ 3~ N HARBOR ~ WILMINGTO AREA (it~~ DISPOSAL
j ~~t
~~ fmiddot1 ~~~ jlV gtO~ gt-gt~~ jf
~ l ~~~ jf Weir Structure I $ raquo fJ~V -~~
I I lb--
1 ----ft_-1 ~~~ Marker Light II - II I
6 I~ OV~lall bull ~ ~
bull I 1 IDNIlECj ~ioiiiiilucJ~(STATION 2 I CJ
I IS(ACE) ra 11bullbull
I I
I
SPRING CITY PAI1lMISediment Sample Locations tNVIRONMEHTAl (215)940middot4700
(See Table AS) SERVICES