August 3, 2017 - s21.q4cdn.com · reference into this presentation, ... Jordan, and Adidas both...
19
August 3, 2017
Transcript of August 3, 2017 - s21.q4cdn.com · reference into this presentation, ... Jordan, and Adidas both...

August 3, 2017

©2017 Acxiom
Some of the matters discussed in this presentation contain forward-looking statements regarding the company’s future business prospects which are subject to certain risks and uncertainties, including competitive pressures, adverse economic conditions and governmental regulations.
These issues and other factors that may be identified from time to time in the Company’s reports filed with the SEC could cause actual results to differ materially from those indicated in the forward-looking statements.
Our discussion today will include non-GAAP financial measures. We refer you to the appendix of this presentation and the Investor Relations section of our website, which include reconciliations to the comparable GAAP measures for each of the non-GAAP financial measures included in this discussion.The location of our website is www.acxiom.com.
The information contained on, or that can be accessed through, our website is not incorporated by reference into this presentation, and you should not consider any information contained on, or that can be accessed through, our website as part of this presentation.
2

©2017 Acxiom 3
Q217A Q317A Q417A Q118A
Audience Solutions Digital Data Revenue3
Q217A Q317A Q417A Q118A
Q/Q 38% (7%) 6%
Direct Connectivity Customers1
Q/Q 17% 6% 10%
Connectivity Revenue Run-Rate2
Q/Q 19% 6% 6%
Q217A Q317A Q417A Q118A
Y/Y 48% 49% 50%
1Excludes agency and reseller deployments and Data Store-only customers
2Revenue run-rate includes period ending LiveRamp product ARR and trailing-twelve month media spend royalties
3Revenue generated from Audience Solutions digital publisher and platform partners
Y/Y 116% 86% 72%
$180
$135
Y/Y 60% 55% 50%
$18.1450
$160
$13.3385
$18.4$M $M
330
$170
410
$17.1

© 2017 Google Inc. All rights reserved. Google and the Google logo are
trademarks of Google Inc. All other company and product names may be
trademarks of the respective companies with which they are associated.
Finish Line finds the right fit
with Customer Match
Looking to re-engage with customers who bought online and in-store, Finish Line turned to
Customer Match for an increase in both clicks and reach.
About Finish Line
● Finish Line is an American retail chain that sells
footwear and apparel from premium brands such
as Nike, Jordan, and Adidas both online and at its
1,100 retail locations.
Goals
● Finish Line wanted to re-engage with high-value
customers online.
● The brand sought to increase online and in-store
sales, as well as improve cost efficiency.
● Finish Line wanted to improve performance for
both CTR and conversion volume.
Approach & Results
● Finish Line tested Customer Match across its paid
search and shopping campaigns.
● The brand identified Customer Match segments
containing customers who transacted online and
in store.
● Partnering with LiveRamp, a Customer Match uploader,
Finish Line was able to reach even more of its
customers.
● The brand now plans to implement Customer Match
across all of its accounts, including its marketing efforts
on YouTube.
“Customer Match helped us engage
with our best customers, improving
our CTR while allowing us to do
more with our marketing budget.”
Lora Loesch, Director of Digital Finance and
Paid Marketing at Finish Line
2X Increase
in match rates 70% Higher
ROAS235% Increase
in CTR

©2017 Acxiom
$M, except per share amounts
5
GAAP
Q118 Y/Y Change
$ 213 -1%
$ 99 7%
46.4% 360 bps
$ (6) NM
(2.7%) (650 bps)
$ (0.02) $ (0.07)
78.7 -1%
Non-GAAP1
Q118 Y/Y Change
$ 213 -1%
$ 106 9%
49.9% 480 bps
$ 22 6%
10.5% 70 bps
$ 0.14 $ (0.01)
81.4 3%
Revenue
Gross Profit
Gross Margin
Operating Income (Loss)
Operating Margin
EPS
Share Count
1Non-GAAP results exclude non-cash stock compensation, purchased intangible asset amortization, restructuring and impairment charges and separation costs

©2017 Acxiom
$M
6
* Numbers may not foot due to rounding
Q118 Q117 Y/Y Change
US
Marketing Services $ 85 $ 102 (17%)
Audience Solutions $ 68 $ 66 4%
Connectivity $ 42 $ 29 44%
Total US $ 194 $ 197 (1%)
International:
Marketing Services $ 7 $ 7 (6%)
Audience Solutions $ 8 $ 8 (6%)
Connectivity $ 4 $ 2 51%
Total International $ 18 $ 18 2%
Total Company:
Marketing Services $ 92 $ 110 (17%)
Audience Solutions $ 76 $ 74 3%
Connectivity $ 45 $ 31 44%
Total Company $ 213 $215 (1%)

©2017 Acxiom
$M
7
Q118 Q117 Y/Y Change
US $ 194 $ 197 (1%)
Acxiom Impact Divestiture - $ (12)
Adjusted US1 $ 194 $ 185 5%
International $ 18 $ 18 2%
Australia Transition $ (0) $ (1)
FX $ 1 -
Adjusted International $ 20 $ 17 15%
Adjusted Total Revenue1 $ 214 $ 202 6%
1Revenue is not adjusted for the acquisitions of Arbor and Circulate given the deep integration of the organizations.
* Numbers may not foot due to rounding

©2017 Acxiom
$M
8
Q118 Q117 Y/Y Change
US:
Revenue1 $ 85 $ 102 (17%)
Gross Profit $ 30 $ 35 (15%)
Gross Margin 35.0% 33.8% 120 bps
Segment Income $ 20 $ 19 3%
Global:
Revenue1 $ 92 $ 110 (17%)
Gross Profit $ 31 $ 37 (16%)
Gross Margin 34.2% 34.1% 10 bps
Segment Income $ 20 $ 20 (2%)
Segment EBITDA2 $ 26 $ 28 (7%)
1Prior period revenue includes approximately $12M associated with the divested Acxiom Impact business. Excluding these revenues, Marketing Services revenue was down 6% in the US and 6% globally.
2Adjusted EBITDA reconciliation included in the appendix
* Numbers may not foot due to rounding
©2017 Acxiom
$M
9
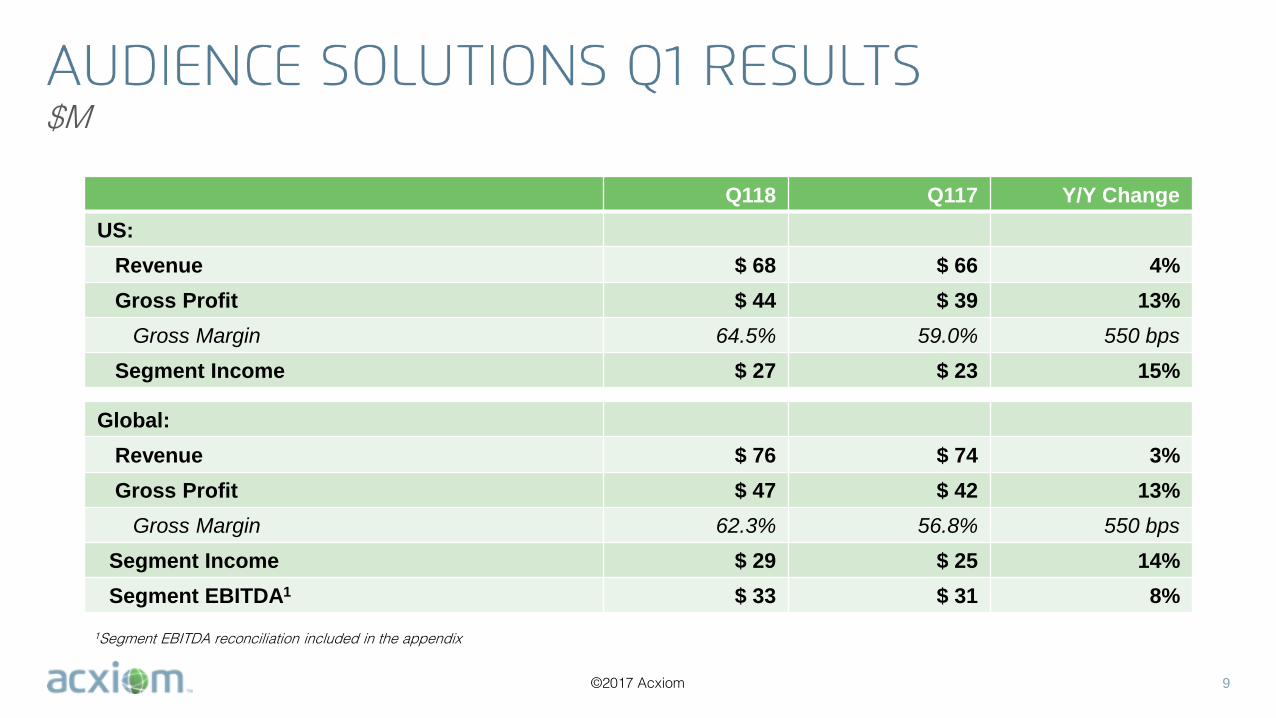
Q118 Q117 Y/Y Change
US:
Revenue $ 68 $ 66 4%
Gross Profit $ 44 $ 39 13%
Gross Margin 64.5% 59.0% 550 bps
Segment Income $ 27 $ 23 15%
Global:
Revenue $ 76 $ 74 3%
Gross Profit $ 47 $ 42 13%
Gross Margin 62.3% 56.8% 550 bps
Segment Income $ 29 $ 25 14%
Segment EBITDA1 $ 33 $ 31 8%
1Segment EBITDA reconciliation included in the appendix

©2017 Acxiom
$M
10
Q118 Q117 Y/Y Change
Revenue $ 45 $ 31 44%
Gross Profit $ 28 $ 18 57%
Gross Margin 60.9% 56.1% 480 bps
Segment Income (Loss) $ (0) $ 0 NM
Segment EBITDA1 $ 2 $2 31%
1Segment EBITDA reconciliation included in the appendix

©2017 Acxiom 11
1Includes capital expenditures, capitalized software and data acquisition costs
Q118 Q117 Y/Y Change
Operating Cash Flow $ 5 $ 1 560%
Free Cash Flow to Equity $ (6) $ (22) NM
Total Capital Spending1 $ 10 $ 15 (29%)
$M

©2017 Acxiom
$M, except per share amounts
12
GAAP Non-GAAP1
Revenue $920 to $930 $920 to $930
Diluted EPS ~ ($0.06) ~ $0.80
1Non-GAAP guidance excludes non-cash stock compensation, purchased intangible asset amortization, restructuring charges and separation costs
$880$860
$20
FY17 AsReported
FY17 ImpactRevenue
FY17 AdjustedBaseline
FY18Guidance
+7% to 8%
Revenue Bridge$920 to $930
(Associated with
Divestiture)

©2017 Acxiom
% of Total Revenue
13
Q1 Q2 Q3 Q4
Revenue(estimated)
23% 24% 26% 27%
Q1 Q2 Q3 Q4
Revenue24% 25% 26% 26%
Historical Average (Last Three Fiscal Years)


©2017 Acxiom
$M
15
Numbers may not foot due to rounding
Marketing Services ex. Impact revenue, gross profit, and segment income are non-GAAP financial measures. We believe these non-GAAP measures provide investors with meaningful supplemental information to evaluate the ongoing performance of the Marketing Services segment after the divestiture of Acxiom Impact. This schedule reconciles the results excluding the divested business to the reported Marketing Services segment results.
Q116A Q216A Q316A Q416A Q117A Q217A Q317A Q417A Q118A FY16A FY17A
Revenue 108$ 113$ 116$ 113$ 110$ 106$ 101$ 94$ 92$ 450$ 411$
V% -1% 0% 1% 3% 2% -6% -13% -17% -17% 1% -9%
Gross Profit 36 37 38 40 37 34 37 31 31 152 141
GM % 33% 33% 33% 35% 34% 33% 37% 33% 34% 34% 34%
Segment Income 17 18 20 19 20 20 21 20 20 74 81
Segment Margin % 16% 16% 18% 17% 18% 19% 21% 21% 22% 17% 20%
Q116A Q216A Q316A Q416A Q117A Q217A Q317A Q417A Q118A FY16A FY17A
Revenue 16$ 16$ 15$ 14$ 12$ 8$ - - - 60$ 20$
Gross Profit 6 4 4 3 1 1 - - - 17 2
GM % 35% 27% 27% 21% 11% 10% - - - 28% 10%
Segment Income 3 3 3 1 (0) 0 - - - 10 (0)
Segment Margin % 21% 19% 17% 11% 0% 2% - - NM - 17% -1%
Q116A Q216A Q316A Q416A Q117A Q217A Q317A Q417A Q118A FY16A FY17A
Revenue 92$ 97$ 101$ 100$ 97$ 98$ 101$ 94$ 92$ 390$ 390$
V% -1% 0% 3% 6% 6% 0% 0% -5% -6% 2% 0%
Gross Profit 31 33 34 37 36 34 38 31 31 136 139
GM % 33% 34% 34% 37% 37% 34% 37% 33% 34% 35% 35%
Segment Income 13 15 18 18 20 20 21 20 20 64 81
Segment Margin % 15% 15% 18% 18% 21% 20% 21% 21% 22% 16% 21%
Marketing Services
Acxiom Impact
Marketing Services
ex. Impact
FY16A FY17A FY18 Full Year
FY18
FY18
Full Year
Full Year
FY16A
FY16A FY17A
FY17A
©2017 Acxiom
$M
16
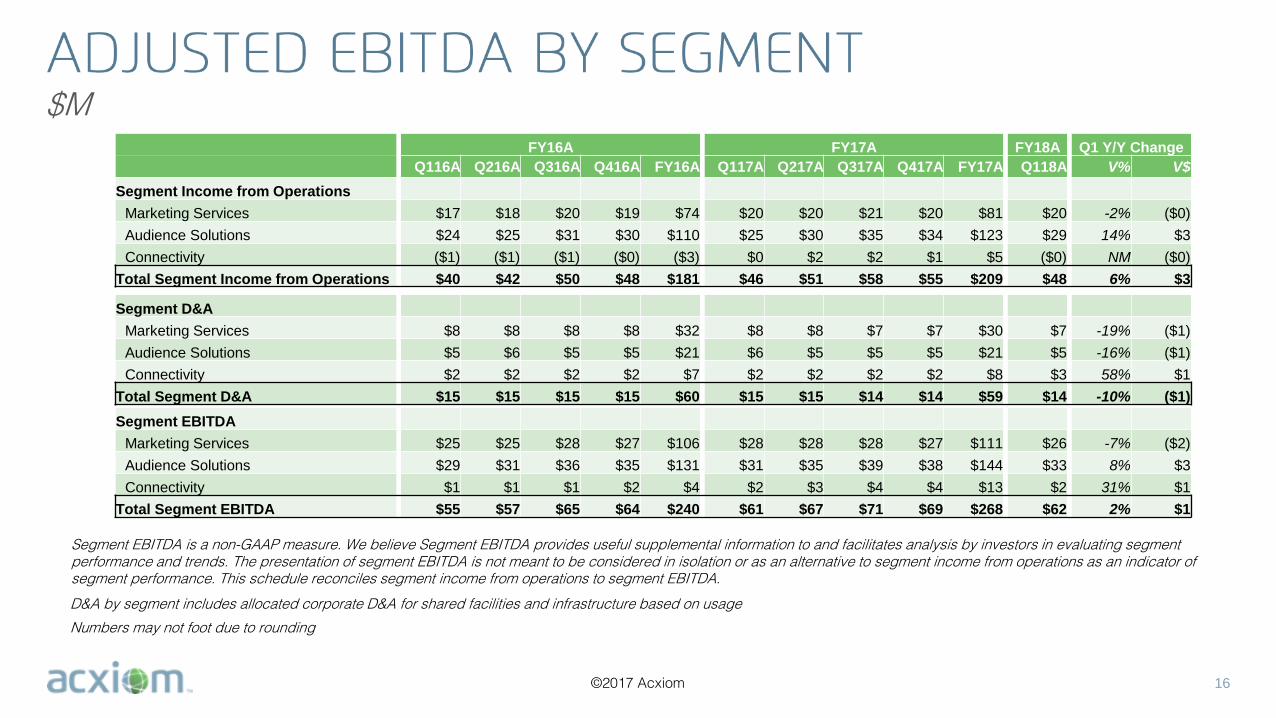
D&A by segment includes allocated corporate D&A for shared facilities and infrastructure based on usage
Numbers may not foot due to rounding
FY16A FY17A FY18A Q1 Y/Y Change
Q116A Q216A Q316A Q416A FY16A Q117A Q217A Q317A Q417A FY17A Q118A V% V$
Segment Income from Operations
Marketing Services $17 $18 $20 $19 $74 $20 $20 $21 $20 $81 $20 -2% ($0)
Audience Solutions $24 $25 $31 $30 $110 $25 $30 $35 $34 $123 $29 14% $3
Connectivity ($1) ($1) ($1) ($0) ($3) $0 $2 $2 $1 $5 ($0) NM ($0)
Total Segment Income from Operations $40 $42 $50 $48 $181 $46 $51 $58 $55 $209 $48 6% $3
Segment D&A
Marketing Services $8 $8 $8 $8 $32 $8 $8 $7 $7 $30 $7 -19% ($1)
Audience Solutions $5 $6 $5 $5 $21 $6 $5 $5 $5 $21 $5 -16% ($1)
Connectivity $2 $2 $2 $2 $7 $2 $2 $2 $2 $8 $3 58% $1
Total Segment D&A $15 $15 $15 $15 $60 $15 $15 $14 $14 $59 $14 -10% ($1)
Segment EBITDA
Marketing Services $25 $25 $28 $27 $106 $28 $28 $28 $27 $111 $26 -7% ($2)
Audience Solutions $29 $31 $36 $35 $131 $31 $35 $39 $38 $144 $33 8% $3
Connectivity $1 $1 $1 $2 $4 $2 $3 $4 $4 $13 $2 31% $1
Total Segment EBITDA $55 $57 $65 $64 $240 $61 $67 $71 $69 $268 $62 2% $1
Segment EBITDA is a non-GAAP measure. We believe Segment EBITDA provides useful supplemental information to and facilitates analysis by investors in evaluating segment performance and trends. The presentation of segment EBITDA is not meant to be considered in isolation or as an alternative to segment income from operations as an indicator of segment performance. This schedule reconciles segment income from operations to segment EBITDA.

©2017 Acxiom
$M, Non-GAAP
17
All reconciling items tax effected at 40.0% unless the nature of the reconciling item included a non-deductible expense for tax purposes. Tax adjustment to balance to non-GAAP tax expense. Numbers may not foot due to rounding.
Q118 Intangible Separation/ Q118
GAAP Restructuring Amort. SBC Transformation Tax Non-GAAP
Revenue $212.5 - $0.0 - - - $212.5
Cost of revenue 114.0 - (6.0) (1.6) - - 106.4
Gross profit 98.6 - 6.0 1.6 - - 106.1
% Gross margin 46.4% 49.9%
Operating expenses:
Research and development 23.6 - - (4.2) - - 19.4
Sales and marketing 48.4 - - (6.3) - - 42.2
General and administrative 32.4 - - (3.0) (7.1) - 22.2
Gains, losses and other items, net (0.1) 0.1 - - - - -
Total operating expenses 104.3 0.1 - (13.5) (7.1) - 83.8
Income (loss) from operations (5.7) (0.1) 6.0 15.0 7.1 - 22.3
% Margin -2.7% 10.5%
Other expense:
Interest expense (2.3) - - - - - (2.3)
Other, net (0.7) - - - - - (0.7)
Total other expense (3.0) - - - - - (3.0)
Earnings (loss) before income taxes (8.7) (0.1) 6.0 15.0 7.1 - 19.3
Income taxes (7.4) (0.0) 2.2 5.5 2.9 4.5 7.7
Net earnings (loss) (1.3) (0.1) 3.7 9.5 4.2 (4.5) 11.6
Diluted earnings (loss) per share: ($0.02) ($0.00) $0.05 $0.12 $0.05 ($0.06) $0.14
Basic shares 78.7 78.7 78.7 78.7 78.7 78.7 78.7
FDWA Shares 81.4 81.4 81.4 81.4 81.4 81.4 81.4
©2017 Acxiom 18
$M
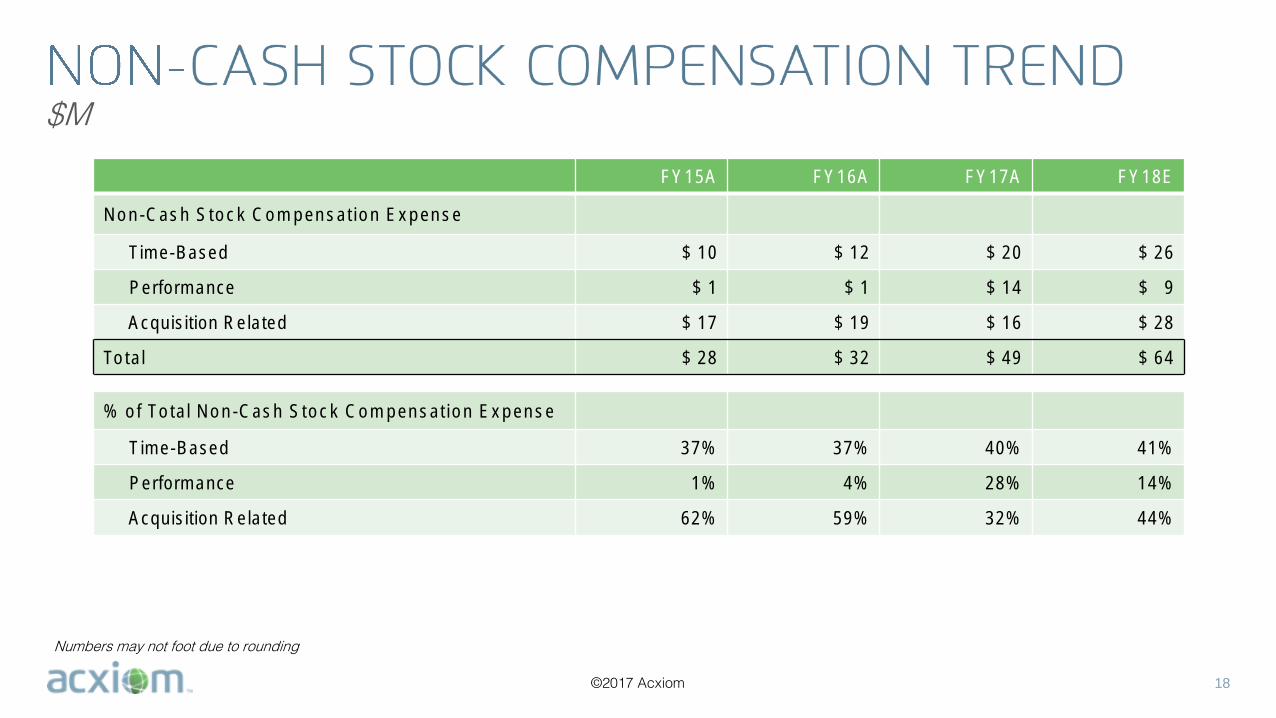
Numbers may not foot due to rounding
FY15A FY16A FY17A FY18E
Non-Cash Stock Compensation Expense
Time-Based $ 10 $ 12 $ 20 $ 26
Performance $ 1 $ 1 $ 14 $ 9
Acquisition Related $ 17 $ 19 $ 16 $ 28
Total $ 28 $ 32 $ 49 $ 64
% of Total Non-Cash Stock Compensation Expense
Time-Based 37% 37% 40% 41%
Performance 1% 4% 28% 14%
Acquisition Related 62% 59% 32% 44%