August 2019: CBOT Weather Premium Popped!
12
Marketing Communication August 2019 1/12 RaboResearch | Agri Commodity Markets Research | August 2019 RaboResearch Food & Agribusiness far.rabobank.com Stefan Vogel Head of ACMR +44 20 7664 9523 Carlos Mera Senior Commodity Analyst +44 20 7664 9512 Michael Magdovitz Commodity Analyst +44 20 7664 9669 Andrew Rawlings Associate Commodity Analyst +44 20 7664 9756 Agri Commodity Markets Research August 2019: CBOT Weather Premium Popped! WHEAT SUGAR CBOT Wheat forecast slightly lowered US to face strong competition for its wheat export during the remainder of 2019. French wheat shows its teeth and becomes the most competitive in Egypt’s tenders as country harvests second- highest crop on record. ICE #11 Sugar will likely recover some ground US dollar strength and Brazilian real weakness have put pressure on ICE #11. Lots of physical sugar around, but the outlook for 2019/20 is tightening. We see support for the white premium ahead. CORN COFFEE CBOT Corn extended its 22% fall in August, as the USDA confirmed a 90m-ac US crop High 2018/19 US stocks, a stabilized 2019/20 US crop, soft global demand, and currency-favored global supplies limit upside for CBOT Corn. Corn yield and harvested acreage uncertainty justify a supply risk premium – selling likely limited from here. ICE Arabica likely to trade range-bound and then have some support towards mid- September Higher demand for certified stocks to support prices. Frost in early July only had limited damage. Adverse weather ahead for Central American and Ethiopian crops, while Brazil weather still a concern. SOY COMPLEX COCOA CBOT Soy resilient on lower US supply prospects and rising Brazilian premiums. CBOT Soy Oil optimism on rising trade war tensions Prices below/near cost of production. CBOT Soy Oil price support, higher Brazilian biodiesel mandates, and strong Chinese vegetable oil demand. Bullish at these levels Improved weather in West Africa should help prevent a large drop. Low prices should continue to incentivize demand and support prices. Challenging trading environment, for both Commercials and Non-Commercials. PALM OIL COTTON Increasing palm oil production in Indonesia and Malaysia in 2H 2019 to limit upside Palm oil import demand from India and China to increase quarter-on-quarter in Q3 2019. Volatility in global soy oil prices to affect palm oil prices in 2H 2019. Marginal short-term upside forecast on ICE #2 Cotton, downside limited by US loan program Potential Speculative short covering risk. Rabobank’s latest US cotton tour Global 2019/20 ending stocks are forecast to expand 1m bales YOY, despite a 2% YOY uptick in demand. The agri commodity complex lost around -8% MOM as the weather premium in G&O popped, while the USDA committed to its large estimates for US corn acreage and yield. Positive US crop tour results, good weather, a strong USD, and heavy global supply are all weighing on markets. Also, the BRL fell to its lowest since September 2018 (-8% MOM), dragging down coffee and sugar. Other producing- country currencies weakened against the USD, with the ARS down a remarkable -28% MOM. A potential government change in Argentina could result in higher export taxes from December 2019.
Transcript of August 2019: CBOT Weather Premium Popped!
Marketing Communication August 2019
1/12 RaboResearch | Agri Commodity Markets Research | August 2019
RaboResearch Food & Agribusiness
far.rabobank.com Stefan Vogel Head of ACMR +44 20 7664 9523
Carlos Mera Senior Commodity Analyst +44 20 7664 9512
Michael Magdovitz Commodity Analyst +44 20 7664 9669 Andrew Rawlings Associate Commodity Analyst +44 20 7664 9756
Agri Commodity Markets Research
August 2019: CBOT Weather Premium Popped!
WHEAT SUGAR
CBOT Wheat forecast slightly lowered
US to face strong competition for its wheat export
during the remainder of 2019.
French wheat shows its teeth and becomes the most
competitive in Egypt’s tenders as country harvests
second- highest crop on record.
ICE #11 Sugar will likely recover some ground
US dollar strength and Brazilian real weakness have
put pressure on ICE #11.
Lots of physical sugar around, but the outlook for
2019/20 is tightening.
We see support for the white premium ahead.
CORN COFFEE
CBOT Corn extended its 22% fall in August, as the USDA confirmed a 90m-ac US crop
High 2018/19 US stocks, a stabilized 2019/20 US
crop, soft global demand, and currency-favored
global supplies limit upside for CBOT Corn.
Corn yield and harvested acreage uncertainty justify a
supply risk premium – selling likely limited from here.
ICE Arabica likely to trade range-bound and then have some support towards mid-September
Higher demand for certified stocks to support prices.
Frost in early July only had limited damage.
Adverse weather ahead for Central American and
Ethiopian crops, while Brazil weather still a concern.
SOY COMPLEX COCOA
CBOT Soy resilient on lower US supply prospects and rising Brazilian premiums. CBOT Soy Oil optimism on rising trade war tensions Prices below/near cost of production.
CBOT Soy Oil price support, higher Brazilian biodiesel
mandates, and strong Chinese vegetable oil demand.
Bullish at these levels Improved weather in West Africa should help prevent
a large drop.
Low prices should continue to incentivize demand
and support prices.
Challenging trading environment, for both
Commercials and Non-Commercials.
PALM OIL COTTON
Increasing palm oil production in Indonesia and Malaysia in 2H 2019 to limit upside Palm oil import demand from India and China to
increase quarter-on-quarter in Q3 2019.
Volatility in global soy oil prices to affect palm oil
prices in 2H 2019.
Marginal short-term upside forecast on ICE #2 Cotton, downside limited by US loan program
Potential Speculative short covering risk.
Rabobank’s latest US cotton tour
Global 2019/20 ending stocks are forecast to expand
1m bales YOY, despite a 2% YOY uptick in demand.
The agri commodity complex lost around -8% MOM as the weather premium in G&O popped, while the USDA committed to its large estimates for US corn acreage and yield. Positive US crop tour results, good weather, a strong USD, and heavy global supply are all weighing on markets. Also, the BRL fell to its lowest since September 2018 (-8% MOM), dragging down coffee and sugar. Other producing-country currencies weakened against the USD, with the ARS down a remarkable -28% MOM. A potential government change in Argentina could result in higher export taxes from December 2019.
2/12 RaboResearch | Agri Commodity Markets Research | August 2019
Wheat
CBOT Wheat forecast slightly lowered
US to face strong competition for its wheat export during the remainder of 2019.
French wheat shows its teeth and becomes the most competitive in Egypt’s tenders as country harvests second- highest crop on record.
Risk of potentially higher export taxes in Argentina could bring some improved US export demand in 2020.
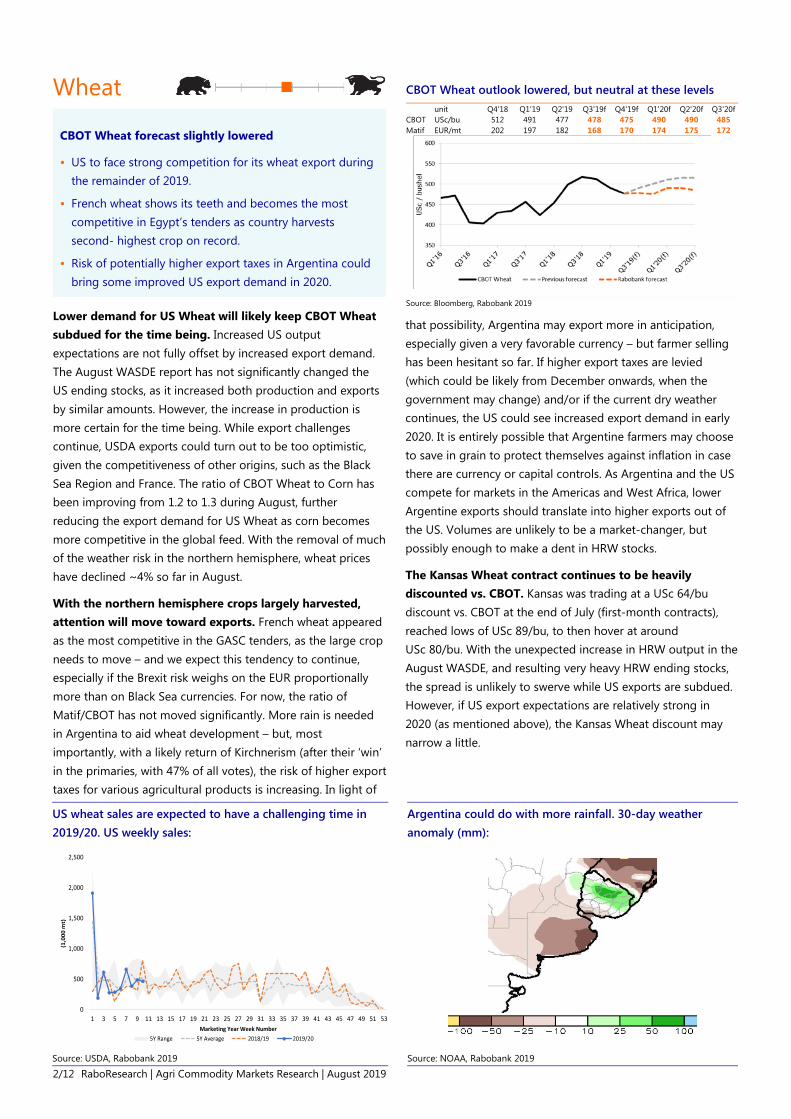
Lower demand for US Wheat will likely keep CBOT Wheat subdued for the time being. Increased US output expectations are not fully offset by increased export demand. The August WASDE report has not significantly changed the US ending stocks, as it increased both production and exports by similar amounts. However, the increase in production is more certain for the time being. While export challenges continue, USDA exports could turn out to be too optimistic, given the competitiveness of other origins, such as the Black Sea Region and France. The ratio of CBOT Wheat to Corn has been improving from 1.2 to 1.3 during August, further reducing the export demand for US Wheat as corn becomes more competitive in the global feed. With the removal of much of the weather risk in the northern hemisphere, wheat prices have declined ~4% so far in August.
With the northern hemisphere crops largely harvested, attention will move toward exports. French wheat appeared as the most competitive in the GASC tenders, as the large crop needs to move – and we expect this tendency to continue, especially if the Brexit risk weighs on the EUR proportionally more than on Black Sea currencies. For now, the ratio of Matif/CBOT has not moved significantly. More rain is needed in Argentina to aid wheat development – but, most importantly, with a likely return of Kirchnerism (after their ‘win’ in the primaries, with 47% of all votes), the risk of higher export taxes for various agricultural products is increasing. In light of
that possibility, Argentina may export more in anticipation, especially given a very favorable currency – but farmer selling has been hesitant so far. If higher export taxes are levied (which could be likely from December onwards, when the government may change) and/or if the current dry weather continues, the US could see increased export demand in early 2020. It is entirely possible that Argentine farmers may choose to save in grain to protect themselves against inflation in case there are currency or capital controls. As Argentina and the US compete for markets in the Americas and West Africa, lower Argentine exports should translate into higher exports out of the US. Volumes are unlikely to be a market-changer, but possibly enough to make a dent in HRW stocks.
The Kansas Wheat contract continues to be heavily discounted vs. CBOT. Kansas was trading at a USc 64/bu discount vs. CBOT at the end of July (first-month contracts), reached lows of USc 89/bu, to then hover at around USc 80/bu. With the unexpected increase in HRW output in the August WASDE, and resulting very heavy HRW ending stocks, the spread is unlikely to swerve while US exports are subdued. However, if US export expectations are relatively strong in 2020 (as mentioned above), the Kansas Wheat discount may narrow a little.
US wheat sales are expected to have a challenging time in 2019/20. US weekly sales:
Argentina could do with more rainfall. 30-day weather anomaly (mm):
Source: USDA, Rabobank 2019 Source: NOAA, Rabobank 2019
0
500
1,000
1,500
2,000
2,500
1 3 5 7 9 11 13 15 17 19 21 23 25 27 29 31 33 35 37 39 41 43 45 47 49 51 53
(1,0
00 m
t)
Marketing Year Week Number5Y Range 5Y Average 2018/19 2019/20
CBOT Wheat outlook lowered, but neutral at these levels
unit Q4'18 Q1'19 Q2'19 Q3'19f Q4'19f Q1'20f Q2'20f Q3'20f CBOT USc/bu 512 491 477 478 475 490 490 485 Matif EUR/mt 202 197 182 168 170 174 175 172
Source: Bloomberg, Rabobank 2019
3/12 RaboResearch | Agri Commodity Markets Research | August 2019
Corn
CBOT Corn extended its 22% fall from grace in August, as the USDA bucked expectations to confirm a 90m-ac US crop and raise yields close to trend
High 2018/19 US stocks, a stabilized 2019/20 US crop, soft global demand, and currency-favored global supplies limit upside for CBOT Corn.
Uncertainty on corn yield and harvested acreage justifies a supply risk premium – selling likely limited from here.
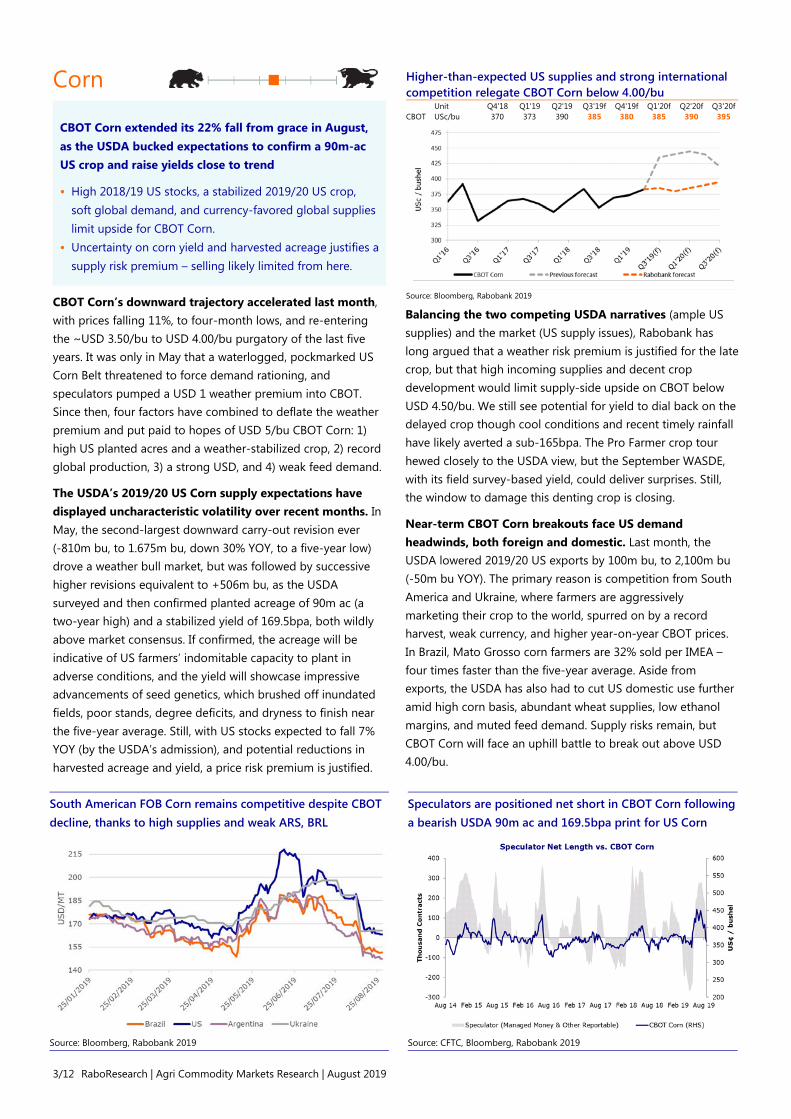
CBOT Corn’s downward trajectory accelerated last month, with prices falling 11%, to four-month lows, and re-entering the ~USD 3.50/bu to USD 4.00/bu purgatory of the last five years. It was only in May that a waterlogged, pockmarked US Corn Belt threatened to force demand rationing, and speculators pumped a USD 1 weather premium into CBOT. Since then, four factors have combined to deflate the weather premium and put paid to hopes of USD 5/bu CBOT Corn: 1) high US planted acres and a weather-stabilized crop, 2) record global production, 3) a strong USD, and 4) weak feed demand.
The USDA’s 2019/20 US Corn supply expectations have displayed uncharacteristic volatility over recent months. In May, the second-largest downward carry-out revision ever (-810m bu, to 1.675m bu, down 30% YOY, to a five-year low) drove a weather bull market, but was followed by successive higher revisions equivalent to +506m bu, as the USDA surveyed and then confirmed planted acreage of 90m ac (a two-year high) and a stabilized yield of 169.5bpa, both wildly above market consensus. If confirmed, the acreage will be indicative of US farmers’ indomitable capacity to plant in adverse conditions, and the yield will showcase impressive advancements of seed genetics, which brushed off inundated fields, poor stands, degree deficits, and dryness to finish near the five-year average. Still, with US stocks expected to fall 7% YOY (by the USDA’s admission), and potential reductions in harvested acreage and yield, a price risk premium is justified.
Balancing the two competing USDA narratives (ample US supplies) and the market (US supply issues), Rabobank has long argued that a weather risk premium is justified for the late crop, but that high incoming supplies and decent crop development would limit supply-side upside on CBOT below USD 4.50/bu. We still see potential for yield to dial back on the delayed crop though cool conditions and recent timely rainfall have likely averted a sub-165bpa. The Pro Farmer crop tour hewed closely to the USDA view, but the September WASDE, with its field survey-based yield, could deliver surprises. Still, the window to damage this denting crop is closing.
Near-term CBOT Corn breakouts face US demand headwinds, both foreign and domestic. Last month, the USDA lowered 2019/20 US exports by 100m bu, to 2,100m bu (-50m bu YOY). The primary reason is competition from South America and Ukraine, where farmers are aggressively marketing their crop to the world, spurred on by a record harvest, weak currency, and higher year-on-year CBOT prices. In Brazil, Mato Grosso corn farmers are 32% sold per IMEA – four times faster than the five-year average. Aside from exports, the USDA has also had to cut US domestic use further amid high corn basis, abundant wheat supplies, low ethanol margins, and muted feed demand. Supply risks remain, but CBOT Corn will face an uphill battle to break out above USD 4.00/bu.
South American FOB Corn remains competitive despite CBOT decline, thanks to high supplies and weak ARS, BRL
Speculators are positioned net short in CBOT Corn following a bearish USDA 90m ac and 169.5bpa print for US Corn
Source: Bloomberg, Rabobank 2019 Source: CFTC, Bloomberg, Rabobank 2019
Higher-than-expected US supplies and strong international competition relegate CBOT Corn below 4.00/bu
Unit Q4'18 Q1'19 Q2'19 Q3'19f Q4'19f Q1'20f Q2'20f Q3'20f CBOT USc/bu 370 373 390 385 380 385 390 395
Source: Bloomberg, Rabobank 2019
4/12 RaboResearch | Agri Commodity Markets Research | August 2019
Soybeans
CBOT Soybeans withstood a post-WASDE corn sell-off thanks to lower US supply and yield prospects, rising Brazilian premiums, and muted farmer selling.
Chinese soy imports were down in 2018/19 on ASF, but are expected to slightly rebound; in the absence of US supplies, China’s supply situation will be strained.
Prices below/near cost of production, US MFP, along with US production cuts in 2019 and potentially 2020 also help limit CBOT Soybean downside from here.
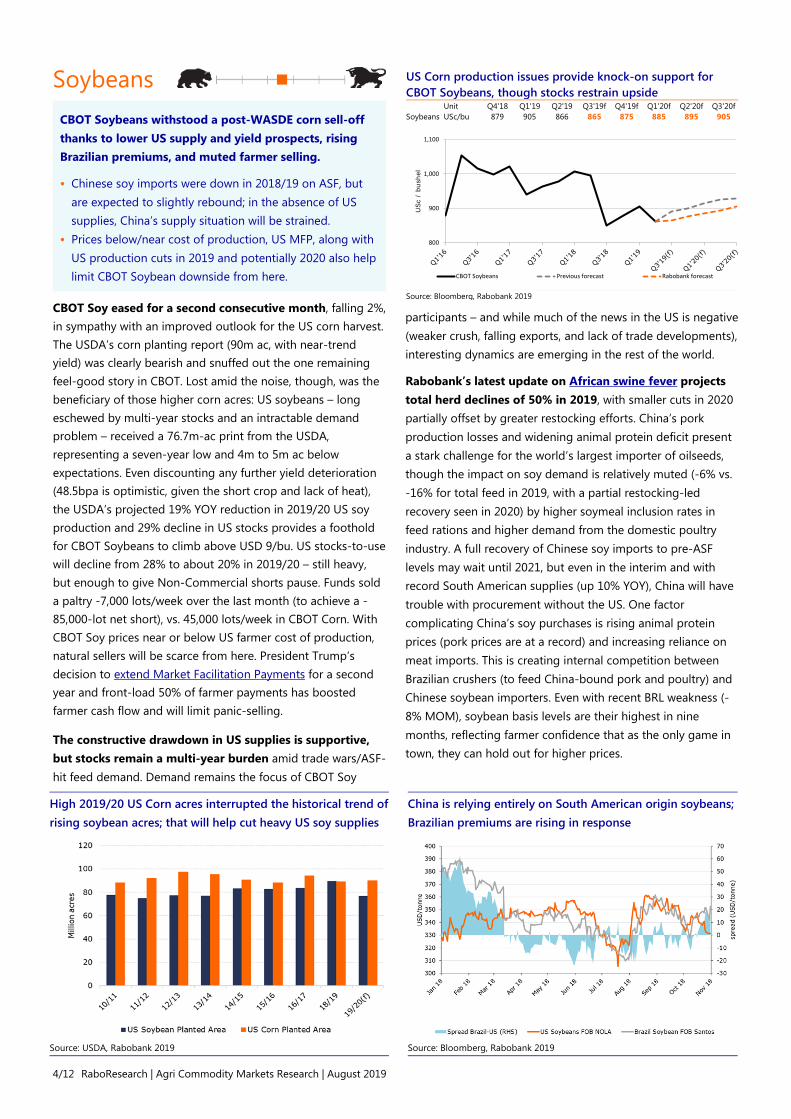
CBOT Soy eased for a second consecutive month, falling 2%, in sympathy with an improved outlook for the US corn harvest. The USDA’s corn planting report (90m ac, with near-trend yield) was clearly bearish and snuffed out the one remaining feel-good story in CBOT. Lost amid the noise, though, was the beneficiary of those higher corn acres: US soybeans – long eschewed by multi-year stocks and an intractable demand problem – received a 76.7m-ac print from the USDA, representing a seven-year low and 4m to 5m ac below expectations. Even discounting any further yield deterioration (48.5bpa is optimistic, given the short crop and lack of heat), the USDA’s projected 19% YOY reduction in 2019/20 US soy production and 29% decline in US stocks provides a foothold for CBOT Soybeans to climb above USD 9/bu. US stocks-to-use will decline from 28% to about 20% in 2019/20 – still heavy, but enough to give Non-Commercial shorts pause. Funds sold a paltry -7,000 lots/week over the last month (to achieve a -85,000-lot net short), vs. 45,000 lots/week in CBOT Corn. With CBOT Soy prices near or below US farmer cost of production, natural sellers will be scarce from here. President Trump’s decision to extend Market Facilitation Payments for a second year and front-load 50% of farmer payments has boosted farmer cash flow and will limit panic-selling.
The constructive drawdown in US supplies is supportive, but stocks remain a multi-year burden amid trade wars/ASF-hit feed demand. Demand remains the focus of CBOT Soy
participants – and while much of the news in the US is negative (weaker crush, falling exports, and lack of trade developments), interesting dynamics are emerging in the rest of the world.
Rabobank’s latest update on African swine fever projects total herd declines of 50% in 2019, with smaller cuts in 2020 partially offset by greater restocking efforts. China’s pork production losses and widening animal protein deficit present a stark challenge for the world’s largest importer of oilseeds, though the impact on soy demand is relatively muted (-6% vs. -16% for total feed in 2019, with a partial restocking-led recovery seen in 2020) by higher soymeal inclusion rates in feed rations and higher demand from the domestic poultry industry. A full recovery of Chinese soy imports to pre-ASF levels may wait until 2021, but even in the interim and with record South American supplies (up 10% YOY), China will have trouble with procurement without the US. One factor complicating China’s soy purchases is rising animal protein prices (pork prices are at a record) and increasing reliance on meat imports. This is creating internal competition between Brazilian crushers (to feed China-bound pork and poultry) and Chinese soybean importers. Even with recent BRL weakness (-8% MOM), soybean basis levels are their highest in nine months, reflecting farmer confidence that as the only game in town, they can hold out for higher prices.
High 2019/20 US Corn acres interrupted the historical trend of rising soybean acres; that will help cut heavy US soy supplies
China is relying entirely on South American origin soybeans; Brazilian premiums are rising in response
Source: USDA, Rabobank 2019 Source: Bloomberg, Rabobank 2019
US Corn production issues provide knock-on support for CBOT Soybeans, though stocks restrain upside
Unit Q4'18 Q1'19 Q2'19 Q3'19f Q4'19f Q1'20f Q2'20f Q3'20f Soybeans USc/bu 879 905
866 865 875 885 895 905
Source: Bloomberg, Rabobank 2019
800
900
1,000
1,100
USc
/ bu
shel
CBOT Soybeans Previous forecast Rabobank forecast
5/12 RaboResearch | Agri Commodity Markets Research | August 2019
Soymeal and Soy Oil
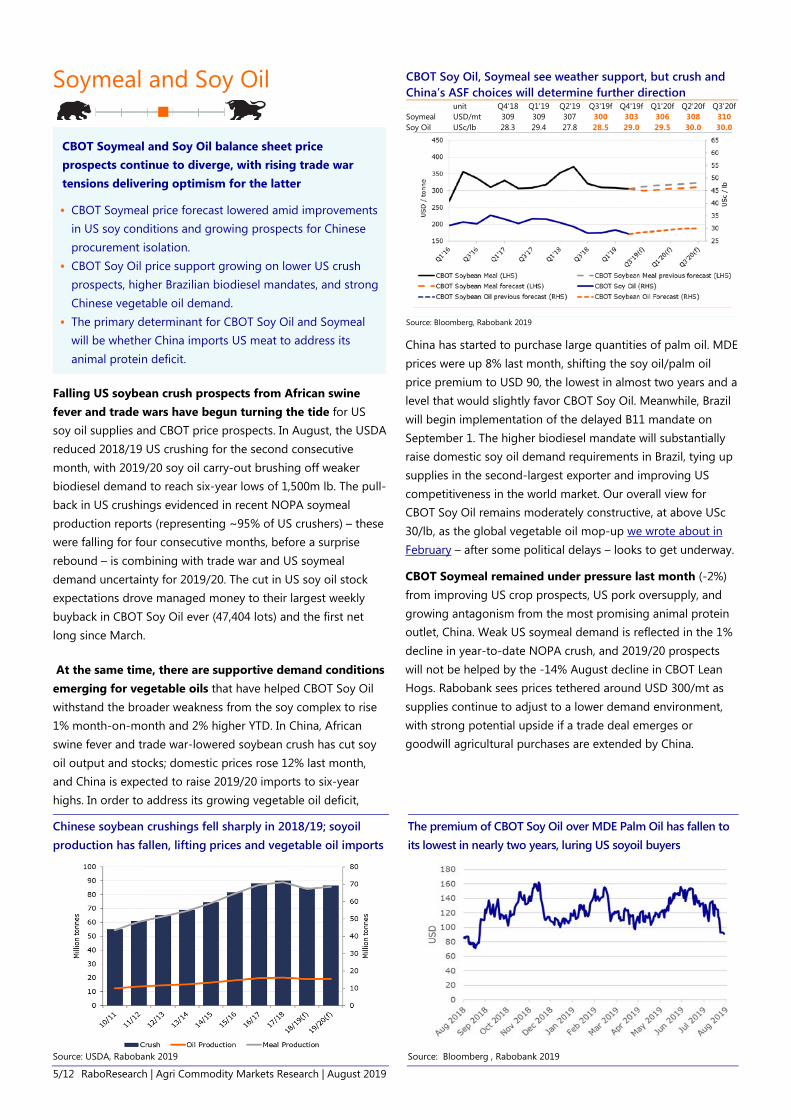
CBOT Soymeal and Soy Oil balance sheet price prospects continue to diverge, with rising trade war tensions delivering optimism for the latter
CBOT Soymeal price forecast lowered amid improvements in US soy conditions and growing prospects for Chinese procurement isolation.
CBOT Soy Oil price support growing on lower US crush prospects, higher Brazilian biodiesel mandates, and strong Chinese vegetable oil demand.
The primary determinant for CBOT Soy Oil and Soymeal will be whether China imports US meat to address its animal protein deficit.
Falling US soybean crush prospects from African swine fever and trade wars have begun turning the tide for US soy oil supplies and CBOT price prospects. In August, the USDA reduced 2018/19 US crushing for the second consecutive month, with 2019/20 soy oil carry-out brushing off weaker biodiesel demand to reach six-year lows of 1,500m lb. The pull-back in US crushings evidenced in recent NOPA soymeal production reports (representing ~95% of US crushers) – these were falling for four consecutive months, before a surprise rebound – is combining with trade war and US soymeal demand uncertainty for 2019/20. The cut in US soy oil stock expectations drove managed money to their largest weekly buyback in CBOT Soy Oil ever (47,404 lots) and the first net long since March.
At the same time, there are supportive demand conditions emerging for vegetable oils that have helped CBOT Soy Oil withstand the broader weakness from the soy complex to rise 1% month-on-month and 2% higher YTD. In China, African swine fever and trade war-lowered soybean crush has cut soy oil output and stocks; domestic prices rose 12% last month, and China is expected to raise 2019/20 imports to six-year highs. In order to address its growing vegetable oil deficit,
China has started to purchase large quantities of palm oil. MDE prices were up 8% last month, shifting the soy oil/palm oil price premium to USD 90, the lowest in almost two years and a level that would slightly favor CBOT Soy Oil. Meanwhile, Brazil will begin implementation of the delayed B11 mandate on September 1. The higher biodiesel mandate will substantially raise domestic soy oil demand requirements in Brazil, tying up supplies in the second-largest exporter and improving US competitiveness in the world market. Our overall view for CBOT Soy Oil remains moderately constructive, at above USc 30/lb, as the global vegetable oil mop-up we wrote about in February – after some political delays – looks to get underway.
CBOT Soymeal remained under pressure last month (-2%) from improving US crop prospects, US pork oversupply, and growing antagonism from the most promising animal protein outlet, China. Weak US soymeal demand is reflected in the 1% decline in year-to-date NOPA crush, and 2019/20 prospects will not be helped by the -14% August decline in CBOT Lean Hogs. Rabobank sees prices tethered around USD 300/mt as supplies continue to adjust to a lower demand environment, with strong potential upside if a trade deal emerges or goodwill agricultural purchases are extended by China.
Chinese soybean crushings fell sharply in 2018/19; soyoil production has fallen, lifting prices and vegetable oil imports
The premium of CBOT Soy Oil over MDE Palm Oil has fallen to its lowest in nearly two years, luring US soyoil buyers
Source: USDA, Rabobank 2019 Source: Bloomberg , Rabobank 2019
CBOT Soy Oil, Soymeal see weather support, but crush and China’s ASF choices will determine further direction
unit Q4'18 Q1'19 Q2'19 Q3'19f Q4'19f Q1'20f Q2'20f Q3'20f Soymeal USD/mt 309 309 307 300 303 306 308 310 Soy Oil USc/lb 28.3 29.4 27.8 28.5 29.0 29.5 30.0 30.0
Source: Bloomberg, Rabobank 2019
6/12 RaboResearch | Agri Commodity Markets Research | August 2019
Palm Oil
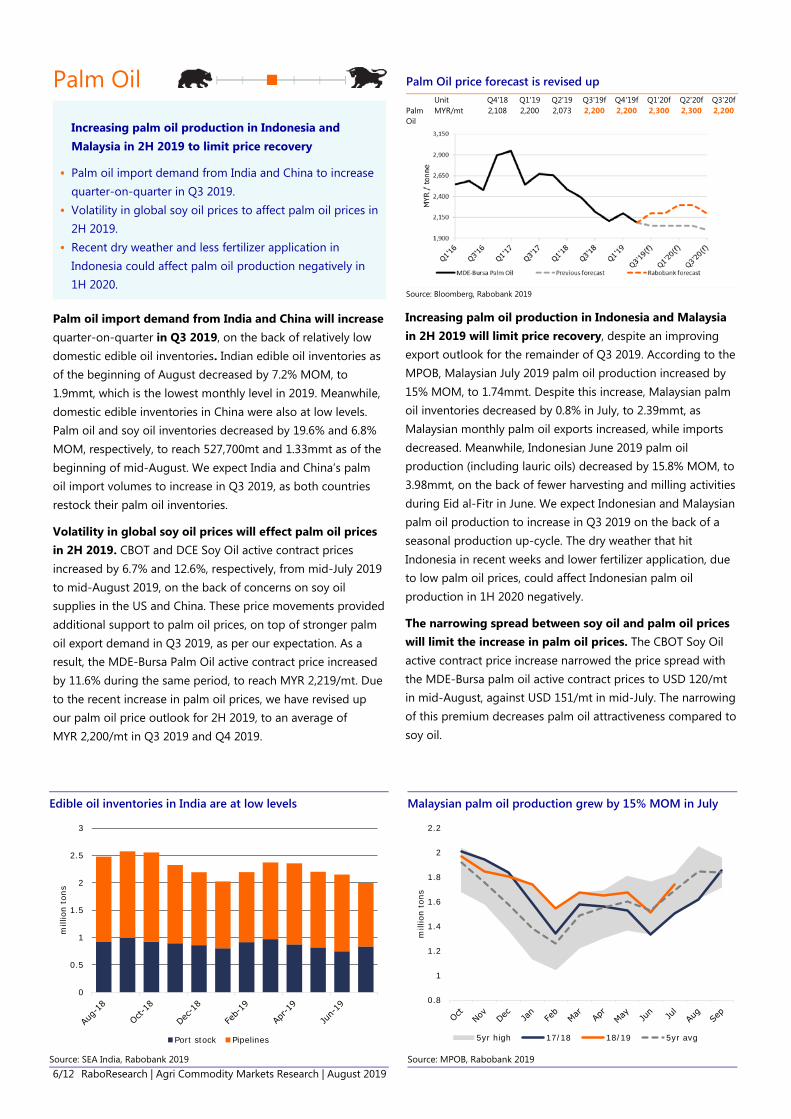
Increasing palm oil production in Indonesia and Malaysia in 2H 2019 to limit price recovery
Palm oil import demand from India and China to increase quarter-on-quarter in Q3 2019.
Volatility in global soy oil prices to affect palm oil prices in 2H 2019.
Recent dry weather and less fertilizer application in Indonesia could affect palm oil production negatively in 1H 2020.
Palm oil import demand from India and China will increase quarter-on-quarter in Q3 2019, on the back of relatively low domestic edible oil inventories. Indian edible oil inventories as of the beginning of August decreased by 7.2% MOM, to 1.9mmt, which is the lowest monthly level in 2019. Meanwhile, domestic edible inventories in China were also at low levels. Palm oil and soy oil inventories decreased by 19.6% and 6.8% MOM, respectively, to reach 527,700mt and 1.33mmt as of the beginning of mid-August. We expect India and China’s palm oil import volumes to increase in Q3 2019, as both countries restock their palm oil inventories.
Volatility in global soy oil prices will effect palm oil prices in 2H 2019. CBOT and DCE Soy Oil active contract prices increased by 6.7% and 12.6%, respectively, from mid-July 2019 to mid-August 2019, on the back of concerns on soy oil supplies in the US and China. These price movements provided additional support to palm oil prices, on top of stronger palm oil export demand in Q3 2019, as per our expectation. As a result, the MDE-Bursa Palm Oil active contract price increased by 11.6% during the same period, to reach MYR 2,219/mt. Due to the recent increase in palm oil prices, we have revised up our palm oil price outlook for 2H 2019, to an average of MYR 2,200/mt in Q3 2019 and Q4 2019.
Increasing palm oil production in Indonesia and Malaysia in 2H 2019 will limit price recovery, despite an improving export outlook for the remainder of Q3 2019. According to the MPOB, Malaysian July 2019 palm oil production increased by 15% MOM, to 1.74mmt. Despite this increase, Malaysian palm oil inventories decreased by 0.8% in July, to 2.39mmt, as Malaysian monthly palm oil exports increased, while imports decreased. Meanwhile, Indonesian June 2019 palm oil production (including lauric oils) decreased by 15.8% MOM, to 3.98mmt, on the back of fewer harvesting and milling activities during Eid al-Fitr in June. We expect Indonesian and Malaysian palm oil production to increase in Q3 2019 on the back of a seasonal production up-cycle. The dry weather that hit Indonesia in recent weeks and lower fertilizer application, due to low palm oil prices, could affect Indonesian palm oil production in 1H 2020 negatively.
The narrowing spread between soy oil and palm oil prices will limit the increase in palm oil prices. The CBOT Soy Oil active contract price increase narrowed the price spread with the MDE-Bursa palm oil active contract prices to USD 120/mt in mid-August, against USD 151/mt in mid-July. The narrowing of this premium decreases palm oil attractiveness compared to soy oil.
Edible oil inventories in India are at low levels Malaysian palm oil production grew by 15% MOM in July
Source: SEA India, Rabobank 2019 Source: MPOB, Rabobank 2019
0
0.5
1
1.5
2
2.5
3
mill
ion
tons
Port stock Pipelines
0.8
1
1.2
1.4
1.6
1.8
2
2.2
mill
ion
tons
5yr high 17/18 18/19 5yr avg
Palm Oil price forecast is revised up
Unit Q4'18 Q1'19 Q2'19 Q3'19f Q4'19f Q1'20f Q2'20f Q3'20f Palm Oil
MYR/mt 2,108 2,200 2,073
2,200 2,200 2,300 2,300 2,200
Source: Bloomberg, Rabobank 2019

7/12 RaboResearch | Agri Commodity Markets Research | August 2019
Sugar
ICE #11 Sugar will likely recover some ground
US dollar strength and Brazilian real weakness have put pressure on ICE #11, which has traded at the lowest levels seen in 2019.
Lots of physical sugar around, but the outlook for 2019/20 is tightening.
We especially see support for the white premium ahead.
ICE Sugar #11 October prices declined by 6% in the first three weeks of August. The main factors were the usual suspects: the strength of the USD, the weakness of the BRL (which lost ~7% vs. the USD since mid-July), concerns on global growth, and, of course, the heavy stocks and the constant threat of large exports from India, where there are estimates of ~14mmt of sugar stocks at the end of the season. Also there is still a lot of 2018/19 raw and white sugar in every nook and cranny, which is likely to appear in the coming October deliveries. If anyone wants sugar, there is no difficulty getting it. While, in the short term, heavy stocks are very visible and manifest themselves in every delivery, the global balance is transitioning toward a sizeable deficit in 2019/20. This will likely not eat through all of the excess stocks, but it could result in a more balanced market and in a market that needs Brazilian mills to produce more sugar in 2020.
The white puzzle – In the last three months, we have seen reductions in the 2019/20 production estimates of three large white exporters: India, the EU, and Thailand. The main reason in all three cases was the adverse weather, but, in the case of the EU, the ban of neonicotinoids also weighed on production. With this in mind, we would expect significant support for whites, especially once Indian export subsidies are set and we have some certainty that India will not completely flood the market with whites. Therefore, it is a bit puzzling to see Managed Money holding a near record net short position.
Even if India sets the export target at the same level, the announcement will probably come a few weeks earlier than last year, allowing raw sugar export contracts to be negotiated in advance, resulting in a lower proportion of whites in the Indian exports (unless relative prices move). Volatility is guaranteed.
There are some reasons to be mildly bullish on raws too. The most obvious one is that the ethanol market in Brazil continues to be surprisingly strong. Total sugar ethanol production is running just 4% below last year, according to Unica, with an ethanol mix of 64.7% vs. last year’s 63.5%. The ethanol parity stands at USc 13.3/lb, signaling that Brazilian millls will continue to maximize ethanol to the detriment of sugar for the time being. But if there is any significant deficit next season, it would be expected that Brazil alleviates some of this deficit by producing a little more sugar. If this is so, sugar prices should move closer to the the ethanol parity (currently at around USc 13.3/lb, but expected to move higher in the coming months as we approach the intercrop season). Everything else equal, ethanol demand should continue to be strong next season. Another reason to be mildly bullish is more sugar-buying from China, where internal prices have been increasing. In fact, July imports were ~77% higher YOY, while the total accumulated YTD is still 7% behind. Still room to catch up.
China’s sugar appetite may be back, with July imports 78% higher YOY and higher internal prices.
Ethanol demand in Brazil has been very strong. With GDP expected to grow by 2% in 2020 demand should keep up.
Source: Chinese Customs, Bloomberg, Rabobank 2019 Source: CEPEA, Bloomberg, Rabobank 2019
0
0.1
0.2
0.3
0.4
0.5
0.6
0.7
0.00
1.00
2.00
3.00
4.00
5.00
6.00
Offi
cial
chi
nese
sug
ar im
port
s -m
mt
12-month rolling imports Monthly imports (RHS)
1.0
1.1
1.2
1.3
1.4
1.5
1.6
1.7
1.8
1.9
2.0
Hyd
rous
eth
anol
in S
P -
BRL/
liter
2014 2015 2016 2017 2018 2019
ICE #11 Sugar price forecast lowered, but still bullish
Unit Q4'18 Q1'19 Q2'19 Q3'19f Q4'19f Q1'20f Q2'20f Q3'20f Sugar USc/lb 13.0 12.8 12.5 12.8 13.1 13.3 13.5 13.6
Source: Bloomberg, Rabobank 2019
8/12 RaboResearch | Agri Commodity Markets Research | August 2019
Coffee
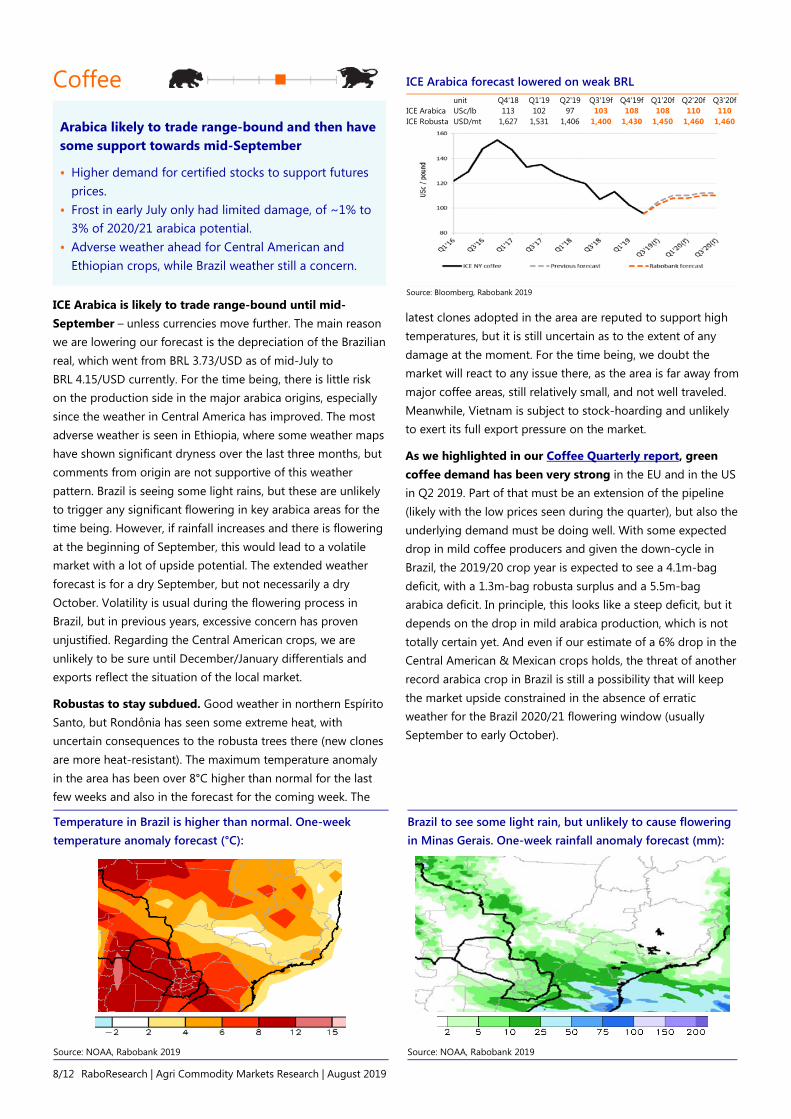
Arabica likely to trade range-bound and then have some support towards mid-September
Higher demand for certified stocks to support futures prices.
Frost in early July only had limited damage, of ~1% to 3% of 2020/21 arabica potential.
Adverse weather ahead for Central American and Ethiopian crops, while Brazil weather still a concern.
ICE Arabica is likely to trade range-bound until mid-September – unless currencies move further. The main reason we are lowering our forecast is the depreciation of the Brazilian real, which went from BRL 3.73/USD as of mid-July to BRL 4.15/USD currently. For the time being, there is little risk on the production side in the major arabica origins, especially since the weather in Central America has improved. The most adverse weather is seen in Ethiopia, where some weather maps have shown significant dryness over the last three months, but comments from origin are not supportive of this weather pattern. Brazil is seeing some light rains, but these are unlikely to trigger any significant flowering in key arabica areas for the time being. However, if rainfall increases and there is flowering at the beginning of September, this would lead to a volatile market with a lot of upside potential. The extended weather forecast is for a dry September, but not necessarily a dry October. Volatility is usual during the flowering process in Brazil, but in previous years, excessive concern has proven unjustified. Regarding the Central American crops, we are unlikely to be sure until December/January differentials and exports reflect the situation of the local market.
Robustas to stay subdued. Good weather in northern Espírito Santo, but Rondônia has seen some extreme heat, with uncertain consequences to the robusta trees there (new clones are more heat-resistant). The maximum temperature anomaly in the area has been over 8°C higher than normal for the last few weeks and also in the forecast for the coming week. The
latest clones adopted in the area are reputed to support high temperatures, but it is still uncertain as to the extent of any damage at the moment. For the time being, we doubt the market will react to any issue there, as the area is far away from major coffee areas, still relatively small, and not well traveled. Meanwhile, Vietnam is subject to stock-hoarding and unlikely to exert its full export pressure on the market.
As we highlighted in our Coffee Quarterly report, green coffee demand has been very strong in the EU and in the US in Q2 2019. Part of that must be an extension of the pipeline (likely with the low prices seen during the quarter), but also the underlying demand must be doing well. With some expected drop in mild coffee producers and given the down-cycle in Brazil, the 2019/20 crop year is expected to see a 4.1m-bag deficit, with a 1.3m-bag robusta surplus and a 5.5m-bag arabica deficit. In principle, this looks like a steep deficit, but it depends on the drop in mild arabica production, which is not totally certain yet. And even if our estimate of a 6% drop in the Central American & Mexican crops holds, the threat of another record arabica crop in Brazil is still a possibility that will keep the market upside constrained in the absence of erratic weather for the Brazil 2020/21 flowering window (usually September to early October).
Temperature in Brazil is higher than normal. One-week temperature anomaly forecast (°C):
Brazil to see some light rain, but unlikely to cause flowering in Minas Gerais. One-week rainfall anomaly forecast (mm):
Source: NOAA, Rabobank 2019 Source: NOAA, Rabobank 2019
ICE Arabica forecast lowered on weak BRL
unit Q4'18 Q1'19 Q2'19 Q3'19f Q4'19f Q1'20f Q2'20f Q3'20f ICE Arabica USc/lb 113 102 97 103 108 108 110 110 ICE Robusta USD/mt 1,627 1,531 1,406 1,400 1,430 1,450 1,460 1,460
Source: Bloomberg, Rabobank 2019
9/12 RaboResearch | Agri Commodity Markets Research | August 2019
Cocoa
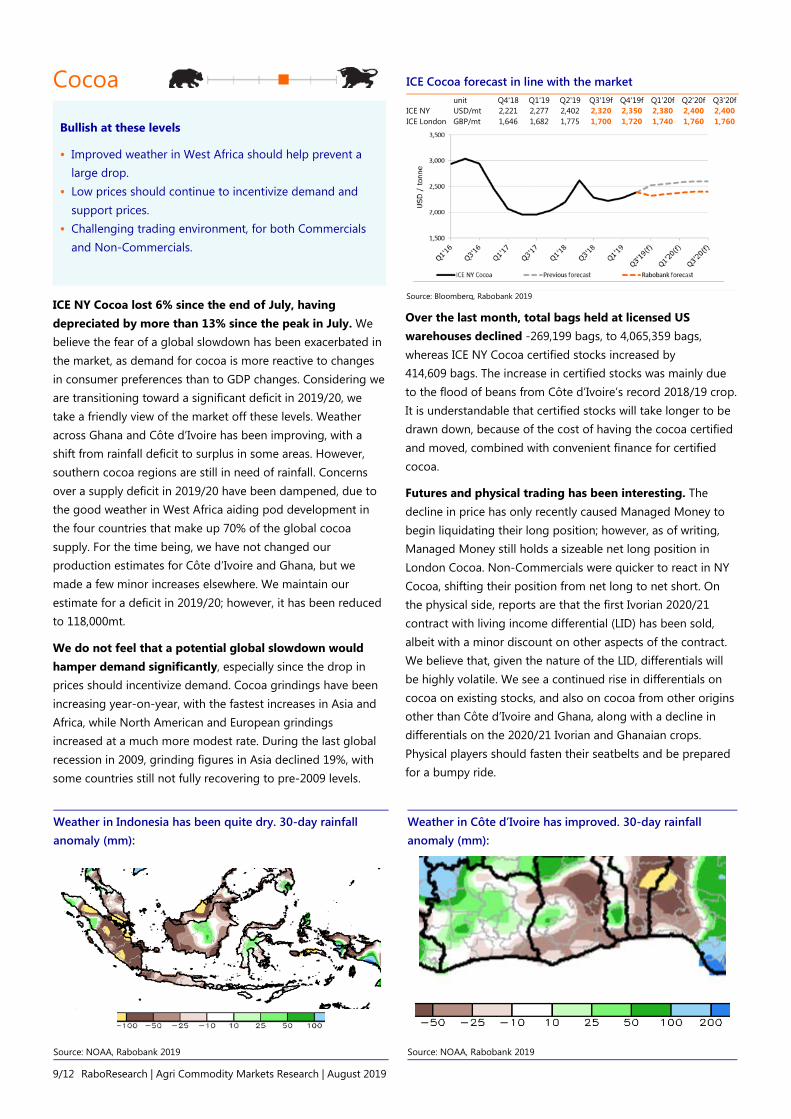
Bullish at these levels
Improved weather in West Africa should help prevent a large drop.
Low prices should continue to incentivize demand and support prices.
Challenging trading environment, for both Commercials and Non-Commercials.
ICE NY Cocoa lost 6% since the end of July, having depreciated by more than 13% since the peak in July. We believe the fear of a global slowdown has been exacerbated in the market, as demand for cocoa is more reactive to changes in consumer preferences than to GDP changes. Considering we are transitioning toward a significant deficit in 2019/20, we take a friendly view of the market off these levels. Weather across Ghana and Côte d’Ivoire has been improving, with a shift from rainfall deficit to surplus in some areas. However, southern cocoa regions are still in need of rainfall. Concerns over a supply deficit in 2019/20 have been dampened, due to the good weather in West Africa aiding pod development in the four countries that make up 70% of the global cocoa supply. For the time being, we have not changed our production estimates for Côte d’Ivoire and Ghana, but we made a few minor increases elsewhere. We maintain our estimate for a deficit in 2019/20; however, it has been reduced to 118,000mt.
We do not feel that a potential global slowdown would hamper demand significantly, especially since the drop in prices should incentivize demand. Cocoa grindings have been increasing year-on-year, with the fastest increases in Asia and Africa, while North American and European grindings increased at a much more modest rate. During the last global recession in 2009, grinding figures in Asia declined 19%, with some countries still not fully recovering to pre-2009 levels.
Over the last month, total bags held at licensed US warehouses declined -269,199 bags, to 4,065,359 bags, whereas ICE NY Cocoa certified stocks increased by 414,609 bags. The increase in certified stocks was mainly due to the flood of beans from Côte d’Ivoire’s record 2018/19 crop. It is understandable that certified stocks will take longer to be drawn down, because of the cost of having the cocoa certified and moved, combined with convenient finance for certified cocoa.
Futures and physical trading has been interesting. The decline in price has only recently caused Managed Money to begin liquidating their long position; however, as of writing, Managed Money still holds a sizeable net long position in London Cocoa. Non-Commercials were quicker to react in NY Cocoa, shifting their position from net long to net short. On the physical side, reports are that the first Ivorian 2020/21 contract with living income differential (LID) has been sold, albeit with a minor discount on other aspects of the contract. We believe that, given the nature of the LID, differentials will be highly volatile. We see a continued rise in differentials on cocoa on existing stocks, and also on cocoa from other origins other than Côte d’Ivoire and Ghana, along with a decline in differentials on the 2020/21 Ivorian and Ghanaian crops. Physical players should fasten their seatbelts and be prepared for a bumpy ride.
Weather in Indonesia has been quite dry. 30-day rainfall anomaly (mm):
Weather in Côte d’Ivoire has improved. 30-day rainfall anomaly (mm):
Source: NOAA, Rabobank 2019 Source: NOAA, Rabobank 2019
ICE Cocoa forecast in line with the market
unit Q4'18 Q1'19 Q2'19 Q3'19f Q4'19f Q1'20f Q2'20f Q3'20f ICE NY USD/mt 2,221 2,277 2,402 2,320 2,350 2,380 2,400 2,400 ICE London GBP/mt 1,646 1,682 1,775 1,700 1,720 1,740 1,760 1,760
Source: Bloomberg, Rabobank 2019
10/12 RaboResearch | Agri Commodity Markets Research | August 2019
Cotton
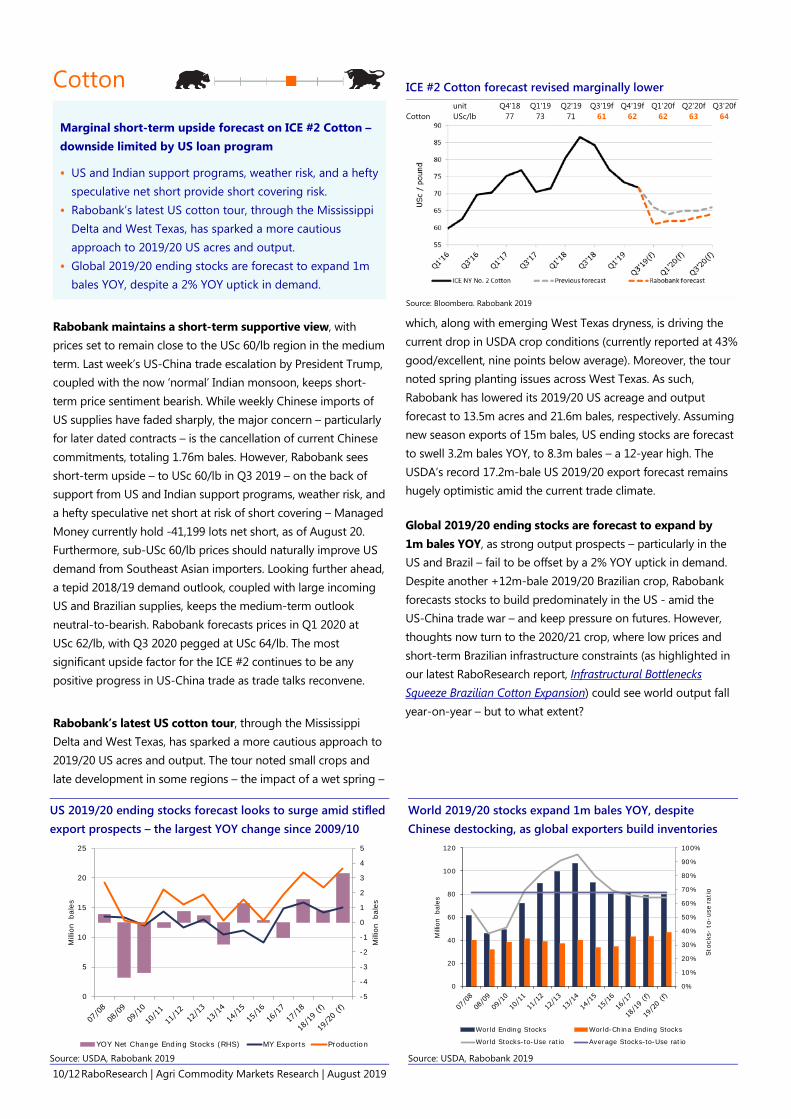
Marginal short-term upside forecast on ICE #2 Cotton – downside limited by US loan program
US and Indian support programs, weather risk, and a hefty speculative net short provide short covering risk.
Rabobank’s latest US cotton tour, through the Mississippi Delta and West Texas, has sparked a more cautious approach to 2019/20 US acres and output.
Global 2019/20 ending stocks are forecast to expand 1m bales YOY, despite a 2% YOY uptick in demand.
Rabobank maintains a short-term supportive view, with prices set to remain close to the USc 60/lb region in the medium term. Last week’s US-China trade escalation by President Trump, coupled with the now ‘normal’ Indian monsoon, keeps short-term price sentiment bearish. While weekly Chinese imports of US supplies have faded sharply, the major concern – particularly for later dated contracts – is the cancellation of current Chinese commitments, totaling 1.76m bales. However, Rabobank sees short-term upside – to USc 60/lb in Q3 2019 – on the back of support from US and Indian support programs, weather risk, and a hefty speculative net short at risk of short covering – Managed Money currently hold -41,199 lots net short, as of August 20. Furthermore, sub-USc 60/lb prices should naturally improve US demand from Southeast Asian importers. Looking further ahead, a tepid 2018/19 demand outlook, coupled with large incoming US and Brazilian supplies, keeps the medium-term outlook neutral-to-bearish. Rabobank forecasts prices in Q1 2020 at USc 62/lb, with Q3 2020 pegged at USc 64/lb. The most significant upside factor for the ICE #2 continues to be any positive progress in US-China trade as trade talks reconvene.
Rabobank’s latest US cotton tour, through the Mississippi Delta and West Texas, has sparked a more cautious approach to 2019/20 US acres and output. The tour noted small crops and late development in some regions – the impact of a wet spring –
which, along with emerging West Texas dryness, is driving the current drop in USDA crop conditions (currently reported at 43% good/excellent, nine points below average). Moreover, the tour noted spring planting issues across West Texas. As such, Rabobank has lowered its 2019/20 US acreage and output forecast to 13.5m acres and 21.6m bales, respectively. Assuming new season exports of 15m bales, US ending stocks are forecast to swell 3.2m bales YOY, to 8.3m bales – a 12-year high. The USDA’s record 17.2m-bale US 2019/20 export forecast remains hugely optimistic amid the current trade climate.
Global 2019/20 ending stocks are forecast to expand by 1m bales YOY, as strong output prospects – particularly in the US and Brazil – fail to be offset by a 2% YOY uptick in demand. Despite another +12m-bale 2019/20 Brazilian crop, Rabobank forecasts stocks to build predominately in the US - amid the US-China trade war – and keep pressure on futures. However, thoughts now turn to the 2020/21 crop, where low prices and short-term Brazilian infrastructure constraints (as highlighted in our latest RaboResearch report, Infrastructural Bottlenecks Squeeze Brazilian Cotton Expansion) could see world output fall year-on-year – but to what extent?
US 2019/20 ending stocks forecast looks to surge amid stifled export prospects – the largest YOY change since 2009/10
World 2019/20 stocks expand 1m bales YOY, despite Chinese destocking, as global exporters build inventories
Source: USDA, Rabobank 2019 Source: USDA, Rabobank 2019
-5
-4
-3
-2
-1
0
1
2
3
4
5
0
5
10
15
20
25
Millio
n ba
les
Millio
n ba
les
YOY Net Change Ending Stocks (RHS) MY Exports Production
0%
10%
20%
30%
40%
50%
60%
70%
80%
90%
100%
0
20
40
60
80
100
120
Sto
cks-
to-u
se ra
tio
Millio
n ba
les
World Ending Stocks World-China Ending Stocks
World Stocks-to-Use ratio Average Stocks-to-Use ratio
ICE #2 Cotton forecast revised marginally lower
unit Q4'18 Q1'19 Q2'19 Q3'19f Q4'19f Q1'20f Q2'20f Q3'20f Cotton USc/lb 77 73 71 61 62 62 63 64
Source: Bloomberg, Rabobank 2019
11/12 RaboResearch | Agri Commodity Markets Research | August 2019
Methodology note: For ICE Sugar (raws and whites), ICE Arabica, ICE Robusta, and ICE Cocoa (NY and London), we aim to forecast the second rolling contracts, whereas for Palm Oil, we aim to forecast the third rolling contract. We have also used these contracts in the price diagrams. For all other contracts, we focus on the front month.
Imprint
RaboResearch Food & Agribusiness far.rabobank.com Agri Commodity Markets Research
Stefan Vogel, Head of ACMR [email protected], +44 20 7664 9523
Carlos Mera, Senior Commodity Analyst [email protected], +44 20 7664 9512
Michael Magdovitz, Commodity Analyst [email protected], +44 20 7664 9969
Andrew Rawlings, Associate Commodity Analyst [email protected], +44 20 7664 9756
Contributing analysts:
Andy Duff―São Paulo, Brazil [email protected]
Charles Clack―Sydney [email protected]
Oscar Tjakra―Singapore [email protected]
Rabobank Markets Corporate Risk & Treasury Management Contacts
GLOBAL HEAD―Martijn Sorber +31 30 21 69447 [email protected]
ASIA―Koon Koh Tan +65 6230 6988 [email protected]
AUSTRALIA―David Teakle +61 (2) 81153101 [email protected]
NETHERLANDS―Arjan Veerhoek +31 30 216 9040 [email protected]
EUROPE―David Kane +44 (20) 7664 9744 [email protected]
NORTH AMERICA―Neil Williamson +1 (212) 8086966 [email protected]
SOUTH AMERICA―Ricardo Rosa +55 11 5503-7150 [email protected]

12/12 RaboResearch | Agri Commodity Markets Research | August 2019
© 2019 – All rights reserved
Disclaimer Non Independent Research
This document is issued by Coöperatieve Rabobank U.A. incorporated in the Netherlands, trading as Rabobank (Rabobank) a cooperative with excluded liability. The liability of its members is limited. Rabobank is authorised by De Nederlandsche Bank (DNB) and the Netherlands Authority for the Financial Markets (AFM). Rabobank London Branch (RL) is authorised by the Prudential Regulation Authority (PRA) and subject to limited regulation by the Financial Conduct Authority (FCA) and PRA. Details about the extent of our authorisation and regulation by the PRA, and regulation by the FCA are available from us on request. RL is registered in England and Wales under Company no. FC 11780 and under Branch No. BR002630. This document is directed exclusively to Eligible Counterparties and Professional Clients. It is not directed at Retail Clients.
This document does not purport to be impartial research and has not been prepared in accordance with legal requirements designed to promote the independence of Investment Research and is not subject to any prohibition on dealing ahead of the dissemination of Investment Research. This document does NOT purport to be an impartial assessment of the value or prospects of its subject matter and it must not be relied upon by any recipient as an impartial assessment of the value or prospects of its subject matter. No reliance may be placed by a recipient on any representations or statements made outside this document (oral or written) by any person which state or imply (or may be reasonably viewed as stating or implying) any such impartiality.
This document is for information purposes only and is not, and should not be construed as, an offer or a commitment by RL or any of its affiliates to enter into a transaction. This document does not constitute investment advice and nor is any information provided intended to offer sufficient information such that is should be relied upon for the purposes of making a decision in relation to whether to acquire any financial products. The information and opinions contained in this document have been compiled or arrived at from sources believed to be reliable, but no representation or warranty, express or implied, is made as to their accuracy, completeness or correctness.
The information contained in this document is not to be relied upon by the recipient as authoritative or taken in substitution for the exercise of judgement by any recipient. Any opinions, forecasts or estimates herein constitute a judgement of RL as at the date of this document, and there can be no assurance that future results or events will be consistent with any such opinions, forecasts or estimates. All opinions expressed in this document are subject to change without notice.
To the extent permitted by law, neither RL, nor other legal entities in the group to which it belongs accept any liability whatsoever for any direct or consequential loss howsoever arising from any use of this document or its contents or otherwise arising in connection therewith.
Insofar as permitted by applicable laws and regulations, RL or other legal entities in the group to which it belongs, their directors, officers and/or employees may have had or have a long or short position or act as a market maker and may have traded or acted as principal in the securities described within this document (or related investments) or may otherwise have conflicting interests. This may include hedging transactions carried out by RL or other legal entities in the group, and such hedging transactions may affect the value and/or liquidity of the securities described in this document. Further it may have or have had a relationship with or may provide or have provided corporate finance or other services to companies whose securities (or related investments) are described in this document. Further, internal and external publications may have been issued prior to this publication where strategies may conflict according to market conditions at the time of each publication.
This document may not be reproduced, distributed or published, in whole or in part, for any purpose, except with the prior written consent of RL. By accepting this document you agree to be bound by the foregoing restrictions. The distribution of this document in other jurisdictions may be restricted by law and recipients of this document should inform themselves about, and observe any such restrictions.
Please email [email protected] to be removed from this mailing list
A summary of the methodology can be found on our website www.rabobank.com
© Rabobank London, Thames Court, One Queenhithe, London EC4V 3RL +44(0) 207 809 3000