August 2016 Trends - Alaska Dept of Labor · 2 AUGUST 2016 ALASKA ECONOMIC TRENDS AUGUST 2016...
19
Transcript of August 2016 Trends - Alaska Dept of Labor · 2 AUGUST 2016 ALASKA ECONOMIC TRENDS AUGUST 2016...

2 ALASKA ECONOMIC TRENDSAUGUST 2016
AUGUST 2016Volume 36 Number 8
ISSN 0160-3345
Alaska Economic Trends is a monthly publica on whose purpose is to objec vely inform the public about a wide variety of economic issues in the state. Trends is funded by the Employment and Training Services Division of the Alaska Department of Labor and Workforce Development and is published by the department’s Research and Analysis Sec on. Trends is printed and distributed by Assets, Inc., a voca onal training and employment program, at a cost of $1.37 per copy. Material in this publica on is public informa on, and with appropriate credit may be reproduced without permission.
Sam DapcevichCover Ar st
Sara WhitneyEditor
To request a free electronic or print subscrip on, e-mail [email protected] or call (907) 465-4500.Trends is on the Web at labor.alaska.gov/trends.
Dan RobinsonChief, Research and Analysis
Bill WalkerGovernor
Heidi DrygasCommissioner
ON THE COVER: House keys photo by Flickr user Ma e.License: h ps://crea vecommons.org/licenses/by-nc-sa/2.0/legalcode
ALASKA DEPARTMENTof LABOR
and WORKFORCEDEVELOPMENT
HOW WE SPEND OUR MONEYPAGE 8
By NEAL FRIED
Data on Alaskans’ personal consump on available for the fi rst me
ALASKA’s RENTAL MARKETPAGE 4
By KARINNE WIEBOLD
Rents have held mostly steady in recent years
THE MONTH IN NUMBERS PAGE 17
VALDEZ-CORDOVAPAGE 11
By ALYSSA RODRIGUES
Vast census area covers towns with a broad range of iden es

3ALASKA ECONOMIC TRENDS AUGUST 2016
AVTEC a world class training op on for graduates
Heidi DrygasCommissioner
August in Alaska: The silver salmon are running, juicy berries are ready to be picked, and state fair season is in full swing. And for many families, August is time to get ready to go back to school.
For students entering their fi nal years of high school, it’s also time to make decisions about their futures. There’s no better choice than AVTEC—Alaska’s In-stitute of Technology for young Alaskans seeking high quality career training.
The state’s world class training facilities are located in Seward, and its quality programs and instructors are primary reasons students enroll each year. With a 90 percent average over the last four years for job placement and a variety of job training options, it is a reliable provider of skilled training for Alaska students.
AVTEC provides room and board, and 10 months is the longest scheduled pro-gram. The courses are affordable and students will graduate well prepared to enter the workforce.
AVTEC’s programs range from Business and Offi ce Technologies (including Infor-mation Technology) to Maritime Training. This year, AVTEC opened a state-of-the art Applied Technologies building for training Alaskans to maintain and oper-ate a variety of heavy equipment, and for learning structural and pipe welding. Students will fi nd a balance of shop and classroom experiences that readily trans-fers to careers in construction, welding, mining, or logging.
Each training program is monitored by industry advisors who review and ap-prove curriculum, providing guidance to respond to changing workforce trends. AVTEC is accredited by the Council on Occupational Education, and its overall guidance for programs is derived from the Alaska Workforce Investment Board.
AVTEC’s Energy Building Technologies programs provide a wide range of equip-
ment and training systems in construc-tion trades, electrical, power production, plumbing and heating, and refrigeration. Graduates of the industrial electrical program can earn the “Golden Ticket” and articulate directly to the NECA/IBEW electrical apprenticeship training program. Many trainees from AVTEC programs are hired by employers that at-tend annual job fairs held in Seward each spring for this purpose.
The AVTEC Maritime Training Center, a U.S. Coast Guard approved training facility, boasts full mission bridge simu-lators that have the ability to replicate entry and exit into harbors across the world. These simulators can test dif-ferent weather conditions, tidal fl ow and visibility, multiple vessels working together, and a wide range of ships that employees might pilot.
The maritime industry regularly con-tracts for its employees to train at AVTEC. Simulations provide the neces-sary training in a safe environment in terms of life and property while putting students through the grueling conditions of working at sea.
AVTEC’s Professional Cooking and Baking program operates in an industrial kitchen and operational dining room. Students learn professional culinary skills and techniques using the same in-dustrial kitchen equipment they will en-counter throughout the culinary industry.
Finally, as a condition of completion, trainees must master the critical soft skills Alaska employers value: being safe, ethical, on time, and productive at work and mastering innovative thought processes with an eye for effi ciency of operation.
Families with high school age students would be wise to consider how AVTEC can prepare young Alaskans for reward-ing careers. For more information about the available training opportunities, please visit www.avtec.edu.
Follow the Alaska Department of Labor and Workforce Development on Facebook (facebook.com/alaskalabor) and Twi er (twi er.com/alaskalabor) for the latest news about jobs, workplace safety, and workforce development.

4 ALASKA ECONOMIC TRENDSAUGUST 2016
Alaska’sRentalMarket
Rents have held mostly steady in recent years
By KARINNE WIEBOLD
Infl a on-Adjusted Rent Has Been Flat in Recent Years1 A , 2000 2016
Notes: Rent includes u li es. Because 2016 infl a on adjustments are not yet available, adjusted rent uses 2015 dollars.Source: Alaska Department of Labor and Workforce Development, Research and Analysis Sec on and Alaska Housing Finance Corpora on, Annual Residen al Rental Survey
Our 2016 annual residen al rental survey shows that Alaska rents are essen ally level with last year (see Exhibit 1) and the overall rental vacancy rate has fallen slightly.
Statewide, rents have increased just seven-tenths of a percent-age point, or $9, since last year, bringing the average rent for all unit types to $1,238 including u li es.
Rents went up faster in some areas, such as the Kenai Peninsula Borough (up 7 percent), Valdez-Cordova Census Area (6 percent), and the Ketchikan Gateway Borough (4 percent). Anchorage, Ko-diak, and the Matanuska-Susitna Borough rents each increased
About the yearlyrental surveyEach March, in cooperation with the Alaska Housing Finance Corporation, the Alaska Department of Labor and Workforce Development surveys thou-sands of landlords across the state to gather residential rental unit information. Data on approximately 15,000 units an-nually provide insight into statewide and local market conditions.
$500$600$700$800$900
$1,000$1,100$1,200$1,300
2000 2001 2002 2003 2004 2005 2006 2007 2008 2009 2010 2011 2012 2013 2014 2015 2016
in 2015 dollars

5ALASKA ECONOMIC TRENDS AUGUST 2016
Rents and Vacancy Rates by Area2 F , 2016
Average Rent Median Rent Number of Units Percentage of Units with Utility Included in Contract RentSurvey Area Contract Adjusted Contract Adjusted Surveyed Vacant Vac Rate Heat Light Hot Water Water Garbage Sewer Snow
Anchorage $1,135 $1,259 $1,075 $1,214 8,215 311 3.8% 76.7% 22.4% 80.1% 48.7% 95.0% 48.7% 88.0%Fairbanks N Star $1,049 $1,199 $1,000 $1,115 2,955 330 11.2% 89.9% 15.8% 79.0% 92.6% 84.6% 92.0% 80.5%Juneau $1,185 $1,333 $1,100 $1,253 1,062 35 3.3% 52.0% 19.7% 47.5% 99.0% 90.7% 98.1% 78.9%Kenai Peninsula $888 $1,059 $850 $992 1,000 88 8.8% 67.1% 23.5% 64.3% 86.8% 72.6% 85.7% 76.5%Ketchikan Gateway $990 $1,122 $984 $1,094 389 36 9.3% 74.8% 33.9% 67.6% 50.6% 48.3% 50.6% 69.4%Kodiak Island $1,288 $1,448 $1,250 $1,419 363 29 8.0% 75.5% 9.1% 67.8% 97.8% 96.7% 97.8% 67.5%Matanuska-Susitna $1,076 $1,224 $900 $1,072 1,134 41 3.6% 47.6% 10.6% 46.2% 90.8% 70.9% 83.1% 70.2%Sitka $979 $1,230 $900 $1,163 276 23 8.3% 39.5% 8.7% 40.6% 13.0% 22.5% 26.1% 66.7%Valdez-Cordova $1,189 $1,365 $1,100 $1,300 237 14 5.9% 65.8% 34.2% 56.1% 78.5% 75.9% 78.5% 77.2%WrangellPetersburg
$700 $888 $700 $865 134 13 9.7% 53.0% 14.2% 44.0% 46.3% 49.3% 43.3% 54.5%
Survey Total $1,100 $1,238 $1,050 $1,175 16,025 931 5.8% 73.8% 19.9% 72.4% 66.9% 86.4% 66.4% 82.1%
Note: Contract rent is the amount paid to the landlord each month, and it may include some u li es. Adjusted rent includes all u li es.Source: Alaska Department of Labor and Workforce Development, Research and Analysis Sec on and the Alaska Housing Finance Corpora on, Annual Resi-den al Rental Market Survey
Higher and Lower Cost Markets3 A , 2016
$2,079 $2,009$1,809 $1,801 $1,783
$1,230 $1,315$1,114
$1,286 $1,226
$1,259$1,448
$1,199 $1,333 $1,365
Anchorage,Municipality
Kodiak IslandBorough
Fairbanks NorthStar Borough
Juneau, Cityand Borough
Valdez-Cordova CA
Higher Cost Rental MarketsSingle-family Apartment Combined
$1,084$1,182
$1,108$993
$874
Lower Cost Rental MarketsSingle-family Apartment Combined
$1,611$1,436
$1,320 $1,288$1,010
$1,224 $1,230$1,122 $1,059
$888
Matanuska-SusitnaBorough
Sitka, Cityand Borough
KetchikanGateway Borough
Kenai PeninsulaBorough
Wrangell, Cityand Borough
Note: Adjusted to include u li esSource: Alaska Department of Labor and Workforce Development, Research and Analysis Sec on and the Alaska Housing Finance Corpora on, Annual Residen al Rental Market Survey
by less than 1 percent. Fairbanks was the only surveyed area whose rent fell, dropping 1 percent to $1,199.
Changes in rents and vacancies af-fect more than 92,000 households in Alaska, or about a third of the state’s total. Unlike home owner-ship, where monthly mortgage payments are established at pur-chase and remain fi xed, rents are fl exible and can move up or down in response to changing market condi ons. Rents can be aff ected by changes in a community’s popu-la on, jobs and wages, and the for-sale housing market. Though renters aren’t insulated from price changes in the same way as homeowners, they can more eas-ily change their housing costs by moving.
High and low cost areasSome communi es are consistently more expensive than others. High-er cost areas include some of the state’s most populated, including Anchorage, Fairbanks, and Juneau. Lower cost areas in the survey are Wrangell, Kenai, Ketchikan, Sitka,

6 ALASKA ECONOMIC TRENDSAUGUST 2016
and the Matanuska-Susitna Borough — although Mat-Su is an unusual case.
Mat-Su, the second most populated borough, falls close to the middle of the spread, even with vacancies well below the statewide average the last fi ve years and the fastest rate of rent increase in the survey over the last 10 years, at 44 percent.
Thirty percent of working Mat-Su residents commute to Anchorage, where wages are considerably higher. Mat-Su also has a much higher rate of homeownership than Alaska overall, at 76 percent versus 63 percent.
In all markets, rents are highest for single-family hous-es, but the diff erence between the average apartment and the average single-family home can vary greatly. In Wrangell-Petersburg, a single-family home costs $136 more, or 16 percent. The spread is much greater in An-chorage, with a single-family home cos ng $849 more, or 69 percent. (See Exhibit 3.)
Aff ordability remains constantThe rental aff ordability index looks at how many aver-age wage earners are required to aff ord the average contract rent — the amount paid to the landlord each month — assuming 24 percent of gross income is avail-able for rent.
Aff ording the average rent statewide requires a single wage earner. By area, Kenai and Wrangell-Petersburg are the most aff ordable, requiring less than a single earner, while Kodiak topped the charts by requiring 1.44 average earners.
Mat-Su, as discussed earlier, may have lower rent than some other places but it isn’t necessarily more aff ord-
Rental Aff ordability Indexes4 P , 2000 20162000 2016
Municipality of Anchorage 0.96 1.00Fairbanks North Star Borough 0.99 1.04Juneau, City and Borough 1.27 1.17Kenai Peninsula Borough 0.93 0.92Ketchikan Gateway Borough 1.11 1.10Kodiak Island Borough 1.43 1.44Matanuska-Susitna Borough 1.25 1.26Sitka, City and Borough 1.20 1.15Valdez-Cordova CA 1.09 1.11Wrangell Borough-Petersburg CA 1.09 0.92
Survey-wide 1.01 1.01
Note: The aff ordability index measures how many monthly paychecks it would take to aff ord the area’s average rent, using the area’s average wages.
Source: Alaska Department of Labor and Workforce Develop-ment, Research and Analysis Sec on
How Vacancy Rates Have Changed5 A , 2000 20162000 2002 2004 2006 2008 2010 2012 2014 2016
Municipality of Anchorage 4.3% 6.2% 5.2% 6.9% 4.7% 1.8% 2.6% 3.2% 3.8%Fairbanks North Star Borough 8.3% 5.8% 9.9% 12.0% 10.6% 5.0% 8.3% 15.6% 11.2%Juneau, City and Borough 5.0% 3.8% 4.2% 4.9% 5.5% 4.1% 3.2% 3.4% 3.3%Kenai Peninsula Borough 12.3% 5.1% 13.0% 9.4% 8.0% 8.6% 5.5% 6.7% 8.8%Ketchikan Gateway Borough 13.4% 17.8% 7.5% 8.4% 7.1% 12.0% 8.2% 10.4% 9.3%Kodiak Island Borough 7.5% 7.4% 8.2% 5.5% 4.0% 1.3% 2.3% 5.7% 8.0%Matanuska-Susitna Borough 6.2% 3.3% 5.0% 9.3% 5.6% 5.3% 3.5% 5.3% 3.6%Sitka, City and Borough 8.1% 2.9% 4.4% 6.2% 11.9% 7.8% 7.7% 7.2% 8.3%Valdez-Cordova CA 4.8% 8.3% 26.2% 8.6% 7.6% 6.4% 3.1% 3.5% 5.9%Wrangell Borough-Petersburg CA 17.5% 22.1% 8.2% 12.7% 8.8% 4.4% 4.4% 5.6% 9.7%
Survey-wide 6.6% 6.8% 7.2% 8.2% 6.7% 3.9% 4.4% 6.2% 5.8%
Source: Alaska Department of Labor and Workforce Development, Research and Analysis Sec on and the Alaska Housing Finance Corpora on, Annual Residen al Rental Survey
able for borough residents because average wages are also lowest. A bit more than a quarter of an addi onal paycheck is required to aff ord the average rent in Mat-Su.
When looking back to 2000, we can see aff ordability hasn’t changed much in most places. (See Exhibit 4.)Wages and rents have been moving mostly in tandem.
Vacancies go down slightlyThe survey-wide vacancy rate of 5.8 percent was down nine-tenths of a percentage point from 2015, but equal to the 10-year average. (See Exhibit 5.)
7ALASKA ECONOMIC TRENDS AUGUST 2016
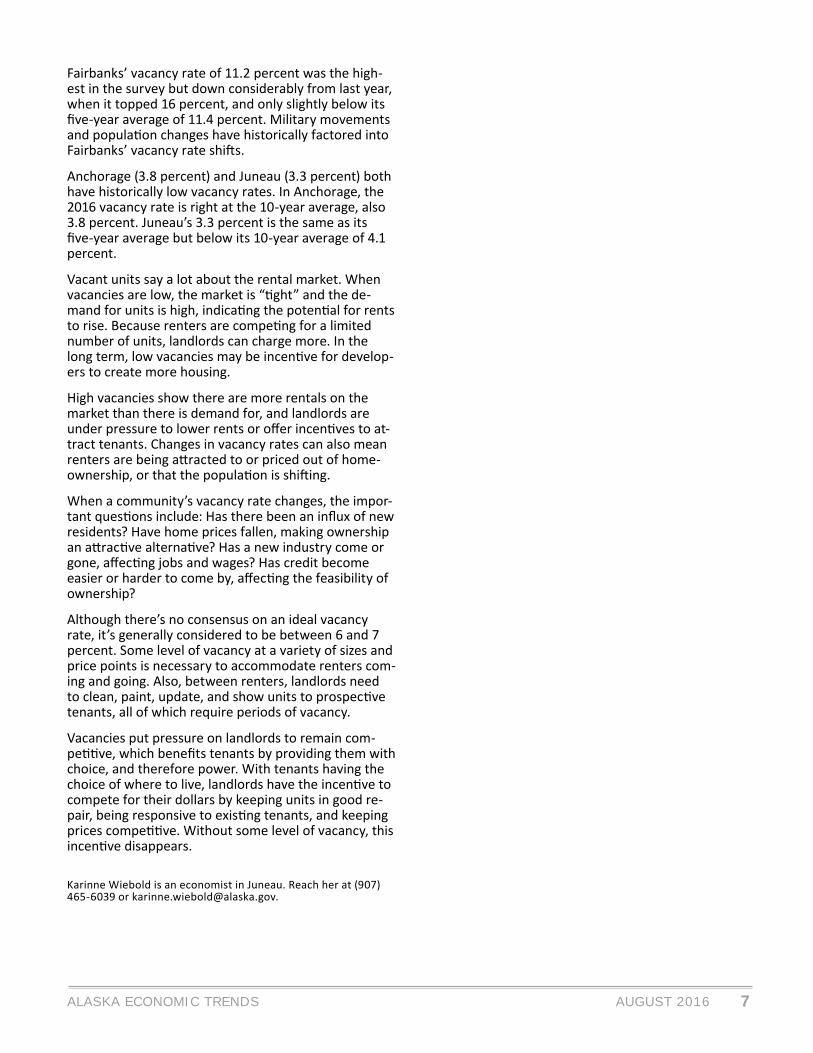
Fairbanks’ vacancy rate of 11.2 percent was the high-est in the survey but down considerably from last year, when it topped 16 percent, and only slightly below its fi ve-year average of 11.4 percent. Military movements and popula on changes have historically factored into Fairbanks’ vacancy rate shi s.
Anchorage (3.8 percent) and Juneau (3.3 percent) both have historically low vacancy rates. In Anchorage, the 2016 vacancy rate is right at the 10-year average, also 3.8 percent. Juneau’s 3.3 percent is the same as its fi ve-year average but below its 10-year average of 4.1 percent.
Vacant units say a lot about the rental market. When vacancies are low, the market is “ ght” and the de-mand for units is high, indica ng the poten al for rents to rise. Because renters are compe ng for a limited number of units, landlords can charge more. In the long term, low vacancies may be incen ve for develop-ers to create more housing.
High vacancies show there are more rentals on the market than there is demand for, and landlords are under pressure to lower rents or off er incen ves to at-tract tenants. Changes in vacancy rates can also mean renters are being a racted to or priced out of home-ownership, or that the popula on is shi ing.
When a community’s vacancy rate changes, the impor-tant ques ons include: Has there been an infl ux of new residents? Have home prices fallen, making ownership an a rac ve alterna ve? Has a new industry come or gone, aff ec ng jobs and wages? Has credit become easier or harder to come by, aff ec ng the feasibility of ownership?
Although there’s no consensus on an ideal vacancy rate, it’s generally considered to be between 6 and 7 percent. Some level of vacancy at a variety of sizes and price points is necessary to accommodate renters com-ing and going. Also, between renters, landlords need to clean, paint, update, and show units to prospec ve tenants, all of which require periods of vacancy.
Vacancies put pressure on landlords to remain com-pe ve, which benefi ts tenants by providing them with choice, and therefore power. With tenants having the choice of where to live, landlords have the incen ve to compete for their dollars by keeping units in good re-pair, being responsive to exis ng tenants, and keeping prices compe ve. Without some level of vacancy, this incen ve disappears.
Karinne Wiebold is an economist in Juneau. Reach her at (907) 465-6039 or [email protected].

8 ALASKA ECONOMIC TRENDSAUGUST 2016
By NEAL FRIEDBy NEAL FRIEDy
How we spend our moneyData on Alaskans’ personal consump on available for the fi rst me
We Mainly Buy Services1 A , 2014
Source: U.S. Bureau of Economic Analysis
DurableGoods
8.7%
Nondurable goods21.5%
Services69.8%
Personal consump on spending by state was re-leased for the fi rst me last year, and it showed Alaskans consumed $34 billion in goods and ser-
vices in 2014. These sta s cs are important na onally because personal consump on expenditures represent about two-thirds of U.S. economic ac vity. It’s a closely watched economic indicator with the power to move the stock market and aff ect economic policy.
Personal consump on is o en considered the na- on’s broadest measure of how consumers feel about
the economy — the prevailing wisdom is that if we’re spending more, things must be good, and vice versa. Although what we can conclude from the state data alone is limited (see the sidebar for more informa on), it can help paint a more comprehensive picture of the state’s economy when combined with other economic indicators, such as employment and income.
Where we spent this $34 billionThis $34 billion went mainly toward services, at 70 percent. (See Exhibit 1.) Services include not just what we spend in obvious places such as the barbershop or mechanic’s garage, but what’s spent on our behalf. The biggest piece is in health care, which includes what em-ployers, Medicare, and Medicaid contribute.
The other 30 percent is for “stuff ,” which is broken down into durables and nondurables. Durable goods
include items that last at least three years, such as cars, furniture, and many appliances. Nondurables include not just food but clothing, gasoline, and medica on — things that typically come to mind when we think of consumables.
Alaska consumers don’t spend much diff erently from

9ALASKA ECONOMIC TRENDS AUGUST 2016
How Per Capita Spending Compares2 A U.S., 2014
AlaskaPercent
Share U.S.Percent
SharePersonal consumption expenditures $46,229 100% $37,196 100%
GOODS $14,008 30% $12,365 33%Durable goods $4,031 9% $4,015 11% Motor vehicles and parts $1,113 2% $1,381 4% Furnishings and durable household equipment $1,000 2% $903 2% Recreational goods and vehicles $1,464 3% $1,112 3% Other durable goods $455 1% $619 2%Nondurable goods $9,977 22% $8,350 22% Food and beverages purchashed for off-premises consumption $3,924 8% $2,780 7% Clothing and footwear $964 2% $1,157 3% Gasoline and other energy goods $1,451 3% $1,258 3% Other nondurable goods $3,638 8% $3,155 8%
SERVICES $32,221 70% $24,831 67%Household consumption expenditures(for services) $30,272 65% $23,820 64%Housing and utilities $7,591 16% $6,720 18%Health care $9,303 20% $6,128 16%Transportation services $1,100 2% $1,112 3%Recreation services $1,416 3% $1,429 4%Food services and accommodations $3,274 7% $2,355 6%Financial services and insurance $3,363 7% $2,768 7%Other services $4,226 9% $3,309 9%
Source: U.S. Bureau of Economic Analysis
the rest of the na on, which may seem surprising, as we’re o en outliers in other economic indica-tors. (See Exhibit 2.) One excep on is health care, where we spend 20 percent of our consumer dollars versus 16 percent na onwide.
Alaska’s health care costs are higher than anywhere else in the country, at an average of $9,303 per person in 2014. In contrast, the na onal average was $6,128. Alas-kans also spent more on food, both at the grocer and at restaurants, as a share of total consump on as well as per capita.
In most of the larger categories, such as housing and transporta- on, Alaskans’ consump on pat-
terns mimicked the rest of the country. A small surprise was that “outdoorsy” Alaskans actually spent slightly less for recrea onal services and the same percent-age on recrea onal goods and vehicles.
Per capita, Alaska spending is highOverall, our per capita consump- on expenditure was high, rank-
ing us fourth among states at $46,229. (See Exhibit 3.)
Big spending is partly due to how expensive things are in Alaska, but it’s also because we tend to have more to spend. Alaska ranked
A new statisticfor AlaskaThe U.S. Bureau of Economic Analysis, which releases the monthly national personal consumption expenditure data, released the fi rst statistics for individual states in 2015. Unlike the national data, BEA calculated the state fi gures on an annual basis and released them two years after the fact.
This fi rst release was for 1997 through 2014, making it more of a “rearview mirror” economic indicator than a hint at future trends. The categories are also broad and lack detail. Finally, most of the data come not from consumers but other sources such as the more business-oriented economic census conducted by the U.S. Census Bureau.
Despite these shortcomings, Alaska’s personal consumption expenditure data can be useful for looking at the big economic picture when combined with other state indicators. It can also help explain some of the differences and similarities between Alaskan consumer behavior and the rest of the nation and, because the data go back to 1997, provide historical economic insight.
Alaska Ranks 4th Na onwide3 P CE , 2014
1 Massachusetts $48,020
2 North Dakota $47,739
3 New Hampshire $46,633
4 Alaska $46,229 5 Connecticut $45,844
6 New Jersey $45,496
7 Vermont $44,768
8 New York $43,727
9 Delaware $41,701
10 Maryland $41,460
United States $37,196
Source: U.S. Bureau of Economic Analysis

10 ALASKA ECONOMIC TRENDSAUGUST 2016
Consump on Trends for Alaska, U.S.5 A , 2000 2014
Consump on Tracks With Income4 A , , 2000 2014
Source: U.S. Bureau of Economic Analysis
-2.0%
0%
2.0%
4.0%
6.0%
8.0%
10.0%
2000 2001 2002 2003 2004 2005 2006 2007 2008 2009 2010 2011 2012 2013 2014
Personal consump onexpenditures Personal income
-2.0%
0%
2.0%
4.0%
6.0%
8.0%
10.0%
2000 2001 2002 2003 2004 2005 2006 2007 2008 2009 2010 2011 2012 2013 2014
U.S.
Alaska
Source: U.S. Bureau of Economic Analysis
sixth among states for personal in-come and fi rst for gross domes c product per capita in 2015.
Gross domes c product can be a good gauge of economic well-being because it measures, to some degree, the produc vity of a workforce. However, only part of the GDP accrues to Alaska residents. A large slice goes to the federal government, mul na onal companies, and individuals and businesses outside the state. Per-sonal income, however, is closely related to personal consump on. It accrues only to Alaskans, and as Exhibit 4 shows, how much we re-ceive in income aff ects how much we buy.
Alaska’s spending grew fasterSince 2000, Alaska’s personal con-sump on expenditures grew faster than the na on’s every year except 2014, at an annual average of 5 percent versus 4 percent. (See Ex-hibit 5.) During this 15-year period, the na on fell into two recessions, including the “Great Recession” of the late 2000s when Alaska’s downturn was compara vely mild. Rates fell for both Alaska and the U.S. in 2009, but Alaska’s dipped 0.1 percent while the na on’s expenditures dropped by 1.7 per-cent.
Neal Fried is an economist in Anchorage. Reach him at (907) 269-4861 or [email protected].

11ALASKA ECONOMIC TRENDS AUGUST 2016
C
Whittier
Cordova
Chenega
Valdez
Tatitlek
Chitina McCarthy
Chisana
Nabesna
PaxsonSlana
Chistochina
Mentasta Lake
Kenny Lake
Tonsina
GakonaGulkana
Glennallen
Tazlina Copper Center
Willow
Creek
Silver SpringsMendeltna
Tolsona
Nelchina
Copper River SubareaValdez-Valdez-CordovaCordova
Vast census area covers towns with broad range of iden es
By ALYSSA RODRIGUES
Besides their founda on in natural resources, the com-muni es that make up the
vast Valdez-Cordova Census Area have li le in common. The land, which is the size of Kentucky, ex-tends from Mentasta Lake in the north to Chenega in the south, Whi er in the west, and the Canadian border in the east. It’s home to more than 20 unincorpo-rated communi es and just three ci es: Valdez, Cordova, and Whit- er.
The popula on throughout the census area is older — a median 39 years versus 35 for Alaska in 2015 — and the popula on and job numbers have been fairly sta-ble since the 1990s. (See exhibits 1 through 3.) But that’s where the major similari es end. From industries and wages to racial makeup, the region varies dras -cally from one place to another.
The Sheridan Glacier is between the Copper River Delta and Cordova. Photo by Flickr user Russ Wigh
12 ALASKA ECONOMIC TRENDSAUGUST 2016
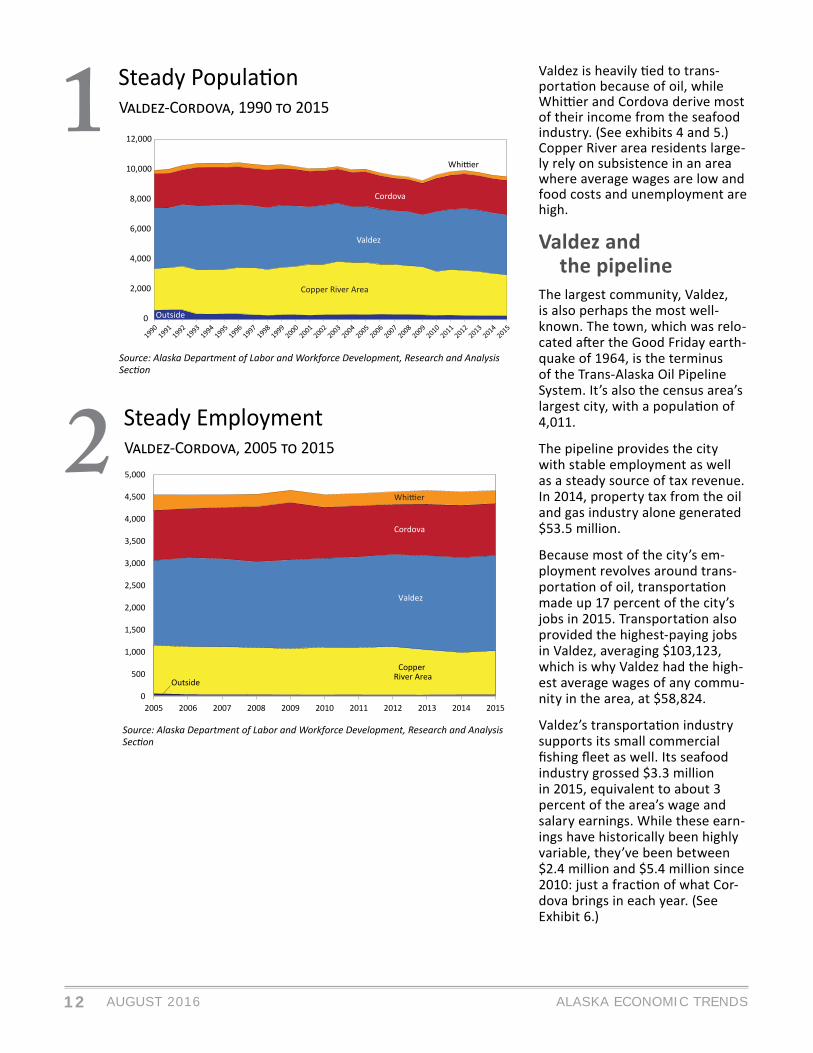
Steady Employment2 V -C , 2005 2015
0
500
1,000
1,500
2,000
2,500
3,000
3,500
4,000
4,500
5,000
2005 2006 2007 2008 2009 2010 2011 2012 2013 2014 2015
Co dova
CoppRiv
Vald z
Source: Alaska Department of Labor and Workforce Development, Research and Analysis Sec on
Valdez is heavily ed to trans-porta on because of oil, while Whi er and Cordova derive most of their income from the seafood industry. (See exhibits 4 and 5.) Copper River area residents large-ly rely on subsistence in an area where average wages are low and food costs and unemployment are high.
Valdez and the pipelineThe largest community, Valdez, is also perhaps the most well-known. The town, which was relo-cated a er the Good Friday earth-quake of 1964, is the terminus of the Trans-Alaska Oil Pipeline System. It’s also the census area’s largest city, with a popula on of 4,011.
The pipeline provides the city with stable employment as well as a steady source of tax revenue. In 2014, property tax from the oil and gas industry alone generated $53.5 million.
Because most of the city’s em-ployment revolves around trans-porta on of oil, transporta on made up 17 percent of the city’s jobs in 2015. Transporta on also provided the highest-paying jobs in Valdez, averaging $103,123, which is why Valdez had the high-est average wages of any commu-nity in the area, at $58,824.
Valdez’s transporta on industry supports its small commercial fi shing fl eet as well. Its seafood industry grossed $3.3 million in 2015, equivalent to about 3 percent of the area’s wage and salary earnings. While these earn-ings have historically been highly variable, they’ve been between $2.4 million and $5.4 million since 2010: just a frac on of what Cor-dova brings in each year. (See Exhibit 6.)
Source: Alaska Department of Labor and Workforce Development, Research and Analysis Sec on
Steady Popula on1 V -C , 1990 2015
0
2,000
4,000
6,000
8,000
10,000
12,000
Outsid
13ALASKA ECONOMIC TRENDS AUGUST 2016
Cordova brings in most seafood earningsCordova, with a popula on of 2,321, was once a rail-road town connec ng the Kenneco Copper Mine to dewater. Today it’s a fi shing town that consis-tently brings in 90 percent of the census area’s gross commercial seafood earnings, mainly from salmon, amoun ng to more than $38.3 million last year.
While most commercial fi shermen are self-employed and not included in the job numbers here, the 373 commercial permits fi shed in Cordova in 2015 provide some context. If each permit were counted as a job, those would make up about 18 percent of all the city’s jobs in July, which is peak harves ng month.
The city’s reliance on fi shing is also refl ected in its high percentage of jobs in seafood processing. Pro-cessing jobs tend to pay less, though, which is largely why Cordova’s average wage of $46,382 last year was well below the statewide average of $54,191.
Whi er has fi shing and tourismMany seafood processing workers travel to Whi er during the summer, when the town has more wage and salary jobs than it has residents. The town is also
buoyed by summer tourism, and hosts about 700,000 visitors per year.
This highly seasonal economy means at the summer peak, the town’s employment can be twice the popu-la on, at 500 jobs and 253 residents — nearly all of whom live in a single building built by and originally for the military.
The military established itself in Whi er during World War II because the area provided a deep, far north, year-round ice-free port. The federal railroad to Portage was completed in 1943 and became the primary debarka on point for cargo, troops, and de-pendents of the Alaska Command, which remained ac ve un l 1960. At that me, the popula on was 1,200.
The town has so li le buildable land and such a small popula on that a single building provides most of its needed housing. The 14-story Hodge Building, now called Begich Towers, was completed in 1957 and contains 150 apartments of varying sizes. At one me, it was one of the largest buildings in the state.
The town’s second-largest sector, leisure and hos-pitality, is ed to the Whi er Tunnel, owned by the State of Alaska. The combined one-way road and railway tunnel had its second-highest traffi c year in history in 2015, with more than 240,000 vehicles
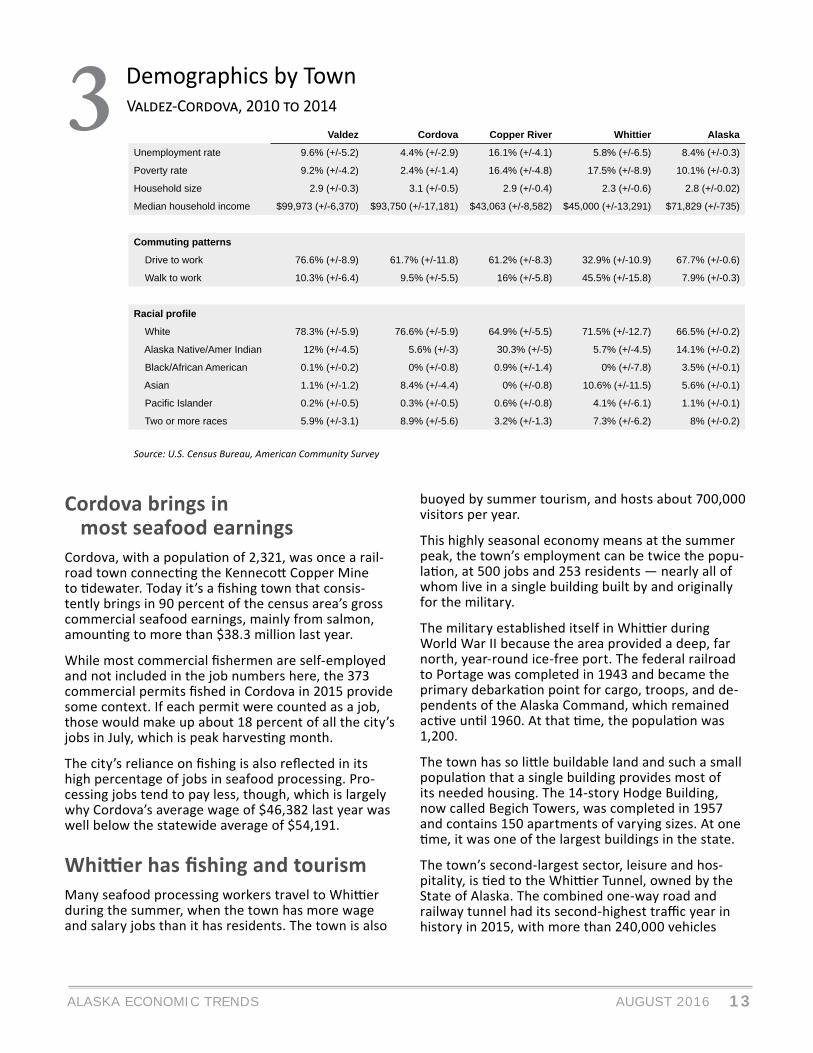
Demographics by Town3 V -C , 2010 2014
Valdez Cordova Copper River Whittier Alaska
Unemployment rate 9.6% (+/-5.2) 4.4% (+/-2.9) 16.1% (+/-4.1) 5.8% (+/-6.5) 8.4% (+/-0.3)
Poverty rate 9.2% (+/-4.2) 2.4% (+/-1.4) 16.4% (+/-4.8) 17.5% (+/-8.9) 10.1% (+/-0.3)
Household size 2.9 (+/-0.3) 3.1 (+/-0.5) 2.9 (+/-0.4) 2.3 (+/-0.6) 2.8 (+/-0.02)
Median household income $99,973 (+/-6,370) $93,750 (+/-17,181) $43,063 (+/-8,582) $45,000 (+/-13,291) $71,829 (+/-735)
Commuting patterns
Drive to work 76.6% (+/-8.9) 61.7% (+/-11.8) 61.2% (+/-8.3) 32.9% (+/-10.9) 67.7% (+/-0.6)
Walk to work 10.3% (+/-6.4) 9.5% (+/-5.5) 16% (+/-5.8) 45.5% (+/-15.8) 7.9% (+/-0.3)
Racial profi le
White 78.3% (+/-5.9) 76.6% (+/-5.9) 64.9% (+/-5.5) 71.5% (+/-12.7) 66.5% (+/-0.2)
Alaska Native/Amer Indian 12% (+/-4.5) 5.6% (+/-3) 30.3% (+/-5) 5.7% (+/-4.5) 14.1% (+/-0.2)
Black/African American 0.1% (+/-0.2) 0% (+/-0.8) 0.9% (+/-1.4) 0% (+/-7.8) 3.5% (+/-0.1)
Asian 1.1% (+/-1.2) 8.4% (+/-4.4) 0% (+/-0.8) 10.6% (+/-11.5) 5.6% (+/-0.1)
Pacifi c Islander 0.2% (+/-0.5) 0.3% (+/-0.5) 0.6% (+/-0.8) 4.1% (+/-6.1) 1.1% (+/-0.1)
Two or more races 5.9% (+/-3.1) 8.9% (+/-5.6) 3.2% (+/-1.3) 7.3% (+/-6.2) 8% (+/-0.2)
Source: U.S. Census Bureau, American Community Survey
14 ALASKA ECONOMIC TRENDSAUGUST 2016
passing through, mainly between May and August. Visitor traffi c includes buses full of cruise ship passengers as well as independent tourists and travelers heading to or from the ferries.
Whi er will host 29 cruise ships in summer 2016. The largest will be the Star Princess, which can hold nearly 15 mes the en re popula on of Whi er, at 3,700 passengers and crew.
Whi er also has strong es to fi shing, including commercial and sport fi shing and marine sup-port services. From a commercial standpoint, Whi er brings in less than 1 percent of the census area’s annual commercial harvest and gross earnings, but seafood processing is the town’s largest single source of jobs. As a result, Whi er’s average annual earn-ings were rela vely low in 2015, at $34,490.
The future of the city’s seafood processing industry is uncertain, however, because its main em-ployer, Great Pacifi c Seafoods, fi led for Chapter 7 bankruptcy and closed its local processing plant in May. The closure means not just job loss but also the loss of rev-enue from the plant’s use of city water and sewer.
Sport fi shing also boosts local tourism. Whi er has a harbor and boat launch that can accom-modate 350 boats, and it’s at full capacity with a wai ng list of fi ve to seven years. During the sum-mer peak, an average of 150 boats launch in a single weekend day, or one boat every 10 minutes.
Subsistence is vital in Copper River areaThe Copper River area, which contains 20 of the area’s 22 unincorporated communi es and 2,735 resi-dents, diff ers considerably from the three main ci es. The three are propor onally more white than the statewide average, while the Copper River area has
more than double the statewide percentage of Alas-ka Na ves. Thirty percent in the Copper River area iden fy as Na ve alone versus 14 percent for Alaska as a whole, and many who say they are more than one race are also Alaska Na ve. (See Exhibit 3.) The Copper River area also has the lowest percentage of those who self-iden fy as white, at 65 percent.
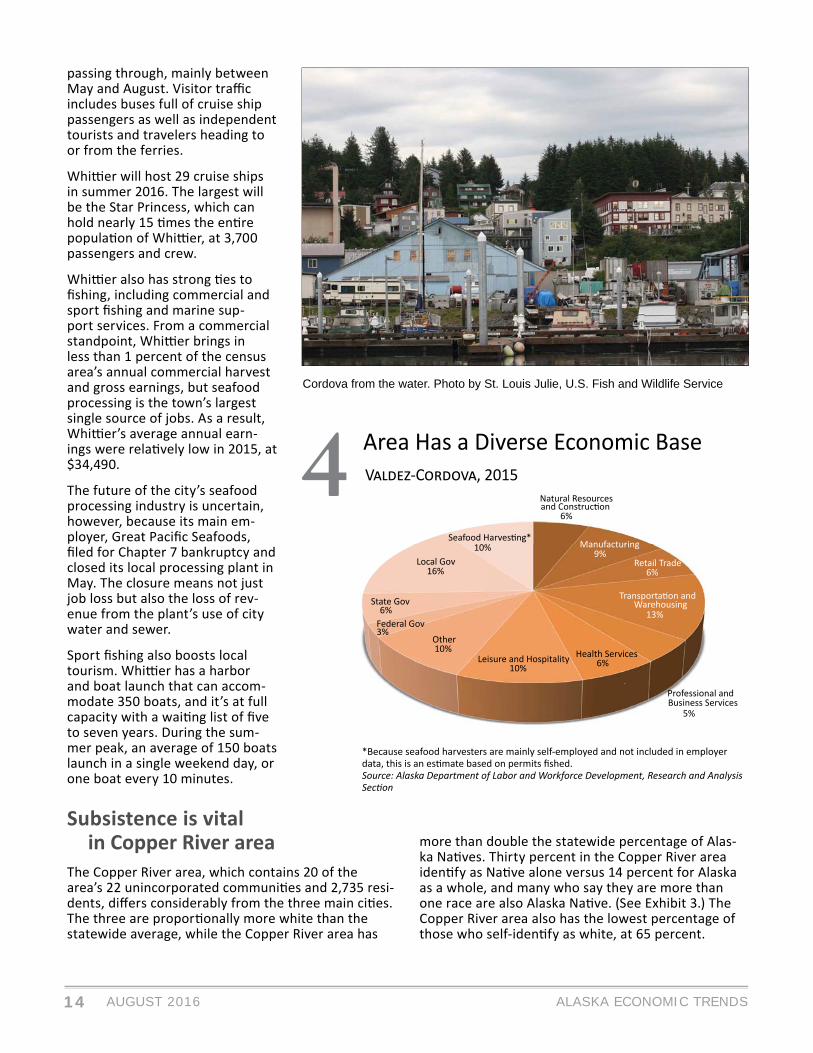
*Because seafood harvesters are mainly self-employed and not included in employer data, this is an es mate based on permits fi shed.Source: Alaska Department of Labor and Workforce Development, Research and Analysis Sec on
4 V -C , 2015Natural Resources
6%
Manufacturing9%
Retail Trade6%
Warehousing13%
Professional and Business Services
5%
Health Services6%Leisure and Hospitality
10%
Other10%
Federal Gov3%
State Gov6%
Local Gov16%
10%
Area Has a Diverse Economic Base
Cordova from the water. Photo by St. Louis Julie, U.S. Fish and Wildlife Service
15ALASKA ECONOMIC TRENDS AUGUST 2016
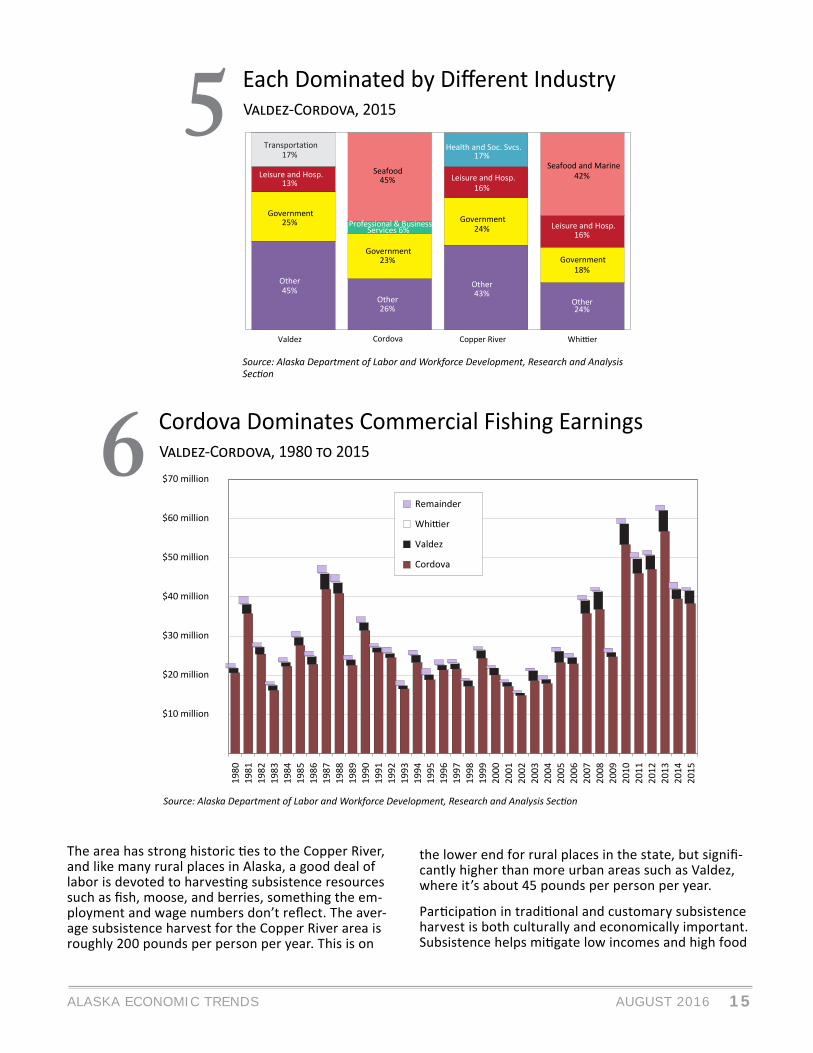
Source: Alaska Department of Labor and Workforce Development, Research and Analysis Sec on
Cordova Dominates Commercial Fishing Earnings6 V -C , 1980 2015
$10 million
$20 million
$30 million
$40 million
$50 million
$60 million
$70 million
2015
2014
2013
2012
2011
2010
2009
2008
2007
2006
2005
2004
2003
2002
2001
2000
1999
1998
1997
1996
1995
1994
1993
1992
1991
1990
1989
1988
1987
1986
1985
1984
1983
1982
1981
1980
Remainder
Whi er
Valdez
Cordova
Source: Alaska Department of Labor and Workforce Development, Research and Analysis Sec on
Each Dominated by Diff erent Industry5 V -C , 2015
Valdez Cordova Copper River Whi er
Other45%
Other26%
Other43%
Government25%
Government23%
Government24%
13%
Professional & BusinessServices 6%
16%
Transporta on17%
Seafood45%
Health and Soc. Svcs.17%
Seafood and Marine42%
Leisure and Hosp.16%
Government18%
Other24%
Leisure and Hosp.Leisure and Hosp.
The area has strong historic es to the Copper River, and like many rural places in Alaska, a good deal of labor is devoted to harves ng subsistence resources such as fi sh, moose, and berries, something the em-ployment and wage numbers don’t refl ect. The aver-age subsistence harvest for the Copper River area is roughly 200 pounds per person per year. This is on
the lower end for rural places in the state, but signifi -cantly higher than more urban areas such as Valdez, where it’s about 45 pounds per person per year.
Par cipa on in tradi onal and customary subsistence harvest is both culturally and economically important. Subsistence helps mi gate low incomes and high food

16 ALASKA ECONOMIC TRENDSAUGUST 2016
Source: Alaska Department of Labor and Workforce Develop-ment, Research and Analysis Sec on
Many Workers Live Elsewhere7 V -C , 2014
Local52%
Nonlocal Alaskan11%
Nonresident37%
costs, which were 26 percent higher than Anchor-age in 2008, the most recent year available.
The core industries in the Copper River area are health care, social services, and leisure and hospital-ity. Health care and social services include health clinics and Na ve associa ons that focus on com-munity care. The leisure and hospitality businesses and jobs in the area exist largely to serve travelers on the Glenn and Richardson highways, which both run through the area. These combined industries made up a third of the area’s wage and salary jobs in 2015.
At 9.4 percent, the Copper River area’s unemploy-ment rate is high, and both of the major private in-dustries have lower-than-average wages. Health and social services jobs paid an average of $37,582 in 2015 and leisure and hospitality jobs paid $21,122.
The highest-paying jobs in the area were in con-struc on, which paid more than $100,000 on aver-age in 2015 but made up just 6 percent of jobs. The area has some higher-paying jobs with the state and federal government as well, which paid an average of $57,464 and $66,989 respec vely. Government jobs made up 14 percent of the area’s employment.
Nearly half of workers live outside census areaNearly half of the people who work in the Valdez-Cordova Census Area, 48 percent, don’t live there. (See Exhibit 7.) Nonresidents make up the largest slice of those who live elsewhere, at 37 percent in 2014. Many of these workers travel in for seafood processing, which had the highest rate of nonresi-dent hire among industries in 2014, at 84.8 percent.
Of the commuters who are Alaskans, the biggest share come from Anchorage, followed by the Mata-nuska-Susitna Borough and the Kenai Peninsula.
Alyssa Rodrigues is an economist in Anchorage. Reach her at (907) 269-4863 or [email protected].
The Whittier Tunnel, above, a combined one-way road and railway tunnel. Photo by Flickr user Arthur Chapman, and Audrey Bendus

17ALASKA ECONOMIC TRENDS AUGUST 2016
All data sources are U.S. Bureau of Labor Sta s cs and Alaska Department of Labor and Workforce Development, Research and Analysis Sec on, unless otherwise noted.1June 20162June 2015 to June 20163Annual average percent change; 2016 data are for January to June compared to the same months in 2015
The Month in Numbers
Job Growth in Alaska and the Na on3
How Alaska Ranks
-4%-3%-2%-1%
01%2%3%
Alaska
U.S.
2005 2006 2007 2008 2009 2010 2011 2012 2013 2014 2015
Prelim. RevisedSEASONALLY ADJUSTED 6/16 5/16 6/15United States 4.9 4.7 5.3Alaska Statewide 6.7 6.7 6.5
NOT SEASONALLY ADJUSTEDUnited States 5.1 4.5 5.5Alaska Statewide 6.8 6.6 6.6
Anchorage/Mat-Su Region 6.2 5.9 5.9 Municipality of Anchorage 5.7 5.3 5.3 Matanuska-Susitna Borough 8.3 8.0 8.0
Gulf Coast Region 7.1 7.5 7.0 Kenai Peninsula Borough 7.7 8.1 7.3 Kodiak Island Borough 5.3 4.7 5.5 Valdez-Cordova Census Area 6.5 7.8 6.9
Interior Region 6.4 6.3 6.5 Denali Borough 3.8 5.4 4.1 Fairbanks North Star Borough 5.7 5.6 5.7 Southeast Fairbanks CA 9.4 10.1 10.1 Yukon-Koyukuk Census Area 17.1 16.4 17.4
Northern Region 12.8 11.9 11.6 Nome Census Area 15.1 13.4 13.2 North Slope Borough 7.2 6.7 6.5 Northwest Arc c Borough 17.5 17.5 16.6
Southeast Region 5.5 5.7 6.0 Haines Borough 8.4 9.6 7.8 Hoonah-Angoon Census Area 8.7 10.5 11.8 Juneau, City and Borough 4.3 4.2 4.7 Ketchikan Gateway Borough 5.5 6.1 6.1 Petersburg Borough 8.2 8.6 8.3 Prince of Wales-Hyder CA 10.6 11.4 10.9 Sitka, City and Borough 4.1 4.2 4.5 Skagway, Municipality 3.6 4.7 4.8 Wrangell, City and Borough 6.7 6.4 7.6 Yakutat, City and Borough 6.3 5.7 6.8
Southwest Region 11.3 12.9 11.7 Aleu ans East Borough 2.8 6.0 3.3 Aleu ans West Census Area 3.6 5.4 4.6 Bethel Census Area 14.8 14.9 14.8 Bristol Bay Borough 6.2 6.5 6.2 Dillingham Census Area 8.8 10.2 8.7 Kusilvak Census Area 23.5 22.4 25.0 Lake and Peninsula Borough 12.1 12.8 11.5
Unemployment Rates
50th1stS. Dakota
2.7%
Unemployment Rate1
6.7%
6th
Average Hourly Earnings,Private Sector
$28.00
45th 50thN. Dakota-3.1%
1stUtah3.5%
Job Growth2
0.3%
17th 50thHawaii32.3
Average Weekly Hours,Private Sector2
34.5
1stTexas
35.8
50thArkansas$19.98
1stMassachusetts
$30.75

18 ALASKA ECONOMIC TRENDSAUGUST 2016
Safety Minute
Older buildings may lack ground-fault circuit interruptorsUsing electrical outlets in a damp or wet location has caused many injuries and deaths, which was the primary reason Professor Charles Dalziel of the University of California Berkeley studied the effects electricity on humans. One result from his study was the invention of the ground-fault circuit interrupter.
A GFCI is an electrical device that measures the amount of current that enters the device and com-pares it to current that returns to the device. If the resulting measurement is not equal, the GFCI dis-connects the power. This monitoring system became a safe and effective way to use electrical equipment in a variety of environmental conditions.
Though expensive at the time, this safety device was recognized by the National Electrical Code in 1971 and became a required protection method. With the adoption of building codes and safety standards,
the increase in demand for these devices prompted manufacturers to produce more, which decreased their cost and made them economical.
Many homes and businesses built before these codes were enacted still use outlets without ground-fault circuit interrupters, posing serious risk to any-one using the building’s electrical system.
Whether you’re an owner or a tenant of a home or workspace, installing GFCIs is an inexpensive way to protect your family, workers, or property from fi res and electrocution hazards. GFCI breakers can be installed at your electrical distribution panel, or GFCI receptacles can be installed in wet or damp loca-tions.
Safety Minute is wri en by the Labor Standards and Safety Division of the Alaska Department of Labor and Workforce Development.
19ALASKA ECONOMIC TRENDS AUGUST 2016
Employer Resources
Alaska Resident Hire requirements apply to 23 occupationsThe most recent employment preference, or “Alaska Resident Hire” determination, became effective in June 2015 when Alaska was declared a Zone of Un-deremployment by the Commissioner of the Depart-ment of Labor and Workforce Development, Heidi Drygas. Alaska’s employment preference applies to certain construction projects funded by the state or any agency of the state and requires that qualifi ed Alaska resident job seekers are given a minimum of 90 percent employment preference over nonresi-dents in 23 job classifi cations:
Boilermakers Bricklayers CarpentersCement Masons Culinary Workers ElectriciansEngineers and Architects
Equipment Operators
Foremen and Supervisors
Insulation Workers Ironworkers LaborersMechanics Millwrights PaintersPile-driving Occupations
Plumbers and Pipefi tters
RoofersTruck Drivers
Sheet Metal Workers SurveyorsTug Boat Workers Welders
Alaska Resident Hire is crucial to the economic well-being of Alaska. It helps stabilize the economy by putting Alaskans to work, keeping earned income in Alaska, and reducing the unemployment rate. The construction industry in Alaska accounts for a substantial percentage of all available employment. Historically, the rate of unemployment in the
construction industry in Alaska has been higher than the combined federal unemployment rate, resulting in a higher percentage of unemployment insurance benefi ts paid to Alaska construction workers than to their counterparts nationwide.
Alaska contractors recognize that investing in Alaska’s workforce is not only in their own best interest, but in the best interest of Alaska. Alaska Resident Hire ensures public works contractors from other states gain fi rst-hand knowledge of Alaska’s commitment to protect the welfare of its citizens.
Staff from the department’s Wage and Hour Administration and the Division of Employment and Training Services work together to ensure contractors understand Alaska Resident Hire laws and help them every step of the way, including facilitating recruitment and alerting statewide Alaska Job Center staff to fi nd and refer qualifi ed Alaskans to the positions. For more information about Alaska Resident Hire, contractors can call offi ces in Anchorage (907) 269-4900, Fairbanks (907) 451-2886, or Juneau (907) 465-4842 or visit http://labor.alaska.gov/lss/home.htm.
Employer Resources is wri en by the Employment and Training Services Division of the Alaska Department of Labor and Workforce Develop-ment.