AUGMENTATION AND MONITORING OF THE SAN JUAN … · AUGMENTATION AND MONITORING OF THE SAN JUAN...
104
AUGMENTATION AND MONITORING OF THE SAN JUAN RIVER RAZORBACK SUCKER POPULATION: 2005 Interim Progress Report (Final) Submitted By: Dale W. Ryden Fishery Biologist 1 June 2006 U. S. Fish and Wildlife Service Colorado River Fishery Project 764 Horizon Drive, Building B Grand Junction, Colorado 81506-3946
-
Upload
nguyendang -
Category
Documents
-
view
217 -
download
1
Transcript of AUGMENTATION AND MONITORING OF THE SAN JUAN … · AUGMENTATION AND MONITORING OF THE SAN JUAN...

AUGMENTATION AND MONITORING OF THE SAN
JUAN RIVER RAZORBACK SUCKER POPULATION:
2005 Interim Progress Report
(Final)
Submitted By:
Dale W. Ryden Fishery Biologist
1 June 2006
U. S. Fish and Wildlife Service Colorado River Fishery Project 764 Horizon Drive, Building B
Grand Junction, Colorado 81506-3946

i
EXECUTIVE SUMMARY
AUGMENTATION In 2005, a total of 1,996 razorback sucker were stocked into the San Juan River. All of these were individually-marked with PIT tags (134 kHz), before being stocked immediately downstream of the Hogback Diversion. The 1,996 fish stocked in 2005 were the second largest group of razorback sucker > 300 mm TL to be stocked into the San Juan River since augmentation efforts for this species began in 1994. Unfortunately, this total was still well short of the 11,400 fish called for annually in the 2003 razorback sucker augmentation plan addendum. Since the San Juan River Recovery Implementation Program (SJRIP) began using grow-out ponds on Navajo Agricultural Products Industry (NAPI) lands in 1998 (i.e., eight years total), there has never been a year when more than 20.2 surface acres (n = 7 ponds) out of the potential 25.7 surface acres of available (n = 9 ponds) yielded harvestable-sized fish (i.e., > 300 mm TL) for the razorback sucker augmentation effort. In fact, in six of those eight years < 15.0 surface acres (< 5 ponds) yielded harvestable-sized fish. The reasons for the continued shortfalls in meeting target stocking numbers and in getting all 25.7 surface acres of NAPI grow-out ponds into production at once are myriad. However, even with all of the problems that have occurred at the NAPI grow-out ponds over the last eight years, these ponds, in four of their eight years of existence, have produced fish at an equivalent or higher rate than more mature and more intensively-managed grow-out ponds being used in Upper Colorado River Basin (UCRB) razorback sucker augmentation efforts (i.e., ponds in and near Grand Junction, CO). A comparison between UCRB and SJRIP grow-out ponds shows that the three main advantages the UCRB has over the SJRIP are: 1) being able to stock grow-out ponds with a larger size-class of fish (200-250 mm TL, compared to larval fish) which leads to greater survival in the ponds; 2) having considerably more surface acres of ponds available (61.8 surface acres for the UCRB versus 25.7 surface acres for the SJRIP in 2005) for stocking and harvest; and, 3) having a fully-staffed, intensive-culture fish hatchery dedicated specifically to their augmentation effort, allowing the UCRB to make up for production shortfalls from their grow-out ponds. Yet, even given all of the drawbacks and setbacks inherent in the SJRIP's razorback sucker augmentation program, the SJRIP has been successful in stocking this species into the San Juan River in 11 of the last 12 calendar years. Many of these stocked fish have retained and survived in the mainstem San Juan River, with some being collected as long as 11 years post-stocking. Numbers of razorback sucker collected on annual fall fish community monitoring trips have greatly increased in 2004 and 2005 compared to previous years, to the point where razorback sucker were collected in 22.0% and 13.3% of all electrofishing collections, respectively. Stocked razorback sucker have located one another and suitable habitat and successfully spawned for eight consecutive years. In addition, age-1+ razorback sucker have been collected in the San Juan River, indicating that at least some of the progeny of the relatively few stocked fish are beginning to recruit. Without a doubt, the SJRIP's razorback sucker augmentation efforts have been frustrating, in terms of shortfalls in numbers of fish stocked annually. However, there have also been several encouraging successes, especially in light of the shortfalls in numbers of fish stocked annually.
ii
MONITORING Stocked razorback sucker were monitored via raft-mounted electrofishing in 2005. Recaptured fish, for the most part, remained spatially separated during presumed spawning periods in 2005. No suspected spawning aggregations of ripe, adult razorback sucker were documented in 2005. Of the 71 razorback sucker collected during our 2005 collections, the majority were first-time recaptures. This makes sense, since two of the three largest groups of razorback sucker ever to be stocked into the San Juan River were stocked in 2004 (n = 2,988) and 2005 (n = 1,996). However, given the large number of razorback sucker that had been stocked in the previous ten years (n = 7,859 fish stocked from 1994-2003), it would seem as if a somewhat higher percentage of razorback sucker with two or more recaptures could be hoped for. Only 11 fish collected in 2005 had been recaptured more than once since stocking. One of these 11, was an age-13 (1992 year-class) fish that had been in the river 11 years post-stocking when it was recaptured in 2005. This is the oldest documented razorback sucker to be recaptured in the San Juan River since augmentation of this species began in 1994. One razorback sucker that had been collected in the PNM fish ladder (in August 2004) was recaptured in 2005 downstream of this structure, indicating that it had "fallen back" over the PNM Weir. This event documents that individuals of both rare fish species (razorback sucker and Colorado pikeminnow) that have used the PNM fish ladder have now fallen back over the PNM Weir (proven by their subsequent recapture in downstream sections of the San Juan River). Razorback sucker continue to be collected throughout the San Juan River, being collected from RM 166.6 (the PNM fish ladder) downstream to Lake Powell in 2005. Despite their continued widespread distribution, total CPUE for razorback sucker declined significantly between the fall 2004 and fall 2005 Adult Monitoring trips. In addition, a larger percentage of razorback sucker recaptures occurred in the canyon-bound sections of the San Juan River on the fall 2005 Adult Monitoring trip compared to the spring 2005 razorback sucker monitoring trip. It appears as if the relatively high spring peak flows in 2005 (these flows peaked at 13,200 CFS on 25 May 2005 at Shiprock USGS gage 09368000), an event that has not been duplicated or matched in the last several years, may have been responsible for not only the decline in relative numbers of razorback sucker collected between these two monitoring trips, but for the observed distributional changes as well. Changes in CPUE and longitudinal distribution related to high flow events have been observed in past years among common wild fishes (e.g., flannelmouth sucker), as well as among stocked Colorado pikeminnow in 2005. Despite the significant decrease in razorback sucker CPUE between the 2004 and 2005, the CPUE for razorback sucker on the fall 2005 Adult Monitoring trip was the second highest ever observed. Indeed, the riverwide total CPUE for razorback sucker on the fall 2005 Adult Monitoring trip was over twice as high as in any previous year, with the exception of 2004. The majority razorback sucker recaptured in 2005 were fish that had been stocked in the relatively recent past (< 400 days post-stocking). Thus, it appears as if the recently-observed increases in razorback sucker CPUE and population estimates are due primarily to recaptures of recently-stocked fish. However, it is not uncommon for sampling crews to encounter older fish (stocked in the 1990's) that are just being collected the first time since stocking. This may indicate that there are numerous fish that are persisting in the river following stocking, but managing to avoid detection for a long period of time post-stocking.
iii
While total CPUE for razorback sucker declined between the fall 2004 and fall 2005 Adult Monitoring trips, the Schnabel multiple-census population estimate actually increased (due to low numbers of recaptured fish). The Schnabel multiple-census population estimate for razorback sucker recaptured on the spring 2005 razorback monitoring trip was 1,479 fish (95% C.I. = 862-2,786 fish) from RM 158.6-76.4. The Schnabel multiple-census population estimate for razorback sucker recaptured on the fall 2005 Adult Monitoring trip was 2,126 fish (95% C.I. = 1,215-4,115 fish) from RM 158.6-76.4. The Schnabel multiple-census population estimate, extrapolated riverwide (RM 158.6-2.9), was 2,408 razorback sucker from RM 158.6-2.9 on the fall 2005 Adult Monitoring trip. These estimates include both adult and sub-adult fish. The pattern shown by the Schnabel multiple-census population estimate indicates that numbers of razorback sucker in the San Juan River have risen markedly and steadily since fall 2000. Faster growth rates were observed in razorback sucker stocked at < 351 mm TL than those stocked at larger sizes. Known female razorback sucker increased in TL faster than did known males, post-stocking. In general, stocked razorback sucker in the San Juan River grow rapidly until they reach about age-4, at which time growth slows considerably. No definitive spawning aggregations of razorback sucker were observed during the spring 2005 razorback sucker monitoring trip. Despite this, there is evidence that stocked razorback sucker continue to successfully spawn in the San Juan River. Crews from UDWR-Moab collected two wild-produced juvenile razorback sucker (174 mm TL at RM 14.2 and 180 mm TL at RM 22.5) in the lower San Juan River in 2005. In addition, crews from the University of New Mexico collected larval razorback sucker for the eighth consecutive year (1998-2005).

iv
TABLE OF CONTENTS EXECUTIVE SUMMARY . . . . . . . . . . . . . . . . . . . . . . . . . . . . i TABLE OF CONTENTS . . . . . . . . . . . . . . . . . . . . . . . . . . . . iv LIST OF TABLES. . . . . . . . . . . . . . . . . . . . . . . . . . . . . . v LIST OF FIGURES . . . . . . . . . . . . . . . . . . . . . . . . . . . . . v INTRODUCTION. . . . . . . . . . . . . . . . . . . . . . . . . . . . . . . 1 Objectives. . . . . . . . . . . . . . . . . . . . . . . . . . . . . 3 Study Area. . . . . . . . . . . . . . . . . . . . . . . . . . . . . 3 CHAPTER 1: OBTAIN, REAR, HARVEST, AND STOCK RAZORBACK SUCKER. . . . . . . 4 INTRODUCTION. . . . . . . . . . . . . . . . . . . . . . . . . . . . 4 Grow-Out Ponds: Background . . . . . . . . . . . . . . . . . 7 West Avocet Pond. . . . . . . . . . . . . . . . . . . . 7 East Avocet Pond. . . . . . . . . . . . . . . . . . . . 8 Hidden Pond . . . . . . . . . . . . . . . . . . . . . . 9 6-Pack Ponds. . . . . . . . . . . . . . . . . . . . . . 9 METHODS . . . . . . . . . . . . . . . . . . . . . . . . . . . . . . 11 Grow-Out Ponds: Stocking . . . . . . . . . . . . . . . . . . 13 West Avocet Pond. . . . . . . . . . . . . . . . . . . . 13 East Avocet Pond. . . . . . . . . . . . . . . . . . . . 13 Hidden Pond . . . . . . . . . . . . . . . . . . . . . . 13 6-Pack Ponds. . . . . . . . . . . . . . . . . . . . . . 14 RESULTS . . . . . . . . . . . . . . . . . . . . . . . . . . . . . . 14 DISCUSSION. . . . . . . . . . . . . . . . . . . . . . . . . . . . . 17 CHAPTER 2: MONITORING OF STOCKED RAZORBACK SUCKER . . . . . . . . . . . . 21 METHODS . . . . . . . . . . . . . . . . . . . . . . . . . . . . . . 21 Field Sampling. . . . . . . . . . . . . . . . . . . . . . . . 21 Electrofishing. . . . . . . . . . . . . . . . . . . . . 21 Data Analysis . . . . . . . . . . . . . . . . . . . . . . . . 22 Objective 2a: Spawning Season Habitat Use And Movement Patterns . . . . . . . . . . . . . . . . . . . . . 22 Objective 2b: Survival And Growth Rates . . . . . . . . 23 Survival. . . . . . . . . . . . . . . . . . . . . 23 Growth. . . . . . . . . . . . . . . . . . . . . . 24 Objective 2c: Determine Whether Hatchery-Reared Razorback Sucker Will Recruit Into The Adult Population And Successfully Spawn In The Wild. . . . 24 RESULTS . . . . . . . . . . . . . . . . . . . . . . . . . . . . . . 25 Objective 2a: Spawning Season Habitat Use And Movement Patterns . . . . . . . . . . . . . . . . . . . . . . . . . 25 Objective 2b: Survival And Growth Rates . . . . . . . . . . . 33 Survival. . . . . . . . . . . . . . . . . . . . . . . . 33 Growth. . . . . . . . . . . . . . . . . . . . . . . . . 36 Objective 2c: Determine Whether Hatchery-Reared Razorback Sucker Will Recruit Into The Adult Population And Successfully Spawn In The Wild . . . . . . . . . . . . . . 42 2005 Spawning Aggregation . . . . . . . . . . . . . . . 42 DISCUSSION. . . . . . . . . . . . . . . . . . . . . . . . . . . . . 44 Objective 2a: Spawning Season Habitat Use And Movement Patterns . . . . . . . . . . . . . . . . . . . . . . . . . 44 Objective 2b: Survival And Growth Rates . . . . . . . . . . . 46 Survival. . . . . . . . . . . . . . . . . . . . . . . . 46 Growth. . . . . . . . . . . . . . . . . . . . . . . . . 48

v
TABLE OF CONTENTS Objective 2c: Determine Whether Hatchery-Reared Razorback Sucker Will Recruit Into The Adult Population And Successfully Spawn In The Wild . . . . . . . . . . . . . . 48 LITERATURE CITED. . . . . . . . . . . . . . . . . . . . . . . . . . . . . 50 APPENDIX A (NAPI Grow-Out Pond Stocking Records) APPENDIX B (NAPI Grow-Out Pond Harvest Records) APPENDIX C (Parental Lineages For Lots Of Razorback Sucker Stocked Into The NAPI Grow-Out Ponds From The 24-Road Hatchery, 2000-2005) APPENDIX D (Values For Schnabel Multiple-Census Population Estimates, 1995-2005)

vi
LIST OF TABLES Table Page 1 Production levels that would have to be met annually in each of the nine existing NAPI grow-out ponds in order for the SJRIP to meet the annual stocking goal of 11,400 fish using just pond harvest . . . . . . . . . . . . . . . . . . . . . 5 2 A list of the SJRIP grow-out ponds and the calendar years during which each pond supplied harvestable-sized fish to the razorback sucker augmentation effort . . . . . . . . . . . . . . 7 3 Razorback sucker stocked into the San Juan River in 2005 . . . . 15 4 Year by year summary of razorback stocked into the San Juan River. . . . . . . . . . . . . . . . . . . . . . . . . . . . . . 16 5 A comparison of annual production of razorback sucker harvested From UCRB versus SJRIP grow-out ponds. . . . . . . . . . . . . . 17 6 Razorback sucker collected from the San Juan River during the
April 2005 razorback sucker monitoring trip (n = 71) . . . . . . 26 7 Growth of razorback sucker, in millimeters per day (mm/day), observed during 904 recapture events, including multiple recaptures, 1995-2005. . . . . . . . . . . . . . . . . . . . . . 38
LIST OF FIGURES Figure Page 1 Movements of 11 PIT-tagged razorback sucker recaptured in 2005 for the second or third time since stocking. . . . . . . . . . . 31
2 Longitudinal distribution of razorback sucker recaptures during the spring 2005 razorback sucker monitoring trip (solid black bars) and the fall 2005 Adult Monitoring trip (cross-hatched bars) in the San Juan River. . . . . . . . . . . . . . . . . . . 32
3 Razorback sucker catch per unit effort (CPUE) on spring razorback sucker monitoring trips and fall Adult Monitoring trips, 1995-2005. Error bars represent one standard error.
Error bars are not presented for the other CPUE trend lines as they are all essentially subsets of the RM 180.0-2.9 data set and in order to avoid unnecessarily cluttering the graph . . . . 34
4 A measure of longevity among stocked fish in the San Juan River razorback sucker population, expressed as the number of days in the river since stocking versus the percent of total recaptures represented by recaptured fish, 2000-2005. Some recaptures could not be used in this analysis due to lack of a detectable PIT tag at the time of recapture. . . . . . 35
vii
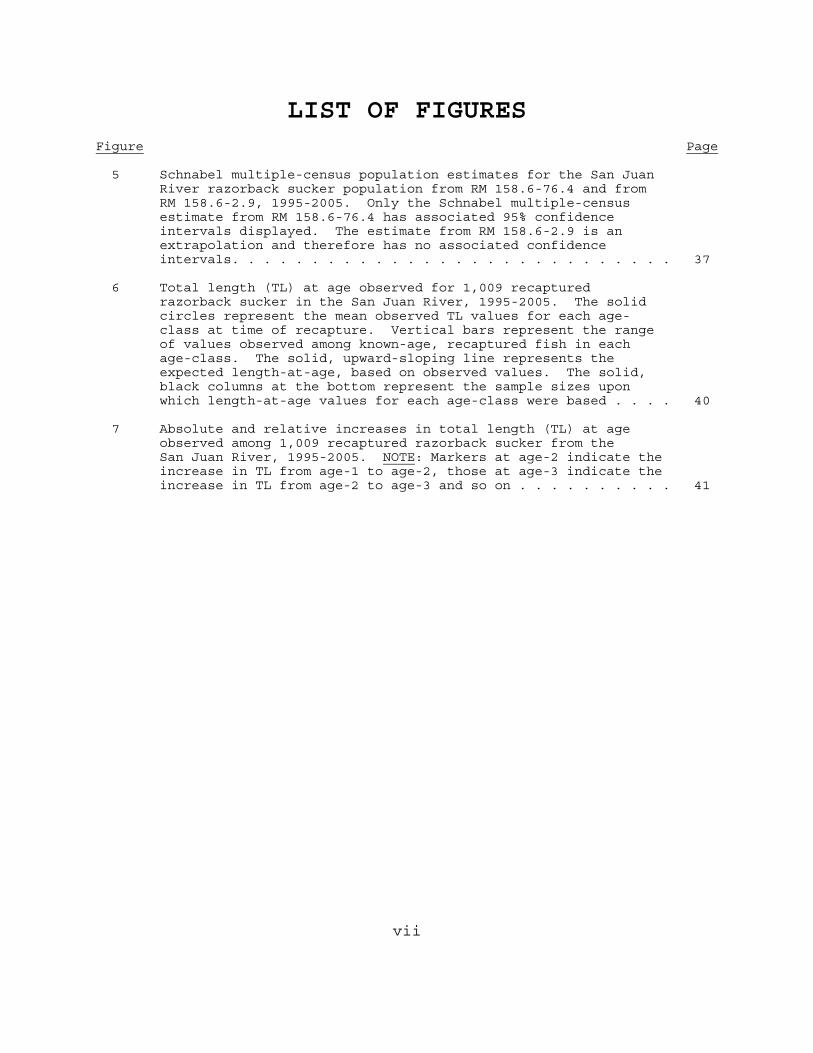
LIST OF FIGURES Figure Page 5 Schnabel multiple-census population estimates for the San Juan River razorback sucker population from RM 158.6-76.4 and from RM 158.6-2.9, 1995-2005. Only the Schnabel multiple-census
estimate from RM 158.6-76.4 has associated 95% confidence intervals displayed. The estimate from RM 158.6-2.9 is an extrapolation and therefore has no associated confidence intervals. . . . . . . . . . . . . . . . . . . . . . . . . . . . 37
6 Total length (TL) at age observed for 1,009 recaptured razorback sucker in the San Juan River, 1995-2005. The solid circles represent the mean observed TL values for each age- class at time of recapture. Vertical bars represent the range of values observed among known-age, recaptured fish in each age-class. The solid, upward-sloping line represents the expected length-at-age, based on observed values. The solid, black columns at the bottom represent the sample sizes upon which length-at-age values for each age-class were based . . . . 40 7 Absolute and relative increases in total length (TL) at age observed among 1,009 recaptured razorback sucker from the San Juan River, 1995-2005. NOTE: Markers at age-2 indicate the increase in TL from age-1 to age-2, those at age-3 indicate the increase in TL from age-2 to age-3 and so on . . . . . . . . . . 41

1
INTRODUCTION Razorback sucker (Xyrauchen texanus), is one of three San Juan River native fish species (the Colorado pikeminnow, Ptychocheilus lucius, and the roundtail chub, Gila robusta being the other two) that have become greatly reduced in numbers and range since the turn of the century (Burdick 1992). Physical alterations of riverine habitats, water impoundment in the form of Navajo Reservoir and Lake Powell and their associated effects on flow and thermal regimes, introduction of non-native fish species, and contaminants have probably all contributed to the decline of these native species (Platania 1990, Brooks et al. 1993, Ryden and Pfeifer 1994a). Extremely small numbers of wild razorback sucker and the apparent long-term lack of recruitment led to this species being listed as endangered under the Endangered Species Act on 22 November 1991 (U.S. Fish and Wildlife Service {USFWS} 1991). The razorback sucker is also currently protected by state laws in Arizona (AZ), California (CA), Colorado (CO), Nevada (NV), Utah (UT), and by the Navajo Nation. Information on the historic distribution and abundance of the razorback sucker in the San Juan River Basin is sparse. Until the late 1980's the number of fishery surveys conducted in the San Juan River was relatively small compared to the rest of the Colorado River basin (Ryden 2000a). This is probably because much of the San Juan River is canyon-bound in its lower stretches and a large percentage of the river runs through Indian reservation land (Maddux et al. 1993). Anecdotal accounts of "humpies" from the Animas River near Durango (Jordan 1891), and the San Juan River near Farmington (Koster 1960) indicated the presence of razorback sucker in these areas. However, these accounts were not verified by scientific collections. Pre-impoundment rotenone applications in the Navajo Dam area in 1962 killed fish downriver to Farmington, New Mexico (NM). However, no razorback sucker were documented among the fish killed (Olson 1962). The first scientifically-documented record of razorback sucker from the San Juan River basin was in 1976 when two adults were seined from a pond near Bluff, UT at about river mile (RM) 81 (VTN Consolidated, Inc. and Museum of Northern Arizona 1978, Platania 1990, Minckley et al. 1991). According to local residents, a second pond adjacent to the one where these two fish were caught was drained just weeks before leaving approximately 100-250 razorback sucker stranded, resulting in their death. These two ponds communicated with the river via a canal that allowed fish movement to and from the river, but only when the headgates were open (VTN Consolidated, Inc. and Museum of Northern Arizona 1978, Platania 1990, Minckley et al. 1991). Between 1987 and 1989 sixteen adult razorback sucker were collected from the San Juan River arm of Lake Powell, in the vicinity of Piute Farms Marina, RM 0.0 (Platania 1990). In 1988 one adult razorback sucker was captured and released in the San Juan River near Bluff, UT, close to the 1976 capture site (Platania 1990). This is the only scientifically-documented collection of a wild razorback sucker from the mainstem San Juan River. No scientifically-documented, wild razorback sucker have been collected from the San Juan River in either CO or NM. Neither had spawning or recruitment of this species been documented in the San Juan River, prior to 1998. However, the historically-recent presence of a few large adult fish near Bluff, UT suggests that there may have been a remnant population of old, adult razorback sucker remaining in the San Juan River as late as 1988. Extensive electrofishing surveys from 1991 to 1997 failed to collect any wild razorback sucker from the mainstem San Juan River (Ryden and Pfeifer 1993, 1994b, 1995, 1996, Ryden 2000b).
2
One of the two goals of the San Juan River Recovery Implementation Program (SJRIP) is to protect and recover endangered fishes in the San Juan River Basin, including Colorado pikeminnow and razorback sucker, with the ultimate goal of promoting self-sustaining populations of razorback sucker and Colorado pikeminnow (SJRIP 1995). This includes reestablishing populations of endangered razorback sucker in appropriate historic habitat, if necessary (Ryden 1997). Due to the paucity of historic and recent collections of this species, including the failure to collect any wild razorback sucker during three years (1991-1993) of intensive studies on all life stages of the San Juan River fish community (Buntjer et al. 1993, 1994, Lashmett 1993, 1994, Ryden and Pfeifer 1993, 1994b, Gido and Propst 1994) the SJRIP's Biology Committee (BC) identified the necessity to initiate an experimental stocking program for razorback sucker in the San Juan River (Ryden and Pfeifer 1994a). Experimental stocking was implemented to provide needed insight about recovery potential and habitat suitability for the razorback sucker in the San Juan River between Farmington, NM and Lake Powell in UT (i.e., the area designated as Critical Habitat for razorback sucker; Maddux et al. 1993, USFWS 1994). Between March 1994 and October 1996, 942 razorback sucker were stocked into the San Juan River at four stocking sites (RM 158.6, 136.6, 117.5, and 79.6). Data gathered on these fish identified habitat types being used year-round by razorback sucker in the San Juan River, and provided information on movements, survival, and growth rates. Based on the successes of the experimental stocking study, the initiation of a full-scale augmentation effort for razorback sucker in the San Juan River was deemed to be desirable by the SJRIP Biology Committee (BC). In 1997 a FIVE-YEAR AUGMENTATION PLAN FOR RAZORBACK SUCKER IN THE SAN JUAN RIVER was completed (Ryden 1997). The 1997 razorback sucker augmentation plan identified a target population of 15,900 razorback sucker in the San Juan River between Hogback Diversion (RM 158.6) and Lake Powell (RM 0.0). In order to meet this target population, it was estimated that 73,482 razorback sucker would have to be stocked between 1997 and 2001. To this end, stocking of razorback sucker began in September 1997. Between September 1997 and November 2001, a total of 5,890 razorback sucker were stocked into the San Juan River, with all stockings occurring at RM 158.6. This represented a 92.0% shortfall (n = of 67,592 fish) compared to the target stocking numbers specified in the 1997 augmentation plan. Despite this large shortfall, numerous encouraging observations were made among the relatively few fish that were stocked. To begin with, the recapture (i.e., survival) rate among razorback sucker stocked at > 300 TL was better than expected (Ryden 2001). Second, aggregations of suspected spawning adults were collected in 1997, 1999, and 2001 at RM 100.2 just downstream of Aneth, UT (Ryden 2001, 2003a). And third, crews from the University of New Mexico (UNM) HAVE collected larval razorback sucker in every year since 1998 (Brandenburg 2000, Brandenburg et al. 2001, 2002, 2003, 2004, 2005). Based on these observations, the SJRIP-BC decided to extend the augmentation effort for razorback sucker. AN AUGMENTATION PLAN FOR RAZORBACK SUCKER IN THE SAN JUAN RIVER: AN ADDENDUM TO THE FIVE-YEAR AUGMENTATION PLAN FOR RAZORBACK SUCKER IN THE SAN JUAN RIVER (Ryden 1997) was completed in February 2003 (Ryden 2003b). This addendum outlines an additional eight-year augmentation period for razorback sucker. This eight-year augmentation period was scheduled to begin in 2004 and continue through 2011. However, because of several mitigating circumstances (detailed in Ryden 2005a), the timeline for beginning this eight-year augmentation effort has been pushed back to at least 2006 and possibly 2007. Therefore, the razorback sucker stocking and augmentation efforts that occurred from 2002-2005 were considered to be an interim effort, separate from these two distinct razorback sucker augmentation efforts. This report provides an overview of the 2005 interim razorback sucker augmentation efforts, including information on the fish that were stocked and/or recaptured during that calendar year.
3
Objectives
The Fiscal Year 2005 workplan for this project had the following objectives: 1) Obtain, rear, harvest, and stock razorback sucker to fulfill tasks and
objectives outlined in the current version of the razorback sucker augmentation plan addendum (Ryden 2003b final)
2) Monitor stocked razorback sucker in the wild for various parameters,
including: a) Spawning season habitat use and movement patterns b) Survival and growth rates c) Determine whether hatchery-reared razorback sucker will recruit
into the adult population and successfully spawn in the wild 3) Remove nonnative fish species which prey upon and compete with native fish species in the San Juan River.
Study Area The study area for monitoring of stocked razorback sucker extends from Hogback Diversion in NM (RM 158.6), downstream to Clay Hills boat launch (RM 2.9). For a detailed description of the geomorphic features of this study area, see the SAN JUAN RIVER STUDY AREA DESCRIPTION in Ryden 2000a or any of the other 7-year final research reports at the following web site:
http://southwest.fws.gov/sjrip/
4
CHAPTER 1: OBTAIN, REAR, HARVEST, AND STOCK RAZORBACK SUCKER
Objective 1: Obtain, rear, harvest, and stock razorback sucker to fulfill tasks and objectives outlined in the current version of the razorback sucker augmentation plan addendum (Ryden 2003b final)
INTRODUCTION In the following chapter it is important to remember that prior to 1998 the SJRIP had no grow-out ponds, hatchery facilities, or contracts with any state or federal fish hatcheries to produce or provide fish for its razorback sucker augmentation activities. Stocking of razorback sucker between 1994 and 1999 (the first year that Ojo Pond was harvested) relied completely on obtaining surplus fish from sources outside of the San Juan River basin. Between 1994 and 1998, this included fish from both the USFWS's Ouray National Fish Hatchery (Ouray NFH) in Ouray, UT and the Utah Division of Wildlife Resources= (UDWR) Wahweap Warmwater Fish Hatchery (Wahweap), near Page AZ. During the first several years of razorback sucker augmentation efforts, the SJRIP was not selective about the sizes of fish being stocked into the San Juan River. Razorback sucker as large as 523 mm TL and as small as 100 mm TL were PIT-tagged and stocked into the river. In fact, most of the fish coming to the SJRIP from Ouray NFH were small fish (mean TL = 190 mm). However, monitoring of stocked razorback sucker between 1995 and 2000 showed that the survival/retention rate among fish stocked at < 300 mm TL was considerably lower than that for fish stocked at > 300 mm TL (Ryden 2000c). Based on this information, the SJRIP-BC decided to switch to stocking only razorback sucker that were > 300 mm TL, beginning in 2001. In 1998, the SJRIP's first grow-out pond, Ojo Pond, was stocked (Appendix A). This pond was harvested for the first time in March of 1999. Unfortunately, unseasonably heavy rains caused the dyke on this pond to wash out on 3 August 1999, completely draining the pond and causing an almost complete fish kill. Ojo Pond was never rebuilt. In 1999, East and West Avocet Pond were stocked for the first time. The two Avocet ponds were first harvested in 2000. Hidden Pond was stocked for the first time in 2000 and harvested for the first time in 2001. The 6-Pack ponds were stocked for the first time in 2002 and harvested for the first time in 2003. As was mentioned previously, fish of all size-classes that were harvested from grow-out ponds prior to 2001 were PIT-tagged and stocked into the San Juan River. Beginning in 2001, mainly fish that were > 300 mm TL were harvested from these ponds and stocked into the river. Smaller razorback sucker (usually in the 250-299 mm TL range) were occasionally harvested and stocked in situations where the harvest crew felt that a thinning of these mid-sized fish was appropriate to allow for accelerated growth of smaller size-class fish which remained in the grow-out pond. When the SJRIP made the decision to passively rear razorback sucker in grow-out ponds (i.e., in the late 1990's), it was anticipated that each grow-out pond would be able to be stocked annually with larval fish in the spring of the year and within the space of two full growing seasons, produce 500 pounds (227 kg) of harvestable fish per pond surface acre per year (Table 1; M. Baker, pers. comm.; T. Czapla, pers. comm., F. Pfeifer, pers. comm.).
5
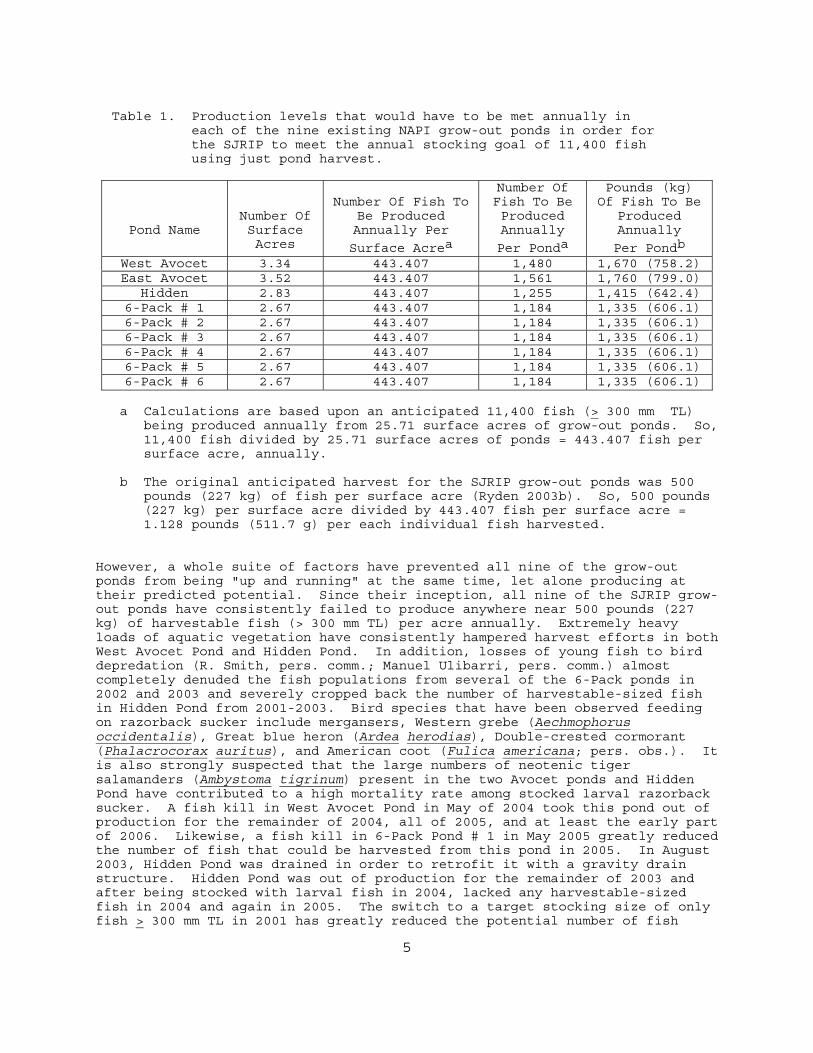
Table 1. Production levels that would have to be met annually in each of the nine existing NAPI grow-out ponds in order for the SJRIP to meet the annual stocking goal of 11,400 fish using just pond harvest.
Pond Name
Number Of Surface Acres
Number Of Fish To
Be Produced Annually Per
Surface Acrea
Number Of Fish To Be Produced Annually
Per Ponda
Pounds (kg) Of Fish To Be
Produced Annually
Per Pondb West Avocet 3.34 443.407 1,480 1,670 (758.2) East Avocet 3.52 443.407 1,561 1,760 (799.0)
Hidden 2.83 443.407 1,255 1,415 (642.4) 6-Pack # 1 2.67 443.407 1,184 1,335 (606.1) 6-Pack # 2 2.67 443.407 1,184 1,335 (606.1) 6-Pack # 3 2.67 443.407 1,184 1,335 (606.1) 6-Pack # 4 2.67 443.407 1,184 1,335 (606.1) 6-Pack # 5 2.67 443.407 1,184 1,335 (606.1) 6-Pack # 6 2.67 443.407 1,184 1,335 (606.1)
a Calculations are based upon an anticipated 11,400 fish (> 300 mm TL) being produced annually from 25.71 surface acres of grow-out ponds. So, 11,400 fish divided by 25.71 surface acres of ponds = 443.407 fish per surface acre, annually. b The original anticipated harvest for the SJRIP grow-out ponds was 500 pounds (227 kg) of fish per surface acre (Ryden 2003b). So, 500 pounds (227 kg) per surface acre divided by 443.407 fish per surface acre = 1.128 pounds (511.7 g) per each individual fish harvested. However, a whole suite of factors have prevented all nine of the grow-out ponds from being "up and running" at the same time, let alone producing at their predicted potential. Since their inception, all nine of the SJRIP grow-out ponds have consistently failed to produce anywhere near 500 pounds (227 kg) of harvestable fish (> 300 mm TL) per acre annually. Extremely heavy loads of aquatic vegetation have consistently hampered harvest efforts in both West Avocet Pond and Hidden Pond. In addition, losses of young fish to bird depredation (R. Smith, pers. comm.; Manuel Ulibarri, pers. comm.) almost completely denuded the fish populations from several of the 6-Pack ponds in 2002 and 2003 and severely cropped back the number of harvestable-sized fish in Hidden Pond from 2001-2003. Bird species that have been observed feeding on razorback sucker include mergansers, Western grebe (Aechmophorus occidentalis), Great blue heron (Ardea herodias), Double-crested cormorant (Phalacrocorax auritus), and American coot (Fulica americana; pers. obs.). It is also strongly suspected that the large numbers of neotenic tiger salamanders (Ambystoma tigrinum) present in the two Avocet ponds and Hidden Pond have contributed to a high mortality rate among stocked larval razorback sucker. A fish kill in West Avocet Pond in May of 2004 took this pond out of production for the remainder of 2004, all of 2005, and at least the early part of 2006. Likewise, a fish kill in 6-Pack Pond # 1 in May 2005 greatly reduced the number of fish that could be harvested from this pond in 2005. In August 2003, Hidden Pond was drained in order to retrofit it with a gravity drain structure. Hidden Pond was out of production for the remainder of 2003 and after being stocked with larval fish in 2004, lacked any harvestable-sized fish in 2004 and again in 2005. The switch to a target stocking size of only fish > 300 mm TL in 2001 has greatly reduced the potential number of fish
6
available to be stocked into the San Juan River on an annual basis. The harvest return based on numbers of larval razorback sucker stocked into East Avocet Pond has been measured at as high as 8% for fish sampled in the 200-250 mm TL range, but drops to around 0.5% (or less) for fish harvested at > 300 mm TL (D. Ryden unpublished data). While the decision to harvest, PIT tag, and stock only razorback sucker that are > 300 mm TL is felt to be a biologically sound decision based on post-stocking survival/retention, it also greatly reduces the potential number of harvestable-sized fish available for harvest annually out of the grow-out ponds. At present, the SJRIP has nine grow-out ponds, totaling 25.71 surface acres (Table 1). However, there have only been four consecutive years (2002-2005) when all nine of the SJRIP's grow-out ponds existed at the same time and therefore even had the potential to be harvested in the same year. Yet, during this four year period (2002-2005) there was never a year when more than seven of the nine SJRIP grow-out ponds yielded harvestable-sized fish (Table 2). Several factors have precluded having all nine of the SJRIP grow-out ponds "up and running" at the same time. These include: 1) in 2003 Hidden Pond (2.83 surface acres; Table 1) was drained and retrofitted and even though it was restocked with larval razorback sucker in 2004, it yielded no harvestable-sized fish in either 2004 or 2005; 2) for most of 2004, all of 2005, and so far in 2006, West Avocet Pond (3.34 surface acres; Table 1) was out of production due to a fish kill (Appendices A and B); 3) 6-Pack Pond # 1 (2.67 surface acres; Table 1) had a fish kill in May of 2005, which precluded the possibility of its being harvested again in the last half of the year (Appendices A and B); 4) likewise, due to heavy bird predation, 6-Pack Pond # 3 (2.67 surface acres; Table 1) yielded no harvestable-sized fish in either 2003 or 2004 (Appendices A and B); 5) in 2004, 6-Pack pond #'s 1 and 2 did not yield any fish > 300 mm TL during harvest efforts. Therefore in reality, only 15.0 surface acres of ponds (n = 5) yielded harvestable-sized fish in 2002, 20.2 surface acres of ponds (n = 7) yielded harvestable-sized fish in 2003, 11.5 surface acres of ponds (n = 4) yielded harvestable-sized fish in 2004, and 19.5 surface acres of ponds (n = 7) yielded harvestable-sized fish in 2005 (Table 2). Razorback sucker from supplemental sources outside of the San Juan River basin continue to be used whenever they can be obtained. The most reliable and successful source to date has been razorback sucker being reared in golf course ponds in Page, AZ. These fish are cooperatively reared, monitored, harvested, and stocked by personnel from UDWR-Wahweap and students from Page High School, in Page AZ, as part of an information and education (I&E) outreach effort. A similar, but much smaller I&E effort between the Colorado Division of Wildlife and students at Ignacio High School in Ignacio, CO has also provided small numbers of razorback sucker to the SJRIP in past years. In 2005, a contract was established with the USFWS's Dexter National Fish Hatchery and Technology Center (Dexter NFH&TC) to annually supply 20,000 razorback sucker > 200 mm TL for stocking into the SJRIP's grow-out ponds (Hamman and Ulibarri 2006). Delivery of these 20,000 fish annually is set to begin in 2006. It was felt that by stocking the SJRIP's grow-out ponds with these larger size-class fish, the problems with predation losses to both birds and tiger salamanders will be greatly reduced. In addition, a series of protective measures (e.g., perimeter security fences, bird alarms, aerators) have either been put in place or are in the process of being installed at all nine grow-out ponds that should help to increase security and reduce both bird predation and fish kills due to low dissolved oxygen levels (Bliesner 2005). In 2005, personnel from the Navajo Nation's Department of Fish and Wildlife (Navajo DF&W) took over day to day monitoring and maintenance of the nine grow-out ponds (Lamarra and Cole 2006), according to protocols developed in 2005 (Lamarra 2005). In February 2006, the SJRIP's Coordination Committee

7
Table 2. A list of the SJRIP grow-out ponds and the calendar years during which each pond supplied harvestable-sized fish to the razorback sucker augmentation effort.
Years During Which Each SJRIP Grow-Out Pond Supplied
Harvestable-Sized Fisha To The Razorback Sucker Augmentation Effort
Pond Name
Surface Acreage
1998
1999
2000
2001
2002
2003
2004
2005
Ojo 2.40 YES East
Avocet
3.52
NO
YES
YES
YES
YES
YES
YES West
Avocet
3.34
NO
YES
YES
YES
YES
NO
NO Hidden 2.83 NO YES YES NO NO NO 6-Pack ponds:
# 1 2.67 NO YES NO YES # 2 2.67 NO YES NO YES # 3 2.67 YES NO NO YES # 4 2.67 YES YES YES YES # 5 2.67 NO YES YES YES # 6 2.67 NO YES YES YES
a: Starting in 2001, the SJRIP adopted a target harvest size of > 300 mm TL for razorback sucker harvested from ponds. Before 2001, any harvested razorback sucker that was deemed large enough to safely inject with a PIT tag was thus implanted and stocked into the river. voted to contract out the production of additional razorback sucker > 300 mm TL (approximately 14,000 fish annually) to two USFWS hatcheries, Ouray NFH and Uvalde NFH in Uvalde, TX. It is anticipated that between these hatchery-produced fish and the fish being produced in the SJRIP's grow-out ponds, the target stocking numbers specified in both of the razorback sucker augmentation plan addendums (Ryden 2003b, 2005a) will soon be able to be met.
Grow-Out Ponds: Background West Avocet Pond Between 2000 and 2003, a total of 857 razorback sucker were harvested from West Avocet Pond and stocked into the San Juan River (Appendix B). However, the majority of these (n = 588) were small fish that were harvested and stocked in 2000, before the harvest size limit of > 300 mm TL was adopted. Relatively few razorback sucker > 300 mm TL (n = 269) have been harvested from West Avocet Pond from 2000-2003. West Avocet Pond has always produced far fewer harvestable-sized fish than has neighboring East Avocet Pond. This, in spite of the fact that West Avocet Pond has been managed essentially identically to East Avocet Pond, which is literally right next to it. The two Avocet ponds are separated by an earthen berm that is only about 10-15 feet wide, but are filled with water from the same pipeline, are of almost identical size, depth, and bottom contours and both ponds have very healthy, mature communities of shoreline vegetation (e.g., cattails, sedges/rushes, grasses, a few small cottonwood trees, and various other types of emergent vegetation).
8
Apparently, the major difference between the two Avocet ponds (and the reason West Avocet Pond had such a large standing crop of macrophytes compared to East Avocet Pond) was that the two Avocet ponds were originally one large pond (R. Bliesner, pers. comm.). When this pond was identified to be used as a razorback sucker grow-out pond, it was separated by an earthen berm and turned into two separate, smaller ponds (R. Bliesner, pers. comm.). In order to construct this berm, the bottom of the higher end of the pond (i.e., the east end) was scraped and lowered and that dirt was used to construct the berm that now separates the two Avocet ponds (R. Bliesner, pers. comm.). Thus when they were first filled with water, West Avocet Pond already had a very richly-laden layer of organic material on its bottom, while East Avocet Pond did not. This apparently led to many of the differences observed later between the two ponds. It was always assumed that the major reason for West Avocet Pond yielding smaller numbers of razorback sucker during harvest efforts (the two Avocet ponds were always harvested simultaneously) was that West Avocet pond had a very heavy standing crop of submergent and floating macrophytes throughout the pond, which got progressively heavier throughout the calendar year, but then tended to die back some during the winter months. In contrast, adjacent East Avocet Pond tended to have a comparatively small standing crop of submergent and floating macrophytes from year to year. The heavy vegetation load in West Avocet Pond made properly setting and running passive fyke nets difficult at best. The lack of large fish being harvested annually from West Avocet pond was assumed to be a function of this heavy vegetation load and the sampling difficulties associated with it. In May 2004, the heavy vegetation load in West Avocet Pond underwent a massive die-off. When this dead vegetation began to decay, it caused dissolved oxygen levels in the pond to plummet, leading to a fish kill. Somewhere upwards of 400 fish (based on 408 carcasses collected) were lost during this fish kill. What caused the vegetation die-off is unknown, but the introduction of a chemical agent into the pond (possibly a pesticide or herbicide from nearby agricultural operations) is suspected. West Avocet Pond had no perimeter security fence at the time. From 8-13 May, salvage efforts using passive fyke nets collected approximately 550 fish (range = 75-432 mm TL; based on 63 measured fish) from West Avocet Pond. These salvaged fish were transferred into adjacent East Avocet Pond. After fyke-netting was completed, West Avocet Pond was completely drained. When draining of this pond began, it was assumed that numerous other razorback sucker were still in West Avocet Pond. However, very few (n = 68) razorback sucker were collected during the entire draining process and most of those were small fish, many as small as 75 mm TL. So, it would appear that harvest efforts using passive fyke nets were relatively effective in sampling the majority of the razorback sucker that were in West Avocet Pond. Following draining, West Avocet pond remained dry during the rest of 2004 and most of 2005, awaiting the award of a contract for dirt work and retro-fitting work. In late summer of 2005, the pond bottom was scraped of dead vegetation and organic-laden bottom soils, re-graded, and retro-fitted with a gravity drain and kettle area. This pond was re-filled with water in the fall of 2005, just before the water was drained out of the NAPI canal system. As of April 2006, there were no razorback sucker in West Avocet Pond. East Avocet Pond East Avocet Pond has been the most successful of the nine grow-out ponds in terms of annually producing healthy fish > 300 mm TL for stocking into the San Juan River. It has contributed harvestable-sized fish to the augmentation effort for six consecutive years now (2000-2005; Table 2). In addition, it
9
has had far fewer problems (e.g., fish kills, extremely heavy standing crops of macrophytes, losses to bird predation, failure to produce fish > 300 mm TL) than the other eight SJRIP grow-out ponds. Like adjacent West Avocet Pond, East Avocet Pond has a very mature shoreline vegetation community that provides good cover for very young fish while precluding predation by wading shorebirds. East Avocet also has submergent and floating macrophytes throughout the pond, however they are not usually dense enough to be problematic during harvest operations. Between 2000 and 2005, a total 2,572 fish have been harvested from East Avocet Pond and stocked into the San Juan River (Appendix B). Some of these (n = 242) were small fish that were harvested and stocked in 2000, before the harvest size limit of > 300 mm TL was adopted. However, the majority (n = 2,330; 90.6%) were fish that were > 300 mm TL. Hidden Pond Since it was first stocked in May of 2000, Hidden Pond has been an extremely problematic pond in which to successfully rear and harvest razorback sucker of harvestable size (> 300 mm TL). Between 2000 and 2002, larval fish from three different year-classes (2000-2002) were stocked into Hidden Pond (Appendix A). A total 100,000 larval fish were stocked into Hidden Pond over this three-year period. Sampling of these fish showed relatively good growth of young razorback sucker in Hidden Pond, with many fish reaching 200+ mm TL by the spring of their second growing season. However, very few of these fish ever seemed to reach the target harvest size of > 300 mm TL. During harvest efforts from 2001-2003, very few harvestable-sized fish were collected (n = 14), yet during this same period, several hundred (pers. obs.) younger fish, ranging to as large as 275 mm TL, were collected regularly. It appears as if very heavy avian predation tends to crop off the large majority of razorback sucker in Hidden Pond somewhere between 200 and 300 mm TL. In 2003, Hidden Pond was completely drained so that a gravity drain could be installed. Fish salvage efforts undertaken in Hidden Pond in July and August of 2003 (prior to its being drained between 8 and 16 August 2003; Appendix A), collected only 1,174 fish (n = 1,171 from 8-11 July; n = 3 from 4-7 August), with the mean size of salvaged fish being 193 mm TL (ranged = 97-392 mm TL). However, only four fish > 300 mm TL were collected during this salvage effort. There was some question at the time as to whether or not the passive collection gear (i.e., fyke nets) being utilized were effective in collecting a majority of the razorback sucker that were in a given grow-out pond when it was sampled. Yet when a salvage crew was on-hand for the entire draining of Hidden Pond (from 8-16 August 2003) not a single additional razorback sucker was found. This would seem to argue that the passive fyke-netting done during the week of 8-11 July 2003 was highly effective, given: 1) the drop to only three fish collected during the second week of fyke-netting efforts, from 4-7 August (compared to 1,171 fish collected via fyke nets from 8-11 July); and 2) the complete absence of any razorback sucker collected during the entire draining process from 8-16 August. Hidden Pond was retrofitted with a gravity drain and refilled with water from the NAPI canals in the fall of 2003. Larval razorback sucker were stocked back into Hidden Pond in both 2004 and 2005 (Appendix A). 6-Pack Ponds From their very creation, the 6-Pack ponds have been somewhat of a paradox. These six ponds are all within 100 yards of one another and like the

10
two Avocet ponds, have just small earthen berms separating them. They were all created from the same soils and are filled from the same gravity-fed, lateral pipeline. All six ponds have essentially the same surface area and depth and, being fed by the same water source, should theoretically have the same water quality. Even after four years of existence, the shoreline vegetative community of the 6-Pack ponds is essentially absent. A few, small, thorny weeds grow in patches along the edges of these ponds and a few cattails have begun to sprout in the corners of two or three ponds, but for the most part, the shorelines consist of bare dirt. These ponds have a very gentle slope for the first 10-15 feet or so, which allows wading shorebirds to enter and successfully forage in these ponds. These ponds are almost constantly subjected to cross-winds that cause the northern and eastern shorelines to be subjected to constant wave-induced erosion. Very few submergent macrophytes have become established in these six ponds and most of the ones that are present are concentrated in the shallow areas adjacent to the shoreline, where shovels-full of alfala pellets have been applied during fertilization efforts. For the first two years of their use, no tiger salamanders were collected in any of the 6-Pack ponds. However, tiger salamanders are now present in all six of these ponds. An abundance of birds (all of the previously mentioned predacious species, as well as large numbers of geese and American avocet Recurvirostra americana) utilize these six ponds on a regular basis. In 2002, Ray Smith (BIA-NIIP) witnessed large numbers of mergansers on these ponds. They had apparently been feeding heavily on the razorback sucker in the ponds, because they were observed having to regurgitate fish before they could lose enough weight to be able to take flight (R. Smith, pers. comm.). This same phenomenon was observed at these ponds in 2003 (M. Ulibarri, pers. comm.). This is where the similarities between these six ponds end. The 6-Pack ponds were stocked for the first time in 2002. Unlike the two Avocet ponds and Hidden Pond, all of the 6-Pack ponds were stocked with either age-1 or age-2 fish in 2002 and 2003 (Appendix A). Fyke nets were set in 6-Pack pond #'s 3 and 4 in the fall of 2002 to observe the growth of razorback sucker in these ponds in their first year. On 6 November 2002, "hundreds" of razorback sucker in the 200-275 mm TL range were observed in both of these ponds (pers. obs.). In addition, three fish > 300 mm TL were harvested and stocked, two from 6-Pack Pond # 3 (312 and 321 mm TL) and one from 6-Pack Pond # 4 (313 mm TL; Appendix B). When harvest crews returned to the 6-Pack ponds in 2003 to set nets, they immediately noticed color and clarity differences among the six ponds. Pond #'s 1, 3 and 4 were very clear and blue-colored, pond #'s 2 and 6 were very turbid and yellow-colored, and pond # 5 was very turbid and had a pea-green color (pers. obs.). These color and turbidity differences between and among the 6-Pack ponds are now documented as being commonplace and continue to this day (pers. obs.). Harvest efforts yielded very different results for all six of these ponds in 2003. Pond #'s 1 and 2 yielded several hundred harvestable-sized fish (n = 158 and 535 fish, respectively) while pond #'s 3-6 yielded very few harvestable-sized fish (n = 0, 1, 4, and 7, respectively; Appendix B). However, pond #'s 2, 3, and 4 had very few remaining sub-harvestable fish left in them (13, 14, and 48, respectively) while the other three ponds had several hundred sub-harvestable fish each in them. It appeared as if avian predators had almost completely denuded pond #'s 3 and 4 of fish of all sizes, while larger fish had been heavily cropped from pond #'s 5 and 6 and smaller fish from pond # 2 (Appendix B). This type of unpredictable, "hit-and-miss" pattern of survival and production of fish in these six ponds has continued through 2005 (i.e., a pond that produces well in one year more often that not does not produce well in the following year). For example, to date, a total of 3,430 razorback sucker (i.e., 26.7% of all the razorback sucker stocked into the San Juan River since 1994) have been stocked from the 6-Pack ponds between 2002 and 2005. Here is how that total breaks down by pond: 163 from 6-Pack Pond #1 (158 {96.9%} of those in 2003); 610 from 6-Pack Pond # 2 (535

11
{87.7%} of those in 2003); 204 from 6-Pack Pond # 3 (202 {99.0%} of those in 2005); 648 from 6-Pack Pond # 4 (about half each from 2004 {n = 294; 45.4%} and 2005 {n = 352; 54.3%}); 1,005 from 6-Pack Pond # 5 (715 {71.1%} of those in 2004); and, 800 from 6-Pack Pond # 6 (582 {72.8%} of those in 2005; Appendix B). 6-Pack Pond # 4 has contributed harvestable-sized fish for four consecutive years (2002-2005) and 6-Pack pond #'s 5 and 6 have contributed harvestable-sized fish for three consecutive years (2003-2005), while the other three 6-Pack ponds (#'s 1, 2, and 3) have each contributed harvestable-sized fish in only two of the last four years, none of which were consecutive for any of these three ponds (Table 2). The explanation for the highly variable production observed among the 6-Pack ponds may lie in their water quality. A presentation made by Vince Lamarra to the SJRIP-BC and Peer Review panel pointed out that even though these six ponds are in very close proximity to one another and are filled with water from the same lateral pipeline, they all have very different nutrient loads (nitrogen and phosphorous) and standing crops of phytoplankton and zooplankton. The explanation for these differences is unclear, but this is a very real phenomenon which, along with outside factors such as avian predation, makes for highly variable survival, growth, and harvest rates among young razorback sucker that are stocked into these six ponds. A fish kill occurred in 6-Pack Pond # 1 from roughly 9-20 May 2005. There were mortalities among fish from approximately 110-420 mm TL (the total number of mortalities is unknown, but we counted several hundred dead fish). However, this was not a complete fish kill and did not seem to affect fish of any one particular size-class. The fish kill was apparently caused by low dissolved oxygen (DO) levels following a pond fertilization event shortly before this. During this period, personnel from NAPI & from Keller-Bliesner Engineering kept pumps going to help aerate the water in the pond while personnel from Navajo DF&W flushed the ponds with fresh water to help increase the DO content. The fish kill appeared to be completely over by 20 May 2005. During the fish kill event (on 18 May 2005), personnel from the USFWS’s Colorado River Fishery Project office in Grand Junction, CO (USFWS-CRFP) set two fyke nets into 6-Pack Pond # 1 (for a total of six hours each) to assess whether or not any fish were still alive and/or needed to be collected and moved to adjacent ponds. Both fyke nets had fish in them when checked, indicating that fish were actively entering the nets and successfully negotiating their way through the nets’ three throats and back to the rear holding bay. However, only the fyke net, the one set closest to where the pond’s surface waters were being actively agitated/aerated by the pumps, had any live fish in it when it was checked. The fish in the other fyke net (about 45 fish) had all died, apparently due to lack of oxygen. At that point, both nets were pulled and no further attempts to harvest fish were undertaken.
METHODS Fish being reared in the SJRIP's nine grow-out ponds have been reared using a multiple year-class strategy, since 1999. This strategy entails annually stocking each pond with larval razorback sucker. Each pond is harvested annually using passive fyke nets, which tend to collect the larger fish that are extant in any given pond (although depending upon the mesh size of the fyke net, fish down to about 100 mm TL can be collected via this method). Over time, the older (and usually larger and healthier) fish are harvested, PIT-tagged, and stocked into the river, while the younger fish are allowed to remain in the pond and grow, along with the individuals from earlier year-classes that are more slow-growing. This strategy was adopted by
12
the SJRIP in 1999 for several reasons. First, up until 2003, none of the nine grow-out ponds had any drain structures. This made the prospect annually draining and re-filling these ponds a costly and time-consuming process. As of April 2006, only two of the nine grow-out ponds have been retrofitted with any kind of drain structure (i.e., Hidden Pond in 2003 and West Avocet Pond in 2005). Second, even if ponds were drained annually, all fish would either have to be stocked or placed back into other grow-out ponds if they were < 300 mm TL. The SJRIP has only nine total grow-out ponds. It was felt that all nine of these grow-out ponds needed to be full of water and "in production" simultaneously in order to rear the numbers of fish specified in the two augmentation plan addendums (Ryden 2003b, 2005a). The lack of surplus ponds that could be used for either rotating groups of fish out of ponds when there was a problem (e.g., heavy vegetation, fish kill) or in which to put fish that were too small to PIT tag and stock from a pond that had been drained and harvested made the annual draining of ponds for fish harvest highly problematic. Additionally, since ponds are supplied with water out of the NAPI canal system. This water source is not available for four to five months of the year (usually mid-November through early March) and when it is available, the lateral pipelines that feed the SJRIP grow-out ponds work via gravity flow, which tends to make filling ponds a long, slow process. Thus annually draining and refilling nine grow-out ponds becomes an unfeasible option. Third, as mentioned earlier in this report, the SJRIP has no hatchery facilities of its own with which it can produce razorback sucker for stocking, whether it be directly into the San Juan River or into the SJRIP's grow-out ponds. It was not until 2005 that the SJRIP established a contract with Dexter NFH&TC to annually supply larger fish for stocking into grow-out ponds (Hamman and Ulibarri 2006). Additionally, it was not until February 2006 that the SJRIP's Coordination Committee committed to a contract with two other USFWS hatcheries to supply fish > 300 mm TL for stocking directly into the San Juan River. So, prior to this time, the only consistently reliable source of razorback sucker available to the SJRIP were larval fish being supplied from the USFWS's 24-Road Hatchery (24-Road) in Grand Junction, CO. Unfortunately, to date none of the nine SJRIP grow-out ponds has ever produced harvestable-sized fish at anywhere near the expected level (500 lbs {227 kg} per surface acre). In retrospect, the passive, multiple year-class rearing strategy currently being employed by the SJRIP may not be the best answer, but at the time grow-out operations began (in 1999) this strategy was recommended by personnel from USFWS-CRFP (specifically Frank Pfeifer and Mike Baker) who were using it successfully in upper Colorado River basin (UCRB) grow-out ponds. This approach was also verbally approved of by the SJRIP-BC. Had the SJRIP grow-out ponds produced at the expected level of 500 lbs (227 kg) per surface acre, it would have been unnecessary to develop pond management guidelines or to contract with hatchery facilities to produce more and larger fish, but unfortunately, this has not been the case. An alternative, active technique for harvesting grow-out ponds (i.e., boat-mounted electrofishing) was considered, but was not implemented for two reasons. First, harvest, PIT-tagging and stocking of fish via passive methods is already very stressful on razorback sucker. It was felt that the additional stress that would be incurred via electrofishing would only help to elevate any delayed mortality that may already be occurring among razorback sucker post-stocking. Second, the SJRIP's grow-out ponds, like many small ponds in the southwest have relatively high conductivity, which makes effectively electrofishing these ponds extremely difficult. The depth of these ponds would also hinder the overall effectiveness of boat-mounted electrofishing.
13
Razorback sucker in grow-out ponds are currently passively-managed from the time they are stocked into grow-out ponds until the time harvest efforts occur. Fish feed on a natural diet found in the ponds. No supplemental feeding of these fish occurs. A consortium of personnel from the Bureau of Indian Affairs (BIA-NIIP; Farmington, NM), Keller-Bliesner Engineering (Logan, UT), Navajo DF&W (Window Rock, AZ) and Ecosystems Research Institute (Logan, UT) managed the SJRIP grow-out ponds (e.g., maintained water levels in the ponds, monitored pond water quality, fertilized the ponds) in 2005. In 2005, fish were harvested from grow-out ponds using fyke nets during four separate week-long harvest trips (in March, May, August, and September). Fish harvested from the SJRIP grow-out ponds were all stocked on the same day upon which they were harvested at a location immediately downstream of the Hogback Diversion (RM 158.6). All of these fish were individually-marked with 134 kilohertz (kHz) PIT tags before being released into the wild. In 2005, no razorback sucker from sources outside of the San Juan River basin were stocked into the San Juan River.
Grow-Out Ponds: Stocking West Avocet Pond West Avocet Pond was not stocked in 2005. This pond had been drained following a fish kill that occurred in May of 2004 (Appendices A and B). During the last half of 2004 and the first half of 2005 it remained dry, awaiting the award of a contract for dirt work and retro-fitting work. In late summer of 2005, the pond bottom was scraped of dead vegetation and organic-laden bottom sediments, re-graded, and retro-fitted with a gravity drain and kettle area. This pond was re-filled with water in the fall of 2005, just before the water was drained out of the NAPI canal system. As of April 2006, West Avocet Pond has no razorback sucker in it. East Avocet Pond East Avocet Pond was stocked with 17,248 larval (2005 year-class) razorback sucker on 2 June 2005 (Appendix A). These larval fish were from 17 different family lots (mixed in transit) from 24-Road. The parental lineage of these 17 family lots (as well as those of previous years' stockings from the 24-Road Hatchery) is recorded in the diagrams in Appendix C. East Avocet Pond has been stocked for seven consecutive years now (1999-2005). Between 1999 and 2005, fish from eight different year-classes (1997, 1999-2005) were stocked into this pond. Hidden Pond Hidden Pond was stocked with 18,040 larval (2005 year-class) razorback sucker on 2 June 2005 (Appendix A). These larval fish were from the same 17 family lots (mixed in transit) as those stocked into East Avocet Pond. All 18,040 fish were from the 24-Road Hatchery in Grand Junction, CO. The parental lineage of these 17 family lots (as well as those of previous years' stockings from the 24-Road Hatchery) is recorded in the diagrams in Appendix C. As of April 2006, Hidden Pond has fish two different year-classes in it (2004-2005).

14
6-Pack ponds All six of the 6-Pack ponds were stocked with larval (2005 year-class) razorback sucker on 2 June 2005 (Appendix A). 6-Pack pond #'s 1-5 were stocked with between 16,280 and 18,612 larval fish each (Appendix A). 6-Pack Pond # 6 received only 11,440 larvae, because it was the last of the nine grow-out ponds stocked and simply got what was left out of all the larvae stocked on 2 June 2005. All of these larval fish were from the same 17 family lots (mixed in transit) as those stocked into East Avocet Pond and Hidden Pond. All larval fish stocked into the 6-Pack ponds were from the 24-Road Hatchery in Grand Junction, CO. The parental lineage of these 17 family lots (as well as those of previous years' stockings from the 24-Road Hatchery) is recorded in the diagrams in Appendix C. As of April 2006, 6-Pack pond #'s 1, 5, and 6 have three different year-classes of fish in them, while 6-Pack pond #'s 2, 3, and 4 have four different year-classes of fish in them.
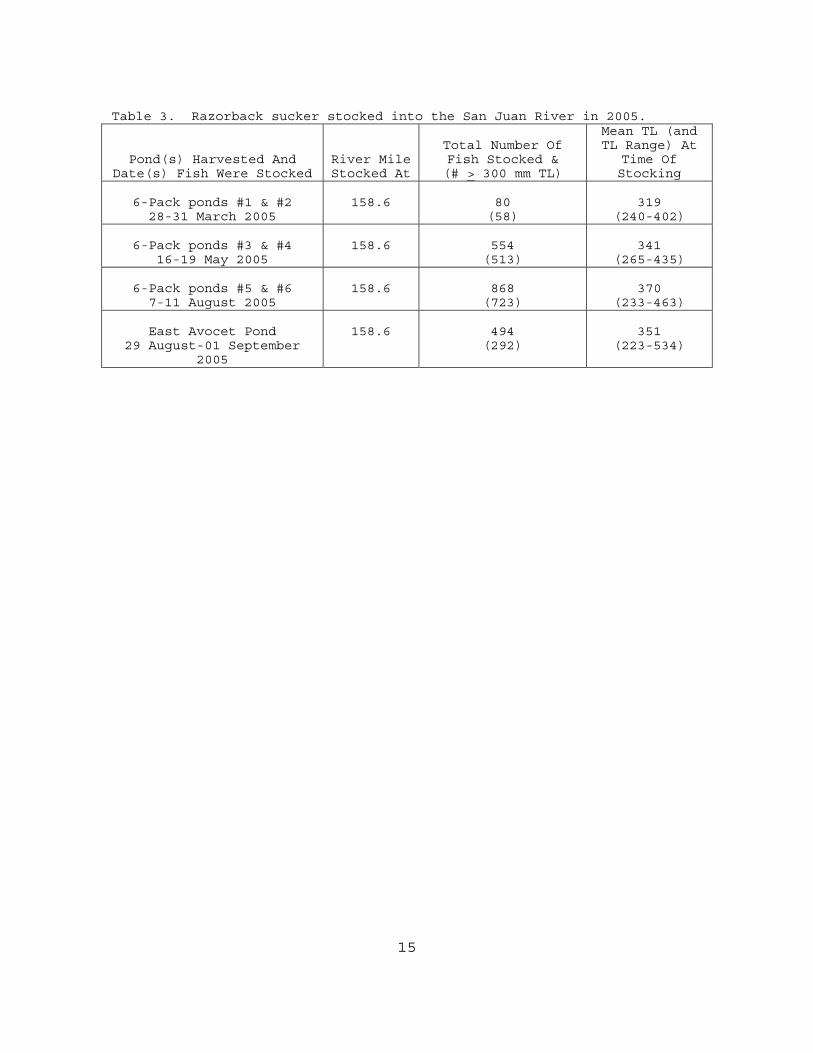
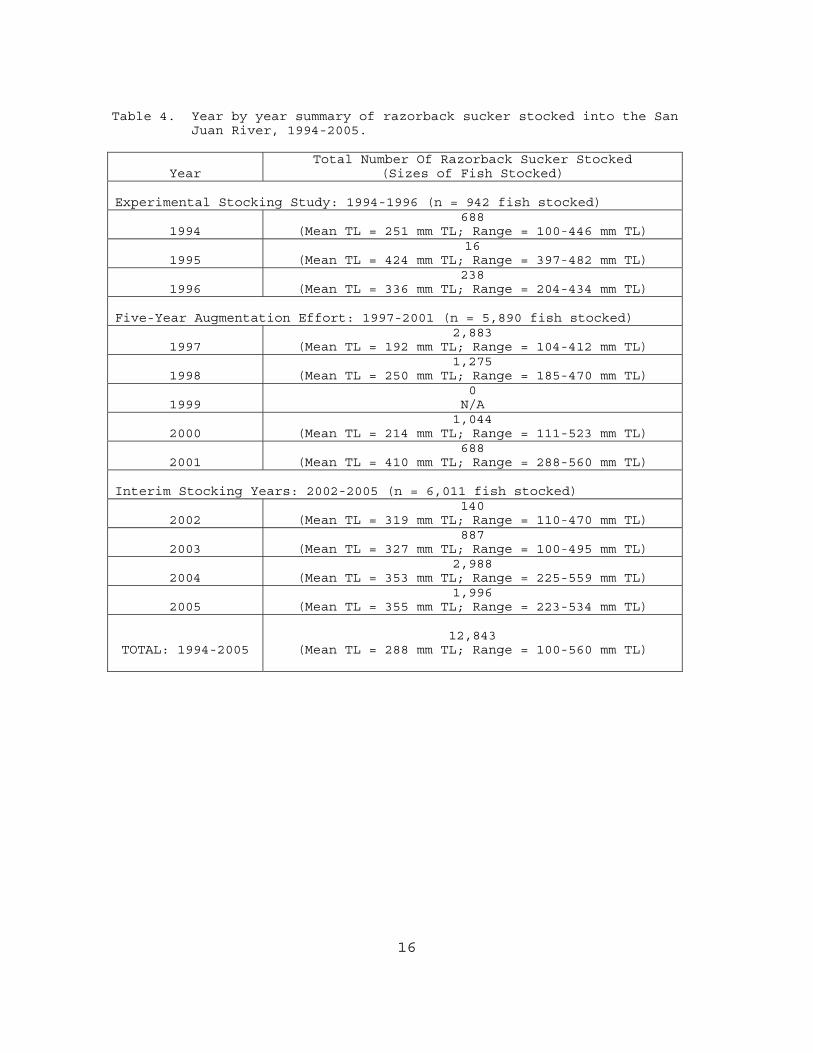
RESULTS In 2005, a total of 1,996 razorback sucker (mean TL = 355 mm; range = 223-534 mm TL) were stocked into the San Juan River (Table 3). All of the 1,996 stocked fish were harvested from the SJRIP=s grow-out ponds (Table 3). No razorback sucker from sources outside of the San Juan River basin were stocked in 2005. This was third largest group of razorback sucker, in terms of total numbers of fish, stocked in any single calendar year since augmentation efforts for this species began in 1994 (n = 2,988 in 2004; n = 2,883 in 1997; Table 4). However, this was the second largest group of razorback sucker, in terms of numbers of fish > 300 mm TL (1,586 {79.5%} of the 1,996 fish stocked in 2005 were > 300 mm TL) stocked into the San Juan River since 1994 (in 2004, mean TL = 353 mm TL, range = 225-559 mm TL -- 2,669 {89.3%} of which were > 300 mm TL; in 1997, mean TL = 192 mm, range = 104-412 mm TL – only 22 {0.8%} of which were > 300 mm TL; Table 3). So, since 1994 a total of 12,843 razorback sucker have been stocked into the San Juan River. Of the 12,843 total razorback sucker stocked into the San Juan River since 1994, 4,984 (38.8%) have been stocked in the last two years (2,988 {23.3%} in 2004 and 1,996 {15.5%} in 2005). Of the 12,843 total razorback sucker stocked since 1994, only 6,156 (47.9%) have been > 300 mm TL. Over two-thirds (n = 4,255 {69.1%}) of the 6,156 razorback sucker that have been stocked at > 300 mm TL since 1994 were stocked in 2004 (n = 2,669) and 2005 (n = 1,586). As discussed earlier, production from year to year has been highly variable among SJRIP grow-out ponds. Production of harvestable-sized fish from the seven SJRIP grow-out ponds harvested in 2005 was 102.2 fish per surface acre (Tables 2 and 5). This was the second highest "harvest yield" (number of fish per pond surface acre harvested) observed among SJRIP grow-out ponds (behind 232.2 fish per surface acre in 2004, n = 4 ponds yielding harvestable-sized fish), since the harvest limit of > 300 mm TL was implemented in 2001 (Table 5). The number of fish being harvested from SJRIP grow-out ponds in both 2004 and 2005 compares relatively favorably with the "harvest yield" observed among UCRB grow-out ponds over the last several years (Table 5), especially considering the large differences in the amount of surface acres being harvested in these two efforts.
15
Table 3. Razorback sucker stocked into the San Juan River in 2005.
Pond(s) Harvested And Date(s) Fish Were Stocked
River Mile Stocked At
Total Number Of Fish Stocked & (# > 300 mm TL)
Mean TL (and TL Range) At
Time Of Stocking
6-Pack ponds #1 & #2
28-31 March 2005
158.6
80
(58)
319
(240-402)
6-Pack ponds #3 & #4 16-19 May 2005
158.6
554
(513)
341
(265-435)
6-Pack ponds #5 & #6 7-11 August 2005
158.6
868
(723)
370
(233-463)
East Avocet Pond 29 August-01 September
2005
158.6
494
(292)
351
(223-534)
16
Table 4. Year by year summary of razorback sucker stocked into the San Juan River, 1994-2005.
Year
Total Number Of Razorback Sucker Stocked (Sizes of Fish Stocked)
Experimental Stocking Study: 1994-1996 (n = 942 fish stocked)
1994
688 (Mean TL = 251 mm TL; Range = 100-446 mm TL)
1995
16 (Mean TL = 424 mm TL; Range = 397-482 mm TL)
1996
238 (Mean TL = 336 mm TL; Range = 204-434 mm TL)
Five-Year Augmentation Effort: 1997-2001 (n = 5,890 fish stocked)
1997
2,883 (Mean TL = 192 mm TL; Range = 104-412 mm TL)
1998
1,275 (Mean TL = 250 mm TL; Range = 185-470 mm TL)
1999
0 N/A
2000
1,044 (Mean TL = 214 mm TL; Range = 111-523 mm TL)
2001
688 (Mean TL = 410 mm TL; Range = 288-560 mm TL)
Interim Stocking Years: 2002-2005 (n = 6,011 fish stocked)
2002
140 (Mean TL = 319 mm TL; Range = 110-470 mm TL)
2003
887 (Mean TL = 327 mm TL; Range = 100-495 mm TL)
2004
2,988 (Mean TL = 353 mm TL; Range = 225-559 mm TL)
2005
1,996 (Mean TL = 355 mm TL; Range = 223-534 mm TL)
TOTAL: 1994-2005
12,843
(Mean TL = 288 mm TL; Range = 100-560 mm TL)

17
Table 5. A comparison of annual production of razorback sucker harvested from UCRB versus SJRIP grow-out ponds.
Calendar Year
Number Of
Ponds Harvested
Number Of Pond Surface Acres
Harvested
Number Of
Fish Harvested
Number Of Fish Per Pond Surface
Acre: "Harvest Yield"
Upper Colorado River Basin (UCRB) Grow-Out Ponds: 2005 15 61.8 9,173 148.4 2004 16 63.8 7,828 122.7 2003 18 69.3 7,739 111.7 2002 11 42.3 4,900 115.8 2001 19 34.1 9,361 274.4 2000 16 25.7 11,263 439.1
San Juan Recovery Implementation Program (SJRIP) Grow-Out Ponds: 2005 7 19.5 1,996 102.2 2004 4 11.5 2,678 232.3 2003 7 20.2 754 37.3 2002 5 15.0 25 1.7 2001 3 9.7 376 38.8 2000 2 6.9 1,044 152.2 1999 0 0.0 0 0.0 1998 1 2.4 1,155 481.3
DISCUSSION The 1,996 razorback sucker stocked into the San Juan River in 2005 were the second largest group of razorback sucker > 300 mm TL to be stocked since augmentation efforts for this species began in 1994. Unfortunately, this total was still well short of the 11,400 fish called for in the 2003 augmentation plan addendum (Ryden 2003b). The failure of the SJRIP grow-out ponds to annually produce either the 11,400 fish called for in the augmentation plan addendum (Ryden 2003b) or 500 pounds (227 kg) of fish > 300 mm TL per surface acre is troublesome, but in hindsight, probably not totally unexpected. When all nine of the SJRIP grow-out ponds are in production, they have a total of 25.71 surface acres. If these ponds had all produced at the levels originally anticipated, the SJRIP should, theoretically, have been able to meet their annual stocking goal of 11,400 razorback sucker. However, in hindsight, several problems are inherent in this whole line of reasoning. First, there have only been four potential years (2002-2005) that razorback sucker could have been harvested from all nine grow-out ponds simultaneously. Unfortunately, during this four year period, there was never actually a time when more than seven of the nine grow-out ponds were "up and running" and yielding harvestable-sized fish at the same time. Production losses due fish kills, retrofitting work, and predation by birds and tiger salamanders has made harvesting large numbers of razorback sucker > 300 mm TL impossible. Second, until 2006, the SJRIP lacked large-scale alternative sources of post-larval fish for use in stocking, either directly into the San Juan River or into the SJRIP grow-out ponds. To date the only reliable and consistently accessible source of razorback sucker available to the SJRIP has been surplus larval fish from the 24-Road Hatchery. This has made any attempt to make up for stocking shortfalls from the SJRIP grow-out ponds impossible. Third, the SJRIP has done no active management of
18
SJRIP grow-out ponds (e.g., supplemental feeding, aeration of ponds, predator control). Even if the SJRIP had active pond management in place, it lacks any surplus ponds into which groups of razorback sucker can be moved and/or rotated. Additionally, the SJRIP lacks the ability to quickly drain seven of its nine grow-out ponds, because of the way in which the ponds were originally constructed, either for emergencies or for harvest purposes. While it is easy to look back and, in hindsight, see the many problems inherent in trying to rear razorback sucker for the SJRIP with this system, it must be remembered that the razorback sucker augmentation effort in the San Juan River came about at roughly the same time as and was heavily based upon a similar razorback sucker augmentation program that was taking place simultaneously in the UCRB. This same type of passive pond management, using passive harvest techniques on ponds containing multiple year-classes of fish has been employed near Grand Junction, CO for the past eight years or so. One of the major differences is that the UCRB program has considerably more pond acreage -- 15 ponds totaling 61.8 surface acres in 2005 (Table 5; USFWS-CRFP unpublished data). This is over three times the amount of pond space available to the SJRIP, if all nine of the SJRIP grow-out ponds were in production simultaneously, which they never have been. The UCRB also has a fully-staffed, indoor, intensive-culture hatchery facility (24-Road) specifically dedicated to rearing razorback sucker for stocking, both directly into the river and into UCRB grow-out ponds. The presence of this hatchery facility makes stocking larval fish into the UCRB ponds unnecessary. Razorback sucker to be stocked into UCRB ponds are held in the 24-Road facility until they are 8"-10" (200-250 mm TL) and then stocked either directly into the river or into grow-out ponds (USFWS-CRFP unpublished data). Being able to stock 8"-10" fish has raised the percent of harvest return (i.e., the number of fish harvested versus number of fish originally stocked) to as high as 77% in some UCRB grow-out ponds (range = 0.24%-77.00%; USFWS-CRFP unpublished data), as opposed to the 0.5% (or less) harvest return seen in SJRIP grow-out ponds when utilizing larval fish to stock grow-out ponds and using a target harvest size of > 300 mm TL. A total of 15,818 razorback sucker were stocked into UCRB rivers in 2005 (USFWS-CRFP unpublished data). Of that 15,818 fish, some 42.0% (n = 6,645 fish) were stocked directly from the 24-Road hatchery facility into the river, the remainder (n = 9,173; 58.0%) came from the 61.8 acres of UCRB grow-out ponds (USFWS-CRFP unpublished data). These 61.8 acres of grow-out ponds (n = 15 ponds) were harvested over a period of approximately ten work weeks (i.e., roughly 50 days; R. Smaniotto, pers. comm.). In comparison, the SJRIP effort is annually scheduled for 4-5 work weeks per year (or roughly 20-25 days). In 2005, UCRB grow-out ponds had a harvest yield of 148.43 fish per surface acre (Table 5). However, there was considerable variation in yields among UCRB grow-out ponds (range = 0.92-524.67 fish per acre; USFWS-CRFP unpublished data). In comparison, the SJRIP grow-out ponds yielded 2,678 fish from 11.5 surface acres in 2004 (a harvest yield of 232.3 fish per pond surface acre; Table 5) and 1,996 fish from 19.5 surface acres in 2005 (a harvest yield of 102.2 fish per pond surface acre; Table 5). The 2005 harvest yield value for SJRIP grow-out ponds is very close to that observed among UCRB grow-out ponds since 2002, while the harvest yield value for 2004 among SJRIP grow-out ponds is actually better than that observed among UCRB ponds since 2002 (Table 5). The stocking goal for the UCRB is 14,000 razorback sucker annually. This target number is not considerably different from the SJRIP's own stocking goal of 11,400 fish annually. The UCRB met their stocking goal of 14,000 razorback sucker for the first time in 2005 (R. Smaniotto, per. comm.). Interestingly, despite the considerable amount of grow-out pond acreage available to the UCRB, this stocking goal would not have been met in 2005 had it not been for the supplemental stocking of the 6,645 razorback sucker that had been reared in the 24-Road Hatchery.

19
The number of SJRIP grow-out ponds that have yielded harvestable-sized fish in any given calendar year has varied from four to seven ponds, but has never included all nine of the SJRIP grow-out ponds in the same calendar year. The number of harvestable-sized fish available from any given pond has also varied greatly from year to year. The number of fish harvested in a given year from a given SJRIP grow-out pond seems to have absolutely no bearing on what kind of harvest yield might be expected from that same pond the following year. Almost certainly, some of this variability can be directly blamed on the use larval fish in stocking the SJRIP grow-out ponds. Larval fish are highly susceptible to a whole range of adverse impacts (e.g., predation, water quality, slight changes in food availability) that can cause large-scale losses in numbers of fish at this life stage. The larger (8"-10") fish being used to stock the UCRB ponds are almost certainly able to weather these types of adverse impacts with greater success. However, until 2006, there was no other alternative for obtaining large numbers fish to annually stock ponds. Another cause for the variability observed among SJRIP grow-out ponds could very well be the fact that most of these ponds (the 6-Pack ponds and Hidden Pond) are relatively young ponds that lack many of the features that make older, more mature ponds (like East Avocet Pond) successful rearing environments. These include things such as well-developed shoreline vegetation communities (to block the winds and preclude predation by wading birds), large stands of aquatic macrophytes (to provide cover and food), and a well-developed zooplankton and phytoplankton communities (to provide food). As would be expected, observations made among UCRB grow-out ponds indicate that older, more mature ponds are more successful in rearing large numbers of healthy fish than are newly-constructed, essentially sterile ponds (R. Smaniotto, pers. comm.). Some of the most successful among UCRB grow-out ponds are the ponds that are fed by ground water directly from the Colorado River (R. Smaniotto, pers. comm.). This is a situation that cannot be duplicated among SJRIP grow-out ponds. Recently, the UCRB has greatly increase the success of rearing fish in four of their more poorly performing grow-out ponds (that are about one surface acre each) by adding both aerators and automatic belt feeders to them. If all nine of the existing SJRIP grow-out ponds could be made to simultaneously produce consistent numbers of harvestable-sized fish from year to year, then the SJRIP could certainly come much closer to meeting their annual stocking goal of 11,400 fish > 300 mm TL. However, viewed in comparison to the UCRB's razorback sucker augmentation effort, it becomes relatively clear that the SJRIP will have to either greatly expand its pond rearing program and/or add supplemental sources of fish from hatchery facilities in order to meet that annual stocking goal. When compared to the UCRB, the SJRIP has had a comparatively limited amount of resources (e.g., time, money, manpower, facilities) available to dedicate to its razorback sucker augmentation effort. However, even though the resources being applied to SJRIP's razorback sucker augmentation effort have been comparatively limited (compared to the UCRB), they have been relatively consistent from year to year (in terms of time, money, and manpower). Unfortunately this consistent approach has not yielded a consistent or predictable number of fish from year to year, due to the unpredictability of the facilities (i.e., the nine SJRIP grow-out ponds). Yet, even given all of the drawbacks and setbacks in the SJRIP's razorback sucker augmentation program, the SJRIP has been successful in stocking this species in 11 of the last 12 calendar years. Many of these stocked fish have retained and survived in the mainstem San Juan River, with some being collected as long as nine years post-stocking (Ryden 2006a). Numbers of razorback sucker collected on annual fall fish community monitoring trips have greatly increased in 2004 and 2005 compared to previous years, to the point where razorback sucker were collected in 22.0% and 13.3% of all
20
electrofishing collections, respectively (Ryden 2006a). These stocked fish have located one another and suitable habitat and successfully spawned for eight consecutive years (see Chapter 2 of this report). In addition, age-1+ razorback sucker have been collected in the San Juan River, indicating that at least some of the progeny of the relatively few stocked fish are beginning to recruit (see Chapter 2 of this report). Without a doubt, the SJRIP's razorback sucker augmentation efforts have been frustrating, in terms of shortfalls in numbers of fish stocked annually. However, there have also been several encouraging successes, especially given the shortfalls in numbers of fish stocked annually. In past years, the annual contribution of fish that are reared at the Page Golf Course ponds by UDWR-Wahweap has been a great boon to the SJRIP's razorback sucker augmentation effort. This cooperative effort should continue to be fostered by the SJRIP.
21
CHAPTER 2: MONITORING OF STOCKED RAZORBACK SUCKER
Objective 2: Monitor stocked razorback sucker in the wild for various
parameters, including: a) Spawning season habitat use and movement patterns b) Survival and growth rates c) Determine whether hatchery-reared razorback sucker will
recruit into the adult population and successfully spawn in the wild
METHODS
Field Sampling Monitoring of stocked razorback sucker was done actively via raft-borne electrofishing. In addition, recaptures of razorback sucker from other San Juan River studies were used to help strengthen the razorback sucker monitoring data set for purposes of data analysis. Thanks go to those researchers that forwarded their data to me and gave their permission for its inclusion in these analyses. Electrofishing The study area for razorback sucker monitoring started at RM 158.6 (Hogback Diversion) and continued downstream to RM 2.9 (Clay Hills boat landing). Razorback sucker monitoring was performed on 19 April 2005 as well as during the week of 26-30 April 2005. Crews from USFWS's New Mexico Fisheries Resources (USFWS-NMFRO) office in Albuquerque, NM (supervised by Jason Davis) performed razorback sucker monitoring from RM 158.6-147.9, while they were engaged in their regularly-scheduled nonnative fish removal trip. Personnel from USFWS-CRFP (supervised by Dale Ryden) performed razorback sucker monitoring from RM 147.9-76.4). Personnel from the UDWR’s native fishes field station in Moab, UT (supervised by Julie Jackson) performed razorback sucker monitoring in the downstream sections of the San Juan River (RM 52.9-2.9), while they were engaged in their regularly-scheduled nonnative fish removal trip. This was done to avoid redundant sampling and to eliminate excess stress on the fish in each section of the river that would have been caused by sampling in consecutive weeks. During razorback sucker monitoring trips, the following sampling protocol was used. Electrofishing proceeded downstream in a continuous fashion from put-in to take-out with two electrofishing rafts. One netter stood on an elevated platform above the anodes and collected fish as they were drawn into the electrical field. The raft operator maneuvered the boat via oars, monitored the Variable Voltage Pulsator (VVP), and made adjustments to current, voltage, amperage, frequency, and pulse width when necessary. Rafts were oriented perpendicular to the shoreline whenever possible, with the anode nearest the shoreline. When this orientation of the boat was not possible (due to slack water or upstream wind), the raft was rowed downstream parallel to the shoreline, keeping it within one oar-length of the shoreline at all times. One raft shocked along each shoreline of the river, breaking off into

22
large secondary channels, when they were accessible. Particular mid-channel features such as debris piles, cobble bars, and island shorelines were also shocked when they were present at the raft operator=s discretion. The study area was divided into two-RM sections. Electrofishing crews began at the upstream end of a section and collected all of the stunned fish that they could net as they shocked downstream. One RM was skipped between each two-RM electrofishing section (i.e., sampling crews shocked two out of every three RM’s), so that sampling methodology would provide data that was comparable to that collected on the fall Sub-Adult And Adult Large-Bodied Fish Community Monitoring trip (i.e., “Adult Monitoring” for short). At the end of each two-RM section, all non-rare fishes collected were enumerated by species and age-class. All nonnative fish species collected during sampling were removed from the river, in support of the nonnative removal efforts (Objective 3 of the FY-2005 workplan). Common native fishes were returned alive to the river. Captured specimens of rare native fish (razorback sucker, Colorado pikeminnow, and roundtail chub) were anesthetized using MS-222 (200 mg/L of water), weighed, measured, checked for both an old (400 kHz) and a new (134 kHz) PIT tag, and examined for general health and reproductive status (if apparent). If no new (134 kHz) PIT tag was detected, one was implanted. River mile of capture (to the nearest 0.1 RM) was noted, if specifically known. In many electrofishing samples the crew was unaware that they had collected a rare fish until the end of the sample when fish were being sorted. In these instances, the exact collection location was impossible to determine, so the RM of release was used in lieu of the actual capture RM. All rare native fishes were returned alive to the river after data collection was complete. Razorback sucker were also recaptured incidentally via electrofishing, seining, cast-netting, and trammel-netting during sampling trips for other SJRIP-approved studies and monitoring efforts, as well as in the PNM Fish Ladder. If these capture data were forwarded to me, I used them to help support and strengthen our razorback sucker data sets, especially for determining growth. Razorback sucker that had been recaptured two or more times since their date of stocking were used to examine movement patterns. The reason for using fish recaptured more than once was to try to examine fish that had adapted to living in the river and were displaying Anatural@ behaviors. Based on previous data, large initial downstream displacements observed among radiotelemetered razorback sucker after stocking were usually followed by fish demonstrating the ability to maintain their relative position in the river with many even moving back upriver (Ryden 2000a). Since only two data points were available for first-time recaptures, it could not be determined if these fish were still in the process of that initial downstream displacement or had already adjusted to riverine conditions.
Data Analysis Objective 2a: Spawning Season Habitat Use And Movement Patterns Generalized movement patterns were analyzed among PIT-tagged fish that had been recaptured for the second (or more) time since stocking. These general movements were used to examine short-term dispersal of stocked fish, as well as long-term movements that might reveal preferred areas or sections of the river. Longitudinal distribution of all razorback sucker recaptured in a given year was also examined to examine the within-year distribution of the razorback sucker population in the San Juan River.
23
Objective 2b: Survival And Growth Rates Survival Catch per unit effort (CPUE = number of fish per hour {hr} of electro-fishing) can give an indirect indication of population size (i.e., the greater the CPUE, the greater the relative population size). By tracking the CPUE trend over time, it should be possible to determine whether the razorback sucker population is increasing or decreasing in number. If this metric is increasing over time, it is indicative of one of two possibilities. First, either stocked fish are surviving post-stocking and the population is growing based on multiple year-classes of fish. The other possibility is that stocked fish are not surviving and increasingly larger numbers young fish are being stocked each year, thus making the likelihood of recapturing a newly-stocked fish more and more likely. In order to determine whether an increasing CPUE is indicative of a multiple year-class population or not, an attempt was made to examine how long fish from the various stockings since 1994 were remaining in the San Juan River razorback sucker population. This was done by examining the number of days a recaptured fish had been in the river since stocking versus the percent of total recaptures represented by that fish. Using this metric, it was possible to determine what percentage of the San Juan River razorback sucker population within a given year was composed of older versus more recently-stocked fish. To make this particular data set more robust, recaptures of razorback sucker from all SJRIP studies for which I had data in a given year were used. A few recaptures could not be used in this analysis due to lack of a detectable PIT tag at the time of recapture. This analysis (days post-stocking versus percent of total recaptures) was used in lieu of a length-frequency histogram analysis of the San Juan River razorback sucker population for a couple of reasons. First, we know that there is essentially no wild razorback sucker population in the San Juan River. Because of this, the current razorback sucker population is based exclusively around larger (> 300 mm TL), stocked fish or their age-0 offspring. Until these age-0 fish begin to recruit into the juvenile and sub-adult age classes, measuring the health of this population based on size-structure will essentially be useless. Thus, the closest thing to a measure of population health and viability we currently have is going to be the occurrence and longevity of stocked adult and large sub-adult fish and the presence/absence and relative abundance of their larval offspring (being monitored by a separate study element). Schnabel population estimates (using Bailey=s modification for low numbers of recaptured fish; Van den Avyle 1993) were performed for spring razorback sucker monitoring trips and fall Adult Monitoring trips, for 1995-2004, to determine the size of the razorback sucker population in the common sampled area of the San Juan River, i.e., RM 158.6-76.4. Population estimate values were then extrapolated to Ariverwide@ (RM 158.6-2.9) estimates based on the population estimate value versus the mean percentage of total razorback sucker recaptures that occurred in the common sampled area (RM 158.8-76.4)of the San Juan River (i.e., 88.3%) on fall sampling trips, which sampled from RM 158.6-2.9, 1995-2005. In other words to extrapolate the Petersen or Schnabel estimate to the larger area:
(population estimate value/88.3)*(100) = the Ariverwide@ estimate

24
Razorback sucker recapture data collected on four consecutive USFWS-CRFP monitoring trips (a time period spanning approximately 18 calendar months; following Ryden 2005b) were used to generate numbers for the Schnabel multiple-census population estimates (Van den Avyle, M. J. 1993). Growth Growth was determined from measurements of recaptured fish. Growth rate trends for recaptured fish stocked in distinct 10-mm total length (TL) size-class groupings were compared. Mean TL (and range) was determined for age at recapture and used to plot a growth curve for TL at age. Absolute and relative increases in TL (Van den Avyle 1993) were determined for distinct one-year growth periods. Objective 2c: Determine Whether Hatchery-Reared Razorback Sucker Will Recruit Into The Adult Population And Successfully Spawn In The Wild Recaptured razorback sucker were examined to determine reproductive status and age (via PIT tag number). Those fish that were freely expressing gametes (i.e., were ripe) or had visible tuberculation present were considered to be mature, sexually active fish. Aggregations of three or more ripe, adult male razorback sucker during the spawning season were considered to be suspected spawning aggregations. Aggregations of two or more razorback sucker were considered to be likely spawning aggregations, if both ripe male and ripe female fish were documented as being present. Suspected spawning areas were identified as those areas at which aggregations of ripe, adult razorback sucker were observed. Likely spawning areas were identified as those areas at which aggregations of ripe, adult razorback sucker were observed in more than one calendar year.
25
RESULTS
Objective 2a: Spawning Season Habitat Use And Movement Patterns Razorback sucker recaptured during the 2005 razorback sucker monitoring trips were, in most cases, spatially separated from one another and were recaptured from a variety of habitat types. Most of the areas from which razorback sucker were collected were low-velocity habitat types, including shallow shoreline shoals, shoreline pools and slackwaters, slackwater/eddy zones at the downstream ends of islands where the secondary and main channels rejoined, and edge pools just downstream and to the sides of adjacent constrictions in the river channel that formed fast-flowing chute channels. A few razorback sucker were also collected from higher velocity habitat types, including cobble riffles and cobble shoals (usually < 2 ft. deep) in and around island complexes or just upstream of where the entire river channel broke laterally across a long, diagonally-oriented cobble bar. Substrate types over which razorback sucker were collected also varied. Substrates in deeper and slower velocity habitats tended to be either silt or sand, while those in higher-velocity habitats tended to be of either embedded or clean cobbles. While no closely-associated aggregations of two or more ripe razorback sucker were observed during the spring 2005 razorback sucker monitoring trip, sampling apparently occurred in very close temporal proximity to razorback spawning. This was apparent from the high number of gravid and/or ripe (i.e., freely expressing eggs) female razorback sucker collected. Gravid female razorback sucker can be identified by their swollen vents, large, flaccid abdomens and the dry, "sticky" feel of their caudal peduncle (T. Bingham, pers. comm., pers. obs.). When two or more of these indicators is present, it usually means that female razorback sucker are within just a few days of spawning (T. Bingham, pers. comm., pers. obs.). Ripe, female razorback sucker will freely express eggs with just very slight pressure being applied to their abdomen. Both of these conditions together usually last for a very short period of time (< 2 weeks) in any given female razorback sucker. Thus when gravid and/or ripe female razorback sucker are collected, especially in any numbers, it is usually a good indicator that spawning season is either occurring or will occur soon. Conversely, tuberculate and/or ripe male razorback sucker are commonly collected throughout much of the calendar year. In most years, few gravid and/or ripe female razorback sucker were collected during the spring razorback sucker monitoring trip. During the 2004 razorback sucker monitoring trip, only three (4.8%) of 62 razorback sucker collected could be positively identified as being female fish (Ryden 20005b). This percentage of fish that can be positively identified as females is fairly typical for most spring razorback sucker monitoring trips. Conversely, in 2005, 18 (25.4%) of 71 razorback sucker collected could be positively identified as females (Table 6). Of these 18 females, four were ripe fish. To put this in perspective, on spring razorback sucker monitoring trips from 1998-2005 (a total of eight years), 52 positively-identified female razorback sucker have been collected – nine of these fish were ripe. Of those 52 females, 18 (34.6%) were collected in 2005. Of the nine ripe female razorback sucker collected since 1998, four (44.4%) were collected in 2005. Thirteen of the 71 razorback sucker that were collected on the spring 2005 razorback sucker monitoring trip were positively identified as male fish (Table 6). All thirteen of these fish had tubercles. Nine of the 13 were ripe (freely expressing milt). The other 40 razorback sucker were of indeterminate sex (Table 6).

26
Table 6. Razorback sucker collected from the San Juan River during the
April 2005 razorback sucker monitoring trip (n = 71).
Date Of Capture
PIT Tag Numbers
Radio Tag
Total Length (mm)
Weight (g)
Sexa
Ending RM Of The
Recapture Sample
Days In The
River Since
Stocking
04/19/2005 434F017C71
3D91BF18D7359
NONE
400
630 I
158.0
236
04/19/2005
43651E0F28 3D91BF18D5F98
NONE
428
660
I
158.0
238
04/19/2005
447B343B5D 3D91BF1D86831
NONE
390
350
I
157.8
279
04/19/2005
4368771717 3D91BF1A05E82
NONE
420
600
I
157.7
238
04/19/2005
4368550D6B 3D91BF1CDE29
NONE
400
600
I
157.0
239
04/19/2005
447F213210 3D91BF1E907D2
NONE
360
495
I
156.0
280
04/19/2005
NO OLD PIT TAG 3D91BF1D8B5E3
NONE
395
600
I
156.0
UNKNOWNb
04/19/2005 4369377E0D
3D91BF18D0B55
NONE
493
1560 I
155.7
239
04/19/2005
450406611D 3D91BF18D0DF6
NONE
422
740
I
155.7
279
04/19/2006
450B127823 3D91BF18BA386
NONE
408
660
I
155.7
279
04/19/2005
4365727573 3D91BF1D8BB3F
NONE
430
780
I
154.0
236
04/19/2005
4366075058 3D91BF1CD65CF
NONE
404
620
I
154.0
239
04/19/2005
4368570916 3D91BF1AF91CB
NONE
414
630
I
154.0
238
04/19/2005
44184244357 3D91BF1E99F38
NONE
445
1260
I
154.0
236
04/19/2005
43687F4B1B 3D91BF1D876EA
NONE
427
754
M tb
153.5
239
04/19/2005
4365406028 3D91BF1E9152F
NONE
410
680
I
153.3
239
04/19/2005
4419233E2A 3D91BF1A030B3
NONE
431
920
M tb
151.1
236
04/19/2005
45032E3953 3D91BF1D87499
NONE
386
500
I
151.1
279
04/19/2005
4416781603 3D91BF1E9171D
NONE
382
680
I
151.0
236
04/19/2005
4507601951 3D91BF1E9228F
NONE
411
850
I
150.0
280
04/19/2005
NO OLD PI TAG 3D91BF1A0367F
NONE
295
280
I
150.0
UNKNOWNb a: F = Female; M = Male; I = Indeterminate; tb = tubercles; r = ripe b: This fish had no detectable "old" (i.e., 400 kHz) PIT tag at the time of
recapture. Therefore the number of days this fish had been in the river since stocking could not be determined. A new (i.e., 134 kHz) PIT tag was implanted in this fish before it was returned to the river.
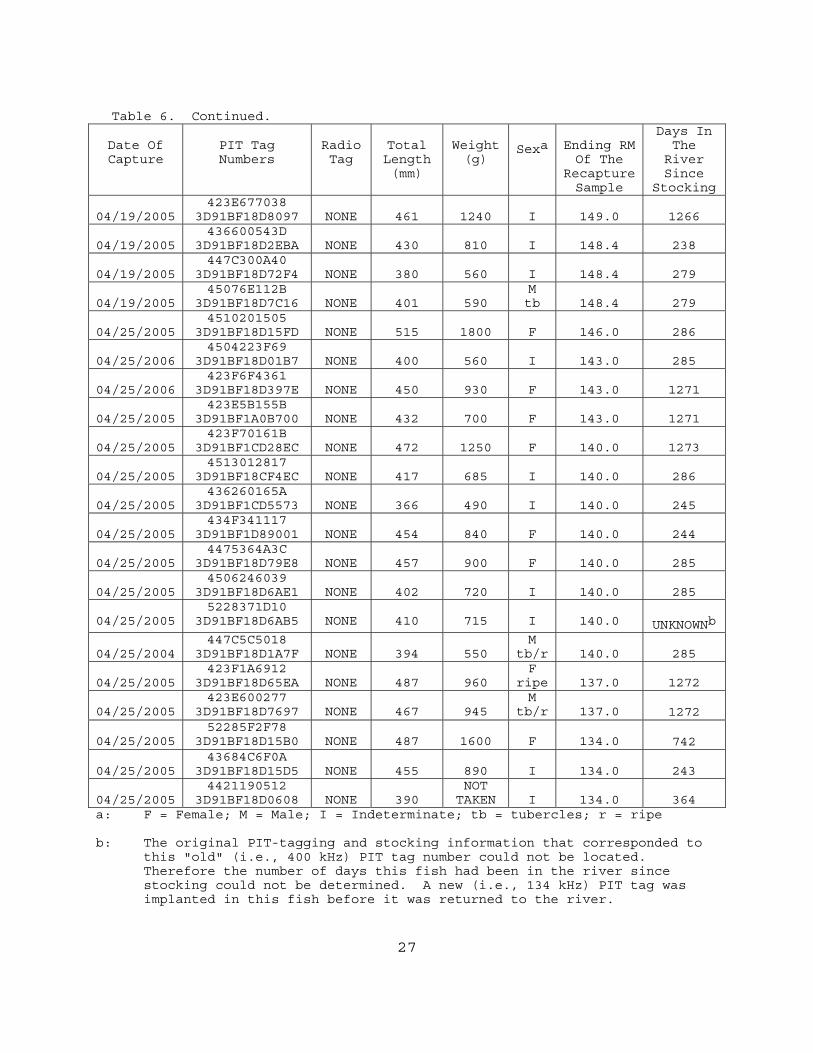
27
Table 6. Continued.
Date Of Capture
PIT Tag Numbers
Radio Tag
Total Length (mm)
Weight (g)
Sexa
Ending RM Of The
Recapture Sample
Days In The
River Since
Stocking
04/19/2005 423E677038
3D91BF18D8097
NONE
461
1240 I
149.0
1266
04/19/2005
436600543D 3D91BF18D2EBA
NONE
430
810
I
148.4
238
04/19/2005
447C300A40 3D91BF18D72F4
NONE
380
560
I
148.4
279
04/19/2005
45076E112B 3D91BF18D7C16
NONE
401
590
M tb
148.4
279
04/25/2005
4510201505 3D91BF18D15FD
NONE
515
1800
F
146.0
286
04/25/2006
4504223F69 3D91BF18D01B7
NONE
400
560
I
143.0
285
04/25/2006
423F6F4361 3D91BF18D397E
NONE
450
930
F
143.0
1271
04/25/2005
423E5B155B 3D91BF1A0B700
NONE
432
700
F
143.0
1271
04/25/2005
423F70161B 3D91BF1CD28EC
NONE
472
1250
F
140.0
1273
04/25/2005
4513012817 3D91BF18CF4EC
NONE
417
685
I
140.0
286
04/25/2005
436260165A 3D91BF1CD5573
NONE
366
490
I
140.0
245
04/25/2005
434F341117 3D91BF1D89001
NONE
454
840
F
140.0
244
04/25/2005
4475364A3C 3D91BF18D79E8
NONE
457
900
F
140.0
285
04/25/2005
4506246039 3D91BF18D6AE1
NONE
402
720
I
140.0
285
04/25/2005
5228371D10 3D91BF18D6AB5
NONE
410
715
I
140.0
UNKNOWNb
04/25/2004 447C5C5018
3D91BF18D1A7F
NONE
394
550 M
tb/r
140.0
285
04/25/2005 423F1A6912
3D91BF18D65EA
NONE
487
960 F
ripe
137.0
1272
04/25/2005 423E600277
3D91BF18D7697
NONE
467
945 M
tb/r
137.0
1272
04/25/2005 52285F2F78
3D91BF18D15B0
NONE
487
1600 F
134.0
742
04/25/2005
43684C6F0A 3D91BF18D15D5
NONE
455
890
I
134.0
243
04/25/2005
4421190512 3D91BF18D0608
NONE
390
NOT TAKEN
I
134.0
364
a: F = Female; M = Male; I = Indeterminate; tb = tubercles; r = ripe b: The original PIT-tagging and stocking information that corresponded to
this "old" (i.e., 400 kHz) PIT tag number could not be located. Therefore the number of days this fish had been in the river since stocking could not be determined. A new (i.e., 134 kHz) PIT tag was implanted in this fish before it was returned to the river.
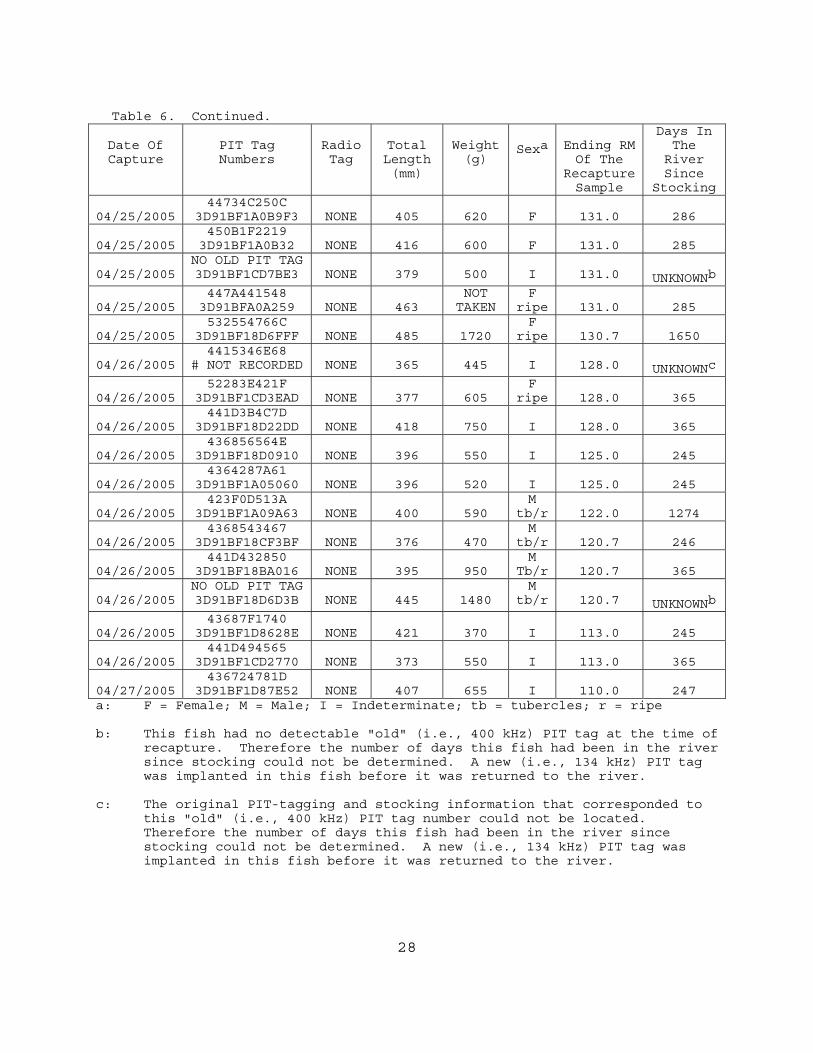
28
Table 6. Continued.
Date Of Capture
PIT Tag Numbers
Radio Tag
Total Length (mm)
Weight (g)
Sexa
Ending RM Of The
Recapture Sample
Days In The
River Since
Stocking
04/25/2005 44734C250C
3D91BF1A0B9F3
NONE
405
620 F
131.0
286
04/25/2005
450B1F2219 3D91BF1A0B32
NONE
416
600
F
131.0
285
04/25/2005
NO OLD PIT TAG 3D91BF1CD7BE3
NONE
379
500
I
131.0
UNKNOWNb
04/25/2005 447A441548
3D91BFA0A259
NONE
463 NOT
TAKEN F
ripe
131.0
285
04/25/2005 532554766C
3D91BF18D6FFF
NONE
485
1720 F
ripe
130.7
1650
04/26/2005 4415346E68
# NOT RECORDED
NONE
365
445 I
128.0
UNKNOWNc
04/26/2005 52283E421F
3D91BF1CD3EAD
NONE
377
605 F
ripe
128.0
365
04/26/2005 441D3B4C7D
3D91BF18D22DD
NONE
418
750 I
128.0
365
04/26/2005
436856564E 3D91BF18D0910
NONE
396
550
I
125.0
245
04/26/2005
4364287A61 3D91BF1A05060
NONE
396
520
I
125.0
245
04/26/2005
423F0D513A 3D91BF1A09A63
NONE
400
590
M tb/r
122.0
1274
04/26/2005
4368543467 3D91BF18CF3BF
NONE
376
470
M tb/r
120.7
246
04/26/2005
441D432850 3D91BF18BA016
NONE
395
950
M Tb/r
120.7
365
04/26/2005
NO OLD PIT TAG 3D91BF18D6D3B
NONE
445
1480
M tb/r
120.7
UNKNOWNb
04/26/2005 43687F1740
3D91BF1D8628E
NONE
421
370 I
113.0
245
04/26/2005
441D494565 3D91BF1CD2770
NONE
373
550
I
113.0
365
04/27/2005
436724781D 3D91BF1D87E52
NONE
407
655
I
110.0
247
a: F = Female; M = Male; I = Indeterminate; tb = tubercles; r = ripe b: This fish had no detectable "old" (i.e., 400 kHz) PIT tag at the time of
recapture. Therefore the number of days this fish had been in the river since stocking could not be determined. A new (i.e., 134 kHz) PIT tag was implanted in this fish before it was returned to the river.
c: The original PIT-tagging and stocking information that corresponded to
this "old" (i.e., 400 kHz) PIT tag number could not be located. Therefore the number of days this fish had been in the river since stocking could not be determined. A new (i.e., 134 kHz) PIT tag was implanted in this fish before it was returned to the river.
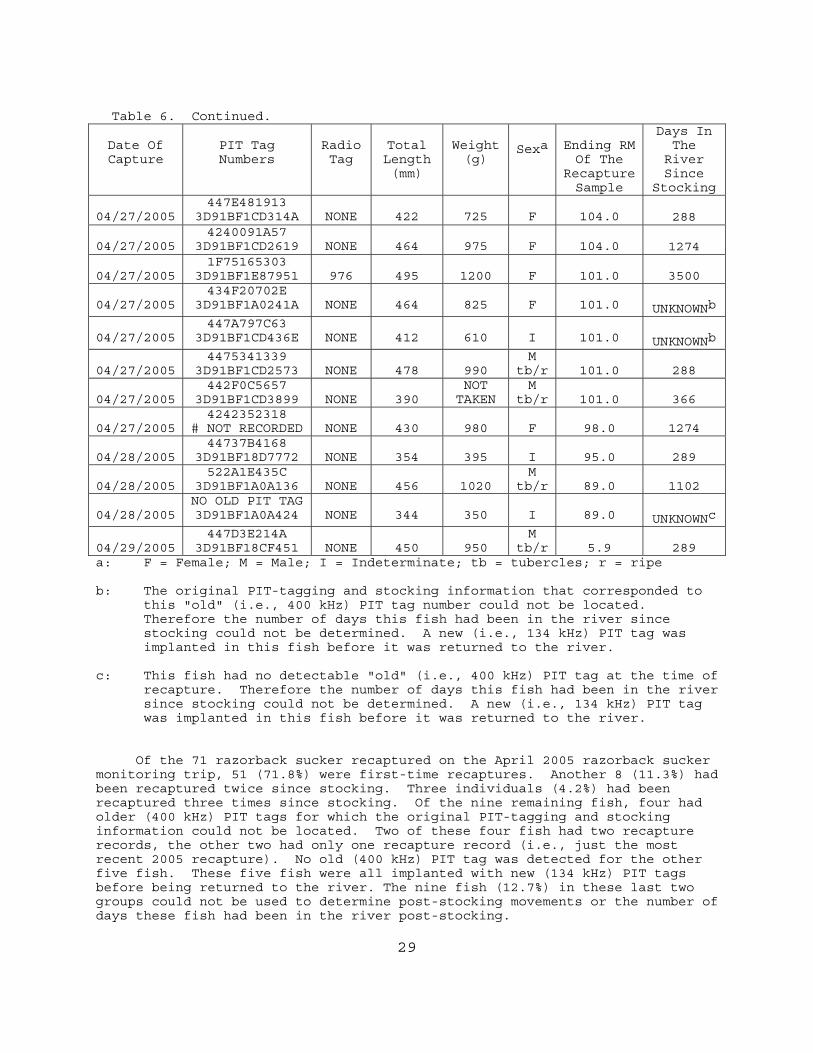
29
Table 6. Continued.
Date Of Capture
PIT Tag Numbers
Radio Tag
Total Length (mm)
Weight (g)
Sexa
Ending RM Of The
Recapture Sample
Days In The
River Since
Stocking
04/27/2005 447E481913
3D91BF1CD314A
NONE
422
725 F
104.0
288
04/27/2005
4240091A57 3D91BF1CD2619
NONE
464
975
F
104.0
1274
04/27/2005
1F75165303 3D91BF1E87951
976
495
1200
F
101.0
3500
04/27/2005
434F20702E 3D91BF1A0241A
NONE
464
825
F
101.0
UNKNOWNb
04/27/2005 447A797C63
3D91BF1CD436E
NONE
412
610 I
101.0
UNKNOWNb
04/27/2005 4475341339
3D91BF1CD2573
NONE
478
990 M
tb/r
101.0
288
04/27/2005 442F0C5657
3D91BF1CD3899
NONE
390 NOT
TAKEN M
tb/r
101.0
366
04/27/2005 4242352318
# NOT RECORDED
NONE
430
980 F
98.0
1274
04/28/2005
44737B4168 3D91BF18D7772
NONE
354
395
I
95.0
289
04/28/2005
522A1E435C 3D91BF1A0A136
NONE
456
1020
M tb/r
89.0
1102
04/28/2005
NO OLD PIT TAG 3D91BF1A0A424
NONE
344
350
I
89.0
UNKNOWNc
04/29/2005 447D3E214A
3D91BF18CF451
NONE
450
950 M
tb/r
5.9
289 a: F = Female; M = Male; I = Indeterminate; tb = tubercles; r = ripe b: The original PIT-tagging and stocking information that corresponded to
this "old" (i.e., 400 kHz) PIT tag number could not be located. Therefore the number of days this fish had been in the river since stocking could not be determined. A new (i.e., 134 kHz) PIT tag was implanted in this fish before it was returned to the river.
c: This fish had no detectable "old" (i.e., 400 kHz) PIT tag at the time of
recapture. Therefore the number of days this fish had been in the river since stocking could not be determined. A new (i.e., 134 kHz) PIT tag was implanted in this fish before it was returned to the river.
Of the 71 razorback sucker recaptured on the April 2005 razorback sucker monitoring trip, 51 (71.8%) were first-time recaptures. Another 8 (11.3%) had been recaptured twice since stocking. Three individuals (4.2%) had been recaptured three times since stocking. Of the nine remaining fish, four had older (400 kHz) PIT tags for which the original PIT-tagging and stocking information could not be located. Two of these four fish had two recapture records, the other two had only one recapture record (i.e., just the most recent 2005 recapture). No old (400 kHz) PIT tag was detected for the other five fish. These five fish were all implanted with new (134 kHz) PIT tags before being returned to the river. The nine fish (12.7%) in these last two groups could not be used to determine post-stocking movements or the number of days these fish had been in the river post-stocking.
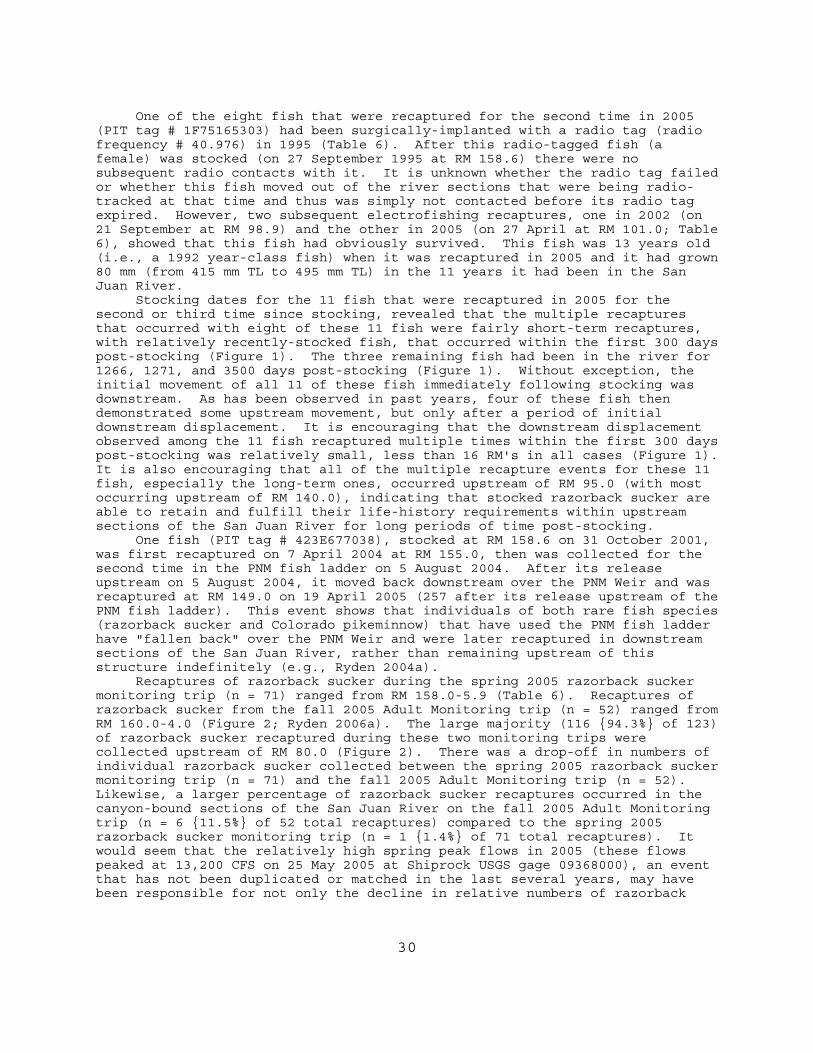
30
One of the eight fish that were recaptured for the second time in 2005 (PIT tag # 1F75165303) had been surgically-implanted with a radio tag (radio frequency # 40.976) in 1995 (Table 6). After this radio-tagged fish (a female) was stocked (on 27 September 1995 at RM 158.6) there were no subsequent radio contacts with it. It is unknown whether the radio tag failed or whether this fish moved out of the river sections that were being radio-tracked at that time and thus was simply not contacted before its radio tag expired. However, two subsequent electrofishing recaptures, one in 2002 (on 21 September at RM 98.9) and the other in 2005 (on 27 April at RM 101.0; Table 6), showed that this fish had obviously survived. This fish was 13 years old (i.e., a 1992 year-class fish) when it was recaptured in 2005 and it had grown 80 mm (from 415 mm TL to 495 mm TL) in the 11 years it had been in the San Juan River. Stocking dates for the 11 fish that were recaptured in 2005 for the second or third time since stocking, revealed that the multiple recaptures that occurred with eight of these 11 fish were fairly short-term recaptures, with relatively recently-stocked fish, that occurred within the first 300 days post-stocking (Figure 1). The three remaining fish had been in the river for 1266, 1271, and 3500 days post-stocking (Figure 1). Without exception, the initial movement of all 11 of these fish immediately following stocking was downstream. As has been observed in past years, four of these fish then demonstrated some upstream movement, but only after a period of initial downstream displacement. It is encouraging that the downstream displacement observed among the 11 fish recaptured multiple times within the first 300 days post-stocking was relatively small, less than 16 RM's in all cases (Figure 1). It is also encouraging that all of the multiple recapture events for these 11 fish, especially the long-term ones, occurred upstream of RM 95.0 (with most occurring upstream of RM 140.0), indicating that stocked razorback sucker are able to retain and fulfill their life-history requirements within upstream sections of the San Juan River for long periods of time post-stocking. One fish (PIT tag # 423E677038), stocked at RM 158.6 on 31 October 2001, was first recaptured on 7 April 2004 at RM 155.0, then was collected for the second time in the PNM fish ladder on 5 August 2004. After its release upstream on 5 August 2004, it moved back downstream over the PNM Weir and was recaptured at RM 149.0 on 19 April 2005 (257 after its release upstream of the PNM fish ladder). This event shows that individuals of both rare fish species (razorback sucker and Colorado pikeminnow) that have used the PNM fish ladder have "fallen back" over the PNM Weir and were later recaptured in downstream sections of the San Juan River, rather than remaining upstream of this structure indefinitely (e.g., Ryden 2004a). Recaptures of razorback sucker during the spring 2005 razorback sucker monitoring trip (n = 71) ranged from RM 158.0-5.9 (Table 6). Recaptures of razorback sucker from the fall 2005 Adult Monitoring trip (n = 52) ranged from RM 160.0-4.0 (Figure 2; Ryden 2006a). The large majority (116 {94.3%} of 123) of razorback sucker recaptured during these two monitoring trips were collected upstream of RM 80.0 (Figure 2). There was a drop-off in numbers of individual razorback sucker collected between the spring 2005 razorback sucker monitoring trip (n = 71) and the fall 2005 Adult Monitoring trip (n = 52). Likewise, a larger percentage of razorback sucker recaptures occurred in the canyon-bound sections of the San Juan River on the fall 2005 Adult Monitoring trip (n = 6 {11.5%} of 52 total recaptures) compared to the spring 2005 razorback sucker monitoring trip (n = 1 {1.4%} of 71 total recaptures). It would seem that the relatively high spring peak flows in 2005 (these flows peaked at 13,200 CFS on 25 May 2005 at Shiprock USGS gage 09368000), an event that has not been duplicated or matched in the last several years, may have been responsible for not only the decline in relative numbers of razorback
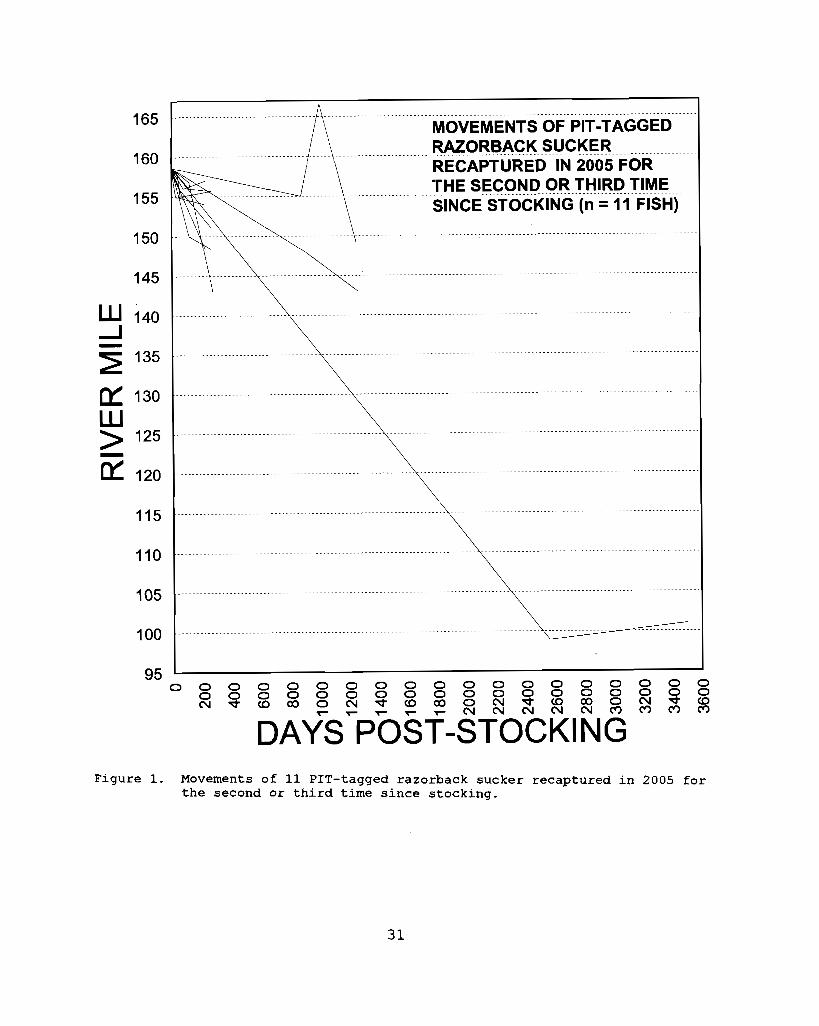
DAYS POST-STOCKING Figure 1. Movements o f 11 PIT-tagged razorback sucker recaptured i n 2005 for
the second or th i rd time s ince stocking.
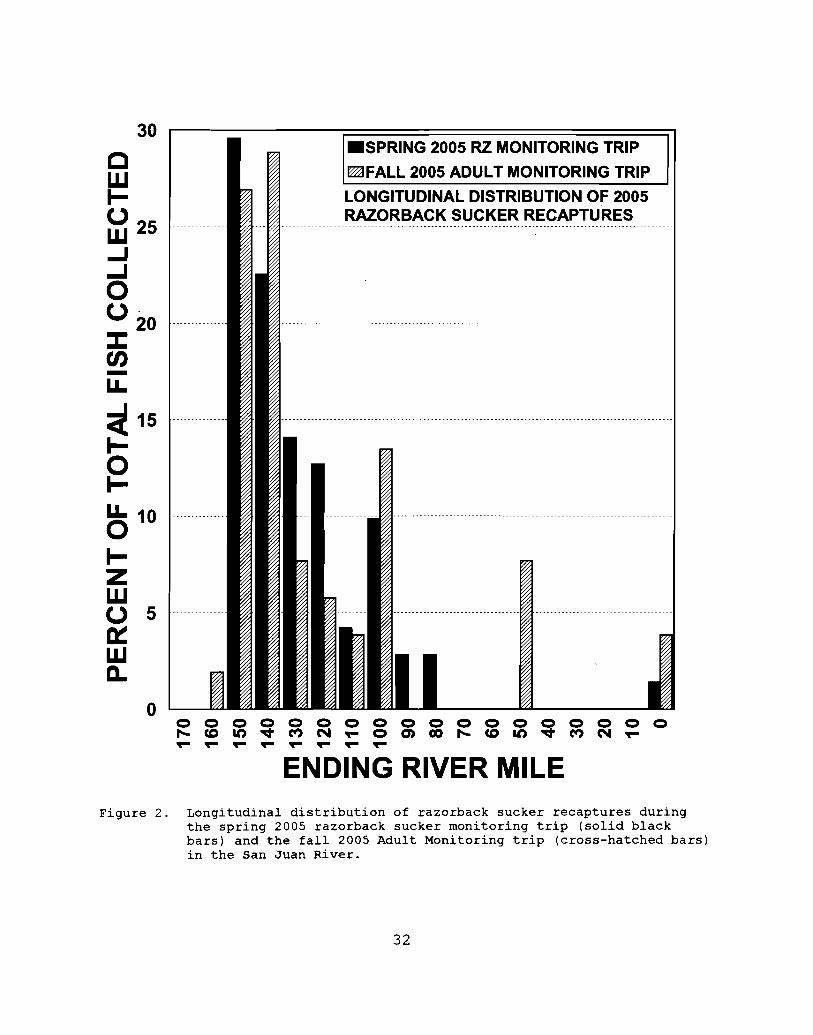
LONGITUDINAL DISTRIBUTION OF 2005
........................................................................................................ .............. RAZORBACK SUCKER RECAPTURES
......................................................................................................... ..............
........................................................................................................ ..............
........................................................................... ..............
..............
ENDING RIVER MILE Figure 2 . Longi tudinal d i s t r i b u t i o n of razorback sucker r ecap tu re s during
t h e s p r i n g 2005 razorback sucker monitor ing t r i p ( s o l i d b lack b a r s ) and t h e f a l l 2005 Adult Monitoring t r i p (cross-hatched b a r s ) i n t h e San Juan River .
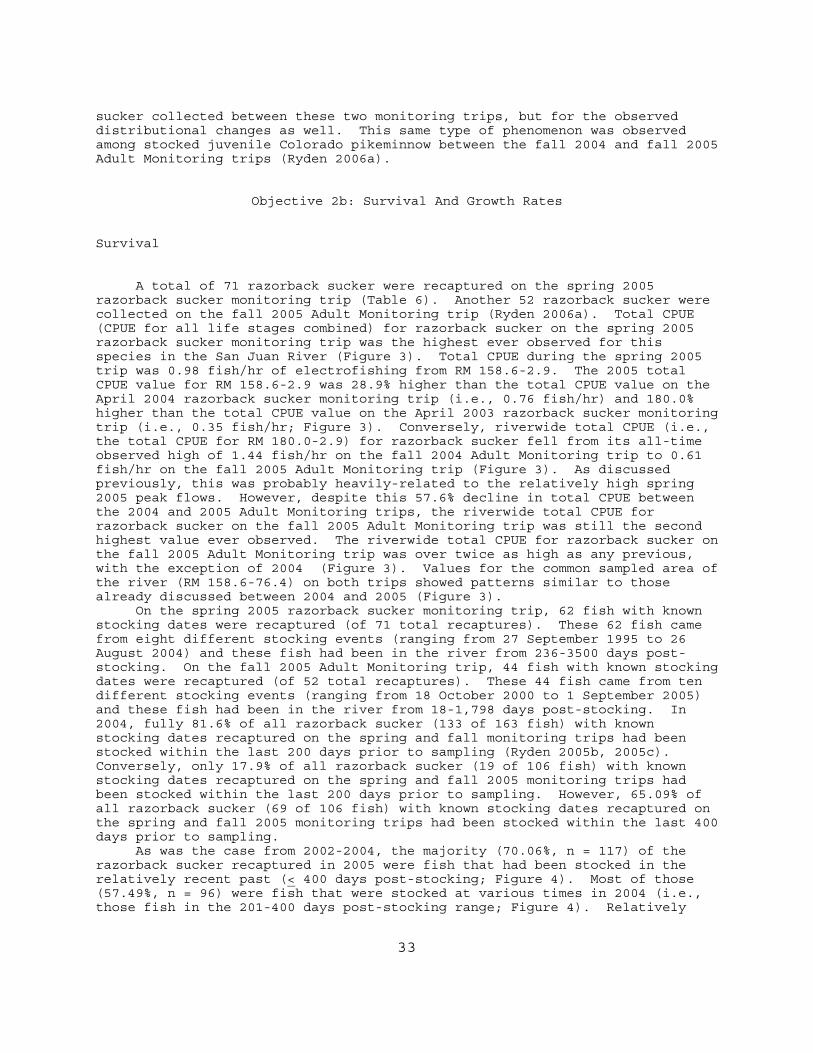
33
sucker collected between these two monitoring trips, but for the observed distributional changes as well. This same type of phenomenon was observed among stocked juvenile Colorado pikeminnow between the fall 2004 and fall 2005 Adult Monitoring trips (Ryden 2006a).
Objective 2b: Survival And Growth Rates Survival A total of 71 razorback sucker were recaptured on the spring 2005 razorback sucker monitoring trip (Table 6). Another 52 razorback sucker were collected on the fall 2005 Adult Monitoring trip (Ryden 2006a). Total CPUE (CPUE for all life stages combined) for razorback sucker on the spring 2005 razorback sucker monitoring trip was the highest ever observed for this species in the San Juan River (Figure 3). Total CPUE during the spring 2005 trip was 0.98 fish/hr of electrofishing from RM 158.6-2.9. The 2005 total CPUE value for RM 158.6-2.9 was 28.9% higher than the total CPUE value on the April 2004 razorback sucker monitoring trip (i.e., 0.76 fish/hr) and 180.0% higher than the total CPUE value on the April 2003 razorback sucker monitoring trip (i.e., 0.35 fish/hr; Figure 3). Conversely, riverwide total CPUE (i.e., the total CPUE for RM 180.0-2.9) for razorback sucker fell from its all-time observed high of 1.44 fish/hr on the fall 2004 Adult Monitoring trip to 0.61 fish/hr on the fall 2005 Adult Monitoring trip (Figure 3). As discussed previously, this was probably heavily-related to the relatively high spring 2005 peak flows. However, despite this 57.6% decline in total CPUE between the 2004 and 2005 Adult Monitoring trips, the riverwide total CPUE for razorback sucker on the fall 2005 Adult Monitoring trip was still the second highest value ever observed. The riverwide total CPUE for razorback sucker on the fall 2005 Adult Monitoring trip was over twice as high as any previous, with the exception of 2004 (Figure 3). Values for the common sampled area of the river (RM 158.6-76.4) on both trips showed patterns similar to those already discussed between 2004 and 2005 (Figure 3). On the spring 2005 razorback sucker monitoring trip, 62 fish with known stocking dates were recaptured (of 71 total recaptures). These 62 fish came from eight different stocking events (ranging from 27 September 1995 to 26 August 2004) and these fish had been in the river from 236-3500 days post-stocking. On the fall 2005 Adult Monitoring trip, 44 fish with known stocking dates were recaptured (of 52 total recaptures). These 44 fish came from ten different stocking events (ranging from 18 October 2000 to 1 September 2005) and these fish had been in the river from 18-1,798 days post-stocking. In 2004, fully 81.6% of all razorback sucker (133 of 163 fish) with known stocking dates recaptured on the spring and fall monitoring trips had been stocked within the last 200 days prior to sampling (Ryden 2005b, 2005c). Conversely, only 17.9% of all razorback sucker (19 of 106 fish) with known stocking dates recaptured on the spring and fall 2005 monitoring trips had been stocked within the last 200 days prior to sampling. However, 65.09% of all razorback sucker (69 of 106 fish) with known stocking dates recaptured on the spring and fall 2005 monitoring trips had been stocked within the last 400 days prior to sampling. As was the case from 2002-2004, the majority (70.06%, n = 117) of the razorback sucker recaptured in 2005 were fish that had been stocked in the relatively recent past (< 400 days post-stocking; Figure 4). Most of those (57.49%, n = 96) were fish that were stocked at various times in 2004 (i.e., those fish in the 201-400 days post-stocking range; Figure 4). Relatively
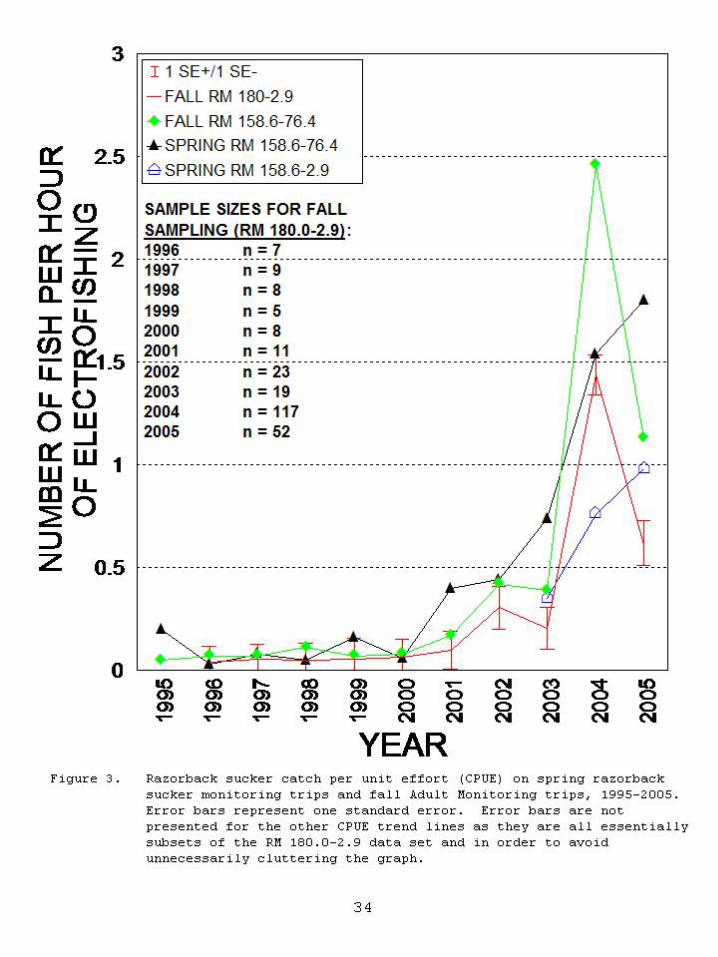
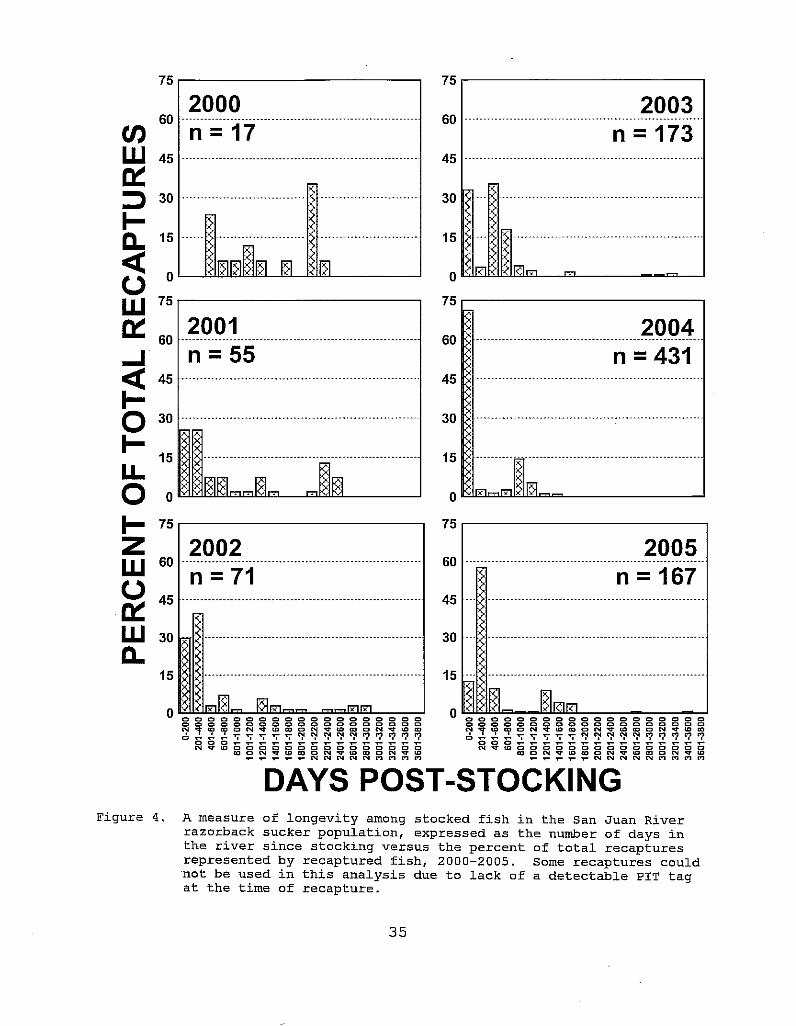
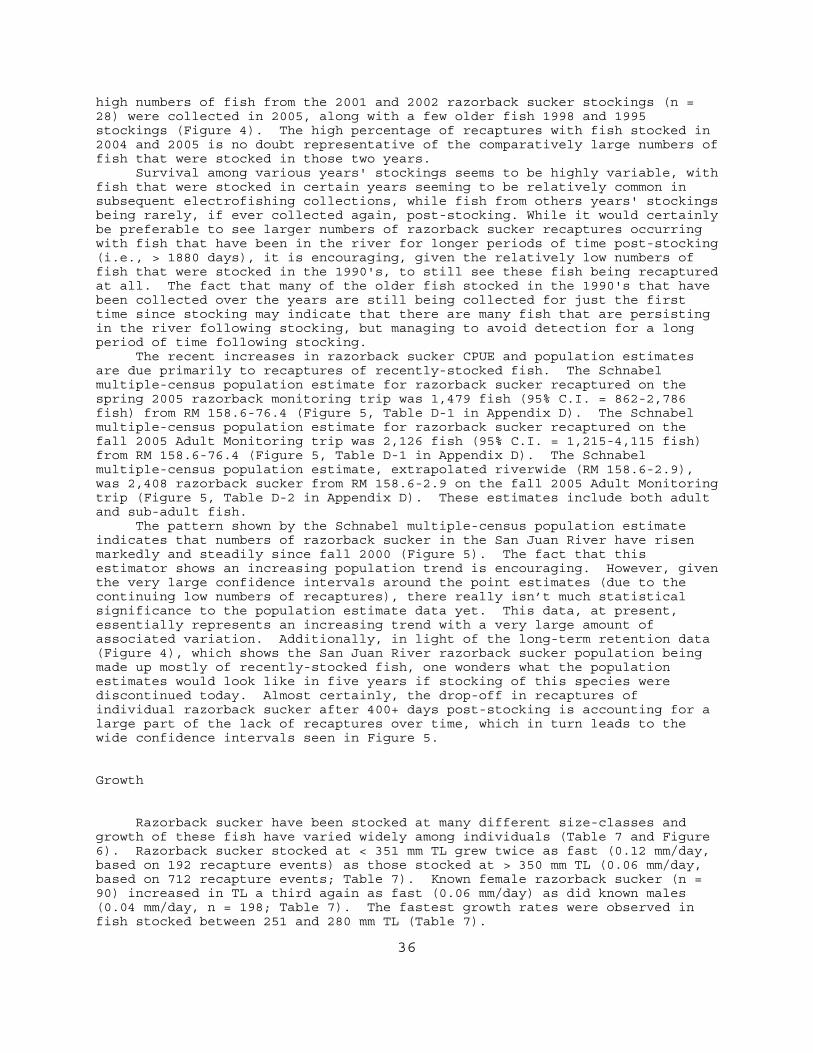
36
high numbers of fish from the 2001 and 2002 razorback sucker stockings (n = 28) were collected in 2005, along with a few older fish 1998 and 1995 stockings (Figure 4). The high percentage of recaptures with fish stocked in 2004 and 2005 is no doubt representative of the comparatively large numbers of fish that were stocked in those two years. Survival among various years' stockings seems to be highly variable, with fish that were stocked in certain years seeming to be relatively common in subsequent electrofishing collections, while fish from others years' stockings being rarely, if ever collected again, post-stocking. While it would certainly be preferable to see larger numbers of razorback sucker recaptures occurring with fish that have been in the river for longer periods of time post-stocking (i.e., > 1880 days), it is encouraging, given the relatively low numbers of fish that were stocked in the 1990's, to still see these fish being recaptured at all. The fact that many of the older fish stocked in the 1990's that have been collected over the years are still being collected for just the first time since stocking may indicate that there are many fish that are persisting in the river following stocking, but managing to avoid detection for a long period of time following stocking. The recent increases in razorback sucker CPUE and population estimates are due primarily to recaptures of recently-stocked fish. The Schnabel multiple-census population estimate for razorback sucker recaptured on the spring 2005 razorback monitoring trip was 1,479 fish (95% C.I. = 862-2,786 fish) from RM 158.6-76.4 (Figure 5, Table D-1 in Appendix D). The Schnabel multiple-census population estimate for razorback sucker recaptured on the fall 2005 Adult Monitoring trip was 2,126 fish (95% C.I. = 1,215-4,115 fish) from RM 158.6-76.4 (Figure 5, Table D-1 in Appendix D). The Schnabel multiple-census population estimate, extrapolated riverwide (RM 158.6-2.9), was 2,408 razorback sucker from RM 158.6-2.9 on the fall 2005 Adult Monitoring trip (Figure 5, Table D-2 in Appendix D). These estimates include both adult and sub-adult fish. The pattern shown by the Schnabel multiple-census population estimate indicates that numbers of razorback sucker in the San Juan River have risen markedly and steadily since fall 2000 (Figure 5). The fact that this estimator shows an increasing population trend is encouraging. However, given the very large confidence intervals around the point estimates (due to the continuing low numbers of recaptures), there really isn’t much statistical significance to the population estimate data yet. This data, at present, essentially represents an increasing trend with a very large amount of associated variation. Additionally, in light of the long-term retention data (Figure 4), which shows the San Juan River razorback sucker population being made up mostly of recently-stocked fish, one wonders what the population estimates would look like in five years if stocking of this species were discontinued today. Almost certainly, the drop-off in recaptures of individual razorback sucker after 400+ days post-stocking is accounting for a large part of the lack of recaptures over time, which in turn leads to the wide confidence intervals seen in Figure 5. Growth Razorback sucker have been stocked at many different size-classes and growth of these fish have varied widely among individuals (Table 7 and Figure 6). Razorback sucker stocked at < 351 mm TL grew twice as fast (0.12 mm/day, based on 192 recapture events) as those stocked at > 350 mm TL (0.06 mm/day, based on 712 recapture events; Table 7). Known female razorback sucker (n = 90) increased in TL a third again as fast (0.06 mm/day) as did known males (0.04 mm/day, n = 198; Table 7). The fastest growth rates were observed in fish stocked between 251 and 280 mm TL (Table 7).
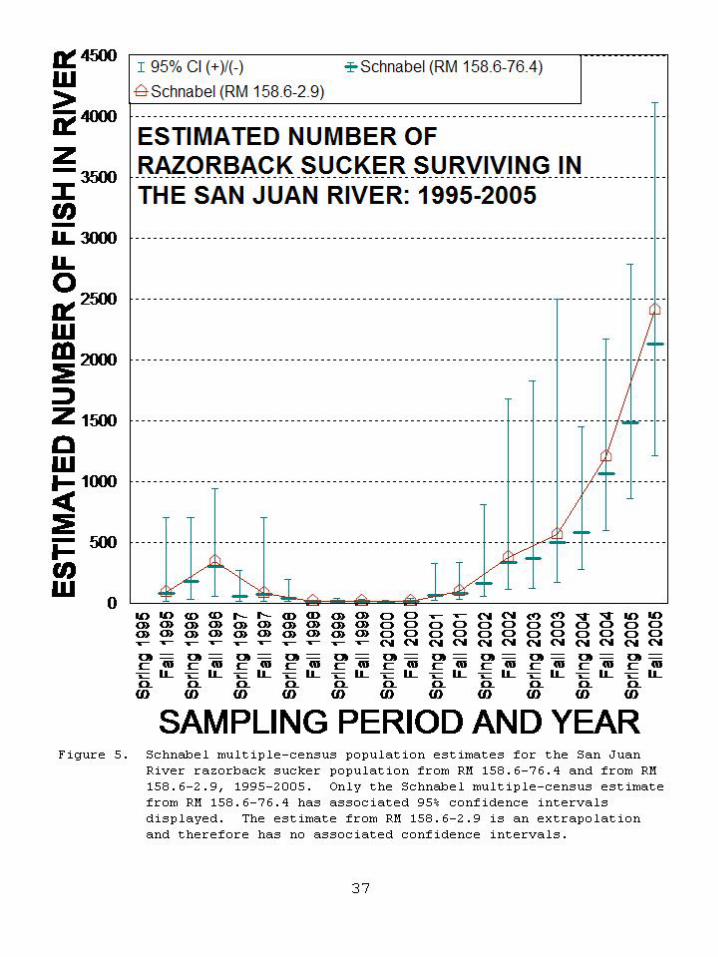

38
Table 7. Growth of razorback sucker, in millimeters per day (mm/day),
observed during 904 recapture events, including multiple recaptures, 1995-2005.
Total Length Range (in
mm) Of Recaptured Fish At The Time They Were Originally Stocked
Mean Growth (mm/day)
Range Of Observed Growth Measurements
Number Of Recapture Events Growth Rates Are
Based On (n =)
By 10-mm TL Size-Classes:
< 221
0.11
0.00-0.42
6
221-230
0.12
0.07-0.17
2
231-240
0.15
0.00-0.42
7
241-250
No Data
No Data
No Data
251-260
0.20
0.20-0.20
2
261-270
0.20
0.13-0.25
3
271-280
0.24
0.00-0.52
13
281-290
0.09
0.00-0.23
12
291-300
0.11
0.00-0.60
12
301-310
0.11
0.00-0.60
16
311-320
0.08
0.00-0.35
27
321-330
0.11
0.00-0.87
25
331-340
0.12
0.00-0.73
29
341-350
0.10
0.00-0.47
38
351-360
0.13
0.00-1.00
55
361-370
0.08
0.00-0.40
49
371-380
0.07
0.00-0.35
79
381-390
0.07
0.00-0.32
83
391-400
0.08
0.00-0.73
94
401-410
0.06
0.00-0.35
82
411-420
0.05
0.00-0.26
72
421-430
0.07
0.00-0.75
44
431-440
0.03
0.00-0.14
32
441-450
0.04
0.00-0.33
39
> 450
0.02
0.00-0.21
83

39
Table 7. Continued. Total Length Range (in mm) Of Recaptured Fish At The Time They Were Originally Stocked
Mean
Growth In
mm/Day
Range Of Observed Growth Measurements
Number Of Recapture Events Growth Rates Are Based On (n =)
ASmall@ Stocked Fish Versus ALarge@ Stocked Fish:
ASmall@ (< 351 mm TL) (range = 193-350 mm TL)
0.12
0.00-0.87
192
ALarge@ (> 350 mm TL) (range = 351-540 mm TL)
0.06
0.00-1.00
712 Known Females Versus Known Males:
Females (TL range = 229-540 mm)
0.06
0.00-0.23
90
Males (TL range = 232-482 mm)
0.04
0.00-0.42
198
Growth curves developed for razorback sucker show that between age-0 and age-4 razorback sucker grow rapidly reaching a mean TL of 436 mm (range = 306-537 mm TL) by age-4 (Figure 6). After age-4, the growth curve flattens considerably and gains in TL between years become much less dramatic (Figure 6). There is a considerable range for TL values at most ages (Figure 6). This reflects the wide range of sizes among razorback sucker of the same age from different hatchery facilities and grow-out ponds used in augmentation efforts. The largest gains in TL relative to the fish=s body size occur from age-1 to age-2 and from age-2 to age-3, when razorback sucker increase in TL by 25.2% and 11.6%, respectively (Figure 7). This translates into an average increase of 73 mm TL and 42 mm TL, respectively (Figure 7). By age-6 stocked razorback sucker demonstrated less than a 5.0% observed annual increase in mean TL between years (Figures 6 and 7). These figures are based on total length values observed among 1,009 razorback sucker recaptured between 1995 and 2005. These 1,009 fish were collected on USFWS-CRFP sampling trips as well as sampling trips being performed for numerous other SJRIP research and monitoring studies.

I t I I TOTAL LENGTHS AT AGE OBSERVED I ............... ......................... .AMONG. ST.O.C.KEI). .fiAZ.Q.R.BAC.K..
_ I SUCKER RECAPTllRED FROM THE SAN JUAN RIVER, 1995-2005 (n = 1,009)
.........................................................................................................
AGE AT RECAPTURE Figure 6. Total length (TL) at age observed for 1,009 recaptured razorback
sucker in the San Juan River, 1995-2005. The solid circles represent the mean observed TL values for each age-class at the time of recapture. Vertical bars represent the range of values observed among known-age, recaptured fish in each age-class. The solid, upward-sloping line represents the expected length-at-age, based on observed values. The solid, black columns at the bottom represent the sample sizes upon which length-at-age values for each age-class were based.

XAbsolute Increase + Relative Increase
........................................................................................................
..........................................................................................................
..........................................................................................................
ABSOLUTE AND RELATIVE INCRESEASES IN MEAN TOTAL LENGTH OBSERVED AMONG STOCKED RAZORBACK SUCKER RECAPTURED
.............
-*-*---+*-+---
AGE AT RECAPTURE Figure 7. Absolute and relative increases in total length (TL) at age
observed among 1,009 razorback sucker recaptured from the San Juan River, 1995-2005. NOTE: Markers at age-2 indicate the increase in TL from age-1 to age-2, those at age-3 indicate the increase in TL from age-2 to age-3 and so on.
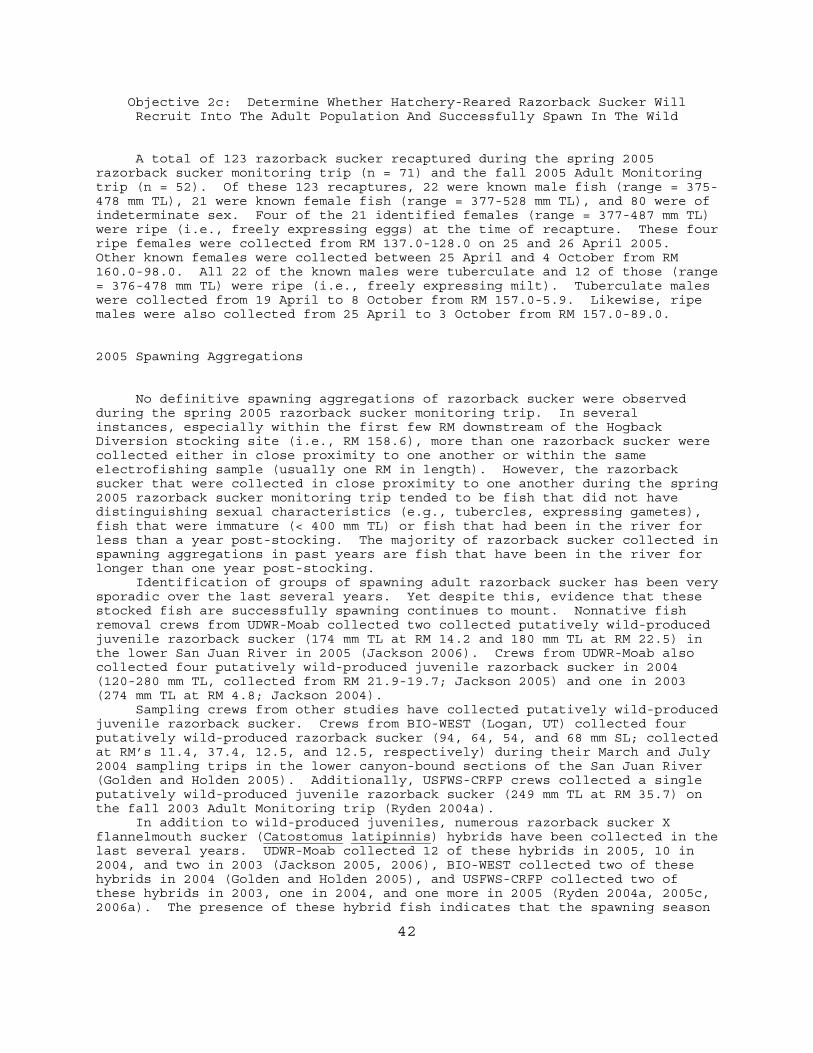
42
Objective 2c: Determine Whether Hatchery-Reared Razorback Sucker Will Recruit Into The Adult Population And Successfully Spawn In The Wild
A total of 123 razorback sucker recaptured during the spring 2005 razorback sucker monitoring trip (n = 71) and the fall 2005 Adult Monitoring trip (n = 52). Of these 123 recaptures, 22 were known male fish (range = 375-478 mm TL), 21 were known female fish (range = 377-528 mm TL), and 80 were of indeterminate sex. Four of the 21 identified females (range = 377-487 mm TL) were ripe (i.e., freely expressing eggs) at the time of recapture. These four ripe females were collected from RM 137.0-128.0 on 25 and 26 April 2005. Other known females were collected between 25 April and 4 October from RM 160.0-98.0. All 22 of the known males were tuberculate and 12 of those (range = 376-478 mm TL) were ripe (i.e., freely expressing milt). Tuberculate males were collected from 19 April to 8 October from RM 157.0-5.9. Likewise, ripe males were also collected from 25 April to 3 October from RM 157.0-89.0. 2005 Spawning Aggregations No definitive spawning aggregations of razorback sucker were observed during the spring 2005 razorback sucker monitoring trip. In several instances, especially within the first few RM downstream of the Hogback Diversion stocking site (i.e., RM 158.6), more than one razorback sucker were collected either in close proximity to one another or within the same electrofishing sample (usually one RM in length). However, the razorback sucker that were collected in close proximity to one another during the spring 2005 razorback sucker monitoring trip tended to be fish that did not have distinguishing sexual characteristics (e.g., tubercles, expressing gametes), fish that were immature (< 400 mm TL) or fish that had been in the river for less than a year post-stocking. The majority of razorback sucker collected in spawning aggregations in past years are fish that have been in the river for longer than one year post-stocking. Identification of groups of spawning adult razorback sucker has been very sporadic over the last several years. Yet despite this, evidence that these stocked fish are successfully spawning continues to mount. Nonnative fish removal crews from UDWR-Moab collected two collected putatively wild-produced juvenile razorback sucker (174 mm TL at RM 14.2 and 180 mm TL at RM 22.5) in the lower San Juan River in 2005 (Jackson 2006). Crews from UDWR-Moab also collected four putatively wild-produced juvenile razorback sucker in 2004 (120-280 mm TL, collected from RM 21.9-19.7; Jackson 2005) and one in 2003 (274 mm TL at RM 4.8; Jackson 2004). Sampling crews from other studies have collected putatively wild-produced juvenile razorback sucker. Crews from BIO-WEST (Logan, UT) collected four putatively wild-produced razorback sucker (94, 64, 54, and 68 mm SL; collected at RM’s 11.4, 37.4, 12.5, and 12.5, respectively) during their March and July 2004 sampling trips in the lower canyon-bound sections of the San Juan River (Golden and Holden 2005). Additionally, USFWS-CRFP crews collected a single putatively wild-produced juvenile razorback sucker (249 mm TL at RM 35.7) on the fall 2003 Adult Monitoring trip (Ryden 2004a). In addition to wild-produced juveniles, numerous razorback sucker X flannelmouth sucker (Catostomus latipinnis) hybrids have been collected in the last several years. UDWR-Moab collected 12 of these hybrids in 2005, 10 in 2004, and two in 2003 (Jackson 2005, 2006), BIO-WEST collected two of these hybrids in 2004 (Golden and Holden 2005), and USFWS-CRFP collected two of these hybrids in 2003, one in 2004, and one more in 2005 (Ryden 2004a, 2005c, 2006a). The presence of these hybrid fish indicates that the spawning season

43
of stocked razorback sucker overlaps with that of wild flannelmouth sucker population. It may also indicate that artificially-reared razorback sucker may be getting their clues as to where and when to spawn from this close relative. Wild-produced larval razorback sucker continue to be collected in the San Juan River. Larval razorback sucker were collected for eighth consecutive year in 2005 (Brandenburg 2000, Brandenburg et al. 2001, 2002, 2003, 2004, 2005, Brandenburg and Farrington 2006). Despite the absence of an observed aggregation of spawning adult razorback sucker in 2005, the collections of young, untagged fish and razorback sucker X flannelmouth sucker hybrids indicates that spawning is continuing annually among stocked razorback sucker in the San Juan River. Recruitment, at least a limited amount of recruitment, through age-1 and age-2 is also occurring. Whether or not these smaller fish will survive to recruit into adulthood remains to be seen, however.
44
DISCUSSION
Objective 2a: Spawning Season Habitat Use And Movement Patterns During the spring 2005 razorback sucker monitoring trip and the fall 2005 Adult Monitoring trip, most razorback sucker remained spatially separated from one another. No suspected spawning aggregations of ripe, adult razorback sucker were documented in 2005. Of the 71 razorback sucker collected during our 2005 collections, the majority (n = 51, 71.8%) were first-time recaptures. In some ways, this makes sense, since two of the three largest groups of razorback sucker ever to be stocked into the San Juan River were stocked in 2004 (n = 2,988) and 2005 (n = 1,996). However, given the large number of razorback sucker that had been stocked in the previous ten years (n = 7,859 fish stocked from 1994-2003), it would seem as if a somewhat higher percentage of razorback sucker with two or more recaptures could be expected. Only 11 fish collected on the spring 2005 razorback sucker were recaptured for the second or third time since their stocking date. The original stocking dates could not be determined for another nine fish. Among the 11 fish that were recaptured for the second (or more) time in 2005 was an age-13 (1992 year-class) fish that had been in the river 11 years post-stocking. This is the oldest razorback sucker that has been recaptured in the San Juan River since augmentation of this species began in 1994. Without exception, the initial movement of all 11 of these multiple recapture fish immediately following stocking was downstream. As has been observed in past years, four of these multiple recapture fish then demonstrated some upstream movement, but only after a period of initial downstream displacement. It is encouraging that all of the multiple recapture events for these 11 fish occurred upstream of RM 95.0 (with most occurring upstream of RM 140.0), indicating that stocked razorback sucker are able to retain and fulfill their life-history requirements within upstream sections of the San Juan River for long periods of time post-stocking. One multiple recapture (stocked in October 2001) was recaptured for the first time in April 2004 at RM 155.0 and the second time in August 2004 in the PNM Fish Ladder (RM 166.6). After its release upstream of the PNM Fish Ladder in August 2004, it moved back downstream over the PNM Weir and was recaptured at RM 149.0 on 19 April 2005. This event shows that individuals of both rare fish species (razorback sucker and Colorado pikeminnow) that have used the PNM fish ladder have "fallen back" over the PNM Weir and were later recaptured in downstream sections of the San Juan River, rather than remaining upstream of this structure indefinitely. It is unknown what exactly leads to this falling back phenomenon among fish that use the selective fish passageway at the PNM Weir. It could be disorientation and stress due to handling when these fish are released upstream of the PNM Fish Ladder, a lack of resources essential to rare fish being able to fulfill their life history needs upstream of the PNM Weir (such as sufficient numbers of other fish to spawn with or unsuitable water temperatures being available on a year-round basis), or just the migratory nature of these species that leads them to once again seek downstream river reaches. It is also unknown whether this fall back occurs in all rare fish that use the PNM Fish Ladder or whether it is limited to just a few individuals. However, among adult Colorado pikeminnow that were stocked in April of 2001, some individuals have been collected in the PNM Fish Ladder up to five times post-stocking (Ryden 2006b; A. Lapahie pers. comm.).
45
Razorback sucker continue to be collected throughout the San Juan River. Recaptures of razorback sucker during the spring 2005 razorback sucker monitoring trip (n = 71) ranged from RM 158.0-5.9, while recaptures during the fall 2005 Adult Monitoring trip (n = 52) ranged from RM 160.0-4.0. However, the majority of razorback sucker collected on these two monitoring trips were collected upstream of RM 80.0 (i.e., upstream of Bluff, UT). Other studies collected razorback sucker as far upstream as the PNM Fish Ladder (RM 166.6; A. Lapahie, pers. comm.) and as far downstream as Lake Powell, specifically in the plunge pool below the most downstream waterfall that separates the lower San Juan River from Lake Powell (Jackson 2006). It is known that stocked razorback sucker can successfully negotiate the fish passage structures at both the Hogback Diversion (RM 158.6) and at the PNM Weir (RM 166.6). There was a drop-off in both numbers of individual razorback sucker collected between the spring 2005 razorback sucker monitoring trip (n = 71) and the fall 2005 Adult Monitoring trip (n = 52). Likewise, total CPUE for razorback sucker between the fall 2004 and fall 2005 Adult Monitoring trips declined significantly (p < 0.000). In addition, a larger percentage of razorback sucker recaptures occurred in the canyon-bound sections of the San Juan River on the fall 2005 Adult Monitoring trip (n = 6 {11.5%} of 52 total recaptures) compared to the spring 2005 razorback sucker monitoring trip (n = 1 {1.4%} of 71 total recaptures). It appears as if the relatively high spring peak flows in 2005 (these flows peaked at 13,200 CFS on 25 May 2005 at Shiprock USGS gage 09368000), an event that has not been duplicated or matched in the last several years, may have been responsible for not only the decline in relative numbers of razorback sucker collected between these two monitoring trips, but for the observed distributional changes as well. These same types of phenomena (drop in numbers of individuals collected and in total CPUE) were observed among stocked juvenile Colorado pikeminnow between the fall 2004 and fall 2005 Adult Monitoring trips (Ryden 2006a). There is evidence to suggest that even among the most common, wild fish species in the San Juan River (e.g., flannelmouth sucker) high flow events represent a strong selective force that can cause marked changes in both overall numbers of fish as well as their longitudinal distribution. Between 1991 and 1997, flannelmouth sucker CPUE declined significantly in Reaches 5-3 of the San Juan River, while at the same time, the mean condition factor (K) for flannelmouth sucker in those same river reaches rose significantly (Ryden 2000b). The following excerpt from Ryden (2000b) explains this line of reasoning: One possible explanation of these observed trends (decreasing CPUE, but increasing mean K values) is that the flannelmouth sucker population, not being subject to a great deal of selective pressure (in the form of high flows) during the stable, low-flow drought years of the late 1980's and early 1990's, had exceeded its carrying capacity. In other words, there was an overabundance of low condition factor (low condition factor = poor health) flannelmouth sucker in the San Juan River. The initiation of research flows and mimicry of the natural hydrograph in the 1990's induced a strong selective pressure on the San Juan River flannelmouth sucker population, "weeding-out" less fit individuals and causing the flannelmouth sucker population to reset to a more natural state. In other words large numbers of fish in poor health gave way to fewer numbers of healthier fish. Indeed, prior to the initiation of Adult Monitoring studies in 1991, the San Juan River had experienced several consecutive years of drought conditions. An analysis of the high flow events that occurred in the 28 years prior to 1991 (i.e., 1962-1990) showed that spring peak flows in the three years prior to 1991 (i.e., 1988-1990) never reached > 6,650 CFS (at the Shiprock USGS gage

46
09368000), thus ranking these three years 20th, 28th, and 23rd respectively among those 28 years as far as high flow events (Bliesner and Lamarra 1993). These low flows continued in 1991, with the spring peak in that year reaching only 4,720 CFS (at the Shiprock USGS gage 09368000). Thus, there was a series of four consecutive years of relatively low-peak, short-duration high flows between 1988 and 1991. Beginning in 1992, the San Juan River experienced a period of years with both comparatively high flow years (e.g., peaks of 9,920 CFS in 1992 and 9,830 in 1993 at the Shiprock USGS gage 09368000) intermixed with moderate flow years that would have acted as a strong selective pressure, even on wild fish. Similarly, two fall monsoon flow spikes observed in 2002 (peaked at 10,100 CFS on 12 September at the Bluff USGS gage 09379500) and 2003 (peaked at 20,700 CFS on 10 September at the Bluff USGS gage 09379500) appear to have caused downstream displacement even among common fish species such as flannelmouth sucker, channel catfish (Ictalurus punctatus) and common carp (Cyprinus carpio; Ryden 2004a). Thus, it would seem to make sense that if high flow events can act as a strong selective factor on common, abundant, wild fishes, they would probably have an even more powerful impact among stocked fish, whether those stocked fish were pond-reared razorback sucker or hatchery-reared Colorado pikeminnow. This also seems to make sense when you see that the decline in razorback sucker total CPUE seemed to take place among the more recently stocked (i.e., fish stocked in 2005; Figure 4) and smaller size-sized (i.e., fish < 300 mm TL) fish (Ryden 2006a).
Objective 2b: Survival And Growth Rates Survival A total of 71 razorback sucker were recaptured on the spring 2005 razorback sucker monitoring trip, with another 52 razorback sucker being collected on the fall 2005 Adult Monitoring trip. Total CPUE for razorback sucker on the spring 2005 razorback sucker monitoring trip was the highest ever observed for this species (at 0.98 fish/hr of electrofishing from RM 158.6-2.9) in the San Juan River. The 2005 total CPUE value for RM 158.6-2.9 was 28.9% higher than the total CPUE value on the April 2004 razorback sucker monitoring trip (i.e., 0.76 fish/hr) and 180.0% higher than the total CPUE value on the April 2003 razorback sucker monitoring trip (i.e., 0.35 fish/hr). Conversely, riverwide total CPUE (i.e., the total CPUE for RM 180.0-2.9) for razorback sucker fell from its all-time observed high of 1.44 fish/hr on the fall 2004 Adult Monitoring trip to 0.61 fish/hr on the fall 2005 Adult Monitoring trip. As discussed previously, this was probably heavily-related to the relatively high spring 2005 peak flows. However, despite this 57.6% decline in total CPUE between the 2004 and 2005 Adult Monitoring trips, the riverwide total CPUE for razorback sucker on the fall 2005 Adult Monitoring trip was still the second highest value ever observed. The riverwide total CPUE for razorback sucker on the fall 2005 Adult Monitoring trip was over twice as high as any previous, with the exception of 2004. So, while the decline in razorback sucker total CPUE observed on the fall 2005 Adult Monitoring trip is not what we might have hoped for, it is probably a circumstance which can be reasonably expected from time to time, as various selective pressures (e.g., very high flows, very low flows, invasions of predatory fishes from Lake Powell, contaminants spills) are applied to populations of stocked (and wild) fish. Indeed, the fact that the population of stocked razorback sucker weathered the 2005 high spring flows in as large of numbers as they did is somewhat encouraging.
47
Survival among various years' stockings seems to be highly variable, with fish that were stocked in certain years seeming to be relatively common in subsequent electrofishing collections, while fish from others years' stockings being rarely, if ever collected again, post-stocking. Razorback sucker collected during the spring 2005 razorback sucker monitoring trip came from eight different stocking events (ranging from 27 September 1995 to 26 August 2004), while those collected on the fall 2005 Adult monitoring trip came from ten different stocking events (ranging from 18 October 2000 to 1 September 2005). The majority razorback sucker recaptured in 2005 were fish that had been stocked in the relatively recent past (< 400 days post-stocking). However, only 17.9% of all razorback sucker (19 of 106 fish) with known stocking dates recaptured on the spring and fall 2005 monitoring trips had been stocked within the last 200 days prior to sampling, while 65.09% of all razorback sucker (69 of 106 fish) with known stocking dates recaptured on the spring and fall 2005 monitoring trips had been stocked within the last 400 days prior to sampling. In other words, most of those were fish that were stocked at various times in 2004 (i.e., those fish in the 201-400 days post-stocking range). Relatively high numbers of fish from the 2001 and 2002 razorback sucker stockings (n = 28) were collected in 2005, along with a few older fish 1998 and 1995 stockings. The overall high percentage of recaptures with fish stocked in 2004 and 2005 is no doubt representative of the comparatively large numbers of fish that were stocked in those two years. While it would certainly be preferable to see larger numbers of razorback sucker recaptures occurring with fish that have been in the river for longer periods of time post-stocking (i.e., > 1880 days), it is encouraging, given the relatively low numbers of fish that were stocked in the 1990's, to still see these fish being recaptured at all. The fact that many of the older fish stocked in the 1990's that have been collected over the years are still being collected for just the first time since stocking may indicate that there are many fish that are persisting in the river following stocking, but managing to avoid detection for a long period of time following stocking. Thus it appears as if the recently-observed increases in razorback sucker CPUE and population estimates are due primarily to recaptures of recently-stocked fish. While total CPUE for razorback sucker declined between the fall 2004 and fall 2005 Adult Monitoring trips, the Schnabel multiple-census population estimate actually increased. The Schnabel multiple-census population estimate for razorback sucker recaptured on the spring 2005 razorback monitoring trip was 1,479 fish (95% C.I. = 862-2,786 fish) from RM 158.6-76.4. The Schnabel multiple-census population estimate for razorback sucker recaptured on the fall 2005 Adult Monitoring trip was 2,126 fish (95% C.I. = 1,215-4,115 fish) from RM 158.6-76.4. The Schnabel multiple-census population estimate, extrapolated riverwide (RM 158.6-2.9), was 2,408 razorback sucker from RM 158.6-2.9 on the fall 2005 Adult Monitoring trip. These estimates include both adult and sub-adult fish. The pattern shown by the Schnabel multiple-census population estimate indicates that numbers of razorback sucker in the San Juan River have risen markedly and steadily since fall 2000. The fact that this estimator shows an increasing population trend is encouraging. However, given the very large confidence intervals around the point estimates (due to the continuing low numbers of recaptures), there really isn’t much statistical significance to the population estimate data yet. This data, at present, essentially represents an increasing trend with a very large amount of associated variation. Additionally, in light of the long-term retention data, which suggests that the San Juan River razorback sucker population is made up mostly of recently-stocked fish, one wonders what the population estimates would look like in five years if stocking of this species were discontinued today.
48
Almost certainly, the drop-off in recaptures of individual razorback sucker after 400+ days post-stocking is accounting for a large part of the lack of recaptures over time, which in turn leads to the wide confidence intervals seen in Figure 5. However, if the 2005 Schnabel point estimate for RM 158.6-2.9 (n = 2,408 fish) is close to accurate, and if stocking of razorback sucker continues at close to the same level it has been at for the last two years – 2,000 to 3,000 fish stocked annually -- or especially if stocking numbers increase dramatically, then it would seem that somewhere within the next two to three years, the SJRIP may want to consider moving from monitoring trips to doing multiple-pass, riverwide, intensive mark-recapture trips in order to obtain more precise population estimates for razorback sucker. These types of multiple-pass, mark-recapture trips would lower the amount of variability currently seen within the data by increasing the probability of capture (p-hat) among stocked fish. These types of multiple-pass, mark-recapture trips could also be used to obtain precise population estimates for stocked Colorado pikeminnow > 200 mm TL at the same time. Growth The faster growth rates observed in razorback sucker stocked at < 351 mm TL were expected. Most species of fish exhibit a period of rapid growth early in life and a subsequent period of more gradual increases as they mature (Van den Avyle 1993). Known female razorback sucker increased in TL faster than did known males, post-stocking. In general, stocked razorback sucker in the San Juan River grow rapidly until they reach about age-4, at which time growth slows considerably. However, fairly large absolute increases in TL (i.e., almost 18 mm annually) were still observed in some stocked fish as late as age-10. The growth curve developed for stocked razorback sucker acts as a tool to judge the relative age of untagged razorback sucker. Currently, very few wild-produced razorback sucker (other than larvae being collected by crews from UNM) are being collected in the San Juan River. However, when wild-produced progeny of stocked fish successfully are collected, this growth curve will provide a tool to make an educated guess as to their age.
Objective 2c: Determine Whether Hatchery-Reared Razorback Sucker Will Recruit Into The Adult Population And Successfully Spawn In The Wild
No definitive spawning aggregations of razorback sucker were observed during the spring 2005 razorback sucker monitoring trip. Identification of groups of spawning adult razorback sucker has been very sporadic over the last several years. Yet despite this, there is evidence that stocked razorback sucker continue to successfully spawn in the San Juan River. Nonnative fish removal crews from UDWR-Moab collected two collected putatively wild-produced juvenile razorback sucker (174 mm TL at RM 14.2 and 180 mm TL at RM 22.5) in the lower San Juan River in 2005 (Jackson 2006). Wild-produced larval razorback sucker continue to be collected in the San Juan River as well. Larval razorback sucker were collected for eighth consecutive year in 2005 (Brandenburg 2000, Brandenburg et al. 2001, Brandenburg et al. 2002, Brandenburg et al. 2003, Brandenburg et al. 2004, Brandenburg et al. 2005, Brandenburg and Farrington 2006).

49
Despite the absence of an observed aggregation of spawning adult razorback sucker in 2005, the collections of young, untagged razorback sucker indicates that spawning is continuing annually among stocked razorback sucker in the San Juan River. Recruitment, at least a limited amount of recruitment, through age-1 and age-2 is also occurring. Whether or not these smaller fish will survive to recruit into adulthood remains to be seen, however.
50
LITERATURE CITED Bliesner, R., and V. Lamarra. 1993. San Juan River habitat studies: 1992
Annual Report. Keller-Bliesner Engineering, Logan, UT and Ecosystems Research Institute, Logan, UT. 144 pp.
Bliesner, R. 2005. NAPI pond aeration and bird control. Fiscal Year 2006 workplan proposal developed by Keller-Bliesner Engineering, Logan, UT. Submitted to the San Juan River Recovery Implementation Program, U. S. Fish and Wildlife Service, Albuquerque, NM. 3 pp.
Brandenburg, W. H. 2000. Razorback sucker larval fish survey: San Juan River 1998 and 1999. Division of Fishes, Museum of Southwestern Biology, University of New Mexico, Albuquerque. 46 pp.
Brandenburg, W. H., M. A. Farrington, and S. J. Gottlieb. 2001. Razorback sucker larval fish survey: San Juan River 2000. Division of Fishes, Museum of Southwestern Biology, University of New Mexico, Albuquerque. 34 pp.
Brandenburg, W. H., M. A. Farrington, and S. J. Gottlieb. 2002. Razorback sucker larval fish survey: San Juan River 2001. Division of Fishes, Museum of Southwestern Biology, University of New Mexico, Albuquerque. 34 pp.
Brandenburg, W. H., M. A. Farrington, and S. J. Gottlieb. 2003. Razorback sucker larval fish survey in the San Juan River during 2002. Division of Fishes, Museum of Southwestern Biology, University of New Mexico, Albuquerque. 48 pp.
Brandenburg, W. H., M. A. Farrington, and S. J. Gottlieb. 2004. Razorback sucker larval fish survey in the San Juan River during 2003. Division of Fishes, Museum of Southwestern Biology, University of New Mexico, Albuquerque. 55 pp.
Brandenburg, W. H., M. A. Farrington, and S. J. Gottlieb. 2005. Colorado pikeminnow and razorback sucker larval fish survey in the San Juan River during 2004. Division of Fishes, Museum of Southwestern Biology, University of New Mexico, Albuquerque. 92 pp.
Brandenburg, W. H., and M. A. Farrington. 2006. Colorado pikeminnow and razorback sucker larval fish survey in the San Juan River during 2005 (Draft Report). Division of Fishes, Museum of Southwestern Biology, University of New Mexico, Albuquerque. 77 pp.
Brooks, J. E., L. Crist, L. A. Ahlm, R. Bliesner, M. J. Buntjer, W. P. Goettlicher, K. Lashmett, W. J. Miller, D. L. Propst, and D. W. Ryden. 1993. San Juan River Seven Year Research Program: Summary Report 1992. San Juan River Recovery Implementation Program, Dexter, NM. 20 pp.
Buntjer, M. J., T. Chart, and L. Lentsch. 1993. Early life history investigations. Utah Division of Wildlife Resources , Salt Lake City, UT. 35 pp.
Buntjer, M. J., T. Chart, and L. Lentsch. 1994. Early life history fishery survey of the San Juan River, New Mexico and Utah. Utah Division of Wildlife Resources , Salt Lake City, UT. 48 pp.
Burdick, B. D. 1992. A plan to evaluate stocking to augment or restore razorback sucker in the Upper Colorado River. U.S. Fish and Wildlife Service, Grand Junction, CO. 56 pp.
Gido, K. B., and D. L. Propst. 1994. San Juan River secondary channel community studies permanent study sites: 1993 Annual Report (Final). New Mexico Department of Game and Fish, Santa Fe, NM. 42 pp.
Golden, M. E., and P. B. Holden. 2005. Retention, growth, and habitat use of stocked Colorado pikeminnow in the San Juan River: 2003-2004 Draft Annual Report. BIO-WEST, Inc., Logan, UT. 76 pp.
51
Hamman, R. L., and M. E. Ulibarri. 2006. Rearing razorback sucker sub-adults
at Dexter National Fish Hatchery and Technology Center. Fiscal Year 2006 workplan proposal developed by the U. S. Fish and Wildlife Service, Dexter National Fish Hatchery and Technology Center, Dexter, NM. Submitted to the San Juan River Recovery Implementation Program, U. S. Fish and Wildlife Service, Albuquerque, NM. 15 pp.
Jackson, J. A. 2004. Nonnative control in the lower San Juan River: 2003. Utah Division of Wildlife Resources, Moab, UT. 19 pp. + appendix.
Jackson, J. A. 2005. Nonnative control in the lower San Juan River: 2004. Utah Division of Wildlife Resources, Moab, UT. 28 pp.
Jackson, J. A. 2006. Nonnative control in the lower San Juan River: 2005 (Draft). Utah Division of Wildlife Resources, Moab, UT. 31 pp.
Jordan, D. S. 1891. Report of the explorations in Colorado and Utah during the summer of 1889, with an account of the fish found in each of the river basins examined. Bulletin of the U.S. Fish Commission. Volume IX:1-40.
Koster, W. J. 1960. Ptychocheilus lucius (Cyprinidae) in the San Juan River, New Mexico. Southwestern Naturalist 5:174-175.
Lamarra, V. A. 2005. Razorback sucker growout ponds operations manual (Draft). Ecosystems Research Institute, Logan, UT. 4 pp. + appendices.
Lamarra, V. A., and J. Cole. 2006. Operation of Public Service Company of New Mexico fish passage structure and NAPI ponds management training. Fiscal Year 2006 workplan proposal developed by Ecosystems Research Institute (Logan, UT) and the Navajo Nation Department of Fish and Wildlife (Window Rock, AZ). Submitted to the San Juan River Recovery Implementation Program, U. S. Fish and Wildlife Service, Albuquerque, NM. 4 pp.
Lashmett, K. 1993. Fishery survey of the lower San Juan River and the upper Arm of Lake Powell (RM 4.0-[-]11.0) 1991/92 B Annual Report. Bureau of Reclamation, Durango, CO. 29 pp.
Lashmett, K. 1994. Fishery survey of the lower San Juan River and the upper Arm of Lake Powell (RM 4.0-[-]0.8) 1993 B Annual Report. Bureau of Reclamation, Durango, CO. 11 pp. + Appendix.
Maddux, R. H., L. A. Fitzpatrick, and W. A. Noonan. 1993. Colorado River endangered fishes Critical Habitat: Draft Biological Support Document and appendices. U.S. Fish and Wildlife Service, Salt Lake City, UT. 222 pp. + appendices.
Minckley, W. L., P. C. Marsh, J. E. Brooks, J. E. Johnson, and B. L. Jensen. 1991. Management toward recovery of the razorback sucker. Pages 303-357 in W. L. Minckley and J. E. Deacon, editors. Battle against extinction. University of Arizona Press, Tucson, AZ. 517 pp.
Olson, H. F. 1962. State-wide rough fish control: Rehabilitation of the San Juan River. Job Completion Report for Job Number C-16-4, Federal Aid Project F-19-D-4, New Mexico Dept. of Game and Fish, Santa Fe, NM. 6 pp.
Platania, S. P. 1990. Biological summary of the 1987-1989 New Mexico-Utah ichthyofaunal study of the San Juan River. Report to the New Mexico Dept. of Game and Fish, Santa Fe, NM, and the U.S. Bureau of Reclamation, Salt Lake City, UT. 143 pp.
Ryden, D. W. 1997. Five-year augmentation plan for razorback sucker in the San Juan River. U.S. Fish and Wildlife Service, Grand Junction, CO. 27 pp.
Ryden, D. W. 2000a. Monitoring of experimentally stocked razorback sucker in the San Juan River: March 1994 through October 1997. U.S. Fish and Wildlife Service, Grand Junction, CO. 132 pp.
52
Ryden, D. W. 2000b. Adult fish community monitoring on the San Juan River,
1991-1997. U.S. Fish and Wildlife Service, Grand Junction, CO. 269 pp. Ryden, D. W. 2000c. Monitoring of razorback sucker stocked into the San Juan
River as part of a five-year augmentation effort: 1997-1999 Interim Progress Report (Draft Final). U.S. Fish and Wildlife Service, Grand Junction, CO. 49 pp.
Ryden, D. W. 2001. Monitoring of razorback sucker stocked into the San Juan River as part of a five-year augmentation effort: 2000 Interim Progress Report (Final). U.S. Fish and Wildlife Service, Grand Junction, CO. 83 pp.
Ryden, D. W. 2003a. Long-term monitoring of sub-adult and adult large-bodied fishes in the San Juan River: 1999-2001 Integration Report. U.S. Fish and Wildlife Service, Grand Junction, CO. 127 pp. + Appendices.
Ryden, D. W. 2003b. An augmentation plan for razorback sucker in the San Juan River: An addendum to the five-year augmentation plan for razorback sucker in the San Juan River (Ryden 1997). U.S. Fish and Wildlife Service, Grand Junction, CO. 32 pp.
Ryden, D. W. 2004a. Long-term monitoring of sub-adult and adult large-bodied fishes in the San Juan River: 2003 Interim Progress Report (Final). U.S. Fish and Wildlife Service, Grand Junction, CO. 67 pp. + appendices.
Ryden, D. W. 2005a. An augmentation plan for razorback sucker in the San Juan River. Addendum # 2: Justification for changing the beginning date of the eight-year stocking period (Final). U.S. Fish and Wildlife Service, Grand Junction, CO. 4 pp.
Ryden, D. W. 2005b. Augmentation and monitoring of the San Juan River razorback sucker population: 2004 Interim Progress Report (Final). U.S. Fish and Wildlife Service, Grand Junction, CO. 41 pp.
Ryden, D. W. 2005c. Long-term monitoring of sub-adult and adult large-bodied fishes in the San Juan River: 2004 Interim Progress Report (Final). U.S. Fish and Wildlife Service, Grand Junction, CO. 85 pp. + appendix.
Ryden, D. W. 2006a. Long-term monitoring of sub-adult and adult large-bodied fishes in the San Juan River: 2005. Interim Progress Report (Draft). U.S. Fish and Wildlife Service, Grand Junction, CO. 86 pp. + appendix.
Ryden, D. W. 2006b. Augmentation of Colorado pikeminnow in the San Juan River: 2005. Interim Progress Report (Draft). U.S. Fish and Wildlife Service, Grand Junction, CO. 20 pp.
Ryden, D. W, and F. K. Pfeifer. 1993. Adult fish collections on the San Juan River (1991-1992): Annual Progress Report. U.S. Fish and Wildlife Service, Grand Junction, CO. 69 pp.
Ryden, D. W., and F. K. Pfeifer. 1994a. An experimental stocking plan for razorback sucker in the San Juan River. U.S. Fish and Wildlife Service, Grand Junction, CO. 26 pp.
Ryden, D. W., and F. K. Pfeifer. 1994b. Adult fish community monitoring on the San Juan River: 1993 Annual Progress Report. U.S. Fish and Wildlife Service, Grand Junction, CO. 84 pp.
Ryden, D. W., and F. K. Pfeifer. 1995. Adult fish community monitoring on the San Juan River: 1994 Annual Progress Report. U.S. Fish and Wildlife Service, Grand Junction, CO. 94 pp.
Ryden, D. W., and F. K. Pfeifer. 1996. Adult fish community monitoring on the San Juan River: 1995 Annual Progress Report. U.S. Fish and Wildlife Service, Grand Junction, CO. 46 pp. + appendices.
San Juan River Recovery Implementation Program Biology Committee. 1995. San Juan River Basin Recovery Implementation Program: Program Document. U.S. Fish and Wildlife Service, Albuquerque, NM. 56 pp.

53
U.S. Fish and Wildlife Service. 1991. Endangered and threatened wildlife and
plants: the razorback sucker (Xyrauchen texanus) determined to be an endangered species. Dept. of the Interior, U.S. Fish and Wildlife Service, Federal register, 23 October 1991, 56:54957-54967.
U.S. Fish and Wildlife Service. 1994. Determination of critical habitat for the Colorado River endangered fishes; razorback sucker, Colorado pikeminnow, humpback chub, and bonytail chub. Dept. of the Interior, U.S. Fish and Wildlife Service, Federal Register, 21 March 1994, 59:13374-13400.
Van den Avyle, M. J. 1993. Dynamics of exploited fish populations. Pages 105-135 in C. C. Kohler and W. A. Hubert (eds.). Inland fisheries management in North America. American Fisheries Society, Bethesda, MD. 594 pp.
VTN Consolidated, Inc. and Museum of Northern Arizona. 1978. Fish, wildlife and habitat assessment; San Juan River, New Mexico and Utah. Gallup-Navajo Indian Water Supply Project. VTN Consolidated, Inc., Irvine, CA. 241 pp.

APPENDIX A
Pond stocking records for the SJRIP's grow-out ponds, 1998-2005.
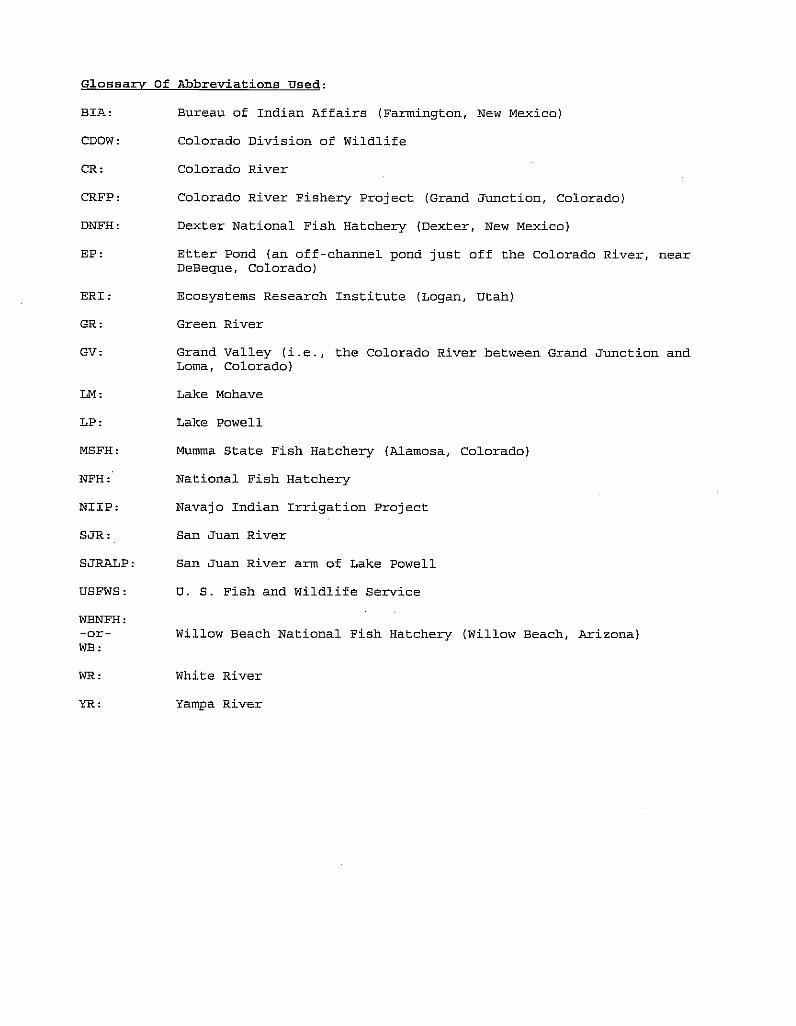

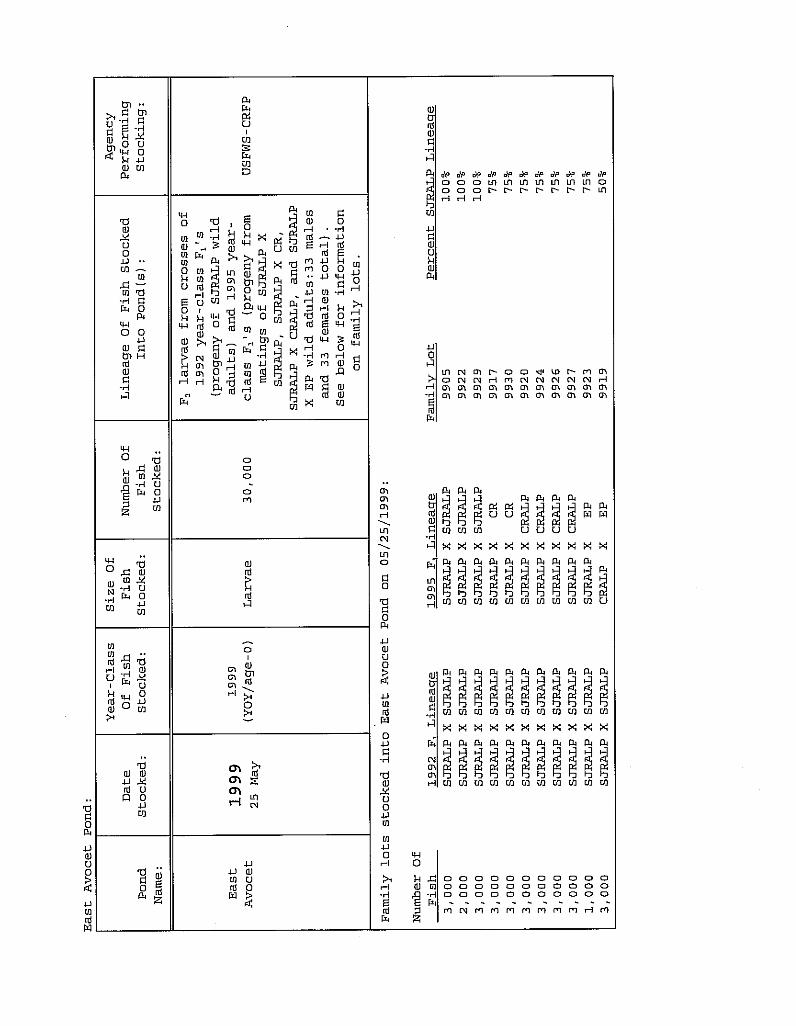
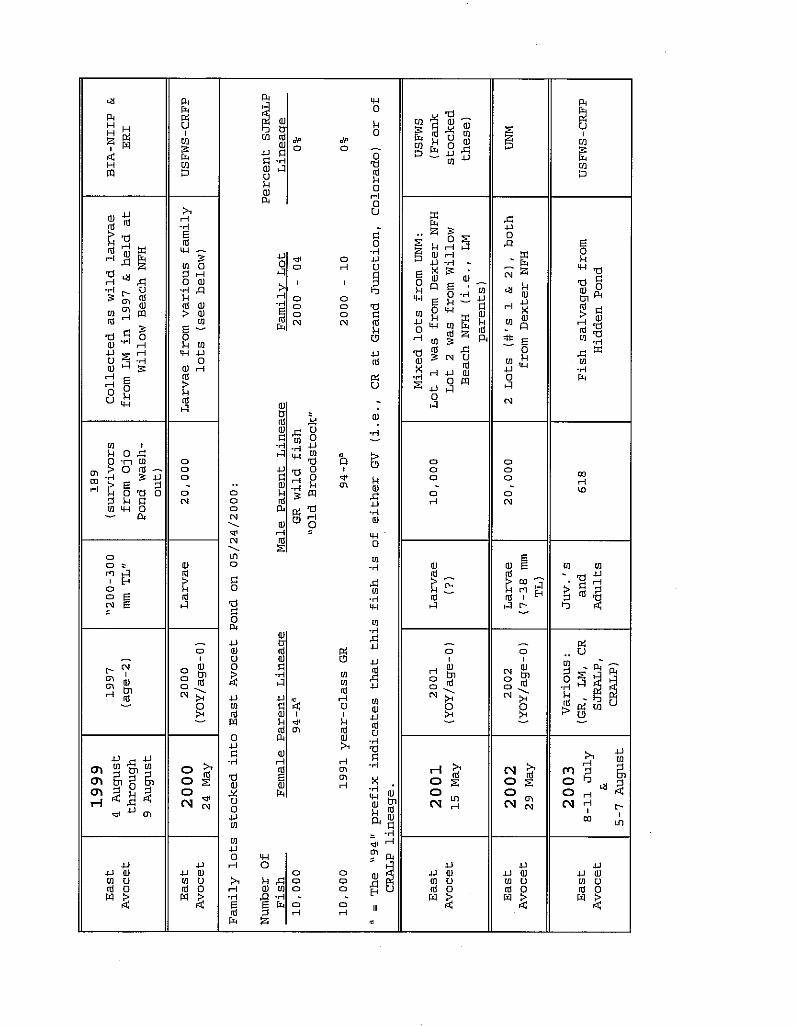
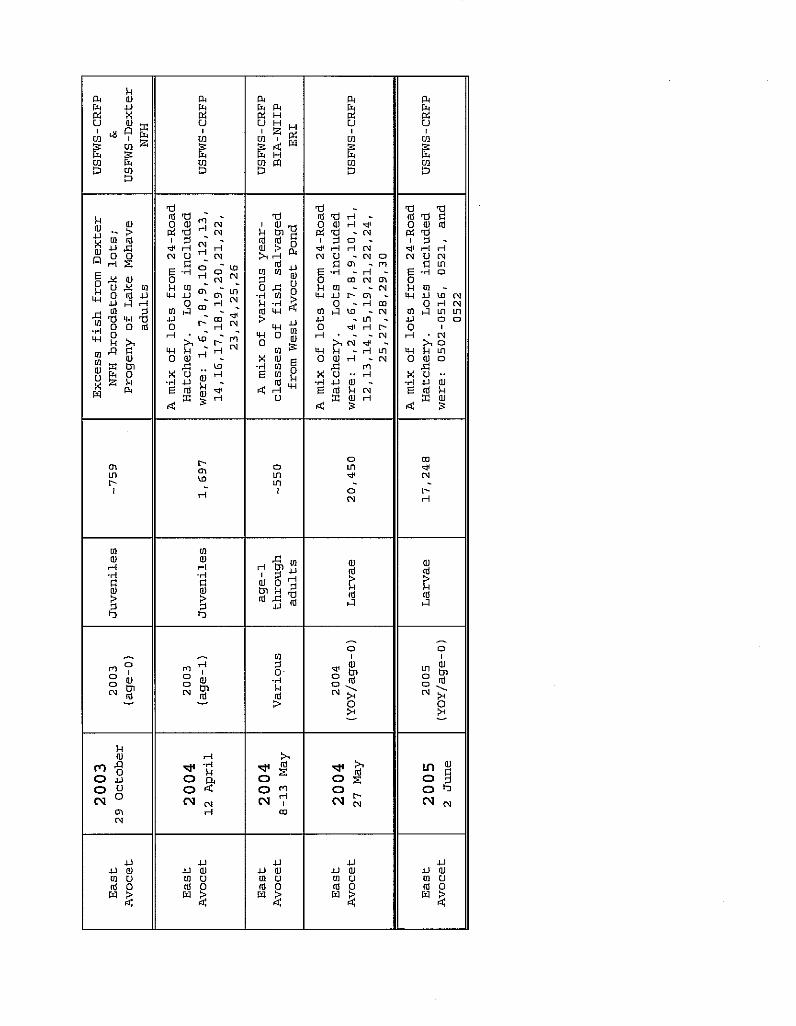
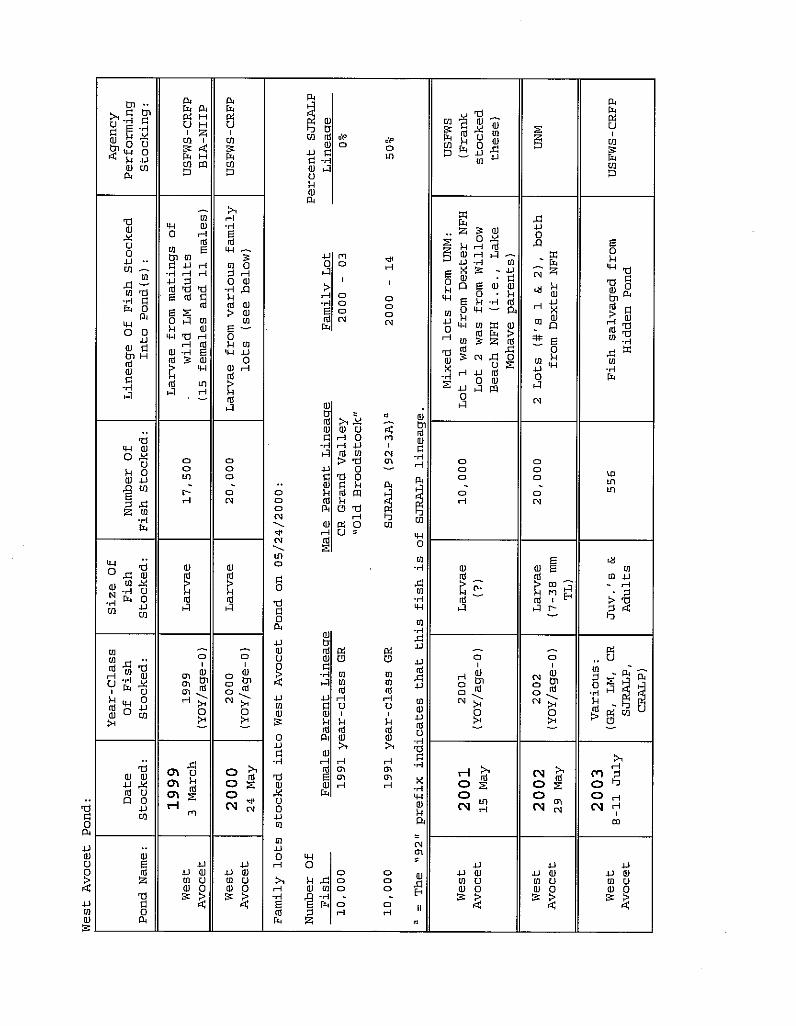
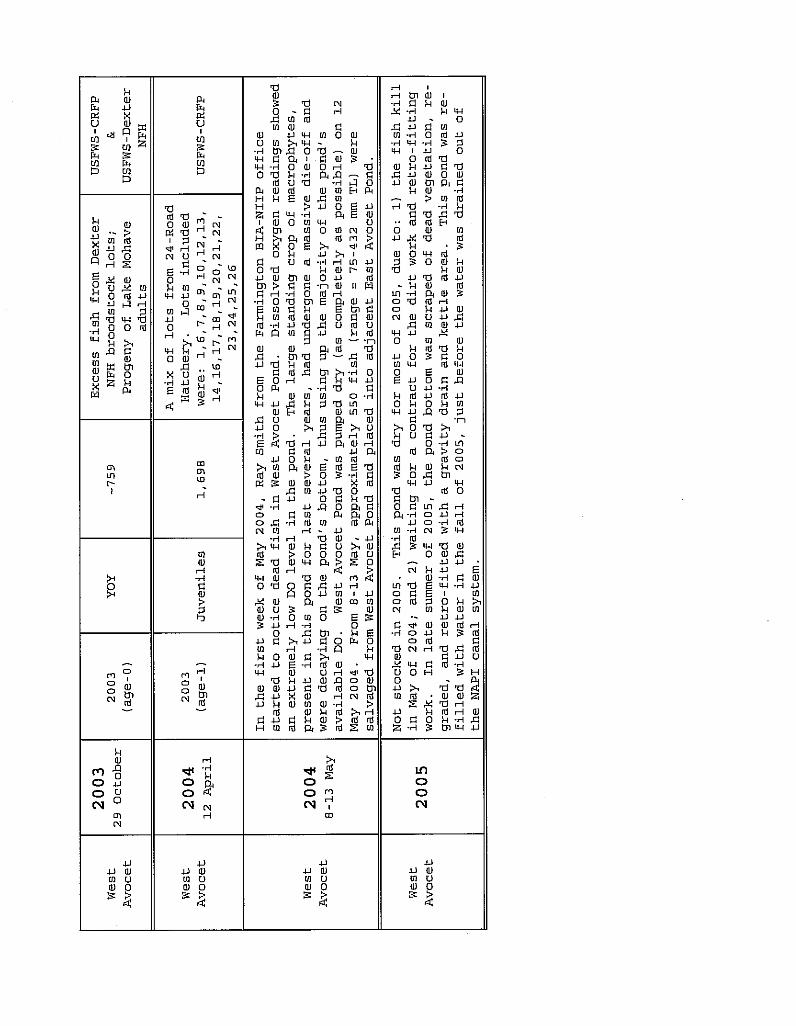


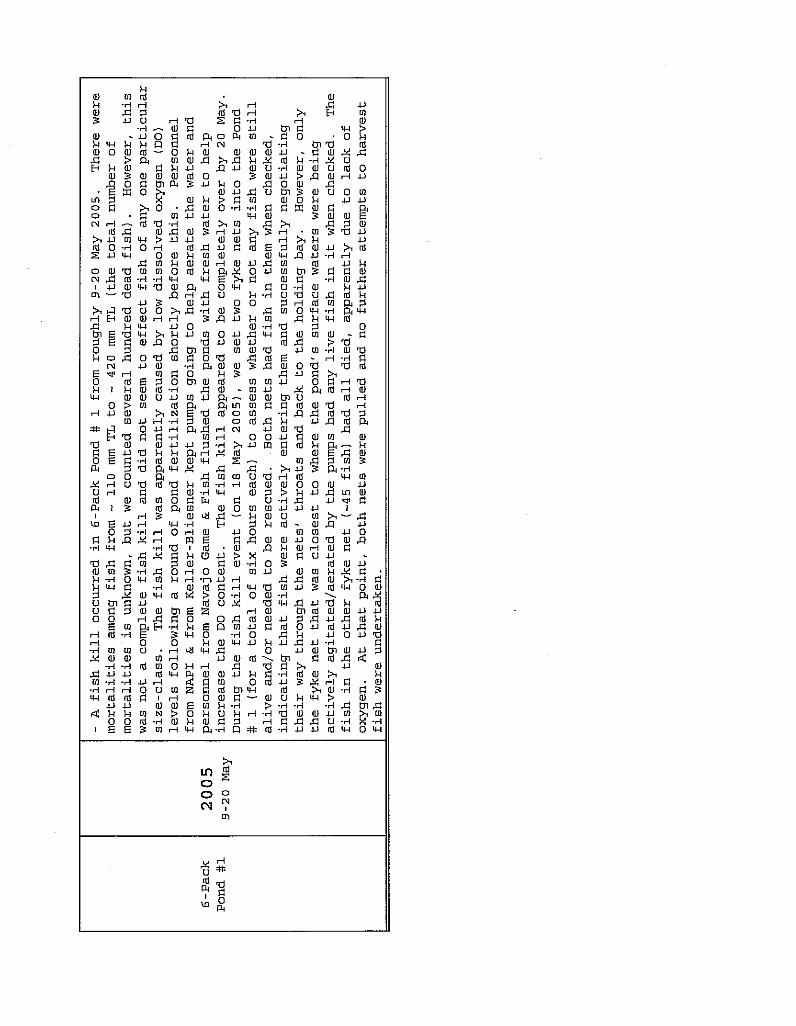
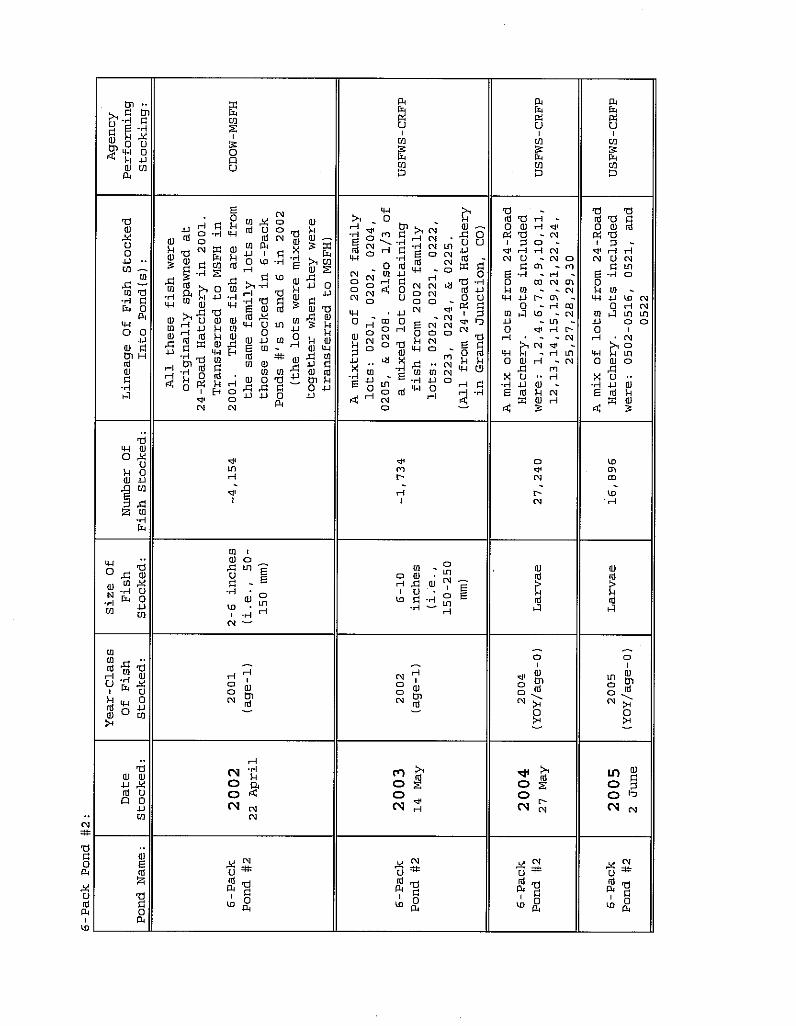
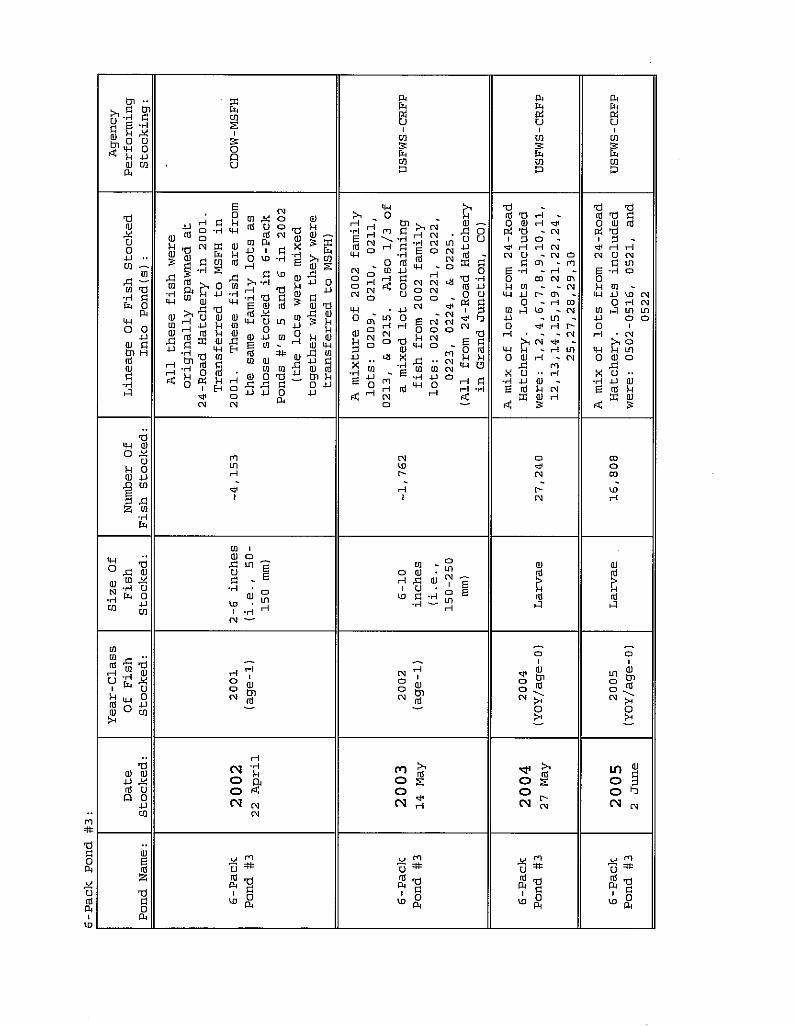
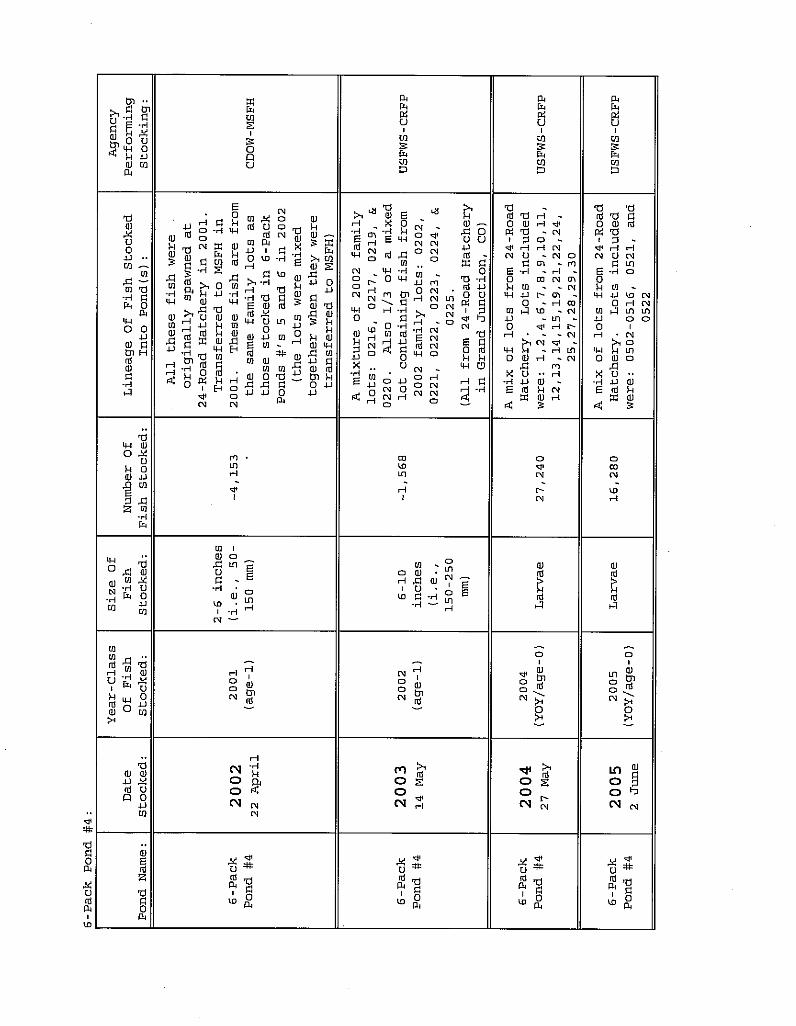
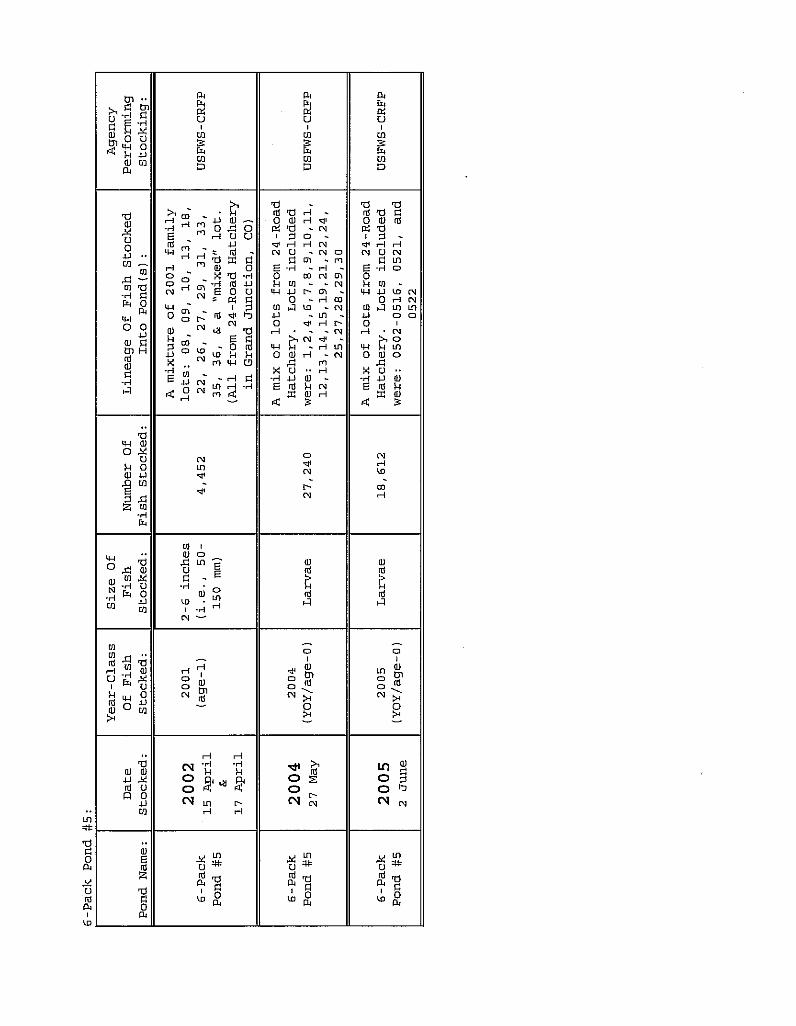
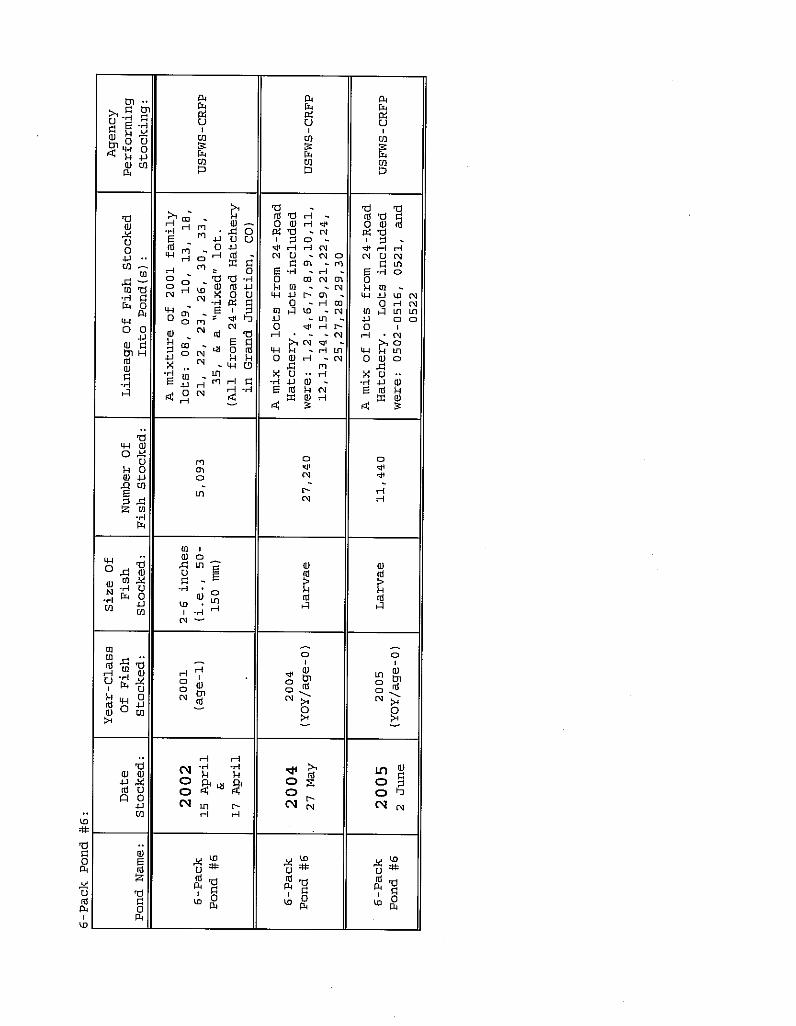

APPENDIX B
Pond harvest records for the SJRIP's grow-out ponds, 1998-2005.
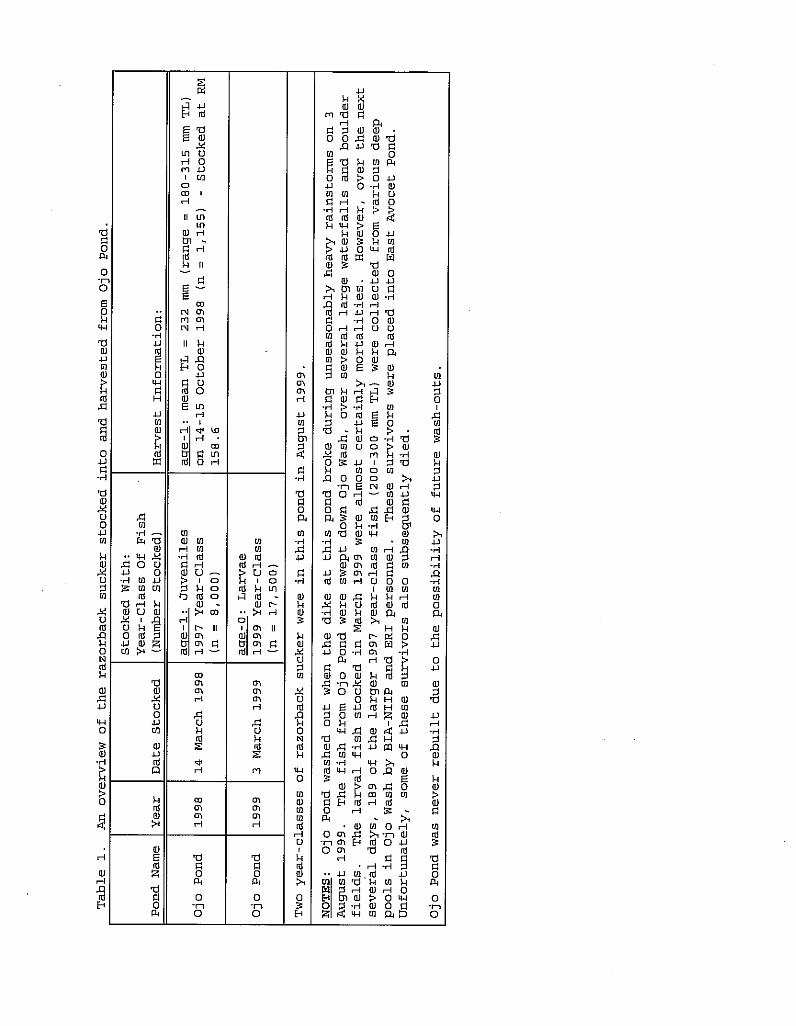
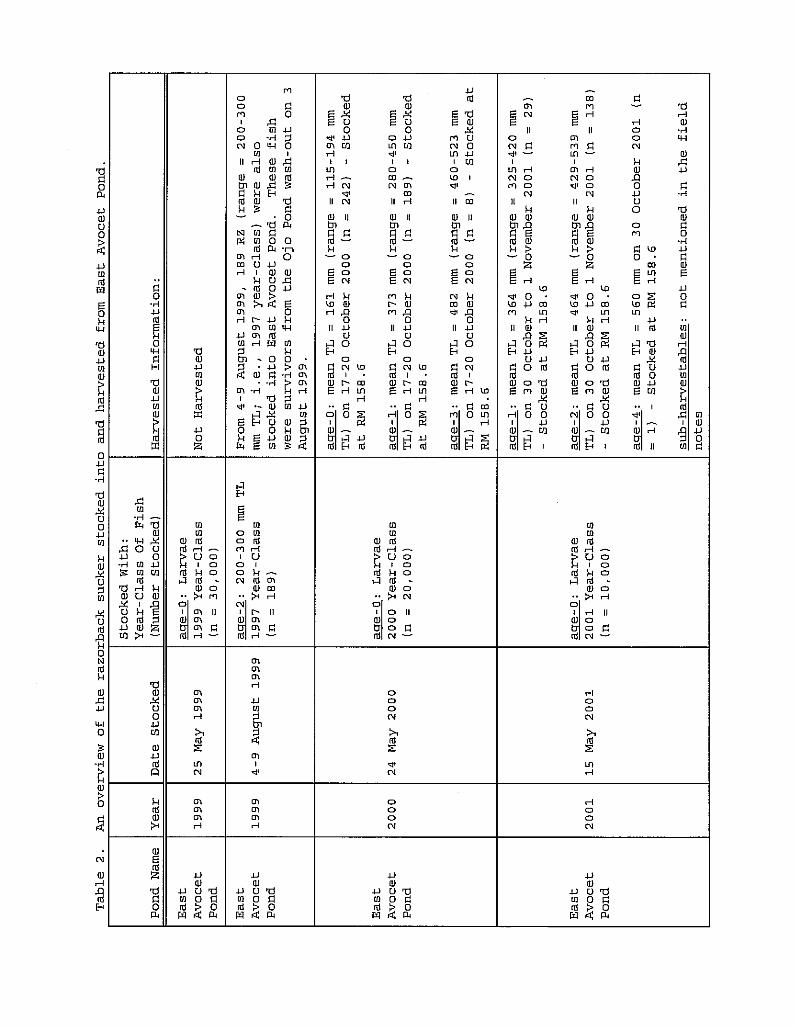


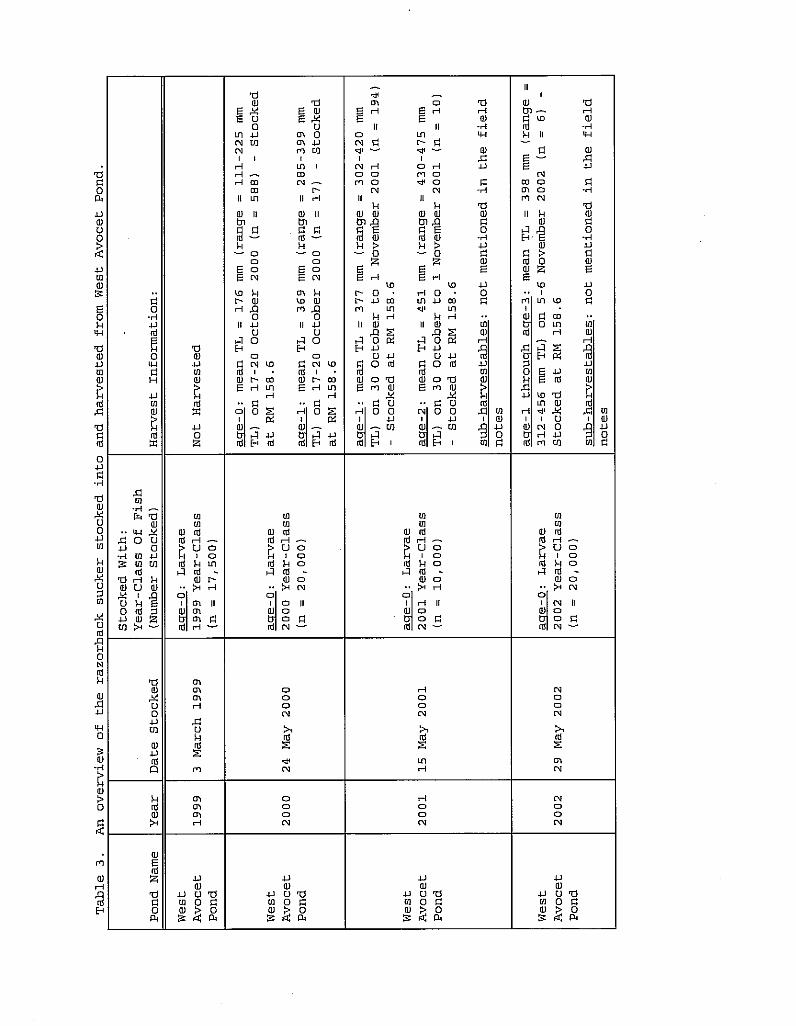
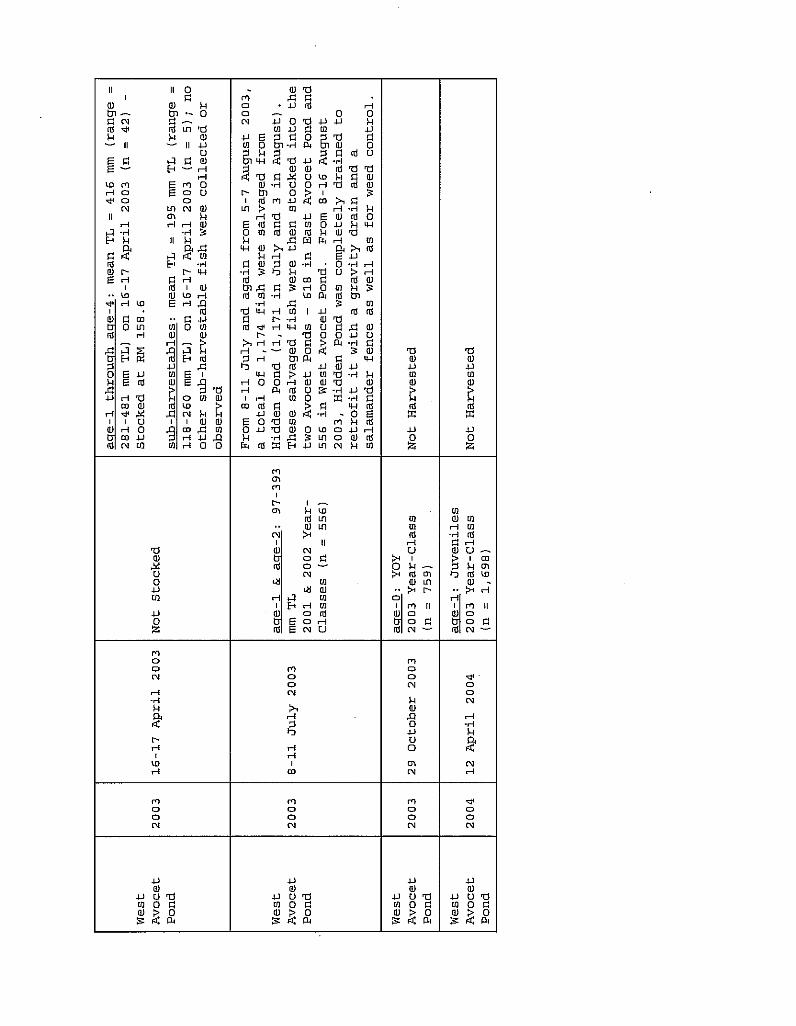
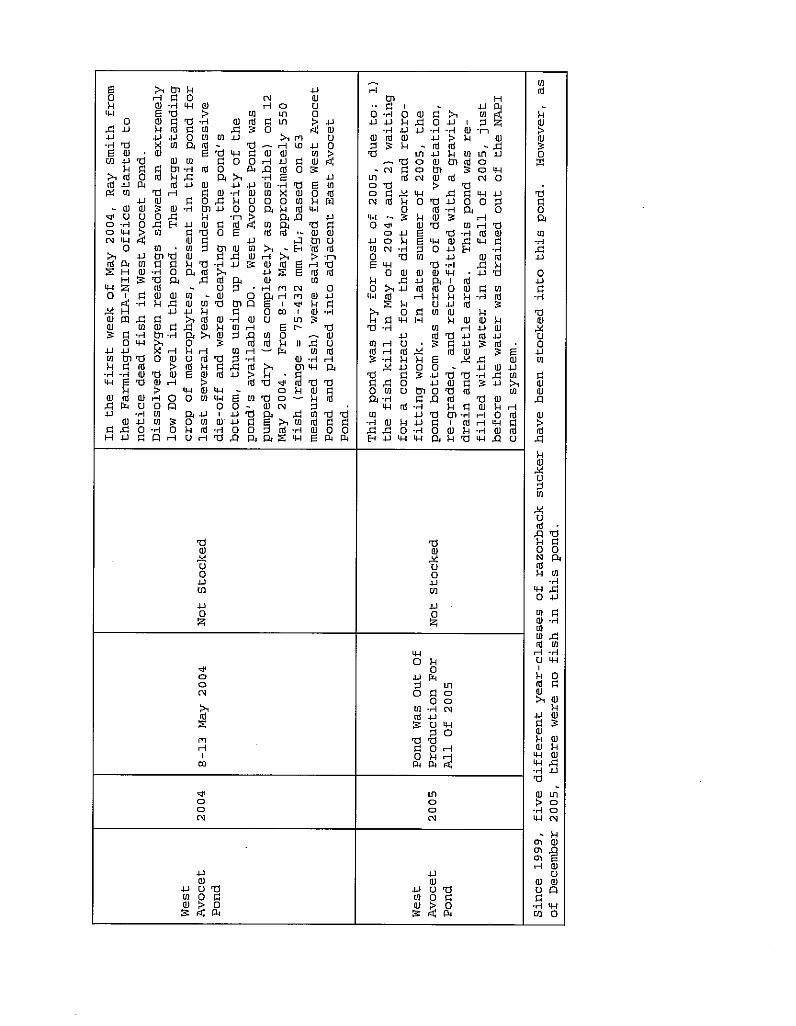

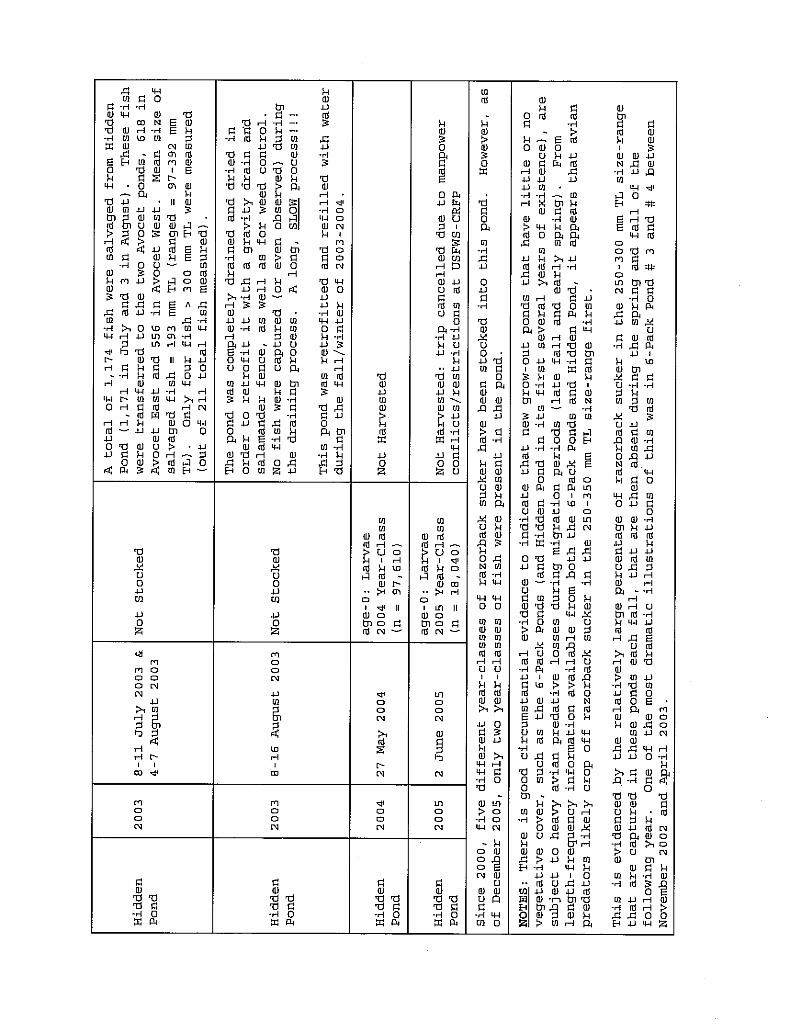
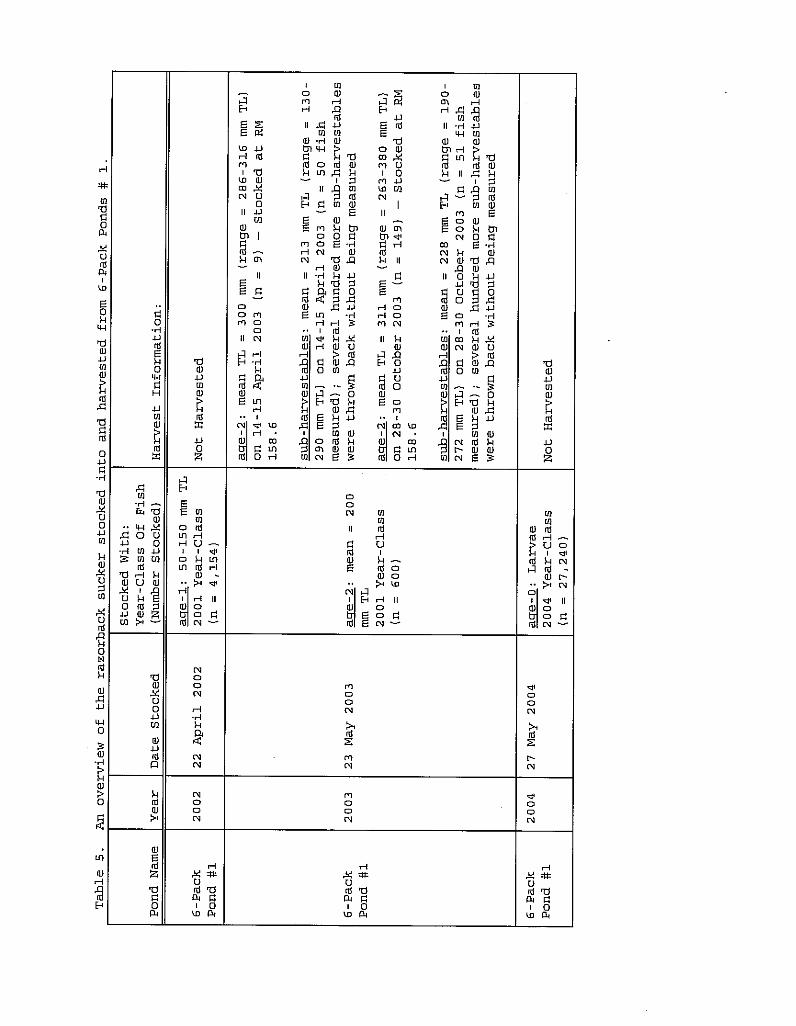
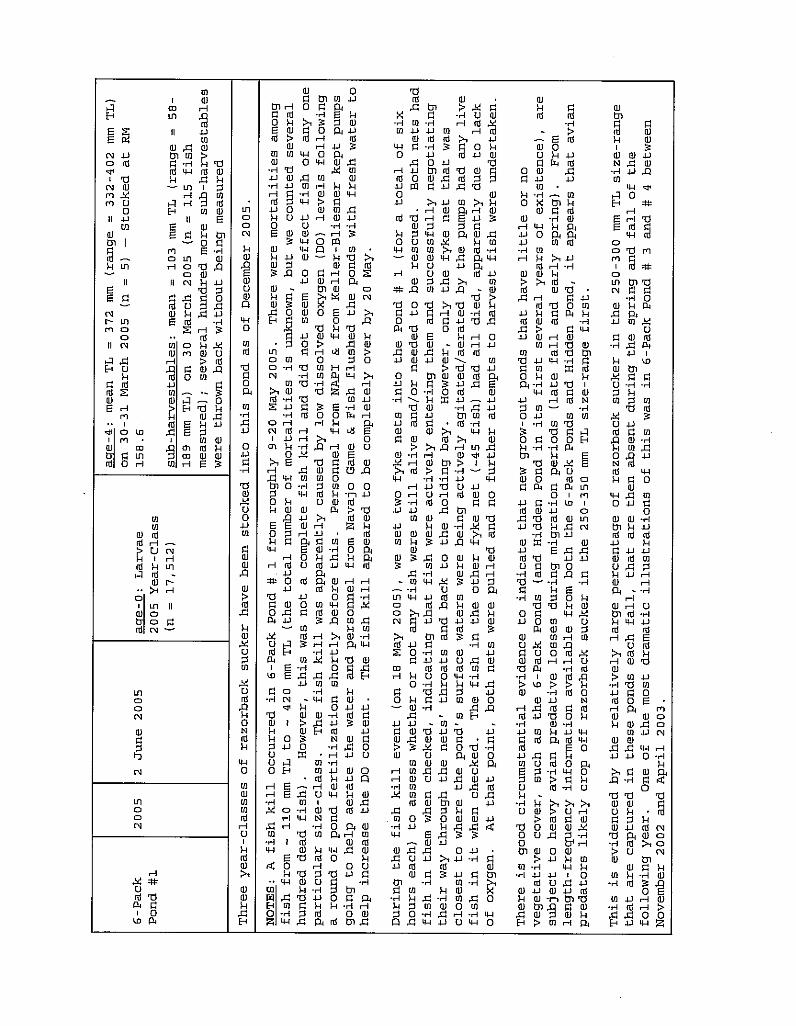
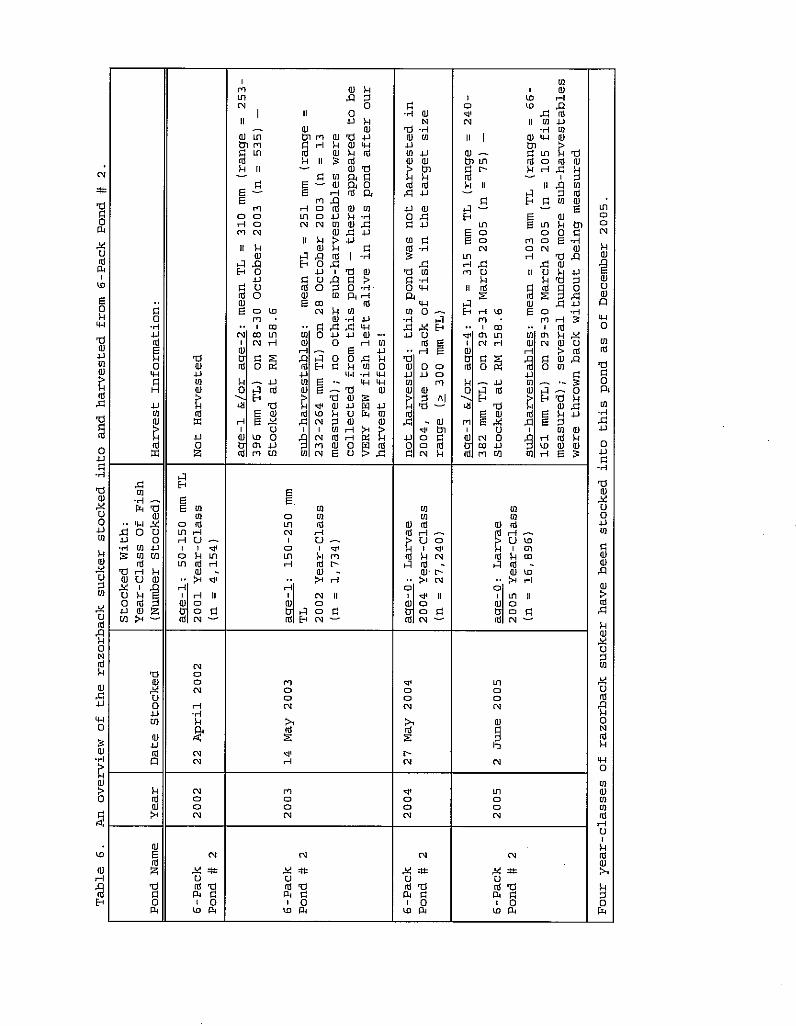

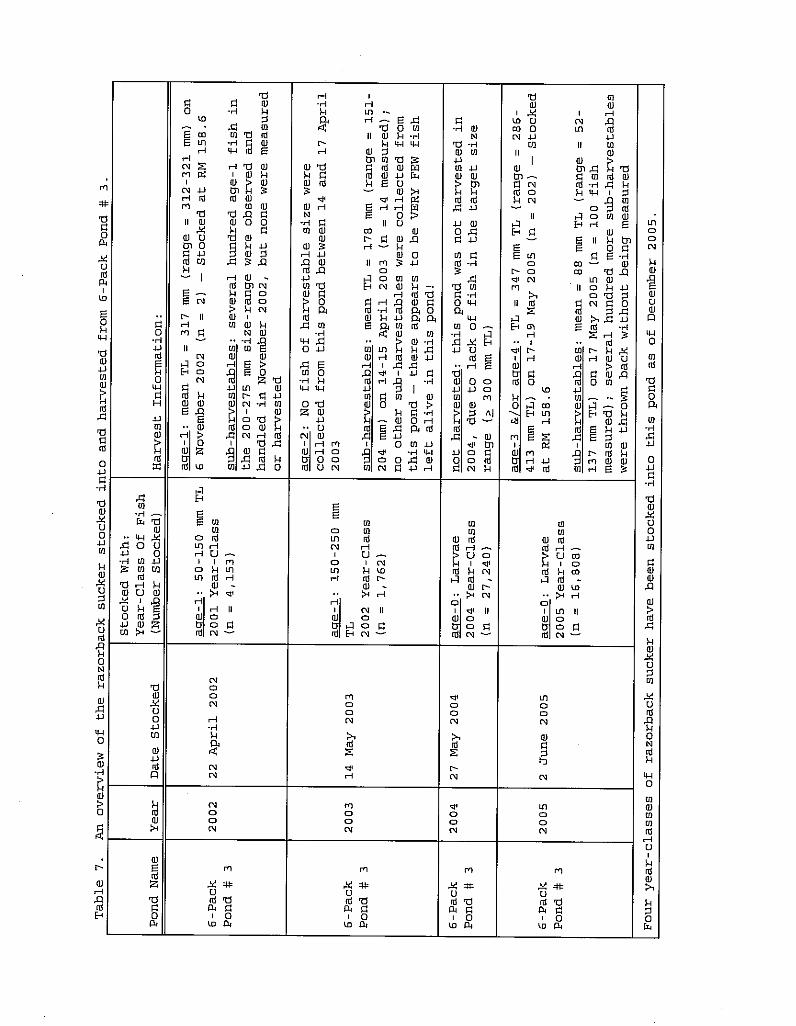
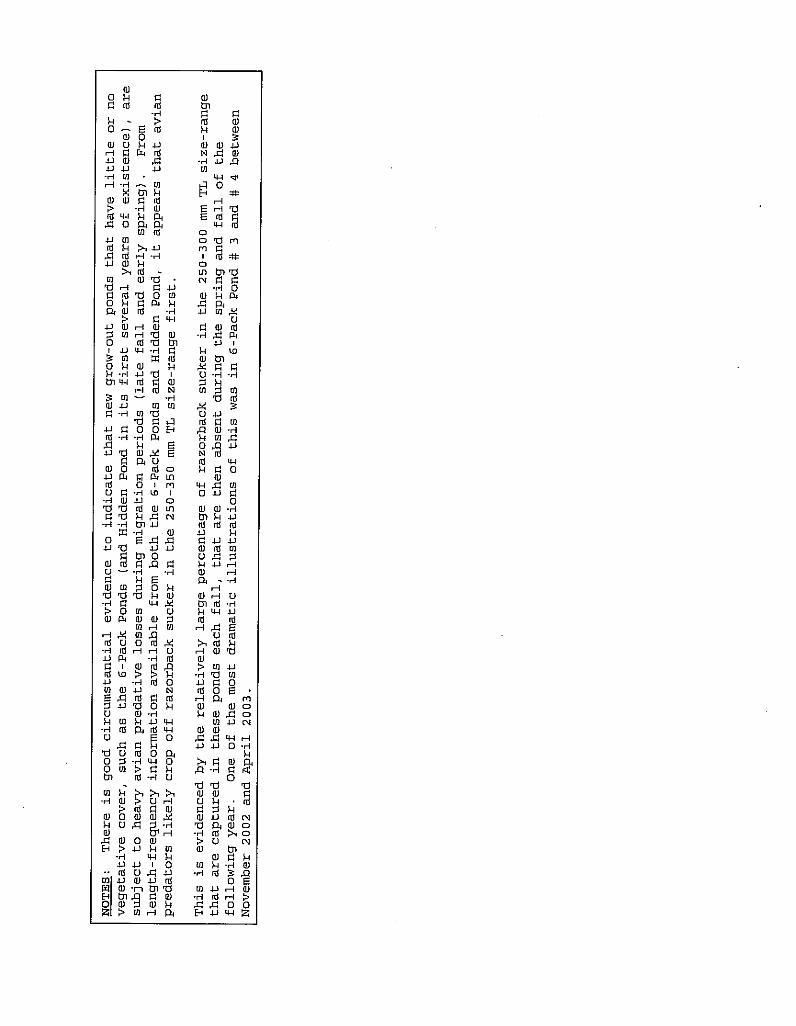


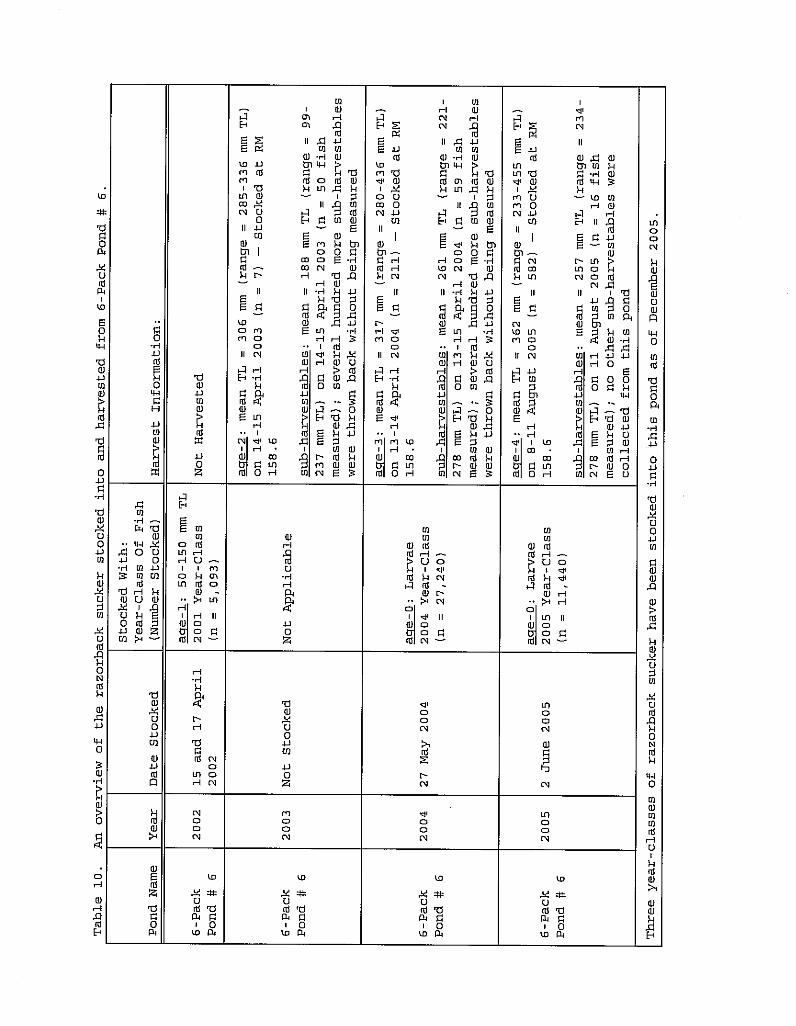
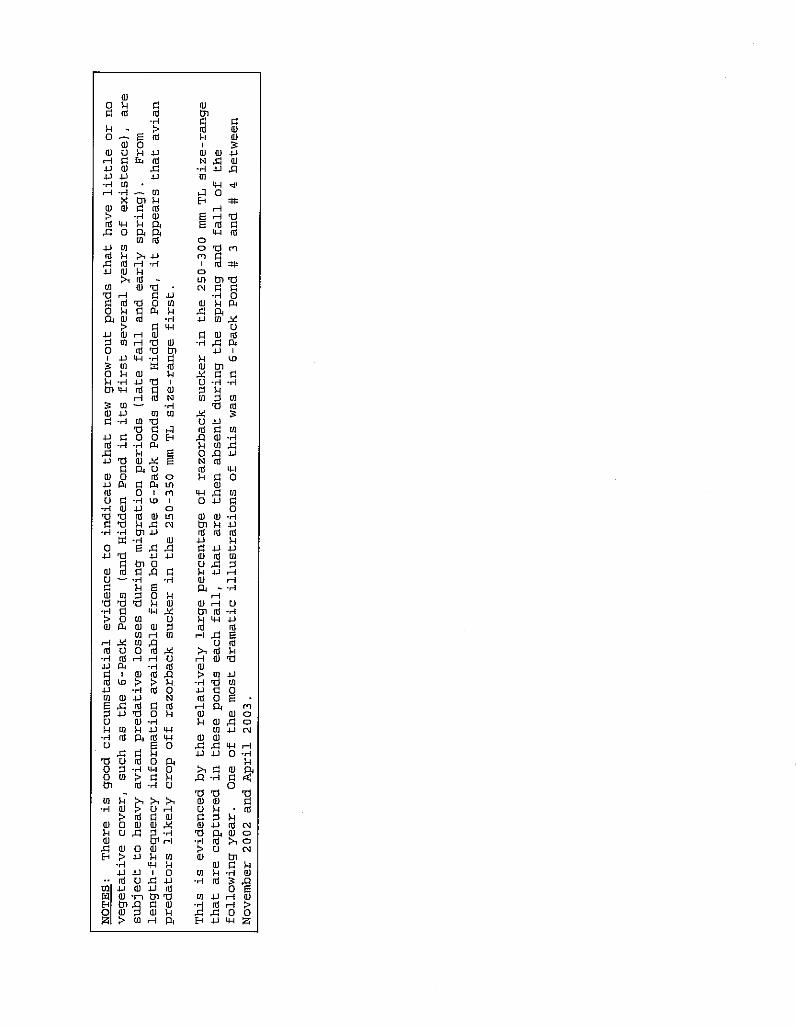

APPENDIX C
Parental lineages for 2000-2005 family lots of larval razorback sucker produced at the USFWS's 24-Road Hatchery (in Grand Junction, CO) and
subsequently stocked into the SJRIP's grow-out ponds (near Farmington, NM).

APPENDIX D
Point estimates generated for the Schnabel multiple-census population estimate, 1995-2005.
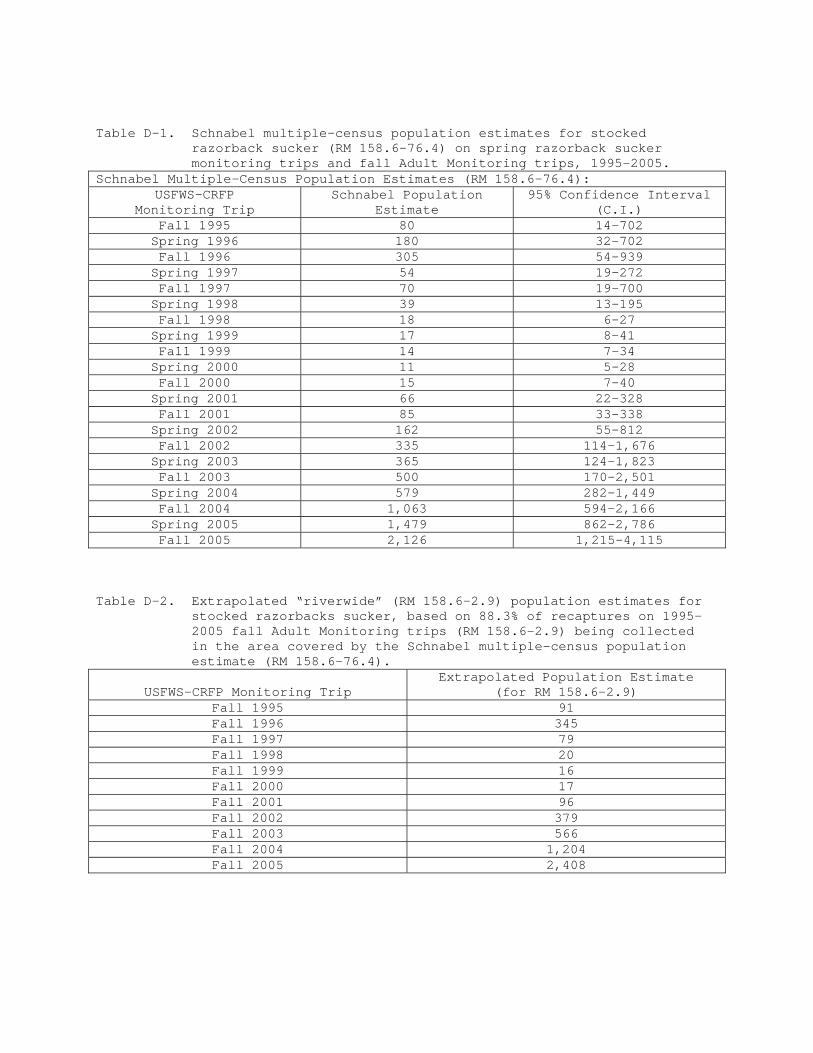
Table D-1. Schnabel multiple-census population estimates for stocked
razorback sucker (RM 158.6-76.4) on spring razorback sucker monitoring trips and fall Adult Monitoring trips, 1995-2005.
Schnabel Multiple-Census Population Estimates (RM 158.6-76.4): USFWS-CRFP
Monitoring Trip Schnabel Population
Estimate 95% Confidence Interval
(C.I.) Fall 1995 80 14-702 Spring 1996 180 32-702 Fall 1996 305 54-939 Spring 1997 54 19-272 Fall 1997 70 19-700 Spring 1998 39 13-195 Fall 1998 18 6-27 Spring 1999 17 8-41 Fall 1999 14 7-34 Spring 2000 11 5-28 Fall 2000 15 7-40 Spring 2001 66 22-328 Fall 2001 85 33-338 Spring 2002 162 55-812 Fall 2002 335 114-1,676 Spring 2003 365 124-1,823 Fall 2003 500 170-2,501 Spring 2004 579 282-1,449 Fall 2004 1,063 594-2,166 Spring 2005 1,479 862-2,786 Fall 2005 2,126 1,215-4,115
Table D-2. Extrapolated “riverwide” (RM 158.6-2.9) population estimates for
stocked razorbacks sucker, based on 88.3% of recaptures on 1995-2005 fall Adult Monitoring trips (RM 158.6-2.9) being collected in the area covered by the Schnabel multiple-census population estimate (RM 158.6-76.4).
USFWS-CRFP Monitoring Trip
Extrapolated Population Estimate (for RM 158.6-2.9)
Fall 1995 91 Fall 1996 345 Fall 1997 79 Fall 1998 20 Fall 1999 16 Fall 2000 17 Fall 2001 96 Fall 2002 379 Fall 2003 566 Fall 2004 1,204 Fall 2005 2,408