Auditor’s Report & Audited Financial Statements · with Bangladesh Standards on Auditing (BSA)....
52
Auditor’s Report & Audited Financial Statements
Transcript of Auditor’s Report & Audited Financial Statements · with Bangladesh Standards on Auditing (BSA)....

Auditor’s Report &Audited Financial Statements

Independent Auditor’s Report to the shareholders of Grameenphone Ltd. Report on the financial statements We have audited the accompanying financial statements of Grameenphone Ltd, which comprise the statement of financial position as at 31 December 2017, and the statement of profit or loss and other comprehensive income, statement of changes in equity and statement of cash flows for the year then ended, and a summary of significant accounting policies and other explanatory notes.
Management’s responsibility for the financial statements Management is responsible for the preparation and fair presentation of these financial statements in accordance with International Financial Reporting Standards (IFRS), Bangladesh Financial Reporting Standards (BFRS), the Companies Act 1994, the Securities and Exchange Rules 1987, and for such internal control as management determines is necessary to enable the preparation of financial statements that are free from material misstatement, whether due to fraud or error.
Auditor’s responsibility Our responsibility is to express an opinion on these financial statements based on our audit. We conducted our audit in accordance with Bangladesh Standards on Auditing (BSA). Those standards require that we comply with relevant ethical requirements and plan and perform the audit to obtain reasonable assurance whether the financial statements are free from material misstatement.
An audit involves performing procedures to obtain audit evidence about the amounts and disclosures in the financial statements. The procedures selected depend on our judgment, including the assessment of the risks of material misstatement of the financial statements, whether due to fraud or error. In making those risk assessments, we consider internal control relevant to the entity’s preparation and fair presentation of the financial statements in order to design audit procedures that are appropriate in the circumstances, but not for the purpose of expressing an opinion on the effectiveness of the entity’s internal control. An audit also includes evaluating the appropriateness of accounting policies used and the reasonableness of accounting estimates made by management, as well as evaluating the overall presentation of the financial statements.
We believe that the audit evidence we have obtained is sufficient and appropriate to provide a basis for our audit opinion.
Opinion In our opinion, the financial statements give a true and fair view of the financial position of the Company as at 31 December 2017 and of its financial performance and its cash flows for the year then ended in accordance with International Financial Reporting Standards (IFRS) and Bangladesh Financial Reporting Standards (BFRS).
Emphasis of matterWe draw users’ attention to Note 42 to the financial statements, where management explains the circumstances of claim from Bangladesh Telecommunication Regulatory Commission (BTRC), claim from National Board of Revenue (NBR) for SIM tax on replacement SIMs, the uncertainties of getting rebate of input VAT related to 2G licence renewal fee and claim from Large Taxpayers Unit (LTU) - VAT based on assessment by office of the Comptroller and Auditor General (C&AG), interest claim on SIM tax from NBR and management’s position on the same. Our opinion is not qualified in this regard.
Report on Other Legal and Regulatory RequirementsIn accordance with the Companies Act 1994 and the Securities and Exchange Rules 1987, we also report the following:a) we have obtained all the information and explanations, which to the best of our knowledge and belief were necessary for the purposes of our audit and made due verification thereof;
b) in our opinion, proper books of account as required by law have been kept by the Company so far as it appeared from our examination of these books;
c) the statement of financial position and statement of profit or loss and other comprehensive income dealt with by the report are in agreement with the books of account and returns; and
d) the expenditure incurred was for the purposes of the Company’s business.
Rahman Rahman HuqChartered AccountantsDhaka, 29 January 2018
Rahman Rahman HuqChartered Accountants9 & 5 Mohakhali C/ADhaka-1212, Bangladesh
Telephone +880 (2) 988 6450-2Fax +880 (2) 988 6449Email [email protected] www.kpmg.com/bd
76 Grameenphone Ltd. x Annual Report 2017
Auditor’s Report & Audited Financial Statements
Director Chief Executive Officer Company Secretary
Dhaka, 29 January 2018 Auditor
As per our report of same date.
Director
Ove
rvie
wAd
dit io
nal I
nfor
mat
ion
Fina
ncia
l Ana
lysi
sG
over
nanc
eSu
stai
nabi
lity
Busi
ness
Per
form
ance
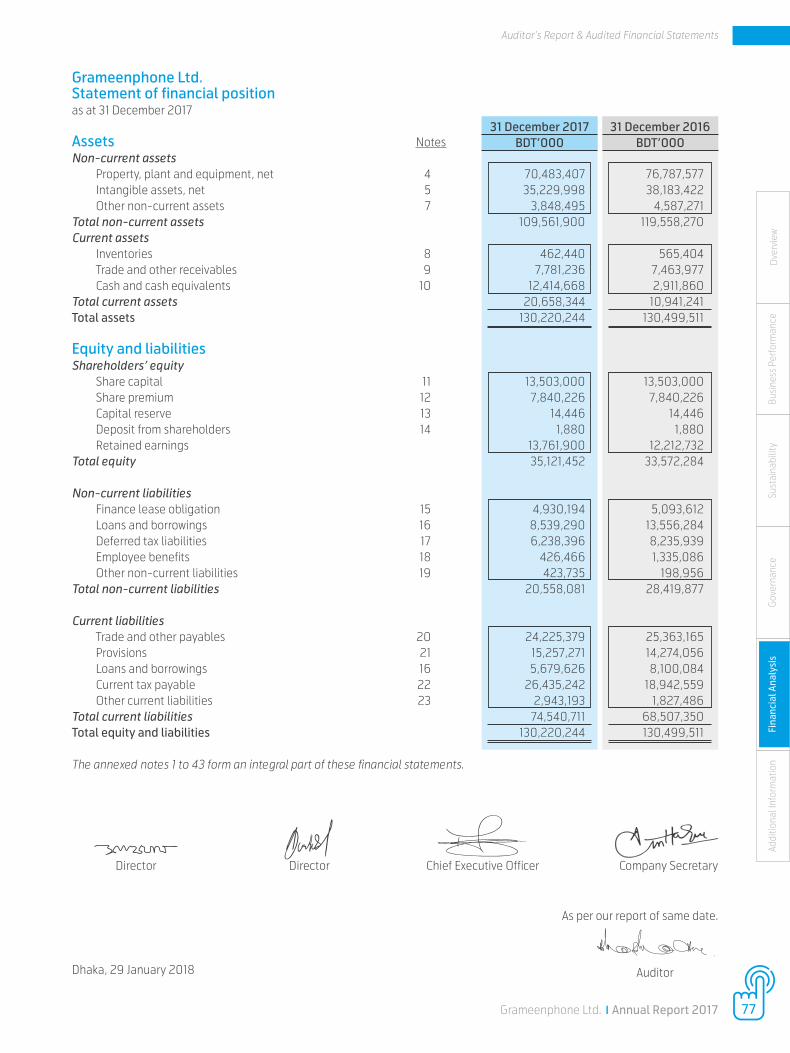
Grameenphone Ltd.Statement of financial position as at 31 December 2017 Assets NotesNon-current assets Property, plant and equipment, net 4 70,483,407 76,787,577 Intangible assets, net 5 35,229,998 38,183,422 Other non-current assets 7 3,848,495 4,587,271 Total non-current assets 109,561,900 119,558,270 Current assets Inventories 8 462,440 565,404 Trade and other receivables 9 7,781,236 7,463,977 Cash and cash equivalents 10 12,414,668 2,911,860 Total current assets 20,658,344 10,941,241 Total assets 130,220,244 130,499,511
Equity and liabilitiesShareholders’ equity Share capital 11 13,503,000 13,503,000 Share premium 12 7,840,226 7,840,226 Capital reserve 13 14,446 14,446 Deposit from shareholders 14 1,880 1,880 Retained earnings 13,761,900 12,212,732 Total equity 35,121,452 33,572,284 Non-current liabilities Finance lease obligation 15 4,930,194 5,093,612 Loans and borrowings 16 8,539,290 13,556,284 Deferred tax liabilities 17 6,238,396 8,235,939 Employee benefits 18 426,466 1,335,086 Other non-current liabilities 19 423,735 198,956 Total non-current liabilities 20,558,081 28,419,877 Current liabilities Trade and other payables 20 24,225,379 25,363,165 Provisions 21 15,257,271 14,274,056 Loans and borrowings 16 5,679,626 8,100,084 Current tax payable 22 26,435,242 18,942,559 Other current liabilities 23 2,943,193 1,827,486 Total current liabilities 74,540,711 68,507,350 Total equity and liabilities 130,220,244 130,499,511 The annexed notes 1 to 43 form an integral part of these financial statements.
31 December 2017BDT’000
31 December 2016BDT’000
77Grameenphone Ltd. x Annual Report 2017
Auditor’s Report & Audited Financial Statements
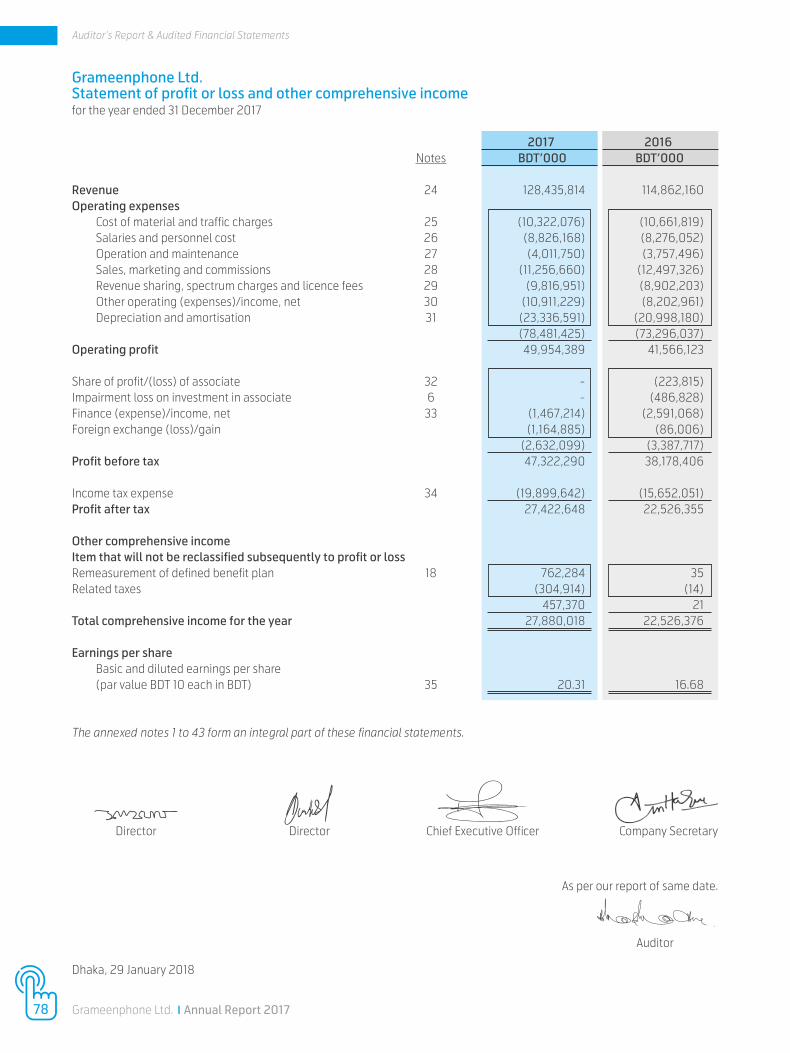
Grameenphone Ltd.Statement of profit or loss and other comprehensive incomefor the year ended 31 December 2017
2017 2016 Notes BDT’000 BDT’000
Revenue 24 128,435,814 114,862,160 Operating expenses Cost of material and traffic charges 25 (10,322,076) (10,661,819) Salaries and personnel cost 26 (8,826,168) (8,276,052) Operation and maintenance 27 (4,011,750) (3,757,496) Sales, marketing and commissions 28 (11,256,660) (12,497,326) Revenue sharing, spectrum charges and licence fees 29 (9,816,951) (8,902,203) Other operating (expenses)/income, net 30 (10,911,229) (8,202,961) Depreciation and amortisation 31 (23,336,591) (20,998,180) (78,481,425) (73,296,037)Operating profit 49,954,389 41,566,123
Share of profit/(loss) of associate 32 - (223,815)Impairment loss on investment in associate 6 - (486,828)Finance (expense)/income, net 33 (1,467,214) (2,591,068)Foreign exchange (loss)/gain (1,164,885) (86,006) (2,632,099) (3,387,717)Profit before tax 47,322,290 38,178,406
Income tax expense 34 (19,899,642) (15,652,051)Profit after tax 27,422,648 22,526,355
Other comprehensive incomeItem that will not be reclassified subsequently to profit or lossRemeasurement of defined benefit plan 18 762,284 35Related taxes (304,914) (14) 457,370 21Total comprehensive income for the year 27,880,018 22,526,376
Earnings per share Basic and diluted earnings per share (par value BDT 10 each in BDT) 35 20.31 16.68
The annexed notes 1 to 43 form an integral part of these financial statements.
Director Chief Executive Officer Company Secretary
Dhaka, 29 January 2018
Auditor
As per our report of same date.
Director
78 Grameenphone Ltd. x Annual Report 2017
Auditor’s Report & Audited Financial Statements
Ove
rvie
wAd
dit io
nal I
nfor
mat
ion
Fina
ncia
l Ana
lysi
sG
over
nanc
eSu
stai
nabi
lity
Busi
ness
Per
form
ance
Gra
mee
npho
ne L
td.
St
atem
ent o
f cha
nges
in e
quity
for t
he y
ear e
nded
31 D
ecem
ber 2
017
Sh
are
Shar
e Ca
pita
l D
epos
it fro
m
Reta
ined
ca
pita
l pr
emiu
m
rese
rve
shar
ehol
ders
ea
rnin
gs
Tota
l
BDT’
00
0
BDT’
00
0
BDT’
00
0
BDT’
00
0
BDT’
00
0
BDT’
00
0
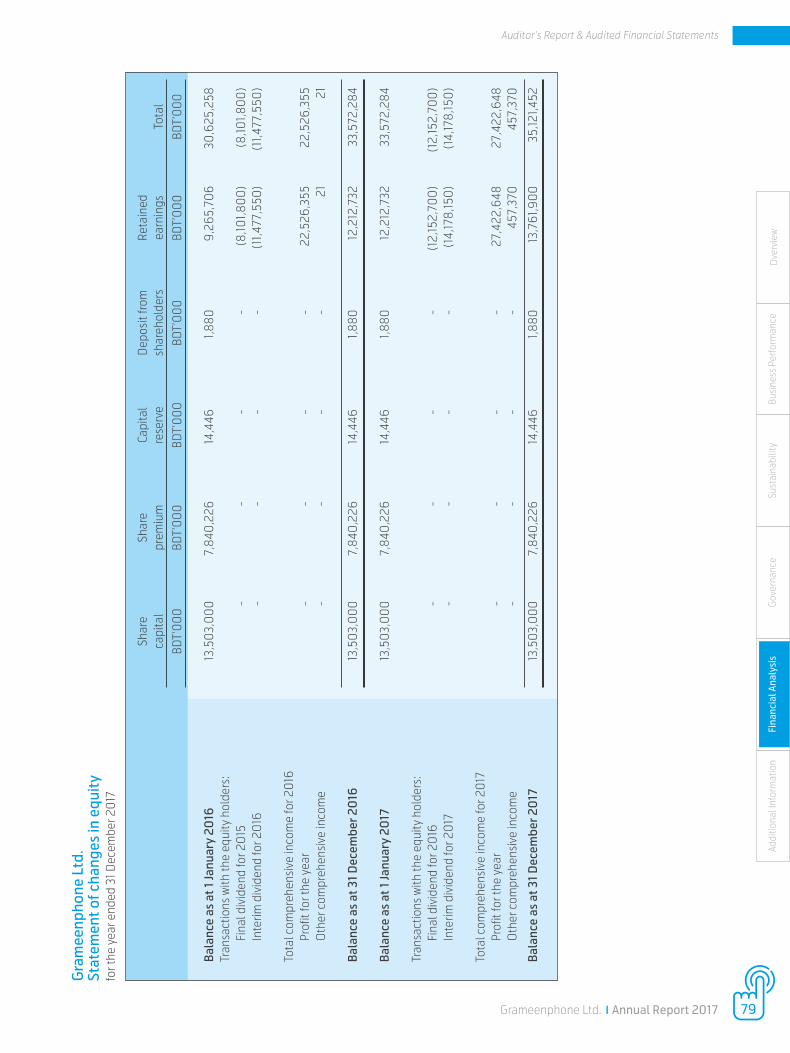
Bala
nce
as a
t 1 Ja
nuar
y 20
16
13,5
03,
00
0
7,8
40,2
26
14,4
46
1,88
0
9,2
65,7
06
3
0,6
25,2
58Tr
ansa
ctio
ns w
ith th
e eq
uity
hol
ders
:
Fina
l div
iden
d fo
r 20
15
-
-
-
-
(8,10
1,80
0)
(8,10
1,80
0)
In
terim
div
iden
d fo
r 20
16
-
-
-
-
(11,4
77,5
50)
(11,4
77,5
50)
Tota
l com
preh
ensi
ve in
com
e fo
r 20
16
Profi
t for
the
year
-
-
-
-
2
2,52
6,35
5
22,
526,
355
O
ther
com
preh
ensi
ve in
com
e -
-
-
-
2
1 2
1
Bala
nce
as a
t 31 D
ecem
ber 2
016
13
,50
3,0
00
7
,840
,226
14
,446
1,
880
12
,212
,732
3
3,57
2,28
4
Bala
nce
as a
t 1 Ja
nuar
y 20
17
13,5
03,
00
0
7,8
40,2
26
14,4
46
1,88
0
12,2
12,7
32
33,
572,
284
Tran
sact
ions
with
the
equi
ty h
olde
rs:
Fi
nal d
ivid
end
for 2
016
-
-
-
-
(1
2,15
2,70
0)
(12,
152,
700
)
Inte
rim d
ivid
end
for 2
017
-
-
-
-
(1
4,17
8,15
0)
(14,
178,
150
)
Tota
l com
preh
ensi
ve in
com
e fo
r 20
17
Profi
t for
the
year
-
-
-
-
2
7,42
2,64
8
27,
422,
648
O
ther
com
preh
ensi
ve in
com
e -
-
-
-
4
57,3
70
457
,370
Bala
nce
as a
t 31 D
ecem
ber 2
017
13
,50
3,0
00
7
,840
,226
14
,446
1,
880
13
,761
,90
0
35,
121,4
52
79Grameenphone Ltd. x Annual Report 2017
Auditor’s Report & Audited Financial Statements
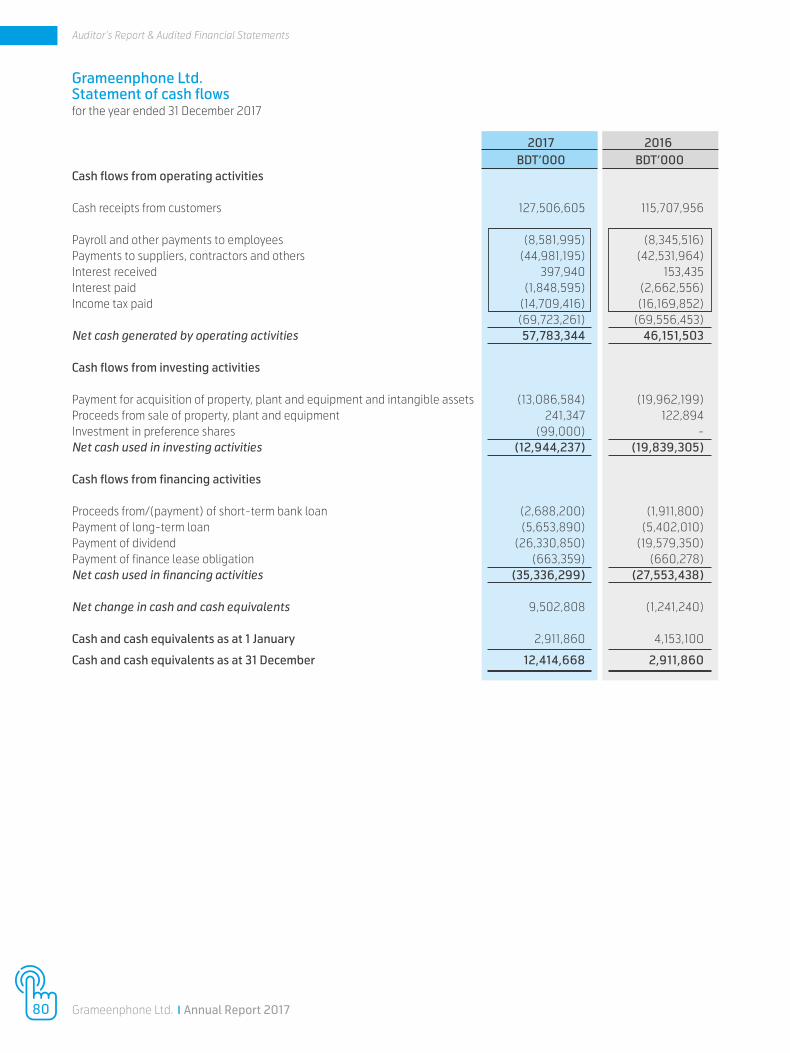
Grameenphone Ltd.Statement of cash flows for the year ended 31 December 2017
2017 2016 BDT’000 BDT’000 Cash flows from operating activities
Cash receipts from customers 127,506,605 115,707,956
Payroll and other payments to employees (8,581,995) (8,345,516)Payments to suppliers, contractors and others (44,981,195) (42,531,964)Interest received 397,940 153,435Interest paid (1,848,595) (2,662,556)Income tax paid (14,709,416) (16,169,852) (69,723,261) (69,556,453)Net cash generated by operating activities 57,783,344 46,151,503
Cash flows from investing activities
Payment for acquisition of property, plant and equipment and intangible assets (13,086,584) (19,962,199)Proceeds from sale of property, plant and equipment 241,347 122,894Investment in preference shares (99,000) -Net cash used in investing activities (12,944,237) (19,839,305)
Cash flows from financing activities
Proceeds from/(payment) of short-term bank loan (2,688,200) (1,911,800)Payment of long-term loan (5,653,890) (5,402,010)Payment of dividend (26,330,850) (19,579,350)Payment of finance lease obligation (663,359) (660,278)Net cash used in financing activities (35,336,299) (27,553,438)
Net change in cash and cash equivalents 9,502,808 (1,241,240)
Cash and cash equivalents as at 1 January 2,911,860 4,153,100
Cash and cash equivalents as at 31 December 12,414,668 2,911,860
80 Grameenphone Ltd. x Annual Report 2017
Auditor’s Report & Audited Financial Statements
Ove
rvie
wAd
dit io
nal I
nfor
mat
ion
Fina
ncia
l Ana
lysi
sG
over
nanc
eSu
stai
nabi
lity
Busi
ness
Per
form
ance
Grameenphone Ltd.Notes to the financial statementsfor the year ended 31 December 2017
1 Corporate informationGrameenphone Ltd. (hereinafter referred to as “Grameenphone”/”GP”/”the company”) is a public limited company incorporated in Bangladesh in 1996 under the Companies Act 1994 and has its registered address at GPHOUSE, Bashundhara, Baridhara, Dhaka 1229. Grameenphone was initially registered as a private limited company and subsequently converted into a public limited company on 25 June 2007. During November 2009, Grameenphone listed its shares with both Dhaka and Chittagong Stock Exchanges. The immediate parent of Grameenphone is Telenor Mobile Communications AS and the ultimate parent is Telenor ASA; both the companies are incorporated in Norway.
The company is primarily involved in providing mobile telecommunication services (voice, data and other related services) in Bangladesh. The company also provides international roaming services through international roaming agreements with various operators of different countries across the world.
2 Basis of preparationThese financial statements are unconsolidated financial statements (also known as individual financial statements) of Grameenphone as at and for the year ended 31 December 2017. These unconsolidated financial statements present the financial position and performance of Grameenphone and Grameenphone’s investment in Accenture Communications Infrastructure Solutions Ltd. (ACISL) being accounted for under the equity method in accordance with (IAS/BAS) 28 Investment in Associates and Joint Ventures.
For understanding of Grameenphone’s stand-alone financial performance, a separate statement of profit or loss and other comprehensive income has been appended to these financial statements as supplementary information.
These financial statements have been prepared in accordance with International Financial Reporting Standards (IFRS), Bangladesh Financial Reporting Standards (BFRS), the Companies Act 1994, the Securities and Exchange Rules 1987 and other applicable laws in Bangladesh. The requirements of IFRS and BFRS, to the extent relevant to these financial statements, do not vary from each other.
These financial statements have been prepared on going concern basis. Unless otherwise specifically mentioned, historical cost principle has been followed for the purpose of these financial statements.
Authorisation for issue
These financial statements were authorised for issue by the Board of Directors of the company on 29 January 2018.
2.1 Functional and presentation currencyItems included in these financial statements are measured using the currency of the primary economic environment in which the company operates (‘the functional currency’). These financial statements are presented in Bangladesh Taka (“BDT”) which is also the functional currency of the company. The amounts in these financial statements have been rounded off to the nearest BDT in thousand (BDT’000) except otherwise indicated. As a result of these rounding off, in some instances the totals may not match the sum of individual balances.
2.2 Use of estimates and judgementsThe preparation of financial statements requires management to make judgments, estimates and assumptions that affect the reported amounts of revenues, expenses, assets and liabilities, and the accompanying disclosures including the disclosure of contingent liabilities. Uncertainty about these assumptions and estimates could result in outcomes that require a material adjustment to the carrying amount of assets or liabilities affected in future periods.
JudgmentsIn the process of applying the accounting policies, management has made the following judgments, which have the most significant effect on the amounts recognised in the financial statements:
81Grameenphone Ltd. x Annual Report 2017
Notes to the financial statements

1. The company has a lease agreement with Bangladesh Railway for Fibre Optic Network (FON) and this lease has been treated as finance lease. For details, please see Note 15 to these financial statements.
2. The company has significant influence over Accenture Communications Infrastructure Solutions Ltd.
3. The company has entered into lease agreements for base stations, switch locations and office space. After evaluation of the terms and conditions of these agreements the company has determined that it does not have substantial risks and rewards related to the assets. For operating lease commitments, please see Note 30.2 to these financial statements.
Estimates and assumptions
Key estimates and assumptions used in preparation of these financial statements are:
1. Applicable tax rate for Income Year 2017 will be declared by Finance Act 2018. For the purpose of these financial statements, management has assumed that the existing corporate tax rate (40%) will be applicable for Income Year 2017 as well.
2. Appropriate financial and demographic assumptions have been used in consultation with a certified actuary tomeasure defined benefit obligation as at 31 December 2017.
3. key assumptions about the likelihood and magnitude of outflow of resources have been used to recognize and measure provisions and contingencies.
4. Recoverable amount of Investment in associate.
3 Significant accounting policiesAccounting policies set out below have been applied consistently to all years presented in these financial statements. Comparative information has been rearranged wherever considered necessary to conform to the current year’s presentation.
3.1 Current versus non-current classification The company presents assets and liabilities in statement of financial position based on current/non-current classification. An asset is current when it is:
i) expected to be realised or intended to be sold or consumed in normal operating cycle, or ii) expected to be realised within twelve months after the reporting period, or iii) held primarily for the purpose of trading, or iv) cash or cash equivalent unless restricted from being exchanged or used to settle a liability for at least twelve months after the reporting period.
All other assets are classified as non-current.
A liability is current when it is:
i) expected to be settled in normal operating cycle, or ii) due to be settled within twelve months after the reporting period, or iii) held primarily for the purpose of trading, or iv) there is no unconditional right to defer the settlement of the liability for at least twelve months after the reporting period.
The company classifies all other liabilities as non-current.
Deferred tax assets and liabilities are classified as non-current assets and liabilities.
3.2 OffsettingThe company reports separately both assets and liabilities, and income and expenses, unless required by an applicable accounting standard or offsetting reflects the substance of the transaction and such offsetting is permitted by applicable accounting standard.
Cash receipts and payments on behalf of customers when the cash flows reflect the activities of the customer rather than those of the entity and cash receipts and payments for items in which the turnover is quick, the amounts are large, and the maturities are short are presented net in the statement of cash flows.
82 Grameenphone Ltd. x Annual Report 2017
Notes to the financial statements

Ove
rvie
wAd
dit io
nal I
nfor
mat
ion
Fina
ncia
l Ana
lysi
sG
over
nanc
eSu
stai
nabi
lity
Busi
ness
Per
form
ance
3.3 Cash dividend to the equity holders The company recognises a liability to make cash dividend when the distribution is authorised and the distribution is no longer at the discretion of the company. As per the corporate laws in Bangladesh, a distribution is authorised when it is approved by the shareholders. A corresponding amount is recognised directly in equity.
3.4 Property, plant and equipment (a) Recognition and measurement
Items of property, plant and equipment are measured at cost less accumulated depreciation and accumulated impairment losses, if any.
The cost of an item of property, plant and equipment comprises its purchase price, import duties and non-refundable taxes, after deducting trade discount and rebates, and any costs directly attributable to bringing the asset to the location and condition necessary for it to be capable of operating in the intended manner. Cost also includes initial estimate of the costs of dismantling and removing the item and restoring the site on which it is located and capitalised borrowing costs. The obligations for costs of dismantling and removing the item and restoring the site (generally called ‘asset retirement obligation’) are recognised and measured in accordance with IAS/BAS 37 Provisions, Contingent Liabilities and Contingent Assets. Purchased software that is integral to the functionality of the related equipment is capitalised as part of that equipment.
When major parts of an item of property, plant and equipment have different useful lives, they are accounted for as separate items (major components) of property, plant and equipment.
(b) Subsequent costsThe cost of replacing or upgradation of an item of property, plant and equipment is recognised in the carrying amount of the item if it is probable that the future economic benefits embodied within the item will flow to the company and its cost can be measured reliably. The carrying amount of the replaced component is derecognised. The costs of the day to day servicing of property, plant and equipment are recognised in profit or loss as incurred.
(c) DepreciationNo depreciation is charged on land and capital work in progress (CWIP) as the land has unlimited useful life and CWIP has not yet been placed in service.
Depreciation on other items of property, plant and equipment is recognised on a straight-line basis over the estimated useful life of each item of property, plant and equipment. Leased assets are depreciated over the shorter of the lease term and their useful lives unless it is reasonably certain that the company will obtain ownership by the end of the lease term. Depreciation method, useful lives and residual values are reviewed at each year-end and adjusted if appropriate. The estimated useful lives of the items of property, plant and equipment for the current and comparative periods are as follows:
2017 2016
Years Years
Own assets
Building 10 -50 10 -50
Base station - equipment 3-10 3-10
Base station - tower, fibre optic network and related assets 7- 30 7- 30
Transmission equipment 5-10 5-10
Computers and other IT equipment 3-4 4
Furniture and fixtures (including office equipment) 3-5 3-5
Vehicles 4 4
Leased asset
Fibre Optic Network (FON) 22.5 - 30 22.5 - 30
83Grameenphone Ltd. x Annual Report 2017
Notes to the financial statements
(d) DerecognitionAn item of property, plant and equipment is derecognised upon disposal or when no future economic benefits are expected from its use or disposal. Any gain or loss on derecognition of an item of property, plant and equipment is determined as the difference between the net disposal proceeds and the carrying amount of the asset and is recognised in profit or loss.
(e) Capital work in progressCapital work in progress consists of unfinished work at sites and capital inventory. Spare parts expected to be used for more than one year are treated as capital work in progress. In case of import of components, capital work in progress is recognised when risks and rewards associated with such assets are transferred to the company.
(f) Capitalisation of borrowing costsAs per the requirements of IAS/BAS 23 Borrowing Costs, directly attributable borrowing costs are capitalised during construction period for all qualifying assets. A qualifying asset is an asset that necessarily takes a substantial period of time to get ready for its intended use or sale. The borrowing costs that are directly attributable to the acquisition, construction or production of a qualifying asset are those borrowing costs that would have been avoided if the expenditure on the qualifying asset had not been made. All other borrowing costs are recognised in profit or loss in the period in which they are incurred.
3.5 Intangible assets
(a) Recognition and measurement Intangible assets that are acquired by the company and have finite useful lives are measured at cost less accumulated amortisation and accumulated impairment loss, if any. Intangible assets are recognised when all the conditions for recognition as per IAS/BAS 38 Intangible Assets are met. The cost of an intangible asset comprises its purchase price, import duties and non-refundable taxes and any directly attributable cost of preparing the asset for its intended use.
Expenditure on research activities, undertaken with the prospect of gaining new scientific or technical knowledge and understanding, is recognised in the profit or loss as incurred.
Development activities involve a plan or design for the production of new and substantially improved products and processes. Development expenditures, on an individual project, are recognised as an intangible asset when the company can demonstrate all of the following:
(a) the technical feasibility of completing the intangible asset so that it will be available for use or sale;
(b) its intention to complete the intangible asset and use or sell it;
(c) its ability to use or sell the intangible asset;
(d) how the intangible asset will generate probable future economic benefits. Among other things, the entity can demonstrate the existence of a market for the output of the intangible asset or the intangible asset itself or, if it is to be used internally, the usefulness of the intangible asset;
(e) the availability of adequate technical, financial and other resources to complete the development and to use or sell the intangible asset; and
(f) its ability to measure reliably the expenditure attributable to the intangible asset during its development. Other development expenditures are recognised in profit or loss as incurred. Development costs previouslyrecognised as an expense are not recognised as an asset in a subsequent period. Following initial recognition ofthe development expenditure as an asset, the cost model is applied requiring the asset to be carried at cost lessany accumulated amortisation and accumulated impairment losses. Amortisation of the asset begins whendevelopment is complete and the asset is placed in service. It is amortised over the period of expectedfuture economic benefits. During the period of development, the asset is tested for impairment annually.
Internally generated intangible assets, excluding capitalised development costs, are not capitalised and expenditure is reflected in profit or loss in the year in which the expenditure is incurred.
(b) Subsequent costs Subsequent costs are capitalised only when they increase the future economic benefits embodied in the specific asset to which they relate. All other costs are recognised in profit or loss as incurred.
84 Grameenphone Ltd. x Annual Report 2017
Notes to the financial statements
Ove
rvie
wAd
dit io
nal I
nfor
mat
ion
Fina
ncia
l Ana
lysi
sG
over
nanc
eSu
stai
nabi
lity
Busi
ness
Per
form
ance
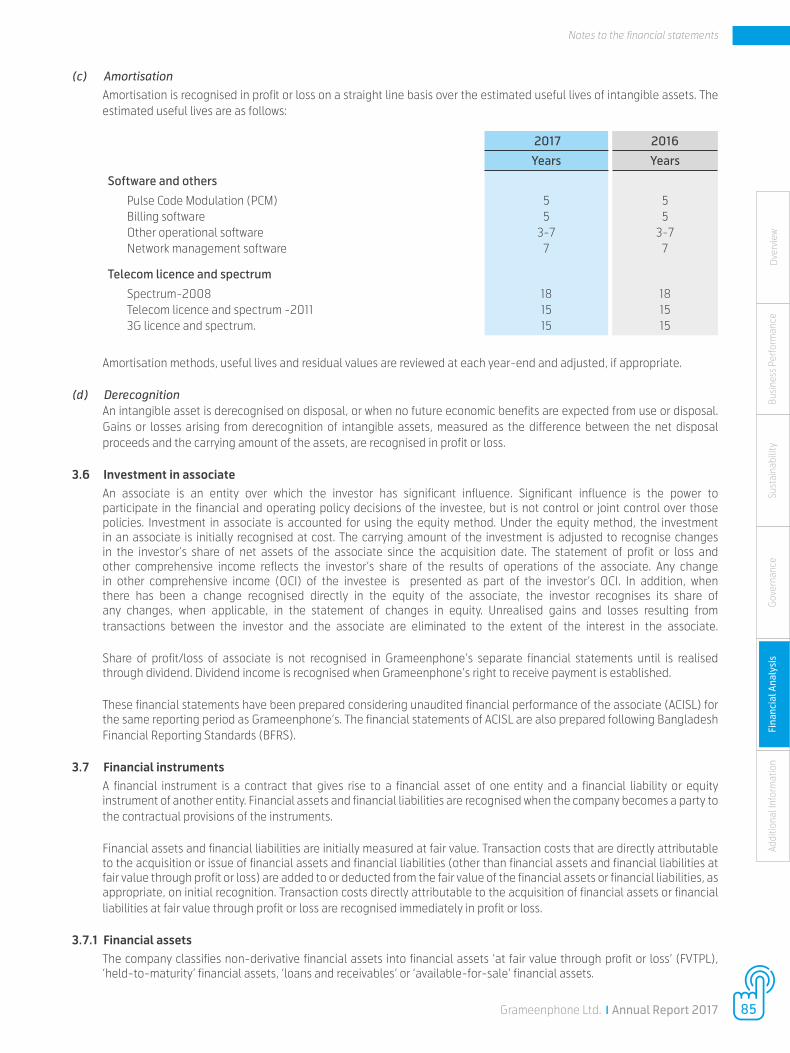
(c) Amortisation Amortisation is recognised in profit or loss on a straight line basis over the estimated useful lives of intangible assets. The estimated useful lives are as follows:
2017 2016
Years Years
Software and others
Pulse Code Modulation (PCM)Billing softwareOther operational softwareNetwork management software
55
3-77
55
3-77
Telecom licence and spectrum
Spectrum-2008Telecom licence and spectrum -20113G licence and spectrum.
181515
181515
Amortisation methods, useful lives and residual values are reviewed at each year-end and adjusted, if appropriate.
(d) DerecognitionAn intangible asset is derecognised on disposal, or when no future economic benefits are expected from use or disposal. Gains or losses arising from derecognition of intangible assets, measured as the difference between the net disposal proceeds and the carrying amount of the assets, are recognised in profit or loss.
3.6 Investment in associateAn associate is an entity over which the investor has significant influence. Significant influence is the power to participate in the financial and operating policy decisions of the investee, but is not control or joint control over those policies. Investment in associate is accounted for using the equity method. Under the equity method, the investment in an associate is initially recognised at cost. The carrying amount of the investment is adjusted to recognise changes in the investor’s share of net assets of the associate since the acquisition date. The statement of profit or loss and other comprehensive income reflects the investor’s share of the results of operations of the associate. Any change in other comprehensive income (OCI) of the investee is presented as part of the investor’s OCI. In addition, when there has been a change recognised directly in the equity of the associate, the investor recognises its share of any changes, when applicable, in the statement of changes in equity. Unrealised gains and losses resulting from transactions between the investor and the associate are eliminated to the extent of the interest in the associate. Share of profit/loss of associate is not recognised in Grameenphone’s separate financial statements until is realised through dividend. Dividend income is recognised when Grameenphone’s right to receive payment is established.
These financial statements have been prepared considering unaudited financial performance of the associate (ACISL) for the same reporting period as Grameenphone’s. The financial statements of ACISL are also prepared following Bangladesh Financial Reporting Standards (BFRS).
3.7 Financial instrumentsA financial instrument is a contract that gives rise to a financial asset of one entity and a financial liability or equity instrument of another entity. Financial assets and financial liabilities are recognised when the company becomes a party to the contractual provisions of the instruments.
Financial assets and financial liabilities are initially measured at fair value. Transaction costs that are directly attributable to the acquisition or issue of financial assets and financial liabilities (other than financial assets and financial liabilities at fair value through profit or loss) are added to or deducted from the fair value of the financial assets or financial liabilities, as appropriate, on initial recognition. Transaction costs directly attributable to the acquisition of financial assets or financial liabilities at fair value through profit or loss are recognised immediately in profit or loss.
3.7.1 Financial assetsThe company classifies non-derivative financial assets into financial assets ‘at fair value through profit or loss’ (FVTPL), ‘held-to-maturity’ financial assets, ‘loans and receivables’ or ‘available-for-sale’ financial assets.
85Grameenphone Ltd. x Annual Report 2017
Notes to the financial statements
The company derecognises a financial asset when the contractual rights or probabilities of receiving the cash flows from the asset expire, or it transfers the rights to receive the contractual cash flows on the financial asset in a transaction in which substantially all the risks and rewards of ownership of the financial asset are transferred. Any interest in such transferred financial assets that is created or retained by the company is recognised as a separate financial asset or liability.
Financial assets and liabilities are offset and the net amount is presented in the statement of financial position when, and only when, the company has a legal right to offset the amounts and intends either to settle them on a net basis or to realize the asset and settle the liability simultaneously
i. Financial assets at fair value through profit or lossA financial asset is classified as fair value through profit or loss if it is classified as held-for-trading or designated as such on initial recognition. A financial asset is designated as fair value through profit or loss if the company manages such investments and make purchase and sale decisions based on their fair value in accordance with company’s documented risk management or investment strategy. Financial assets at fair value through profit or loss are measured at fair value and changes there in, which takes into account any dividend income, are recognised in the profit or loss.
As at the date of statement of financial position the company had no financial assets at fair value through profit or loss.
ii. Held-to-maturity financial assetsIf the company has positive intent and ability to hold debt securities to maturity, then such financial assets are classified as held-to-maturity financial assets. Subsequent to initial recognition, held-to-maturity financial assets are measured at amortised cost using the effective interest method, less any impairment losses.
Short-term investments are classified as held-to-maturity financial assets. Short term investments comprise investment in Fixed Deposit Receipts (FDR) with original maturity of more than three months.
iii. Loans and receivablesLoans and receivables are financial assets with fixed and determinable payments that are not quoted in the active market. Subsequent to initial recognition, loans and receivables are measured at amortised cost using the effective interest method, less any impairment losses. This is the most relevant category of financial asset to the company and includes trade and other receivables. Trade receivables with no stated interest rate are recognised at the original invoice amount when the impact of discounting is not material.
iv. Available-for-sale financial assetsAvailable-for-sale financial assets are non-derivative financial assets that are designated as available-for-sale or are not classified in any of the above categories of financial assets.
Subsequent to initial recognition, they are measured at fair value and changes there in, other than impairment losses and foreign currency differences on available-for-sale debt instruments, are recognised in other comprehensive income and presented in the fair value reserve in equity. When an investment is derecognised, the gain or loss accumulated in equity is reclassified to profit or loss.
As at the date of statement of financial position the company had no financial assets available-for-sale.
3.7.2 Financial liabilitiesFinancial liabilities are classified as either financial liabilities ‘at FVTPL’ or ‘other financial liabilities’. Company’s financial liabilities mainly include trade and other payables, loans and borrowings.
i. Financial liabilities at fair value through profit or loss (FVTPL)Financial liabilities at fair value through profit or loss include financial liabilities held for trading and financial liabilities designated upon initial recognition as at fair value through profit or loss. Financial liabilities are classified as held for trading if they are incurred for the purpose of repurchasing in the near term. This category also includes derivative financial instruments entered into by the company that are not designated as hedging instruments in hedge relationships as defined by IAS/BAS 39. Separated embedded derivatives are also classified as held for trading unless they are designated as effective hedging instruments. Financial liabilities designated upon initial recognition at fair value through profit or loss are designated at the initial date of recognition, and only if the criteria in IAS/BAS 39 are satisfied.
86 Grameenphone Ltd. x Annual Report 2017
Notes to the financial statements

Financial liabilities at fair value through profit or loss (FVTPL) are subsequently measured at fair value with gains or losses arising on remeasurement are recognised in profit or loss. The company has not designated any financial liabilities as at fair value through profit or loss.
ii. Other financial liabilitiesOther financial liabilities are subsequently measured at amortised cost using the effective interest rate method (EIR). Gains and losses are recognised in profit or loss when the liabilities are derecognised as well as through the EIR amortisation process. Amortised cost is calculated by taking into account any discount or premium on acquisition and fees or costs that are an integral part of the EIR. Other financial liabilities include loans and borrowings, trade and other payables.
3.7.3 Equity instrumentsAn equity instrument is any contract that gives rise to a residual interest in the assets of an entity after deducting all of its liabilities. Equity instruments issued by the company are recognised at the proceeds received, net of direct issue costs. No gain or loss is recognised in profit or loss on the sale , repurchase or cancellation of the company’s own equity instruments.
3.8 Impairment
(a) Financial assetsA financial asset, not classified as fair value through profit or loss, is assessed at each reporting date to determine whether there is an objective evidence that it is impaired. A financial asset is impaired if there is objective evidence of impairment as a result of one or more events that occurred after the initial recognition of the assets, and the loss event(s) had an impact on the estimated future cash flows of that assets that can be estimated reliably.
i. Financial assets measured at amortised costThe company considers evidence of impairment for financial assets (loans and receivables and held-to-maturity investment securities) at both a specific asset and collective asset level. All individually significant receivables and held-to-maturity investment securities are assessed for specific impairment. All individually significant loans and receivables and held-to-maturity investment securities found not to be specifically impaired are then collectively assessed for any impairment that has been incurred but not yet identified. Loans and receivables and held-to-maturity investment securities that are not individually significant are collectively assessed for impairment by grouping together loans and receivables and held-to-maturity investment securities with similar risk characteristics.
In assessing collective impairment, the company uses historical trend of probability of default, timing of recoveries and amount of loss incurred, adjusted for management's judgement as to whether current economic and credit conditions are such that the actual losses are likely to be greater or lesser than suggested by historical trends.
An impairment loss in respect of a financial asset measured at amortised cost is calculated as the difference between its carrying amount and the present value of estimated future cash flows discounted at the asset's original effective interest rate. Losses are recognised in the profit or loss and reflected in the allowance account against loans and receivables or held-to-maturity investment securities. Interest on the impaired assets continues to be recognised. When an event occurring after the impairment was recognised causes the amount of impairment loss to decrease, the decrease in impairment loss is reversed through profit or loss.
As per the existing credit policy, 100% impairment allowance is recognised on receivables from permanently disconnected post-paid subscribers. Post-paid subscribers are permanently disconnected if they fail to make any payment within 90 days of temporary disconnection. Any post-paid receivables remaining uncollected after one year of allowance creation are written-off. Other accounts receivable are written-off when there is no reasonable expectation of future recovery.
ii. Available-for-sale financial assetsImpairment losses on available-for-sale financial assets are recognised by reclassifying the losses accumulated in the fair value reserve in equity to profit or loss. The cumulative loss that is reclassified from equity to profit or loss is the difference between the acquisition cost, net of any principal repayment and amortisation, and the current fair value, less any impairment loss recognised previously in profit or loss. Changes in cumulative impairment losses attributable to application of the effective interest method are reflected as a component of interest income. If, in a subsequent period, the fair value of an impaired available-for-sale debt security increases and the increase can be related objectively to an event occurring after the impairment loss was recognised, then the impairment loss is reversed, with the amount of reversal recognised in profit or loss.
Ove
rvie
wAd
dit io
nal I
nfor
mat
ion
Fina
ncia
l Ana
lysi
sG
over
nanc
eSu
stai
nabi
lity
Busi
ness
Per
form
ance
87Grameenphone Ltd. x Annual Report 2017
Notes to the financial statements
(b) Non-financial assetsThe carrying amounts of the company’s non-financial assets, other than inventories and deferred tax assets, are reviewed at each reporting date to determine whether there is any indication of impairment. If any such indication exists, then the asset’s recoverable amount is estimated in order to determine the extent of impairment loss (if any). Where it is not possible to determine the recoverable amount of an individual asset, the company estimates the recoverable amount of the Cash Generating Unit (CGU) to which the asset belongs. An impairment loss is recognised if the carrying amount of an asset or its CGU exceeds its estimated recoverable amount.
The recoverable amount of an asset or CGU is the greater of its value in use and its fair value less costs to sell. In assessing value in use, the estimated future cash flows are discounted to their present value using a pre-tax discount rate that reflects current market assessments of the time value of money and the risks specific to the asset or CGU. For the purpose of impairment testing, the company considers Grameenphone as the smallest identifiable groups of assets (CGU).
Impairment losses are recognised in profit or loss. Impairment losses recognised in respect of CGUs are allocated to reduce the carrying amounts of the other assets in the CGU on a pro rata basis.
Impairment losses recognised in prior periods are assessed at each reporting date for any indications that the loss has decreased or no longer exists. An impairment loss is reversed if there has been a change in the estimates used to determine the recoverable amount. An impairment loss is reversed only to the extent that the asset’s carrying amount does not exceed the carrying amount that would have been determined, net of depreciation or amortisation, if no impairment loss had been recognised.
3.9 InventoriesInventories consisting of scratch cards, SIM cards, mobile handsets, data cards and other devices are valued at lower of cost and net realisable value. Cost of inventories include expenditure incurred in acquiring the inventories, production or conversion costs and other costs incurred in bringing them to their existing location and condition. Cost of inventories is determined by using the weighted average cost formula. Where necessary, allowance is provided for damaged, obsolete and slow moving items to adjust the carrying amount of inventories to the lower of cost and net realisable value. Net realisable value is based on estimated selling price in the ordinary course of business less the estimated costs of completion and the estimated costs necessary to make the sale.
3.10 Employee benefitsThe company maintains both defined contribution plan and defined benefit plan for its eligible permanent employees. The eligibility is determined according to the terms and conditions set forth in the respective trust deeds and rules. Both of the plans are funded and are recognised/approved under Income Tax Ordinance 1984.
(a) Defined contribution plan (provident fund)A defined contribution plan is a post-employment benefit plan under which an entity pays fixed contributions into a separate entity and has no legal or constructive obligation to pay further amounts. Obligations for contribution to defined contribution plans are recognised as an employee benefit expense in profit or loss in the period during which related services are rendered by employees. Advance contributions are recognised as an asset to the extent that a cash refund or a reduction in future payment is available. Contributions to a defined contribution plan that are due more than 12 months after the end of the period in which employees render the services are discounted to the present value.
Grameenphone has a separate recognised provident fund scheme. All permanent employees of Grameenphone contribute 10% of their basic salary to the provident fund and the company makes matching contributions.
The company recognises contribution to defined contribution plan as an expense when an employee has rendered related services in exchange for such contribution. The legal and constructive obligation is limited to the amount Grameenphone agrees to contribute to the fund.
(b) Defined benefit plan (gratuity)A defined benefit plan is a post-employment benefit plan other than a defined contribution plan. The employee gratuity plan is considered as defined benefit plan as it meets the recognition criteria. The company's obligation is to provide the agreed benefits to current and former employees.
88 Grameenphone Ltd. x Annual Report 2017
Notes to the financial statements

The net defined benefit liability (asset) in respect of a defined benefit plan is recognised in the statement of financial position. The net defined benefit liability (asset) is made up of:
i) the present value of defined benefit obligation; lessii) the fair value of plan assets; adjusted foriii) any effect of limiting a net defined benefit asset to the asset ceiling. Present value of defined benefit obligation is determined by professional actuary. Projected Unit Credit method is used to measure the present value of defined benefit obligations and related current and past service cost by using mutually compatible actuarial assumptions about demographic and financial variables.
Current service cost, past service cost and gain/loss on settlement and net interest on the net defined benefit liability (asset) are recognised in profit or loss. Service cost and gain/loss on settlement are classified as personnel expense and net interest on the net defined benefit liability (asset) is classified as financial expense.
Remeasurements of the net defined liability (asset) are recognised in other comprehensive income, comprising:
i) actuarial gains and losses;ii) return on plan asset, excluding amounts included in net interest on the net defined benefit liability (asset); andiii) any change in the affect of the asset ceiling excluding amounts included in net interest on the net defined benefit liability (asset).
Relevant tax impacts of such remeasurements are also recognised under other comprehensive income.
(c) Short-term employee benefitsShort-term employee benefit obligations are measured on an undiscounted basis and are expensed as the related service is provided. A provision is recognised for the amount of annual leave encashment based on the latest basic salary.
3.11 Income taxIncome tax expense comprises current and deferred taxes. Income tax expense is recognised in profit or loss except to the extent that it relates to items recognised directly in equity, in which case it is recognised in equity.
(a) Current taxCurrent tax is the expected tax payable on the taxable income for the period, using tax rates enacted or substantively enacted at the reporting date, and any adjustment to tax payable in respect of previous periods. The tax rates used for the reporting periods are as follows:
Year Tax rate
2016 40%
2017 40%
(b) Deferred taxDeferred tax is recognised in compliance with IAS/BAS 12 Income Taxes, providing for temporary differences between the carrying amounts of assets and liabilities for financial reporting purpose and amounts used for taxation purpose. Deferred tax is measured at the tax rates that are expected to be applied to the temporary differences when they reverse, based on the laws that have been enacted or substantively enacted by the date of statement of financial position. Deferred tax assets and liabilities are offset if there is a legally enforceable right to offset current tax liabilities and assets, and they relate to income taxes levied by the same tax authority on the same taxable entity.
A deferred tax asset is recognised to the extent that it is probable that future taxable profits will be available against which the deductible temporary difference can be utilised. Deferred tax assets are reviewed at each year-end and are reduced to the extent that it is no longer probable that the related tax benefit will be realised.
Ove
rvie
wAd
dit io
nal I
nfor
mat
ion
Fina
ncia
l Ana
lysi
sG
over
nanc
eSu
stai
nabi
lity
Busi
ness
Per
form
ance
89Grameenphone Ltd. x Annual Report 2017
Notes to the financial statements

3.12 Accruals, provisions and contingencies
(a) AccrualsAccruals are liabilities to pay for goods or services that have been received or supplied but have not been paid, invoiced or formally agreed with the supplier, including amounts due to employees. Accruals are reported as part of trade and other payables.
(b) ProvisionsA provision is recognised in the statement of financial position when the company has a legal or constructive obligation as a result of a past event, it is probable that an outflow of economic benefits will be required to settle the obligation and a reliable estimate can be made of the amount of the obligation. Provision is ordinarily measured at the best estimate of the expenditure required to settle the present obligation at the reporting date. Where the company expects some or all of a provision to be reimbursed, the reimbursement is recognised as a separate asset but only when the reimbursement is virtually certain. The expense relating to any provision is presented in the income statement net of any reimbursement. If the effect of the time value of money is material, provisions are discounted using a current pre-tax rate that reflects, where appropriate, the risks specific to the liability. Where discounting is used, the increase in the provision due to the passage of time is recognised as a finance cost.
Asset Retirement Obligations (ARO) Asset Retirement Obligations (ARO) are recognised when there is a legal or constructive obligation as a result of past event for dismantling and removing an item of property, plant and equipment and restoring the site on which the item is located and it is probable that an outflow of resources will be required to settle the obligation, and a reliable estimate of the amount of obligation can be made. A corresponding amount equivalent to the provision is recognised as part of the cost of the related property, plant and equipment. The amount recognised is the estimated expected cost of decommissioning, discounted to its present value. Changes in the estimated timing of decommissioning or decommissioning cost estimates are dealt with prospectively by recording an adjustment to the provision, and a corresponding adjustment to property, plant and equipment. The company recognises ARO in respect of roof-top base station and office space. The periodic unwinding of the discount is recognised in profit or loss as a finance cost as it occurs.
(c) ContingenciesA contingent liability is a possible obligation that arises from past events and whose existence will be confirmed only by the occurrence or non-occurrence of one or more uncertain future events not wholly within the control of the company; or a present obligation that arises from past events but is not recognised because it is not probable that an outflow of resources embodying economic benefits will be required to settle the obligation; or the amount of the obligation cannot be measured with sufficient reliability.
A contingent asset is a possible asset that arises from past events and whose existence will be confirmed only by the occurrence or non-occurrence of one or more uncertain future events not wholly within the control of the company. We recognise any amount as an asset only if recovery of that amount is virtually certain.
Contingent liabilities and assets are not recognised in the statement of financial position of the company.
3.13 Revenue recognition, measurement and presentationRevenues are recognised when goods are delivered or services rendered, to the extent that it is probable that the economic benefits from the transactions will flow to the company and the revenues can be reliably measured. Revenues are measured at the fair value of the consideration received or receivable, net of discounts and sales related taxes. These taxes are regarded as collected on behalf of the authorities.
Revenues primarily comprise sale of:
• Services: subscription and traffic fees, connection fees, interconnection fees, roaming charges, fees for leased lines and leased networks.
• Customer equipment is primarily mobile devices/phones and data card.
90 Grameenphone Ltd. x Annual Report 2017
Notes to the financial statements
(a) Subscription and traffic feesRevenues from subscription fees are recognised over the subscription period while revenues from voice and non-voice services are recognised upon actual use. Consideration from the sale of prepaid cards to customers where services have not been rendered at the reporting date is deferred until actual usage or when the cards expire or are forfeited.
(b) Connection feesConnection fees that are charged and not allocated to the other elements of an arrangement are deferred and recognised over the periods in which the fees are expected to be earned. The earning period is the expected period of the customer relationship and is based on past history of churn.
(c) Customer equipment Revenues from sales of customer equipment are normally recognised when the equipment, including the related significant risks and rewards of ownership, is transferred to the buyer and the company retains neither continuing managerial involvement to the degree usually associated with ownership nor effective control over the goods sold.
(d) DiscountsDiscounts are often provided in the form of cash discounts or free products and services delivered by the company or by external parties. Discounts are recognised on a systematic basis over the period the discount is earned. Cash discounts or free products and services given as part of sales transactions are recognised as a reduction of revenue. Free products or services provided that are not related to sales transactions are recognised as expenses.
(e) Multiple element arrangementsWhen the company delivers multiple services and/or equipment as part of one contract or arrangement, the consideration is allocated to the separate identifiable components if the delivered item has value to the customer on a standalone basis and there is objective and reliable evidence of the fair value of undelivered items. The consideration is allocated between the elements based on their relative fair values, and recognition of the revenue allocated to the delivered item is limited to the amount that is not contingent on the delivery of additional items or other specified performance criteria.
(f) Interest and dividend incomeInterest income is accrued on a time proportion basis that reflects an effective yield on the financial asset. Dividend income from an investment is recognised when the company’s rights to receive payment is established (declared by the Annual General Meeting of the investee or otherwise).
PresentationThe determination of whether the company is acting as a principal or as an agent in a transaction is based on an evaluation of the substance of the transaction, the responsibility for providing the goods or services and setting prices and the underlying financial risks and rewards. Where the company acts as a principal, the revenues are recognised on a gross basis. This requires revenue to comprise the gross value of the transaction billed to the customers, after trade discounts, with any related expenses charged as operating costs. Where the company acts as an agent, the expenses are offset against the revenues and the resulting net revenues represent the margins or commissions earned for providing services in the capacity of an agent.
Revenues from roaming are recognised gross in line with generally accepted accounting principles within the telecommunications industry.
Licence fees payable to Bangladesh Telecommunication Regulatory Commission (BTRC) that are calculated on the basis of revenue share arrangements are not offset against the revenues. Instead, they are recognised as operating costs because the company is considered to be the primary obligor.
3.14 LeasesThe determination of whether an arrangement is, or contains a lease is based on the substance of the arrangement at the inception date: whether fulfilment of the arrangement is dependent on the use of a specific asset or assets and the arrangement conveys a right to use the asset, even if that right is not explicitly specified in an arrangement. Leases are classified as finance leases whenever the terms of lease transfer substantially all the risk and rewards of ownership to the lessee. All other leases are classified as operating leases.
Ove
rvie
wAd
dit io
nal I
nfor
mat
ion
Fina
ncia
l Ana
lysi
sG
over
nanc
eSu
stai
nabi
lity
Busi
ness
Per
form
ance
91Grameenphone Ltd. x Annual Report 2017
Notes to the financial statements

(a) The company as lesseeAssets held under finance leases are initially recognised as asset of the company at their fair value at the inception of the lease or, if lower, at the present value of minimum lease payments. The corresponding liability to the lessor is included in the statement of financial position as a finance lease obligation.
Lease payments are apportioned between finance expenses and reduction of lease obligation so as to achieve a constant rate of interest on the remaining balance of liability. Finance expenses are immediately recognised in profit or loss, unless they are directly attributable to qualifying assets, in which case they are capitalised. Contingent rentals are recognised as expenses in the period in which they incur.
Operating lease payments are recognised as an expense on straight line basis over the lease term, except where another systemic basis is more representative of the time pattern in which economic benefits from the leased assets are consumed. Contingent rentals arising under operating leases are recognised as an expense in the period in which they are incurred.
In the event that lease incentives are received to enter into operating leases, such incentives are recognised as liability. The aggregate benefit of incentives is recognised as a reduction of rental expenses on a straight line basis, except where another systematic basis is more representative of the time pattern in which economic benefits from the leased assets are consumed.
(b) The company as lessorAmounts due from lessees under finance leases are recognised as receivables at the amount of company's net investment in the leases. Finance lease income is allocated to accounting period so as to reflect a constant periodic rate of return on the company's net investment outstanding in respect of the leases.
Rental income from operating lease is recognised on straight line basis over the term of relevant lease. Initial direct costs incurred in negotiating and arranging an operating lease are added to carrying amount of leased assets and recognised on a straight line basis over the lease term.
3.15 Foreign currency transactions The financial statements are presented in BDT, which is company's functional currency. Transactions in foreign currencies are recorded in the books at the exchange rate prevailing on the date of the transaction. Monetary assets and liabilities in foreign currencies at the date of statement of financial position are translated into BDT at the exchange rate prevailing at that date. Non-monetary items that are measured in terms of historical cost in a foreign currency are translated using the exchange rate at the date of the initial transaction. Non-monetary items measured at fair value in a foreign currency are translated using the exchange rate at the date when the fair value was determined. Exchange differences arising on the settlement of monetary items or on translating monetary items at the end of the reporting period are recognised in profit or loss as per IAS/BAS 21 The Effects of Changes in Foreign Exchange Rates.
3.16 Earnings per shareThe company presents basic and diluted (when dilution is applicable) earnings per share (EPS) for its ordinary shares. Basic EPS is calculated by dividing the profit or loss attributable to ordinary shareholders of the company by the weighted average number of ordinary shares outstanding during the period, adjusted for the effect of change in number of shares for bonus issue, share split and reverse split. Diluted EPS is determined by adjusting the profit or loss attributable to ordinary shareholders and the weighted average number of ordinary shares outstanding, for the effects of all dilutive potential ordinary shares. However, dilution of EPS is not applicable for these financial statements as there was no dilutive potential ordinary shares during the relevant periods.
3.17 Events after the reporting periodAmounts recognised in the financial statements are adjusted for events after the reporting period that provide evidence of conditions that existed at the end of the reporting period. No adjustment is given in the financial statements for events after the reporting period that are indicative of conditions that arose after the reporting period. Material non-adjusting events are disclosed in the financial statements.
92 Grameenphone Ltd. x Annual Report 2017
Notes to the financial statements
4Pr
oper
ty, p
lant
and
equ
ipm
ent,
net
31 D
ecem
ber 2
017
Co
st
Dep
reci
atio
n Ca
rryin
g am
ount
BDT'
00
0
BDT'
00
0
BDT'
00
0
BDT'
00
0
BDT'
00
0
BDT'
00
0
BDT'
00
0
BDT'
00
0
BD
T'0
00
Land
(Not
e 4.
1)
80
7,0
50
-
-
80
7,0
50
-
-
-
-
80
7,0
50
Build
ing
4
,050
,657
-
(1
,743
) 4
,048
,914
1,
204,
901
198,
078
-
1,
402,
979
2
,645
,935
Base
sta
tion
11
0,5
01,6
15
9,2
90,6
17
(2,8
35,8
87)
116,
956,
345
6
6,42
2,11
6
11,6
52,0
69
(2,6
91,5
91)
75,
382,
593
41
,573
,752
Tran
smis
sion
equ
ipm
ent
33,
573,
136
1,
763,
300
-
3
5,33
6,43
6
21,8
22,9
28
5,17
3,85
2
-
26,
996,
781
8,3
39,6
56
Com
pute
rs a
nd o
ther
IT e
quip
men
t 6
,440
,528
7
22,6
20
(60
,945
) 7
,102,
203
4
,536
,567
8
43,9
47
(57,
724)
5
,322
,790
1,
779,
413
Furn
iture
and
fixtu
res (
incl
udin
g of
fice
equi
pmen
t) 2
,787
,60
4
135,
385
(3
9,71
4)
2,8
83,2
75
2,3
45,14
4
120
,061
(3
9,71
4)
2,4
25,4
91
457
,784
Vehi
cles
1,
998,
059
16
2,49
7
(176
,247
) 1,
984,
308
1,
124,
788
2
29,6
29
(128
,125)
1,
226,
291
758
,017
160
,158,
649
12
,074
,418
(3
,114,
536)
16
9,11
8,53
1 9
7,45
6,44
4
18,2
17,6
36
(2,9
17,15
5)
112,
756,
924
56,
361,6
07
Capi
tal w
ork
in p
rogr
ess
(Not
e 4.
2)
9,3
06,
246
12
,125,
457
(12
,447
,392
) 8
,984
,311
-
-
-
-
8
,984
,311
169,
464,
895
2
4,19
9,87
5 (
15,5
61,9
28)
178,
102,
842
97
,456
,444
18
,217
,636
(2
,917
,155)
11
2,75
6,92
4
65,3
45,9
17
Fibr
e O
ptic
Net
wor
k un
der fi
nanc
e le
ase
9
,267
,245
8
68,9
04
-
10
,136,
149
4
,488
,119
5
10,5
40
-
4,9
98,6
59
5,13
7,49
0
178,
732,
140
2
5,0
68,7
79
(15,
561,9
28)
188,
238,
991
101,9
44,5
63
18,7
28,17
6
(2,9
17,15
5)
117,
755,
583
70
,483
,40
7
Nam
e of
ass
ets
As a
t1 J
anua
ry20
17
Addi
tion
durin
g th
e ye
ar
Dis
posa
l/Ad
just
men
tdu
ring
the
year
As a
t31
Dec
embe
r20
17
As a
t1 J
anua
ry20
17
Char
ged
durin
gth
e ye
ar
Dis
posa
l/Ad
just
men
tdu
ring
the
year
As a
t31
Dec
embe
r20
17
As
at
31 D
ecem
ber
20
17
Ove
rvie
wAd
dit io
nal I
nfor
mat
ion
Fina
ncia
l Ana
lysi
sG
over
nanc
eSu
stai
nabi
lity
Busi
ness
Per
form
ance
93Grameenphone Ltd. x Annual Report 2017
Notes to the financial statements

4Pr
oper
ty, p
lant
and
equ
ipm
ent,
net
31 D
ecem
ber 2
016
Co
st
Dep
reci
atio
n Ca
rryin
g am
ount
BDT'
00
0
BDT'
00
0
BDT'
00
0
BDT'
00
0
BDT'
00
0
BDT'
00
0
BDT'
00
0
BDT'
00
0
BD
T'0
00
Land
(Not
e 4.
1)
80
7,49
7
-
(447
) 8
07,
050
-
-
-
-
8
07,
050
Build
ing
4
,058
,116
5
8,69
0
(66,
149)
4
,050
,657
1,
114,
566
15
6,48
5
(66,
149)
1,
204,
901
2,8
45,7
56
Base
sta
tion
9
6,72
4,39
5
15,3
52,13
5
(1,5
74,9
14)
110
,50
1,615
5
7,27
7,69
8
10,6
95,3
30
(1,5
50,9
13)
66,
422,
116
44,
079
,50
0
Tran
smis
sion
equ
ipm
ent
28,
070
,339
5
,50
2,79
8
-
33,
573,
136
17
,468
,725
4
,354
,20
3
-
21,8
22,9
28
11,7
50,2
08
Com
pute
rs a
nd o
ther
IT e
quip
men
t 5
,145,
846
1,
312,
939
(1
8,25
7)
6,4
40,5
28
3,7
86,5
35
768
,112
(1
8,0
80)
4,5
36,5
67
1,90
3,96
1
Furn
iture
and
fixtu
res (
incl
udin
g of
fice
equi
pmen
t) 2
,681
,971
13
9,19
8
(33,
565)
2
,787
,60
4
2,2
44,5
45
134,
164
(3
3,56
5)
2,3
45,14
4
442
,460
Vehi
cles
1,
872,
699
3
39,5
30
(214
,171)
1,
998,
059
1,
077
,825
2
20,3
17
(173
,354
) 1,
124,
788
8
73,2
70
139,
360
,863
2
2,70
5,29
0
(1,9
07,
503)
16
0,15
8,64
9 8
2,96
9,89
4
16,3
28,6
11
(1,8
42,0
60)
97,
456,
444
62,
702,
205
Capi
tal w
ork
in p
rogr
ess
(Not
e 4.
2)
13,0
82,4
73
19,2
41,9
50
(23,
018
,177)
9
,30
6,24
6
-
-
-
-
9,3
06,
246
152,
443,
336
4
1,947
,239
(24
,925
,679
) 16
9,46
4,89
5 8
2,96
9,89
4
16,3
28,6
11
(1,8
42,0
60)
97,
456,
444
72,
00
8,45
1
Fibr
e O
ptic
Net
wor
k un
der fi
nanc
e le
ase
8
,757
,398
5
09,
847
-
9
,267
,245
4
,026
,30
9
461
,810
-
4
,488
,119
4
,779
,126
161,2
00
,734
4
2,45
7,0
86 (
24,9
25,6
79)
178,
732,
140
86
,996
,20
2
16,7
90,4
21
(1,8
42,0
60)
101,9
44,5
63
76,7
87,5
77
Nam
e of
ass
ets
As a
t1 J
anua
ry20
16
Addi
tion
durin
g th
e ye
ar
Dis
posa
l/Ad
just
men
tdu
ring
the
year
As a
t31
Dec
embe
r20
16
As a
t1 J
anua
ry20
16
Char
ged
durin
gth
e ye
ar
Dis
posa
l/Ad
just
men
tdu
ring
the
year
As a
t31
Dec
embe
r20
16
As
at
31 D
ecem
ber
20
16
94 Grameenphone Ltd. x Annual Report 2017
Notes to the financial statements
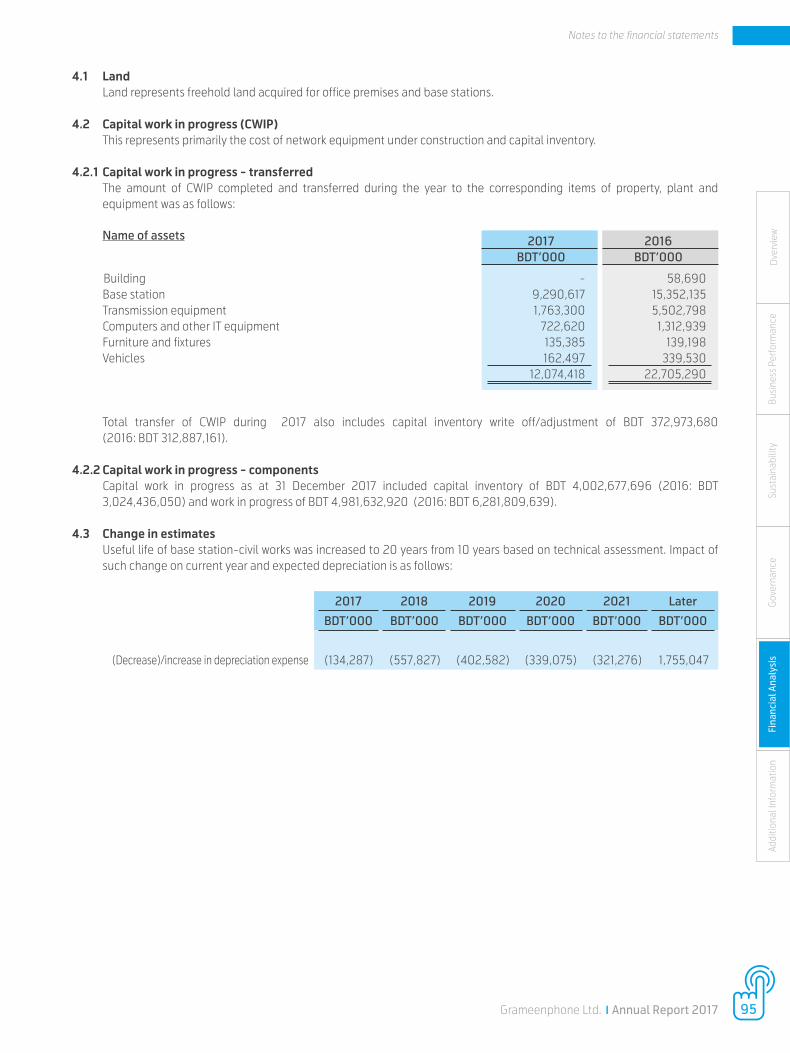
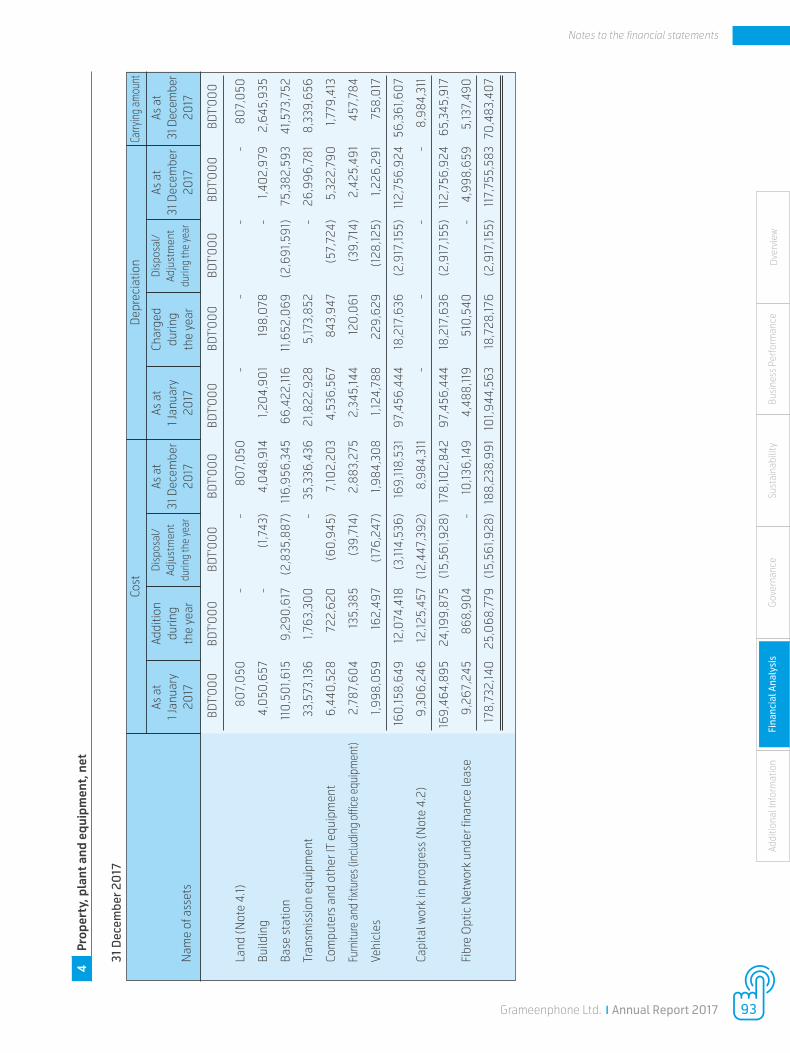
4.1 Land Land represents freehold land acquired for office premises and base stations.
4.2 Capital work in progress (CWIP)This represents primarily the cost of network equipment under construction and capital inventory.
4.2.1 Capital work in progress - transferredThe amount of CWIP completed and transferred during the year to the corresponding items of property, plant and equipment was as follows:
2017 2016 BDT’000 BDT’000
Building - 58,690Base station 9,290,617 15,352,135Transmission equipment 1,763,300 5,502,798Computers and other IT equipment 722,620 1,312,939Furniture and fixtures 135,385 139,198Vehicles 162,497 339,530 12,074,418 22,705,290
Total transfer of CWIP during 2017 also includes capital inventory write off/adjustment of BDT 372,973,680(2016: BDT 312,887,161).
4.2.2 Capital work in progress - componentsCapital work in progress as at 31 December 2017 included capital inventory of BDT 4,002,677,696 (2016: BDT 3,024,436,050) and work in progress of BDT 4,981,632,920 (2016: BDT 6,281,809,639).
4.3 Change in estimatesUseful life of base station-civil works was increased to 20 years from 10 years based on technical assessment. Impact of such change on current year and expected depreciation is as follows:
(Decrease)/increase in depreciation expense
2017 2018 2019 2020 2021 Later
BDT’000 BDT’000 BDT’000 BDT’000 BDT’000 BDT’000
(134,287) (557,827) (402,582) (339,075) (321,276) 1,755,047
Ove
rvie
wAd
dit io
nal I
nfor
mat
ion
Fina
ncia
l Ana
lysi
sG
over
nanc
eSu
stai
nabi
lity
Busi
ness
Per
form
ance
Name of assets
95Grameenphone Ltd. x Annual Report 2017
Notes to the financial statements
5In
tang
ible
ass
ets,
net
31 D
ecem
ber 2
017
Co
st
Amor
tisat
ion
Carry
ing
amou
nt
BDT'
00
0
BDT'
00
0
BDT'
00
0
BDT'
00
0
BDT'
00
0
BDT'
00
0
BDT'
00
0
BDT'
00
0
BD
T'0
00
Soft
war
e an
d ot
hers
(Not
e 5.
1)
8,3
52,3
33
1,0
65,2
52
-
9,4
17,5
85
6,9
69,4
81
1,0
88,3
18
-
8,0
57,7
99
1,35
9,78
6
Tele
com
lice
nce
and
spec
trum
(Not
e 5.
2)
53,0
49,2
58
-
-
53,0
49,2
58
16,3
22,0
05
3
,520
,097
-
19
,842
,102
33
,20
7,15
6
61,4
01,5
92
1,0
65,2
52
-
62,4
66,8
44
23,
291,4
86
4,6
08,
415
-
27
,899
,90
1 3
4,56
6,94
2
Capi
tal w
ork
in p
rogr
ess
(Not
e 5.
3)
73,
317
1,
654,
991
(1,0
65,2
52)
663
,056
-
-
-
-
6
63,0
56
61,4
74,9
08
2
,720
,244
(1
,065
,252
) 6
3,12
9,90
0
23,
291,4
86
4,6
08,
415
-
27
,899
,90
1 3
5,22
9,99
8
31 D
ecem
ber 2
016
Co
st
Amor
tisat
ion
Carry
ing
amou
nt
BDT’
00
0
BDT’
00
0
BDT’
00
0
BDT’
00
0
BDT’
00
0
BDT’
00
0
BDT’
00
0
BDT’
00
0
BD
T’0
00
Soft
war
e an
d ot
hers
(Not
e 5.
1)
6,9
08,
532
1,
443,
801
-
8
,352
,333
6
,281
,819
6
87,6
62
-
6
,969
,481
1,
382,
852
Tele
com
lice
nce
and
spec
trum
(Not
e 5.
2)
53,
049
,258
-
-
53,
049
,258
12
,80
1,90
8
3,5
20,0
97
-
16,
322,
00
5 3
6,72
7,25
3
59,9
57,7
90
1,44
3,80
1 -
61,4
01,5
92
19,0
83,7
27
4,2
07,
759
-
2
3,29
1,486
3
8,11
0,10
5
Capi
tal w
ork
in p
rogr
ess
(Not
e 5.
3)
171,4
82
1,34
5,63
6
(1,4
43,8
01)
7
3,31
7
-
-
-
-
73,
317
60,12
9,27
3
2,7
89,4
37
(1,4
43,8
01)
6
1,474
,90
8
19,0
83,7
27
4,2
07,
759
-
2
3,29
1,486
3
8,18
3,42
2
Nam
e of
ass
ets
Nam
e of
ass
ets
As a
t1 J
anua
ry20
17
As a
t1 J
anua
ry20
16
Addi
tion
durin
g th
e ye
ar
Addi
tion
durin
g th
e ye
ar
Dis
posa
l/Ad
just
men
tdu
ring
the
year
Dis
posa
l/Ad
just
men
tdu
ring
the
year
As a
t31
Dec
embe
r20
17
As a
t31
Dec
embe
r20
16
As a
t1 J
anua
ry20
17
As a
t1 J
anua
ry20
16
Char
ged
durin
gth
e ye
ar
Char
ged
durin
gth
e ye
ar
Dis
posa
l/Ad
just
men
tdu
ring
the
year
Dis
posa
l/Ad
just
men
tdu
ring
the
year
As a
t31
Dec
embe
r20
17
As a
t31
Dec
embe
r20
16
As
at
31 D
ecem
ber
20
17
As
at
31 D
ecem
ber
20
16
96 Grameenphone Ltd. x Annual Report 2017
Notes to the financial statements
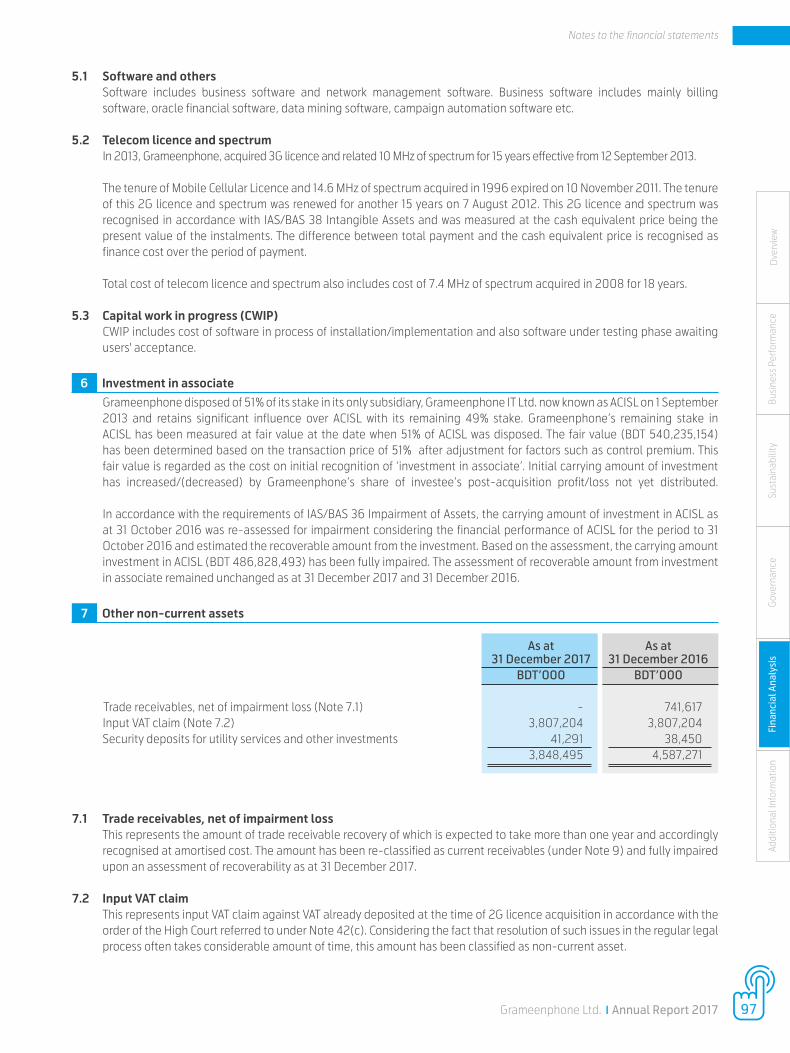
5.1 Software and othersSoftware includes business software and network management software. Business software includes mainly billing software, oracle financial software, data mining software, campaign automation software etc.
5.2 Telecom licence and spectrumIn 2013, Grameenphone, acquired 3G licence and related 10 MHz of spectrum for 15 years effective from 12 September 2013.
The tenure of Mobile Cellular Licence and 14.6 MHz of spectrum acquired in 1996 expired on 10 November 2011. The tenure of this 2G licence and spectrum was renewed for another 15 years on 7 August 2012. This 2G licence and spectrum was recognised in accordance with IAS/BAS 38 Intangible Assets and was measured at the cash equivalent price being the present value of the instalments. The difference between total payment and the cash equivalent price is recognised as finance cost over the period of payment.
Total cost of telecom licence and spectrum also includes cost of 7.4 MHz of spectrum acquired in 2008 for 18 years.
5.3 Capital work in progress (CWIP)CWIP includes cost of software in process of installation/implementation and also software under testing phase awaiting users' acceptance.
6 Investment in associateGrameenphone disposed of 51% of its stake in its only subsidiary, Grameenphone IT Ltd. now known as ACISL on 1 September 2013 and retains significant influence over ACISL with its remaining 49% stake. Grameenphone’s remaining stake in ACISL has been measured at fair value at the date when 51% of ACISL was disposed. The fair value (BDT 540,235,154) has been determined based on the transaction price of 51% after adjustment for factors such as control premium. This fair value is regarded as the cost on initial recognition of ‘investment in associate’. Initial carrying amount of investment has increased/(decreased) by Grameenphone’s share of investee’s post-acquisition profit/loss not yet distributed. In accordance with the requirements of IAS/BAS 36 Impairment of Assets, the carrying amount of investment in ACISL as at 31 October 2016 was re-assessed for impairment considering the financial performance of ACISL for the period to 31 October 2016 and estimated the recoverable amount from the investment. Based on the assessment, the carrying amount investment in ACISL (BDT 486,828,493) has been fully impaired. The assessment of recoverable amount from investment in associate remained unchanged as at 31 December 2017 and 31 December 2016.
7 Other non-current assets As at As at 31 December 2017 31 December 2016 BDT’000 BDT’000 Trade receivables, net of impairment loss (Note 7.1) - 741,617Input VAT claim (Note 7.2) 3,807,204 3,807,204Security deposits for utility services and other investments 41,291 38,450 3,848,495 4,587,271
7.1 Trade receivables, net of impairment lossThis represents the amount of trade receivable recovery of which is expected to take more than one year and accordingly recognised at amortised cost. The amount has been re-classified as current receivables (under Note 9) and fully impaired upon an assessment of recoverability as at 31 December 2017.
7.2 Input VAT claimThis represents input VAT claim against VAT already deposited at the time of 2G licence acquisition in accordance with the order of the High Court referred to under Note 42(c). Considering the fact that resolution of such issues in the regular legal process often takes considerable amount of time, this amount has been classified as non-current asset.
Ove
rvie
wAd
dit io
nal I
nfor
mat
ion
Fina
ncia
l Ana
lysi
sG
over
nanc
eSu
stai
nabi
lity
Busi
ness
Per
form
ance
97Grameenphone Ltd. x Annual Report 2017
Notes to the financial statements
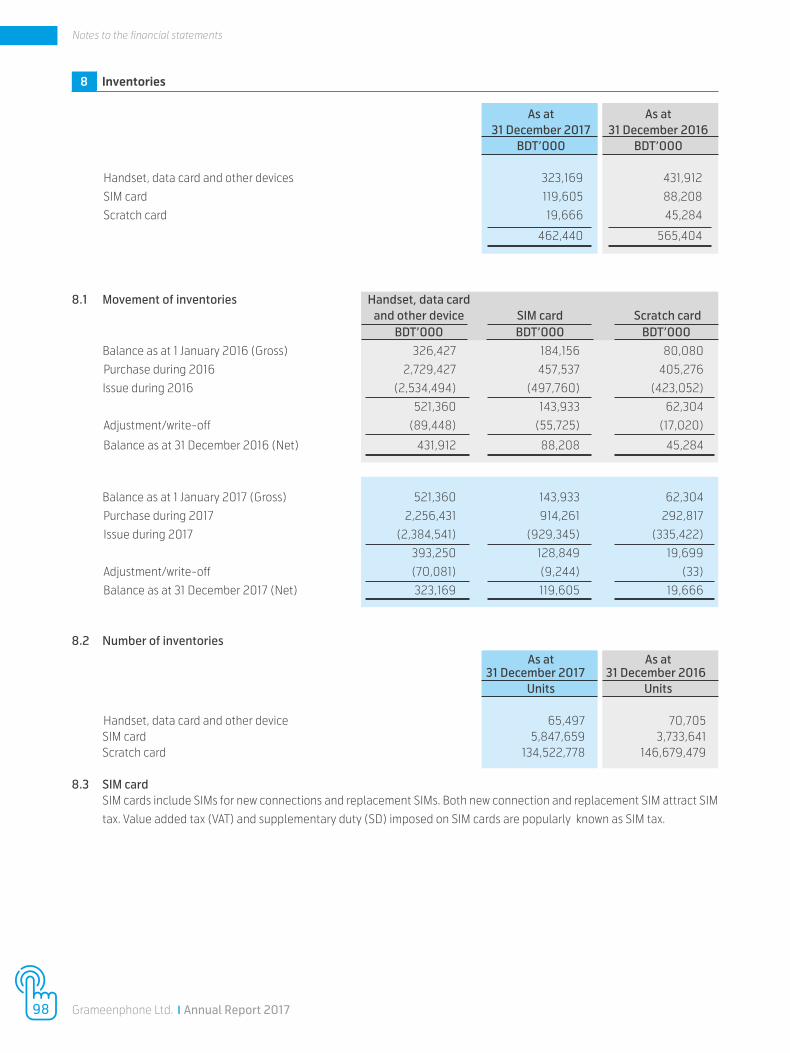
8 Inventories As at As at 31 December 2017 31 December 2016 BDT’000 BDT’000
Handset, data card and other devices 323,169 431,912
SIM card 119,605 88,208
Scratch card 19,666 45,284
462,440 565,404
8.1 Movement of inventories Handset, data card and other device SIM card Scratch card BDT’000 BDT’000 BDT’000
Balance as at 1 January 2016 (Gross) 326,427 184,156 80,080
Purchase during 2016 2,729,427 457,537 405,276
Issue during 2016 (2,534,494) (497,760) (423,052)
521,360 143,933 62,304
Adjustment/write-off (89,448) (55,725) (17,020)
Balance as at 31 December 2016 (Net) 431,912 88,208 45,284
Balance as at 1 January 2017 (Gross) 521,360 143,933 62,304
Purchase during 2017 2,256,431 914,261 292,817
Issue during 2017 (2,384,541) (929,345) (335,422)
393,250 128,849 19,699
Adjustment/write-off (70,081) (9,244) (33)
Balance as at 31 December 2017 (Net) 323,169 119,605 19,666
8.2 Number of inventories As at As at 31 December 2017 31 December 2016 Units Units
Handset, data card and other device 65,497 70,705SIM card 5,847,659 3,733,641Scratch card 134,522,778 146,679,479
8.3 SIM cardSIM cards include SIMs for new connections and replacement SIMs. Both new connection and replacement SIM attract SIM
tax. Value added tax (VAT) and supplementary duty (SD) imposed on SIM cards are popularly known as SIM tax.
98 Grameenphone Ltd. x Annual Report 2017
Notes to the financial statements
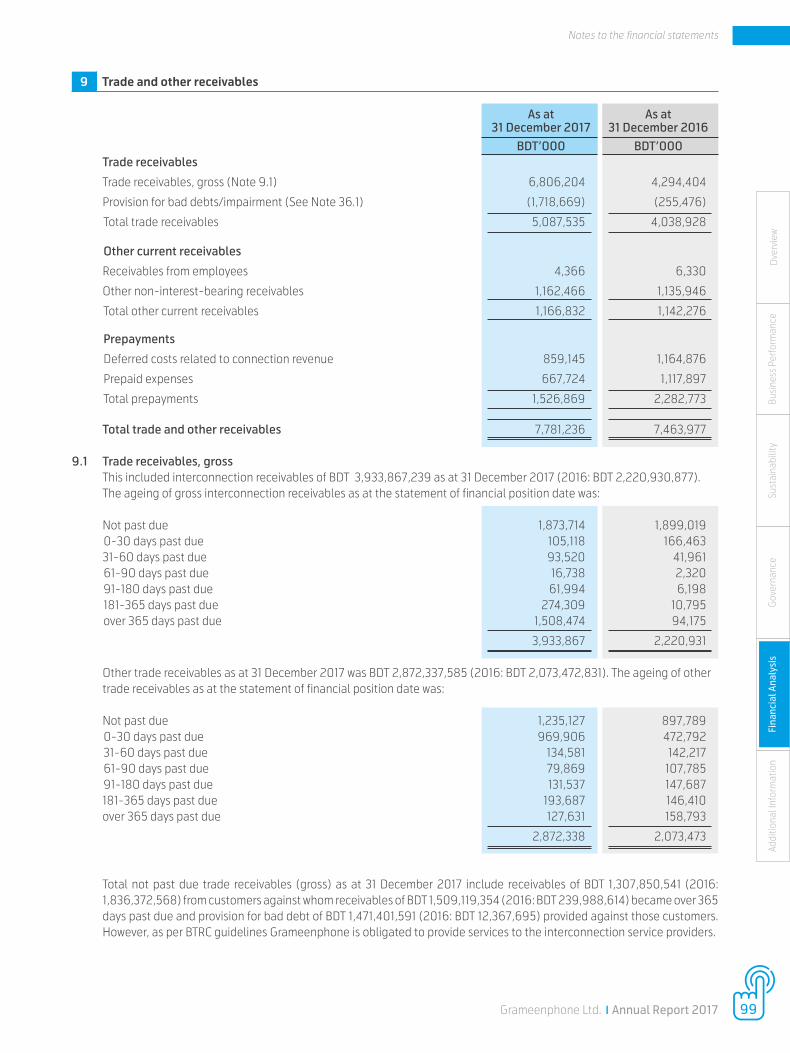
9 Trade and other receivables As at As at 31 December 2017 31 December 2016 BDT’000 BDT’000 Trade receivables
Trade receivables, gross (Note 9.1) 6,806,204 4,294,404
Provision for bad debts/impairment (See Note 36.1) (1,718,669) (255,476)
Total trade receivables 5,087,535 4,038,928
Other current receivables
Receivables from employees 4,366 6,330
Other non-interest-bearing receivables 1,162,466 1,135,946
Total other current receivables 1,166,832 1,142,276
Prepayments
Deferred costs related to connection revenue 859,145 1,164,876
Prepaid expenses 667,724 1,117,897
Total prepayments 1,526,869 2,282,773
Total trade and other receivables 7,781,236 7,463,977
9.1 Trade receivables, grossThis included interconnection receivables of BDT 3,933,867,239 as at 31 December 2017 (2016: BDT 2,220,930,877). The ageing of gross interconnection receivables as at the statement of financial position date was:
Not past due 1,873,714 1,899,019 0-30 days past due 105,118 166,46331-60 days past due 93,520 41,961 61-90 days past due 16,738 2,320 91-180 days past due 61,994 6,198 181-365 days past due 274,309 10,795 over 365 days past due 1,508,474 94,175
3,933,867 2,220,931 Other trade receivables as at 31 December 2017 was BDT 2,872,337,585 (2016: BDT 2,073,472,831). The ageing of other trade receivables as at the statement of financial position date was:
Not past due 1,235,127 897,789 0-30 days past due 969,906 472,792 31-60 days past due 134,581 142,217 61-90 days past due 79,869 107,785 91-180 days past due 131,537 147,687181-365 days past due 193,687 146,410over 365 days past due 127,631 158,793
2,872,338 2,073,473
Total not past due trade receivables (gross) as at 31 December 2017 include receivables of BDT 1,307,850,541 (2016: 1,836,372,568) from customers against whom receivables of BDT 1,509,119,354 (2016: BDT 239,988,614) became over 365 days past due and provision for bad debt of BDT 1,471,401,591 (2016: BDT 12,367,695) provided against those customers. However, as per BTRC guidelines Grameenphone is obligated to provide services to the interconnection service providers.
Ove
rvie
wAd
dit io
nal I
nfor
mat
ion
Fina
ncia
l Ana
lysi
sG
over
nanc
eSu
stai
nabi
lity
Busi
ness
Per
form
ance
99Grameenphone Ltd. x Annual Report 2017
Notes to the financial statements
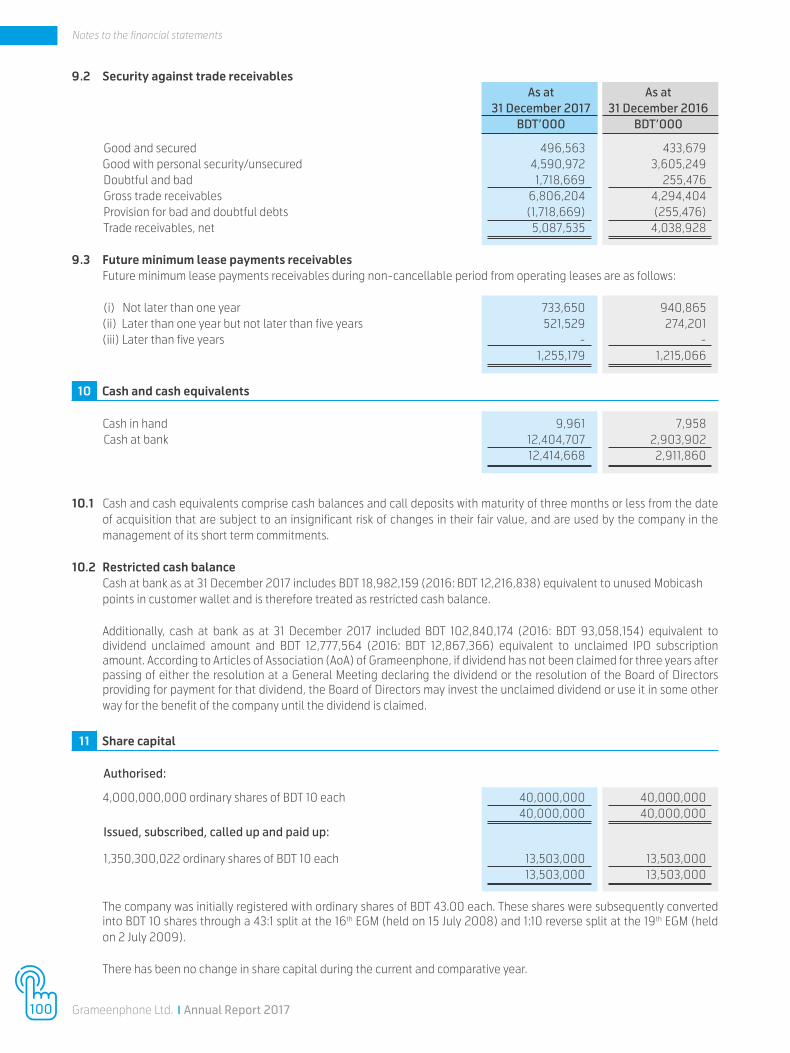
9.2 Security against trade receivables As at As at 31 December 2017 31 December 2016 BDT’000 BDT’000 Good and secured 496,563 433,679 Good with personal security/unsecured 4,590,972 3,605,249 Doubtful and bad 1,718,669 255,476 Gross trade receivables 6,806,204 4,294,404 Provision for bad and doubtful debts (1,718,669) (255,476) Trade receivables, net 5,087,535 4,038,928
9.3 Future minimum lease payments receivablesFuture minimum lease payments receivables during non-cancellable period from operating leases are as follows: (i) Not later than one year 733,650 940,865(ii) Later than one year but not later than five years 521,529 274,201(iii) Later than five years - - 1,255,179 1,215,066
10 Cash and cash equivalents
Cash in hand 9,961 7,958 Cash at bank 12,404,707 2,903,902 12,414,668 2,911,860
10.1 Cash and cash equivalents comprise cash balances and call deposits with maturity of three months or less from the date of acquisition that are subject to an insignificant risk of changes in their fair value, and are used by the company in the management of its short term commitments.
10.2 Restricted cash balanceCash at bank as at 31 December 2017 includes BDT 18,982,159 (2016: BDT 12,216,838) equivalent to unused Mobicash points in customer wallet and is therefore treated as restricted cash balance.
Additionally, cash at bank as at 31 December 2017 included BDT 102,840,174 (2016: BDT 93,058,154) equivalent to dividend unclaimed amount and BDT 12,777,564 (2016: BDT 12,867,366) equivalent to unclaimed IPO subscription amount. According to Articles of Association (AoA) of Grameenphone, if dividend has not been claimed for three years after passing of either the resolution at a General Meeting declaring the dividend or the resolution of the Board of Directors providing for payment for that dividend, the Board of Directors may invest the unclaimed dividend or use it in some other way for the benefit of the company until the dividend is claimed.
11 Share capital
Authorised:
4,000,000,000 ordinary shares of BDT 10 each 40,000,000 40,000,000 40,000,000 40,000,000
Issued, subscribed, called up and paid up:
1,350,300,022 ordinary shares of BDT 10 each 13,503,000 13,503,000 13,503,000 13,503,000
The company was initially registered with ordinary shares of BDT 43.00 each. These shares were subsequently converted into BDT 10 shares through a 43:1 split at the 16th EGM (held on 15 July 2008) and 1:10 reverse split at the 19th EGM (held on 2 July 2009).
There has been no change in share capital during the current and comparative year.
100 Grameenphone Ltd. x Annual Report 2017
Notes to the financial statements
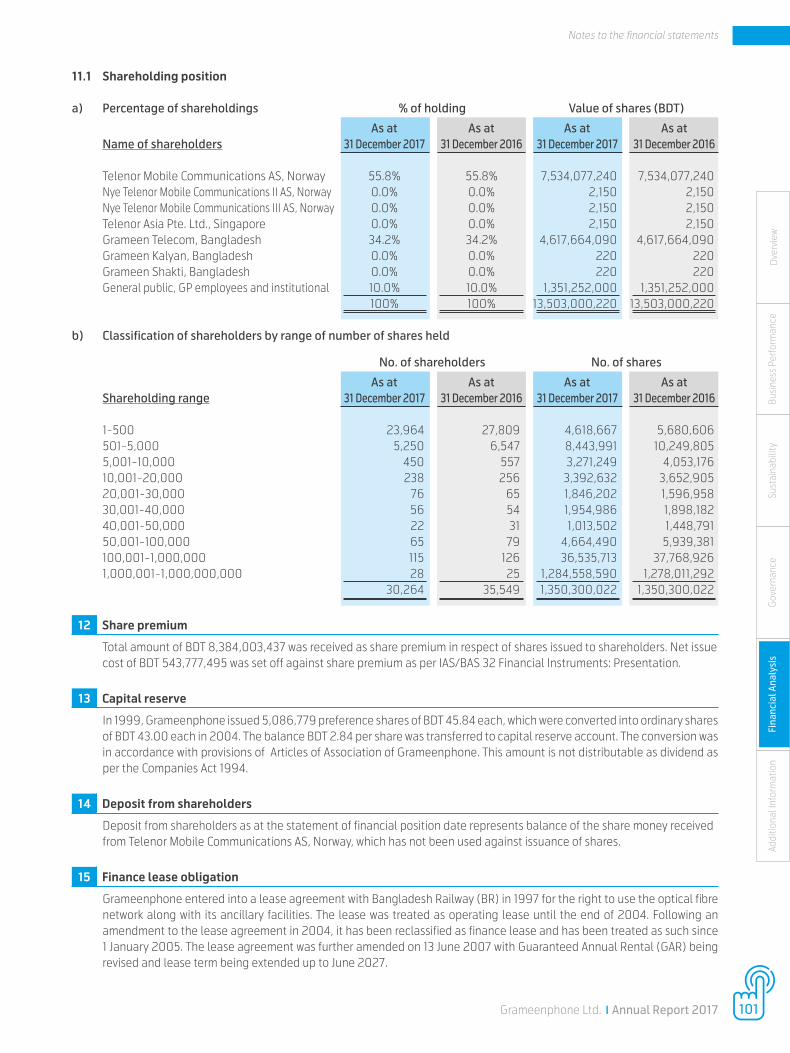
11.1 Shareholding position
a) Percentage of shareholdings % of holding Value of shares (BDT)
As at As at As at As at Name of shareholders 31 December 2017 31 December 2016 31 December 2017 31 December 2016
Telenor Mobile Communications AS, Norway 55.8% 55.8% 7,534,077,240 7,534,077,240Nye Telenor Mobile Communications II AS, Norway 0.0% 0.0% 2,150 2,150Nye Telenor Mobile Communications III AS, Norway 0.0% 0.0% 2,150 2,150Telenor Asia Pte. Ltd., Singapore 0.0% 0.0% 2,150 2,150Grameen Telecom, Bangladesh 34.2% 34.2% 4,617,664,090 4,617,664,090Grameen Kalyan, Bangladesh 0.0% 0.0% 220 220Grameen Shakti, Bangladesh 0.0% 0.0% 220 220General public, GP employees and institutional 10.0% 10.0% 1,351,252,000 1,351,252,000 100% 100% 13,503,000,220 13,503,000,220
b) Classification of shareholders by range of number of shares held
No. of shareholders No. of shares
As at As at As at As at Shareholding range 31 December 2017 31 December 2016 31 December 2017 31 December 2016
1-500 23,964 27,809 4,618,667 5,680,606501-5,000 5,250 6,547 8,443,991 10,249,8055,001-10,000 450 557 3,271,249 4,053,17610,001-20,000 238 256 3,392,632 3,652,90520,001-30,000 76 65 1,846,202 1,596,95830,001-40,000 56 54 1,954,986 1,898,18240,001-50,000 22 31 1,013,502 1,448,79150,001-100,000 65 79 4,664,490 5,939,381100,001-1,000,000 115 126 36,535,713 37,768,9261,000,001-1,000,000,000 28 25 1,284,558,590 1,278,011,292 30,264 35,549 1,350,300,022 1,350,300,022
12 Share premium
Total amount of BDT 8,384,003,437 was received as share premium in respect of shares issued to shareholders. Net issue cost of BDT 543,777,495 was set off against share premium as per IAS/BAS 32 Financial Instruments: Presentation.
13 Capital reserve
In 1999, Grameenphone issued 5,086,779 preference shares of BDT 45.84 each, which were converted into ordinary shares of BDT 43.00 each in 2004. The balance BDT 2.84 per share was transferred to capital reserve account. The conversion was in accordance with provisions of Articles of Association of Grameenphone. This amount is not distributable as dividend as per the Companies Act 1994.
14 Deposit from shareholders
Deposit from shareholders as at the statement of financial position date represents balance of the share money received from Telenor Mobile Communications AS, Norway, which has not been used against issuance of shares.
15 Finance lease obligation
Grameenphone entered into a lease agreement with Bangladesh Railway (BR) in 1997 for the right to use the optical fibre network along with its ancillary facilities. The lease was treated as operating lease until the end of 2004. Following an amendment to the lease agreement in 2004, it has been reclassified as finance lease and has been treated as such since 1 January 2005. The lease agreement was further amended on 13 June 2007 with Guaranteed Annual Rental (GAR) being revised and lease term being extended up to June 2027.
Ove
rvie
wAd
dit io
nal I
nfor
mat
ion
Fina
ncia
l Ana
lysi
sG
over
nanc
eSu
stai
nabi
lity
Busi
ness
Per
form
ance
101Grameenphone Ltd. x Annual Report 2017
Notes to the financial statements
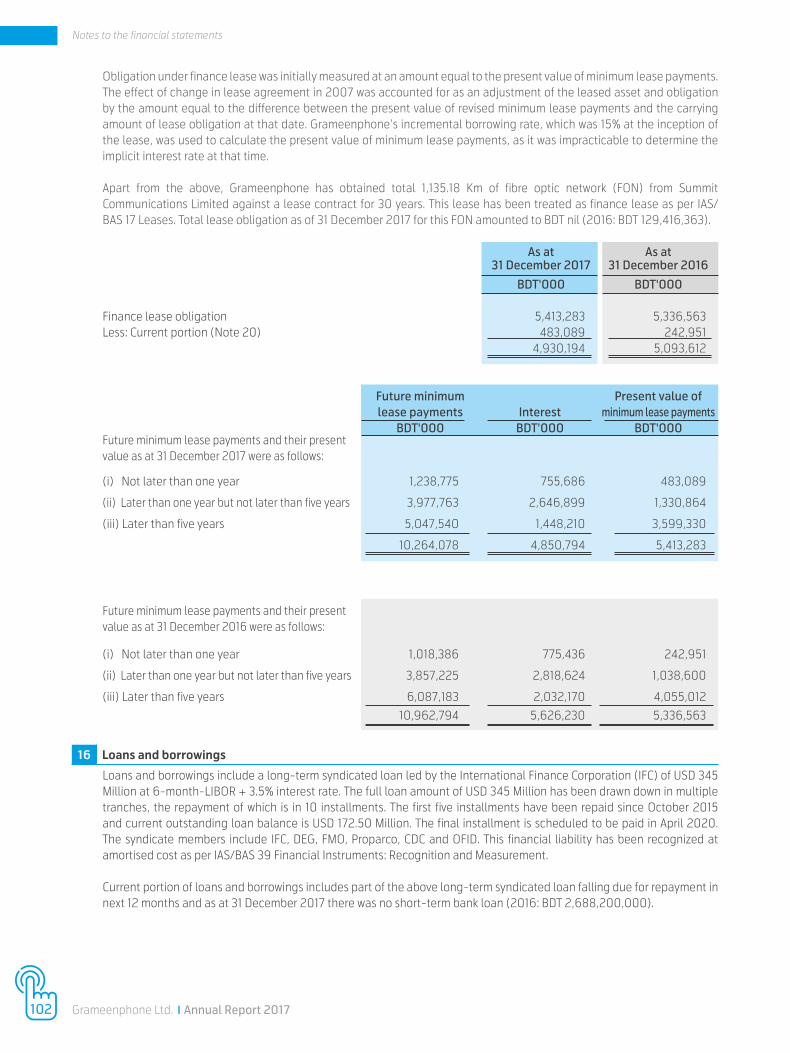
Obligation under finance lease was initially measured at an amount equal to the present value of minimum lease payments. The effect of change in lease agreement in 2007 was accounted for as an adjustment of the leased asset and obligation by the amount equal to the difference between the present value of revised minimum lease payments and the carrying amount of lease obligation at that date. Grameenphone’s incremental borrowing rate, which was 15% at the inception of the lease, was used to calculate the present value of minimum lease payments, as it was impracticable to determine the implicit interest rate at that time.
Apart from the above, Grameenphone has obtained total 1,135.18 Km of fibre optic network (FON) from Summit Communications Limited against a lease contract for 30 years. This lease has been treated as finance lease as per IAS/BAS 17 Leases. Total lease obligation as of 31 December 2017 for this FON amounted to BDT nil (2016: BDT 129,416,363). As at As at 31 December 2017 31 December 2016 BDT'000 BDT'000
Finance lease obligation 5,413,283 5,336,563 Less: Current portion (Note 20) 483,089 242,951 4,930,194 5,093,612
Future minimum Present value of lease payments Interest minimum lease payments BDT'000 BDT'000 BDT'000
(i) Not later than one year 1,238,775 755,686 483,089
(ii) Later than one year but not later than five years 3,977,763 2,646,899 1,330,864
(iii) Later than five years 5,047,540 1,448,210 3,599,330
10,264,078 4,850,794 5,413,283
(i) Not later than one year 1,018,386 775,436 242,951
(ii) Later than one year but not later than five years 3,857,225 2,818,624 1,038,600
(iii) Later than five years 6,087,183 2,032,170 4,055,012
10,962,794 5,626,230 5,336,563
16 Loans and borrowings
Loans and borrowings include a long-term syndicated loan led by the International Finance Corporation (IFC) of USD 345 Million at 6-month-LIBOR + 3.5% interest rate. The full loan amount of USD 345 Million has been drawn down in multiple tranches, the repayment of which is in 10 installments. The first five installments have been repaid since October 2015 and current outstanding loan balance is USD 172.50 Million. The final installment is scheduled to be paid in April 2020. The syndicate members include IFC, DEG, FMO, Proparco, CDC and OFID. This financial liability has been recognized at amortised cost as per IAS/BAS 39 Financial Instruments: Recognition and Measurement.
Current portion of loans and borrowings includes part of the above long-term syndicated loan falling due for repayment in next 12 months and as at 31 December 2017 there was no short-term bank loan (2016: BDT 2,688,200,000).
Future minimum lease payments and their present value as at 31 December 2017 were as follows:
Future minimum lease payments and their present value as at 31 December 2016 were as follows:
102 Grameenphone Ltd. x Annual Report 2017
Notes to the financial statements

17 Deferred tax liabilities
Deferred tax assets and liabilities have been recognised and measured in accordance with the provisions of IAS/BAS 12 Income Taxes. Related deferred tax (expense)/income have been disclosed in Note 34. The components of deferred tax assets and liabilities are given below: Taxable/(deductible) temporary Carrying amount Tax base difference BDT'000 BDT'000 BDT'000
As at 31 December 2017Property, plant and equipment (excluding land, 55,554,556 36,443,874 19,110,683CWIP and leased assets) (Note 4) Property, plant and equipment under finance lease (Note 4) 5,137,490 - 5,137,490 Difference for vehicle (Note 17.1) (152,845) - (152,845) 24,095,328
Telecom licence, spectrum, software and others 34,566,942 35,271,271 (704,328)Trade receivables (Note 9) 5,087,535 6,806,204 (1,718,670)Finance lease obligation including current portion (Note 15) (5,413,283) - (5,413,283)Other current liabilities (profit sharing plan) (236,591) - (236,591)Employee benefit plans (funded) (426,466) - (426,466)Net taxable temporary difference 15,595,990 Deferred tax liability @40% tax rate (Note 3.11) 6,238,396 Deferred tax liabilities (Note 17.2) 6,238,396
As at 31 December 2016Property, plant and equipment (excluding land, 61,895,155 37,360,423 24,534,732CWIP and leased assets) (Note 4) Property, plant and equipment under finance lease (Note 4) 4,779,126 - 4,779,126 Difference for vehicle (Note 17.1) (141,009) - (141,009) 29,172,849
Trade receivables, net of impairment loss 741,617 1,483,234 (741,617)Telecom licence, spectrum, software and others 38,110,105 38,940,547 (830,442)Trade receivables (Note 9) 4,038,928 4,170,347 (131,419)Finance lease obligation including current portion (Note 15) (5,336,563) - (5,336,563)Other current liabilities (profit sharing plan) (207,876) - (207,876)Employee benefit plans (funded) (1,335,086) - (1,335,086)Net taxable temporary difference 20,589,846 Deferred tax liability @40% tax rate (Note 3.11) 8,235,939 Deferred tax liabilities (Note 17.2) 8,235,939
17.1 Difference for vehicleThis represents the permanent difference related to sedan cars, not plying for hire, owned by Grameenphone. As per the provisions of Income Tax Ordinance 1984, depreciation on such cars is allowed only up to certain limit of cost (currently BDT 2.5 million per car) of such cars for tax purpose. Difference for vehicle represents the amount of depreciated cost exceeding such limits.
17.2 Actuarial gain/loss from re-measurement of defined benefite obligationsDeferred tax liabilities as of 31 December 2017 include net deferred tax asset of BDT 170,586,508 (2016: BDT 534,034,217) for actuarial gain/loss from re-measurement of defined benefit obligations corresponding impact of which has been recognised under other comprehensive income.
Ove
rvie
wAd
dit io
nal I
nfor
mat
ion
Fina
ncia
l Ana
lysi
sG
over
nanc
eSu
stai
nabi
lity
Busi
ness
Per
form
ance
103Grameenphone Ltd. x Annual Report 2017
Notes to the financial statements
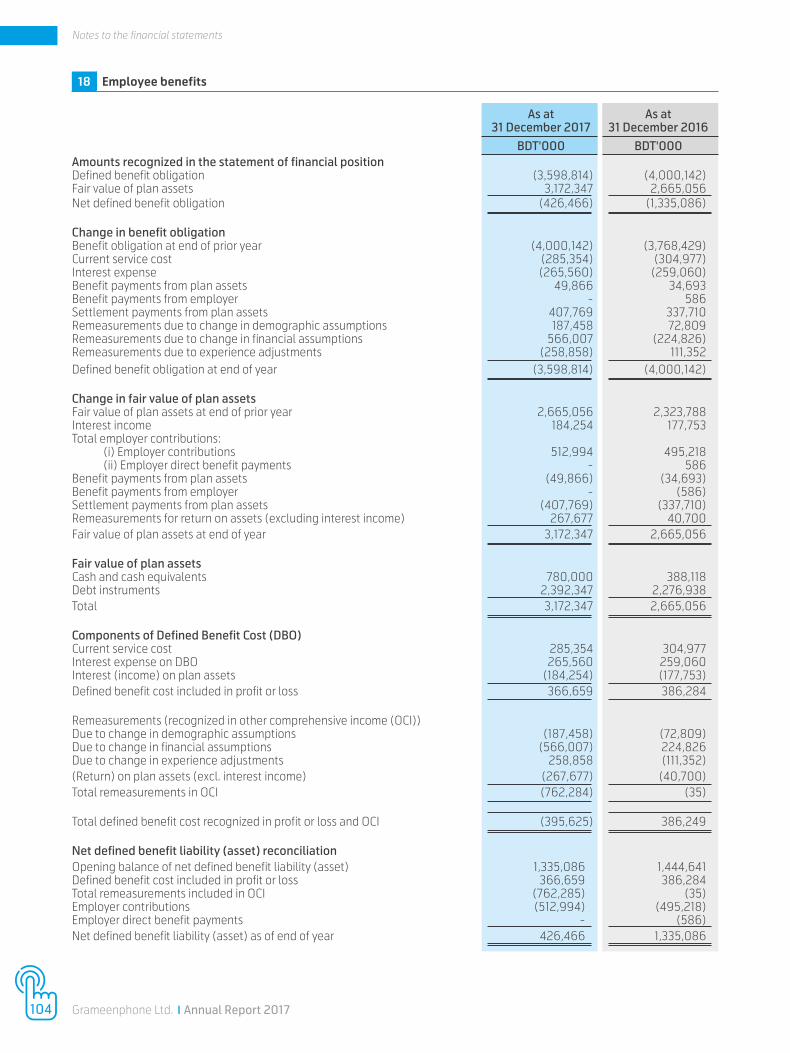
18 Employee benefits
As at As at 31 December 2017 31 December 2016
BDT'000 BDT'000 Amounts recognized in the statement of financial position Defined benefit obligation (3,598,814) (4,000,142)Fair value of plan assets 3,172,347 2,665,056Net defined benefit obligation (426,466) (1,335,086)
Change in benefit obligationBenefit obligation at end of prior year (4,000,142) (3,768,429)Current service cost (285,354) (304,977)Interest expense (265,560) (259,060)Benefit payments from plan assets 49,866 34,693Benefit payments from employer - 586Settlement payments from plan assets 407,769 337,710Remeasurements due to change in demographic assumptions 187,458 72,809Remeasurements due to change in financial assumptions 566,007 (224,826)Remeasurements due to experience adjustments (258,858) 111,352Defined benefit obligation at end of year (3,598,814) (4,000,142)
Change in fair value of plan assetsFair value of plan assets at end of prior year 2,665,056 2,323,788Interest income 184,254 177,753Total employer contributions:
(i) Employer contributions 512,994 495,218 (ii) Employer direct benefit payments - 586
Benefit payments from plan assets (49,866) (34,693)Benefit payments from employer - (586)Settlement payments from plan assets (407,769) (337,710)Remeasurements for return on assets (excluding interest income) 267,677 40,700Fair value of plan assets at end of year 3,172,347 2,665,056
Fair value of plan assets Cash and cash equivalents 780,000 388,118Debt instruments 2,392,347 2,276,938Total 3,172,347 2,665,056
Components of Defined Benefit Cost (DBO) Current service cost 285,354 304,977Interest expense on DBO 265,560 259,060Interest (income) on plan assets (184,254) (177,753)Defined benefit cost included in profit or loss 366,659 386,284
Remeasurements (recognized in other comprehensive income (OCI)) Due to change in demographic assumptions (187,458) (72,809)Due to change in financial assumptions (566,007) 224,826Due to change in experience adjustments 258,858 (111,352)(Return) on plan assets (excl. interest income) (267,677) (40,700)Total remeasurements in OCI (762,284) (35)
Total defined benefit cost recognized in profit or loss and OCI (395,625) 386,249
Net defined benefit liability (asset) reconciliation Opening balance of net defined benefit liability (asset) 1,335,086 1,444,641 Defined benefit cost included in profit or loss 366,659 386,284 Total remeasurements included in OCI (762,285) (35)Employer contributions (512,994) (495,218)Employer direct benefit payments - (586) Net defined benefit liability (asset) as of end of year 426,466 1,335,086
104 Grameenphone Ltd. x Annual Report 2017
Notes to the financial statements
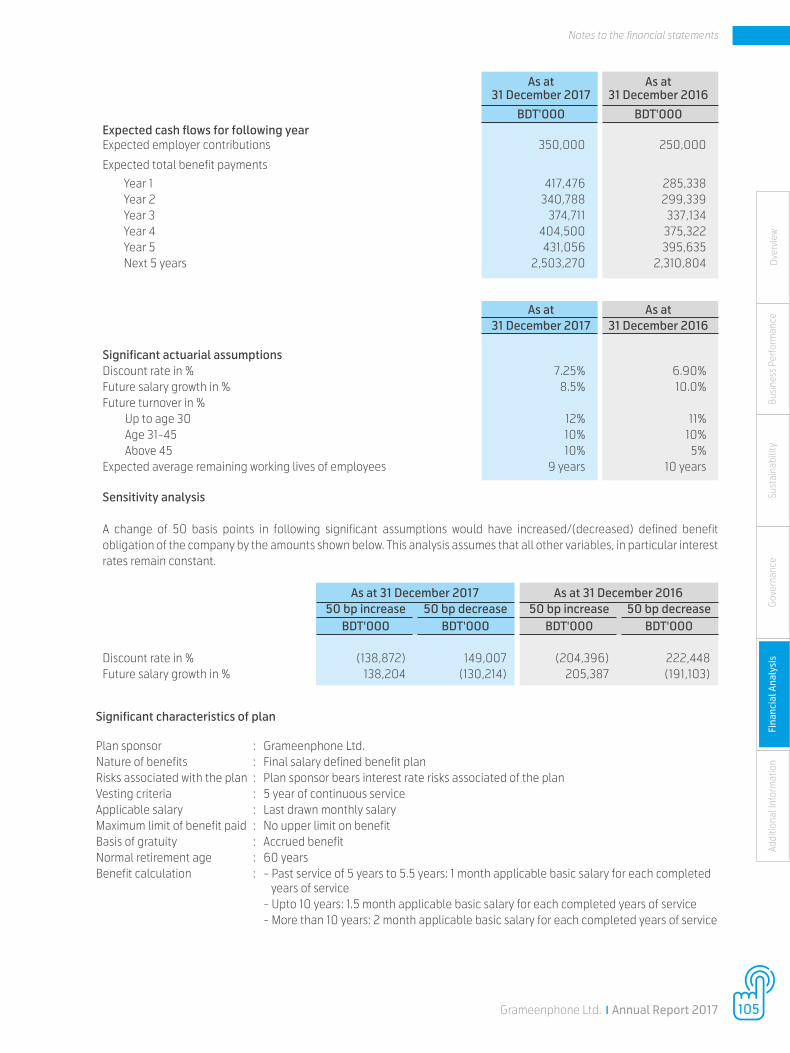
As at As at 31 December 2017 31 December 2016 BDT'000 BDT'000
Expected cash flows for following year Expected employer contributions 350,000 250,000
Expected total benefit payments
Year 1 417,476 285,338 Year 2 340,788 299,339 Year 3 374,711 337,134 Year 4 404,500 375,322 Year 5 431,056 395,635 Next 5 years 2,503,270 2,310,804
As at As at 31 December 2017 31 December 2016
Significant actuarial assumptions Discount rate in % 7.25% 6.90% Future salary growth in % 8.5% 10.0%
Future turnover in % Up to age 30 12% 11%
Age 31-45 10% 10% Above 45 10% 5% Expected average remaining working lives of employees 9 years 10 years Sensitivity analysis
A change of 50 basis points in following significant assumptions would have increased/(decreased) defined benefit obligation of the company by the amounts shown below. This analysis assumes that all other variables, in particular interest rates remain constant.
As at 31 December 2017 As at 31 December 2016 50 bp increase 50 bp decrease 50 bp increase 50 bp decrease BDT'000 BDT'000 BDT'000 BDT'000 Discount rate in % (138,872) 149,007 (204,396) 222,448 Future salary growth in % 138,204 (130,214) 205,387 (191,103)
Significant characteristics of plan
Plan sponsor : Grameenphone Ltd. Nature of benefits : Final salary defined benefit plan Risks associated with the plan : Plan sponsor bears interest rate risks associated of the plan Vesting criteria : 5 year of continuous service Applicable salary : Last drawn monthly salary Maximum limit of benefit paid : No upper limit on benefit Basis of gratuity : Accrued benefit Normal retirement age : 60 years Benefit calculation : - Past service of 5 years to 5.5 years: 1 month applicable basic salary for each completed years of service - Upto 10 years: 1.5 month applicable basic salary for each completed years of service - More than 10 years: 2 month applicable basic salary for each completed years of service
Ove
rvie
wAd
dit io
nal I
nfor
mat
ion
Fina
ncia
l Ana
lysi
sG
over
nanc
eSu
stai
nabi
lity
Busi
ness
Per
form
ance
105Grameenphone Ltd. x Annual Report 2017
Notes to the financial statements

19 Other non-current liabilities
As at As at 31 December 2017 31 December 2016
BDT'000 BDT'000 Asset retirement obligations (Note 19.1)` 139,651 124,073 Other non-current liabilities 284,084 74,883 423,735 198,956
Security deposits from subscribers and channel partners have been reclassified as other current liabilities in 2017 (under Note 23) based on an assessment of contractual terms to determine maturity date. 19.1 Asset retirement obligations (ARO) Opening balance 124,157 126,699 Provision made during the year 19,442 20,164 143,599 146,863 Provision released during the year (3,948) (22,706) Closing balance 139,651 124,157
Grameenphone recognises Asset Retirement Obligations (ARO) in respect of roof-top base stations and office space for any constructive and/or legal obligations for dismantling, removal or restoration incurred by the company as a consequence of installing or constructing the sites. ARO is measured at the present value of expected cash outflows required to settle such obligations. Unwinding of the discount is charged as finance expense in the profit or loss.
20 Trade and other payables
Trade payables including liability for capital expenditure 11,293,719 12,135,515 Accrued expenses 5,122,408 5,871,661 Finance lease obligation 483,089 242,951 16,899,216 18,250,127 Indirect taxes 1,645,305 1,512,521 Deferred connection revenue 953,712 1,291,941 Unearned revenue 4,727,146 4,308,576 24,225,379 25,363,165
21 Provisions
Provisions includes provision for BTRC revenue share, annual operating licence fee, office running, other operational expenses and capital expenditure.
22 Current tax payable
Movement of income tax provision is shown as under:
Opening balance 18,942,559 19,785,655 Provision made during the year including transactions for other comprehensive income 22,320,271 16,005,063 41,262,830 35,790,718 Paid during the year (incl. tax deducted at source) (14,709,415) (16,169,852) Provision released during the year (118,173) (678,307) Closing balance 26,435,242 18,942,559
23 Other current liabilities
Other current liabilities mainly include accruals for profit sharing plan BDT 236,590,686 (2016: BDT 207,853,964), payable for bills pay receipts BDT 694,199,181 (2016: BDT 756,539,891), dividend unclaimed BDT 102,840,174 (2016: BDT 93,058,154) and Security deposits from subscribers and channel partners BDT 455,708,942 (2016: 428,015,857). Security deposits from subscribers and channel partners were classified as non-current liabilities in 2016.
106 Grameenphone Ltd. x Annual Report 2017
Notes to the financial statements
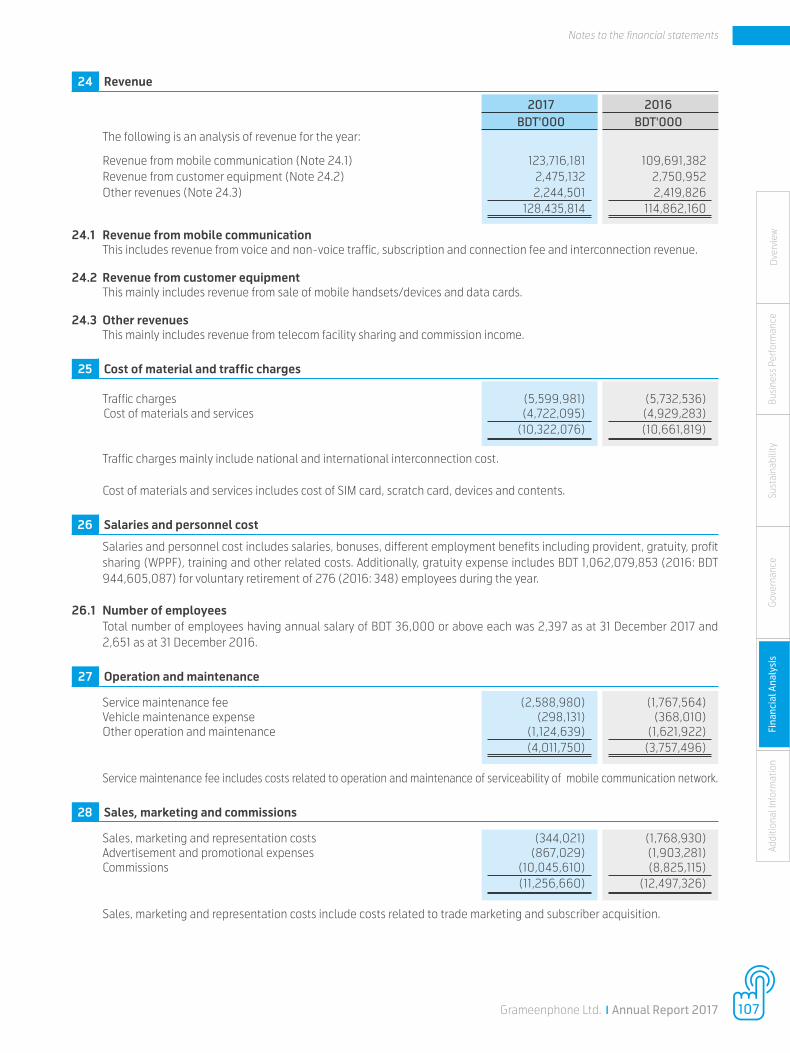
24 Revenue 2017 2016 BDT'000 BDT'000The following is an analysis of revenue for the year:
Revenue from mobile communication (Note 24.1) 123,716,181 109,691,382 Revenue from customer equipment (Note 24.2) 2,475,132 2,750,952 Other revenues (Note 24.3) 2,244,501 2,419,826 128,435,814 114,862,160
24.1 Revenue from mobile communication This includes revenue from voice and non-voice traffic, subscription and connection fee and interconnection revenue.
24.2 Revenue from customer equipment This mainly includes revenue from sale of mobile handsets/devices and data cards.
24.3 Other revenues This mainly includes revenue from telecom facility sharing and commission income.
25 Cost of material and traffic charges
Traffic charges (5,599,981) (5,732,536) Cost of materials and services (4,722,095) (4,929,283) (10,322,076) (10,661,819)
Traffic charges mainly include national and international interconnection cost. Cost of materials and services includes cost of SIM card, scratch card, devices and contents.
26 Salaries and personnel cost
Salaries and personnel cost includes salaries, bonuses, different employment benefits including provident, gratuity, profit sharing (WPPF), training and other related costs. Additionally, gratuity expense includes BDT 1,062,079,853 (2016: BDT944,605,087) for voluntary retirement of 276 (2016: 348) employees during the year.
26.1 Number of employeesTotal number of employees having annual salary of BDT 36,000 or above each was 2,397 as at 31 December 2017 and 2,651 as at 31 December 2016.
27 Operation and maintenance
Service maintenance fee (2,588,980) (1,767,564) Vehicle maintenance expense (298,131) (368,010) Other operation and maintenance (1,124,639) (1,621,922) (4,011,750) (3,757,496) Service maintenance fee includes costs related to operation and maintenance of serviceability of mobile communication network.
28 Sales, marketing and commissions
Sales, marketing and representation costs (344,021) (1,768,930) Advertisement and promotional expenses (867,029) (1,903,281) Commissions (10,045,610) (8,825,115) (11,256,660) (12,497,326) Sales, marketing and representation costs include costs related to trade marketing and subscriber acquisition.
Ove
rvie
wAd
dit io
nal I
nfor
mat
ion
Fina
ncia
l Ana
lysi
sG
over
nanc
eSu
stai
nabi
lity
Busi
ness
Per
form
ance
107Grameenphone Ltd. x Annual Report 2017
Notes to the financial statements
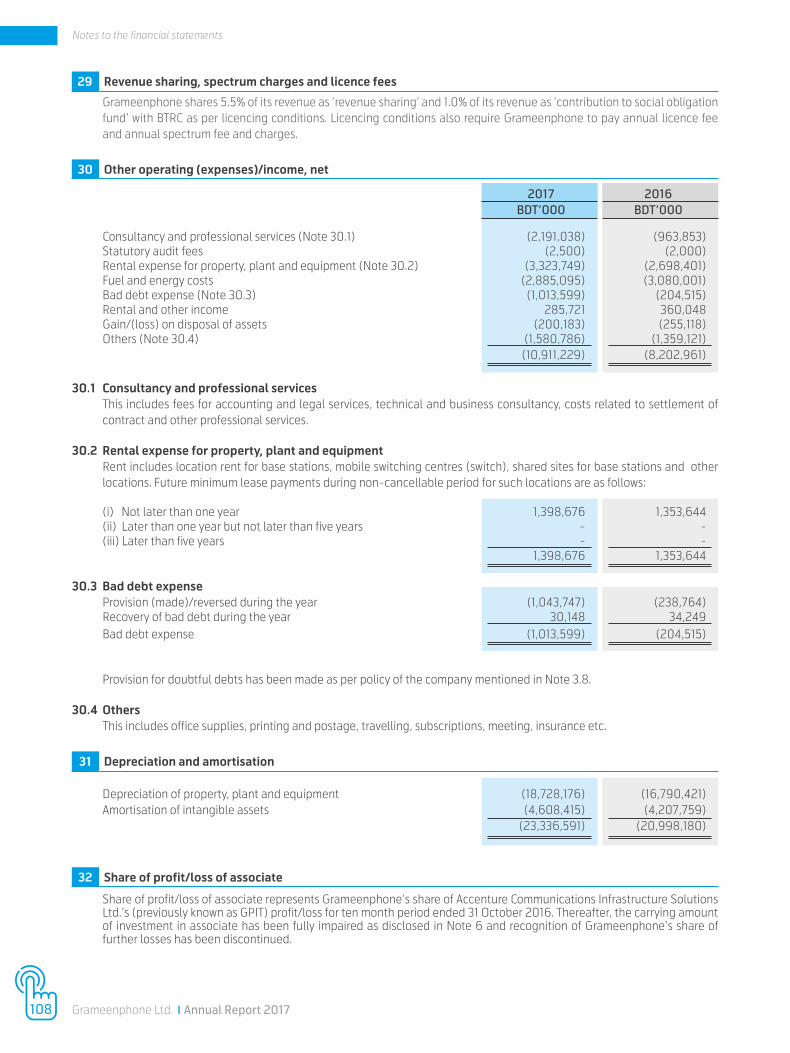
29 Revenue sharing, spectrum charges and licence fees
Grameenphone shares 5.5% of its revenue as ‘revenue sharing’ and 1.0% of its revenue as ‘contribution to social obligation fund’ with BTRC as per licencing conditions. Licencing conditions also require Grameenphone to pay annual licence fee and annual spectrum fee and charges.
30 Other operating (expenses)/income, net
2017 2016 BDT’000 BDT’000
Consultancy and professional services (Note 30.1) (2,191,038) (963,853)Statutory audit fees (2,500) (2,000)Rental expense for property, plant and equipment (Note 30.2) (3,323,749) (2,698,401)Fuel and energy costs (2,885,095) (3,080,001)Bad debt expense (Note 30.3) (1,013,599) (204,515)Rental and other income 285,721 360,048Gain/(loss) on disposal of assets (200,183) (255,118)Others (Note 30.4) (1,580,786) (1,359,121) (10,911,229) (8,202,961)
30.1 Consultancy and professional services This includes fees for accounting and legal services, technical and business consultancy, costs related to settlement of contract and other professional services.
30.2 Rental expense for property, plant and equipmentRent includes location rent for base stations, mobile switching centres (switch), shared sites for base stations and other locations. Future minimum lease payments during non-cancellable period for such locations are as follows:
(i) Not later than one year 1,398,676 1,353,644 (ii) Later than one year but not later than five years - - (iii) Later than five years - - 1,398,676 1,353,644
30.3 Bad debt expense Provision (made)/reversed during the year (1,043,747) (238,764) Recovery of bad debt during the year 30,148 34,249 Bad debt expense (1,013,599) (204,515)
Provision for doubtful debts has been made as per policy of the company mentioned in Note 3.8.
30.4 Others This includes office supplies, printing and postage, travelling, subscriptions, meeting, insurance etc.
31 Depreciation and amortisation Depreciation of property, plant and equipment (18,728,176) (16,790,421)
Amortisation of intangible assets (4,608,415) (4,207,759) (23,336,591) (20,998,180)
32 Share of profit/loss of associate
Share of profit/loss of associate represents Grameenphone’s share of Accenture Communications Infrastructure Solutions Ltd.’s (previously known as GPIT) profit/loss for ten month period ended 31 October 2016. Thereafter, the carrying amount of investment in associate has been fully impaired as disclosed in Note 6 and recognition of Grameenphone’s share of further losses has been discontinued.
108 Grameenphone Ltd. x Annual Report 2017
Notes to the financial statements
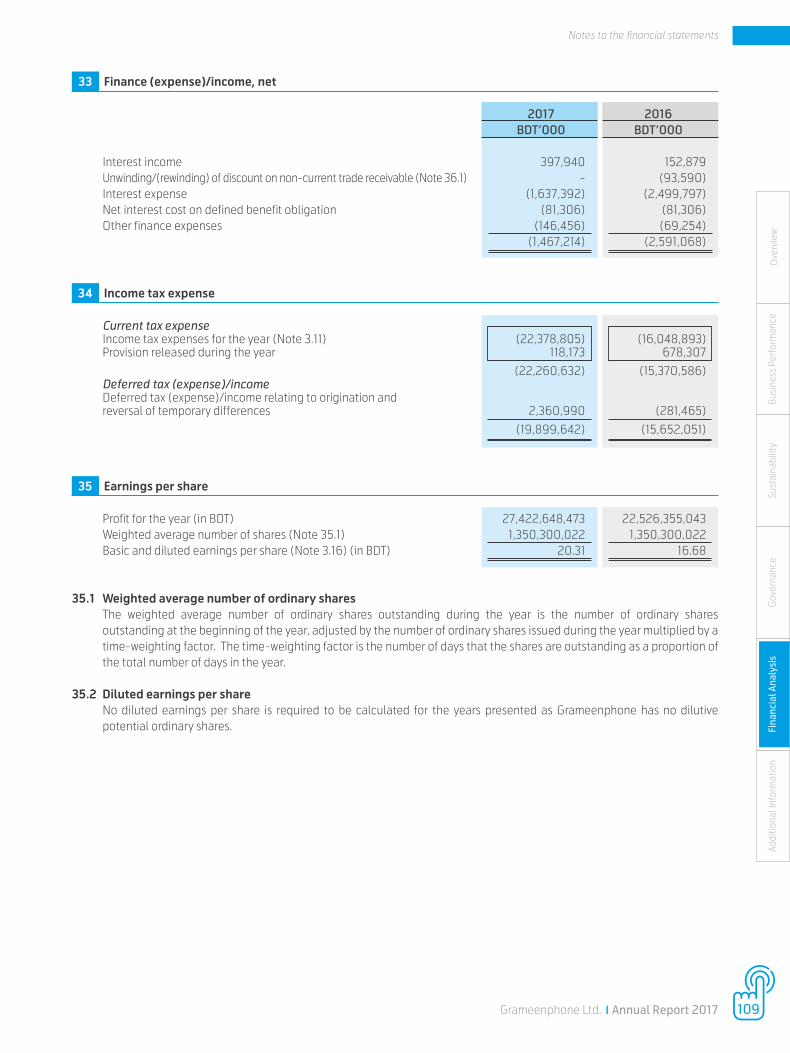
Ove
rvie
wAd
dit io
nal I
nfor
mat
ion
Fina
ncia
l Ana
lysi
sG
over
nanc
eSu
stai
nabi
lity
Busi
ness
Per
form
ance
33 Finance (expense)/income, net
2017 2016 BDT’000 BDT’000
Interest income 397,940 152,879Unwinding/(rewinding) of discount on non-current trade receivable (Note 36.1) - (93,590)Interest expense (1,637,392) (2,499,797)Net interest cost on defined benefit obligation (81,306) (81,306)Other finance expenses (146,456) (69,254) (1,467,214) (2,591,068)
34 Income tax expense
Current tax expense Income tax expenses for the year (Note 3.11) (22,378,805) (16,048,893)Provision released during the year 118,173 678,307
(22,260,632) (15,370,586)Deferred tax (expense)/incomeDeferred tax (expense)/income relating to origination andreversal of temporary differences 2,360,990 (281,465)
(19,899,642) (15,652,051)
35 Earnings per share
Profit for the year (in BDT) 27,422,648,473 22,526,355,043 Weighted average number of shares (Note 35.1) 1,350,300,022 1,350,300,022 Basic and diluted earnings per share (Note 3.16) (in BDT) 20.31 16.68
35.1 Weighted average number of ordinary shares
The weighted average number of ordinary shares outstanding during the year is the number of ordinary shares outstanding at the beginning of the year, adjusted by the number of ordinary shares issued during the year multiplied by a time-weighting factor. The time-weighting factor is the number of days that the shares are outstanding as a proportion of the total number of days in the year.
35.2 Diluted earnings per shareNo diluted earnings per share is required to be calculated for the years presented as Grameenphone has no dilutivepotential ordinary shares.
109Grameenphone Ltd. x Annual Report 2017
Notes to the financial statements
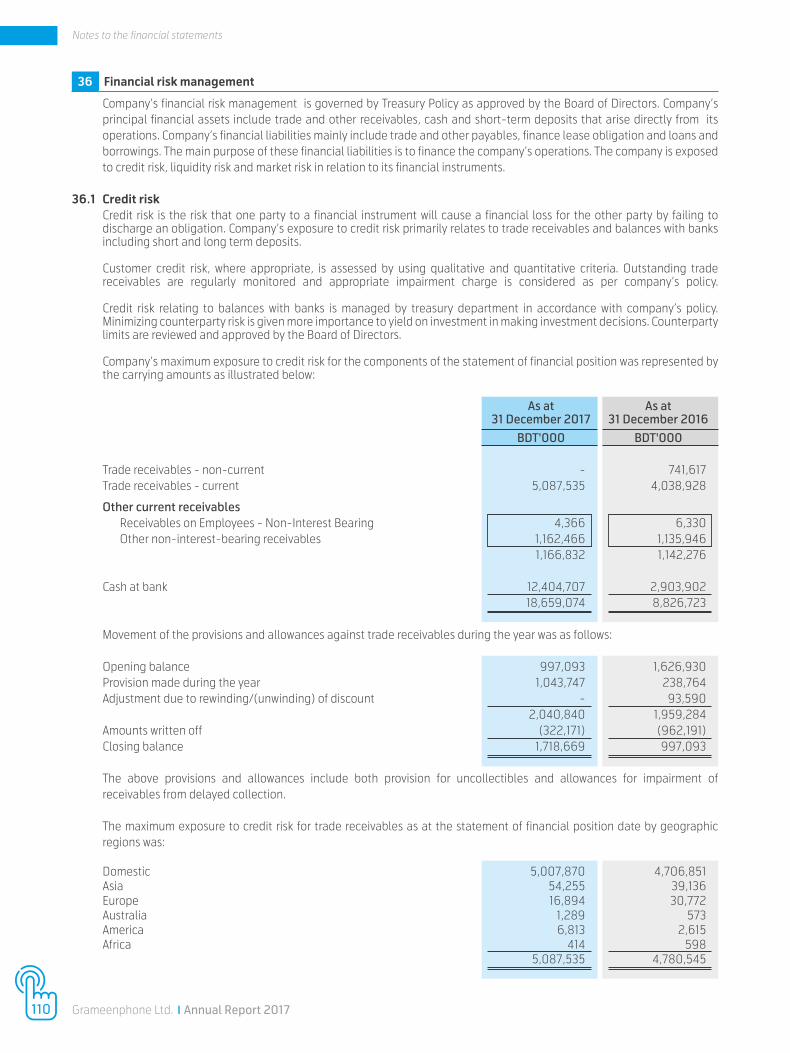
As at As at 31 December 2017 31 December 2016
BDT'000 BDT'000
Trade receivables - non-current - 741,617Trade receivables - current 5,087,535 4,038,928
Other current receivablesReceivables on Employees - Non-Interest Bearing 4,366 6,330Other non-interest-bearing receivables 1,162,466 1,135,946
1,166,832 1,142,276
Cash at bank 12,404,707 2,903,902 18,659,074 8,826,723
Movement of the provisions and allowances against trade receivables during the year was as follows:
Opening balance 997,093 1,626,930 Provision made during the year 1,043,747 238,764 Adjustment due to rewinding/(unwinding) of discount - 93,590 2,040,840 1,959,284 Amounts written off (322,171) (962,191)Closing balance 1,718,669 997,093
The above provisions and allowances include both provision for uncollectibles and allowances for impairment ofreceivables from delayed collection.
The maximum exposure to credit risk for trade receivables as at the statement of financial position date by geographicregions was:
Domestic 5,007,870 4,706,851 Asia 54,255 39,136 Europe 16,894 30,772 Australia 1,289 573 America 6,813 2,615 Africa 414 598 5,087,535 4,780,545
36 Financial risk management
Company’s financial risk management is governed by Treasury Policy as approved by the Board of Directors. Company’s principal financial assets include trade and other receivables, cash and short-term deposits that arise directly from its operations. Company’s financial liabilities mainly include trade and other payables, finance lease obligation and loans and borrowings. The main purpose of these financial liabilities is to finance the company’s operations. The company is exposed to credit risk, liquidity risk and market risk in relation to its financial instruments.
36.1 Credit riskCredit risk is the risk that one party to a financial instrument will cause a financial loss for the other party by failing to discharge an obligation. Company’s exposure to credit risk primarily relates to trade receivables and balances with banks including short and long term deposits.
Customer credit risk, where appropriate, is assessed by using qualitative and quantitative criteria. Outstanding trade receivables are regularly monitored and appropriate impairment charge is considered as per company’s policy.
Credit risk relating to balances with banks is managed by treasury department in accordance with company’s policy. Minimizing counterparty risk is given more importance to yield on investment in making investment decisions. Counterparty limits are reviewed and approved by the Board of Directors.
Company’s maximum exposure to credit risk for the components of the statement of financial position was represented by the carrying amounts as illustrated below:
110 Grameenphone Ltd. x Annual Report 2017
Notes to the financial statements

36.2
Liq
uidi
ty ri
skLi
quid
ity ri
sk is
the
risk
that
the
com
pany
is u
nabl
e to
mee
t its
fina
ncia
l obl
igat
ions
as
they
fall
due.
The
com
pany
fore
cast
s its
cas
h flo
w re
quire
men
ts a
nd e
nsur
es th
at it
has
su
ffici
ent c
ash
and
cash
equ
ival
ents
and
loan
faci
litie
s to
cov
er e
xpec
ted
need
s fo
r liq
uidi
ty d
urin
g th
e ne
xt 12
mon
ths.
The
com
pany
mai
ntai
ns a
bal
ance
d m
atur
ity p
rofil
e of
de
bt o
blig
atio
ns a
nd in
gen
eral
min
imiz
es c
urre
nt e
xces
s ca
sh.
The
tabl
e be
low
giv
es th
e m
atur
ity p
rofil
e of
the
com
pany
’s fi
nanc
ial l
iabi
litie
s ba
sed
on c
ontr
actu
al u
ndis
coun
ted
paym
ents
.
Carr
ying
amou
nt
BDT'
00
0
Mat
urity
date
Nom
inal
Inte
rest
rate
Cont
ract
ual
Cash
flow
s
BDT'
00
0
6 m
onth
sor
less
BDT'
00
0
6-12
mon
ths
BDT'
00
0
1-2
year
s
BDT'
00
0
2-5
year
s
BDT'
00
0
Mor
e th
an5
year
s
BDT'
00
0
As
at 3
1 Dec
embe
r 20
17
Fina
nce
leas
e ob
ligat
ion
5,4
13,2
83
June
2027
15
%
10,2
64,0
78
452,
019
78
6,75
6
949,
239
1,9
88,8
81
6,08
7,18
3 (in
clud
ing
curr
ent p
ortio
n)
Loan
s an
d bo
rrow
ings
- lo
ng-t
erm
8,
539,
290
Ap
ril 20
20 6
-mon
th-LIB
OR +
3.5%
8,
994,
784
-
-
6,
069,
094
2,
925,
689
-
Loan
s an
d bo
rrow
ings
- s
hort
-ter
m
Fore
ign
5
,679
,626
Oc
tobe
r 201
8 6
-mon
th-LIB
OR +
3.5%
6,
358,
585
3,
215,
578
3,
143,
006
-
-
-
Loca
l -
-
-
-
- -
-
-
-
Tra
de a
nd o
ther
pay
able
s
Trad
e pa
yabl
es in
clud
ing
liabi
lity
for
11,2
93,7
19
Dece
mbe
r 201
8
N/A
11
,293
,719
4,7
85,4
02.0
0 6
,508
,316
.93
-
-
-
ca
pita
l exp
endi
ture
Accr
ued
expe
nses
5,
122,
408
Dec
embe
r 201
8
N/A
5
,122,
408
2,9
19,7
72.7
8 2
,202
,635
.61
-
-
-
Oth
er c
urre
nt li
abili
ties
2,9
43,19
3 D
ecem
ber 2
018
N
/A
2,94
3,19
3
2,94
3,19
3
-
-
-
-
3
8,99
1,519
44
,976
,766
14
,315
,966
12
,640
,715
7,
018
,333
4,
914,
571
6,0
87,18
3
Ove
rvie
wAd
dit io
nal I
nfor
mat
ion
Fina
ncia
l Ana
lysi
sG
over
nanc
eSu
stai
nabi
lity
Busi
ness
Per
form
ance
111Grameenphone Ltd. x Annual Report 2017
Notes to the financial statements
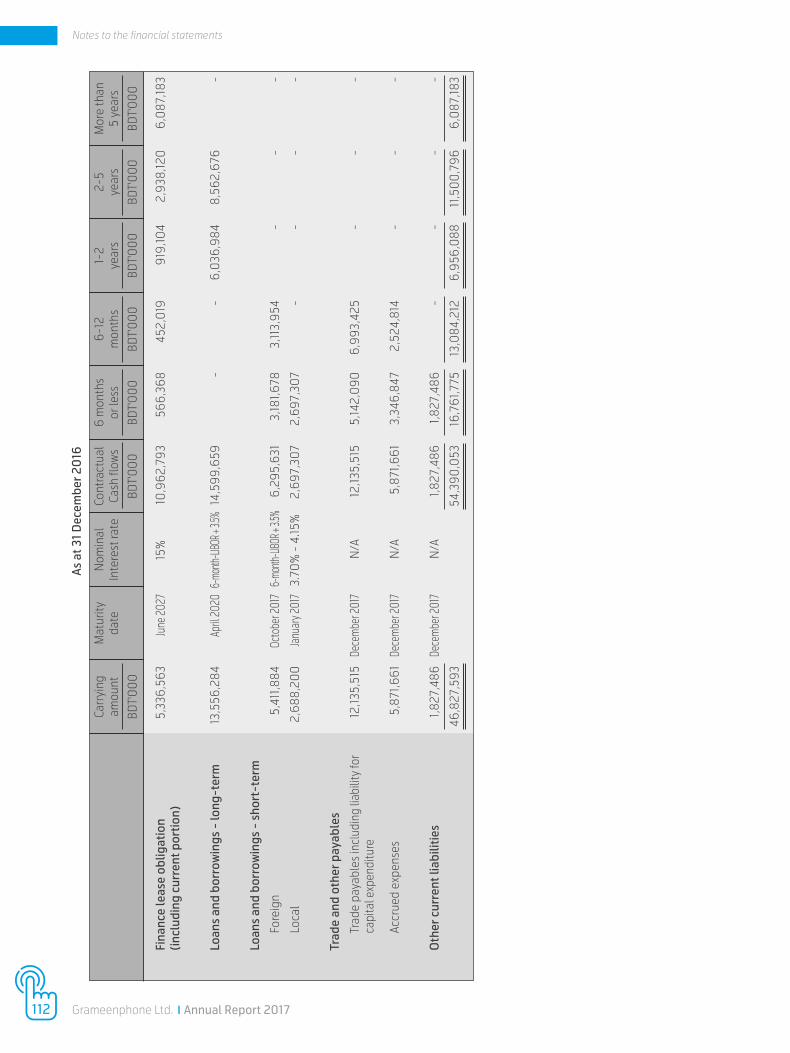
As a
t 31 D
ecem
ber 2
016
Fina
nce
leas
e ob
ligat
ion
5,33
6,56
3 Ju
ne 20
27
15%
10
,962
,793
56
6,36
8 45
2,0
19
919,
104
2,9
38,12
0
6,0
87,18
3(in
clud
ing
curr
ent p
ortio
n)
Loan
s an
d bo
rrow
ings
- lo
ng-t
erm
13
,556
,284
Ap
ril 20
20 6
-mon
th-LIB
OR +
3.5%
14,5
99,6
59
-
-
6,0
36,9
84
8,5
62,6
76
-
Loan
s an
d bo
rrow
ings
- s
hort
-ter
m
Fore
ign
5
,411
,884
O
ctob
er 20
17 6
-mon
th-LIB
OR +
3.5%
6
,295
,631
3
,181,6
78
3,11
3,95
4 -
-
-
Loca
l 2,
688,
200
Ja
nuar
y 201
7 3.
70%
- 4
.15%
2
,697
,30
7
2,6
97,3
07
-
-
-
-
Trad
e an
d ot
her p
ayab
les
Trad
e pa
yabl
es in
clud
ing
liabi
lity
for
12,13
5,51
5 D
ecem
ber 2
017
N/A
12
,135,
515
5
,142,
090
6
,993
,425
-
-
-
ca
pita
l exp
endi
ture
Accr
ued
expe
nses
5
,871
,661
De
cem
ber 2
017
N/A
5
,871
,661
3
,346
,847
2
,524
,814
-
-
-
Oth
er c
urre
nt li
abili
ties
1,8
27,4
86
Dece
mbe
r 201
7 N
/A
1,82
7,48
6
1,82
7,48
6
-
-
-
-
4
6,82
7,59
3
54,
390
,053
1
6,76
1,775
13
,084
,212
6
,956
,088
11
,50
0,7
96
6,0
87,18
3
Carr
ying
amou
nt
BDT'
00
0
Mat
urity
date
Nom
inal
Inte
rest
rate
Cont
ract
ual
Cash
flow
s
BDT'
00
0
6 m
onth
sor
less
BDT'
00
0
6-12
mon
ths
BDT'
00
0
1-2
year
s
BDT'
00
0
2-5
year
s
BDT'
00
0
Mor
e th
an5
year
s
BDT'
00
0
112 Grameenphone Ltd. x Annual Report 2017
Notes to the financial statements
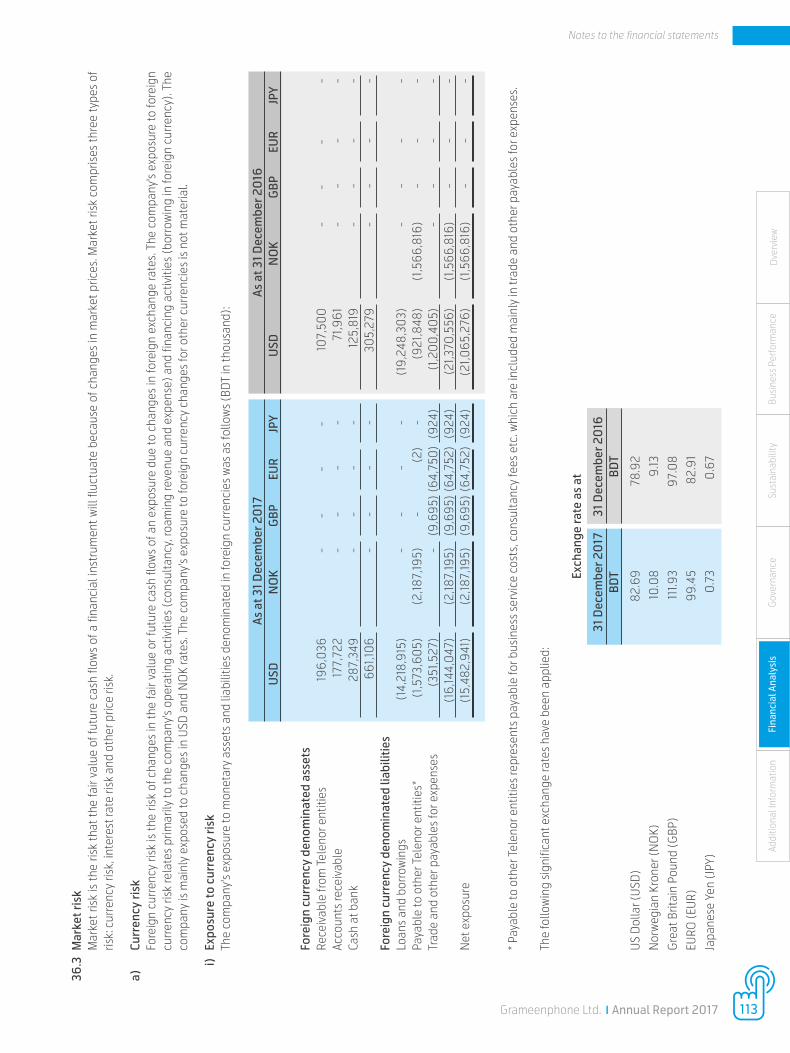
36.3
Mar
ket r
isk
Mar
ket r
isk
is th
e ris
k th
at th
e fa
ir va
lue
of fu
ture
cas
h flo
ws
of a
fina
ncia
l ins
trum
ent w
ill fl
uctu
ate
beca
use
of c
hang
es in
mar
ket p
rices
. Mar
ket r
isk
com
pris
es th
ree
type
s of
ris
k: c
urre
ncy
risk,
inte
rest
rate
risk
and
oth
er p
rice
risk.
a)
Curr
ency
risk
Fore
ign
curr
ency
risk
is th
e ris
k of
cha
nges
in th
e fa
ir va
lue
or fu
ture
cas
h flo
ws
of a
n ex
posu
re d
ue to
cha
nges
in fo
reig
n ex
chan
ge ra
tes.
The
com
pany
's ex
posu
re to
fore
ign
curr
ency
risk
rela
tes
prim
arily
to th
e co
mpa
ny's
oper
atin
g ac
tiviti
es (c
onsu
ltanc
y, ro
amin
g re
venu
e an
d ex
pens
e) a
nd fi
nanc
ing
activ
ities
(bor
row
ing
in fo
reig
n cu
rren
cy).
The
com
pany
is m
ainl
y ex
pose
d to
cha
nges
in U
SD a
nd N
OK
rate
s. T
he c
ompa
ny's
expo
sure
to fo
reig
n cu
rren
cy c
hang
es fo
r oth
er c
urre
ncie
s is
not
mat
eria
l.
i) Ex
posu
re to
cur
renc
y ris
kTh
e co
mpa
ny's
expo
sure
to m
onet
ary
asse
ts a
nd li
abili
ties
deno
min
ated
in fo
reig
n cu
rren
cies
was
as
follo
ws
(BD
T in
thou
sand
):
As
at 3
1 Dec
embe
r 20
17
As a
t 31 D
ecem
ber 2
016
USD
N
OK
GBP
EU
R JP
Y U
SD
NO
K G
BP
EUR
JPY
Fo
reig
n cu
rren
cy d
enom
inat
ed a
sset
s
Rece
ivab
le fr
om T
elen
or e
ntiti
es
196,
036
-
-
-
-
10
7,50
0
-
-
-
-
Ac
coun
ts re
ceiv
able
1
77,7
22
-
-
-
-
71,9
61
-
-
-
-
Cash
at b
ank
287,
349
-
-
-
-
125,
819
-
-
-
-
661
,106
-
-
-
-
3
05,
279
-
-
-
-
Fore
ign
curr
ency
den
omin
ated
liab
ilitie
s
Loan
s an
d bo
rrow
ings
(
14,2
18,9
15)
-
-
-
-
(19
,248
,30
3)
-
-
-
-
Paya
ble
to o
ther
Tel
enor
ent
ities
* (
1,573
,60
5)
(2,18
7,19
5)
-
(2)
-
(
921,8
48)
(1,5
66,8
16)
-
-
-
Tr
ade
and
othe
r pay
able
s fo
r exp
ense
s
(351
,527
) -
(9
,695
) (6
4,75
0)
(924
) (1
,20
0,4
05)
-
-
-
-
(16,
144,
047
) (2
,187,
195)
(9
,695
) (6
4,75
2)
(924
) (2
1,370
,556
) (1
,566
,816
) -
-
-
Net
exp
osur
e (1
5,48
2,94
1)
(2,18
7,19
5)
(9,6
95)
(64,
752)
(9
24)
(21,0
65,2
76)
(1,5
66,8
16)
-
-
-
* P
ayab
le to
oth
er T
elen
or e
ntiti
es re
pres
ents
pay
able
for b
usin
ess
serv
ice
cost
s, c
onsu
ltanc
y fe
es e
tc. w
hich
are
incl
uded
mai
nly
in tr
ade
and
othe
r pay
able
s fo
r exp
ense
s.
The
follo
win
g si
gnifi
cant
exc
hang
e ra
tes
have
bee
n ap
plie
d:
Exch
ange
rate
as
at
31
Dec
embe
r 20
17
31 D
ecem
ber 2
016
BD
T BD
T
U
S D
olla
r (U
SD)
82.6
9 78
.92
N
orw
egia
n Kr
oner
(NO
K)
10.0
8 9.
13
G
reat
Brit
ain
Poun
d (G
BP)
111.9
3 97
.08
EU
RO (E
UR)
99
.45
82.9
1
Ja
pane
se Y
en (J
PY)
0.7
3 0
.67
Ove
rvie
wAd
dit io
nal I
nfor
mat
ion
Fina
ncia
l Ana
lysi
sG
over
nanc
eSu
stai
nabi
lity
Busi
ness
Per
form
ance
113Grameenphone Ltd. x Annual Report 2017
Notes to the financial statements

Market risk (contd.) ii) Foreign exchange rate sensitivity analysis for foreign currency expenditures
A change of 10 basis points in foreign currencies would have increased/ (decreased) equity and profit or loss of the company by the amounts shown below. This analysis assumes that all other variables, in particular interest rates remain constant.
Profit or loss Equity 10 bp increase 10 bp decrease 10 bp increase 10 bp decrease 31 December 2017 BDT'000 BDT'000 BDT'000 BDT'000
Expenditures denominated in USD (15,483) 15,483 (15,483) 15,483 Expenditures denominated in NOK (2,187) 2187 (2,187) 2,187 Expenditures denominated in GBP (10) 10 (10) 10 Expenditures denominated in EURO (65) 65 (65) 65 Expenditures denominated in JPY (1) 1 (1) 1 Exchange rate sensitivity (17,746) 17,746 (17,746) 17,746 31 December 2016 Expenditures denominated in USD (21,065) 21,065 (21,065) 21,065 Expenditures denominated in NOK (1,567) 1,567 (1,567) 1,567 Expenditures denominated in GBP - - - - Expenditures denominated in EURO - - - - Expenditures denominated in JPY - - - - Exchange rate sensitivity (22,632) 22,632 (22,632) 22,632 b) Interest rate risk
Interest rate risk is the risk that the fair value or future cash flows of a financial instrument will fluctuate because of changes in market interest rate. Exposure to fair value movement relates to fixed rate instruments subject to fair value accounting and exposure to cash flow fluctuation relates to variable rate instruments. The company is primarily exposed to cash flow fluctuation arising from variable rate borrowings. The objective of interest rate risk management for Grameenphone is to reduce financial cost and ensure predictability.
Profile As at 31 December 2017, the interest rate profile of the company's interest bearing financial instruments was:
Carrying amount As at As at
31 December 2017 31 December 2016 BDT'000 BDT'000
Fixed rate instruments
Financial assets Short-term investment - - Financial liabilities Loans and borrowings - 2,688,200 Floating rate instruments
Financial liabilities Loans and borrowings 14,218,915 18,968,168
114 Grameenphone Ltd. x Annual Report 2017
Notes to the financial statements
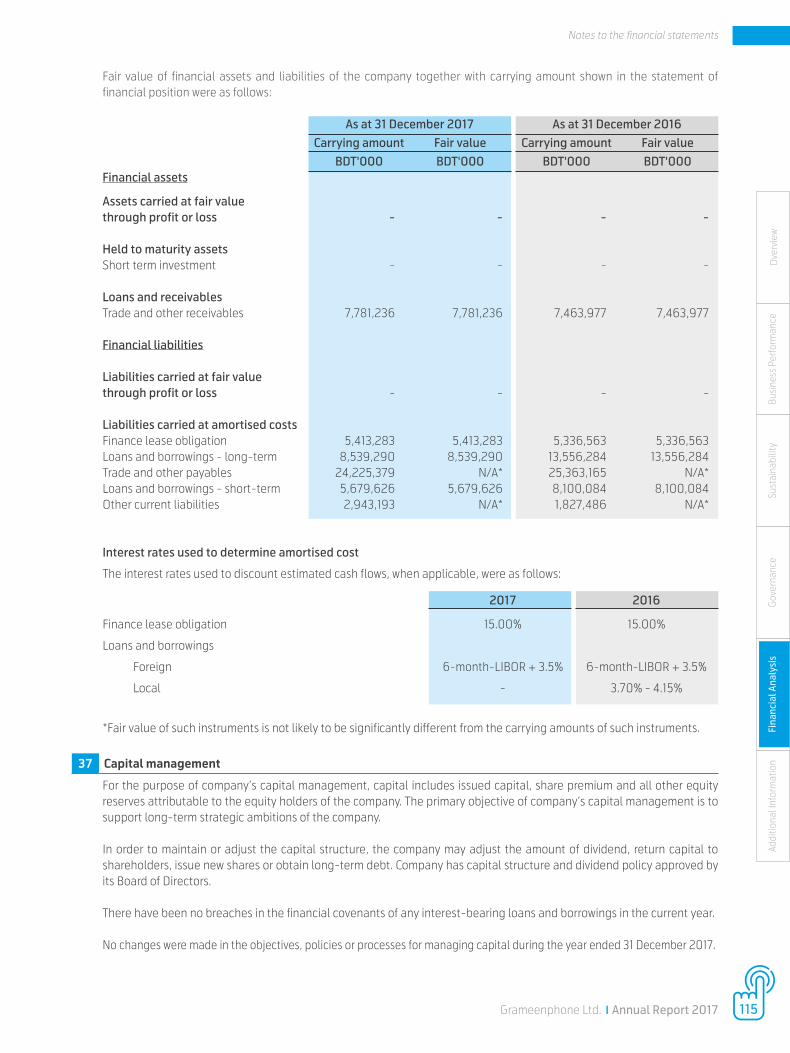
Fair value of financial assets and liabilities of the company together with carrying amount shown in the statement offinancial position were as follows:
As at 31 December 2017 As at 31 December 2016 Carrying amount Fair value Carrying amount Fair value BDT'000 BDT'000 BDT'000 BDT'000
Financial assets
Assets carried at fair value through profit or loss - - - - Held to maturity assets Short term investment - - - -
Loans and receivables Trade and other receivables 7,781,236 7,781,236 7,463,977 7,463,977 Financial liabilities Liabilities carried at fair value through profit or loss - - - - Liabilities carried at amortised costsFinance lease obligation 5,413,283 5,413,283 5,336,563 5,336,563 Loans and borrowings - long-term 8,539,290 8,539,290 13,556,284 13,556,284 Trade and other payables 24,225,379 N/A* 25,363,165 N/A*Loans and borrowings - short-term 5,679,626 5,679,626 8,100,084 8,100,084 Other current liabilities 2,943,193 N/A* 1,827,486 N/A*
Interest rates used to determine amortised cost
The interest rates used to discount estimated cash flows, when applicable, were as follows:
2017 2016
Finance lease obligation 15.00% 15.00%
Loans and borrowings
Foreign 6-month-LIBOR + 3.5% 6-month-LIBOR + 3.5%
Local - 3.70% - 4.15%
*Fair value of such instruments is not likely to be significantly different from the carrying amounts of such instruments.
37 Capital management
For the purpose of company’s capital management, capital includes issued capital, share premium and all other equity reserves attributable to the equity holders of the company. The primary objective of company’s capital management is to support long-term strategic ambitions of the company.
In order to maintain or adjust the capital structure, the company may adjust the amount of dividend, return capital to shareholders, issue new shares or obtain long-term debt. Company has capital structure and dividend policy approved by its Board of Directors.
There have been no breaches in the financial covenants of any interest-bearing loans and borrowings in the current year.
No changes were made in the objectives, policies or processes for managing capital during the year ended 31 December 2017.
Ove
rvie
wAd
dit io
nal I
nfor
mat
ion
Fina
ncia
l Ana
lysi
sG
over
nanc
eSu
stai
nabi
lity
Busi
ness
Per
form
ance
115Grameenphone Ltd. x Annual Report 2017
Notes to the financial statements

38Re
late
d pa
rty
disc
losu
res
Dur
ing
the
year
end
ed 3
1 Dec
embe
r 20
17, t
he c
ompa
ny e
nter
ed in
to a
num
ber o
f tra
nsac
tions
with
rela
ted
part
ies i
n th
e no
rmal
cou
rse
of b
usin
ess.
The
nam
es o
f the
sign
ifica
nt
rela
ted
part
ies,
nat
ure
of th
ese
tran
sact
ions
[exp
endi
ture
s/(r
even
ue),
rece
ivab
les/
(pay
able
s), a
nd d
ivid
end
paym
ents
] and
am
ount
s ar
e se
t out
bel
ow in
acc
orda
nce
with
the
prov
isio
ns o
f IAS
/BAS
24
Rela
ted
Part
y D
iscl
osur
es. N
atur
e of
rela
tions
hip
and
sign
ifica
nce
of th
e am
ount
s ha
ve b
een
cons
ider
ed in
pro
vidi
ng th
is d
iscl
osur
e.
38.1
Key
man
agem
ent p
erso
nnel
com
pens
atio
n
20
17
2016
BDT'
00
0
BDT'
00
0
Shor
t ter
m e
mpl
oyee
ben
efits
55
2,80
6
471,3
37
Po
st e
mpl
oym
ent b
enefi
ts
58,12
2
49,
790
Oth
er lo
ng te
rm b
enefi
ts
18,8
93
13,7
95
629,
821
534
,922
Key
man
agem
ent p
erso
nnel
com
pens
atio
n in
clud
es b
enefi
ts fo
r em
ploy
ees
of th
e ra
nk o
f Dire
ctor
and
abo
ve. N
o re
mun
erat
ion
is g
iven
to th
e Bo
ard
of D
irect
ors
apar
t fro
m
atte
ndan
ce fe
es in
con
nect
ion
with
Boa
rd a
nd B
oard
Sub
-Com
mitt
ee m
eetin
gs. D
urin
g th
e ye
ar 2
017
, att
enda
nce
fees
in c
onne
ctio
n w
ith B
oard
and
Boa
rd S
ub-C
omm
ittee
m
eetin
gs a
re B
DT
1,296
,122
(20
16: B
DT
875,
840
).
38
.2 D
ebts
due
from
and
due
to k
ey m
anag
emen
t per
sonn
elAt
tend
ance
fees
of
Boar
d of
Dire
ctor
s w
hich
are
not
yet
pai
d, in
clud
es B
DT
3,72
9,45
6 as
at 3
1 Dec
embe
r 20
17 (2
016
: BD
T 3,
143,
166)
. Oth
er th
an th
at n
o de
bts
wer
e du
e fro
m
and
due
to k
ey m
anag
emen
t per
sonn
el o
f the
com
pany
.
Key
man
agem
ent p
erso
nnel
of G
ram
eenp
hone
, may
use
mob
ile c
omm
unic
atio
n se
rvic
es o
f Gra
mee
npho
ne. T
hese
ser
vice
s m
ay b
e ch
arge
d on
the
arm
’s le
ngth
bas
is a
fter
a
cert
ain
usag
e lim
it an
d tr
ade
and
othe
r rec
eiva
bles
may
incl
ude
rece
ivab
les
for p
rovi
ding
mob
ile c
omm
unic
atio
n se
rvic
es to
them
.
38.
3 O
ther
rela
ted
part
y tr
ansa
ctio
ns d
urin
g th
e ye
ar
20
17
2016
N
ame
of re
late
d pa
rtie
s N
atur
e N
atur
e of
tran
sact
ions
BD
T'0
00
BD
T'0
00
Te
leno
r Mob
ile C
omm
unic
atio
ns A
S Sh
areh
olde
r D
ivid
end
paym
ent
14,6
91,4
51
10,9
24,4
12
N
ye T
elen
or M
obile
Com
mun
icat
ions
II A
S Sh
areh
olde
r D
ivid
end
paym
ent
4
3
Nye
Tel
enor
Mob
ile C
omm
unic
atio
ns II
I AS
Shar
ehol
der
Div
iden
d pa
ymen
t 4
3
Tele
nor A
sia
Pte.
Ltd
. Sh
areh
olde
r D
ivid
end
paym
ent
4
3
Gra
mee
n Te
leco
m
Shar
ehol
der
Div
iden
d pa
ymen
t 9
,00
4,44
5
6,6
95,6
13
Co
mm
issi
on e
xpen
se
190
,755
17
7,35
8
Gra
mee
n Ka
lyan
Sh
areh
olde
r D
ivid
end
paym
ent
0.4
0
.3
G
ram
een
Shak
ti Sh
areh
olde
r D
ivid
end
paym
ent
0.4
0
.3
Ac
cent
ure
Com
mun
icat
ions
As
soci
ate
Purc
hase
of I
T se
rvic
e, e
quip
men
ts a
nd s
oftw
ares
6
36,3
61
1,19
6,31
0
In
frast
ruct
ure
Solu
tions
Ltd
.
Rent
al in
com
e an
d ot
her i
ncom
e (2
5,34
4)
(62,
412)
In
vest
men
t in
pref
eren
ce s
hare
s 9
9,0
00
-
116 Grameenphone Ltd. x Annual Report 2017
Notes to the financial statements

38Re
late
d pa
rty
disc
losu
res
Dur
ing
the
year
end
ed 3
1 Dec
embe
r 20
17, t
he c
ompa
ny e
nter
ed in
to a
num
ber o
f tra
nsac
tions
with
rela
ted
part
ies i
n th
e no
rmal
cou
rse
of b
usin
ess.
The
nam
es o
f the
sign
ifica
nt
rela
ted
part
ies,
nat
ure
of th
ese
tran
sact
ions
[exp
endi
ture
s/(r
even
ue),
rece
ivab
les/
(pay
able
s), a
nd d
ivid
end
paym
ents
] and
am
ount
s ar
e se
t out
bel
ow in
acc
orda
nce
with
the
prov
isio
ns o
f IAS
/BAS
24
Rela
ted
Part
y D
iscl
osur
es. N
atur
e of
rela
tions
hip
and
sign
ifica
nce
of th
e am
ount
s ha
ve b
een
cons
ider
ed in
pro
vidi
ng th
is d
iscl
osur
e.
38.1
Key
man
agem
ent p
erso
nnel
com
pens
atio
n
20
17
2016
BDT'
00
0
BDT'
00
0
Shor
t ter
m e
mpl
oyee
ben
efits
55
2,80
6
471,3
37
Po
st e
mpl
oym
ent b
enefi
ts
58,12
2
49,
790
Oth
er lo
ng te
rm b
enefi
ts
18,8
93
13,7
95
629,
821
534
,922
Key
man
agem
ent p
erso
nnel
com
pens
atio
n in
clud
es b
enefi
ts fo
r em
ploy
ees
of th
e ra
nk o
f Dire
ctor
and
abo
ve. N
o re
mun
erat
ion
is g
iven
to th
e Bo
ard
of D
irect
ors
apar
t fro
m
atte
ndan
ce fe
es in
con
nect
ion
with
Boa
rd a
nd B
oard
Sub
-Com
mitt
ee m
eetin
gs. D
urin
g th
e ye
ar 2
017
, att
enda
nce
fees
in c
onne
ctio
n w
ith B
oard
and
Boa
rd S
ub-C
omm
ittee
m
eetin
gs a
re B
DT
1,296
,122
(20
16: B
DT
875,
840
).
38
.2 D
ebts
due
from
and
due
to k
ey m
anag
emen
t per
sonn
elAt
tend
ance
fees
of
Boar
d of
Dire
ctor
s w
hich
are
not
yet
pai
d, in
clud
es B
DT
3,72
9,45
6 as
at 3
1 Dec
embe
r 20
17 (2
016
: BD
T 3,
143,
166)
. Oth
er th
an th
at n
o de
bts
wer
e du
e fro
m
and
due
to k
ey m
anag
emen
t per
sonn
el o
f the
com
pany
.
Key
man
agem
ent p
erso
nnel
of G
ram
eenp
hone
, may
use
mob
ile c
omm
unic
atio
n se
rvic
es o
f Gra
mee
npho
ne. T
hese
ser
vice
s m
ay b
e ch
arge
d on
the
arm
’s le
ngth
bas
is a
fter
a
cert
ain
usag
e lim
it an
d tr
ade
and
othe
r rec
eiva
bles
may
incl
ude
rece
ivab
les
for p
rovi
ding
mob
ile c
omm
unic
atio
n se
rvic
es to
them
.
38.
3 O
ther
rela
ted
part
y tr
ansa
ctio
ns d
urin
g th
e ye
ar
20
17
2016
N
ame
of re
late
d pa
rtie
s N
atur
e N
atur
e of
tran
sact
ions
BD
T'0
00
BD
T'0
00
Te
leno
r Mob
ile C
omm
unic
atio
ns A
S Sh
areh
olde
r D
ivid
end
paym
ent
14,6
91,4
51
10,9
24,4
12
N
ye T
elen
or M
obile
Com
mun
icat
ions
II A
S Sh
areh
olde
r D
ivid
end
paym
ent
4
3
Nye
Tel
enor
Mob
ile C
omm
unic
atio
ns II
I AS
Shar
ehol
der
Div
iden
d pa
ymen
t 4
3
Tele
nor A
sia
Pte.
Ltd
. Sh
areh
olde
r D
ivid
end
paym
ent
4
3
Gra
mee
n Te
leco
m
Shar
ehol
der
Div
iden
d pa
ymen
t 9
,00
4,44
5
6,6
95,6
13
Co
mm
issi
on e
xpen
se
190
,755
17
7,35
8
Gra
mee
n Ka
lyan
Sh
areh
olde
r D
ivid
end
paym
ent
0.4
0
.3
G
ram
een
Shak
ti Sh
areh
olde
r D
ivid
end
paym
ent
0.4
0
.3
Ac
cent
ure
Com
mun
icat
ions
As
soci
ate
Purc
hase
of I
T se
rvic
e, e
quip
men
ts a
nd s
oftw
ares
6
36,3
61
1,19
6,31
0
In
frast
ruct
ure
Solu
tions
Ltd
.
Rent
al in
com
e an
d ot
her i
ncom
e (2
5,34
4)
(62,
412)
In
vest
men
t in
pref
eren
ce s
hare
s 9
9,0
00
-
2017
20
16
Nam
e of
rela
ted
part
ies
Nat
ure
Nat
ure
of tr
ansa
ctio
ns
BDT'
00
0
BDT'
00
0
Te
leno
r ASA
Te
leno
r gro
up e
ntity
Co
nsul
tanc
y an
d pr
ofes
sion
al s
ervi
ce fe
e 6
84,2
52
382
,819
IT s
uppo
rt c
ost
30
1,343
6
6,13
6
Tele
nor C
onsu
lt AS
Te
leno
r gro
up e
ntity
Co
nsul
tanc
y an
d pr
ofes
sion
al s
ervi
ce fe
e in
clud
ing
-
5
,977
com
pens
atio
n of
key
man
agem
ent p
erso
nnel
whe
re re
leva
nt
Tele
nor G
loba
l Ser
vice
s AS
Te
leno
r gro
up e
ntity
Co
nsul
tanc
y an
d pr
ofes
sion
al s
ervi
ce fe
e 3
8,34
3
28,
174
Te
leno
r Glo
bal S
hare
d Se
rvic
es A
S Te
leno
r gro
up e
ntity
Co
nsul
tanc
y an
d pr
ofes
sion
al s
ervi
ce fe
e 5
79,7
70
435
,050
Tele
nor G
O
Tele
nor g
roup
ent
ity
Cons
ulta
ncy
and
prof
essi
onal
ser
vice
fee
incl
udin
g 3
14,2
58
227
,944
com
pens
atio
n of
key
man
agem
ent p
erso
nnel
whe
re re
leva
nt
Tele
nor D
igita
l AS
Tele
nor g
roup
ent
ity
Cons
ulta
ncy
and
prof
essi
onal
ser
vice
fee
(99,
136)
9
9,13
6
Tele
nor H
ealth
AS
Tele
nor g
roup
ent
ity
Cost
of s
ervi
ce
42,
399
5
,549
Tele
nor P
rocu
rem
ent C
ompa
ny
Tele
nor g
roup
ent
ity
Cost
of s
ervi
ce
21,5
30
-
Te
leno
r Nor
way
Te
leno
r gro
up e
ntity
Ro
amin
g re
venu
e ne
t of d
isco
unt
(482
) (3
60)
Ro
amin
g co
st n
et o
f dis
coun
t 2
16
17
Te
leno
r Sw
eden
Te
leno
r gro
up e
ntity
Ro
amin
g re
venu
e ne
t of d
isco
unt
(249
) (1
08)
Ro
amin
g co
st n
et o
f dis
coun
t 7
2
(11)
Te
leno
r Den
mar
k Te
leno
r gro
up e
ntity
Ro
amin
g re
venu
e ne
t of d
isco
unt
264
(8
3)
Roam
ing
cost
net
of d
isco
unt
87
2
1
Tele
nor H
unga
ry
Tele
nor g
roup
ent
ity
Roam
ing
reve
nue
net o
f dis
coun
t (2
2)
(4)
Ro
amin
g co
st n
et o
f dis
coun
t 0
.4
9
Ca
pita
l exp
endi
ture
-
14,9
47
Te
leno
r Ser
bia
Tele
nor g
roup
ent
ity
Roam
ing
reve
nue
net o
f dis
coun
t 8
2
(2)
Ro
amin
g co
st n
et o
f dis
coun
t 3
(0
.4)
Te
leno
r Mon
tene
gro
Tele
nor g
roup
ent
ity
Roam
ing
reve
nue
net o
f dis
coun
t (3
) (0
.3)
Ro
amin
g co
st n
et o
f dis
coun
t 0
.0
0.2
Te
leno
r Bul
garia
Te
leno
r gro
up e
ntity
Ro
amin
g re
venu
e ne
t of d
isco
unt
(1)
(9)
Ro
amin
g co
st n
et o
f dis
coun
t 1
2
Ove
rvie
wAd
dit io
nal I
nfor
mat
ion
Fina
ncia
l Ana
lysi
sG
over
nanc
eSu
stai
nabi
lity
Busi
ness
Per
form
ance
117Grameenphone Ltd. x Annual Report 2017
Notes to the financial statements
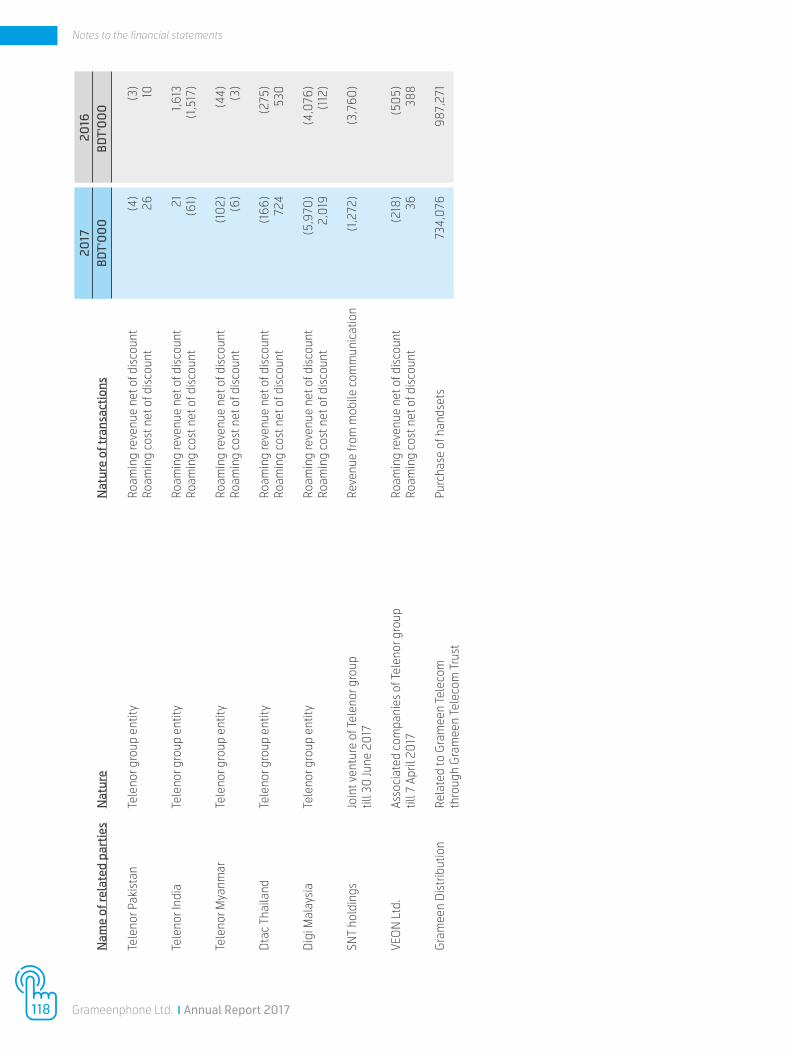
2017
20
16
Nam
e of
rela
ted
part
ies
Nat
ure
Nat
ure
of tr
ansa
ctio
ns
BDT'
00
0
BDT'
00
0
Tele
nor P
akis
tan
Tele
nor g
roup
ent
ity
Roam
ing
reve
nue
net o
f dis
coun
t (4
) (3
)
Roam
ing
cost
net
of d
isco
unt
26
10
Te
leno
r Ind
ia
Tele
nor g
roup
ent
ity
Roam
ing
reve
nue
net o
f dis
coun
t 2
1 1,
613
Roam
ing
cost
net
of d
isco
unt
(61)
(1
,517
)
Te
leno
r Mya
nmar
Te
leno
r gro
up e
ntity
Ro
amin
g re
venu
e ne
t of d
isco
unt
(10
2)
(44)
Ro
amin
g co
st n
et o
f dis
coun
t (6
) (3
)
Dta
c Th
aila
nd
Tele
nor g
roup
ent
ity
Roam
ing
reve
nue
net o
f dis
coun
t (1
66)
(275
)
Roam
ing
cost
net
of d
isco
unt
724
5
30
D
igi M
alay
sia
Tele
nor g
roup
ent
ity
Roam
ing
reve
nue
net o
f dis
coun
t (5
,970
) (4
,076
)
Roam
ing
cost
net
of d
isco
unt
2,0
19
(112
)
SNT
hold
ings
Jo
int v
entu
re o
f Tel
enor
gro
up
Reve
nue
from
mob
ile c
omm
unic
atio
n (1
,272
) (3
,760
)
til
l 30
June
20
17
VE
ON
Ltd
. As
soci
ated
com
pani
es o
f Tel
enor
gro
up
Roam
ing
reve
nue
net o
f dis
coun
t (2
18)
(50
5)
til
l 7 A
pril
2017
Ro
amin
g co
st n
et o
f dis
coun
t 3
6
388
Gra
mee
n D
istr
ibut
ion
Rela
ted
to G
ram
een
Tele
com
Pu
rcha
se o
f han
dset
s 7
34,0
76
987
,271
th
roug
h G
ram
een
Tele
com
Tru
st
118 Grameenphone Ltd. x Annual Report 2017
Notes to the financial statements
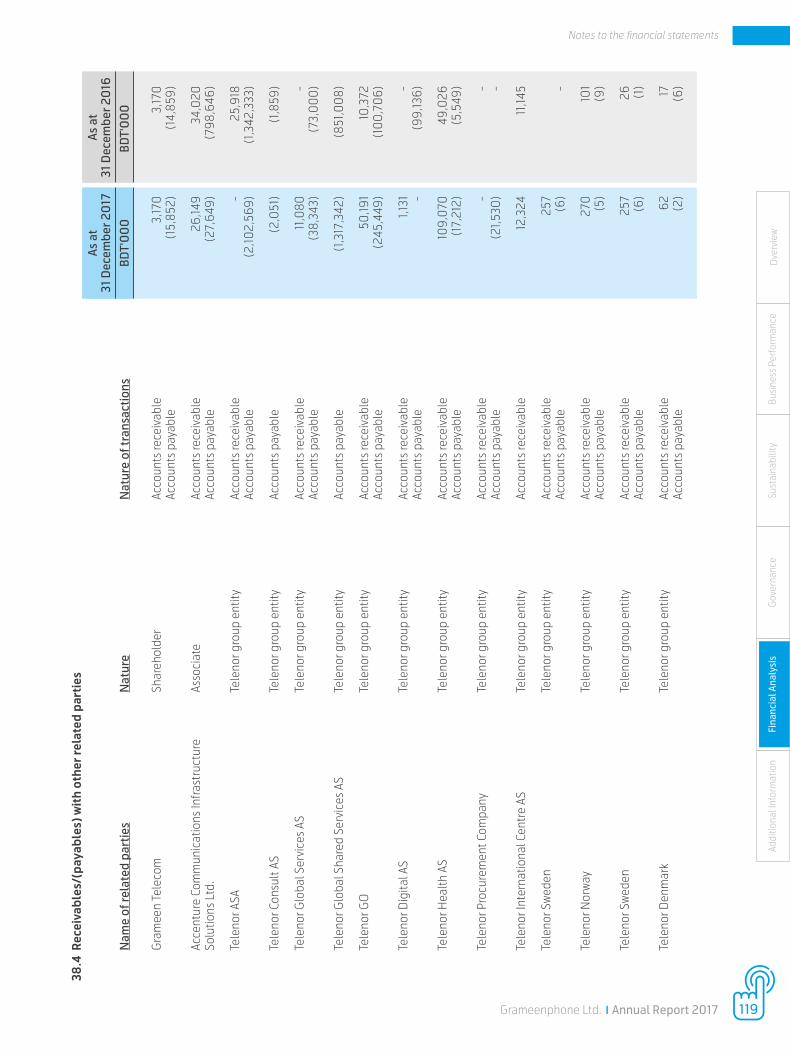
38.4
Rec
eiva
bles
/(pa
yabl
es) w
ith
othe
r rel
ated
par
ties
As a
t As
at
31 D
ecem
ber 2
017
31
Dec
embe
r 20
16
Nam
e of
rela
ted
part
ies
Nat
ure
Nat
ure
of tr
ansa
ctio
ns
BDT'
00
0
BDT'
00
0
G
ram
een
Tele
com
Sh
areh
olde
r Ac
coun
ts re
ceiv
able
3
,170
3
,170
Acco
unts
pay
able
(1
5,85
2)
(14,
859)
Ac
cent
ure
Com
mun
icat
ions
Infra
stru
ctur
e As
soci
ate
Acco
unts
rece
ivab
le
26,
149
3
4,0
20
So
lutio
ns L
td.
Ac
coun
ts p
ayab
le
(27
,649
) (7
98,6
46)
Te
leno
r ASA
Te
leno
r gro
up e
ntity
Ac
coun
ts re
ceiv
able
-
25,
918
Acco
unts
pay
able
(2
,102,
569)
(1
,342
,333
)
Te
leno
r Con
sult
AS
Tele
nor g
roup
ent
ity
Acco
unts
pay
able
(
2,0
51)
(1,8
59)
Te
leno
r Glo
bal S
ervi
ces
AS
Tele
nor g
roup
ent
ity
Acco
unts
rece
ivab
le
11,0
80
-
Ac
coun
ts p
ayab
le
(38,
343)
(7
3,0
00
)
Te
leno
r Glo
bal S
hare
d Se
rvic
es A
S Te
leno
r gro
up e
ntity
Ac
coun
ts p
ayab
le
(1,3
17,3
42)
(851
,00
8)
Te
leno
r GO
Te
leno
r gro
up e
ntity
Ac
coun
ts re
ceiv
able
5
0,19
1 10
,372
Ac
coun
ts p
ayab
le
(24
5,44
9)
(10
0,7
06)
Te
leno
r Dig
ital A
S Te
leno
r gro
up e
ntity
Ac
coun
ts re
ceiv
able
1
,131
-
Acco
unts
pay
able
-
(99,
136)
Tele
nor H
ealth
AS
Tele
nor g
roup
ent
ity
Acco
unts
rece
ivab
le
10
9,0
70
49,
026
Acco
unts
pay
able
(
17,2
12)
(5,5
49)
Te
leno
r Pro
cure
men
t Com
pany
Te
leno
r gro
up e
ntity
Ac
coun
ts re
ceiv
able
-
-
Ac
coun
ts p
ayab
le
(21,5
30)
-
Te
leno
r Int
erna
tiona
l Cen
tre
AS
Tele
nor g
roup
ent
ity
Acco
unts
rece
ivab
le
12,3
24
11,14
5
Tele
nor S
wed
en
Tele
nor g
roup
ent
ity
Acco
unts
rece
ivab
le
257
Acco
unts
pay
able
(6
) -
Tele
nor N
orw
ay
Tele
nor g
roup
ent
ity
Acco
unts
rece
ivab
le
270
10
1
Acco
unts
pay
able
(5
) (9
)
Tele
nor S
wed
en
Tele
nor g
roup
ent
ity
Acco
unts
rece
ivab
le
257
2
6
Acco
unts
pay
able
(6
) (1
)
Tele
nor D
enm
ark
Tele
nor g
roup
ent
ity
Acco
unts
rece
ivab
le
62
17
Acco
unts
pay
able
(2
) (6
)
Ove
rvie
wAd
dit io
nal I
nfor
mat
ion
Fina
ncia
l Ana
lysi
sG
over
nanc
eSu
stai
nabi
lity
Busi
ness
Per
form
ance
119Grameenphone Ltd. x Annual Report 2017
Notes to the financial statements
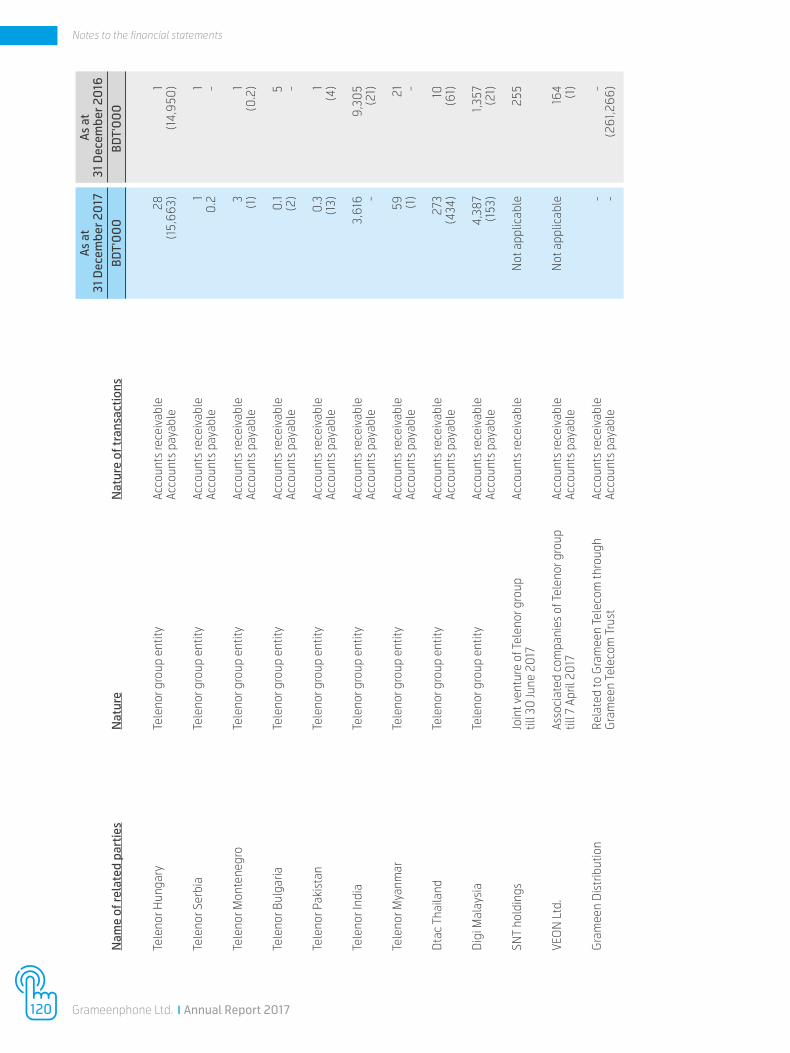
As a
t As
at
31 D
ecem
ber 2
017
31
Dec
embe
r 20
16
Nam
e of
rela
ted
part
ies
Nat
ure
Nat
ure
of tr
ansa
ctio
ns
BDT'
00
0
BDT'
00
0
Tele
nor H
unga
ry
Tele
nor g
roup
ent
ity
Acco
unts
rece
ivab
le
28
1
Acco
unts
pay
able
(1
5,66
3)
(14,
950
)
Tele
nor S
erbi
a Te
leno
r gro
up e
ntity
Ac
coun
ts re
ceiv
able
1
1
Acco
unts
pay
able
0
.2
-
Te
leno
r Mon
tene
gro
Tele
nor g
roup
ent
ity
Acco
unts
rece
ivab
le
3
1
Ac
coun
ts p
ayab
le
(1)
(0.2
)
Tele
nor B
ulga
ria
Tele
nor g
roup
ent
ity
Acco
unts
rece
ivab
le
0.1
5
Ac
coun
ts p
ayab
le
(2)
-
Te
leno
r Pak
ista
n Te
leno
r gro
up e
ntity
Ac
coun
ts re
ceiv
able
0
.3
1
Ac
coun
ts p
ayab
le
(13)
(4
)
Te
leno
r Ind
ia
Tele
nor g
roup
ent
ity
Acco
unts
rece
ivab
le
3,6
16
9,3
05
Acco
unts
pay
able
-
(21)
Te
leno
r Mya
nmar
Te
leno
r gro
up e
ntity
Ac
coun
ts re
ceiv
able
5
9
21
Acco
unts
pay
able
(1
) -
Dta
c Th
aila
nd
Tele
nor g
roup
ent
ity
Acco
unts
rece
ivab
le
273
10
Ac
coun
ts p
ayab
le
(434
) (6
1)
Dig
i Mal
aysi
a Te
leno
r gro
up e
ntity
Ac
coun
ts re
ceiv
able
4
,387
1,
357
Acco
unts
pay
able
(1
53)
(21)
SN
T ho
ldin
gs
Join
t ven
ture
of T
elen
or g
roup
Ac
coun
ts re
ceiv
able
N
ot a
pplic
able
2
55
till 3
0 Ju
ne 2
017
VEO
N L
td.
Asso
ciat
ed c
ompa
nies
of T
elen
or g
roup
Ac
coun
ts re
ceiv
able
N
ot a
pplic
able
16
4
til
l 7 A
pril
2017
Ac
coun
ts p
ayab
le
(1
)
Gra
mee
n D
istr
ibut
ion
Rela
ted
to G
ram
een
Tele
com
thro
ugh
Acco
unts
rece
ivab
le
-
-
G
ram
een
Tele
com
Tru
st
Acco
unts
pay
able
-
(261
,266
)
120 Grameenphone Ltd. x Annual Report 2017
Notes to the financial statements
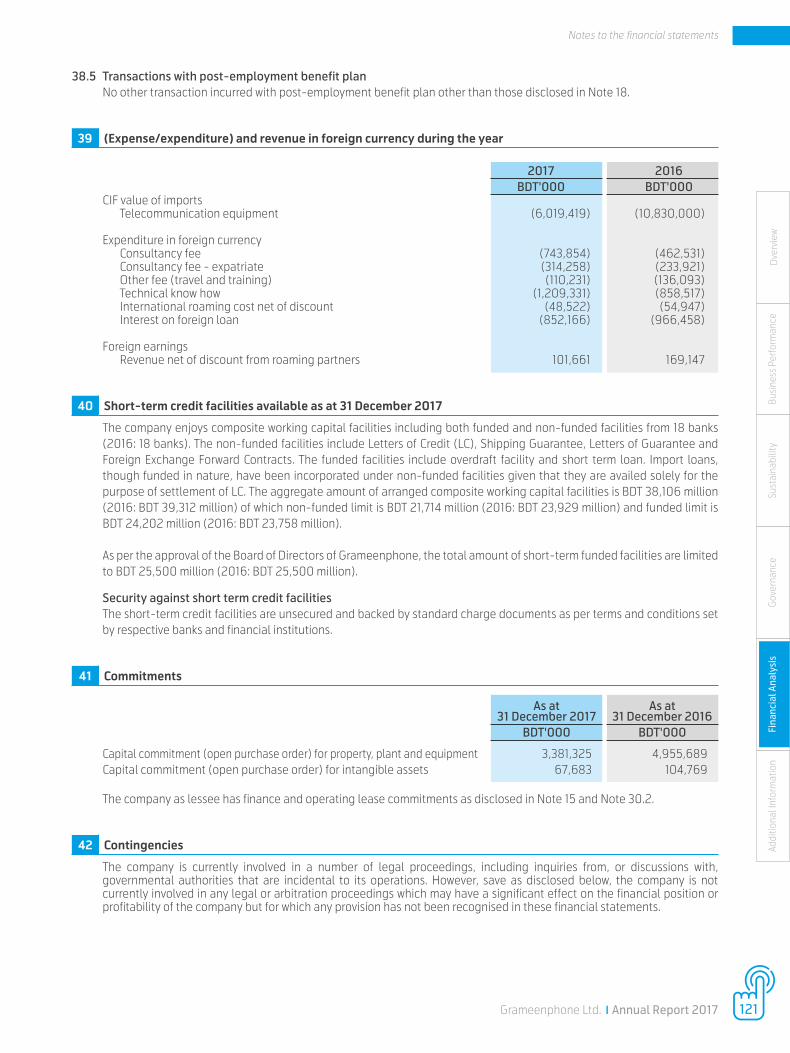
38.5 Transactions with post-employment benefit plan No other transaction incurred with post-employment benefit plan other than those disclosed in Note 18.
39 (Expense/expenditure) and revenue in foreign currency during the year
2017 2016 BDT'000 BDT'000CIF value of imports
Telecommunication equipment (6,019,419) (10,830,000)
Expenditure in foreign currency Consultancy fee (743,854) (462,531) Consultancy fee - expatriate (314,258) (233,921) Other fee (travel and training) (110,231) (136,093) Technical know how (1,209,331) (858,517) International roaming cost net of discount (48,522) (54,947) Interest on foreign loan (852,166) (966,458)
Foreign earnings Revenue net of discount from roaming partners 101,661 169,147
40 Short-term credit facilities available as at 31 December 2017
The company enjoys composite working capital facilities including both funded and non-funded facilities from 18 banks (2016: 18 banks). The non-funded facilities include Letters of Credit (LC), Shipping Guarantee, Letters of Guarantee and Foreign Exchange Forward Contracts. The funded facilities include overdraft facility and short term loan. Import loans, though funded in nature, have been incorporated under non-funded facilities given that they are availed solely for the purpose of settlement of LC. The aggregate amount of arranged composite working capital facilities is BDT 38,106 million (2016: BDT 39,312 million) of which non-funded limit is BDT 21,714 million (2016: BDT 23,929 million) and funded limit is BDT 24,202 million (2016: BDT 23,758 million).
As per the approval of the Board of Directors of Grameenphone, the total amount of short-term funded facilities are limited to BDT 25,500 million (2016: BDT 25,500 million).
Security against short term credit facilitiesThe short-term credit facilities are unsecured and backed by standard charge documents as per terms and conditions set by respective banks and financial institutions.
41 Commitments As at As at 31 December 2017 31 December 2016 BDT'000 BDT'000
Capital commitment (open purchase order) for property, plant and equipment 3,381,325 4,955,689 Capital commitment (open purchase order) for intangible assets 67,683 104,769
The company as lessee has finance and operating lease commitments as disclosed in Note 15 and Note 30.2.
42 Contingencies
The company is currently involved in a number of legal proceedings, including inquiries from, or discussions with, governmental authorities that are incidental to its operations. However, save as disclosed below, the company is not currently involved in any legal or arbitration proceedings which may have a significant effect on the financial position or profitability of the company but for which any provision has not been recognised in these financial statements.
Ove
rvie
wAd
dit io
nal I
nfor
mat
ion
Fina
ncia
l Ana
lysi
sG
over
nanc
eSu
stai
nabi
lity
Busi
ness
Per
form
ance
121Grameenphone Ltd. x Annual Report 2017
Notes to the financial statements
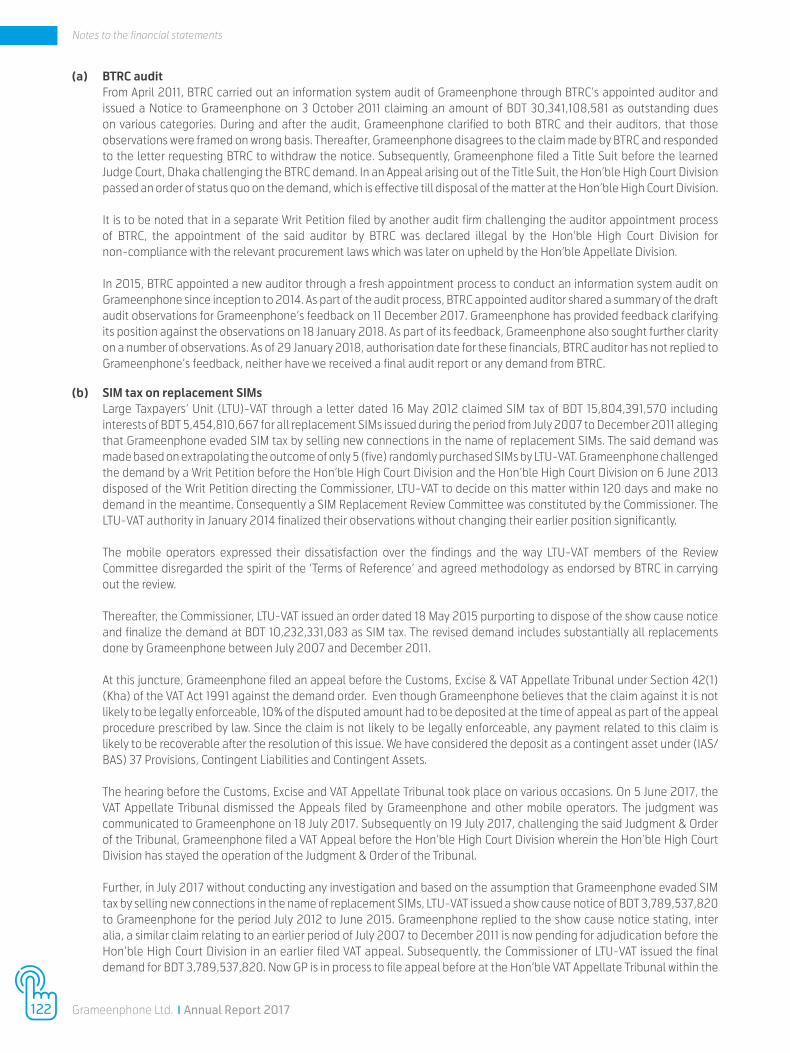
(a) BTRC auditFrom April 2011, BTRC carried out an information system audit of Grameenphone through BTRC’s appointed auditor and issued a Notice to Grameenphone on 3 October 2011 claiming an amount of BDT 30,341,108,581 as outstanding dues on various categories. During and after the audit, Grameenphone clarified to both BTRC and their auditors, that those observations were framed on wrong basis. Thereafter, Grameenphone disagrees to the claim made by BTRC and responded to the letter requesting BTRC to withdraw the notice. Subsequently, Grameenphone filed a Title Suit before the learned Judge Court, Dhaka challenging the BTRC demand. In an Appeal arising out of the Title Suit, the Hon’ble High Court Division passed an order of status quo on the demand, which is effective till disposal of the matter at the Hon’ble High Court Division. It is to be noted that in a separate Writ Petition filed by another audit firm challenging the auditor appointment process of BTRC, the appointment of the said auditor by BTRC was declared illegal by the Hon’ble High Court Division fornon-compliance with the relevant procurement laws which was later on upheld by the Hon’ble Appellate Division.
In 2015, BTRC appointed a new auditor through a fresh appointment process to conduct an information system audit on Grameenphone since inception to 2014. As part of the audit process, BTRC appointed auditor shared a summary of the draft audit observations for Grameenphone’s feedback on 11 December 2017. Grameenphone has provided feedback clarifying its position against the observations on 18 January 2018. As part of its feedback, Grameenphone also sought further clarity on a number of observations. As of 29 January 2018, authorisation date for these financials, BTRC auditor has not replied to Grameenphone’s feedback, neither have we received a final audit report or any demand from BTRC.
(b) SIM tax on replacement SIMsLarge Taxpayers’ Unit (LTU)-VAT through a letter dated 16 May 2012 claimed SIM tax of BDT 15,804,391,570 including interests of BDT 5,454,810,667 for all replacement SIMs issued during the period from July 2007 to December 2011 alleging that Grameenphone evaded SIM tax by selling new connections in the name of replacement SIMs. The said demand was made based on extrapolating the outcome of only 5 (five) randomly purchased SIMs by LTU-VAT. Grameenphone challenged the demand by a Writ Petition before the Hon’ble High Court Division and the Hon’ble High Court Division on 6 June 2013 disposed of the Writ Petition directing the Commissioner, LTU-VAT to decide on this matter within 120 days and make no demand in the meantime. Consequently a SIM Replacement Review Committee was constituted by the Commissioner. The LTU-VAT authority in January 2014 finalized their observations without changing their earlier position significantly.
The mobile operators expressed their dissatisfaction over the findings and the way LTU-VAT members of the Review Committee disregarded the spirit of the ‘Terms of Reference’ and agreed methodology as endorsed by BTRC in carrying out the review.
Thereafter, the Commissioner, LTU-VAT issued an order dated 18 May 2015 purporting to dispose of the show cause notice and finalize the demand at BDT 10,232,331,083 as SIM tax. The revised demand includes substantially all replacements done by Grameenphone between July 2007 and December 2011.
At this juncture, Grameenphone filed an appeal before the Customs, Excise & VAT Appellate Tribunal under Section 42(1)(Kha) of the VAT Act 1991 against the demand order. Even though Grameenphone believes that the claim against it is not likely to be legally enforceable, 10% of the disputed amount had to be deposited at the time of appeal as part of the appeal procedure prescribed by law. Since the claim is not likely to be legally enforceable, any payment related to this claim is likely to be recoverable after the resolution of this issue. We have considered the deposit as a contingent asset under (IAS/BAS) 37 Provisions, Contingent Liabilities and Contingent Assets.
The hearing before the Customs, Excise and VAT Appellate Tribunal took place on various occasions. On 5 June 2017, the VAT Appellate Tribunal dismissed the Appeals filed by Grameenphone and other mobile operators. The judgment was communicated to Grameenphone on 18 July 2017. Subsequently on 19 July 2017, challenging the said Judgment & Order of the Tribunal, Grameenphone filed a VAT Appeal before the Hon’ble High Court Division wherein the Hon’ble High Court Division has stayed the operation of the Judgment & Order of the Tribunal.
Further, in July 2017 without conducting any investigation and based on the assumption that Grameenphone evaded SIM tax by selling new connections in the name of replacement SIMs, LTU-VAT issued a show cause notice of BDT 3,789,537,820 to Grameenphone for the period July 2012 to June 2015. Grameenphone replied to the show cause notice stating, inter alia, a similar claim relating to an earlier period of July 2007 to December 2011 is now pending for adjudication before the Hon’ble High Court Division in an earlier filed VAT appeal. Subsequently, the Commissioner of LTU-VAT issued the final demand for BDT 3,789,537,820. Now GP is in process to file appeal before at the Hon’ble VAT Appellate Tribunal within the
122 Grameenphone Ltd. x Annual Report 2017
Notes to the financial statements
time stipulated by law. So the aggregated demand for the period from July 2007 to December 2011 and July 2012 to June 2015 stands BDT 14,021,868,903.
Subsequently during November 2017, the commissioner of LTU-VAT issued a separate show-cause notice for the similar issue but for the period of January 2012 to June 2012 amounting BDT 823,342,916. As per provision of the VAT Act-1991, LTU-VAT cannot claim any due beyond 5 years, hence the claim is time barred. Grameenphone has replied to the show cause notice accordingly.
(c) VAT rebate on 2G licence renewal feeGrameenphone was under legal obligation to deduct 15% VAT at source from the payments to any licensing authorities including BTRC pursuant to insertion of Rule 18(Uma) in Value Added Tax Rules, 1991 which became effective from 1 July 2010. Since then Grameenphone complied with the same and BTRC accepted such deductions. However, the dispute arose in 2011 at the time of Grameenphone’s 2G License Renewal when BTRC stipulated in License Renewal Guideline to make the payment ‘without any deduction’. In 2011 mobile operators including Grameenphone challenged such stipulation in separate Writ Petitions before the Hon’ble High Court Division wherein the Court allowed Grameenphone to exercise the right to claim rebate of VAT. However, Grameenphone, BTRC and NBR filed separate Civil Petition for Leave to Appeals before the Hon’ble Appellate Division. The Appellate Division granted leave and accordingly Grameenphone filed Civil Appeal.
It should be noted that after amendments in Value Added Tax Rules, 1991, in 2012 at the time of making payment for 2nd installment of 2G Spectrum Assignment Fee, Grameenphone exercised its right to claim rebate of VAT which was subsequently cancelled by the LTU-VAT since BTRC, not being a VAT registered entity, could not provide legally required VAT Challan i.e. Mushak-11. Grameenphone challenged such cancellation by another Writ Petition which is still pending before the Hon’ble High Court Division.
100% of the Licence Renewal Fee has been capitalised based on the assumption that Grameenphone’s VAT exposure will be nil. This assumption is based on the Hon’ble High Court’s verdict which allowed Grameenphone to exercise its right to claim rebate against the VAT paid.
However, the lawsuit over the VAT rebate mechanism is still pending before the Appellate Division. If the Hon’ble Appellate Division rules that Grameenphone would be required to pay VAT and would not be able to exercise the right to claim rebate for this VAT, Grameenphone’s financial exposure on capitalised License Renewal Fee for this would increase by 15% (i.e. BDT 4,876,800,000).
(d) Claim for VAT based on C&AG auditLarge Taxpayers’ Unit (LTU)-VAT on 14 May 2014 issued 8 demand-cum-show cause notices for a total amount of BDT 16,597,269,891 referring to an audit report prepared by Local and Revenue Audit Directorate of Comptroller and Auditor General (C&AG) office of Bangladesh. C&AG office made this audit report for the fiscal year 2010-11 and 2011-12. Grameenphone disagreed to the findings of the audit report referred by LTU-VAT due to lack of jurisdiction of C&AG office to conduct audit on the matters of private entity under the Constitution of Bangladesh. Moreover, improper procedures were followed during the course of the assessment and relevant facts as well as legal provisions were misconstrued in reaching the conclusion. Grameenphone challenged the notices by filing a Writ Petition before Hon’ble High Court Division and the Hon’ble High Court Division, on 15 December 2014, passed the judgment by making the rule absolute in favour of Grameenphone and setting aside the demand notices.
Thereafter, NBR filed a Civil Petition for Leave to Appeal before the Hon’ble Appellate Division and on 5 March 2017 the Hon’ble Appellate Division disposed of the said Civil Petition for Leave to Appeal. Subsequently in connection with the demand-cum-show cause notices dated 14 May 2014 Grameenphone provided information and documentation to the VAT authority which they have reviewed, which we believe should be to their satisfaction.
(e) Interest on SIM Tax during 24 August 2006 to 27 March 2007NBR through a General Order dated 9 June 2005 fixed Tariff Value determining SIM Tax (Supplementary Duty and VAT) on SIM Card at BDT 2,172.20. Challenging the legality of such imposition of SIM Tax one subscriber filed a Writ Petition before the Hon’ble High Court Division and the Hon’ble High Court Division on 25 June 2005 by an interim order stayed the operation of the General Order. Accordingly the mobile operators including Grameenphone could not collect SIM Tax from the customers since the collection of SIM Tax was suspended. Subsequently, on 24 August 2006 Hon’ble High Court Division passed judgment declaring the imposition of SIM Tax on SIM Card as illegal. Upon a Civil Petition filed by the NBR, the judgment of the Hon’ble High Court Division was initially stayed by the Hon’ble Appellate Division on 27 March 2007
Ove
rvie
wAd
dit io
nal I
nfor
mat
ion
Fina
ncia
l Ana
lysi
sG
over
nanc
eSu
stai
nabi
lity
Busi
ness
Per
form
ance
123Grameenphone Ltd. x Annual Report 2017
Notes to the financial statements
and finally on 1 August 2012 the Hon’ble Appellate Division reversed the judgment of Hon’ble High Court Division declaring the imposition of SIM Tax as legal. NBR issued a demand notice after the judgment of the Hon’ble Appellate Division and BDT 3,480,971,703 was paid by Grameenphone on 12 September 2012 on protest.
Thereafter, on 9 May 2016 Large Tax Payers’ Unit (LTU)-VAT issued a show cause notice on Grameenphone for interest amounting BDT 4,525,263,202 for the delay in payment of SIM Tax on sale of SIM during the period August 2006 to March 2007 for a period of 65 months, i.e. the period between 1 April 2007 and the day before the date of the payment made by Grameenphone, i.e. 11 September 2012 during which the matter was pending before the Hon’ble Appellate Division for disposal. Subsequently, NBR issued a demand notice on 22 June 2016 for the same amount which was challenged by Grameenphone through filing an appeal before the Hon’ble Customs, Excise & VAT Appellate Tribunal. Even though Grameenphone believes that the claim against Grameenphone is not likely to be legally enforceable, 10% of the disputed amount had to be deposited at the time of filing such appeal as part of the appeal procedure prescribed by law. Since the claim is not likely to be legally enforceable, any payment related to this claim is likely to be recoverable after the resolution of this issue. We have considered the deposit as a contingent asset under (IAS/BAS) 37 Provisions, Contingent Liabilities and Contingent Assets. The appeal was heard before the Hon’ble Customs, Excise and VAT Appellate Tribunal on 28 March 2017. Now, the Tribunal is expected to pass its judgment.
43 Other disclosures
43.1 Segment informationGrameenphone essentially provides similar products and services to customers across the country and its products and services essentially have similar risk profile. Grameenphone’s business is not organised in product or geographical components and its operating result is reviewed as a whole by its management. Hence, segment information is not relevant.
43.2 Events after the reporting periodThe Board of Directors of Grameenphone Ltd. at its 189th meeting held on 29 January 2018 recommended a final cash dividend amounting to BDT 13,503,000,220 being 100% of the paid-up capital (i.e. BDT 10 per share) for the year 2017. Total cash dividend including this final cash dividend stands at 205% of the paid-up capital (i.e. BDT 20.5 per share) for the year 2017. These dividends are subject to final approval by the shareholders at the forthcoming annual general meeting of the company.
43.3 Accounting standards issued but not yet effectiveThe standards and interpretations that are issued, but not yet effective, up to the date of issuance of the Grameenphone’s financial statements are disclosed below. Grameenphone intends to adopt these standards, if applicable, when they become effective.
(a) IFRS/BFRS 15 Revenue from Contracts with CustomersIFRS/BFRS 15 establishes a five-step model to account for revenue arising from contracts with customers. Under IFRS/BFRS 15, revenue is recognised at an amount that reflects the consideration to which an entity expects to be entitled in exchange for transferring goods or services to a customer.
The new revenue standard will supersede all current revenue related requirements under IFRS/BFRS. Either a full retrospective application or a modified retrospective application is required for annual periods beginning on or after 1 January 2018. Grameenphone will adopt the new standard using the modified retrospective method.
Grameenphone has assessed the estimated impact of the initial application of IFRS/BFRS 15 on its financial statements. As per Grameenphone’s assessment adoption of IFRS/BFRS 15 will not have any significant impact in recognition of revenue. However, customer acquisition cost mainly in the form of SIM cost, different commissions and other directly attributable costs related to acquisition of customers of BDT 4,171,201,397 which was expensed in earlier periods up until 31 December 2017 will now be deferred and recognized as Contract cost. Deferment of these expenses will result in an increased retained earnings balance by BDT 2,678,148,571 on 1 January 2018.
(b) IFRS/BFRS 16 LeasesIFRS/BFRS 16 replaces existing leases guidance, including IAS/BAS 17 Leases, IFRIC/BFRIC 4 Determining whether an Arrangement contains a Lease, SIC-15 Operating Leases – Incentives and SIC-27 Evaluating the Substance of Transactions Involving the Legal Form of a Lease. The standard is effective for annual periods beginning on or after 1 January 2019. Early adoption is permitted for entities that apply IFRS/BFRS 15 at or before the date of initial application of IFRS/BFRS 16.
124 Grameenphone Ltd. x Annual Report 2017
Notes to the financial statements

IFRS/BFRS 16 introduces a single, on-balance sheet lease accounting model for lessees. A lessee recognises a right-of-use asset representing its right to use the underlying asset and a lease liability representing its obligation to make lease payments. There are recognition exemptions for short-term leases and leases of low-value items. Lessor accounting remains similar to the current standard – i.e. lessors continue to classify leases as finance or operating leases.
Grameenphone has identified the areas of potential impact on its financial statements but has not yet completed its detailed assessment. The actual impact of applying IFRS/BFRS 16 on the financial statements in the period of initial application will depend on future economic conditions, including Grameenphone’s borrowing rate at 1 January 2019, the composition of its lease portfolio at that date, its latest assessment of whether it will exercise any lease renewal options and the extent to which it chooses to use practical expedients and recognition exemptions.
So far, the most significant impact identified is that Grameenphone will recognize new assets and liabilities for its operating leases of site sharing contract, BTS sites, GPC/office space, house rent etc.
In addition, the nature of expenses related to those leases will now change as IFRS/BFRS 16 replaces the straight-line operating lease expense with a depreciation charge for right-of-use assets and interest expense on lease liabilities. No significant impact is expected on Grameenphone’s existing finance leases.
As a lessee, Grameenphone can either apply the standard using a retrospective approach or modified retrospective approach with optional practical expedients. The lessee applies the election consistently to all of its leases. Grameenphone plans to apply IFRS/BFRS 16 initially on 1 January 2019, using the modified retrospective approach. Therefore, the cumulative effect of adopting IFRS/BFRS 16 will be recognized as an adjustment to the opening balance of retained earnings at 1 January 2019, with no restatement of comparative information.
When applying the modified retrospective approach to leases previously classified as operating leases under IAS/BAS 17, the lessee can elect, on a lease-by-lease basis, whether to apply a number of practical expedients on transition. Grameenphone is assessing the potential impact of using these practical expedients.
Grameenphone is not required to make any adjustments for leases in which it is a lessor except where it is an intermediate lessor in a sub-lease.
(c) IFRS/BFRS 9 Financial InstrumentsIFRS/BFRS 9 Financial Instruments sets out requirements for recognising and measuring financial assets, financial liabilities and some contracts to buy or sell non-financial items. This standard replaces IAS/BAS 39 Financial Instruments: Recognition and Measurement and is effective from 1 January 2018. Except for hedge accounting, retrospective application is required but providing comparative information is not compulsory.
Grameenphone will adopt the new standard and will not restate comparative information. During 2017, Grameenphone has performed a detailed impact assessment of all the aspects of IFRS/BFRS 9. This assessment is based on currently available information and may be subject to changes arising from further reasonable and supportable information being made available to Grameenphone in 2018. Overall, Grameenphone expects no significant impact on its statement of financial position and equity.
Ove
rvie
wAd
dit io
nal I
nfor
mat
ion
Fina
ncia
l Ana
lysi
sG
over
nanc
eSu
stai
nabi
lity
Busi
ness
Per
form
ance
125Grameenphone Ltd. x Annual Report 2017
Notes to the financial statements

Supplementary informationSeparate statement of profit or loss and other comprehensive income of Grameenphone Ltd. for the year ended 31 December 2017.
2017 2016 BDT'000 BDT'000
Revenue 128,435,814 114,862,160
Operating expenses Cost of material and traffic charges (10,322,076) (10,661,819)
Salaries and personnel cost (8,826,168) (8,276,052)Operation and maintenance (4,011,750) (3,757,496)Sales, marketing and commissions (11,256,660) (12,497,326)Revenue sharing, spectrum charges and licence fees (9,816,951) (8,902,203)Other operating (expenses)/income, net (10,911,229) (8,202,961)Depreciation and amortisation (23,336,591) (20,998,180)
(78,481,425) (73,296,037)
Operating profit 49,954,389 41,566,123
Share of profit/(loss) of associate - -Impairment loss on investment in associate - (36,751)Finance (expense)/income, net (1,467,214) (2,591,068)Foreign exchange (loss)/gain (1,164,885) (86,006) (2,632,099) (2,713,825) Profit before tax 47,322,290 38,852,298
Income tax expense (19,899,642) (15,753,134)Profit after tax 27,422,648 23,099,164
Other comprehensive incomeItem that will not be reclassified subsequently to profit or loss
Remeasurement of defined benefit plan 762,284 35Income taxes (304,914) (14) 457,370 21
Total comprehensive income for the year 27,880,018 23,099,185
Earnings per share Basic and diluted earnings per share (par value BDT 10 each in BDT) 20.31 17.11
126 Grameenphone Ltd. x Annual Report 2017
Notes to the financial statements