AUDITOR-GENERAL SPECIAL REPORT No. 100 … · 2011 No. 18 . 2011 . PARLIAMENT OF TASMANIA ....
157
2011 No. 18 2011 PARLIAMENT OF TASMANIA AUDITOR-GENERAL SPECIAL REPORT No. 100 Financial and economic performance of Forestry Tasmania July 2011 Presented to both Houses of Parliament in accordance with the provisions of Audit Act 2008
Transcript of AUDITOR-GENERAL SPECIAL REPORT No. 100 … · 2011 No. 18 . 2011 . PARLIAMENT OF TASMANIA ....
2011 No. 18
2011
PARLIAMENT OF TASMANIA
AUDITOR-GENERAL SPECIAL REPORT No. 100
Financial and economic performance of Forestry Tasmania
July 2011
Presented to both Houses of Parliament in accordance with the provisions of Audit Act 2008
© Crown in Right of the State of Tasmania July 2011
Auditor-General’s reports are available from the Tasmanian Audit Office, Hobart, although in limited supply. This report, and other Special Reports, can be accessed via our home page (http://www.audit.tas.gov.au).
For further information please contact:
Tasmanian Audit Office
GPO Box 851
Hobart
TASMANIA 7001
Phone: (03) 6226 0100, Fax (03) 6226 0199
Email: [email protected]
This report is printed on recycled paper.
ISBN 978-0-9808688-7-6
5 July 2011
President
Legislative Council
HOBART
Speaker
House of Assembly
HOBART
Dear Madam President
Dear Mr Speaker
SPECIAL REPORT NO. 100
Financial and economic performance of Forestry Tasmania
This report has been prepared consequent to examinations conducted under section 23 of the Audit Act 2008. The objectives of the audit were to assess Forestry Tasmania’s financial performance, economic contributions to our State and elements of its compliance responsibilities.
Yours sincerely
H M Blake
AUDITOR-GENERAL
Contents
Foreword ............................................................................................................... i
List of acronyms and abbreviations .................................................................. ii
Executive summary ............................................................................................. 2
Background .................................................................................................................. 2
Overall Audit conclusion ............................................................................................. 2
Detailed audit conclusions ........................................................................................... 5
List of recommendations ............................................................................................. 9
Audit Act 2008 section 30 — Submissions and comments received ............. 13
Introduction ....................................................................................................... 17
1 Legislative context ................................................................................ 23
1.1 Background .................................................................................................... 23
1.2 Legislative requirements ................................................................................ 23
1.3 Governance ..................................................................................................... 24
1.4 Key assumption made by Forestry ................................................................. 27
1.5 Discussion ...................................................................................................... 27
1.6 Financial reporting obligations ....................................................................... 30
1.7 Sustainable commercial rate of return ............................................................ 31
1.8 Conclusions .................................................................................................... 32
2 Financial context ................................................................................... 35
2.1 Background .................................................................................................... 35
2.2 How Forestry was initially capitalised? ......................................................... 35
2.3 Other sources of equity, or similar, funding since 1994 ................................ 40
2.4 Impacts on recurrent revenues and costs ........................................................ 45
2.5 How, and when, is financial performance assessed in a long-term business? ........................................................................................................ 45
2.6 How does Forestry deal with these equity related matters in its annual corporate plans? ............................................................................................. 50
2.7 How has Forestry’s financial environment evolved? ..................................... 51
2.8 Conclusions .................................................................................................... 53
3 Measuring the State’s investment in Forestry ................................... 56
3.1 Background .................................................................................................... 56
3.2 CCNCO’s competitive neutrality in forestry ................................................. 57
3.3 Setting rate of return targets ........................................................................... 58
3.4 Industry comparison ....................................................................................... 58
3.5 Productivity Commission ............................................................................... 59
3.6 Comparisons based on audit financial statements .......................................... 60
3.7 Risk free rate of return ................................................................................... 61
3.8 Discussions with Forestry management ......................................................... 61
3.9 Rate of return applied by Forestry .................................................................. 63
3.10 Alternative use and/or governance models .................................................... 63
3.11 Forestry’s tourism ventures ............................................................................ 64
3.12 Sixteen-year rate of return .............................................................................. 65
3.13 Conclusions .................................................................................................... 66
4 Financial performance ......................................................................... 68
4.1 Background .................................................................................................... 68
4.2 Accounting for superannuation related expenses and cost of trees sold ........ 68
4.3 Profitability ..................................................................................................... 70
4.4 Cash flows ...................................................................................................... 77
4.5 Long-term nature of Forestry’s business ........................................................ 81
4.6 Conclusions .................................................................................................... 82
5 Community service obligations ........................................................... 85
5.1 Background .................................................................................................... 85
5.2 Forestry’s legislative responsibilities regarding CSOs .................................. 85
5.3 Forestry’s statutory as against contractual obligations .................................. 88
5.4 Have CSOs ever been funded? ....................................................................... 89
5.5 Costs incurred by Forestry ............................................................................. 93
5.6 300 000 cubic metres of saw logs .................................................................. 95
5.7 Conclusions .................................................................................................... 97
6 Balance sheet management .................................................................. 99
6.1 Background .................................................................................................... 99
6.2 Significant events impacting Forestry’s balance sheet .................................. 99
6.3 Summarised balance sheets .......................................................................... 101
6.4 Debt (also referred to as borrowings) ........................................................... 103
6.5 Working capital management ....................................................................... 106
6.6 Fixed assets other than biological assets ...................................................... 107
6.7 TCFA funds received in advance ................................................................. 108
6.8 Taxation ........................................................................................................ 108
6.9 Contributed Equity ....................................................................................... 108
6.10 Conclusions .................................................................................................. 109
7 Economic performance ...................................................................... 113
7.1 Background .................................................................................................. 113
7.2 Equilibrium modelling ................................................................................. 113
7.3 Modelling by Monash University ................................................................ 114
7.4 Findings ........................................................................................................ 114
7.5 Conclusions .................................................................................................. 116
8 Compliance .......................................................................................... 119
8.1 Background .................................................................................................. 119
8.2 Board/CEO obligations ................................................................................ 119
8.3 Corporate plan .............................................................................................. 120
8.4 Taxation and accounting records .................................................................. 121
8.5 Financial statements ..................................................................................... 122
8.6 Annual report and Statement of Compliance ............................................... 124
8.7 Dividend policy ............................................................................................ 124
8.8 Investments ................................................................................................... 125
8.9 Forest lands, management plans and fire safety ........................................... 126
8.10 Conclusions .................................................................................................. 128
Independent auditor’s conclusion ................................................................. 131
Recent reports ................................................................................................. 135
Current projects .............................................................................................. 137
Appendix 1 — About this Report .................................................................. 139
Background .............................................................................................................. 139
April 2009 draft report ............................................................................................. 139
Action taken following discussion of the April 2009 draft report ........................... 140
January 2010 draft report ......................................................................................... 140
Action taken following discussion of the January 2010 draft report ....................... 143
Valuer’s valuation and resulting financial reporting impact ................................... 143
Updated economic analysis ..................................................................................... 145
Compliance .............................................................................................................. 145
Way forward for this Report .................................................................................... 145
List of Figures Figure 1: Forestry’s biological and forest estate assets and obligations excluding land ...... 146
List of Tables Table 1: Receipts and payments - three years to 30 June 1997 (four years to 30 June 1998 shown for comparison) .................................................................................................. 39
Table 2: Non-equity funding agreements ............................................................................... 41
Table 3: Areas transferred into reserves ................................................................................. 42
Table 4: TCFA funds received and acquitted ($’000) ............................................................ 44
Table 5: Forestry’s ‘operating’ profits before tax and operating cash flows for the 16 years ended 30 June 2010 ....................................................................................................... 48
Table 6: Forestry’s sources and applications of funds – 1994–2010 ...................................... 51
Table 7: Factors impacting Forestry’s rate of return .............................................................. 62
Table 8: Financial results of Forestry’s commercial tourism ventures for the nine years ended 30 June 2010 ($’000) .......................................................................................... 65
Table 9: Sixteen-year average rates of return ......................................................................... 65
Table 10: Profitability from 1 July 1994 to 30 June 2010 ($’000) ......................................... 71
Table 11: Possible adjusted operating profit — 12 years to June 2010 .................................. 77
Table 12: Summary of cash flows ($’000) ............................................................................. 78
Table 13: CCSP funding ......................................................................................................... 90
Table 14: CSO costs incurred by Forestry 2006–07 to 2008–09 ($’000) (un-audited)* ........ 94
Table 15: Balance sheets at 1994, 1995 and 2010 ($’000)* ................................................. 101
Table 16: Movements in net defined benefit superannuation liabilities ($‘000) .................. 105
Table 17: Total debt ($’000) and relevant ratios .................................................................. 106
Table 17: Liquidity ratios ...................................................................................................... 107
Table 19: Movements in Forestry’s contributed equity ........................................................ 109
Table 20: Component parts of integrated forest valuation .................................................... 144
i
Foreword This project proved more difficult than initially anticipated. Changes experienced by Forestry Tasmania over the period 1994 to 2010 were significant, not only to its operations but due also to changing accounting standards, and the interpretation thereof, and other requirements. Attempts to benchmark performance with like businesses proved problematic because of differing structures and resources managed.
This Report is longer than I would normally wish to provide to the Parliament and in some places information is duplicated and more detailed than usual. This was done because I considered some contextual information was needed, such as Forestry Tasmanian’ legislative responsibilities.
Because of the frequent changes to reported values attributed to Forestry Tasmania’s assets and due to differing interpretations as to its ‘operational’ performance, emphasis is given to its cash operating results, which in recent times has been poor. While my overall conclusion was that Forestry Tasmania’s financial performance over the past 16 years was poor, this may not have been the case had there been clarity around its community service type obligations and the funding thereof, and if the compensation provided under various State and Commonwealth agreements had addressed loss of profits and a longer term view.
I concluded in the executive summary that the forestry business is cyclical in nature and exposed to changes in trading conditions and to the strength of local and world economies. Also clear from this Report is that Forestry Tasmania’s financial performance in recent years was difficult. I make no comments as to if or when this will change.
When I commenced this project I anticipated making recommendations about structural reform. In the end I avoided this for two reasons:
Comparative structures were difficult to analyse.
This is a matter for government policy.
I trust this Report will inform such structural analysis.
H M Blake
Auditor-General
5 July 2011
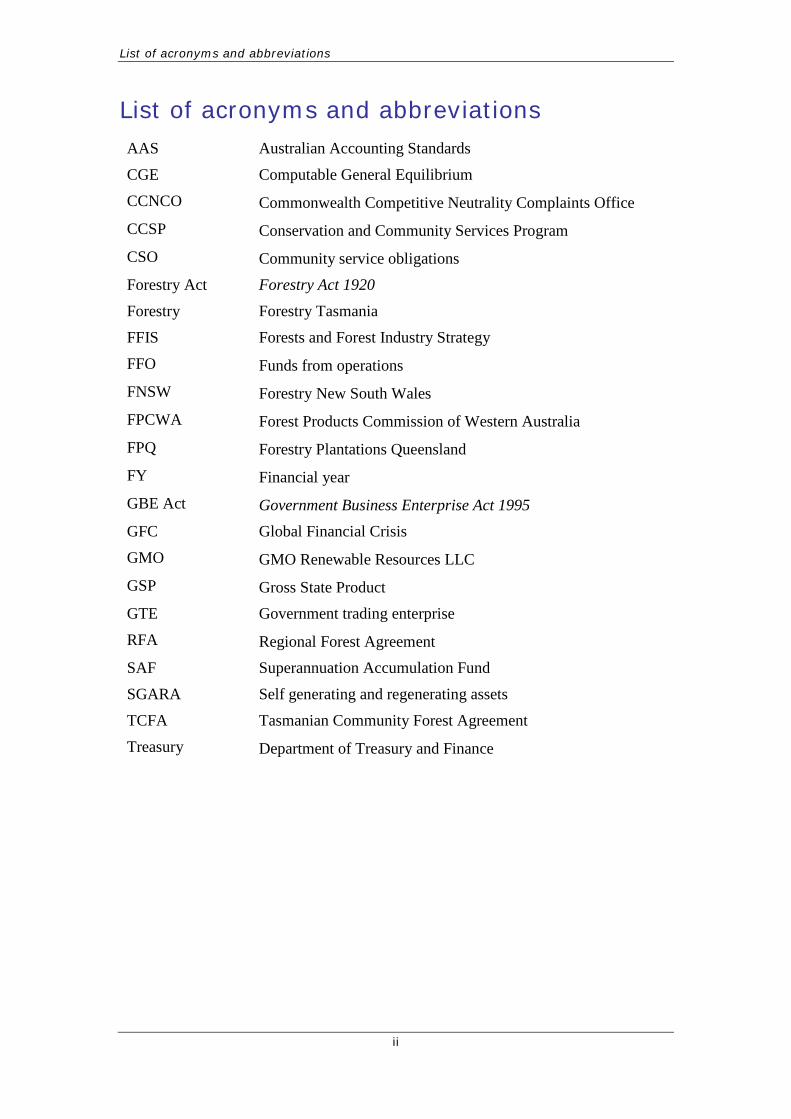
List of acronyms and abbreviations
ii
List of acronyms and abbreviations AAS Australian Accounting Standards
CGE Computable General Equilibrium
CCNCO Commonwealth Competitive Neutrality Complaints Office CCSP Conservation and Community Services Program CSO Community service obligations Forestry Act Forestry Act 1920
Forestry Forestry Tasmania
FFIS Forests and Forest Industry Strategy
FFO Funds from operations FNSW Forestry New South Wales FPCWA Forest Products Commission of Western Australia FPQ Forestry Plantations Queensland FY Financial year GBE Act Government Business Enterprise Act 1995 GFC Global Financial Crisis
GMO GMO Renewable Resources LLC GSP Gross State Product GTE Government trading enterprise
RFA Regional Forest Agreement SAF Superannuation Accumulation Fund
SGARA Self generating and regenerating assets
TCFA Tasmanian Community Forest Agreement
Treasury Department of Treasury and Finance
1
Forestry Tasmania
Executive summary
Executive summary
2
Forestry Tasmania
Executive summary
Background
Forestry Tasmania (Forestry) was established under the Forestry Amendment (Forestry Corporation) Act 1994, which amended the Forestry Act 1920 (Forestry Act). It is responsible for the management of approximately 1.5 million hectares of State forest and plantations, a role that includes managing forests for multiple uses and delivering both economic and social benefits to the Tasmanian public.
Forestry’s key objectives include maintenance of profitable operating performance and provision of returns to its owners. Its objectives also include non-commercial obligations to maintain the non-wood values of State forests.
During the period July 1994 to June 2010 the nature of Forestry’s business changed significantly as did the market in which it operates. Our project was to identify and summarise Forestry’s activities over that period, to assess its economic performance over the period 2006-08 and to assess elements of its compliance responsibilities in 2008.
No account has been taken in this audit of the potential impacts on Forestry of agreements that may have been entered into in recent times by representatives of the forestry sector and conservationists.
Overall audit conclusion
The forestry business is cyclical in nature and exposed to changes in trading conditions and to the strength of local and world economies. The nature of Forestry’s business changed significantly over the 16 years to 30 June 2010. Some of the changes included:
early financial results (1994 to 1998) positive with profits generated and dividend and tax payments supported by positive cash flows
lower profitability and operating cash flows arising from the increasing defined benefit fund obligations, in particular after 1998
losses in productive native forest
increasing responsibility for managing forest reserves
sale of plantation assets replaced by joint venture involvement
Executive summary
3
Forestry Tasmania
greater involvement in plantation development in particular following agreements with the State and Commonwealth governments of which the full long-term impact on Forestry’s business is still unclear
losses in community service obligation-type (CSO) funding
introduction of the need to pay rates
evolving social and environmental pressures
evolving local and international trading conditions generally leading to declining demand for Forestry’s products
development of tourism activities
decisions to reduce staffing levels although only in the most recent few years
initially strong operating profits and cash flows but which declined significantly in recent years.
Matters of particular impact were decisions to remove the provision to it of CSO-type funding, sell its plantation assets requiring it to return $40.000m to the State and entering into the Regional Forest Agreement (RFA) and the Tasmanian Community Forest Agreement (TCFA). To an extent these changes were initiated by State and Commonwealth governments in response to community and other concerns. Some of these decisions had cumulative impacts.
Forestry’s financial situation is particularly difficult it being faced with declining revenues, relatively high fixed costs including CSO-type costs, declining productive forests, particularly since 2000, but increasing obligations for non-productive forests, declining operating cash flows, long periods prior to investments in plantation development providing returns, declining local and world markets, increasing Australian dollar, increasing defined benefit superannuation obligations and uncertainty regarding its CSO obligations.
As a result, and when read alongside the findings outlined here and elsewhere in this Report, we formed the view that expectations of Forestry, and the environment in which it operates, changed fundamentally over the period July 1994 to June 2010 but that its business and funding model did not keep pace with these changes. This conclusion is supported by the fact that the most recent Ministerial Charter was issued in 1999.
Forestry is endeavouring to deal with these matters but may not be able to do so without financial assistance from the State
Executive summary
4
Forestry Tasmania
Government. For example, based on current levels of cash flow, Forestry will find it difficult to fund its defined benefit superannuation obligations.
Executive summary
5
Forestry Tasmania
Detailed audit conclusions
Legislative context
There is potential tension between Forestry’s legislative requirements in particular those relating to the need to manage the forests sustainably and to provide a sustainable commercial rate of return. However, the term sustainable commercial rate of return has still to be defined.
Forestry’s approved Corporate Plan anticipates that it will generate low rates of return with the Plan not outlining how or why they were set. These rates of return are impacted by expenditure on CSO-type obligations and decisions regarding forest rotations.
Forestry complies with its financial reporting obligations but it could be more transparent if it included in its annual reports financial details of its tourism activities and other segments of its activities.
Financial context
The business taken over by Forestry in 1994–95 was sound including the initial level of contributed equity. However, we found no evidence of any assessment at that time as to whether the business could sustain the financial impacts of factors known then or that followed.
In the first three years of its activities, that is, to 30 June 1997, Forestry generated sufficient cash from its operations, and from CSOs, to enable it to invest in plantation development and other capital assets. In this period Forestry averaged income tax and dividend payments of $10.197m per annum, annual average investments in non-current assets of $18.133m and it invested $5.895m in a superannuation investment account.
These returns to government and asset investments continued in 1997-98 such that by 30 June 1998 Forestry’s cash reserves had remained unchanged.
Ignoring inflationary impacts, Forestry earned annual average operating profits and positive operating cash flows of $12.560m and $18.000m respectively over the past 16 years. During this period it paid taxes of $23.570m and dividends to the State of $75.545m. This represented total returns to the State of $99.115m or an average of $6.194m per annum.
Forestry’s profit and cash flow results fluctuated significantly over the past 16 years. Operating profits varied from a high of $24.071m in 2004 to a loss of $(7.997m) in 2010 with net operating cash
Executive summary
6
Forestry Tasmania
fluctuating from a high of $29.775m in 2004 to a deficit $(12.117m) in 2010.
If Forestry wishes to continue with its current level of investment in plantation development sources of government or other funding of approximately $200m to $250m will be needed. The alternative is a significant reduction in Forestry’s infrastructure investment programs in future.
How to measure the State’s investment in Forestry
The nature of the forestry business makes annual assessments of financial performance difficult and applying conventional rates of return such as the government bond rate may lack relevance. There is, therefore, a need for Forestry to develop a rate of return philosophy acceptable to its owners and the community. However, rates of return achieved by Forestry may have been very different had CSOs been funded.
Assessing the financial performance of a forestry type business over the conventional 12 months cycle is problematic. Annual financial accountability remains essential but accountability for performance over a longer planning cycle needs to be developed and agreed with Forestry’s owners and the community.
Alternative models and structures for managing Tasmania’s forest reserves are available but need to be assessed with care.
Financial performance
Forestry’s average annual operating profits fluctuated over the 16-year review period. The 16-year average was $12.560m with a high of $18.887m in the four years to 30 June 1998 and a low of $6.275m in the three years to 30 June 2010.
The decline in average operating profitability was caused by various factors including withdrawal of CSO-type funding, the imposition of local government rating on government businesses from 2003–04, the sale of its softwood plantations, increases in net interest costs particularly since 2001–02, decline in sales particularly since 2003–04, not matched by decreasing costs, mainly caused first by the economic crisis in Asia and then the Global Financial Crisis (GFC).
The financial impact of increasing forests in reserves as a result of the RFA has not been quantified although is understood not to be significant in the short term other than perhaps on fixed costs.
Forestry’s average annual operating cash flows fluctuated over the 16-year review period. The 16-year average was $18.000m with a
Executive summary
7
Forestry Tasmania
high of $22.716m in the four years to 30 June 1998 and a low of $4.522m in the three years to 30 June 2010.
Forestry invested more than $450.000m in assets and plantation development over the period funded from a mix of cash generated from operations ($287.608m), Helsham, RFA and TCFA funding ($223.465m) and net asset sales ($49.785m). It paid taxes of $23.570m and dividends (including the $40m return of equity) of $115.545m.
Returns from investment of RFA and TCFA funds have still to be realised.
By 30 June 2010 Forestry was increasingly reliant on TCFA monies to manage its cash flows. This source of funding has now ceased and at 30 June 2010 Forestry still had to acquit $22.014m of TCFA funding received. Action is required by Forestry management to address what was at 30 June 2010 a difficult cash flow situation. It is, however, noted that had Forestry not entered into the TCFA, its level of investment in plantations would have been less.
Forestry’s financial performance:
resulted in an operating profit for the 16 years of $200.962m and operating cash flows of $270.319m from which it paid taxes and dividends of $99.115m
did not meet conventional benchmarks such as the government bond rate
varied significantly over time with the final three years to 30 June 2010 being poor.
It is essential that Forestry make an assessment of the long-term impacts on its profitability of the RFA and TCFA.
However, had Forestry accounted for superannuation expenses referred to in Section 4.2.1, and the forest valuation adjustments referred to in Section 4.2.2, as operating costs, Forestry’s operating profit for the 16-year period would have been $79.162m instead of $200.962m.
Community service obligations
Our interpretation is that the Parliament, by including the functions and powers outlined in section 10(1) of the Forestry Act, intended that Forestry should carry out the activities outlined in that Section. Therefore, the exercise of these functions by Forestry is not discretionary and Forestry should seek legal advice to clarify its position as to its responsibilities and whether or not costs it incurs in providing these functions are CSOs.
Executive summary
8
Forestry Tasmania
Forestry received no CSO specific funding over the 16-year period of this audit. However, it must have incurred expenditure annually to satisfy its responsibilities under section 10(1) with these costs likely to have increased as additional forests were added to reserves. Funding of these costs as CSOs might have resulted in Forestry’s profitability, returns on assets and operating cash flows being very different to that actually achieved.
Forestry needs to be able to demonstrate that it satisfies the requirements of the Forestry Act as these relate to its section 10(1) responsibilities and that it does so efficiently and effectively.
Balance sheet management
Over the 16 years of this review, Forestry’s net assets declined considerably primarily due to:
deteriorating cash flow position
changes in accounting standards leading to lower recorded assets values
changes in the approach to valuing its biological assets also leading to lower recorded assets values
increases in the actuarially assessed amounts attributed to unfunded defined benefit superannuation obligations
increasing debt
withdrawal of equity
introduction of liabilities to record unearned advanced TCFA funding
introduction of liabilities recording obligations for non-commercial forest zones.
It is likely that Forestry’s unfunded defined benefit superannuation obligations will continue to grow for at least another 5.5 years and it will require cash to fund retirements and pensions.
Forestry’s debt and net superannuation obligations increased significantly over the past 16 years while at the same time its profitability declined. This was highlighted by its inability in recent years to achieve targeted ratios as these related to funds from operations to total debt and funds from operations to interest coverage.
Executive summary
9
Forestry Tasmania
Economic performance
Economic modelling for the period 2005-06 to 2007-08 indicates an average net contribution by Forestry to the Tasmanian economy of $111 million per year.
Overall, this is a positive outcome for Tasmania relative to what would have occurred if Forestry had not operated during the period.
Forestry’s non-wood related activities also result in unquantified, beneficial impacts.
Compliance
Forestry complied with the majority of legislative and regulatory provisions required by the Government Business Enterprise Act 1995 (GBE Act) and the Forestry Act. We noted compliance of 204 out of 207 criteria. The three exceptions, where total compliance was not achieved, were:
The Statement of Compliance, which is required to be signed by two Board members, was only signed by the Managing Director in 2007–08.
There was no agreed dividend policy with Treasury in 2006–07.
A Guarantee Fee Return was not submitted for 2005–06.
Our view is that these are minor exceptions. Forestry exhibited a very high level of compliance across all assessed areas.
List of recommendations
The following Table reproduces the recommendations contained in the body of this Report.
Rec Section We recommend that …
1 1.3.1 … the responsible Ministers issue an updated Ministerial Charter.
2 1.3.4 …Forestry’s future Corporate Plans include discussion and argument, including assumptions made on industry and other conditions, regarding:
the relevance of the performance targets set
the extent to which these do, or do not, and if so why not, achieve commercial performance levels
comparison with relevant external benchmarks.
3 1.3.4 … future Corporate Plans demonstrate how Forestry will satisfy the financial and economic responsibilities outlined in the GBE
Executive summary
10
Forestry Tasmania
Act and in the Forestry Act.
4 1.5.3 … Forestry separately report in its annual financial statements the financial performance of its tourism activities
5 1.6.1 … despite the exemption provided in Australian Accounting Standard AASB 8 Operating Segments, Forestry complies with this accounting standard.
6 1.7 … Forestry’s responsible Ministers define what they mean by:
‘sustainable commercial rate of return that maximises value for the State having regard to the economic and social objectives of the State’.
7 2.2.2 … any decision to establish a State-owned company or government business enterprise include an assessment of the capital structure needed to establish and maintain that entity
… Forestry Board, as a matter of urgency, carry out an assessment of the most appropriate capital structure for its business and of the working capital requirements associated therewith.
8 2.3.1.2 … Forestry should:
quantify whether or not the funding it received under the RFA and TCFA represented sufficient compensation to enable it to operate profitably and to generate positive operating cash flows
develop, in association with its stakeholder owners, the impact on its business model of these changes.
9 4.4.4 … the Forestry Board take action to improve a deteriorating cash flow position.
10 5.4.2 … Forestry obtain legal advice from the Solicitor-General regarding discretionary or non-discretionary obligations imposed by section 10(1) of the Forestry Act and any resulting impact on section 10(2)*
… the Minister’s and Treasurer’s letter of stakeholder expectation explicitly deal with their expectations regarding the provision by Forestry of CSO and CSO-type functions
… Forestry’s annual Corporate plan explicitly detail how it will satisfy the functions and powers required under section 10
… Forestry demonstrates that it satisfies its obligations under section 10(1) and that it does so efficiently and effectively.
Executive summary
11
Forestry Tasmania
11 5.5 … Forestry:
annually quantifies, has audited and reports the implications on its profitability of all of the various legislative requirements imposed upon it
identifies those CSOs it believes satisfy the requirement for funding under Part 9 of the GBE Act and seeks a determination for them to be funded*
if such a determination fails, evaluate the need, in both the short and long-term, to continue its current CSO program.
* We note that in recent weeks Forestry has made a formal application for CSO funding.
In our view, Recommendations 1, 2, 5, 6 and the first part of 7, have applicability to all Government Businesses in that
Steps are needed to ensure all Ministerial Charters are current.
All Corporate plans should outline assumptions made, performance targets set and how these were determined, achieve commercial levels of performance and include relevant benchmarking.
Segment information should be reported in line with Australian Accounting Standard AASB 8 Operating Segments.
Stakeholder Ministers should, for each Government Business, define their interpretation or expectation as to ‘sustainable commercial rate of return that maximises value for the State having regard to the economic and social objectives of the State.
Any decision to establish a State-owned company or government business enterprise should include an assessment of the capital structure needed to establish and maintain that entity.
Submission and comments received
12
Forestry Tasmania
Audit Act 2008 Section 30 — Submissions and comments received
Submission and comments received
13
Forestry Tasmania
Audit Act 2008 section 30 — Submissions and comments received
Introduction
In accordance with section 30(2) of the Audit Act 2008, a copy of this Report was provided to Forestry Tasmania and the Department of Treasury and Finance. A summary of findings was also provided to the Treasurer and the Minister for Energy and Resources with a request for comment or submissions.
The comments and submissions provided are not subject to the audit nor the evidentiary standards required in reaching an audit conclusion. Responsibility for the accuracy, fairness and balance of those comments rests solely with those who provided a response or comment.
Submissions and comments received
Treasurer I refer to your letter of 7 June 2011 inviting feedback on your draft report to Parliament regarding the financial and economic performance of Forestry Tasmania.
I note the summary of findings attached to your letter and your intention to table the report in Parliament on 5 July 2011. Your report will be an important input to the strategic review of Forestry Tasmania, which will commence shortly.
I also note that the Department of Treasury and Finance provided comments on your report on 1 June 2011 and would like to indicate that I support the statements made by the Department and have no further comments to make.
Thank you for the opportunity to provide feedback.
Minister for Energy and Resources Thank you for the opportunity to comment on your summary of findings in relation to your report to the Parliament of Tasmania on the financial and economic performance of Forestry Tasmania.
The publication of your findings is timely and will provide a valuable input into the comprehensive strategic review of Forestry Tasmania recently announced by the State Government, including its business model and governance.
As you would be aware, the environment in which Forestry Tasmania operates has been characterised by an increasing degree of
Submission and comments received
14
Forestry Tasmania
uncertainty in recent times, placing a great deal of operational and management stress on the business.
As the Portfolio Minister responsible for Forestry Tasmania, I believe the resolution of conflicting community and commercial considerations impacting on the Tasmanian forestry sector generally at present will be an important determinant of both the functional role and financial performance of Forestry Tasmania as a commercial entity in the future.
Forestry Tasmania I refer to your letter of May 20 regarding the draft Report to Parliament on the Financial and economic performance of Forestry Tasmania (FT).
FT believes the review has been thorough and professional, and generally supports the findings and recommendations.
While we support the intent of Recommendation 5, we note the acknowledgment made that such disclosure, depending on its implementation, may lead to competitive disadvantage in comparison to our competitors. We would seek to further consider these implications, and the identification of appropriate segments, before moving to implement this recommendation. We agree with the position that in any event, this level of information should be available to shareholder Ministers.
Chapter 7 of the report outlines findings in relation to economic contribution of FT to the Tasmanian economy. The impact on GSP as reported from the Equilibrium modelling provides only a limited understanding of the contribution of State forests wood supply, as distinct from FT. This has been correctly outlined in Section 7.4.3, but perhaps not articulated sufficiently clearly. The modelled results allow only for FT’s direct activities, and assume that the activities of downstream harvest, haulage, sawmilling, wood chipping and pulp production, would continue essentially unchanged. However, given the significance of State forest supply, and the limited opportunity to import log supplies from outside the State, should that supply be no longer available to the market, these downstream activities would be lost to the Tasmanian economy. By FT’s reckoning, that would suggest an overall contribution, dependent on supply from State forest, of $563 million in 2009–10.
Thank you for the opportunity to comment.
Department of Treasury and Finance Thank you for the opportunity to comment on the Report to Parliament on the financial and economic performance of Forestry Tasmania. Your overall conclusion that the nature of Forestry
Submission and comments received
15
Forestry Tasmania
Tasmania’s business has changed significantly since its corporatisation is supported by Treasury.
As you would be aware the Government has announced an independent Strategic Review of Forestry Tasmania to examine the future structures, governance and business models under which Forestry Tasmania may operate in the new Tasmanian forest industry. Your Report will provide a valuable input into this review and the review will directly consider some of your recommendations in relation to Forestry Tasmania, specifically in relation to the capital structure of Forestry Tasmania, the benefits and costs of Forestry Tasmania managing the forests for multiple uses and the implications of the legislated guaranteed supply level.
As you have noted Forestry Tasmania has made a request for community service obligation funding for some of the activities it has identified as non commercial. This request will be considered in the context of the Strategic Review.
In relation to your recommendations that have applicability to all Government businesses, Treasury has commenced work on the implementation of the seven principles for reform of the operation of Government businesses and the Report’s recommendations will be considered throughout implementation of these reforms.
Treasury agrees that Ministers should set clear objectives for Government businesses and work has commenced on updating the Ministerial Charters and Statements of Expectations for Government businesses. As part of this process, other key governance documents, including the current Treasurers’ Instruction on segment reporting, will be reviewed.
In addition, it is proposed that an annual performance agreement between the Board and the Shareholding Ministers is to be agreed during the Corporate Plan process. This will set key performance measures to ensure that Government Businesses provide an appropriate return and can be more transparently held accountable for performance.
Submission and comments received
16
Forestry Tasmania
Introduction
Introduction
17
Forestry Tasmania
Introduction
Forestry Tasmania
Forestry Tasmania (Forestry) was established under the Forestry Amendment (Forestry Corporation) Act 1994, which amended the Forestry Act 1920 (Forestry Act). Forestry is responsible for the management of approximately 1.5 million hectares of State forest and plantations, a role that includes managing forests for multiple uses and delivering both economic and social benefits to the Tasmanian public.
Forestry’s key objectives include maintenance of profitable operating performance and provision of returns to its owners. Its objectives also include non-commercial obligations to maintain the non-wood values of State forests.
Forestry’s major traded product is logs, harvested from both native forest and plantations. Logs exist in three categories:
sawlogs — for conversion into sawn-timber, plywood, or veneer products that are mainly used in the construction and furniture industries
pulp logs — for conversion into woodchips, fibreboard, particleboard or pulp (for subsequent conversion into paper and paperboard products)
peeler logs — for use in the rotary veneer mill.
Forestry also derives revenue from a joint venture with GMO Renewable Resources LLC (GMO), to manage and commercially operate softwood plantations, and from the provision of forest management consulting services.
In addition, Forestry incurs costs associated with its non-commercial (community service) obligations to maintain the non-wood values of State forests and it operates a range of tourism ventures.
Profitability
As with any business, Forestry’s financial performance depends on:
internal factors such as:
─ strategic decision-making
─ efficiency of its operations
─ minimisation of costs
─ quantity and mix of products
Introduction
18
Forestry Tasmania
─ levels of investment in research and community activities
external factors such as:
─ demand for timber
─ timber prices
─ environmental conditions
─ changes in currency exchange rates
─ changes to accounting standards
─ satisfying multiple legislative responsibilities
─ tourism demand.
Economic performance
The Forestry Act requires Forestry to optimise the economic returns from its wood production activities and the benefits to the public of the non-wood values of forests.
Compliance expectations
The Forestry Act and the Government Business Enterprises Act 1995 (GBE Act) require compliance by Forestry with a number of governance related matters.
Audit objectives
This audit included both performance audit and compliance aspects. The objectives were to assess:
Financial performance:
─ the reasonableness of Forestry’s profitability, focussing on cash flows, and associated returns to the State government over time
Economic contribution:
─ the reasonableness of Forestry’s economic contribution to Tasmania
Compliance:
─ The extent to which Forestry was meeting its statutory, corporate and owner obligations.
Audit scope
The scope of the audit was:
Introduction
19
Forestry Tasmania
all operations of Forestry including wood and non-wood activities
financial performance from 1994–95 to 2009–10
economic performance from 2005–06 to 2007–08
compliance with statutory requirements in one financial period.
Audit criteria
Performance — Financial
Is Forestry’s financial performance reasonable compared against recognised business benchmarks?
Has Forestry’s financial performance improved or deteriorated over time?
Performance — Economic
Is Forestry’s economic contribution to Tasmania reasonable given the resources under its control?
Compliance
Does Forestry meet its statutory, corporate and owner obligations in respect of:
Board and Chief Executive Officer obligations
corporate planning
taxation and accounting records
financial statements
annual report
dividend policy
investments
forest lands, management plans and fire protection?
Audit methodology
We used the following methods during the course of the audit to gather evidence:
review of background materials on the operations of Forestry
review of applicable legislation
Introduction
20
Forestry Tasmania
discussions with relevant staff from Forestry
analysis of financial data
review of documentation related to compliance with legislation
equilibrium modelling using the Multi-regional Forecasting Model Computable General Equilibrium model, operated by the Centre of Policy Studies at Monash University (Monash).
Evidence gathering and analysis was assisted by a private contractor, namely Deloitte Touche Tohmatsu. The findings and conclusions are my own.
Timing
Planning for this performance audit began in April 2008. March 2011 saw the end of fieldwork and the report was finalised in April 2011. The time elapsed for this project was lengthy during which period a number of reports were prepared and discussed with Forestry. Details, including preliminary conclusions, are outlined in Appendix 1.
Resources
The total cost of the audit, including use of contractors but excluding production costs was $225 500.
Introduction
21
Forestry Tasmania
Chapter 1 – Legislative context
This page left blank intentionally
1 Legislative context
Chapter 1 — Legislative context
23
Forestry Tasmania
1 Legislative context
1.1 Background
This Chapter is included to enable readers of this Report to gain some context regarding Forestry’s legislative requirements, key assumptions, corporate plans and operating environment. These factors impact Forestry’s financial and economic performance and therefore any assessment of this performance.
1.2 Legislative requirements
As it relates to Forestry’s financial and economic performance, applicable legislation is noted below.
1.2.1 Government Business Enterprises Act 1995 (GBE Act)
The GBE Act sets the principle objectives for all Government Business Enterprises, including Forestry, including the need for them to (our emphasis by underlining):
operate in accordance with sound commercial practice and as efficiently as possible
achieve a sustainable commercial rate of return that maximises value for the State in accordance with corporate plans having regard to the economic and social objectives of the State
perform on behalf of the State their community service obligations in an efficient and effective manner.
1.2.2 Forestry Act 1920 (the Forestry Act)
Elements of this Act are also relevant to an assessment of Forestry’s financial and economic performance requiring it to (our emphasis by underlining):
optimise –
the economic returns from its wood production activities
the benefits to the public and the State of the non-wood values of forests
perform its functions in a manner that is consistent with those practices that would best achieve sustainable forest management
promote and encourage the use of State forests for purposes other than wood production
Chapter 1 — Legislative context
24
Forestry Tasmania
provide to the public information and educational programmes on sustainable forest management
maintain the Register of Multiple Use Forest Land
manage forest reserves
provide and maintain forest roads and other facilities for public access to and through State forest
provide and maintain recreation and public information facilities
each year, from multiple use forest land, make available, at prescribed specifications, for the veneer and sawmilling industries a minimum aggregate quantity of 300 000 cubic metres of eucalypt veneer logs and eucalypt sawlogs.
1.3 Governance
There are a number of mechanisms under which the financial performance of a GBE is administered. The Board of a GBE, including Forestry, is appointed with the expectation that it will manage the entity in line with these mechanisms. This Section details what these are.
1.3.1 Ministerial Charter
Section 36 of the GBE Act requires the preparation of a Ministerial Charter. The most recent Charter for Forestry was issued in 1999 and commenced on 1 July 1999. The Charter details Ministerial expectations regarding:
objectives and strategic direction
core business
performance targets
financial considerations
pricing policy
human resources management, superannuation and industrial relations
code of ethics and
risk management.
Forestry has experienced significant changes since 1999 for which the Charter requires updating.
Chapter 1 — Legislative context
25
Forestry Tasmania
Recommendation 1
We recommend that the responsible Ministers issue an updated Ministerial Charter.
1.3.2 Tasmanian Government Businesses Governance Framework Guide
The Department of Treasury and Finance’s (Treasury) Tasmanian Government Businesses Governance Framework Guide 2008 (the Guide) provides guidance in relation to the following aspects:
expectations of government
accountability arrangements
the role of the Parliament and of the portfolio Minister and the Treasurer
Treasury’s role and that of the portfolio Department
the role of the Board.
1.3.3 Governance guidelines
The Guide suggests that the board of directors of a GBE should (our underlining added for emphasis):
In fulfilling its role in respect of performance, a board must ensure it sets relevant performance targets for the business, with a commitment towards achievement of commercial performance levels and, wherever possible, external benchmarks should be identified which are relevant to the industry, sector or market of the business …
1.3.4 Corporate plans
Government businesses are required to provide their portfolio Minister and the Treasurer with a Corporate Plan. On 30 April 2009, Forestry satisfied this requirement when it submitted its Corporate Plan 2009–12 (the Corporate Plan) to the Treasurer and the Minister for Energy and Resources. Forestry has submitted its Corporate Plan for the 2010–13 period which we have read. However, our commentary below focuses on the 2009–12 plan.
Following an assessment of the Corporate Plan by Treasury, it was approved by the two responsible Ministers on 20 August 2009. The Plan envisaged:
Chapter 1 — Legislative context
26
Forestry Tasmania
an improvement to $12.583m in operating profit before net interest expense and taxation by 30 June 2012 (actual for the year ended 30 June 2009 was $10.063m)
an improvement in cash generated from operations to $12.981m by 2012 (actual for the year ended 30 June 2009 was $3.315m)
average earnings before interest and taxation expressed as a ratio of total assets of 1.67 per cent (actual for the year ended 30 June 2009 was 1.08 per cent)
average earnings before interest and taxation expressed as a percentage of equity of 2.70 per cent (actual for the year ended 30 June 2009 was 1.78 per cent)
no change in borrowings (there were no new borrowings in 2008–09).
Because this Corporate Plan was approved, we assume Government accepted the rates of return forecast by Forestry’s Board. We also note that the Corporate Plan included no discussion about:
the relevance of the performance targets set for the business
the extent to which these performance targets achieve commercial performance levels or
comparison with any external benchmarks. The relevance of external benchmarks is discussed further in Chapter 3.
Recommendation 2
We recommend that Forestry’s future Corporate Plans include discussion and argument, including assumptions made on industry and other conditions, regarding:
- the relevance of the performance targets set
- the extent to which these do, or do not, and if so why not, achieve commercial performance levels
- comparison with relevant external benchmarks.
We note also that the Plan did not discuss how Forestry would achieve the legislative responsibilities detailed in Section 1.2 of this Chapter. For example, we would have expected some discussion in the Plan about how Forestry optimises economic returns, achieves sustainable forest management or performs its CSOs in an efficient manner. We acknowledge, however, that these matters, other than
Chapter 1 — Legislative context
27
Forestry Tasmania
CSOs, are addressed in public documents issued by Forestry such as its Sustainability Charter and the 2009 Stewardship Report.
We also acknowledge that Forestry’s 2010–13 Corporate Plan includes additional discussion about CSOs.
Recommendation 3
We recommend that future Corporate Plans demonstrate how Forestry will satisfy the financial and economic responsibilities outlined in the GBE Act and in the Forestry Act.
Taken together, the external governance arrangements, at least as they relate to Forestry’s financial performance, are comprehensive.
1.4 Key assumption made by Forestry
In order to satisfy the requirement that Forestry best achieve sustainable forest management and provide 300 000 cubic metres of eucalypt veneer and sawlogs to the veneer and sawmilling industries, it manages its native forestry estate on timeframes and forest management regimes that maximise the long term production of high quality sawlogs. For native forests this averages around 90 years.
The requirement to provide 300 000 cubic metres of eucalypt veneer and sawlogs has been in the Forestry Act for many years. This inclusion was reviewed as part of the National Competition Policy Progress Report – 1 August 1997 to 31 August 1998 in which it was concluded that:
The review process conducted under the Tasmanian Forest and Forest Industries Strategy and more recently the Regional Forest Agreement demonstrated that the minimum supply requirement was justified in the public interest1.
We discuss further the National Competition Policy Progress Report and financial impacts of this requirement in Section 5.6.
1.5 Discussion
Our assessment of Forestry’s legislative responsibilities are discussed below.
1 National Competion Policy Progress Report – 1 August 1997 to 31 August 1998, section 4.4.2.4
Chapter 1 — Legislative context
28
Forestry Tasmania
1.5.1 Legislative and other requirements
Forestry is required to operate efficiently, apply sound commercial practices and provide a sustainable commercial rate of return to government. At the same time, it is required to:
provide various community support activities which are funded from its own resources
provide its community service obligations efficiently and effectively
provide fire fighting services some of which are funded
manage assets, such as forest reserves, from which no revenues are generated
make available a minimum aggregate quantity of 300 000 cubic metres eucalypt veneer logs and eucalypt sawlogs
sustainably manage its forests.
In our view, there is the potential for tension between these requirements in particular those relating to the need to manage the forests sustainably, provide CSOs and, at the same time, to provide a commercial rate of return. It has been correctly asserted to us that this tension may not be any greater than normally experienced in any corporate entity attempting to balance commercial imperatives with community, shareholder and stakeholder expectations within modern corporate social responsibility frameworks. We agree to an extent but argue that those frameworks, along with Forestry’s legislative responsibilities and its requirement to manage reserves generating no income, are more onerous.
During the course of this audit we asked Forestry management:
to quantify all of the CSOs that it provides
whether or not it provides its CSOs efficiently
to quantify the financial impact of the annual requirement to make available a minimum aggregate quantity of 300 000 cubic metres eucalypt veneer logs and eucalypt sawlogs and of the related decision to manage its native forests on a 90-year rotation.
With the exception of the first (answered in part) and second of these, details were provided and are commented upon in Chapter 5.
1.5.2 Community Service Obligations – further discussion
Chapter 1 — Legislative context
29
Forestry Tasmania
The Guide referred to in Section 1.3.2 defines a CSO as:
… an activity undertaken by a GBE that would not be undertaken if it was a commercial entity operating in the private sector. The Government Business Enterprises Act 1995 requires that a CSO can only be declared where:
- the function performed, services provided, or concession allowed will result in a net cost to the GBE;
- it is the direct result of a direction given under, or a specific requirement of an Act of Parliament; and
- it would not be performed, provided or allowed if the GBE were a business in the private sector acting in accordance with sound commercial practice.
As already noted, the impact of Forestry’s CSO-type activities is explored further in Chapter 5.
1.5.3 Tourism activities
Forestry is required to promote and encourage the use of State forests for purposes other than wood production. It satisfies this requirement by the provision of tourism ventures such as the Tahune Airwalk, its 50 per cent interest in Hollybank Treetops Adventure and a number of other activities.
In its assessment of Forestry’s tourism activities, assessed as part of its assessment of Forestry’s 2009–12 Corporate Plan, Treasury noted that, ‘Forestry’s underperforming tourism operations will be a constraint on business profitability’2.
We concur with this observation and note that in recent years Forestry impaired to nil its investments in the former Dismal Swamp.
While Forestry’s tourism activities may result in economic benefits to Tasmania, the direct impact on its profitability is not publicly reported with Forestry not having to report segment information in its annual financial statements. However, in the interests of full accountability for its decisions regarding this legislative requirement, Forestry should separately report in its annual financial statements the results of its tourism operations.
Recommendation 4
2 Department of Treasury and Finance Corporate Plan Assessment 19 June 2009
Chapter 1 — Legislative context
30
Forestry Tasmania
We recommend that Forestry separately report in its annual financial statements the financial performance of its tourism activities.
The financial performance of Forestry’s tourism activities is dealt with in Section 3.11 in Chapter 3.
1.6 Financial reporting obligations
Forestry is required to, and does, comply with Australian Accounting Standards (AAS) when preparing its annual financial statements. These statements must be submitted to the Auditor-General within 45 days of 30 June each year which it also satisfies.
During the period covered by this Report, there were significant changes to AAS although the impact on the net operating results before tax (see Chapter 4) were not significant. There were, however, changes to:
non-operating transactions such as valuations of biological assets
disclosure requirements which significantly impacted Forestry’s annual financial statements primarily as these related to disclosure of its superannuation arrangements (see Chapter 6), forestry activities and financial instruments. Another change, explored below, related to compliance with segment reporting.
1.6.1 Segment reporting
AAS include some standards which Forestry does not need to comply with because the standards setter, the Australian Accounting Standards Board (AASB), regards certain standards as not relevant to all for-profit entities. One of the standards which Forestry no longer needs to comply with is AASB 8 Operating Segments which superseded AASB 114 Segment Reporting in 2009. This exemption became effective at 30 June 2009. In its 30 June 2008, and prior, financial statements Forestry complied with AASB 114 when it reported its financial performance on a segment basis.
The Core Principle in AASB 8 is as follows:
An entity shall disclose information to enable users of its financial statements to evaluate the nature and financial effects of the business activities in which it engages and the economic environments in which it operates3.
3 AASB 8 Operating Segments, paragraph 1
Chapter 1 — Legislative context
31
Forestry Tasmania
To enable users of Forestry’s annual financial statements to effectively assess its financial performance, segment information should be provided in line with Forestry’s internal management reporting. Such reporting is likely to enhance understanding by the public of the complexity of Forestry’s operations particularly the management of its hardwood and softwood plantations over varying cycles and the financial implications of this. In any event, such segment information should include financial performance as it relates to Forestry’s tourism activities (see Recommendation 4) as well as the following:
domestic sales
export sales
plantations
Forest management services
CSOs.
Recommendation 5
Despite the exemption provided in AASB 8 Operating Segments, we recommend that Forestry comply with this accounting standard.
In making this recommendation, we acknowledge that this may be a requirement greater than expected of Forestry’s competitors and that such disclosure may provide those competitors with a competitive advantage. In any event, this level of information should be available to Forestry’s stakeholder Ministers.
1.7 Sustainable commercial rate of return
As noted in Section 1.2.1, the GBE Act requires Forestry to achieve a sustainable commercial rate of return that maximises value for the State in accordance with corporate plans having regard to the economic and social objectives of the State. However, as far as we have been able to ascertain, the term ‘sustainable commercial rate of return that maximises value for the State in accordance with corporate plans having regard to the economic and social objectives of the State’ has not been defined.
In a number of sections of this Report we consider planned, actual and comparative rates of return and we endeavour to determine a reasonable rate expectation for Forestry (see Chapter 3). We also acknowledged that:
Stakeholder Ministers approved the rates of return included in Corporate Plans.
Chapter 1 — Legislative context
32
Forestry Tasmania
While making comparative assessments is difficult, refer Chapter 3, some peer public forestry businesses generated low returns in recent years.
There are factors which contribute to Forestry achieving lower returns such as its unfunded CSO-type activities.
We also acknowledge Forestry’s decision to manage its native forestry estate on timeframes and forest management regimes that maximise the long term production of high quality sawlogs. For native forests this averages around 90 years and, therefore, an assessment of any annual or other short term financial performance is problematic. This is dealt with to an extent in Chapter 4.
We discussed with Forestry the difference between maximising short term commercial returns, and managing for a sustainable return. In order to maximise short term returns, Forestry could consider alternative strategies such as:
increasing the cut
reducing native forest and other rotation periods
logging coups with anticipated highest yields and locations facilitating easier access
cutting back on research, corporate relations and business development
reducing staffing levels
minimising expenditure on CSOs including fire fighting
withdrawing from tourism activities.
However, if these options were to be taken up, we question whether sustainable management of the forest would be achieved and we doubt that this would satisfy legislated requirements.
In any event, the term ‘sustainable commercial rate of return that maximises value for the State having regard to the economic and social objectives of the State’ needs to be defined.
Recommendation 6
We recommend that Forestry’s responsible Ministers define what they mean by ‘sustainable commercial rate of return that maximises value for the State having regard to the economic and social objectives of the State’.
1.8 Conclusions
Chapter 1 — Legislative context
33
Forestry Tasmania
Forestry’s approved Corporate Plan anticipates that it will generate low rates of return with the Plan not outlining how or why they were set. These rates of return are impacted by expenditure on community service type obligations and decisions regarding forest rotations.
There is potential tension between Forestry’s legislative requirements in particular those relating to the need to manage the forests sustainably and to provide a sustainable commercial rate of return. However, the term sustainable commercial rate of return has still to be defined.
Forestry complies with is financial reporting obligations but it could be more transparent if it included in its annual reports financial details of its tourism activities and other segments of its activities.
Chapter 3 – Rates of return
34
Forestry Tasmania
2 Financial context
Chapter 2 — Financial context
35
Forestry Tasmania
2 Financial context
2.1 Background
We decided it was relevant to provide context around Forestry’s financial situation for a number of reasons. We wanted to:
evaluate the manner in which it was initially established and funded and whether or not this impacted its subsequent financial situation
review the level of equity, or similar, funding on establishment in 1994 and since then (we also refer to this as how Forestry was initially, or subsequently, capitalised)
assess any impacts on Forestry’s profitability and cash flows, including costs, of increases in forests held in reserves and higher levels of expenditure on plantation development
assess the evolving nature of Forestry’s business over the 16 years to 30 June 2010.
While we did not separately assess here the financial impact of Forestry’s CSO obligations, which are explored in Chapter 5, we note in this Chapter the situation that in 1993–94 (the financial year prior to the commencement of Forestry Tasmania), and for the first four years of Forestry’s operations, it received funding for the Conservation and Community Service Program. We refer in this Chapter to this Program as ‘CSO-type’ funding.
2.2 How Forestry was initially capitalised?
Our focus here was to establish the level of equity funding and other resources provided to Forestry when the former Forestry Commission ceased operating on 1 July 1994 and since then.
2.2.1 Initial equity funding
On 1 July 1994 net assets transferred to Forestry totalled $2 178.062m comprising:
net working capital of $11.888m
forest (including biological) assets of $2 130.786m
other non-current assets of $77.541m
non-current deferred taxation liability of $1.619m
non-current employee related provisions of $36.255m
Chapter 2 — Financial context
36
Forestry Tasmania
borrowings of $4.279m of which $2.296m related to plantations established by private forest landowners which were transferred to Private Forests Tasmania in 1994-95. The remaining $1.983m was paid in 1994–95.
These net assets of $2 178.062m were represented by:
state equity of $272.057m. This amount represented debt owed by the former Forestry Commission which was taken over by the State in 1988. At that time the Commission’s forestry revenue was paid into Consolidated Fund and appropriated to the Commission in the following year.
revaluation reserves of $1 862.552m; 98 per cent of which was a forest timber revaluation reserve. At 30 June 1995, one year later, this reserve was reduced by 86 per cent to $250.971m. At 30 June 1994 biological assets were recognised at the value of the total estimated standing volume of merchantable timber at that date. This was changed in 1994–95 to recognise these assets at the net present value of the revenue flows from the harvesting of existing forests at a sustainable rate less costs associated with bringing these forests to maturity.
retained profits of $43.453m.
At that time the multiple use forest totalled 1.601 million hectares.
Analysis of the position upon establishment of Forestry suggests to us that:
No new equity was provided when Forestry commenced operations on 1 July 1994. The debt for equity swap had occurred in 1988.
The net working capital of the business was sound with a current ratio of 2.72.
Inherited debt was low.
Operating cash flows were reasonable although less than that needed for investment in plantations and capital assets.
Forestry took over operating assets and a business model which had previously generated positive returns and cash flows.
Chapter 2 — Financial context
37
Forestry Tasmania
2.2.2 The situation 12 months later
Forestry’s first balance sheet at 30 June 1995 differed significantly from that at 30 June 1994. Net assets had declined by $1 561.077m due to the net effects of:
a healthy operating profit of $21.194m which excluded $12.328m abnormal Helsham funding
payment of a dividend of $3.920m and tax of $5.079m
debt being reduced to nil
$20.985m invested in plantation development and other capital assets
a change in accounting policy relating to forest assets resulting in a downward valuation of $1 572.500m.
At 30 June 1995, Forestry’s net working capital was still strong with its current ratio being 3.71 and the multiple use forest still totalled 1.601 million hectares.
Therefore, it is our assessment that the business taken over by Forestry in 1994–95 was sound. However, we found no evidence of any assessment at that time as to whether the business could sustain the financial impacts of factors known at that time or that followed including:
its minimum day to day working capital requirements taking into account factors such as sales and supplier credit terms, fortnightly salary costs, arrangements with contractors, property and other leasing arrangements, etc.
the condition and replacement strategies for property, plant and equipment taken over
the condition and plans for upgrades of information technology systems
costs required to be incurred on satisfying legislative requirements, meeting owner and community expectations and how these were to be funded
funds required to service debt
funds required to meet planned plantation investment programs including the impacts of decisions such as plantation rotation periods and any cash flow implications thereof
financial risks associated with the business in question including exchange rate risk and market risk.
Chapter 2 — Financial context
38
Forestry Tasmania
It is our expectation that prior to, or upon, the establishment of any government business, assessments of this nature, which may impact their initial capital structure, would be conducted by either initial decision makers or by the initial board and management. It is also our expectation that such assessments would lead to decisions about factors such as:
asset replacement programs including plantations development
debt/equity levels
funding, or not funding, CSOs.
Recommendation 7
We recommend that:
- Any decision to establish a State-owned company or government business enterprise should include an assessment of the capital structure needed to establish and maintain that entity
- The Forestry Board, as a matter of urgency, should carry out an assessment of the most appropriate capital structure for its business and of the working capital requirements associated therewith.
2.2.3 Forestry’s cash requirements on and after its establishment
We assessed Forestry’s cash requirements in the three years 1994–95 to 1996–97. This was done to assess whether or not cash generated from operations was sufficient to meet necessary obligations in the absence of equity funding. The 1994–95 to 1996–97 period was selected because Regional Forest Agreement (RFA) funding commenced in 1997–98.
During the three-year period to 30 June 1997, Forestry generated receipts and made payments as detailed in Table 1.
Chapter 2 — Financial context
39
Forestry Tasmania
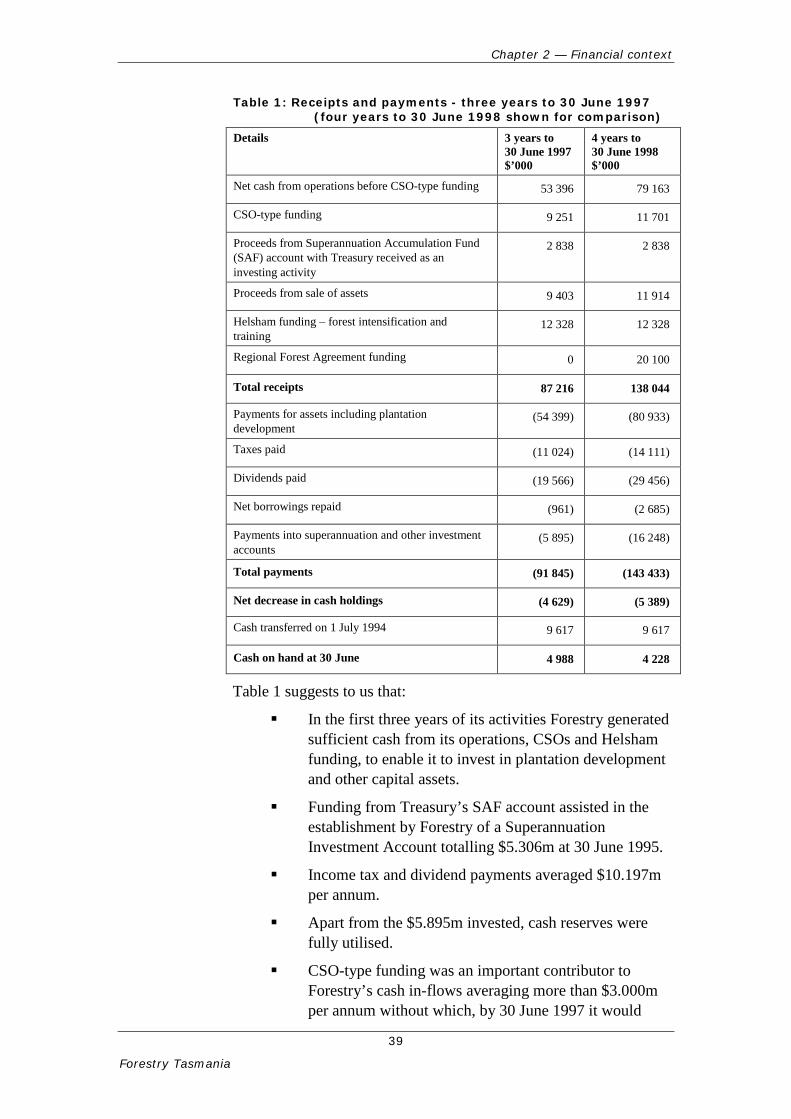
Table 1: Receipts and payments - three years to 30 June 1997 (four years to 30 June 1998 shown for comparison)
Details 3 years to 30 June 1997 $’000
4 years to 30 June 1998 $’000
Net cash from operations before CSO-type funding 53 396 79 163
CSO-type funding 9 251 11 701
Proceeds from Superannuation Accumulation Fund (SAF) account with Treasury received as an investing activity
2 838 2 838
Proceeds from sale of assets 9 403 11 914
Helsham funding – forest intensification and training
12 328 12 328
Regional Forest Agreement funding 0 20 100
Total receipts 87 216 138 044
Payments for assets including plantation development
(54 399) (80 933)
Taxes paid (11 024) (14 111)
Dividends paid (19 566) (29 456)
Net borrowings repaid (961) (2 685)
Payments into superannuation and other investment accounts
(5 895) (16 248)
Total payments (91 845) (143 433)
Net decrease in cash holdings (4 629) (5 389)
Cash transferred on 1 July 1994 9 617 9 617
Cash on hand at 30 June 4 988 4 228
Table 1 suggests to us that:
In the first three years of its activities Forestry generated sufficient cash from its operations, CSOs and Helsham funding, to enable it to invest in plantation development and other capital assets.
Funding from Treasury’s SAF account assisted in the establishment by Forestry of a Superannuation Investment Account totalling $5.306m at 30 June 1995.
Income tax and dividend payments averaged $10.197m per annum.
Apart from the $5.895m invested, cash reserves were fully utilised.
CSO-type funding was an important contributor to Forestry’s cash in-flows averaging more than $3.000m per annum without which, by 30 June 1997 it would
Chapter 2 — Financial context
40
Forestry Tasmania
have required to cut back its CSO-type activities, plantation development activities or raise new borrowings of about $4.000m.
Helsham funding was also an important contributor to Forestry’s cash flows in this three-year period without which Forestry’s investments in plantation development, or the level of dividends it paid, would have had to have been lower.
The trend evident in the first three years continued in 1997–98 except that in this financial year Forestry received the first tranche, $20.100m, under the Regional Forest Agreement (RFA). This resulted in higher investments in assets and plantation development.
Income tax and dividends paid in 1997–98 totalled $12.977m.
So, other than external support in the form of $12.328m Helsham funding, sufficiency of equity funding may not have been regarded as a potential difficulty in the first three years of Forestry’s operations.
However, as previously noted, we have been unable to ascertain whether or not, at that time or in 1995 (when it became a government business) or at any time since then (although see Section 6.4), any assessment was made as to the minimum equity required to enable Forestry to meet its legislative and commercial obligations.
Movements in Forestry’s State equity contribution since 1 July 1994 is detailed in Chapter 6 from which it will be noted that the State’s direct equity interest in Forestry declined over the period 1994 to 2010.
2.3 Other sources of equity, or similar, funding since 1994
The conclusion in Section 2.2 does not mean that Forestry did not receive financial support from governments. At various times during the period of this financial assessment, Forestry received funding as a result of various agreements with governments. In general these agreements were aimed at assisting plantation development in return for increasing area of forests held in reserves. In addition, Forestry participated in a significant asset sale in 1999–2000.
This Section summarises the financial impacts of these arrangements.
2.3.1. Commonwealth state agreements
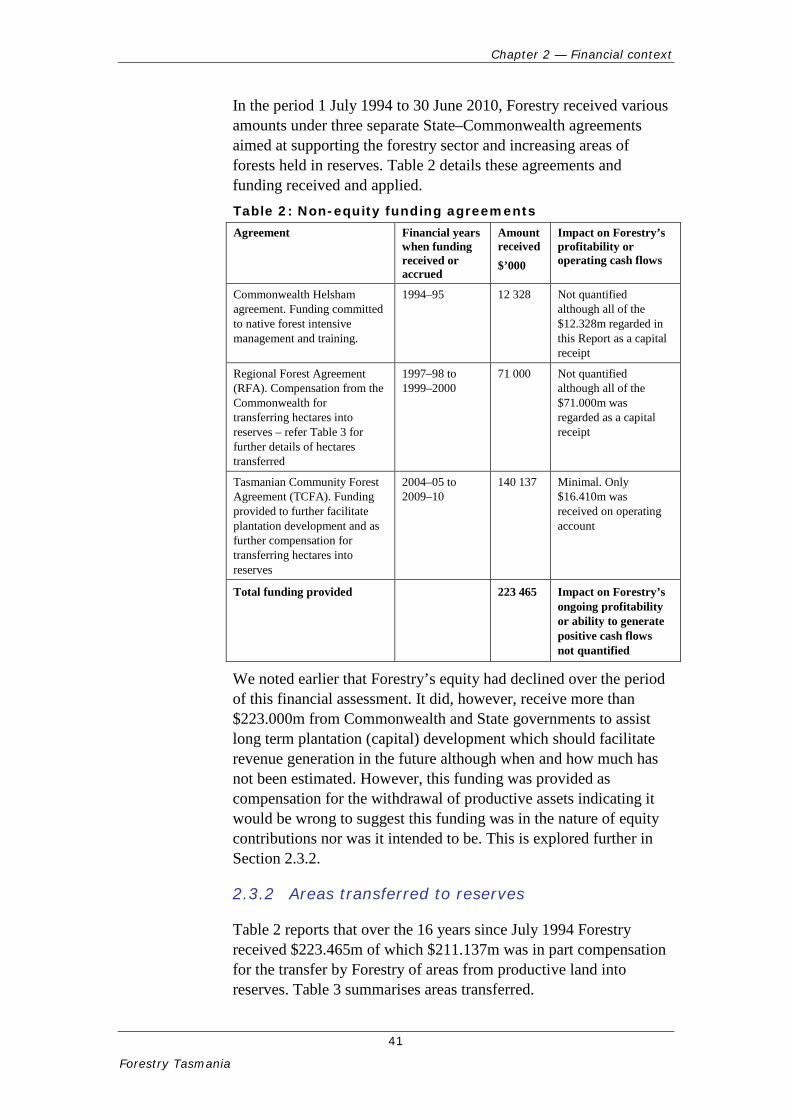
Chapter 2 — Financial context
41
Forestry Tasmania
In the period 1 July 1994 to 30 June 2010, Forestry received various amounts under three separate State–Commonwealth agreements aimed at supporting the forestry sector and increasing areas of forests held in reserves. Table 2 details these agreements and funding received and applied. Table 2: Non-equity funding agreements Agreement Financial years
when funding received or accrued
Amount received $’000
Impact on Forestry’s profitability or operating cash flows
Commonwealth Helsham agreement. Funding committed to native forest intensive management and training.
1994–95 12 328 Not quantified although all of the $12.328m regarded in this Report as a capital receipt
Regional Forest Agreement (RFA). Compensation from the Commonwealth for transferring hectares into reserves – refer Table 3 for further details of hectares transferred
1997–98 to 1999–2000
71 000 Not quantified although all of the $71.000m was regarded as a capital receipt
Tasmanian Community Forest Agreement (TCFA). Funding provided to further facilitate plantation development and as further compensation for transferring hectares into reserves
2004–05 to 2009–10
140 137 Minimal. Only $16.410m was received on operating account
Total funding provided 223 465 Impact on Forestry’s ongoing profitability or ability to generate positive cash flows not quantified
We noted earlier that Forestry’s equity had declined over the period of this financial assessment. It did, however, receive more than $223.000m from Commonwealth and State governments to assist long term plantation (capital) development which should facilitate revenue generation in the future although when and how much has not been estimated. However, this funding was provided as compensation for the withdrawal of productive assets indicating it would be wrong to suggest this funding was in the nature of equity contributions nor was it intended to be. This is explored further in Section 2.3.2.
2.3.2 Areas transferred to reserves
Table 2 reports that over the 16 years since July 1994 Forestry received $223.465m of which $211.137m was in part compensation for the transfer by Forestry of areas from productive land into reserves. Table 3 summarises areas transferred.
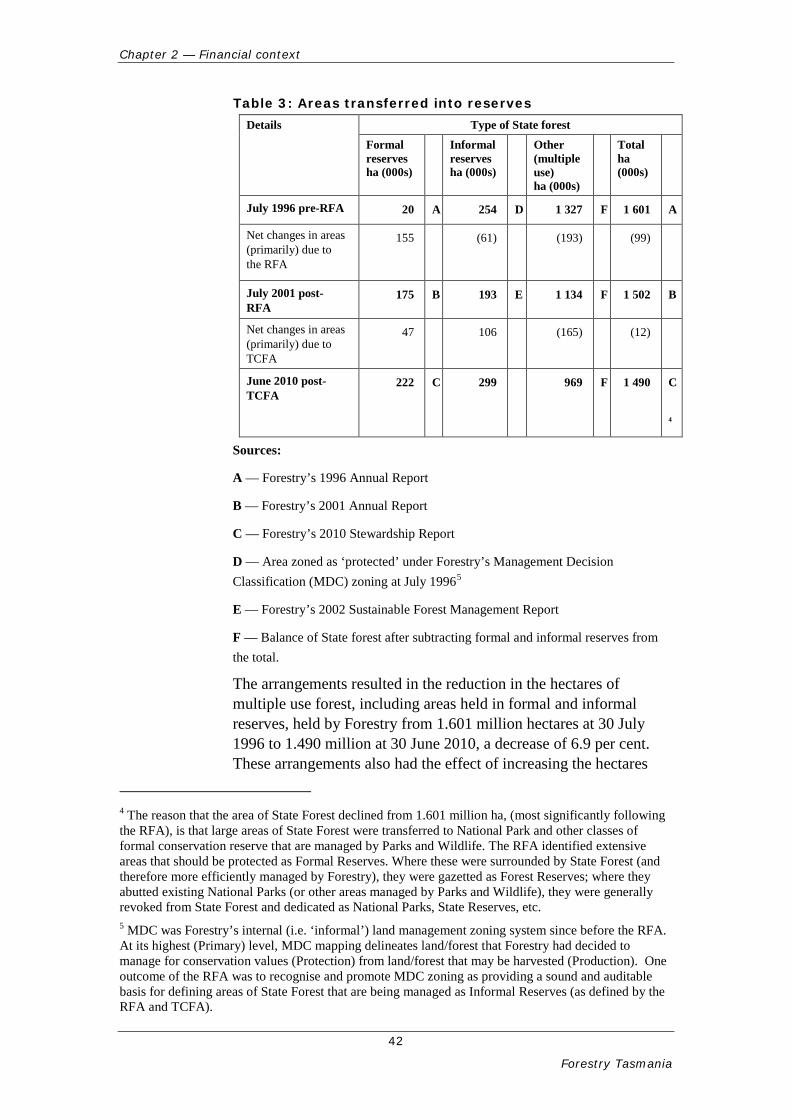
Chapter 2 — Financial context
42
Forestry Tasmania
Table 3: Areas transferred into reserves Details Type of State forest
Formal reserves ha (000s)
Informal reserves ha (000s)
Other (multiple use) ha (000s)
Total ha (000s)
July 1996 pre-RFA 20 A 254 D 1 327 F 1 601 A
Net changes in areas (primarily) due to the RFA
155 (61)
(193) (99)
July 2001 post- RFA
175 B 193 E 1 134 F 1 502 B
Net changes in areas (primarily) due to TCFA
47 106 (165) (12)
June 2010 post-TCFA
222 C 299 969 F 1 490 C
4
Sources:
A — Forestry’s 1996 Annual Report
B — Forestry’s 2001 Annual Report
C — Forestry’s 2010 Stewardship Report
D — Area zoned as ‘protected’ under Forestry’s Management Decision Classification (MDC) zoning at July 19965
E — Forestry’s 2002 Sustainable Forest Management Report
F — Balance of State forest after subtracting formal and informal reserves from the total.
The arrangements resulted in the reduction in the hectares of multiple use forest, including areas held in formal and informal reserves, held by Forestry from 1.601 million hectares at 30 July 1996 to 1.490 million at 30 June 2010, a decrease of 6.9 per cent. These arrangements also had the effect of increasing the hectares
4 The reason that the area of State Forest declined from 1.601 million ha, (most significantly following the RFA), is that large areas of State Forest were transferred to National Park and other classes of formal conservation reserve that are managed by Parks and Wildlife. The RFA identified extensive areas that should be protected as Formal Reserves. Where these were surrounded by State Forest (and therefore more efficiently managed by Forestry), they were gazetted as Forest Reserves; where they abutted existing National Parks (or other areas managed by Parks and Wildlife), they were generally revoked from State Forest and dedicated as National Parks, State Reserves, etc. 5 MDC was Forestry’s internal (i.e. ‘informal’) land management zoning system since before the RFA. At its highest (Primary) level, MDC mapping delineates land/forest that Forestry had decided to manage for conservation values (Protection) from land/forest that may be harvested (Production). One outcome of the RFA was to recognise and promote MDC zoning as providing a sound and auditable basis for defining areas of State Forest that are being managed as Informal Reserves (as defined by the RFA and TCFA).
Chapter 2 — Financial context
43
Forestry Tasmania
held in formal and informal reserves, which Forestry still had to manage, from 0.274 million hectares to 0.521 million hectares, an increase of 90.1 per cent. At the same time, productive forest reduced by 0.358 million hectares or 27.0 per cent.
As indicated in Section 2.3.1, funding was provided to compensate Forestry for the withdrawal of productive assets. On a gross revenue earned basis, the loss of 27 per cent productive hectares is likely to have negatively impacted Forestry’s sales, its ability to recover fixed costs and CSO-type costs incurred.
As part of this audit, we did not assess whether or not the compensation received by Forestry under the RFA and TCFA was adequate in relation to:
lost productive forests and loss of profits
adequacy of funding provided to assist Forestry to transition to a more plantation based model
higher relative fixed costs.
Recommendation 8
We recommend that Forestry should:
- quantify whether or not the funding it received under the RFA and TCFA represented sufficient compensation to enable it to operate profitably and to generate positive operating cash flows
- develop, in association with its stakeholder owners, the impact on its business model of these changes.
2.3.3 Acquittal of TCFA Funds received
The total TCFA program amounted to $221.200m of which the Commonwealth provided $131.200m and the State $90.000m. By 30 June 2010 Forestry had received $140.137m and it will receive no further funding under the TCFA. The difference between the total program amount of $221.200m and the $140.137m received by Forestry, $81.063m, was paid to other Tasmanian State entities. How these funds were spent is not addressed in this Report.
How Forestry’s share of this funding has been accounted for, and acquitted by it, is detailed in Table 4.
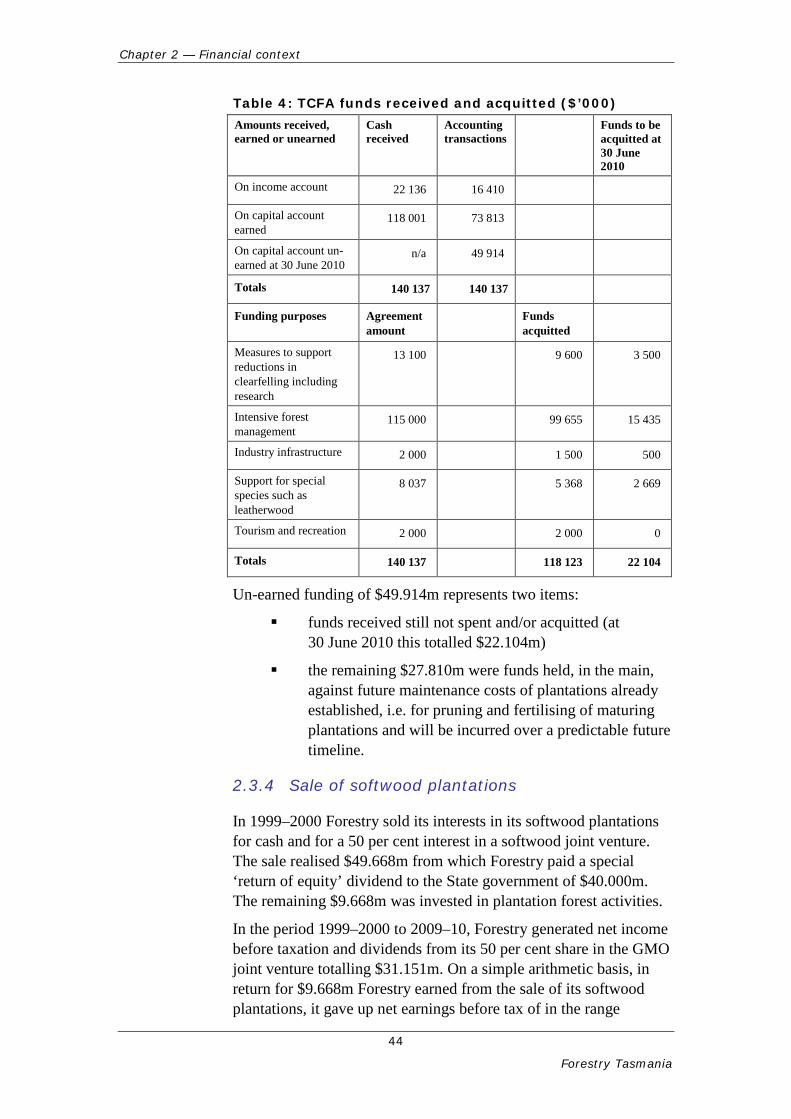
Chapter 2 — Financial context
44
Forestry Tasmania
Table 4: TCFA funds received and acquitted ($’000) Amounts received, earned or unearned
Cash received
Accounting transactions
Funds to be acquitted at 30 June 2010
On income account 22 136 16 410
On capital account earned
118 001 73 813
On capital account un-earned at 30 June 2010
n/a 49 914
Totals 140 137 140 137
Funding purposes Agreement amount
Funds acquitted
Measures to support reductions in clearfelling including research
13 100 9 600 3 500
Intensive forest management
115 000 99 655 15 435
Industry infrastructure 2 000 1 500 500
Support for special species such as leatherwood
8 037 5 368 2 669
Tourism and recreation 2 000 2 000 0
Totals 140 137 118 123 22 104
Un-earned funding of $49.914m represents two items:
funds received still not spent and/or acquitted (at 30 June 2010 this totalled $22.104m)
the remaining $27.810m were funds held, in the main, against future maintenance costs of plantations already established, i.e. for pruning and fertilising of maturing plantations and will be incurred over a predictable future timeline.
2.3.4 Sale of softwood plantations
In 1999–2000 Forestry sold its interests in its softwood plantations for cash and for a 50 per cent interest in a softwood joint venture. The sale realised $49.668m from which Forestry paid a special ‘return of equity’ dividend to the State government of $40.000m. The remaining $9.668m was invested in plantation forest activities.
In the period 1999–2000 to 2009–10, Forestry generated net income before taxation and dividends from its 50 per cent share in the GMO joint venture totalling $31.151m. On a simple arithmetic basis, in return for $9.668m Forestry earned from the sale of its softwood plantations, it gave up net earnings before tax of in the range
Chapter 2 — Financial context
45
Forestry Tasmania
$15.000m to $30.000m. However, this ignores synergies arising from joint venture.
2.4 Impacts on recurrent revenues and costs
We have not, nor did we set out to, established what impact the initiatives detailed in Section 2.3 had, or should have had, on Forestry’s operational capacity, its revenues or on its fixed costs, compared to its situation on 1 July 1994.
In any event, the nature of Forestry’s plantations activities must mean that the impacts, in particular the revenue impacts, are long-term in nature. Funding of $223.000m, that was provided for investment in plantation development over the period 1997–98 to 2009–10, was aimed at generating revenue inflows some years into the future. These initiatives also resulted in higher forest reserves which Forestry is required to manage resulting in costs but no associated revenues.
However, as we shall show, dropping profitability, removal of CSO-type funding, payment of rates, loss of revenue from the sale of 50 per cent of its plantation assets, high investment in long-term cash producing assets, meeting its defined benefit superannuation obligations, paying taxes and dividends and poor market conditions all contrived to Forestry having to increasingly rely on debt funding and exhausting its cash reserves.
2.5 How, and when, is financial performance assessed in a long-term business?
In the early stages of this performance audit and during our financial audits in recent years we have discussed with Forestry management our concerns regarding declining profitability and, in particular, what appeared to us as an increasingly difficult financial liquidity position. This was exacerbated by relatively high levels of investment in plantation development.
Forestry management offered to brief us on their forecast profitability and cash flows which was taken up. That briefing was provided prior to the global financial crisis (GFC).
Our objective for referring to this briefing in this Report was not to detail what the forecasts were. Instead, what struck us at the time was the importance of understanding the very long-term nature of Forestry’s business, in particular as it relates to its 90-year native forest rotation policy. This policy is clearly related to the requirement that Forestry manage its biological assets in a sustainable manner for the long term.
Chapter 2 — Financial context
46
Forestry Tasmania
In our view, there are at least three implications of this. These are discussed below.
Chapter 2 — Financial context
47
Forestry Tasmania
2.5.1 Separating short- versus long-term functions
In order to properly assess Forestry’s financial performance, there is a need to separately assess the financial performance of the significant components of its business including:
native forest activities and their longer term impacts
hardwood plantations, also having longer-term impacts
softwood plantations
all of the above separating domestic and export sales and profitability
tourism activities
CSOs as it relates to both commercial and non-commercial forests.
Having this information separately reported would facilitate better evaluation of financial performance, although it is acknowledged that the first four of these activities are all strategically related. Hardwood plantations and native forests supply the same or similar contracted supplies and markets, for both domestic and export sales.
Recommendation 5 applies.
2.5.2 Evaluation timeframes and parameters
Section 2.5.1 refers to those aspects of Forestry’s business which are longer term in nature. This performance audit has highlighted (see Chapter 4) the difficulty in evaluating the financial performance of a forestry business annually. Forestry’s performance over the 16 years of its existence showed significant annual variations in financial performance with some conclusions possible over this more extended time period. Table 5 summarises Forestry’s operating profitability and cash flows for the 16 years ended 30 June 3010.
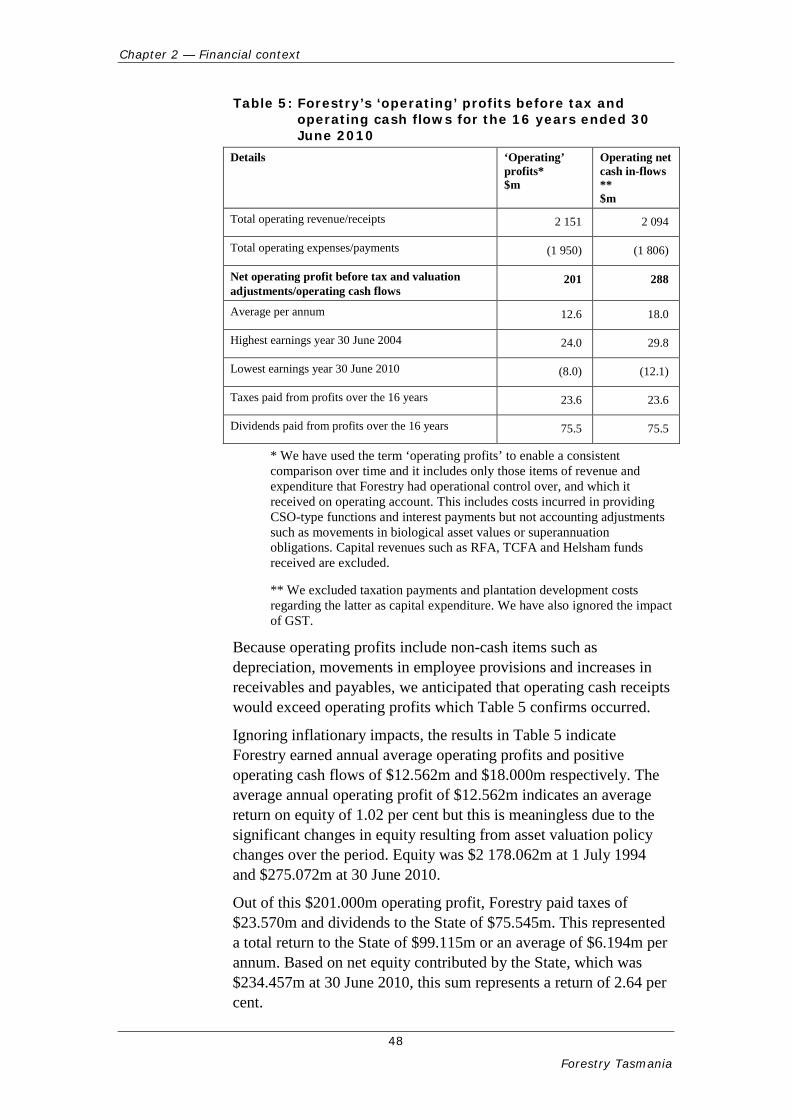
Chapter 2 — Financial context
48
Forestry Tasmania
Table 5: Forestry’s ‘operating’ profits before tax and operating cash flows for the 16 years ended 30 June 2010
Details ‘Operating’ profits* $m
Operating net cash in-flows ** $m
Total operating revenue/receipts 2 151 2 094
Total operating expenses/payments (1 950) (1 806)
Net operating profit before tax and valuation adjustments/operating cash flows
201 288
Average per annum 12.6 18.0
Highest earnings year 30 June 2004 24.0 29.8
Lowest earnings year 30 June 2010 (8.0) (12.1)
Taxes paid from profits over the 16 years 23.6 23.6
Dividends paid from profits over the 16 years 75.5 75.5
* We have used the term ‘operating profits’ to enable a consistent comparison over time and it includes only those items of revenue and expenditure that Forestry had operational control over, and which it received on operating account. This includes costs incurred in providing CSO-type functions and interest payments but not accounting adjustments such as movements in biological asset values or superannuation obligations. Capital revenues such as RFA, TCFA and Helsham funds received are excluded.
** We excluded taxation payments and plantation development costs regarding the latter as capital expenditure. We have also ignored the impact of GST.
Because operating profits include non-cash items such as depreciation, movements in employee provisions and increases in receivables and payables, we anticipated that operating cash receipts would exceed operating profits which Table 5 confirms occurred.
Ignoring inflationary impacts, the results in Table 5 indicate Forestry earned annual average operating profits and positive operating cash flows of $12.562m and $18.000m respectively. The average annual operating profit of $12.562m indicates an average return on equity of 1.02 per cent but this is meaningless due to the significant changes in equity resulting from asset valuation policy changes over the period. Equity was $2 178.062m at 1 July 1994 and $275.072m at 30 June 2010.
Out of this $201.000m operating profit, Forestry paid taxes of $23.570m and dividends to the State of $75.545m. This represented a total return to the State of $99.115m or an average of $6.194m per annum. Based on net equity contributed by the State, which was $234.457m at 30 June 2010, this sum represents a return of 2.64 per cent.
Chapter 2 — Financial context
49
Forestry Tasmania
However, Forestry’s profit and cash flow results fluctuated significantly over the past 16 years. Operating profits and losses varied from a high of $24.071m in 2004 to a low of $(7.997m) in 2010 with net operating cash fluctuating from a high of $29.775m in 2004 to a low of $(12.117m) in 2010.
A number of factors contributed to this including:
the strength of the national economy, particularly the building industry, which fluctuates with references to its impact being made as early as in the 1995–96 annual report
the sale of Forestry’s softwood resource followed by entering into a joint venture with GMO
the strength of the international economy. The South East Asian financial crises in and around 1997–99 and 2004–05 impacted financial performance in those periods. In contrast, 2004–05 was preceded by years of strong demand for wood products and better profits in the period 2002–04. Also, the recent and ongoing global financial crisis had, and continues to have, negative impacts on Forestry’s financial performance
decisions by some customers to seek supplies from other than old growth forests
movements in foreign exchange rates
introduction of the RFA and of the TCFA
investments in hardwood and softwood plantations
revised accounting standards leading to changing approaches to valuing Forestry’s biological assets
the decision by the Forestry Board in 2000–01 to approve a business case for making a commercial investment in recreational tourism resulting in opening the Tahune AirWalk in July 2001 followed later by other tourism related projects such as the Scottsdale Forest Eco Centre
investments in wood centre infrastructure through Newood Holdings, initially as a joint venture but subsequently 100 per cent controlled.
In Chapter 4 we report how Forestry’s operating profits and cash flows fluctuated over three distinct periods. In Chapter 3 we examine rates of return with one finding relevant to the discussion in Chapter 2 (see Section 3.2).
Chapter 2 — Financial context
50
Forestry Tasmania
2.5.3 Equity investment
In Section 2.2.1 we noted that at the commencement of Forestry’s activities, it was provided with no new equity although it had net working capital of $11.888m, various infrastructure assets, effectively $1.983m in borrowings and long term employee liabilities of $36.255m. At that time CSO-type funding was provided totalling almost $3.000m per annum and Forestry was in receipt of Helsham funding. Profitability and net operating cash flows in the year ended 30 June 1995 seemed strong with operating profits totalling $16.041m and net operating cash flows $15.247m.
Despite what appeared to have been a strong starting position, we remain of the view that, at that time, an assessment needed to have been made as to Forestry’s working capital requirements in running a for-profit business with:
very long-term planning and forest growth horizons
necessary high levels of investment in forest development
significant CSO responsibilities
high fixed costs.
Had this been done, it is possible that Forestry’s initial balance sheet may have been differently established at the outset and included a cash equity contribution consistent with its 90-year native forest rotation.
Recommendation 7 applies.
2.6 How does Forestry deal with equity-related matters in its annual corporate plans?
During the course of this audit we reviewed Forestry’s 2009–12 and 2010–13 Corporate Plans. We noted no discussion about the very long-term nature of its business or of the manner in which it was, or is, capitalised. Forestry has advised us that plantation investment decisions taken today can take up to 30 years to result in any financial return. We expected to find in these corporate plans assessments of impacts of these decisions and timeframes on Forestry’s business, particularly its cash flows and balance sheet. Detailed cash flow impacts were provided but not as these relate to the balance sheet or capital requirements.
Forestry’s sources and applications of funds over the 16-year period are shown in Table 6.
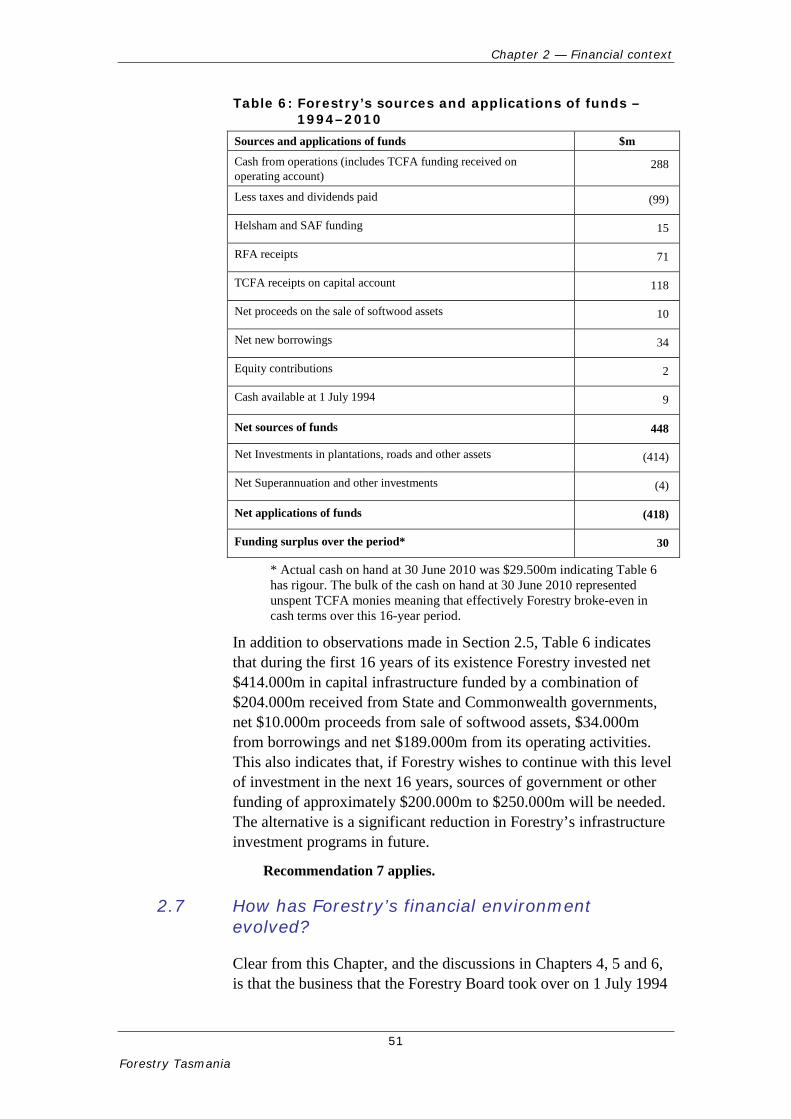
Chapter 2 — Financial context
51
Forestry Tasmania
Table 6: Forestry’s sources and applications of funds – 1994–2010
Sources and applications of funds $m
Cash from operations (includes TCFA funding received on operating account)
288
Less taxes and dividends paid (99)
Helsham and SAF funding 15
RFA receipts 71
TCFA receipts on capital account 118
Net proceeds on the sale of softwood assets 10
Net new borrowings 34
Equity contributions 2
Cash available at 1 July 1994 9
Net sources of funds 448
Net Investments in plantations, roads and other assets (414)
Net Superannuation and other investments (4)
Net applications of funds (418)
Funding surplus over the period* 30
* Actual cash on hand at 30 June 2010 was $29.500m indicating Table 6 has rigour. The bulk of the cash on hand at 30 June 2010 represented unspent TCFA monies meaning that effectively Forestry broke-even in cash terms over this 16-year period.
In addition to observations made in Section 2.5, Table 6 indicates that during the first 16 years of its existence Forestry invested net $414.000m in capital infrastructure funded by a combination of $204.000m received from State and Commonwealth governments, net $10.000m proceeds from sale of softwood assets, $34.000m from borrowings and net $189.000m from its operating activities. This also indicates that, if Forestry wishes to continue with this level of investment in the next 16 years, sources of government or other funding of approximately $200.000m to $250.000m will be needed. The alternative is a significant reduction in Forestry’s infrastructure investment programs in future.
Recommendation 7 applies.
2.7 How has Forestry’s financial environment evolved?
Clear from this Chapter, and the discussions in Chapters 4, 5 and 6, is that the business that the Forestry Board took over on 1 July 1994
Chapter 2 — Financial context
52
Forestry Tasmania
differed substantially from the one existing by 30 June 2010. Some of the changes include:
Early financial results (1994 to 1998) were positive with profits generated and dividend and tax payments supported by positive cash flows.
Increasing costs and lower operating cash flows arising from the increasing defined benefit fund obligations, in particular after 1998.
The area of productive native forests shrunk.
Responsibility for management of increased forest reserves.
Plantation assets were sold and replaced by joint venture involvement.
There was greater involvement in plantation development in particular following agreements with the State and Commonwealth governments (of which the full impact on Forestry’s business is still unclear).
CSO-type funding dried up.
Liability for payment of rates was introduced.
Social and environmental pressures evolved.
Evolving local and international trading conditions generally led to declining demand for Forestry’s products.
Tourism activities developed.
Decisions to reduce staffing levels although only in the most recent few years.
To an extent, these changes were initiated by State and Commonwealth governments in response to community and other concerns. As a result and when read alongside the findings outlined here and elsewhere in this Report, we formed the view that expectations of Forestry, and the environment in which it operates, changed fundamentally between 1994 and 2010 but that its business and funding model did not keep pace with these changes. This conclusion is supported by the fact that the most recent Ministerial Charter was issued in 1999.
Chapter 2 — Financial context
53
Forestry Tasmania
2.8 Conclusions
At the commencement of this Chapter, we initially sought to:
evaluate the manner in which forestry was initially established and funded
determine whether or not this impacted its subsequent financial situation
review the level of equity, or similar, funding on establishment in 1994 and since then.
It is our assessment that the business taken over by Forestry in 1994–95 was sound including the initial level of contributed equity. However, we found no evidence of any assessment at that time as to whether the business could sustain the financial impacts of factors known then or that followed.
Our next aim was to assess any impacts on Forestry’s profitability and cash flows, including costs, of increases in forests held in reserves and higher levels of expenditure on plantation development. We found that:
In the first three years of its activities, Forestry generated sufficient cash from its operations, and from CSOs, to enable it to invest in plantation development and other capital assets.
In its first three financial years, Forestry averaged income tax and dividend payments of $10.197m per annum, annual average investments in non-current assets of $18.133m and it invested $5.895m in a superannuation investment account.
High returns to government and asset investments continued in 1997–98 such that by 30 June 1998 Forestry’s cash reserves had remained unchanged.
Ignoring inflationary impacts, Forestry earned annual average operating profits and positive operating cash flows of $12.562m and $18.000m respectively.
Forestry paid taxes of $23.570m and dividends to the State of $75.545m. This represented total returns to the State of $99.115m or an average of $6.194m per annum
Forestry’s profit and cash flow results fluctuated significantly over the past 16 years. Operating profits varied from a high of $24.071m in 2004 to a low of $(7.997m) in 2010 with net operating cash fluctuating
Chapter 2 — Financial context
54
Forestry Tasmania
from a high of $29.775m in 2004 to a low of $(12.117m) in 2010.
If Forestry wishes to continue with its current level of investment in plantation development, sources of government or other funding of approximately $200.000m to $250.000m will be needed. The alternative is a significant reduction in Forestry’s infrastructure investment programs in future.
Finally, we wanted to assess the evolving nature of Forestry’s business over the 16 years to 30 June 2010. We found that the business taken over by Forestry in 1994, and the environment in which it operated at that time, differs from the situation faced by it at 30 June 2010. The funding and business model applied has not kept pace with these changes.
55
Forestry Tasmania
3 Measuring the State’s investment in Forestry
Chapter 3 — Measuring the State’s investment in Forestry
56
Forestry Tasmania
3 Measuring the State’s investment in Forestry
3.1 Background
In this Chapter we explore what might be the most appropriate approach to measuring the State’s investment in Forestry. Our approach was to apply conventional rates of return to assess Forestry’s financial performance. Sources of reference included:
the Commonwealth Competitive Neutrality Complaints Office’s (CCNCO) research papers into
─ Competitive Neutrality in Forestry6
─ Rate of Return Issues7
comparison with rates of return achieved by other Australian publicly owned forestry entities
our own research. In this regard we refer to the Government Businesses section of the Auditor-General’s Report No 2 of 2008, under the heading ‘Return on Equity’, where we noted:
─ Typically the cost of equity capital would range between 9 per cent and 11.5 per cent before tax for government businesses depending on the relative risk beta of the particular business compared to the market as a whole. Assuming a taxation rate of 30 per cent, after tax returns of government business enterprises and state-owned companies should be of the order of 6–7.5 per cent (nominal post-tax).
However, there is circularity of reasoning here, particularly given that, other than the State assuming the responsibility for Commonwealth Softwood loans which form the basis of the contributed equity (see Chapter 2) no new equity was initially contributed to Forestry. Rates of return revolve around the valuation of the forests which is a derivative of the assumed discount rate in any event.
6 Commonwealth Competitive Neutrality Complaints Office (CCNCO) 2001, Competitive Neutrality in Forestry, CCNCO Research Paper, Productivity Commission, Canberra, May 7 Commonwealth Competitive Neutrality Complaints Office (CCNCO) 1998, Rate of Return Issues, CCNCO Research Paper, Productivity Commission, Canberra, December
Chapter 3 — Measuring the State’s investment in Forestry
57
Forestry Tasmania
As indicated in Chapter 2, Forestry’s approved targets are well below the range six per cent to 7.5 per cent and also below another comparative measure being the long-term government bond rate.
The remainder of this Chapter explores Forestry’s performance applying conventional rates of return. Not taken into account in this assessment is the conclusion we reached in Chapter 2 — that Forestry’s funding and business model changed over the period which impacted its financial performance and, as will be seen from Chapter 4, this performance deteriorated over time.
In this Chapter, we accepted Forestry’s current accounting treatments whereby:
Interest charged on unfunded defined benefit superannuation obligations was not reported as an operating cost.
Forestry’s income statements do not report a cost of trees sold.
These two matters are discussed further in Section 4.2.
3.2 CCNCO’s competitive neutrality in forestry
In the Summary to the CCNCO’s research paper it was noted that:
As forestry agencies are deemed to be significant government businesses, they are subject to competitive neutrality. This requires them to: charge prices that reflect costs; pay all relevant government taxes and charges; pay commercial interest rates on their borrowings; earn commercially acceptable rates of return on their assets; and operate under the same regulatory regimes as their private sector counterparts.
Over the ‘life’ of a forest, the rate of return provides a useful measure of an agency’s performance. However, annual rates of return need to be interpreted with care. For example:
- Revenues, and hence rates of return, will fluctuate from year to year because the quantity of wood available for harvest will vary, unless the forest age profile is consistent through time;
- With a pronounced cyclical demand for many processed wood products, log prices (and hence forestry returns) can also be quite volatile; and
- The use of expected future returns to determine the value of forests introduces an element of circularity into an agency’s reported rate of return. More specifically, it means that poor performance by an agency will lower the value of its forest
Chapter 3 — Measuring the State’s investment in Forestry
58
Forestry Tasmania
assets. As a result, the reported decline in returns, relative to the new asset base, is dampened, or perhaps even eliminated.
Chapters 1 and 2 of this Report confirmed the existence of many of these factors when assessing the financial performance of Forestry.
3.3 Setting rate of return targets
The CCNCO Rate of Return Issues research paper noted that:
Jurisdictions have adopted three methods of establishing target rates of return for government businesses. In increasing order of complexity these are:
- specifying a uniform rate of return for all businesses;
- setting a unique rate of return for each business by benchmarking returns against similar private businesses or industry sectors; and
- setting a unique return based on the businesses’ weighted average cost of capital.
In general, application of the first and third of these methods results, depending on the assessment of risk, in use of the long term bond rate plus a margin. Regarding the second, our review of the Productivity Commission’s series of reports comparing the financial performance of State forestry entities suggest that their structures make comparison difficult.
3.4 Industry comparison
In Section 1.3.4, we noted that Forestry’s Corporate Plan did not include discussion about:
the extent to which its performance targets achieve commercial performance levels, or
comparison with any external benchmarks.
An assessment of financial performance is more meaningful if an entity’s performance is measured against itself over time, reasonable targets established by owners, other entities in similar industries and other existing benchmarks such as the government bond rate (regarded as a risk free rate of return).
For purposes of comparative assessment we researched rates of return achieved by the following publicly owned forestry entities:
Forestry NSW (FNSW)
VicForests
Forestry Plantations Queensland (FPQ)
Chapter 3 — Measuring the State’s investment in Forestry
59
Forestry Tasmania
Forest Products Commission of Western Australia (FPCWA)
Forestry SA.
Financial information used was sourced from audited financial statements for each entity located on their websites and from assessments conducted by the Productivity Commission in its July 2008 report Financial Performance of Government Trading Enterprises 2004-05 to 2006-07 (the Commission’s July 2008 report). This report forms part of the Commission’s research into the performance of Australian industries and the progress of microeconomic reform.8
3.5 Productivity Commission
Of relevance to our Report, the Productivity Commission’s July 2008 report identified the following key points:
At a consolidated level, return on assets (excluding FPQ) declined from 8.5 per cent to 5.4 per cent in 2006–07.
Of the monitored government trading enterprises (GTEs), four earned less that the risk free rate of return.
Three forestry GTEs — received community service obligation (CSO) funding totalling $14.600m. CSO payments comprised 2.1 per cent of total sector income in 2006–07.
In terms of income, the largest entity was Forestry Tasmania ($201.000m in 2006–07).
Three of the six entities carried out tourism activities.
All six conducted research and marketing activities.
Four States currently have RFAs — NSW, Victoria, WA and Tasmania.
The measurement of profitability for forestry GTEs can be significantly affected by the valuations of their self generating and regenerating assets (SGARAs) or their biological assets (native forests and hardwood and softwood plantations). However, the Productivity Commission notes that as variations in SGARA valuations are not included in total income, they are excluded from measures used to estimate indicators such
8 Extracted from the Productivity Commission’s web site at http://www.pc.gov.au/research/commissionresearch/gte0607
Chapter 3 — Measuring the State’s investment in Forestry
60
Forestry Tasmania
as return on assets or return on equity. (This is consistent with the approach adopted in our Report).
Five forestry GTEs reported a positive return on assets in 2006–07 ranging from 0.3 per cent for VicForests to 32.1 per cent for FPCWA. FPQ generated a negative return on assets of -38.4 per cent.
Only two of the six forestry GTEs achieved a return that exceeded the risk-free rate of return (5.8 per cent in 2006–07) on assets — FPCWA and Forestry SA.
Return on total equity for the sector (excluding FPQ) was 2.2 per cent in 2006–07.
On the whole, these entities did not perform well when compared to the government bond rate.
Any annual assessment of financial performance must be viewed with caution.
Comparison with peer organisations is useful but has limitations and should also be viewed with caution due to varying organisational structures, asset valuation practices and varying forest life cycles.
We concluded from our review of the Productivity Commission’s report that, on an industry comparative basis, it is difficult to draw any strong conclusions on Forestry’s relative rate of return performance.
3.6 Comparisons based on audit financial statements
We updated the Productivity Commission’s work by reviewing rates of return for the six publicly owned forestry businesses for financial periods post 30 June 2007 and similarly concluded, in general, that:
With some exceptions, rates of return achieved were below the government bond rate.
Operating returns on assets dropped markedly in 2007–08 declining still further in 2008–09.
Operating return on equity improved in 2007–08 but declined markedly in 2008–09.
Forestry’s return on assets and return on equity targets in its 2008–09 Corporate Plan of 1.67 per cent and 2.7 per cent were well below the government bond rate but reasonable when compared to its peer forestry entities.
Overall, we concluded that rate of comparative assessments of this nature were difficult due to the differing capital structures of each of these entities.
Chapter 3 — Measuring the State’s investment in Forestry
61
Forestry Tasmania
3.7 Risk free rate of return
This analysis, along with that conducted by the Productivity Commission, confirms our view that the best benchmark against which to compare Forestry’s financial performance, particularly over the longer term, is the government bond rate.
Our reference to the longer term is significant in view of the very long term life cycles of the various forests managed by these entities. Any annual assessment of financial performance must be viewed with caution.
3.8 Discussions with Forestry management
Discussions with management confirmed our view that setting ‘conventional’ rates of return for a forestry business can be problematic. Factors contributing to a lower rate of return could include:
Forestry’s assets are primarily made up of the forests, land, roads and associated buildings and equipment. However, the primary source of revenue comes from the forest assets. Forest assets are valued as the Present Net Worth, or, put another way, at the discounted value of projected future net cash flows from the existing forest stands. For Forestry, with rotations in their native forests of around 90 years, this can be approximated as the present value of an infinite stream of net revenues from the annual sustained yield of the forest. Consistent with accounting standards, the valuation model assumes that all of Forestry’s assets are a single cash generating unit.
Variations in discount rates, wood volumes, projected revenues and costs have significant impacts on the annual valuation of the forest assets.
Because forest asset values are based on the current crop over a single (90-year for native forests) rotation, none of the costs expended by Forestry on planning, creation or management of future crops or on the management of non-wood values is incorporated in the valuation.
Buildings are recorded at fair values but do not in their own right, generate revenues.
Land was previously recorded at deemed cost but, in its own right, generates no revenues resulting in this asset being recorded at nil with effect from 30 June 2010.
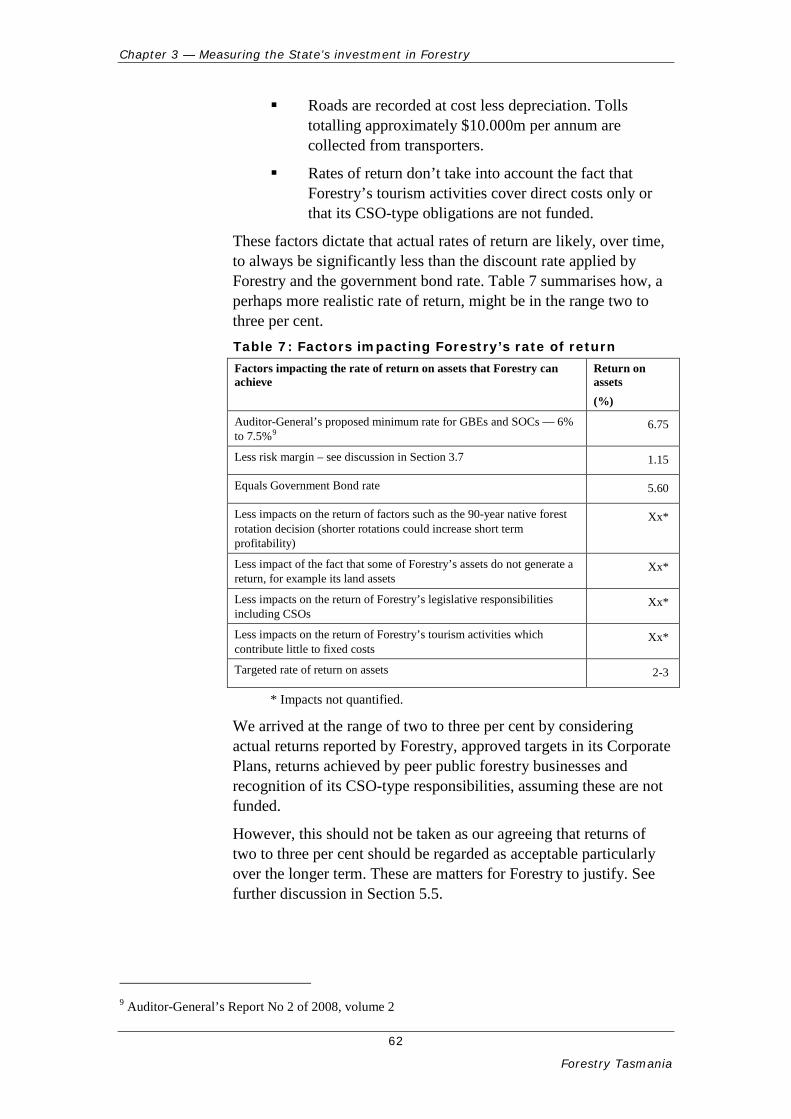
Chapter 3 — Measuring the State’s investment in Forestry
62
Forestry Tasmania
Roads are recorded at cost less depreciation. Tolls totalling approximately $10.000m per annum are collected from transporters.
Rates of return don’t take into account the fact that Forestry’s tourism activities cover direct costs only or that its CSO-type obligations are not funded.
These factors dictate that actual rates of return are likely, over time, to always be significantly less than the discount rate applied by Forestry and the government bond rate. Table 7 summarises how, a perhaps more realistic rate of return, might be in the range two to three per cent. Table 7: Factors impacting Forestry’s rate of return Factors impacting the rate of return on assets that Forestry can achieve
Return on assets (%)
Auditor-General’s proposed minimum rate for GBEs and SOCs — 6% to 7.5%9
6.75
Less risk margin – see discussion in Section 3.7 1.15
Equals Government Bond rate 5.60
Less impacts on the return of factors such as the 90-year native forest rotation decision (shorter rotations could increase short term profitability)
Xx*
Less impact of the fact that some of Forestry’s assets do not generate a return, for example its land assets
Xx*
Less impacts on the return of Forestry’s legislative responsibilities including CSOs
Xx*
Less impacts on the return of Forestry’s tourism activities which contribute little to fixed costs
Xx*
Targeted rate of return on assets 2-3
* Impacts not quantified.
We arrived at the range of two to three per cent by considering actual returns reported by Forestry, approved targets in its Corporate Plans, returns achieved by peer public forestry businesses and recognition of its CSO-type responsibilities, assuming these are not funded.
However, this should not be taken as our agreeing that returns of two to three per cent should be regarded as acceptable particularly over the longer term. These are matters for Forestry to justify. See further discussion in Section 5.5.
9 Auditor-General’s Report No 2 of 2008, volume 2
Chapter 3 — Measuring the State’s investment in Forestry
63
Forestry Tasmania
3.9 Rate of return applied by Forestry
As noted in Section 1.3.4, Forestry’s approved 2009–12 Corporate Plan included the following rates of return, namely the average earnings before interest and taxation expressed as:
a ratio of total assets of 1.67 per cent
a percentage of equity of 2.70 per cent.
In its assessment of Forestry’s Corporate Plan, Treasury noted:
Forestry has responsibility for optimising both the economic returns from its wood production activities and the benefits to the public and the state of the non-wood value of forests. This has the potential to undermine the business’s commercial focus and may need to be addressed in the future if Forestry’s financial performance is to improve10.
While noting that the rates of return in the Corporate Plan were approved, we concur with Treasury’s conclusion.
Recommendations 2 and 3 apply.
3.10 Alternative use and/or governance models
We asked ourselves:
Are there alternative uses of the forest that might generate higher sustainable returns and, if so, have these been explored?
Is there a better governance model that might lessen the tension between the requirement to manage the forests sustainably and to provide a commercial rate of return?
These questions are matters of government policy and therefore outside the scope of this Report. However, in our view, they are fundamental to any assessment of alternative options.
Also, regarding the first question, any assessment of potential sustainable alternative uses needs to consider at least the following:
existing returns generated by Forestry and the need to consider these in a long-term context
the need to continue supply to the sawlog industry
the CSOs currently provided and whether or not these need to continue — such as fire fighting capability for
10 Department of Treasury and Finance Corporate Plan Assessment 19 June 2009
Chapter 3 — Measuring the State’s investment in Forestry
64
Forestry Tasmania
Tasmania — and if so by whom? CSOs are addressed further in Chapter 5
the most appropriate structure either for Forestry or any entities into which it may be broken up or that may replace it (For example, it was suggested to us that Forestry be broken up into two entities — one managing the land and trees and another to manage harvesting and sales: neither option has been investigated by us)
the State entity that would take on the road construction role currently provided by Forestry and how will their construction be funded
the State entity that would manage Forestry’s various tourism ventures and how will this be funded
the State entity that would manage forests in reserves and how this will be funded relative to the costs currently incurred by Forestry. It may be possible, for example, to transfer Forestry’s reserves for management by Parks and Wildlife. Any exploration of this option will need to consider comparative costs and functions
the recommendations made in this Report
the sustainable economic returns provided to the State — these are discussed in Chapter 7 of this Report.
In the final dot point we use the word ‘sustainable’ in the context of sustainable development rather than just economically sustainable development and in doing so we define sustainable development as ‘meeting the needs of the present without compromising the ability of future generations to meet their own needs’11.
In any event, we repeat the point that the very long term nature of Forestry’s business makes annual assessments of performance difficult. Even the 16 years is used in this Report may be too short a time to properly evaluate financial performance.
3.11 Forestry’s tourism ventures
Regular references have been made in this Report to the financial performance of Forestry’s tourism ventures. Forestry commenced its commercial tourism activities in 2001–02. Table 8 summarises the results, ignoring inflation, for the period 2001–02 to 30 June 2010.
11 This definition is based on the 1987 Report of the World Commission on Environment and Development, commonly referred to as the Brundtland Report. Details obtained from a report of the Canadian Office of the Auditor-General titled OAG Managing Sustainable Development.
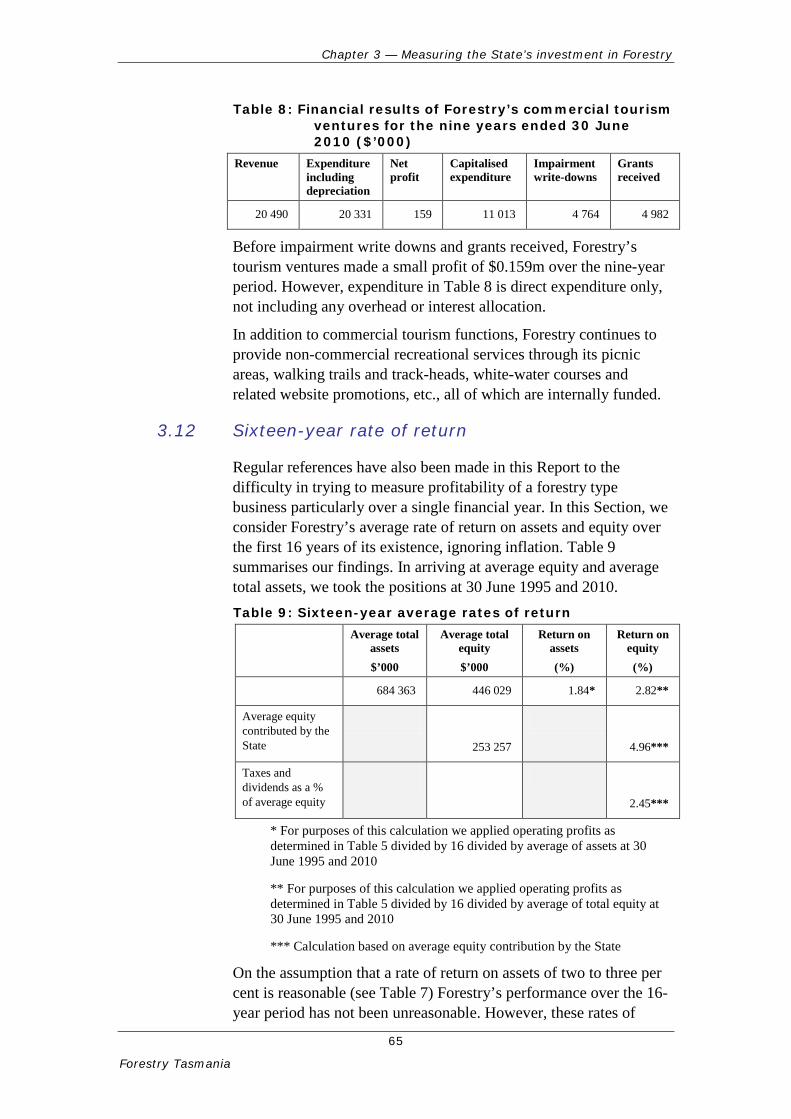
Chapter 3 — Measuring the State’s investment in Forestry
65
Forestry Tasmania
Table 8: Financial results of Forestry’s commercial tourism ventures for the nine years ended 30 June 2010 ($’000)
Revenue Expenditure including depreciation
Net profit
Capitalised expenditure
Impairment write-downs
Grants received
20 490 20 331 159 11 013 4 764 4 982
Before impairment write downs and grants received, Forestry’s tourism ventures made a small profit of $0.159m over the nine-year period. However, expenditure in Table 8 is direct expenditure only, not including any overhead or interest allocation.
In addition to commercial tourism functions, Forestry continues to provide non-commercial recreational services through its picnic areas, walking trails and track-heads, white-water courses and related website promotions, etc., all of which are internally funded.
3.12 Sixteen-year rate of return
Regular references have also been made in this Report to the difficulty in trying to measure profitability of a forestry type business particularly over a single financial year. In this Section, we consider Forestry’s average rate of return on assets and equity over the first 16 years of its existence, ignoring inflation. Table 9 summarises our findings. In arriving at average equity and average total assets, we took the positions at 30 June 1995 and 2010. Table 9: Sixteen-year average rates of return
Average total assets $’000
Average total equity $’000
Return on assets (%)
Return on equity (%)
684 363 446 029 1.84* 2.82**
Average equity contributed by the State
253 257
4.96***
Taxes and dividends as a % of average equity
2.45***
* For purposes of this calculation we applied operating profits as determined in Table 5 divided by 16 divided by average of assets at 30 June 1995 and 2010
** For purposes of this calculation we applied operating profits as determined in Table 5 divided by 16 divided by average of total equity at 30 June 1995 and 2010
*** Calculation based on average equity contribution by the State
On the assumption that a rate of return on assets of two to three per cent is reasonable (see Table 7) Forestry’s performance over the 16-year period has not been unreasonable. However, these rates of
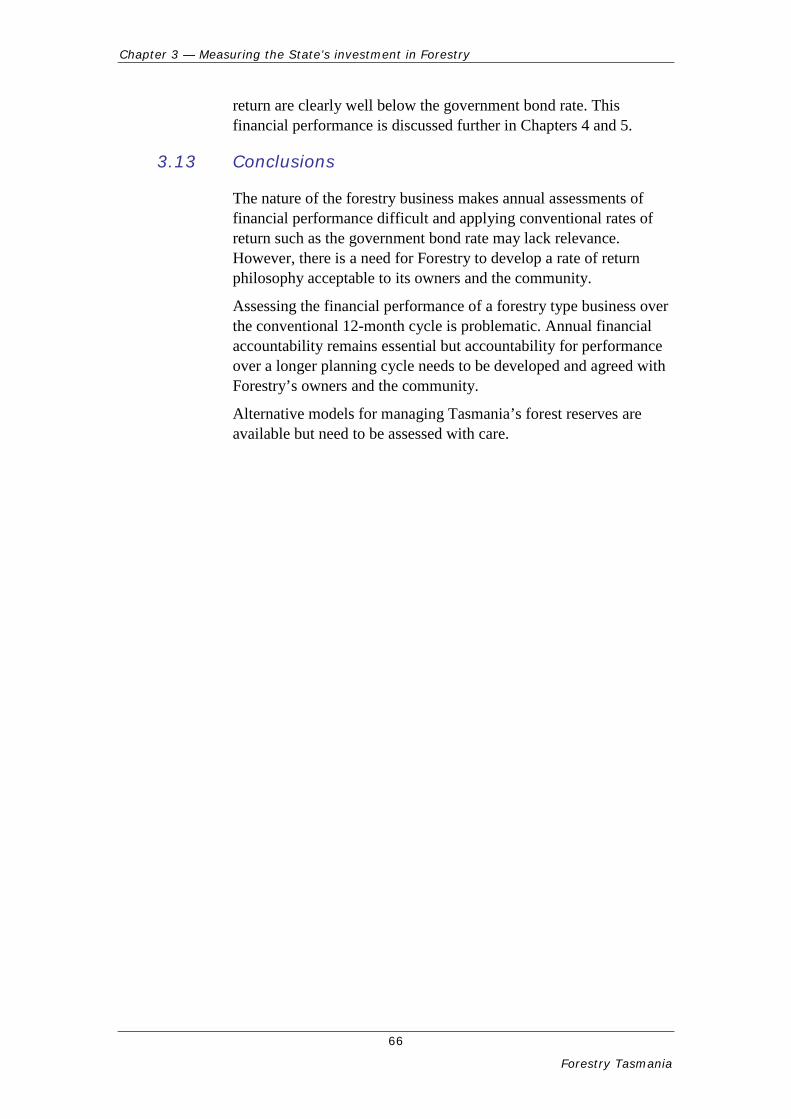
Chapter 3 — Measuring the State’s investment in Forestry
66
Forestry Tasmania
return are clearly well below the government bond rate. This financial performance is discussed further in Chapters 4 and 5.
3.13 Conclusions
The nature of the forestry business makes annual assessments of financial performance difficult and applying conventional rates of return such as the government bond rate may lack relevance. However, there is a need for Forestry to develop a rate of return philosophy acceptable to its owners and the community.
Assessing the financial performance of a forestry type business over the conventional 12-month cycle is problematic. Annual financial accountability remains essential but accountability for performance over a longer planning cycle needs to be developed and agreed with Forestry’s owners and the community.
Alternative models for managing Tasmania’s forest reserves are available but need to be assessed with care.
67
Forestry Tasmania
4 Financial performance
Chapter 4 — Financial performance
68
Forestry Tasmania
4 Financial performance
4.1 Background
As we developed our analysis, while recognising that various national and international economic factors impacted Forestry’s financial performance, we noted three reasonably distinct phases since its establishment on 1 July 1994:
pre-RFA in 1997–98, that is the period 1 July 1994 to 30 June 1998
post-RFA up until the global financial crisis (GFC), that is the period 1 July 1998 to 30 June 2007
the GFC period from 1 July 2007 to 30 June 2010.
We could have added a fourth period, that of the Asian financial crises in the 1997 to 1999 and 2004 to 2006 periods but ignored these to assist with simplifying reporting.
We also noted variations in profitability and cash flows over the period under review, variations in assets values, growing levels of debt, some new costs impacting financial performance, changes to the funding of CSO-type activities, introduction of obligations to pay local government rates, impacts of the sale of Forestry plantation assets and in the amounts of dividends and taxes paid. There were also changes to accounting standards.
Another factor impacting Forestry’s financial performance during this period was its increasing unfunded superannuation liabilities. This, along with other changes to balance sheet items, is explored further in Chapter 6 although any impact on operating performance is discussed here.
In this Chapter we consider Forestry’s operating financial performance by examining its operating profitability and operating cash flows based on its consolidated financial performance.
4.2 Accounting for superannuation related expenses and cost of trees sold
During the course of preparing this Report, two matters not previously considered were suggested to us. These are summarised here.
4.2.1 Superannuation related expenses
By superannuation related expenses we refer to costs other than actuarially assessed movements in the annually adjusted unfunded
Chapter 4 — Financial performance
69
Forestry Tasmania
defined benefit fund superannuation obligations. These costs are the net total of employer service costs, contributions tax, interest and returns on plan assets collectively referred to here as ‘superannuation expenses’.
With effect from 30 June 2006, which coincided with the introduction of International Financial Reporting Standards in Australia, Forestry did not report these superannuation expenses as ‘operating costs’ on the basis that they are outside their day to day operating control. In the period 1 July 2004 to 30 June 2010 (the 2004–05 financial period is included because in the 2005–06 financial statements comparative information was properly changed) the total superannuation expense was $46.515m.
In Table 10 later in this Chapter, we calculate that Forestry generated pre-tax operating profits over the 16-year period totalling $200.962m with profitability for the three years to 30 June 2010 and nine years to 30 June 2007 being $9.826m and $115.589m respectively. If the superannuation expense of $46.515m had been reported as an operating expense, the resulting pre tax operating profitability would have been:
Total $154.447m
Three years to 30 June 2010 (loss) $(14.596)m
Nine years to 30 June 2007 $93.496m.
In this Chapter, we applied Forestry’s approach to dealing with this expense although note its significant impact on any assessment of profitability.
4.2.2 Cost of sales argument
In a conventional manufacturing business reporting the costs to produce products sold is essential. Similar accounting practices apply to retail businesses such as Coles or Woolworths. The proposition was put to us that in a forestry business costs should be allocated to each tree harvested so that sales proceeds can be charged with the full cost of harvesting. This is problematic in particular where there were no costs incurred in acquiring the trees. Forestry does not acquire trees. Another difference when compared to a manufacturing or retail operation is that trees grow over time and in some cases they die or fall down.
However, costs are incurred in maintaining and growing trees, particularly in its plantations. These costs are either expensed or capitalised depending on their nature. One of Forestry’s highest costs relates to its harvesting and transportation activities with all such costs expensed.
Chapter 4 — Financial performance
70
Forestry Tasmania
Effectively, Forestry currently accounts for the costs associated with trees harvested, and their natural growth, by way of the annual revaluation of the trees, supported by their five-yearly wood reviews. Such annual revaluations can give rise to revenues or costs depending on various factors including economic as well as accounting factors.
Charged against these revaluations each year are costs incurred on plantation establishment with the total reported as a non-operating cost. Over the period of this review, pre-tax charges against profits, or in some years, pre-tax credits were:
- Four years to 30 June 1998 nil
- Nine years to 30 June 2007 credit $29.785m
- Three years to 30 June 2010 (expense) $(105.070)m
- Total $(75.285)m
In preparing this Chapter we have adopted Forestry’s practice.
4.2 Profitability
Table 10 summarises Forestry’s profitability over the period 1 July 1994 to 30 June 2010. This information is not CPI-adjusted. Column 1 covers the four-year period to 30 June 1998 (1997–98 was the first year of the RFA), Column 2 the nine-year period to 30 June 2007 and Column 3 the three-year period to 30 June 2010.
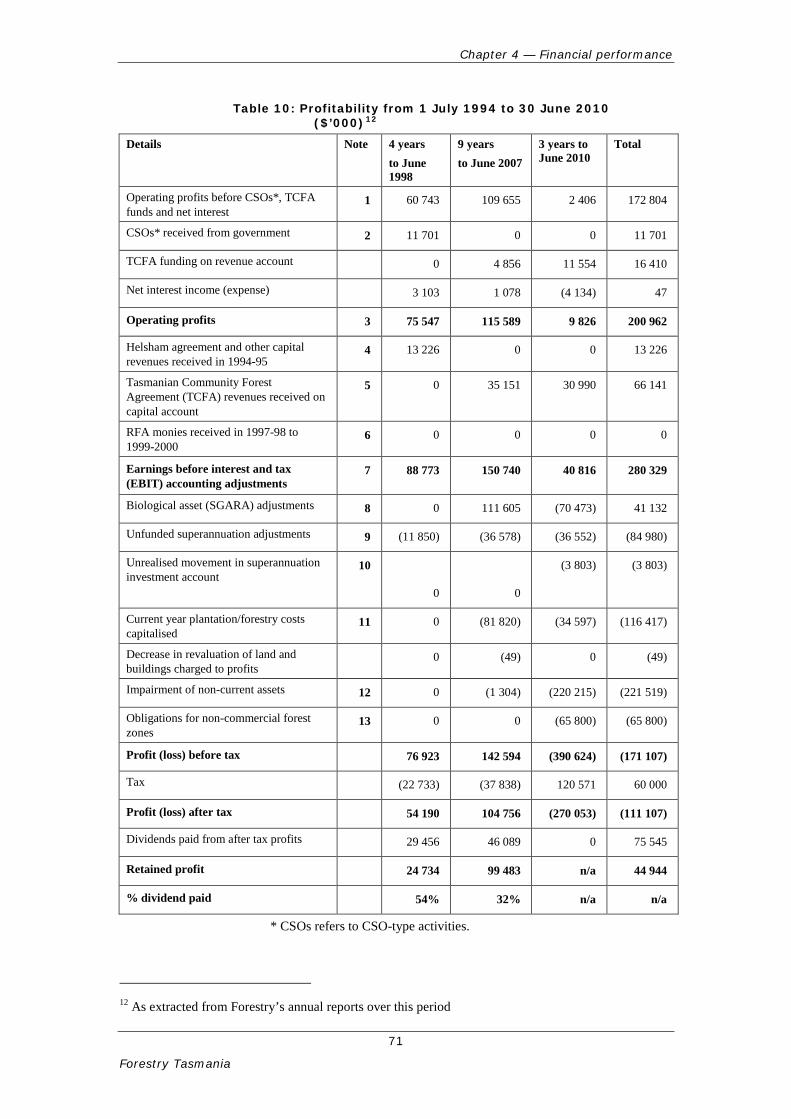
Chapter 4 — Financial performance
71
Forestry Tasmania
Table 10: Profitability from 1 July 1994 to 30 June 2010 ($’000)12
Details Note 4 years to June 1998
9 years to June 2007
3 years to June 2010
Total
Operating profits before CSOs*, TCFA funds and net interest
1 60 743 109 655 2 406 172 804
CSOs* received from government 2 11 701 0 0 11 701
TCFA funding on revenue account 0 4 856 11 554 16 410
Net interest income (expense) 3 103 1 078 (4 134) 47
Operating profits 3 75 547 115 589 9 826 200 962
Helsham agreement and other capital revenues received in 1994-95
4 13 226 0 0 13 226
Tasmanian Community Forest Agreement (TCFA) revenues received on capital account
5 0 35 151 30 990 66 141
RFA monies received in 1997-98 to 1999-2000
6 0 0 0 0
Earnings before interest and tax (EBIT) accounting adjustments
7 88 773 150 740 40 816 280 329
Biological asset (SGARA) adjustments 8 0 111 605 (70 473) 41 132
Unfunded superannuation adjustments 9 (11 850) (36 578) (36 552) (84 980)
Unrealised movement in superannuation investment account
10
0
0
(3 803) (3 803)
Current year plantation/forestry costs capitalised
11 0 (81 820) (34 597) (116 417)
Decrease in revaluation of land and buildings charged to profits
0 (49) 0 (49)
Impairment of non-current assets 12 0 (1 304) (220 215) (221 519)
Obligations for non-commercial forest zones
13 0 0 (65 800) (65 800)
Profit (loss) before tax 76 923 142 594 (390 624) (171 107)
Tax (22 733) (37 838) 120 571 60 000
Profit (loss) after tax 54 190 104 756 (270 053) (111 107)
Dividends paid from after tax profits 29 456 46 089 0 75 545
Retained profit 24 734 99 483 n/a 44 944
% dividend paid 54% 32% n/a n/a
* CSOs refers to CSO-type activities.
12 As extracted from Forestry’s annual reports over this period
Chapter 4 — Financial performance
72
Forestry Tasmania
Notes:
1. Operating profits is net profit before interest and tax and before contributions to CSOs and TCFA monies received but include Forestry’s actual earnings from its softwood activities including its 50 per cent share in the GMO joint venture.
2. CSOs averaged $2.925m in each of the four years ended 30 June 1998. Nil was received thereafter although Forestry continued to provide CSOs.
3. The amount of $200.962m lines up with the amount noted in Table 5 in Section 2.5.2.
4. The Helsham and other capital receipts were brought to account as abnormal revenues in 1994–95.
5. TCFA monies received to fund capital expenditure and plantation development therefore brought to account as revenue but after striking the operating profit.
6. RFA monies, which totalled $71.000m, were received over the three-year period 1997–98 to 1999–2000. This transaction did not impact Forestry’s income statement. It was accounted for as an increase in cash and investments and a reduction in the forest estate asset. Funds received were invested in plantation development.
7. EBIT is prior to bringing to account fair value movements (unfunded superannuation and forest valuation adjustments).
8. SGARA refers to the impact on net profit before tax of annual revaluations of Forestry’s plantations in accordance with accounting standards.
9. Unfunded superannuation adjustments arise from the annual actuarial reassessment of Forestry’s liability for employee superannuation entitlements.
10. Forestry invests monies aimed at funding, over time, its obligations for unfunded employee superannuation entitlements.
11. Current year plantation costs capitalised are offset in Forestry’s annual financial statements against the SGARA adjustment.
12. The impairment up to 30 June 2007 in the main related to Forestry’s tourism investments. The impairment in the period July 2007 to June 2010 in the main related to the revised asset revaluation approaches discussed in Table 20.
13. The obligation for Forestry’s responsibility to manage non-commercial forest zones all related to the 2009–10 financial year and is also discussed in Table 20.
Chapter 4 — Financial performance
73
Forestry Tasmania
The discussion which follows focuses on the Operating profits identified in Table 10.
4.3.1 Operating performance
In Section 2.5.2, we discuss Forestry’s financial performance at the operating profit level over the full 16 years of this financial assessment. Table 10 highlights the difficulties Forestry experienced in the most recent three years of its operations. Table 10 also highlights that, on average, profitability declined since about 1997–98. Average operating profits in relevant periods were:
Fours years to 30 June 1998 $18.887m
Nine years to 30 June 2007 $12.843m
13 years to 30 June 2007 $14.703m
Three years to 30 June 2010 $ 6.275m
16 years to 30 June 2010 $12.560m.
Reasons for this decline in average operating profitability included:
The withdrawal of CSO-type funding but on-going expenditure on CSO-type activities. This withdrawal was a policy decision of government and is not questioned. However, the cumulative implication for Forestry’s profitability and cash flow were significant. Assuming that CSOs had continued at the level of $3.000m per annum throughout the 16-year period, profitability and operating cash flows before taxes and dividends would have been $30.000m greater. It is acknowledged that had this funding continued, Forestry may have paid higher taxes and dividends. CSOs are discussed further in Chapter 5.
The sale by Forestry of its softwood plantations in return for a 50 per cent interest in the GMO joint venture resulted in lowering its net profits before taxation and dividends by approximately $30.000m. In Section 2.3.4, we noted the decision to sell its softwood plantation assets in 1999–2000 may have resulted in Forestry foregoing additional net earnings before taxation in the range $15.000m to $30.000m over the period 1999–2000 to 2009–10. This is discussed further in Section 4.3.2.2.
The imposition of local government rating on government businesses from 2003–04. In the six years ended 30 June 2010, local government rates paid by
Chapter 4 — Financial performance
74
Forestry Tasmania
Forestry totalled $13.542m averaging $2.257m per annum.
Decline in sales particularly since 2003–04 which was not matched by decreasing costs. Two factors caused this – the Asian crisis over the 2004–05 period and the GFC over the post-2007 period.
Increases in net interest costs in particular since 2001–02 when Forestry commenced its borrowing programs. See further discussion in Section 4.3.2.1.
4.3.2 Discussion on some specific areas impacting profitability
In this Section, we provide greater analysis of aspects of Forestry’s financial operating performance.
4.3.2.1 Increases in Interest expenses
A major contributor to the decline in Forestry’s net profit before tax was higher financing costs which increased considerably post-1998 as its borrowings grew, particularly since 2002. The average negative annual impact on profitability since July 2001 was $0.930m.
4.3.2.2 GMO joint venture activities
The decision in 1999–2000 to divest Forestry’s softwood plantation activities in return for a 50 per cent share in the joint venture with GMO effectively halved profits generated from this source because the bulk of the proceeds from the sale ($40.000m out of $49.968m) was paid to government as a return of equity.
During the 11-year period 1999–2000 to 2009–10, Forestry averaged an annual net profit from the joint venture with GMO of $2.832m per annum with the annual net profit ranging from a high of $5.182m in 2001–02 to a low of $0.839m in 2007–08. On the assumption that as a 100 per cent owner of the joint venture plantations Forestry may have doubled its earnings, over the 11 years in question, Forestry may have lost before tax earnings of between $15.000m to $30.000m.
4.3.3 Any impacts on profitability of the RFA?
As part of this audit we asked ourselves, ‘did the RFA have any negative consequences for Forestry’s long-term profitability particularly in view of the increase in the number of hectares transferred to reserves?’
Chapter 4 — Financial performance
75
Forestry Tasmania
This has proven difficult to quantify although we note the following:
The RFA had the impact of reducing Forestry’s reserves by 193 000 hectares. Despite this, with the exception of the impact on available veneer logs, the withdrawal of timber producing land at that time probably did not have an immediate major effect on revenue. The veneer logs exception relates to the supply of these logs to the high value sliced veneer industry which was reliant on high quality forest stands largely withdrawn from timber production. The loss of access to these stands had a direct impact on Forestry’s revenue but was not quantified.
It is also likely that the loss of the 193 000 hectares may have affected Forestry’s fixed costs and also impacted costs associated with investments in roads requiring construction of additional new roads. However, we have not attempted to quantify either the short term or long term profitability and sustainability impacts.
In addition, the RFA resulted in Forestry having to manage 94 000 hectares of previously productive forest but now as reserves.
Recommendation 8 applies.
4.3.4 Tasmanian Community Forestry Agreement (TCFA)
An outcome of the TCFA, entered into between the State and Commonwealth governments in 2004–05, was further investment in plantations as compensation, or offset, for the withdrawal of forests from production. The intent was to seek to mitigate the effects of the withdrawal on future production, and therefore in effect, Forestry’s future revenues and balance sheet asset values. Given the plantation life-cycle of 20 to 25 years, Forestry currently finds itself in a period of capital investment aimed at placing itself in a position of having more productive plantation assets in the future. The plantations are being established, but have not reached significant maturity and hence production. Any transition has been an acceleration of an ongoing trend from older native forests to younger native forests as a result of area withdrawals.
Also, the TCFA resulted in the transfer of 150 000 hectares into formal and informal reserves and a reduction by 165 000 hectares in productive forest (refer Table 3).
Cash flows received under the TCFA facilitated significant investment in plantation establishment and development with
Chapter 4 — Financial performance
76
Forestry Tasmania
consequent revenue streams, and therefore profits or loss impacts, still to be realised.
Chapter 4 — Financial performance
77
Forestry Tasmania
4.3.5 Possible adjusted EBIT before accounting adjustments
On the assumption that CSOs might have continued to be funded at an average of $3.000m per annum, local government rates were not required to be paid and Forestry had not sold its softwood plantations, an adjusted EBIT for Forestry might have been as recorded in Table 11. The adjustment in Table 11 relates to the 12 years from 1 July 1998 only, because prior to this period some CSO-type activities were funded, the local government rates impact commenced from 2003–04 and the softwood interests were sold in 1999–2000. Table 11: Possible adjusted operating profit — 12 years to
June 2010 Total
$’000 Per annum $’000
Operating profits as reported in Table 10 125 415 10 451
CSO-type funding – assumes at least $3.000m per annum for 12 years
36 000 3 000
Local government rates (6 years) 13 542 2 257
Net softwood revenues foregone (11 years) 15 000 1 364
Adjusted EBIT 189 957 17 072
Actual EBIT — 1 July 1994 to 30 June 1998 75 547 18 887
Forestry could have earned an average annual operating profit of $17.072m, comparable to that earned in the first four years of its existence of $18.887m. The possible improvement in operating profits may have had the effect of Forestry requiring reduced borrowings over the 12-year period.
This assessment is before taxation and dividends. We are advised by Treasury that the decision to withdraw CSO-type funding in 1998 recognised that Forestry’s profitability, and therefore dividend returns, might drop which was the case.
In any event, Table 11 illustrates the impact on Forestry’s post-1998 profitability of decisions beyond its control. Chapter 5 includes further discussion about the financial impacts of CSO expenditure.
4.4 Cash flows
Our summary analysis of Forestry’s cash flows covers the full 16-year period from 1 July 1994 to 30 June 2010. Table 12 summarises these cash flows again for the three distinct financial periods used in Table 10.
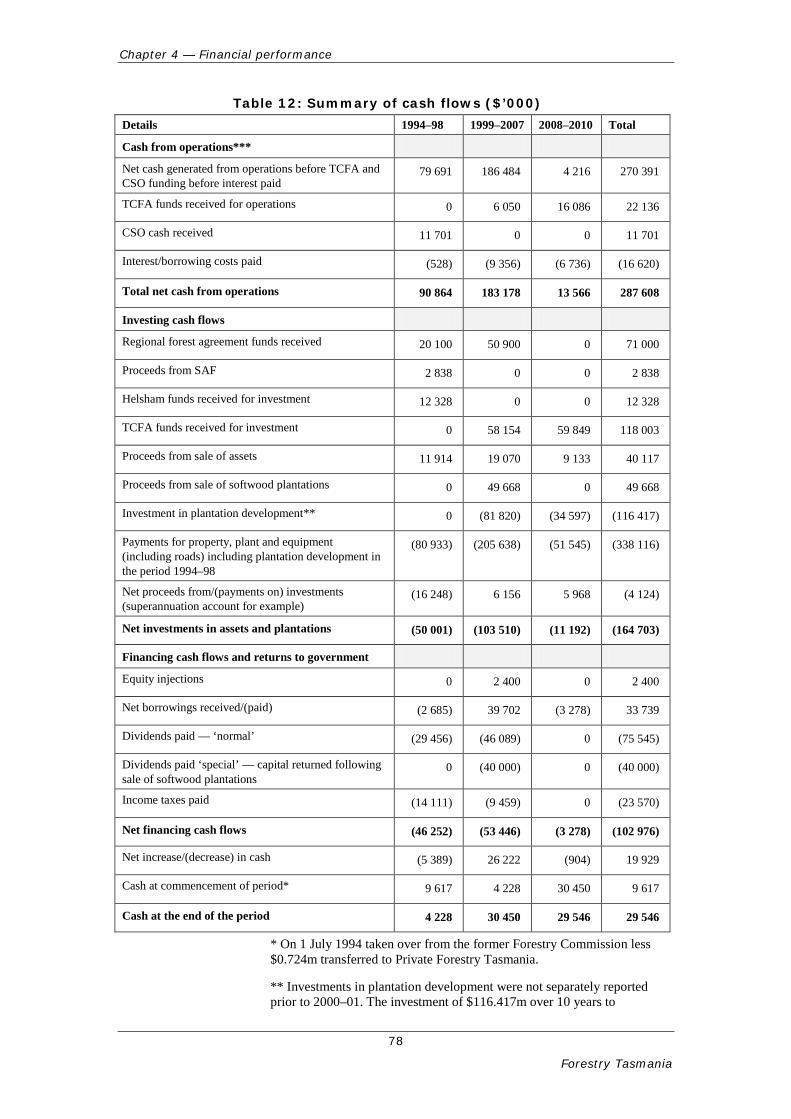
Chapter 4 — Financial performance
78
Forestry Tasmania
Table 12: Summary of cash flows ($’000) Details 1994–98 1999–2007 2008–2010 Total
Cash from operations***
Net cash generated from operations before TCFA and CSO funding before interest paid
79 691 186 484 4 216 270 391
TCFA funds received for operations 0 6 050 16 086 22 136
CSO cash received 11 701 0 0 11 701
Interest/borrowing costs paid (528) (9 356) (6 736) (16 620)
Total net cash from operations 90 864 183 178 13 566 287 608
Investing cash flows
Regional forest agreement funds received 20 100 50 900 0 71 000
Proceeds from SAF 2 838 0 0 2 838
Helsham funds received for investment 12 328 0 0 12 328
TCFA funds received for investment 0 58 154 59 849 118 003
Proceeds from sale of assets 11 914 19 070 9 133 40 117
Proceeds from sale of softwood plantations 0 49 668 0 49 668
Investment in plantation development** 0 (81 820) (34 597) (116 417)
Payments for property, plant and equipment (including roads) including plantation development in the period 1994–98
(80 933) (205 638) (51 545) (338 116)
Net proceeds from/(payments on) investments (superannuation account for example)
(16 248) 6 156 5 968 (4 124)
Net investments in assets and plantations (50 001) (103 510) (11 192) (164 703)
Financing cash flows and returns to government
Equity injections 0 2 400 0 2 400
Net borrowings received/(paid) (2 685) 39 702 (3 278) 33 739
Dividends paid — ‘normal’ (29 456) (46 089) 0 (75 545)
Dividends paid ‘special’ — capital returned following sale of softwood plantations
0 (40 000) 0 (40 000)
Income taxes paid (14 111) (9 459) 0 (23 570)
Net financing cash flows (46 252) (53 446) (3 278) (102 976)
Net increase/(decrease) in cash (5 389) 26 222 (904) 19 929
Cash at commencement of period* 9 617 4 228 30 450 9 617
Cash at the end of the period 4 228 30 450 29 546 29 546
* On 1 July 1994 taken over from the former Forestry Commission less $0.724m transferred to Private Forestry Tasmania.
** Investments in plantation development were not separately reported prior to 2000–01. The investment of $116.417m over 10 years to
Chapter 4 — Financial performance
79
Forestry Tasmania
30 June 2010 was about $11.500m per annum, a period when significant funding was provided via the RFA and TCFA.
*** We have not separately identified in Table 11 CSO expenditure by Forestry in managing forest reserves.
4.4.1 Operating cash flows
We would expect operating cash flows to at least exceed net non-cash items charged to operating profits which would normally include:
Depreciation and amortisation — so that in cash terms Forestry was able to re-invest in infrastructure and plantation assets amounts at least equivalent to average annual deprecation and amortisation charges. Over the 16-year period depreciation and amortisation totalled $137.633m while net investments in plantation development, property, plant and equipment totalled $414.416m. This higher level of investment in assets was facilitated by Helsham, RFA and TCFA funding as well as cash from operations and borrowings.
Increases in trade debtors. Such increases will negatively impact cash flows because this means that Forestry was providing increased credit to its customers. Trade debtors increased by $30.934m between 30 June 1994 and 30 June 2010.
Increases in trade creditors and accrued expenses. Such increases will benefit cash flows because they mean that Forestry’s suppliers were providing higher levels of credit. Trade creditors and accrued expenses increased by $19.148m between 30 June 1994 and 30 June 2010.
Increases in provisions for employee entitlements other than movements in unfunded superannuation provisions, that is, movements in provisions for annual and long service leave. These provisions decreased by $4.029m between 30 June 1994 and 30 June 2010.
In summary, we would therefore expect to find that over the 16-year period, cash generated from operations would exceed the net total of these four items plus operating profits before taxes paid for the period of $200.962m (see Table 10) which is approximately $322.780m. Actual operating cash flows were, as recorded in Table 12, $287.608m resulting in a difference of more than $35.000m. Further analysis indicates this was caused by:
Chapter 4 — Financial performance
80
Forestry Tasmania
other timing differences — in the main the inclusion in operating profits of Forestry’s share of joint venture activities not received in cash
asset impairments during the period such as the decision by Forestry to impair its investment in the Dismal Swamp tourism venture
finance lease costs capitalised not paid in cash
interest on earned on superannuation investments capitalised not received in cash
pension and other retirement payments to staff employed under Forestry’s defined benefit arrangements — these payments totalled more than $56.000m over the 16-year period (see Table 16).
Forestry generated average operating annual cash flows in excess of $18.000m over the 16-year period ended 30 June 2010. However, operating cash flows were much higher in earlier periods as follows:
average in the four years to June 1998 — $22.716m
average in the nine years to June 2007 — $20.353m
average in the three years to June 2010 — $4.522m.
This significant decline was principally due to:
cessation of CSO funding
payment of rates
sale of Forestry’s softwood plantations in return for a 50 per cent interest in the joint venture with GMO
higher finance costs incurred
investment in loss making tourism ventures
allowing customers higher levels of credit. This is confirmed by our analysis that Forestry was providing lengthier credit to its customers while paying its suppliers promptly. This conclusion is supported by the fact that average days taken to collect receivables increased from 41 days in 2006–07 to 65 days in 2008–09 and to 85 days in 2009–10 while the average days taken to pay suppliers remained steady at around 40 days in each of the past three years
lower overall profitability — see Table 10 and discussion in Section 4.3.
Chapter 4 — Financial performance
81
Forestry Tasmania
4.4.2 Investing cash flows
Forestry invested in excess of $450.000m in property, plant and equipment, the bulk of which was on road systems and plantation development. These investments were funded from operating cash flows, Helsham, RFA and TCFA funds, debt and from the $9.668m retained on the sale of its softwood activities.
4.4.3 Cash returns to Government
Over the 16-year period a total of $139.115m was returned to the State government in the form of taxes and dividends although no taxes were paid since 2005–06 and the last dividend paid was $1.297m in 2006–07.
4.4.4 Forestry’s cash position at 30 June 2010
Cash on hand at 30 June 2010 totalled $29.546m, most of which, we estimate, represented unspent TCFA funds. We estimate this as follows:
Total TCFA funds received to 30 June 2010 $140.137m
Acquitted at 30 June 2010 $118.123m
Unexpended $ 22.014m
While Forestry’s cash position worsened considerably over the 16-year period under review, a significant contributor to this was Forestry’s ongoing investment in CSOs despite these no longer being funded. This is considered in greater detail in Chapter 5.
Recommendation 9
We recommend that the Forestry Board take action to improve a deteriorating cash flow position.
4.5 Long-term nature of Forestry’s business
We indicated earlier in this Report — see Section 1.4 — that Forestry manages its native forestry estate on timeframes and forest management regimes that maximise the long-term production of high quality sawlogs. For native forests this averages around 90 years.
This long-term nature of Forestry’s business must be borne in mind when assessing short-term, such as annual, financial performance. However, recent performance, both in terms of profitability or a capacity to generate cash flows, has been poor.
Chapter 4 — Financial performance
82
Forestry Tasmania
4.6 Conclusions
4.6.1 General conclusions from Chapter 4
Forestry’s average annual operating profits fluctuated over the 16-year review period. The 16-year average was $12.560m with a high of $18.887m in the four years to 30 June 1998 and a low of $6.275m in the three years to 30 June 2010.
The decline in average operating profitability was caused by various factors including withdrawal of CSO-type funding, the imposition of local government rating on government businesses from 2003–04, the sale of its softwood plantations, increases in net interest costs particularly since 2001–02, decline in sales particularly since 2003–04, not matched by decreasing costs, caused first by the economic crisis in Asia and then the GFC.
The financial impact of increasing forests in reserves as a result of the RFA has not been quantified although is understood not to be significant in the short term other than perhaps on fixed costs.
Forestry’s average annual operating cash flows fluctuated over the 16-year review period. The 16-year average was $17.975m with a high of $22.716m in the four years to 30 June 1998 and a low of $4.522m in the three years to 30 June 2010.
Forestry invested more than $450.000m in assets and plantation development over the period funded from a mix of cash generated from operations ($287.608m), Helsham, RFA and TCFA funding ($223.465m) and net asset sales ($49.785m). It paid taxes of $23.570m and dividends (including the $40.000m return of equity) of $115.545m.
Returns from investment of Helsham, RFA and TCFA funds have still to be realised.
By 30 June 2010 Forestry was increasingly reliant on TCFA monies to manage its cash flows. This source of funding has now ceased and at 30 June 2010 Forestry still had to acquit $22.014m of TCFA funding received. Action is required by Forestry management to address what was at 30 June 2010 a difficult cash flow situation.
4.6.2 Conclusions against our audit objective
The Introduction to this Report noted one of our audit objectives as ‘assessing the reasonableness of Forestry’s profitability, focussing on cash flows, and associated returns to the State government over time’.
Chapter 4 — Financial performance
83
Forestry Tasmania
Subject to impacts on operating profitability and operating cash flows of the discussion about CSOs in Chapter 5, we concluded against this objective that Forestry’s financial performance:
resulted in an operating profit for the 16 years of $200.962m and operating cash flows of $287.608m from which it paid taxes and dividends of $99.115m
did not meet conventional benchmarks such as the government bond rate
varied significantly over time with the final three years to 30 June 2010 being poor.
We also concluded it is essential that Forestry make an assessment of the long-term impacts on its profitability of the RFA and TCFA.
However, had Forestry accounted for superannuation expenses referred to in Section 4.2.1 and Forest valuation adjustments referred to in Section 4.2.2 as operating costs, Forestry’s operating profit for the 16-year period would have been $79.162m instead of $200.962m.
This page left blank intentionally
5 Community service obligations
Chapter 5 — Community service obligations
85
Forestry Tasmania
5 Community service obligations
5.1 Background
In 1994, Forestry was established as a government business enterprise. While GBEs have to operate on a commercial basis, they are often also subject to community service obligations (CSOs) that form a significant component of government’s social policies. In general, CSOs are goods or services provided at the direction of government, which could not be justified solely on commercial grounds. In Forestry’s case, some CSO-type costs were incurred to meet its requirement to manage its forests in a sustainable long-term manner, for example, expenditure on research.
In addition, and as indicated in the Appendix to this Report, Forestry incurs CSO-type costs in managing its non-commercial forest zones which were quantified for the first time at 30 June 2010.
Between 1994–95 and 1997–98 — the last year in which CSO-type funding was provided — Forestry received government funding, that averaged $2.925m per year, for its Conservation and Community Services Program (CCSP). However, this was a specific program and at no stage has any funding been provided to Forestry for CSOs as defined in the Forestry Act. This is explored further in sections 5.3 and 5.4.
Although separate funding ceased after 1997–98, Forestry has continued to internally record some amounts expended on CSOs.
In Section 4.3.5, we discuss financial performance in terms of adjusted profit and the impact on operating cash flows of CSO-type costs funded up to June 1998 but not thereafter.
5.2 Forestry’s legislative responsibilities regarding CSOs
5.2.1 GBE Act
Part 9 of the GBE Act contains specific provisions regarding CSOs. The following are relevant to a discussion about them:
5.2.1.1 Application by a GBE Board
Section 60 enables the board of a GBE, through their Portfolio Minister, to make application to the Treasurer for declaration that a function performed, service provided or concession allowed, or proposed to be performed, provided or allowed, by a Government Business Enterprise is a CSO.
Chapter 5 — Community service obligations
86
Forestry Tasmania
The Portfolio Minister must not agree to the request of a board unless he or she is satisfied that performing, providing or allowing the function, service or concession which is the subject of the request is or will be a net cost to the GBE.
The conditions about which the Treasurer must be satisfied prior to making a declaration.
It establishes the costing basis to be applied to the CSOs.
The method and basis for funding, in whole or in part, any declared CSO must be determined by the Treasurer and must be consistent with the Treasurer’s Instructions (TIs).
The Treasurer must review annually the costing basis and the method and basis on which a CSO is funded.
The Treasurer may amend or revoke a CSO declaration.
5.2.1.2 Joint direction
The Portfolio Minister and Treasurer, jointly, may give a direction to a GBE to perform, provide or allow a function, service or concession that they are satisfied would not be performed, provided or allowed if the GBE were a business in the private sector acting in accordance with sound commercial practice.
5.2.2 Forestry Act
The specific requirements of section 10(1) ‘Additional functions and powers’ are:
(a) the promotion and encouragement of the use of State forests for purposes other than wood production, including in particular –
(i) the conservation of flora and fauna; and
(ii) the conservation of landforms; and
(iii) the conservation of cultural heritage; and
(iv) the care of the environment including scenery; and
(v) recreation; and
(vi) in the case of multiple use forest land, the exploration and development of mineral resources;
Chapter 5 — Community service obligations
87
Forestry Tasmania
(b) the provision to the public of information and educational programmes on sustainable forest management;
(c) the maintenance of the Register of Multiple Use Forest Land under section 17;
(d) the management of forest reserves;
(e) the provision and maintenance of forest roads and other facilities for public access to and through State forest;
(f) the provision and maintenance of recreation and public information facilities.
5.2.3 Requirements of the Treasurer’s Instructions (TIs)
Section 115 of the GBE Act requires GBEs to comply with GBE TIs. There are two GBE-specific TIs relevant to CSOs.
5.2.3.1 GBE 09–60–01 — Application for Community Service Obligation
The purpose of this TI is to ensure that the appropriate information, facilitating an informed decision by the Portfolio and Stakeholder Ministers, is provided by a Board when submitting an application for declaration of a CSO. Information to be provided includes why the potential CSO would not have been performed, provided or allowed if the GBE were a business in the private sector acting in accordance with sound commercial practice.
5.2.3.2 GBE 13–114–04 — Community Service Obligations
The purpose of this TI is to provide a CSO policy, and implementation guidelines, for GBEs. Its aim is to ensure that the Government's economic, social and other objectives are achieved without impacting on the commercial performance of GBEs and to improve the transparency, equity and efficiency of CSO service delivery.
The TI notes:
CSOs are presently funded internally by GBEs through cross subsidisation, resulting in distorted efficiency and equity effects and a lack of funding transparency. The lack of funding transparency means benefits are provided without scrutiny by either Government or the Parliament and are directed to consumers who are unaware of the true cost of service delivery.
Chapter 5 — Community service obligations
88
Forestry Tasmania
In essence, existing CSOs differ from other Government outlays because they are not subjected to the Budget process and are not subjected to the scrutiny normally applied to the outputs funded through annual appropriations from the Consolidated Fund. There is currently no Minister accountable for the outcomes of CSOs.
Regarding the need for transparency, we note that Forestry included in some recent annual reports unaudited details of some of the CSOs it provides and in its 30 June 2010 financial report it included, for the first time quantification of its CSOs as these relate to its non-commercial forest zone obligations.
5.2.4 Forestry’s position
In order to satisfy the requirements specified in section 10(1) of the Forestry Act, Forestry management considers that it is required to conduct a range of CSO-type activities including13:
conservation of flora, fauna, land forms and cultural heritage
management of forest reserves for conservation including costs related to pest, disease and fire control and weed management activities
provision and maintenance of forest roads and other facilities for public access in productive and non-productive forests for recreation and tourism, including walking tracks, picnic sites and other related infrastructure
provision of public information and education programs
provision of fire protection measures in accordance with the State Fire Management protocol
assistance to a range of industry economic development activities that are beyond Forestry’s direct commercial mandate and which provide the basis for value-added benefits for the State.
These activities are in addition to the requirement that Forestry manage formal reserves and special timber zones.
Costs incurred in undertaking these activities reduce Forestry’s profits. Such costs were quantified to an extent — see Table 14.
5.3 Forestry’s statutory as against contractual obligations
13 Page 52 of Forestry Tasmania’s annual 2006 report
Chapter 5 — Community service obligations
89
Forestry Tasmania
While conducting this audit we were provided with copy of a service contract (the Contract) entered into between the then Ministers for the Environment and for Forests in September 1996. The Contract made specific reference to additional functions and powers prescribed by section 10(1) of the Forestry Act referring to these as ‘functions are described as Community Service Obligations (CSOs)’.
While no reference was made to section 10(2) we regard it as relevant in the context as to whether or not functions referred to in section 10(1) are ‘discretionary’ or not (our emphasis by underlining):
(2) Without limiting the purposes for which that portion of the funds of the corporation consisting of money provided by Parliament may be used, the costs and expenses incurred by the corporation in the performance and exercise of the functions and powers specified in subsection (1) are to be paid out of money provided by Parliament for the purpose.
The contract goes on to note that (again, our emphasis by underlining)
These functions are not obligations but rather are discretionary. However, the performance of these functions on State forest remains, by operation of the Act, the responsibility of Forestry Tasmania, regardless of the delivering authority. The services outlined within this Contract for Services document represent a CSO program, consistent with statutory requirements, to be delivered on State forest by Forestry Tasmania in 1996–97. …. Forestry Tasmania will deliver the CSO services outlined … for the sum of $2.572m.
In summary therefore, as far as the funders were concerned in 1996–97, the functions imposed on Forestry by section 10(1) were discretionary and, at least in 1996–97, they were funded as a CSO to the extent of $2.572m.
However, our interpretation of section 10(1), confirmed by the underlined sections of the contract referred to above, is that Parliament, by including section 10(1) in the Forestry Act, intended that Forestry should carry out these functions. Therefore, the exercise of these functions by Forestry is not discretionary.
5.4 Have CSOs ever been funded?
Inquiries were made as to whether or not Forestry had ever been funded for CSOs.
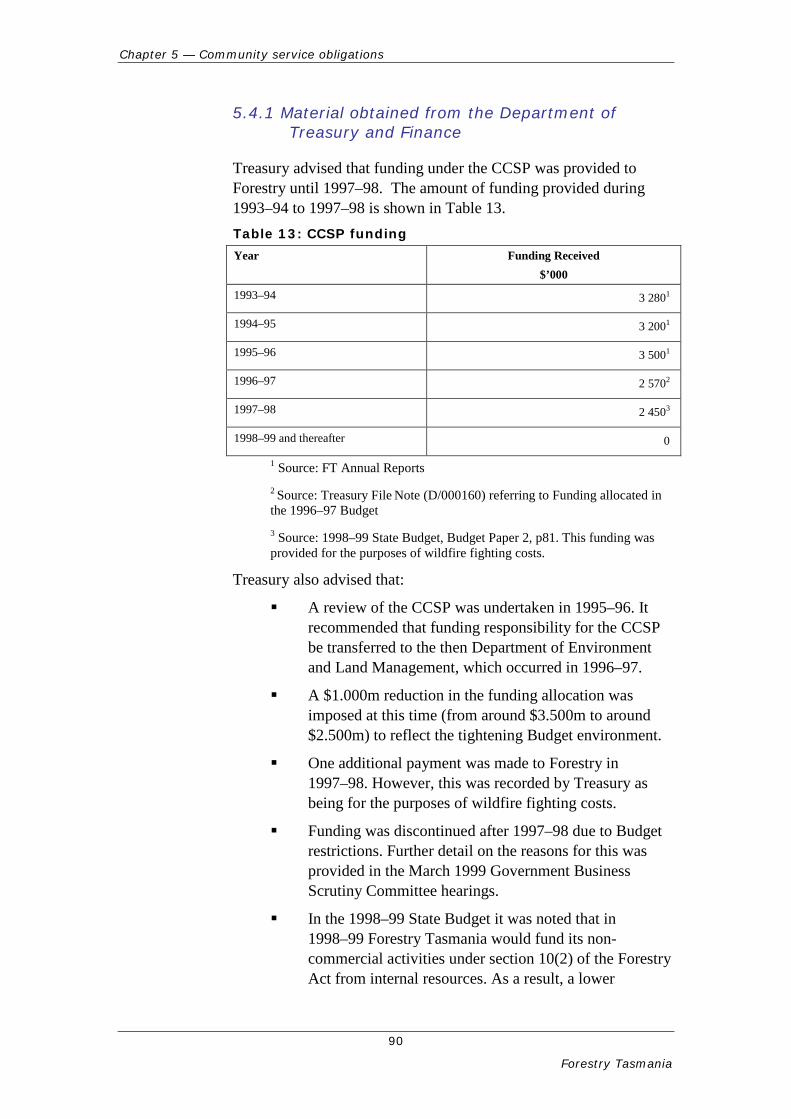
Chapter 5 — Community service obligations
90
Forestry Tasmania
5.4.1 Material obtained from the Department of Treasury and Finance
Treasury advised that funding under the CCSP was provided to Forestry until 1997–98. The amount of funding provided during 1993–94 to 1997–98 is shown in Table 13. Table 13: CCSP funding Year Funding Received
$’000
1993–94 3 2801
1994–95 3 2001
1995–96 3 5001
1996–97 2 5702
1997–98 2 4503
1998–99 and thereafter 0
1 Source: FT Annual Reports 2 Source: Treasury File Note (D/000160) referring to Funding allocated in the 1996–97 Budget 3 Source: 1998–99 State Budget, Budget Paper 2, p81. This funding was provided for the purposes of wildfire fighting costs.
Treasury also advised that:
A review of the CCSP was undertaken in 1995–96. It recommended that funding responsibility for the CCSP be transferred to the then Department of Environment and Land Management, which occurred in 1996–97.
A $1.000m reduction in the funding allocation was imposed at this time (from around $3.500m to around $2.500m) to reflect the tightening Budget environment.
One additional payment was made to Forestry in 1997–98. However, this was recorded by Treasury as being for the purposes of wildfire fighting costs.
Funding was discontinued after 1997–98 due to Budget restrictions. Further detail on the reasons for this was provided in the March 1999 Government Business Scrutiny Committee hearings.
In the 1998–99 State Budget it was noted that in 1998–99 Forestry Tasmania would fund its non-commercial activities under section 10(2) of the Forestry Act from internal resources. As a result, a lower
Chapter 5 — Community service obligations
91
Forestry Tasmania
dividend would be paid to the Government due to the lower level of profits.
Towards the end of this period Forestry applied for its non-commercial activities to be designated as a CSO under the Government Business Enterprises (GBE) Act 1995. On 27 May 1997, Forestry’s CSO application was considered by Budget Committee and it was agreed that the activities Forestry claimed as CSOs were not CSOs (as defined by the GBE Act) and that no separate funding would be provided.
Treasury’s view has been that while the Forestry Act provides Forestry with additional broad functions and powers under section 10(1), this enables it to undertake these activities, but does not oblige it to, particularly where no specific funding has been provided by Parliament for this purpose under section 10(2).
From this point forward, it appears that Forestry has chosen to continue to undertake these non-commercial activities, despite no funding being provided for this purpose and no direction being given by Ministers.
The conclusion from the information sourced from Treasury is that, as far as Treasury is concerned, despite the contract referred to in Section 5.3, Forestry received no CSO funding over the 16-year period of this audit. The conclusion from this must therefore be that, again as far as Treasury is concerned, Forestry made a commercial decision, based on their interpretation of the GBE and Forestry Acts and to assure sustainable forest management and compliance with its legislated functions, to continue to incur CSO-type expenditure.
5.4.2 Material sourced from Forestry
Discussions with Forestry management made clear their view that, while the Treasury position may be true by reference to the provisions of the GBE Act, nevertheless a formal Service Contract for what purported to be the ‘delivery of Community Service Obligations (CSOs) in Tasmanian State Forests’ was executed as detailed in Section 5.3.
We noted further:
That in 1997, Cabinet determined to not declare any CSOs for Forestry for the following year, but a ‘non-commercial grant’ of $2.450m was allocated ‘for the purposes outlined in section 10(2) of the Forestry Act’. This was noted as being required to be offset by an additional tax and dividend payment to an equivalent
Chapter 5 — Community service obligations
92
Forestry Tasmania
amount drawn from the proceeds of the sale of the one half-share of the State’s softwood plantations.
Correspondence in 1997 between various parties arguing from Forestry’s perspective that:
─ among other things, a range of ‘social’ functions it provided were not clearly related to wood production and would not be the responsibility of a ‘normal’ forest company
─ whilst the Forest Legislation enables the provision of a number of activities, it in no way compels Forestry to undertake these activities.
Forestry remains of the view that:
It is arguable as to whether the section 10(1) requirements are either a commercial decision or discretionary expenditure.
The requirements of the Forestry Act are clear, and the commitments agreed between governments on behalf of Forestry in the RFA and TCFA remove any actual or effective discretion that Forestry might have had, particularly in respect of Forest reserves, which have a specific statutory base, and the special timber zones which were specifically identified in both agreements.
The only real question that might be raised would be about how hard Forestry should have argued and what tactics it might have employed to raise the profile of the issue.
As recorded in Section 5.3, our interpretation of sections 10(1) of the Forestry Act is that Forestry has no discretion other than to comply with the functions outlined in section 10(1). We also concur with Forestry’s view that some of these functions would not necessarily be provided by a privately operated forestry business in particular as these relate to managing reserves. There can be no doubt that Forestry must be incurring costs in satisfying this legislative requirement. The differing points of view held by Treasury and Forestry needs to be resolved.
Also, to satisfy full transparency, Forestry needs to demonstrate that it satisfies the requirements of the Forestry and GBE Acts as these relate to the functions outlined in section 10(1) and that it does so efficiently and effectively.
Chapter 5 — Community service obligations
93
Forestry Tasmania
Recommendation 10
We recommend that:
- Forestry obtain legal advice from the Solicitor-General regarding discretionary or non-discretionary obligations imposed by section 10(1) of the Forestry Act 1920 and any resulting impact on section 10(2)
- the Minister’s and Treasurer’s letter of stakeholder expectation explicitly deal with their expectations regarding the provision by Forestry of CSO and CSO-type functions
- Forestry’s annual Corporate Plan explicitly detail how it will satisfy the functions and powers required under section 10
- Forestry demonstrates that it satisfies its obligations under section 10(1) and that it does so efficiently and effectively.
5.5 Costs incurred by Forestry
When developing our analysis of Forestry’s financial operating performance, we identified various CSO-type costs being incurred by it. Some of these were included in the unaudited section of its annual report in recent years.
However, bearing in mind Forestry’s responsibilities under the Forestry Act and our own understanding of the non-commercial activities it undertook, we sought details from Forestry regarding all of the CSO-type activities it claims to provide. Table 14 below documents, for the three years ended 30 June 2009, all of the CSO-type costs Forestry advised it incurs. Table 14 does not include costs incurred on formal reserves and special timber zones.
Details are not provided for the 2009–10 financial year because; in this year Forestry introduced the non-commercial zone as a formal part of the audited financial statements. The costs identified formed part of what had previously been identified as CSO-type activities, but using a different, more comprehensive costing model. Because there is an overlap between costs identified in managing Forestry’s formal non-commercial zone activities and its other CSO-type functions, we did not seek further break down of these costs.
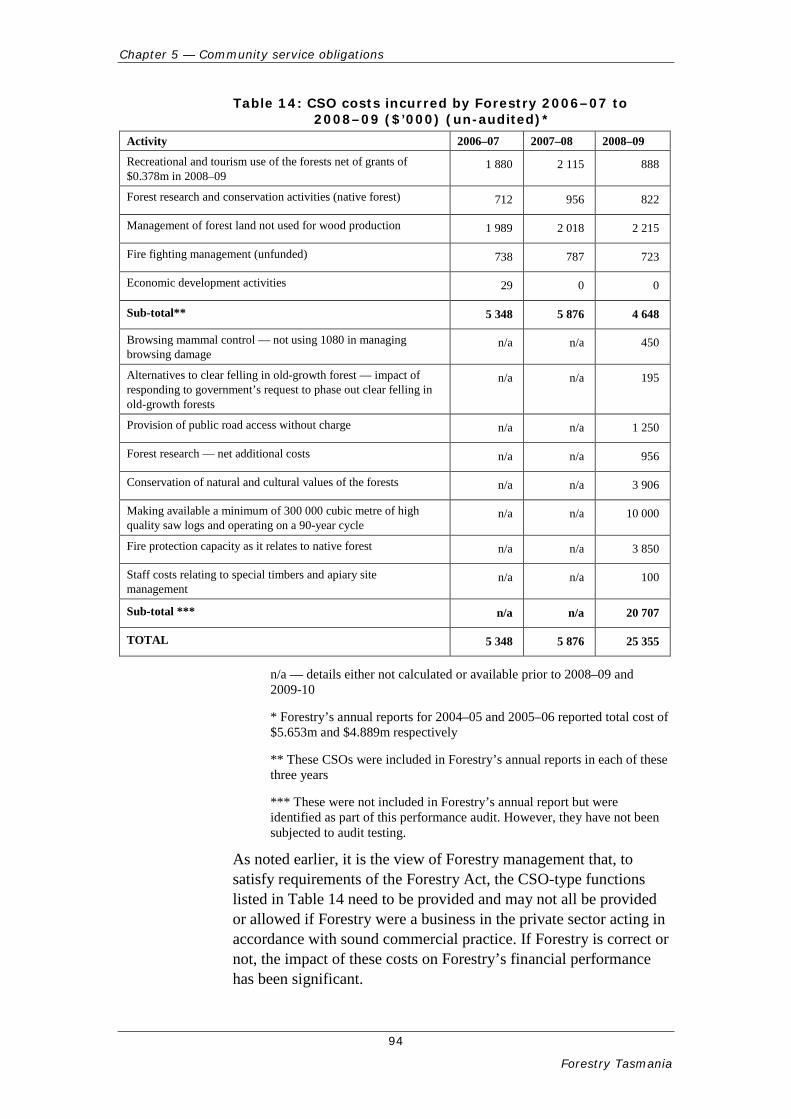
Chapter 5 — Community service obligations
94
Forestry Tasmania
Table 14: CSO costs incurred by Forestry 2006–07 to 2008–09 ($’000) (un-audited)*
Activity 2006–07 2007–08 2008–09
Recreational and tourism use of the forests net of grants of $0.378m in 2008–09
1 880 2 115 888
Forest research and conservation activities (native forest) 712 956 822
Management of forest land not used for wood production 1 989 2 018 2 215
Fire fighting management (unfunded) 738 787 723
Economic development activities 29 0 0
Sub-total** 5 348 5 876 4 648
Browsing mammal control — not using 1080 in managing browsing damage
n/a n/a 450
Alternatives to clear felling in old-growth forest — impact of responding to government’s request to phase out clear felling in old-growth forests
n/a n/a 195
Provision of public road access without charge n/a n/a 1 250
Forest research — net additional costs n/a n/a 956
Conservation of natural and cultural values of the forests n/a n/a 3 906
Making available a minimum of 300 000 cubic metre of high quality saw logs and operating on a 90-year cycle
n/a n/a 10 000
Fire protection capacity as it relates to native forest n/a n/a 3 850
Staff costs relating to special timbers and apiary site management
n/a n/a 100
Sub-total *** n/a n/a 20 707
TOTAL 5 348 5 876 25 355
n/a — details either not calculated or available prior to 2008–09 and 2009-10
* Forestry’s annual reports for 2004–05 and 2005–06 reported total cost of $5.653m and $4.889m respectively
** These CSOs were included in Forestry’s annual reports in each of these three years
*** These were not included in Forestry’s annual report but were identified as part of this performance audit. However, they have not been subjected to audit testing.
As noted earlier, it is the view of Forestry management that, to satisfy requirements of the Forestry Act, the CSO-type functions listed in Table 14 need to be provided and may not all be provided or allowed if Forestry were a business in the private sector acting in accordance with sound commercial practice. If Forestry is correct or not, the impact of these costs on Forestry’s financial performance has been significant.
Chapter 5 — Community service obligations
95
Forestry Tasmania
To illustrate this; even if only 50 per cent of the CSO costs advised by Forestry as noted for 2008–09 in Table 14 are correct and had existed since signing the TCFA in 2004–05 (say for six years), and these CSOs had been fully funded, the impact would have been to increase Forestry’s operating performance approximately as follows:
Additional before tax profits $75.000m
Additional after tax profits $52.500m
Additional operating cash flows after tax $52.500m.
On this basis conclusions about Forestry’s profitability, and returns on assets, would be very different. See also discussion in Section 4.3.5.
Recommendation 11
We recommend that Forestry:
- annually quantifies, has audited and reports the implications on its profitability of all of the various legislative requirements imposed upon it
- identifies those CSOs it believes satisfy the requirement for funding under Part 9 of the GBE Act and seeks a determination for them to be funded
- if such a determination fails, evaluate the need, in both the short and long-term, to continue its current CSO program.
5.6 300 000 cubic metres of saw logs
Table 14 includes an estimate of $10.000m made by Forestry of the negative impact on its profitability of the requirement that, each year, from multiple use forest land, it makes available, at prescribed specifications, for the veneer and sawmilling industries a minimum aggregate quantity of 300 000 cubic metres of eucalypt veneer logs and eucalypt sawlogs. The $10.000m is determined on the assumption of lost revenue if Forestry applied a 50-year rather than 90-year rotation.
It is Forestry management’s view that the 300 000 cubic metre requirement defined above is a responsible position for the industry which, as indicated in Section 1.4, was re-confirmed following a review in 1997–98.
Chapter 5 — Community service obligations
96
Forestry Tasmania
In this regard, we note the discussion and findings about this requirement in the 1997 Nixon Report14. Extracts relevant to a discussion about CSOs regarding the 300 000 cubic metres of saw logs requirement include:
The 300 000 cubic metre legislated supply provision of the Forestry Act 1920 is undermining significantly the commercial role of Forestry Tasmania. This provision of the Act was a key recommendation of the Forests and Forest Industry Strategy (FFIS). The FFIS is the key industry development strategy of the Tasmanian forest industry, developed in consultation with community, industry and environmental interests by the Forest Industry Council during 1990. In this regard, the statutory supply provision of the Act is an explicit industry development objective of the Tasmanian Government.
I believe that this industry development objective is misplaced and should be removed to allow Forestry Tasmania to undertake commercial operations to the best commercial advantage. This will provide maximum return to the Tasmanian Government.
Continuation of the minimum supply requirement was also considered in the National Competition Policy Project Report that concluded:
The minimum supply requirement was justified in the public interest. It determined that the benefits associated with ecologically sustainable development and economic and regional development, including employment and investment growth, outweigh any costs imposed on the community as a result of the minimum supply requirement15.
In addition, removal of this minimum aggregate requirement was also considered during a review, under a national competition policy legislative review program, which reported in April 2000. Table A2 of that report noted:
A minor review of this (Forestry Act 1920) has been completed and all but one of the restrictions on competition are to be removed from the Act. The remaining restriction, relating to minimum supply requirements for eucalypt veneer logs and sawlogs to the veneer industry and sawmilling industries, was reviewed and justified as being in the public benefit during the Regional Forestry Agreement process16.
14 The Nixon report: Tasmania into the 21st Century / report to the Prime Minister of Australia and the Premier of Tasmania [by] Hon. Peter Nixon. 15 National Competition Policy Project Report – 1 August to 31 August 1998 section 4.4.2.4 16 Legislative Review Program Progress report as at 30 April 2000 Table A2, p81
Chapter 5 — Community service obligations
97
Forestry Tasmania
This audit did not set out to assess the reasonableness or otherwise of the 300 000 cubic metre minimum sawlog requirement. What is evident, however, is that it is likely to negatively impact Forestry’s financial performance.
Recommendations 10 and 11 apply.
5.7 Conclusions
Our interpretation is that the Parliament, by including the functions and powers outlined in section 10(1), intended that Forestry should carry out these activities. Therefore, the exercise of these functions by Forestry is not discretionary and Forestry should seek legal advice to clarify its position as to its responsibilities and whether or not costs it incurs in providing these functions are CSOs.
Forestry received no CSO-specific funding over the 16-year period of this audit. However, it must have incurred expenditure annually to satisfy its responsibilities under section 10(1) of the Forestry Act with these costs likely to have increased as additional forests were added to reserves. Funding of these costs as CSOs might have resulted in Forestry’s profitability, returns on assets and operating cash flows being very different to that actually achieved.
Forestry needs to be able to demonstrate that it satisfies the requirements of the Forestry Act as these relate to its section 10(1) responsibilities and that it does so efficiently and effectively.
We note that Forestry has, in recent weeks, made formal application for CSOs to be funded.
98
Forestry Tasmania
6 Balance sheet management
Chapter 6 — Balance sheet management
99
Forestry Tasmania
6 Balance sheet management
6.1 Background
Any assessment of financial performance should include the manner in which Forestry managed its assets and liabilities over the period under review which this Chapter does. This assessment is based on Forestry’s consolidated financial position.
6.2 Significant events impacting Forestry’s balance sheet
Over the period 1994–95 to 2009–10 a number of events impacted Forestry’s balance sheet in one way or another including:
Commencing in 1994–95, there was recognition in the financial statements of the Helsham Agreement on an accrual basis. ‘Abnormal’ revenue of $12.328m was recognised in that year of which $9.691m was a receivable at 30 June 1995. This funding was from the Commonwealth for native forest intensification, sawlog/veneer production and skills, education and training. Funding commenced prior to 30 June 1994 but was previously recorded on a cash basis.
Receipt of $49.668m in 1999–2000 from the sale of its softwood plantations into the joint venture with GMO, $40.000m of which was paid to the State Government as a return of equity.
Funding under the RFA saw Forestry receive $71.000m over the period 1997–98 to 1999–2000 and the transfer by it of 193 000 hectares of native forest into reserves. At 30 June 1995, the total State multiple use forest under Forestry’s management totalled 1.601 million hectares reducing to 1.502 million hectares post-RFA with the number of hectares available for productive forest reducing over this period from 1.327 million to 1.134 million.
Funding under the TCFA saw Forestry receive $140.137m over the period 2004–05 to 2009–10 with $90.223m ‘earned’ by 30 June 2010 when $49.914m was ‘unearned’. This agreement saw the State and Commonwealth governments provide funding to Forestry for investment in plantation development as direct compensation for future productive capacity
Chapter 6 — Balance sheet management
100
Forestry Tasmania
foregone so as to restore Forestry’s future capacity to supply wood and earn revenues.
The TCFA reduced multiple use forest by a further 12 000 hectares to 1.490 million with the area available for productive use reduced to 969 000 hectares.
Negative financial impacts of the economic downturn experienced in South East Asia in the 1996–98 and 2004–06 periods as well as the negative impacts of the GFC commencing in 2007–08.
Changes to accounting standards which saw greater fluctuations in the carrying amounts of biological assets, unfunded defined benefit superannuation obligations and deferred taxation balances.
The establishment in 1994–95 of an investment aimed at fully funding Forestry’s unfunded superannuation obligations. The initial investment was funded in that year by $2.800m returned to Forestry by Treasury and by an internal contribution of $2.500m. At 30 June 1995, the balance invested totalled $5.306m with the balance growing to $13.666m by 30 June 2010. In this period, however, Forestry’s superannuation obligations increased by $85.150m from $37.265m to $122.415m.
At 30 June 1995, Forestry had 622 (563 full-time, 31 part-time and 28 casual) employees compared to 443 at 30 June 2010.
Forest product sales totalled 2.813 million cubic metres (2.167 million native forest and 0.646 million cubic metres softwood plantations) in 1994–95 and, inclusive of only 50 per cent of softwood joint venture production, 2.656 million cubic metres in 2009-10 (1.949m cm native forest and 0.528 million cubic metres softwood plantations).
Forestry’s debt grew from nil at 30 June 1995 to $52.685m at 30 June 2010 which included a finance lease obligation through Newood Holdings Pty Ltd of $11.706m.
In 2007–08 Forestry acquired its 100 per cent interest in Newood. Newood was established to develop the Huon Wood Centre and the Smithton sawmill sites.
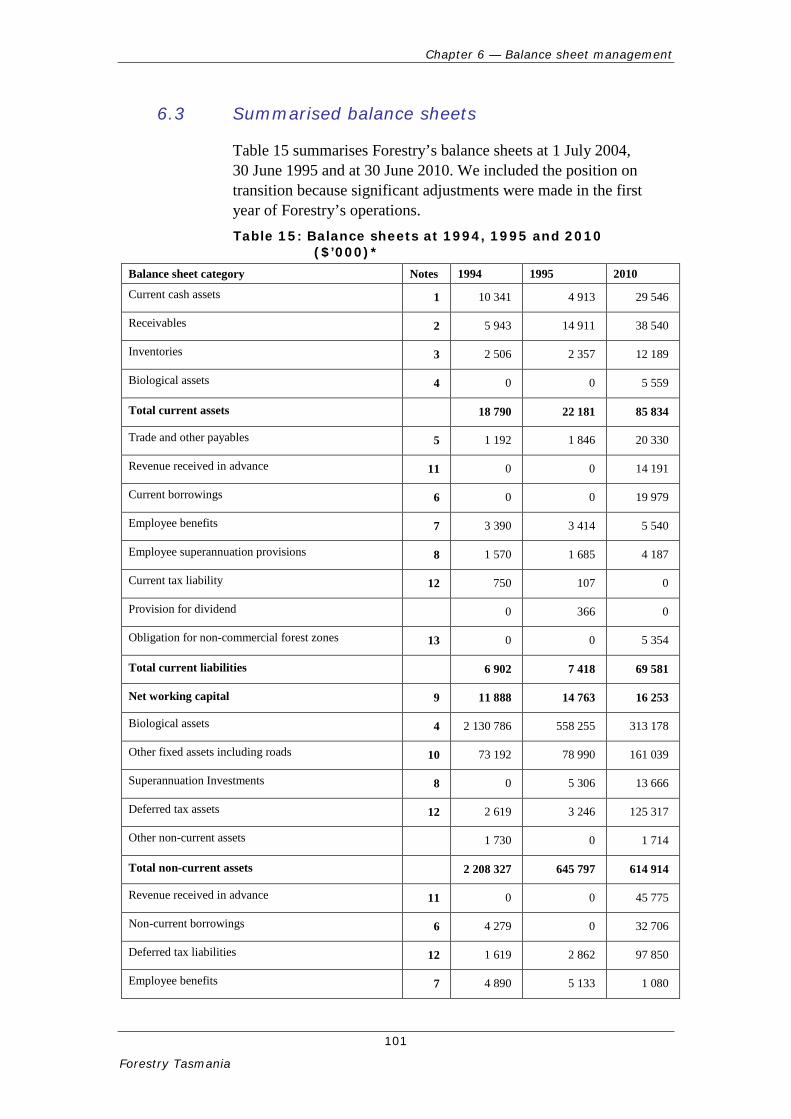
Chapter 6 — Balance sheet management
101
Forestry Tasmania
6.3 Summarised balance sheets
Table 15 summarises Forestry’s balance sheets at 1 July 2004, 30 June 1995 and at 30 June 2010. We included the position on transition because significant adjustments were made in the first year of Forestry’s operations. Table 15: Balance sheets at 1994, 1995 and 2010
($’000)* Balance sheet category Notes 1994 1995 2010
Current cash assets 1 10 341 4 913 29 546
Receivables 2 5 943 14 911 38 540
Inventories 3 2 506 2 357 12 189
Biological assets 4 0 0 5 559
Total current assets 18 790 22 181 85 834
Trade and other payables 5 1 192 1 846 20 330
Revenue received in advance 11 0 0 14 191
Current borrowings 6 0 0 19 979
Employee benefits 7 3 390 3 414 5 540
Employee superannuation provisions 8 1 570 1 685 4 187
Current tax liability 12 750 107 0
Provision for dividend 0 366 0
Obligation for non-commercial forest zones 13 0 0 5 354
Total current liabilities 6 902 7 418 69 581
Net working capital 9 11 888 14 763 16 253
Biological assets 4 2 130 786 558 255 313 178
Other fixed assets including roads 10 73 192 78 990 161 039
Superannuation Investments 8 0 5 306 13 666
Deferred tax assets 12 2 619 3 246 125 317
Other non-current assets 1 730 0 1 714
Total non-current assets 2 208 327 645 797 614 914
Revenue received in advance 11 0 0 45 775
Non-current borrowings 6 4 279 0 32 706
Deferred tax liabilities 12 1 619 2 862 97 850
Employee benefits 7 4 890 5 133 1 080
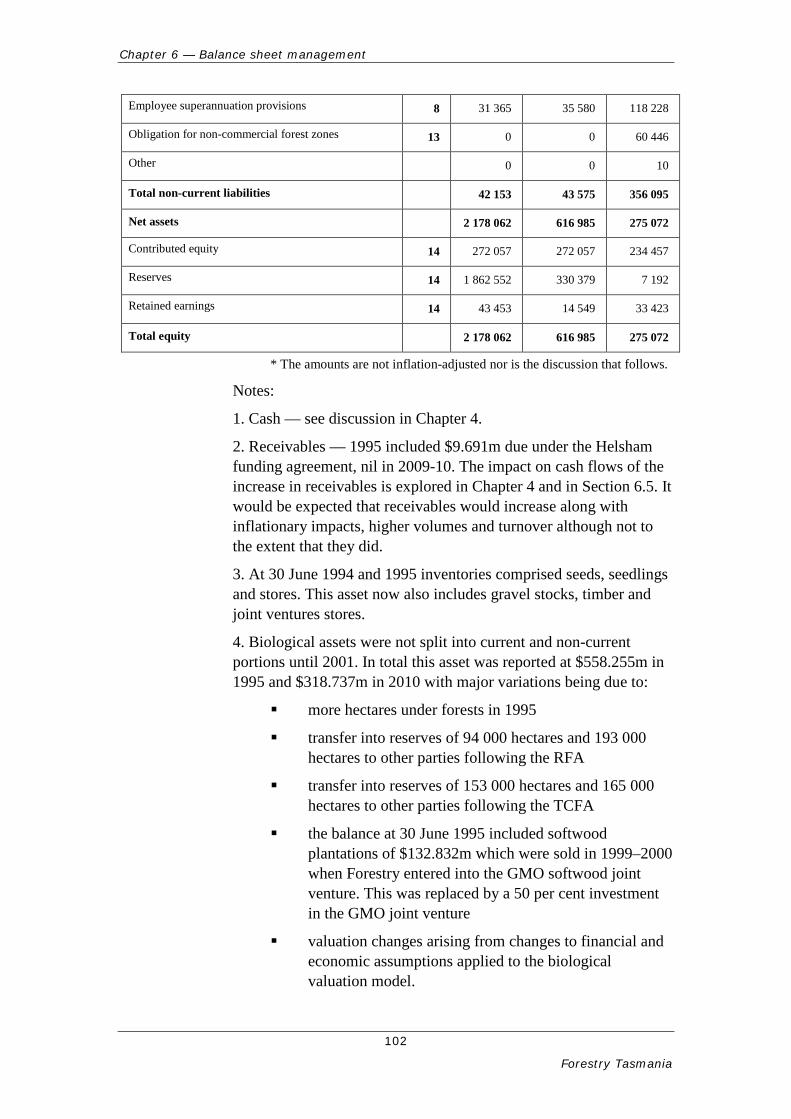
Chapter 6 — Balance sheet management
102
Forestry Tasmania
Employee superannuation provisions 8 31 365 35 580 118 228
Obligation for non-commercial forest zones 13 0 0 60 446
Other 0 0 10
Total non-current liabilities 42 153 43 575 356 095
Net assets 2 178 062 616 985 275 072
Contributed equity 14 272 057 272 057 234 457
Reserves 14 1 862 552 330 379 7 192
Retained earnings 14 43 453 14 549 33 423
Total equity 2 178 062 616 985 275 072
* The amounts are not inflation-adjusted nor is the discussion that follows.
Notes:
1. Cash — see discussion in Chapter 4.
2. Receivables — 1995 included $9.691m due under the Helsham funding agreement, nil in 2009-10. The impact on cash flows of the increase in receivables is explored in Chapter 4 and in Section 6.5. It would be expected that receivables would increase along with inflationary impacts, higher volumes and turnover although not to the extent that they did.
3. At 30 June 1994 and 1995 inventories comprised seeds, seedlings and stores. This asset now also includes gravel stocks, timber and joint ventures stores.
4. Biological assets were not split into current and non-current portions until 2001. In total this asset was reported at $558.255m in 1995 and $318.737m in 2010 with major variations being due to:
more hectares under forests in 1995
transfer into reserves of 94 000 hectares and 193 000 hectares to other parties following the RFA
transfer into reserves of 153 000 hectares and 165 000 hectares to other parties following the TCFA
the balance at 30 June 1995 included softwood plantations of $132.832m which were sold in 1999–2000 when Forestry entered into the GMO softwood joint venture. This was replaced by a 50 per cent investment in the GMO joint venture
valuation changes arising from changes to financial and economic assumptions applied to the biological valuation model.
Chapter 6 — Balance sheet management
103
Forestry Tasmania
Biological assets at 1 July 1994 were valued on a basis different to that adopted at 30 June 1995 and at 20 June 2010. Reasons for this change are dealt with in Chapter 2.
5. The increase in trade creditors reflects increasing costs and volumes of business activity with the impact of this increase on cash flows explored in Chapter 4 and in Section 6.5.
6. The increase of $52.685m in borrowings is discussed in Section 6.4.
7. Employee benefits, comprising provisions for annual leave, long service leave and workers compensation, totalled $8.547m at 30 June 1995 and $6.620m at 30 June 2010. The workers compensation component at 30 June 1995 was $1.763m, but nil at 30 June 2010. This means that the provision for annual leave and long service leave declined by $0.164m over the period despite salary increases with the decline primarily due to the decrease in the number of employees from 622 to 443 over the period.
8. The increase in provisions for superannuation obligations totalling $85.150m and increase in the superannuation investment account of $13.666m is discussed in Section 6.4.
9. The increase in Forestry’s net working capital of $4.365m is discussed in Section 6.5.
10. The increase in Forestry’s fixed assets of $82.049m, other than biological assets, is discussed in Section 6.6.
11. This includes TCFA advance revenues, which is discussed in Section 6.7.
12. Forestry’s taxation obligations are discussed in Section 6.8.
13. Forestry’s obligations for managing non-commercial forest zones are discussed in the Appendix — see Table 20.
14. Movements in Forestry’s equity are dealt with in Section 6.9.
6.4 Debt (also referred to as borrowings)
We discuss three matters here, absolute increases in debt and two ratios17:
Funds from operations (FFO) to total debt (FFO/total debt with FFO calculated as earnings before interest and tax + depreciation – tax paid)
17 These ratios were selected because we identified them in a confidential February 2002 capital structure review of Forestry carried out by Macquarie Risk Advisory Services Limited. Macquarie noted these as two key ratios used by ratings agencies to measure financial strength.
Chapter 6 — Balance sheet management
104
Forestry Tasmania
Funds from operations to interest coverage (FFOIC) – calculated as earnings before interest and tax + depreciation – tax paid divided by interest expense.
In the discussion in this section, we have included Forestry’s superannuation liabilities as part of debt but net of the superannuation investment account. Not included however was the liability established for the first time at 30 June 2010 for Forestry’s obligations as these relate to its non-commercial forest zones.
We have also assumed that Forestry targets a credit rating of BBB18.
6.4.1. Borrowings
From July 1994 to June 2001 Forestry operated with minimal debt with borrowings generally limited to finance leases. This changed in 2001–02 with borrowings in that year of $14.000m increasing steadily thereafter to $53.685m at 30 June 2010 comprising:
borrowings from Tascorp of $40.800m
a finance lease of $11.885m raised to finance Newood’s 25-year lease agreement with Transend Networks Pty Ltd for a transmission line onto the Huon Wood Centre site.
In general, commencement of borrowings coincided with declining profitability and cash generated from operations, generally higher investments in plantation establishment and property, plant and equipment, mainly roads, and increases in hectares transferred to reserves resulting in fewer hectares available for production.
Forestry’s borrowings from Tascorp have remained at $40.800m since 30 June 2007, which is the limit established by Tascorp. At 30 June 2006 the balance was $35.000m. Over the period since Forestry first started to raise borrowings, it has effectively only met annual interest charges.
6.4.2 Net superannuation liabilities
The Macquarie report referred to in the footnotes on the previous page provides a useful explanation of Forestry’s exposure to its defined benefit superannuation obligations.
Defined benefit funds provide risks to their employer sponsors as insufficient funding, deterioration in the value of plan assets or the granting of improved benefits can give rise to significant unfunded
18 The Macquarie report established targets for the FFOIC and FFO to total debt ratios for Forestry based on a BBB rating. We have accepted these targets and assessed Forestry’s performance against them.
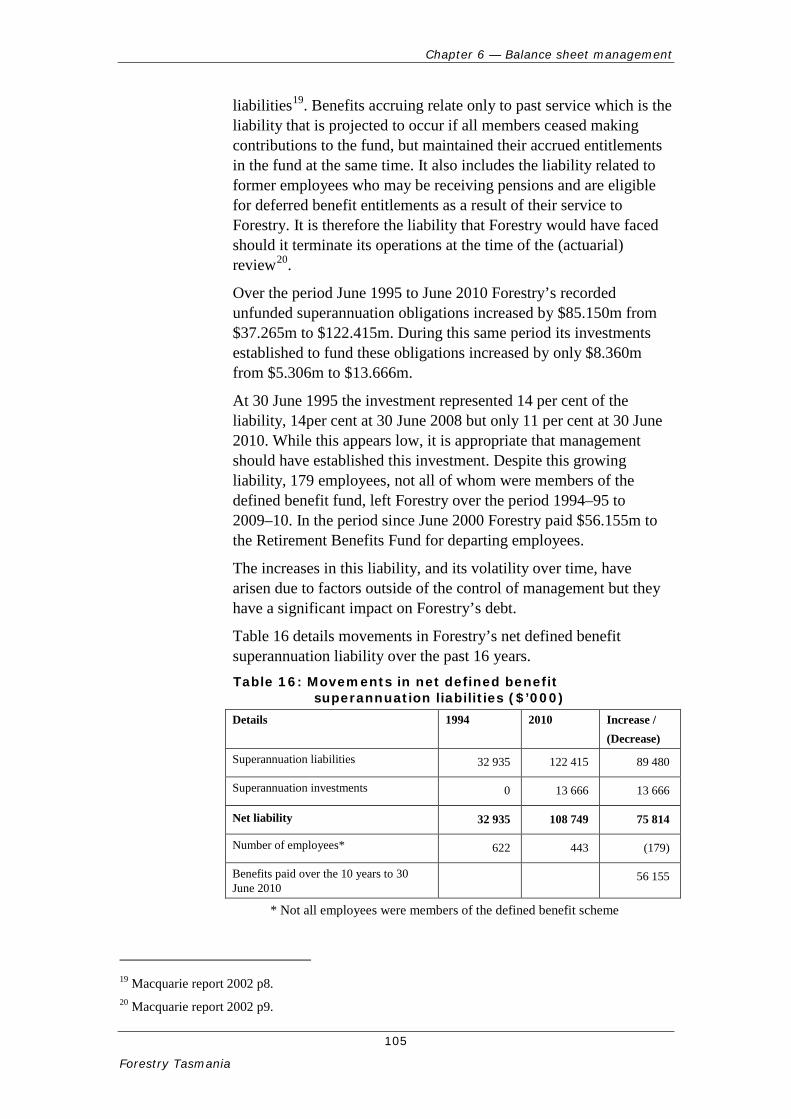
Chapter 6 — Balance sheet management
105
Forestry Tasmania
liabilities19. Benefits accruing relate only to past service which is the liability that is projected to occur if all members ceased making contributions to the fund, but maintained their accrued entitlements in the fund at the same time. It also includes the liability related to former employees who may be receiving pensions and are eligible for deferred benefit entitlements as a result of their service to Forestry. It is therefore the liability that Forestry would have faced should it terminate its operations at the time of the (actuarial) review20.
Over the period June 1995 to June 2010 Forestry’s recorded unfunded superannuation obligations increased by $85.150m from $37.265m to $122.415m. During this same period its investments established to fund these obligations increased by only $8.360m from $5.306m to $13.666m.
At 30 June 1995 the investment represented 14 per cent of the liability, 14per cent at 30 June 2008 but only 11 per cent at 30 June 2010. While this appears low, it is appropriate that management should have established this investment. Despite this growing liability, 179 employees, not all of whom were members of the defined benefit fund, left Forestry over the period 1994–95 to 2009–10. In the period since June 2000 Forestry paid $56.155m to the Retirement Benefits Fund for departing employees.
The increases in this liability, and its volatility over time, have arisen due to factors outside of the control of management but they have a significant impact on Forestry’s debt.
Table 16 details movements in Forestry’s net defined benefit superannuation liability over the past 16 years. Table 16: Movements in net defined benefit
superannuation liabilities ($’000) Details 1994 2010 Increase /
(Decrease)
Superannuation liabilities 32 935 122 415 89 480
Superannuation investments 0 13 666 13 666
Net liability 32 935 108 749 75 814
Number of employees* 622 443 (179)
Benefits paid over the 10 years to 30 June 2010
56 155
* Not all employees were members of the defined benefit scheme
19 Macquarie report 2002 p8. 20 Macquarie report 2002 p9.
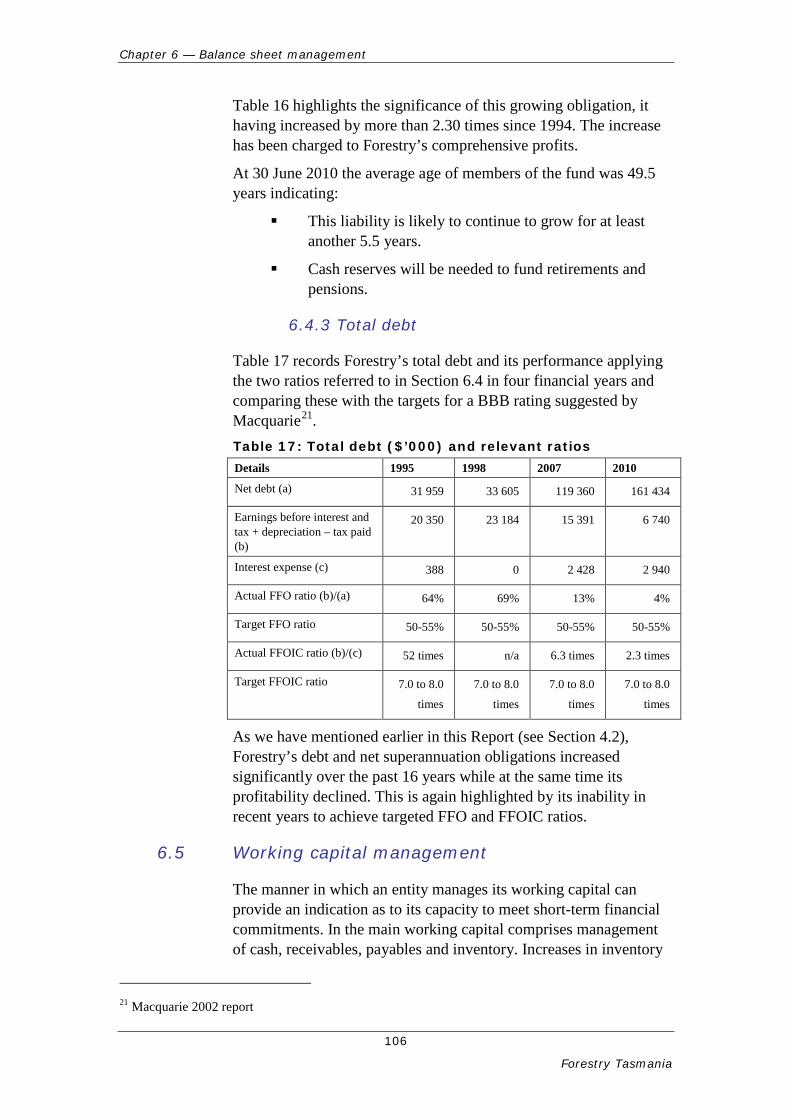
Chapter 6 — Balance sheet management
106
Forestry Tasmania
Table 16 highlights the significance of this growing obligation, it having increased by more than 2.30 times since 1994. The increase has been charged to Forestry’s comprehensive profits.
At 30 June 2010 the average age of members of the fund was 49.5 years indicating:
This liability is likely to continue to grow for at least another 5.5 years.
Cash reserves will be needed to fund retirements and pensions.
6.4.3 Total debt
Table 17 records Forestry’s total debt and its performance applying the two ratios referred to in Section 6.4 in four financial years and comparing these with the targets for a BBB rating suggested by Macquarie21. Table 17: Total debt ($’000) and relevant ratios Details 1995 1998 2007 2010
Net debt (a) 31 959 33 605 119 360 161 434
Earnings before interest and tax + depreciation – tax paid (b)
20 350 23 184 15 391 6 740
Interest expense (c) 388 0 2 428 2 940
Actual FFO ratio (b)/(a) 64% 69% 13% 4%
Target FFO ratio 50-55% 50-55% 50-55% 50-55%
Actual FFOIC ratio (b)/(c) 52 times n/a 6.3 times 2.3 times
Target FFOIC ratio 7.0 to 8.0
times
7.0 to 8.0
times
7.0 to 8.0
times
7.0 to 8.0
times
As we have mentioned earlier in this Report (see Section 4.2), Forestry’s debt and net superannuation obligations increased significantly over the past 16 years while at the same time its profitability declined. This is again highlighted by its inability in recent years to achieve targeted FFO and FFOIC ratios.
6.5 Working capital management
The manner in which an entity manages its working capital can provide an indication as to its capacity to meet short-term financial commitments. In the main working capital comprises management of cash, receivables, payables and inventory. Increases in inventory
21 Macquarie 2002 report
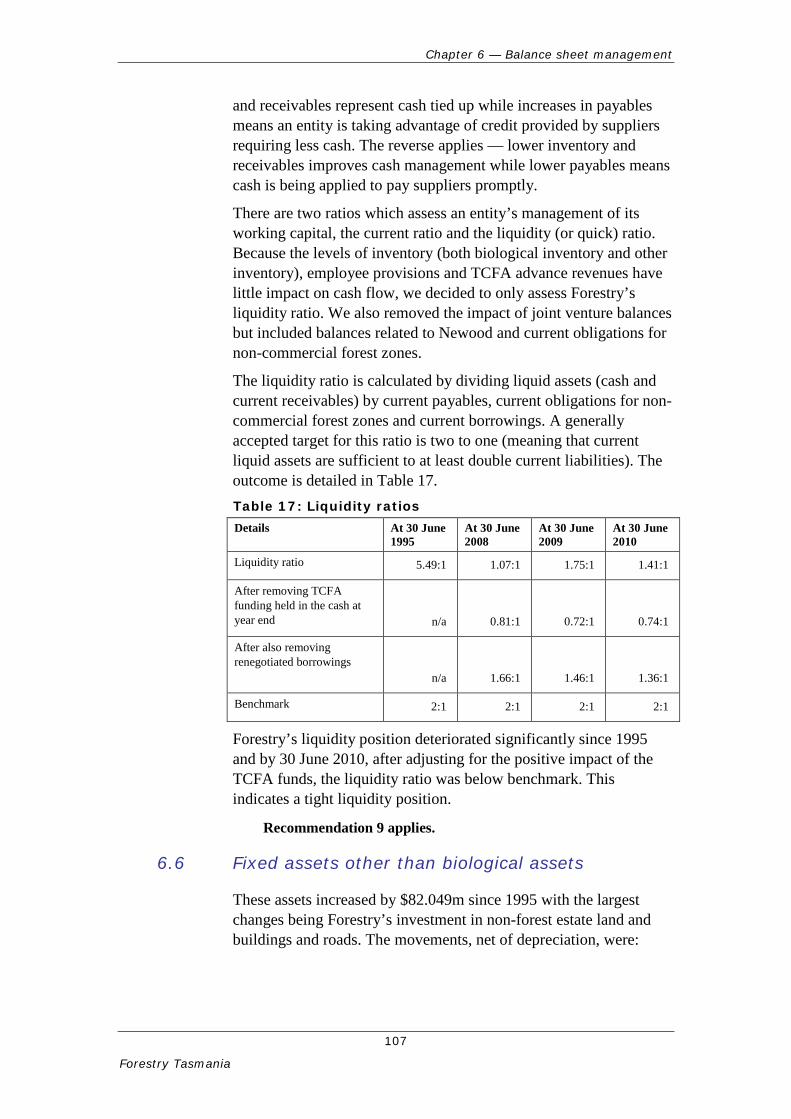
Chapter 6 — Balance sheet management
107
Forestry Tasmania
and receivables represent cash tied up while increases in payables means an entity is taking advantage of credit provided by suppliers requiring less cash. The reverse applies — lower inventory and receivables improves cash management while lower payables means cash is being applied to pay suppliers promptly.
There are two ratios which assess an entity’s management of its working capital, the current ratio and the liquidity (or quick) ratio. Because the levels of inventory (both biological inventory and other inventory), employee provisions and TCFA advance revenues have little impact on cash flow, we decided to only assess Forestry’s liquidity ratio. We also removed the impact of joint venture balances but included balances related to Newood and current obligations for non-commercial forest zones.
The liquidity ratio is calculated by dividing liquid assets (cash and current receivables) by current payables, current obligations for non-commercial forest zones and current borrowings. A generally accepted target for this ratio is two to one (meaning that current liquid assets are sufficient to at least double current liabilities). The outcome is detailed in Table 17. Table 17: Liquidity ratios Details At 30 June
1995 At 30 June 2008
At 30 June 2009
At 30 June 2010
Liquidity ratio 5.49:1 1.07:1 1.75:1 1.41:1
After removing TCFA funding held in the cash at year end
n/a
0.81:1
0.72:1
0.74:1
After also removing renegotiated borrowings
n/a
1.66:1
1.46:1
1.36:1
Benchmark 2:1 2:1 2:1 2:1
Forestry’s liquidity position deteriorated significantly since 1995 and by 30 June 2010, after adjusting for the positive impact of the TCFA funds, the liquidity ratio was below benchmark. This indicates a tight liquidity position.
Recommendation 9 applies.
6.6 Fixed assets other than biological assets
These assets increased by $82.049m since 1995 with the largest changes being Forestry’s investment in non-forest estate land and buildings and roads. The movements, net of depreciation, were:
Chapter 6 — Balance sheet management
108
Forestry Tasmania
Roads:
1995 $ 18.206m
2010 $114.654m
Other fixed assets excluding forest land and biological assets
1995 $ 22.708m
2010 $ 46.385m
Roads are reported at cost less depreciation and increased due to inflationary impacts and Forestry’s on-going investment in roads for multiple use.
Increases in other fixed assets primarily related to:
land and buildings up $13.641m
Newood transmission line (leased) of $12.984m
Small decline in plant and equipment of $2.403m.
6.7 TCFA funds received in advance
These amounts represent funds received by Forestry under the TCFA program but which had still to be earned. At 30 June 2010, $49.914m had been received by Forestry which had still to be invested in forestry related activities. These funds are held, in the main, against future maintenance costs of plantations already established, i.e. for pruning and fertilising of maturing plantations and will emerge over a predictable future timeline. Forestry’s acquittal of TCFA funds received was dealt with in Section 2.3.3.
6.8 Taxation
Over the period under review significant changes took place to the manner in which entities report actual and deferred taxation obligations. In the main the net balance at 30 June 2010 of $27.467m represented the income tax effects of asset revaluations offset by accrued provisions for employee annual leave, long service leave and superannuation entitlements.
6.9 Contributed Equity
When Forestry commenced operations on 1 July 1994, it inherited the then State equity in the former Forestry Commission which was $272.057m. This balance had arisen when the State Government took over debt of this amount at 30 June 1988. In the context of Forestry’s balance sheet at 30 June 1995, this equity contribution
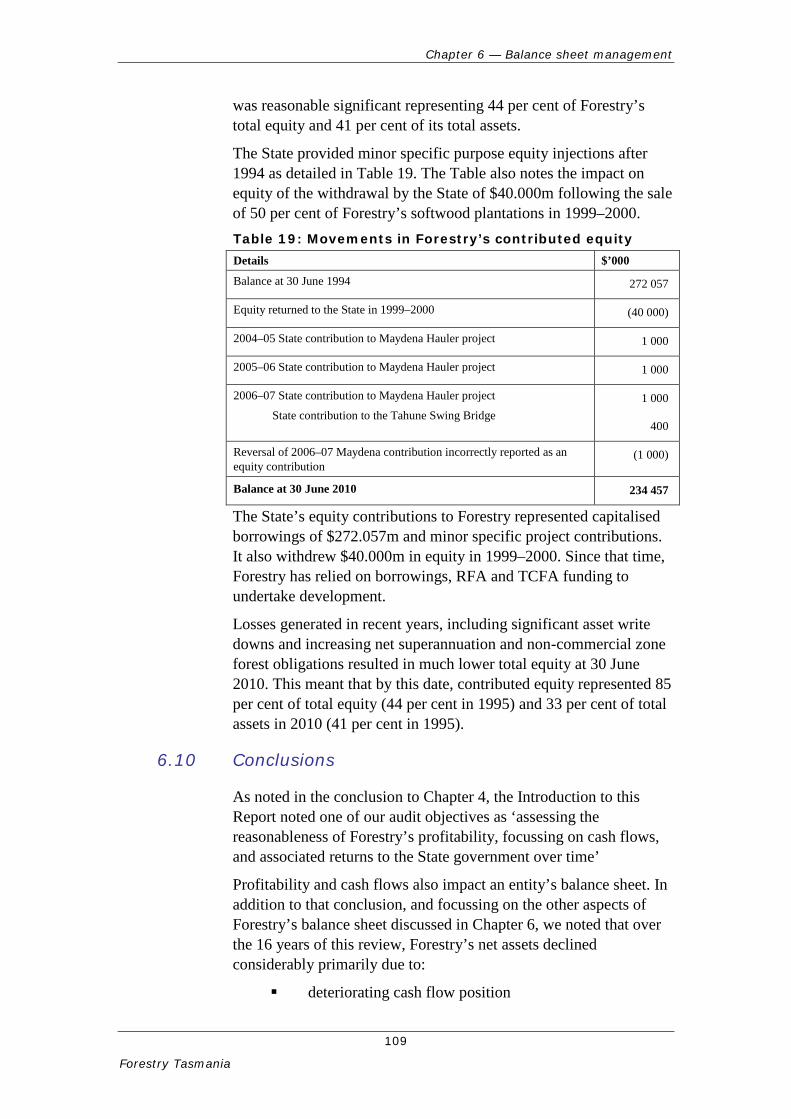
Chapter 6 — Balance sheet management
109
Forestry Tasmania
was reasonable significant representing 44 per cent of Forestry’s total equity and 41 per cent of its total assets.
The State provided minor specific purpose equity injections after 1994 as detailed in Table 19. The Table also notes the impact on equity of the withdrawal by the State of $40.000m following the sale of 50 per cent of Forestry’s softwood plantations in 1999–2000. Table 19: Movements in Forestry’s contributed equity Details $’000
Balance at 30 June 1994 272 057
Equity returned to the State in 1999–2000 (40 000)
2004–05 State contribution to Maydena Hauler project 1 000
2005–06 State contribution to Maydena Hauler project 1 000
2006–07 State contribution to Maydena Hauler project
State contribution to the Tahune Swing Bridge 1 000
400
Reversal of 2006–07 Maydena contribution incorrectly reported as an equity contribution
(1 000)
Balance at 30 June 2010 234 457
The State’s equity contributions to Forestry represented capitalised borrowings of $272.057m and minor specific project contributions. It also withdrew $40.000m in equity in 1999–2000. Since that time, Forestry has relied on borrowings, RFA and TCFA funding to undertake development.
Losses generated in recent years, including significant asset write downs and increasing net superannuation and non-commercial zone forest obligations resulted in much lower total equity at 30 June 2010. This meant that by this date, contributed equity represented 85 per cent of total equity (44 per cent in 1995) and 33 per cent of total assets in 2010 (41 per cent in 1995).
6.10 Conclusions
As noted in the conclusion to Chapter 4, the Introduction to this Report noted one of our audit objectives as ‘assessing the reasonableness of Forestry’s profitability, focussing on cash flows, and associated returns to the State government over time’
Profitability and cash flows also impact an entity’s balance sheet. In addition to that conclusion, and focussing on the other aspects of Forestry’s balance sheet discussed in Chapter 6, we noted that over the 16 years of this review, Forestry’s net assets declined considerably primarily due to:
deteriorating cash flow position
Chapter 6 — Balance sheet management
110
Forestry Tasmania
changes in accounting standards leading to lower recorded assets values
changes in the approach to valuing its biological assets also leading to lower recorded assets values
increases in the actuarially assessed amounts attributed to unfunded defined benefit superannuation obligations
increasing debt
withdrawal of equity
introduction of liabilities to record unearned advanced TCFA funding
introduction of liabilities recording obligations for non-commercial forest zones.
It is likely that Forestry’s unfunded defined benefit superannuation obligations will continue to grow for at least another 5.5 years and it will require cash to fund retirements and pensions.
Forestry’s debt and net superannuation obligations increased significantly over the past 16 years while at the same time its profitability declined. This was highlighted by its inability in recent years to achieve targeted FFO and FFOIC ratios.
Overall conclusions from Chapters 4 to 6 is that Forestry’s financial situation is particularly difficult it being faced with declining revenues, high fixed costs, declining productive forests but increasing obligations for non-productive forests, poor cash flows, long periods before investments in plantation development provide returns, declining local and world markets, increasing Australian dollar, increasing defined benefit superannuation obligations and uncertainty regarding its CSO obligations. Our impression is that Forestry is endeavouring to deal with these matters but may not be able to do so without financial assistance from the State. For example, based on current levels of cash flow, Forestry will find it difficult to fund its defined benefit superannuation obligations.

111
Forestry Tasmania

This page left blank intentionally
7 Economic performance
Chapter 7 — Economic performance
113
Forestry Tasmania
7 Economic performance
7.1 Background
As previously noted, the dual objectives of Forestry are to optimise the economic returns from its wood production activities and the benefits to the State of the non-wood values of forests.
Forestry’s activities involve significant expenditure and therefore generate substantial economic, social and environmental impacts for Tasmania. These include:
economic returns generated directly through Forestry’s own activities such as its operational expenditure, jobs creation and export growth
economic returns generated through flow on impacts for the Tasmanian economy, such as increased demand for the goods and services of local suppliers and higher demand for goods by workers employed by Forestry
social and environmental impacts arising from its community service activities, such as protection of the ecosystem, property and life through fire management activities.
In this chapter, we evaluate Forestry’s economic contribution to Tasmania based on equilibrium modelling performed by Monash University.
7.2 Equilibrium modelling
Computable General Equilibrium (CGE) models are large models of the State and Territory economies that use actual economic data to estimate how an economy might react to changes in policy, technology or other external factors. CGE modelling is based on the premise that if one industry expands in response to demand, there will be flow-on effects on production, employment and income in other industries and sectors.
CGE modelling has been used to measure both the direct and flow-on effects of Forestry’s operations on the Tasmanian economy over the period, 2005–08. However, the scope of this evaluation did not assess the economic impact of other, downstream activity that occurs following Forestry’s involvement, such as the processing of wood by other third parties sourced from areas managed by Forestry Tasmania. Such an evaluation would provide a greater economic impact.
Chapter 7 — Economic performance
114
Forestry Tasmania
The modelling is complex and not always intuitive. For example, activities that create employment might lead to labour shortages, higher wages and increased costs in other industries and sectors as well as increases in interest rates. Another example is that Forestry’s activities can increase export activity leading to increases in the Australian dollar also, potentially, resulting in negative impacts.
7.3 Modelling by Monash University
The Monash suite of CGE models has a lengthy history of development, is extensively documented and has been subject to comprehensive peer review.
In modelling the impacts of Forestry’s business operations, data was sourced from financial information provided by Forestry for the period 2005–08. Additional assumptions were made such as the interstate–tourist percentage of total tourists attracted by Forestry’s activities and their spending patterns.
We are confident that the data used was accurate and the related assumptions were reasonable. On the other hand, the algorithm of the model has not been reviewed and our confidence in the output of the model rests largely on the credibility of the developers and operators of the model.
7.4 Findings
7.4.1 Impacts on Tasmanian Gross State Product (GSP)
The impact on GSP is the key measure of the economic value added by Forestry’s activities.
Based on the GCE modelling approach, as a result of Forestry’s activities, Tasmania’s net GSP over the period 2005–08 was estimated, compared to a base case situation where these activities did not occur, to have been $334.000m (or $111.000m per annum) higher than it would otherwise have been22. This was primarily due to higher levels of consumption and investment, both direct and indirect, and consequential positive effects on employment.
Note that the increase in real GSP is less than the spending associated with Forestry’s activities because the model assumes a constraint on the availability of labour resources. As a result, Forestry’s contribution to employment puts upward pressure on real
22 These impacts represent Forestry’s net economic impact on the Tasmanian economy; that is, they incorporate the impact of expenditure funded out of Forestry’s own income as well as the impact of public financing of some activities, mainly funding in this period under the TCFA.
Chapter 7 — Economic performance
115
Forestry Tasmania
wage rates, with a corresponding impact on the competitiveness of other Tasmanian products.
The top three industries that were shown to have benefited in Tasmania due to Forestry’s activities were:
construction materials
trade services
road transport.
Government revenues have also benefitted from increased payroll and other taxes to the amount of $41.000m (1.9 per cent of all state taxes).
Overall, however, this is a positive outcome for Tasmania relative to what would have occurred if Forestry had not operated during the 2005–08 period.
7.4.2 Unquantified benefits
In addition, while they are difficult to measure in quantitative terms, there are impacts associated with Forestry’s non-wood activities, including:
productivity improvements in existing forestry activities resulting from the application of knowledge and new techniques generated by Forestry’s research and development activities
social benefits associated with job creation, recreation and tourism use of the State forest and Forestry’s fire management activities
environmental benefits through Forestry’s activities in research and development for conservation outcomes, fire management and management of the forest land not used for wood production.
7.4.3 Forestry management’s view
Forestry noted the scope of our evaluation noted in Section 7.2 which did not assess the economic impact of other, downstream activity that occurs following Forestry’s involvement, such as the processing of wood by other third parties sourced from areas managed by Forestry Tasmania. Such an evaluation would provide a greater economic impact.
Our attention was drawn to:
Forestry’s internal calculations estimating the final value to the State economy of production from State forests,
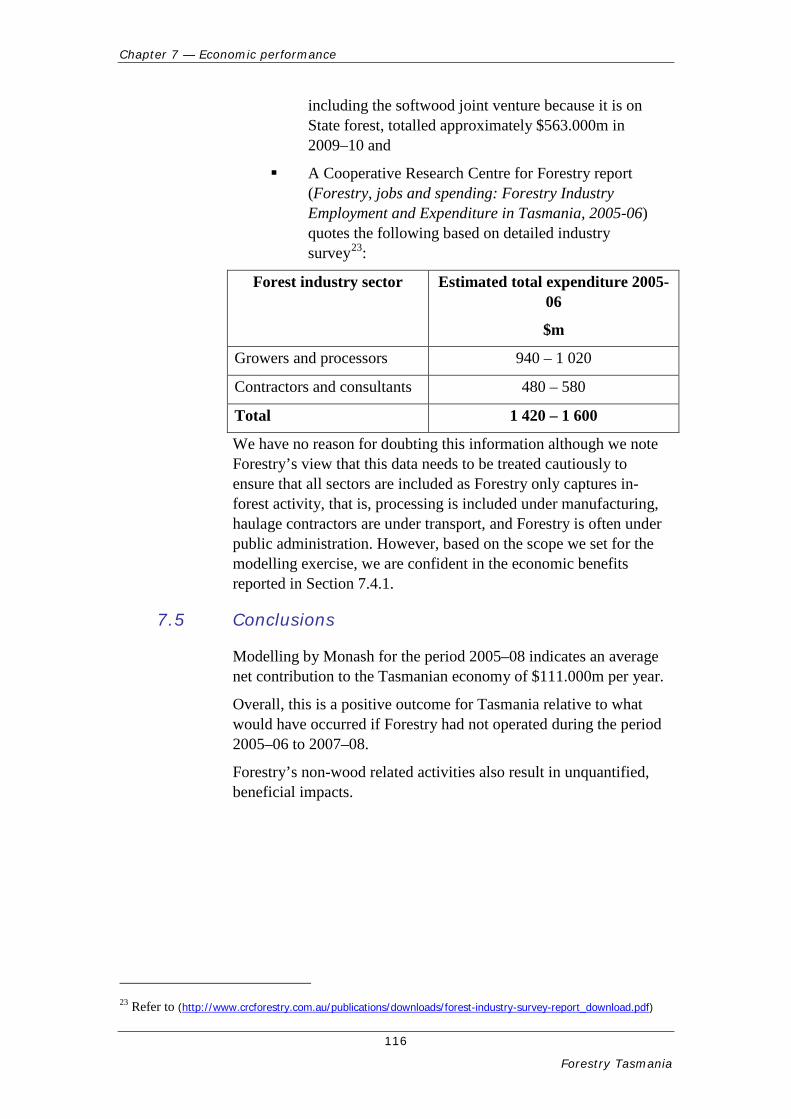
Chapter 7 — Economic performance
116
Forestry Tasmania
including the softwood joint venture because it is on State forest, totalled approximately $563.000m in 2009–10 and
A Cooperative Research Centre for Forestry report (Forestry, jobs and spending: Forestry Industry Employment and Expenditure in Tasmania, 2005-06) quotes the following based on detailed industry survey23:
Forest industry sector Estimated total expenditure 2005-06
$m
Growers and processors 940 – 1 020
Contractors and consultants 480 – 580
Total 1 420 – 1 600
We have no reason for doubting this information although we note Forestry’s view that this data needs to be treated cautiously to ensure that all sectors are included as Forestry only captures in-forest activity, that is, processing is included under manufacturing, haulage contractors are under transport, and Forestry is often under public administration. However, based on the scope we set for the modelling exercise, we are confident in the economic benefits reported in Section 7.4.1.
7.5 Conclusions
Modelling by Monash for the period 2005–08 indicates an average net contribution to the Tasmanian economy of $111.000m per year.
Overall, this is a positive outcome for Tasmania relative to what would have occurred if Forestry had not operated during the period 2005–06 to 2007–08.
Forestry’s non-wood related activities also result in unquantified, beneficial impacts.
23 Refer to (http://www.crcforestry.com.au/publications/downloads/forest-industry-survey-report_download.pdf)

This page left blank intentionally
118
Forestry Tasmania
8 Compliance
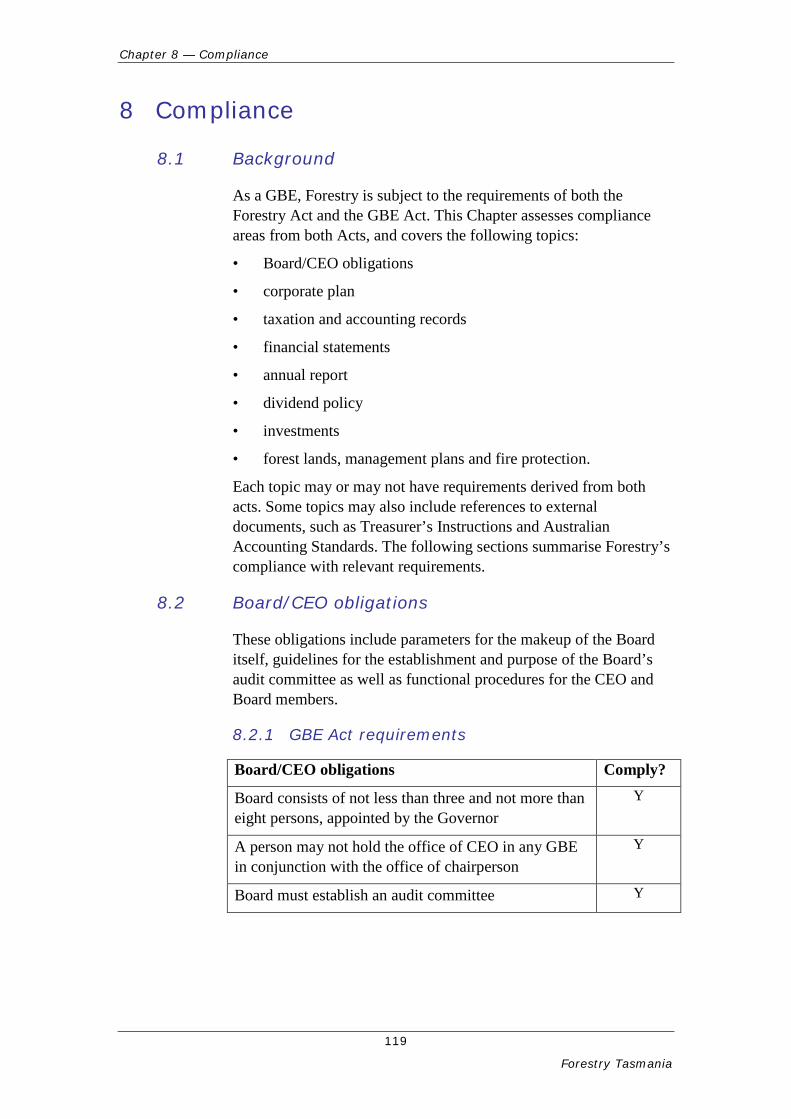
Chapter 8 — Compliance
119
Forestry Tasmania
8 Compliance
8.1 Background
As a GBE, Forestry is subject to the requirements of both the Forestry Act and the GBE Act. This Chapter assesses compliance areas from both Acts, and covers the following topics:
• Board/CEO obligations
• corporate plan
• taxation and accounting records
• financial statements
• annual report
• dividend policy
• investments
• forest lands, management plans and fire protection.
Each topic may or may not have requirements derived from both acts. Some topics may also include references to external documents, such as Treasurer’s Instructions and Australian Accounting Standards. The following sections summarise Forestry’s compliance with relevant requirements.
8.2 Board/CEO obligations
These obligations include parameters for the makeup of the Board itself, guidelines for the establishment and purpose of the Board’s audit committee as well as functional procedures for the CEO and Board members.
8.2.1 GBE Act requirements
Board/CEO obligations Comply?
Board consists of not less than three and not more than eight persons, appointed by the Governor
Y
A person may not hold the office of CEO in any GBE in conjunction with the office of chairperson
Y
Board must establish an audit committee Y
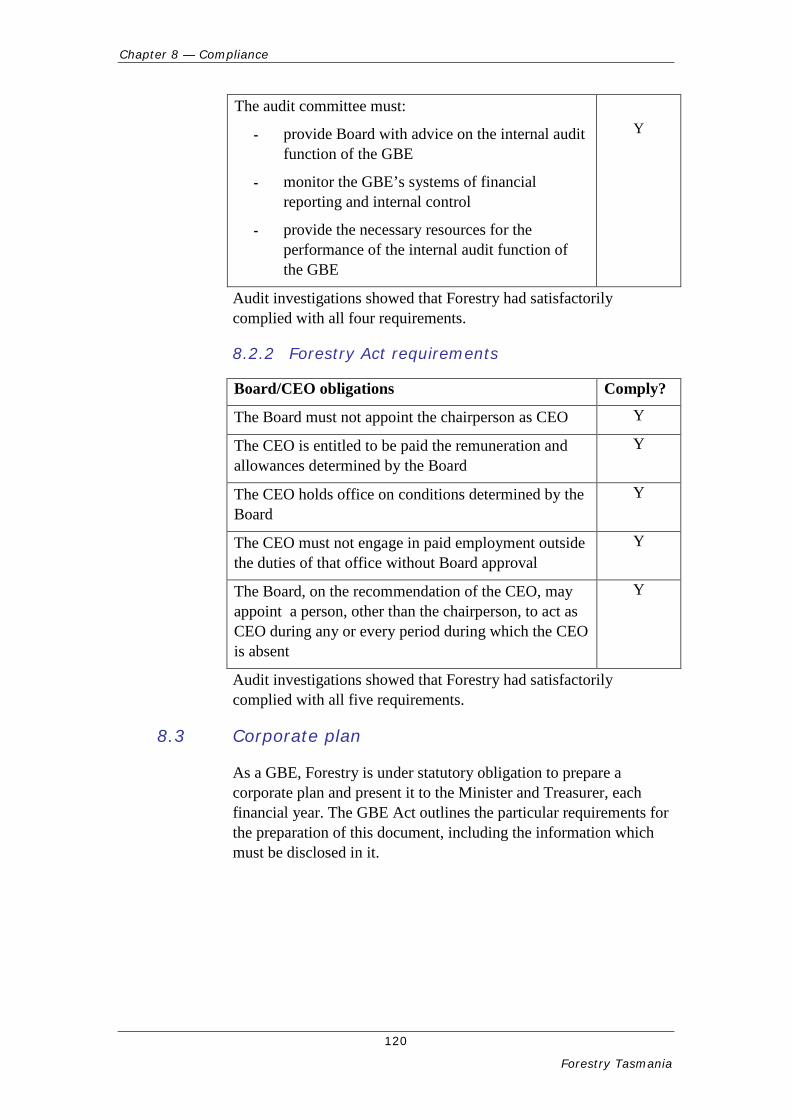
Chapter 8 — Compliance
120
Forestry Tasmania
The audit committee must:
- provide Board with advice on the internal audit function of the GBE
- monitor the GBE’s systems of financial reporting and internal control
- provide the necessary resources for the performance of the internal audit function of the GBE
Y
Audit investigations showed that Forestry had satisfactorily complied with all four requirements.
8.2.2 Forestry Act requirements
Board/CEO obligations Comply?
The Board must not appoint the chairperson as CEO Y
The CEO is entitled to be paid the remuneration and allowances determined by the Board
Y
The CEO holds office on conditions determined by the Board
Y
The CEO must not engage in paid employment outside the duties of that office without Board approval
Y
The Board, on the recommendation of the CEO, may appoint a person, other than the chairperson, to act as CEO during any or every period during which the CEO is absent
Y
Audit investigations showed that Forestry had satisfactorily complied with all five requirements.
8.3 Corporate plan
As a GBE, Forestry is under statutory obligation to prepare a corporate plan and present it to the Minister and Treasurer, each financial year. The GBE Act outlines the particular requirements for the preparation of this document, including the information which must be disclosed in it.
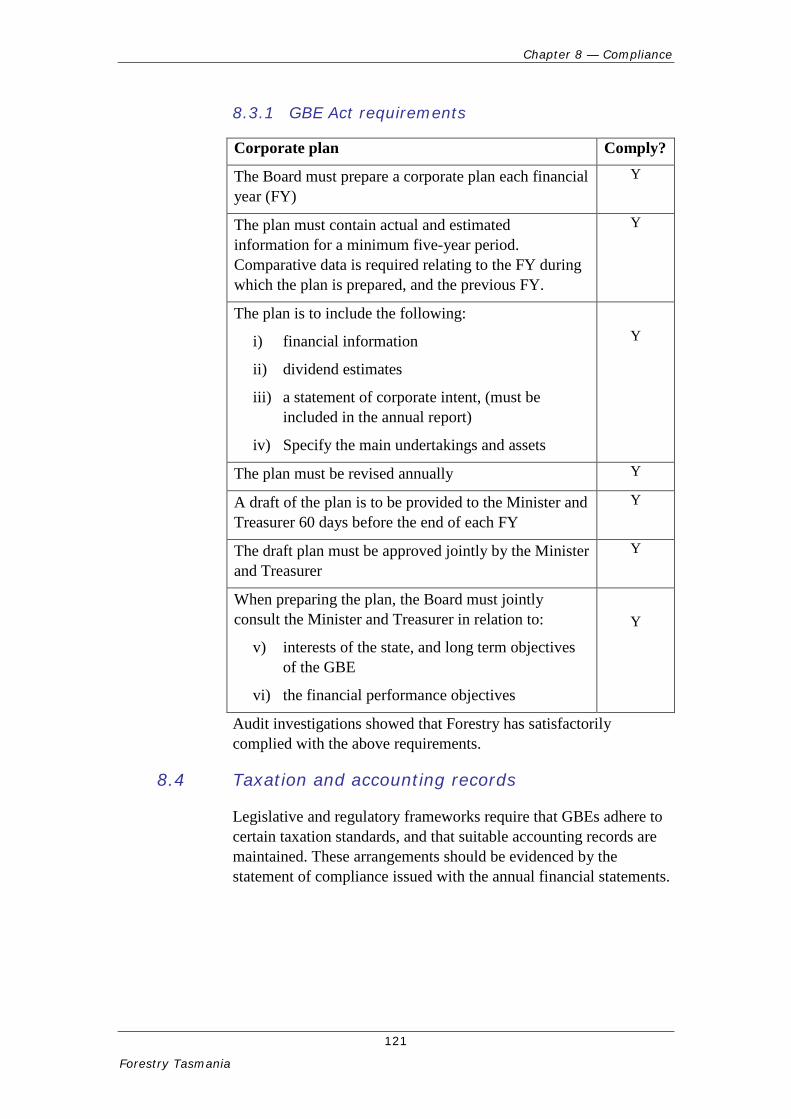
Chapter 8 — Compliance
121
Forestry Tasmania
8.3.1 GBE Act requirements
Corporate plan Comply?
The Board must prepare a corporate plan each financial year (FY)
Y
The plan must contain actual and estimated information for a minimum five-year period. Comparative data is required relating to the FY during which the plan is prepared, and the previous FY.
Y
The plan is to include the following:
i) financial information
ii) dividend estimates
iii) a statement of corporate intent, (must be included in the annual report)
iv) Specify the main undertakings and assets
Y
The plan must be revised annually Y
A draft of the plan is to be provided to the Minister and Treasurer 60 days before the end of each FY
Y
The draft plan must be approved jointly by the Minister and Treasurer
Y
When preparing the plan, the Board must jointly consult the Minister and Treasurer in relation to:
v) interests of the state, and long term objectives of the GBE
vi) the financial performance objectives
Y
Audit investigations showed that Forestry has satisfactorily complied with the above requirements.
8.4 Taxation and accounting records
Legislative and regulatory frameworks require that GBEs adhere to certain taxation standards, and that suitable accounting records are maintained. These arrangements should be evidenced by the statement of compliance issued with the annual financial statements.
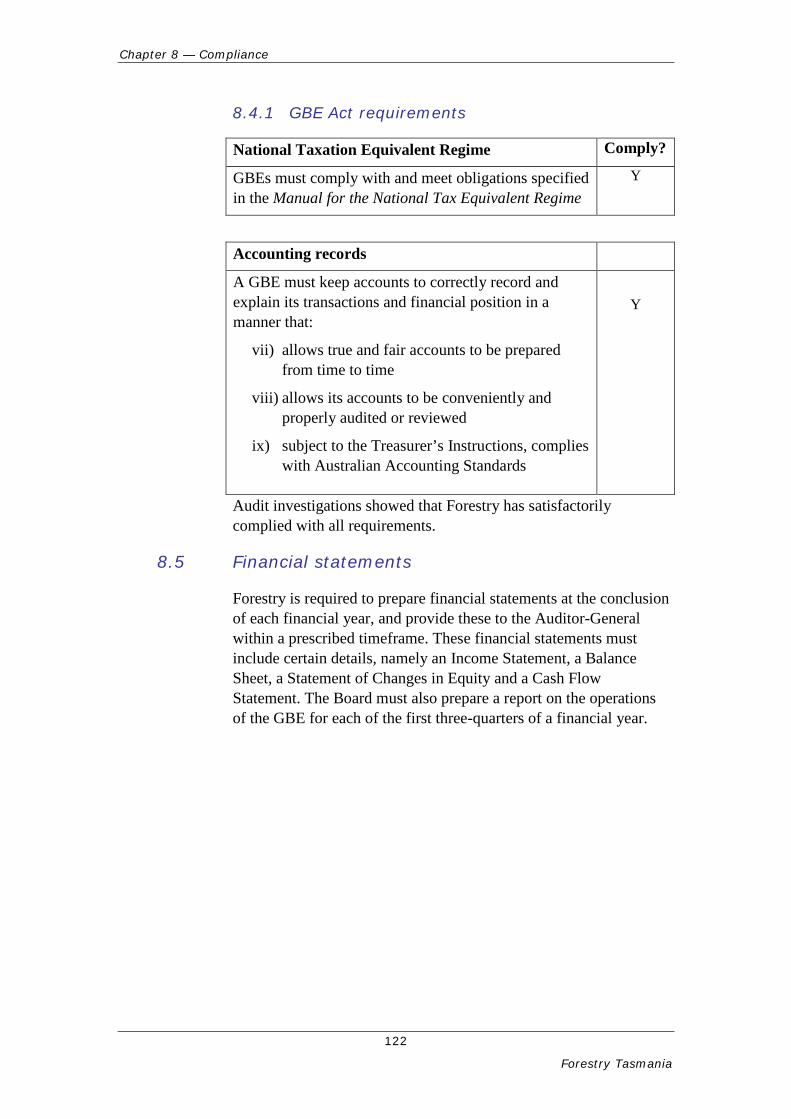
Chapter 8 — Compliance
122
Forestry Tasmania
8.4.1 GBE Act requirements
National Taxation Equivalent Regime Comply?
GBEs must comply with and meet obligations specified in the Manual for the National Tax Equivalent Regime
Y
Accounting records
A GBE must keep accounts to correctly record and explain its transactions and financial position in a manner that:
vii) allows true and fair accounts to be prepared from time to time
viii) allows its accounts to be conveniently and properly audited or reviewed
ix) subject to the Treasurer’s Instructions, complies with Australian Accounting Standards
Y
Audit investigations showed that Forestry has satisfactorily complied with all requirements.
8.5 Financial statements
Forestry is required to prepare financial statements at the conclusion of each financial year, and provide these to the Auditor-General within a prescribed timeframe. These financial statements must include certain details, namely an Income Statement, a Balance Sheet, a Statement of Changes in Equity and a Cash Flow Statement. The Board must also prepare a report on the operations of the GBE for each of the first three-quarters of a financial year.
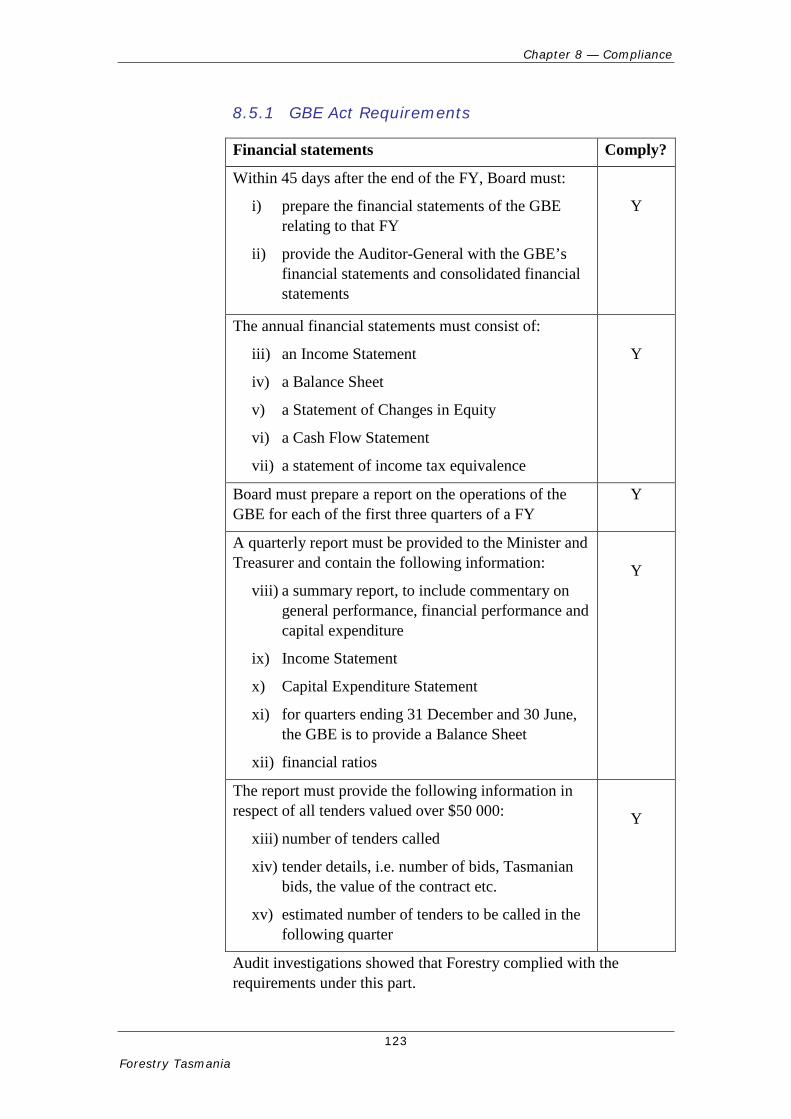
Chapter 8 — Compliance
123
Forestry Tasmania
8.5.1 GBE Act Requirements
Financial statements Comply?
Within 45 days after the end of the FY, Board must:
i) prepare the financial statements of the GBE relating to that FY
ii) provide the Auditor-General with the GBE’s financial statements and consolidated financial statements
Y
The annual financial statements must consist of:
iii) an Income Statement
iv) a Balance Sheet
v) a Statement of Changes in Equity
vi) a Cash Flow Statement
vii) a statement of income tax equivalence
Y
Board must prepare a report on the operations of the GBE for each of the first three quarters of a FY
Y
A quarterly report must be provided to the Minister and Treasurer and contain the following information:
viii) a summary report, to include commentary on general performance, financial performance and capital expenditure
ix) Income Statement
x) Capital Expenditure Statement
xi) for quarters ending 31 December and 30 June, the GBE is to provide a Balance Sheet
xii) financial ratios
Y
The report must provide the following information in respect of all tenders valued over $50 000:
xiii) number of tenders called
xiv) tender details, i.e. number of bids, Tasmanian bids, the value of the contract etc.
xv) estimated number of tenders to be called in the following quarter
Y
Audit investigations showed that Forestry complied with the requirements under this part.
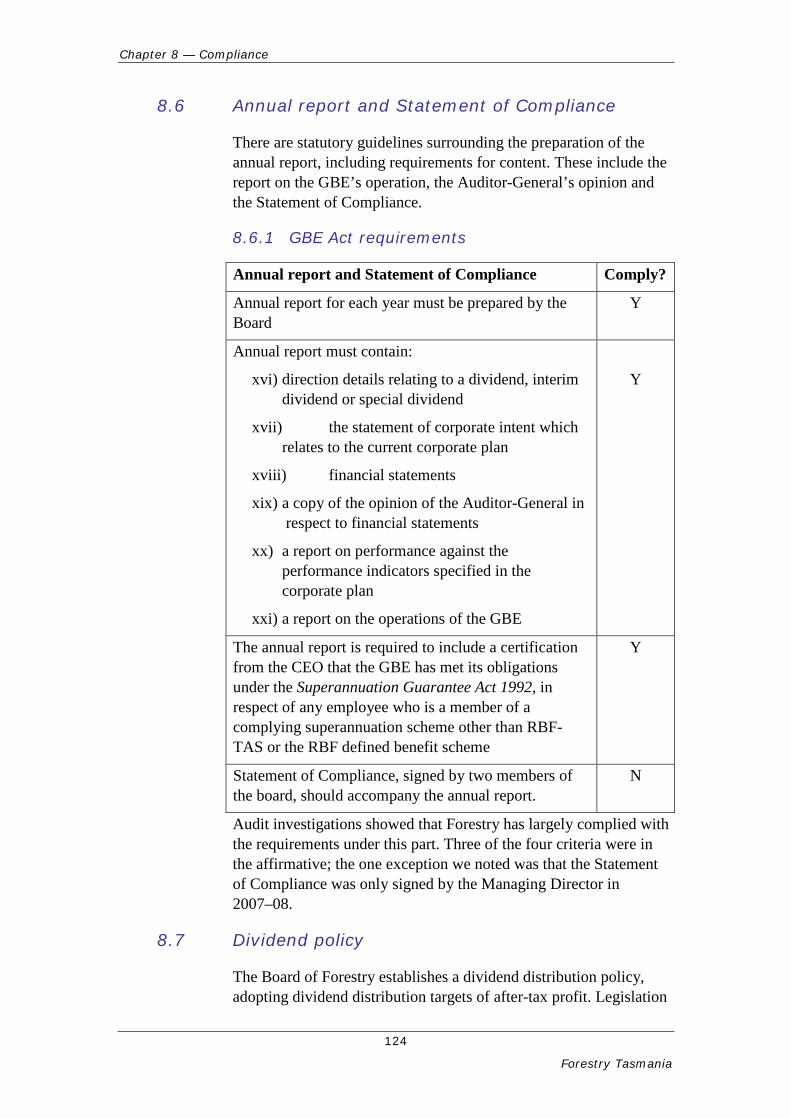
Chapter 8 — Compliance
124
Forestry Tasmania
8.6 Annual report and Statement of Compliance
There are statutory guidelines surrounding the preparation of the annual report, including requirements for content. These include the report on the GBE’s operation, the Auditor-General’s opinion and the Statement of Compliance.
8.6.1 GBE Act requirements
Annual report and Statement of Compliance Comply?
Annual report for each year must be prepared by the Board
Y
Annual report must contain:
xvi) direction details relating to a dividend, interim dividend or special dividend
xvii) the statement of corporate intent which relates to the current corporate plan
xviii) financial statements
xix) a copy of the opinion of the Auditor-General in respect to financial statements
xx) a report on performance against the performance indicators specified in the corporate plan
xxi) a report on the operations of the GBE
Y
The annual report is required to include a certification from the CEO that the GBE has met its obligations under the Superannuation Guarantee Act 1992, in respect of any employee who is a member of a complying superannuation scheme other than RBF-TAS or the RBF defined benefit scheme
Y
Statement of Compliance, signed by two members of the board, should accompany the annual report.
N
Audit investigations showed that Forestry has largely complied with the requirements under this part. Three of the four criteria were in the affirmative; the one exception we noted was that the Statement of Compliance was only signed by the Managing Director in 2007–08.
8.7 Dividend policy
The Board of Forestry establishes a dividend distribution policy, adopting dividend distribution targets of after-tax profit. Legislation
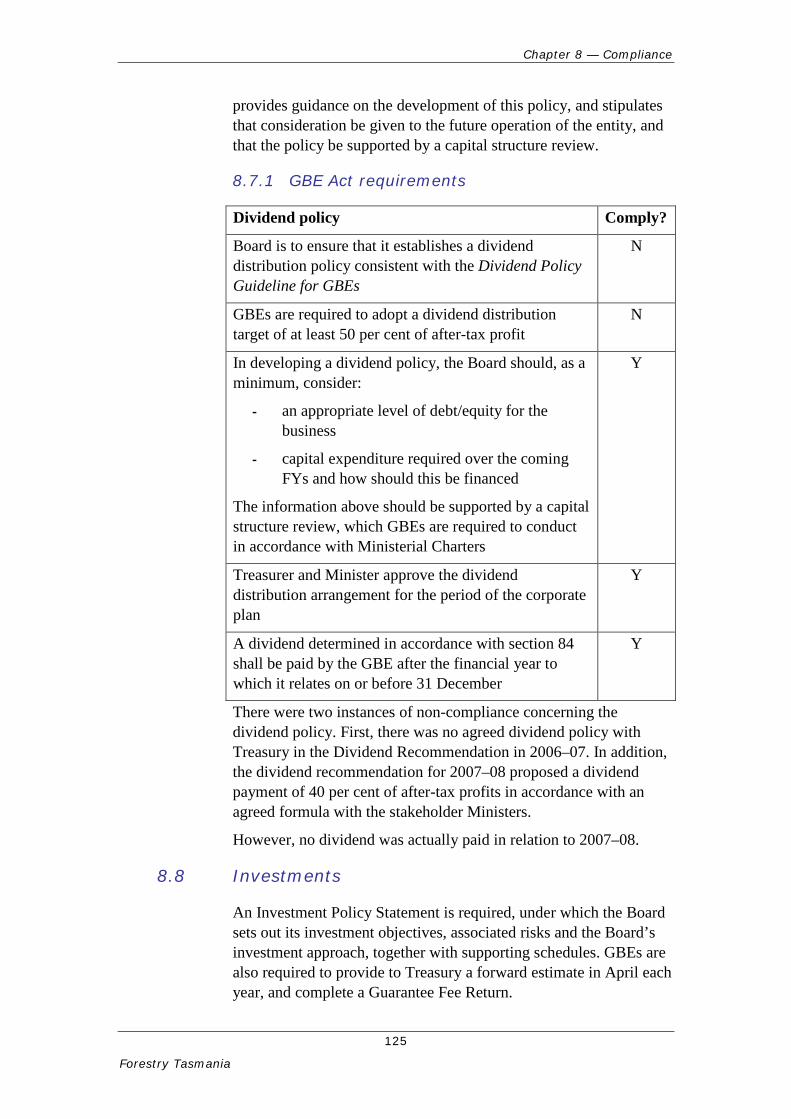
Chapter 8 — Compliance
125
Forestry Tasmania
provides guidance on the development of this policy, and stipulates that consideration be given to the future operation of the entity, and that the policy be supported by a capital structure review.
8.7.1 GBE Act requirements
Dividend policy Comply?
Board is to ensure that it establishes a dividend distribution policy consistent with the Dividend Policy Guideline for GBEs
N
GBEs are required to adopt a dividend distribution target of at least 50 per cent of after-tax profit
N
In developing a dividend policy, the Board should, as a minimum, consider:
- an appropriate level of debt/equity for the business
- capital expenditure required over the coming FYs and how should this be financed
The information above should be supported by a capital structure review, which GBEs are required to conduct in accordance with Ministerial Charters
Y
Treasurer and Minister approve the dividend distribution arrangement for the period of the corporate plan
Y
A dividend determined in accordance with section 84 shall be paid by the GBE after the financial year to which it relates on or before 31 December
Y
There were two instances of non-compliance concerning the dividend policy. First, there was no agreed dividend policy with Treasury in the Dividend Recommendation in 2006–07. In addition, the dividend recommendation for 2007–08 proposed a dividend payment of 40 per cent of after-tax profits in accordance with an agreed formula with the stakeholder Ministers.
However, no dividend was actually paid in relation to 2007–08.
8.8 Investments
An Investment Policy Statement is required, under which the Board sets out its investment objectives, associated risks and the Board’s investment approach, together with supporting schedules. GBEs are also required to provide to Treasury a forward estimate in April each year, and complete a Guarantee Fee Return.
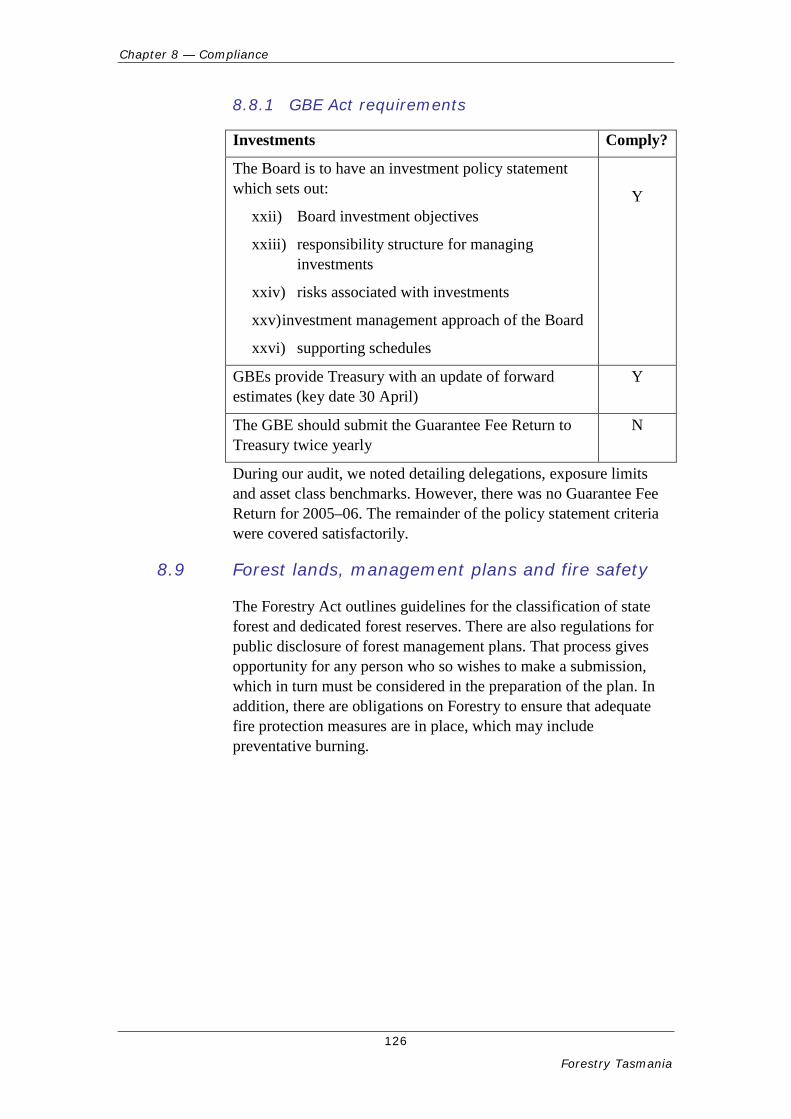
Chapter 8 — Compliance
126
Forestry Tasmania
8.8.1 GBE Act requirements
Investments Comply?
The Board is to have an investment policy statement which sets out:
xxii) Board investment objectives
xxiii) responsibility structure for managing investments
xxiv) risks associated with investments
xxv) investment management approach of the Board
xxvi) supporting schedules
Y
GBEs provide Treasury with an update of forward estimates (key date 30 April)
Y
The GBE should submit the Guarantee Fee Return to Treasury twice yearly
N
During our audit, we noted detailing delegations, exposure limits and asset class benchmarks. However, there was no Guarantee Fee Return for 2005–06. The remainder of the policy statement criteria were covered satisfactorily.
8.9 Forest lands, management plans and fire safety
The Forestry Act outlines guidelines for the classification of state forest and dedicated forest reserves. There are also regulations for public disclosure of forest management plans. That process gives opportunity for any person who so wishes to make a submission, which in turn must be considered in the preparation of the plan. In addition, there are obligations on Forestry to ensure that adequate fire protection measures are in place, which may include preventative burning.
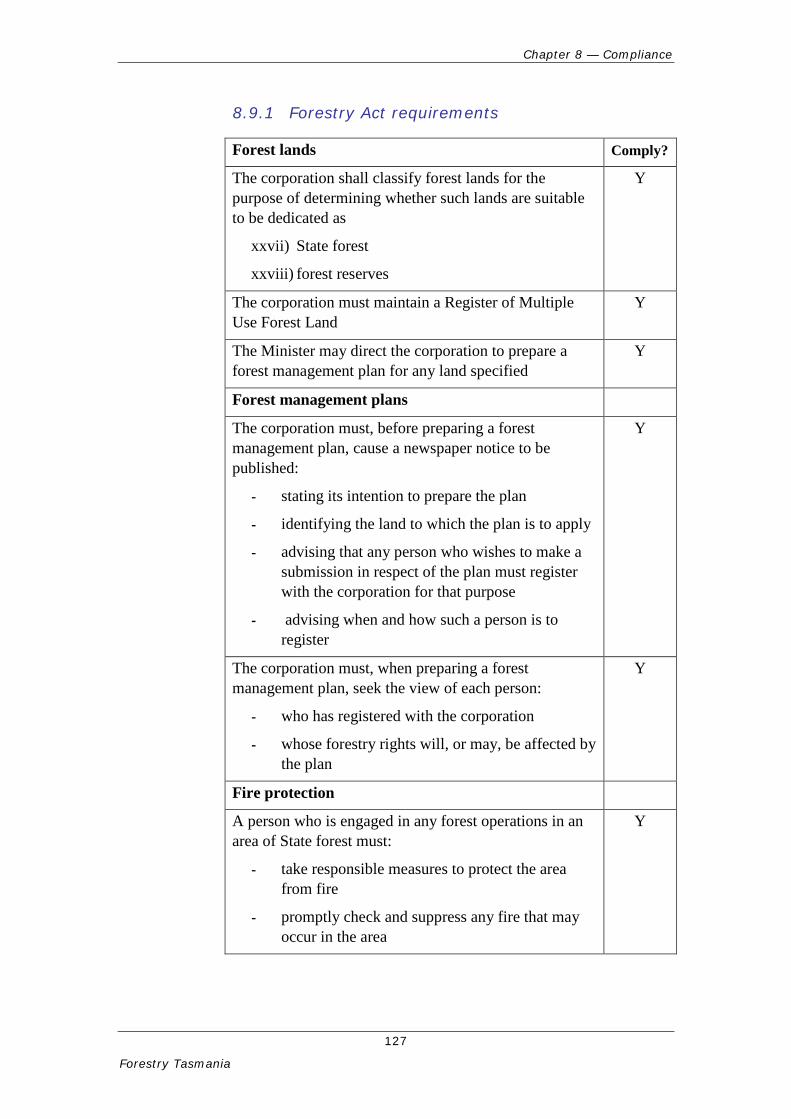
Chapter 8 — Compliance
127
Forestry Tasmania
8.9.1 Forestry Act requirements
Forest lands Comply?
The corporation shall classify forest lands for the purpose of determining whether such lands are suitable to be dedicated as
xxvii) State forest
xxviii) forest reserves
Y
The corporation must maintain a Register of Multiple Use Forest Land
Y
The Minister may direct the corporation to prepare a forest management plan for any land specified
Y
Forest management plans
The corporation must, before preparing a forest management plan, cause a newspaper notice to be published:
- stating its intention to prepare the plan
- identifying the land to which the plan is to apply
- advising that any person who wishes to make a submission in respect of the plan must register with the corporation for that purpose
- advising when and how such a person is to register
Y
The corporation must, when preparing a forest management plan, seek the view of each person:
- who has registered with the corporation
- whose forestry rights will, or may, be affected by the plan
Y
Fire protection
A person who is engaged in any forest operations in an area of State forest must:
- take responsible measures to protect the area from fire
- promptly check and suppress any fire that may occur in the area
Y
Chapter 8 — Compliance
128
Forestry Tasmania
A person may carry out reasonable and controlled burning-off operations with the written approval of the corporation as part of any forest operation or for the purpose of land management or fire safety
Y
Audit investigations showed that Forestry had satisfactorily complied with all requirements.
8.10 Conclusions
Forestry had complied with the majority of legislative and regulatory provisions required by the Government Business Enterprise Act and the Forestry Act. We noted compliance in 204 out of 207 criteria. The three exceptions, where total compliance was not achieved, were:
The Statement of Compliance, which is required to be signed by two Board members, was only signed by the Managing Director in 2007–08.
There was no agreed dividend policy with Treasury in 2006–07.
A Guarantee Fee Return was not submitted for 2005–06.
Our view is that these are minor exceptions. Forestry exhibited a very high level of compliance across all assessed areas.

This page left blank intentionally
130
Forestry Tasmania
Independent auditor’s conclusion
Independent auditor’s conclusion
131
Forestry Tasmania
Independent auditor’s conclusion This independent conclusion is addressed to the President of the Legislative Council and to the Speaker of the House of Assembly. It relates to my performance audit assessing the reasonableness of Forestry Tasmania’s (Forestry) financial performance and its economic contribution to Tasmania and compliance by it with aspects of its compliance responsibilities.
In developing the scope of this audit and completing my work, Forestry provided me with all of the information that I requested. There was no effort by any party to the audit to limit the scope of my work. This Report is a public document and its use is not restricted in any way by me or by any other person or party.
Responsibility of Forestry Tasmania
Forestry is responsible for operating in accordance with obligations established under the Forestry Act, the GBE Act, other relevant legislation, guidelines, corporate plans and Ministerial Charters.
Auditor-General’s responsibility
In the context of this performance audit, my responsibility was to express a conclusion on whether or not Forestry’s financial performance and economic contribution to Tasmania were reasonable and whether or not it complied with audited aspects of its compliance responsibilities.
I conducted my audit in accordance with Australian Auditing Standard ASAE 3500 Performance engagements, which required me to comply with relevant ethical requirements relating to audit engagements. I planned and performed the audit to obtain reasonable assurance whether Forestry’s financial performance and economic contribution to Tasmania were satisfactory and whether or not it complied with audited aspects of its compliance responsibilities.
My work involved obtaining evidence of management by applying the following methodology to gather evidence:
review of background materials on the operations of Forestry
review of applicable legislation
discussions with relevant staff from Forestry
analysis of financial data
Independent auditor’s conclusion
132
Forestry Tasmania
review of documentation related to compliance with legislation
equilibrium modelling using the Multi-regional Forecasting Model Computable General Equilibrium model, operated by the Centre of Policy Studies at Monash University (Monash).
I believe that the evidence I have obtained was sufficient and appropriate to provide a basis for my conclusion.
Auditor-General’s conclusion
Based on the audit objective and scope and for reasons outlined in the remainder of this Report, it is my conclusion that:
Forestry’s financial performance, over the 16 years of its existence since 1 July 1994 was low,
it made a positive contribution to Tasmania’s economy over the period 2006 to 2008 and
it complied with those aspects of its compliance responsibilities audited.
H M Blake
Auditor-General
5 July 2011
Independent auditor’s conclusion
133
Forestry Tasmania

This page left blank intentionally
Recent reports
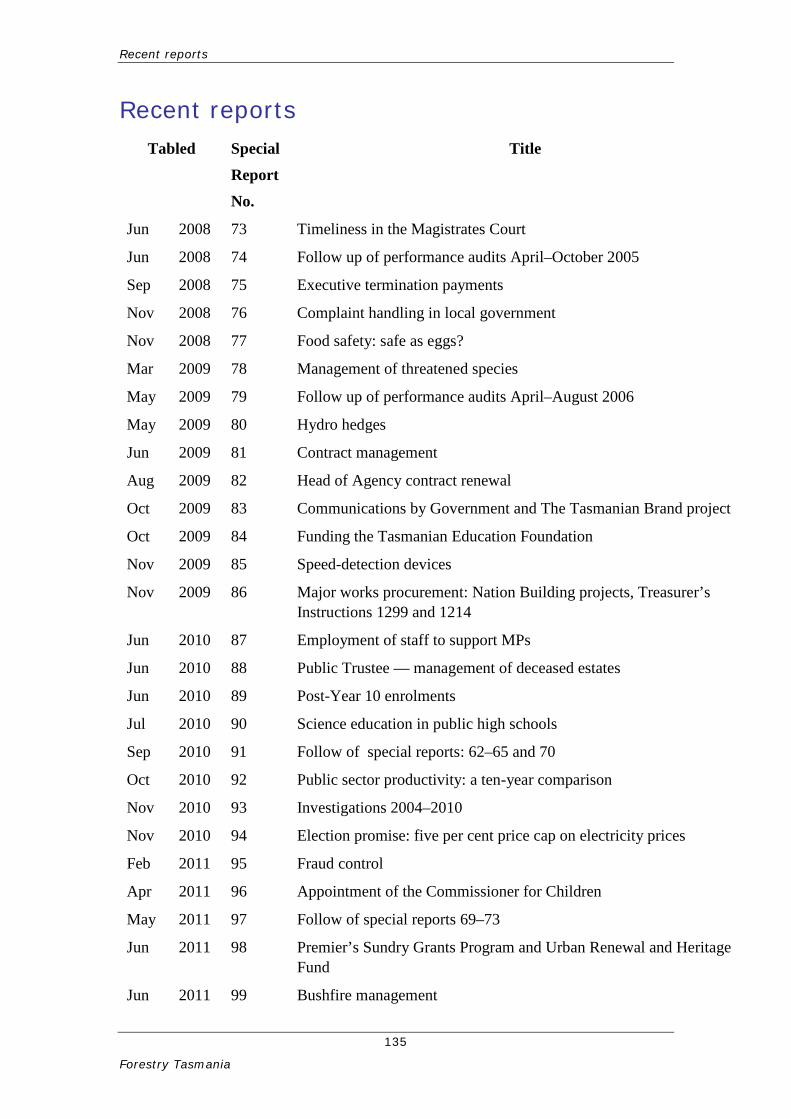
Recent reports
135
Forestry Tasmania
Recent reports Tabled Special
Report No.
Title
Jun 2008 73 Timeliness in the Magistrates Court
Jun 2008 74 Follow up of performance audits April–October 2005
Sep 2008 75 Executive termination payments
Nov 2008 76 Complaint handling in local government
Nov 2008 77 Food safety: safe as eggs?
Mar 2009 78 Management of threatened species
May 2009 79 Follow up of performance audits April–August 2006
May 2009 80 Hydro hedges
Jun 2009 81 Contract management
Aug 2009 82 Head of Agency contract renewal
Oct 2009 83 Communications by Government and The Tasmanian Brand project
Oct 2009 84 Funding the Tasmanian Education Foundation
Nov 2009 85 Speed-detection devices
Nov 2009 86 Major works procurement: Nation Building projects, Treasurer’s Instructions 1299 and 1214
Jun 2010 87 Employment of staff to support MPs
Jun 2010 88 Public Trustee — management of deceased estates
Jun 2010 89 Post-Year 10 enrolments
Jul 2010 90 Science education in public high schools
Sep 2010 91 Follow of special reports: 62–65 and 70
Oct 2010 92 Public sector productivity: a ten-year comparison
Nov 2010 93 Investigations 2004–2010
Nov 2010 94 Election promise: five per cent price cap on electricity prices
Feb 2011 95 Fraud control
Apr 2011 96 Appointment of the Commissioner for Children
May 2011 97 Follow of special reports 69–73
Jun 2011 98 Premier’s Sundry Grants Program and Urban Renewal and Heritage Fund
Jun 2011 99 Bushfire management
136
Forestry Tasmania
Current projects
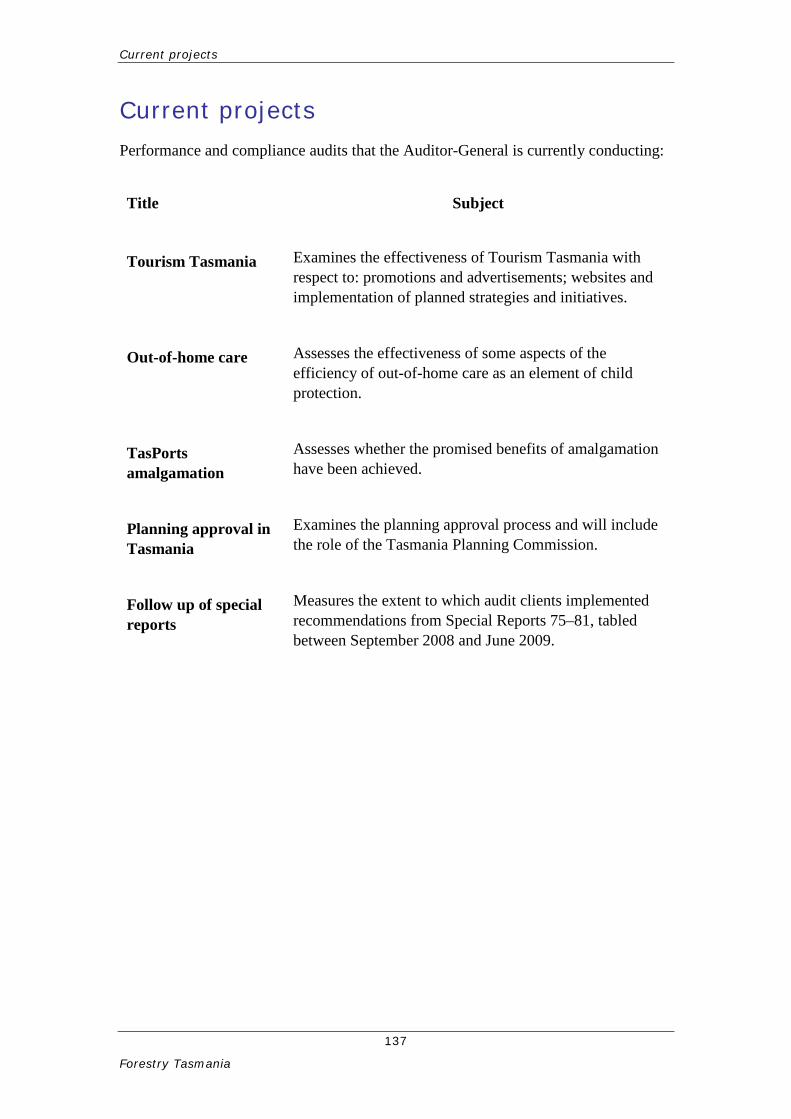
Current projects
137
Forestry Tasmania
Current projects Performance and compliance audits that the Auditor-General is currently conducting:
Title
Subject
Tourism Tasmania Examines the effectiveness of Tourism Tasmania with respect to: promotions and advertisements; websites and implementation of planned strategies and initiatives.
Out-of-home care Assesses the effectiveness of some aspects of the efficiency of out-of-home care as an element of child protection.
TasPorts amalgamation
Assesses whether the promised benefits of amalgamation have been achieved.
Planning approval in Tasmania
Examines the planning approval process and will include the role of the Tasmania Planning Commission.
Follow up of special reports
Measures the extent to which audit clients implemented recommendations from Special Reports 75–81, tabled between September 2008 and June 2009.
138
Forestry Tasmania
Appendix 1 — About this Report
Appendix 1 — About this Report
139
Forestry Tasmania
Appendix 1 — About this Report
Background
As noted in the Introduction to this Report, this audit commenced in April 2008. In addition to this Report and drafts of it, two quite separate draft reports were issued to Forestry, one in April 2009 and another in January 2010.
April 2009 draft report
This draft report evaluated Forestry’s financial performance, where the focus was on aspects of profitability and economic and compliance performance up to 30 June 2008. While making no recommendations, it broadly concluded that:
Financial analysis chapter
Profits have trended downwards since 1995, mainly because of a substantial decline in softwood revenues. Other than softwood, quantities sold had shown a small increase, prices had fallen and costs had not changed substantially.
The return on assets has been consistently poor. Analysis suggested Forestry’s assets were over-valued, but at recent levels of profit, return on assets would only have been reasonable if no value was assigned to the biological assets (trees) or land improvements (roads).
Without stronger financial performance, investment in roads and plantations over the past 15 years will not yield future benefits to Forestry and arguably should be expensed rather than capitalised. On that basis, it can be argued that ordinary operations from 1994 to 2008 have yielded little profit. It also follows that dividends paid had been entirely funded from abnormal receipts such as Commonwealth compensation money.
Economic analysis chapter
Modelling by Monash for the period 2005–08 indicated an average net contribution to the Tasmanian economy of $111m per year. However, following further discussion, this conclusion was updated to place it into context (see Chapter 7).
Appendix 1 — About this Report
140
Forestry Tasmania
Compliance chapter
Forestry Tasmania had complied with the majority of legislative and regulatory provisions required by the Government Business Enterprise Act 1995 and the Forestry Act 1920. While some exceptions were reported, Forestry exhibited a high level of compliance across the remaining criteria.
Action taken following discussion of the April 2009 draft report
Discussions with Forestry management at that time lead to re-assessments of the manner in which it valued its assets. We sought independent expert advice. This work resulted in only minor changes as evidenced by Forestry’s audited 2008–09 annual financial statements which reported total assets of $969.376m including the forest estate and biological assets at an amount of $777.719m.
Work then recommenced on this performance audit as there was a need to re-visit the April 2009 draft report by updating our assessments to include:
the 2008–09 financial results
comparison with other publicly owned forestry businesses
further analysis and quantification of the financial impacts on Forestry of expenditure by it on community service-type obligations (the word ‘type’ is included here because, as will be seen from Chapter 5, Forestry has never been funded for CSOs)
separation of the financial analysis into three distinct periods, namely pre- and post-RFA in 1998 and the period 2007–08 to 2008–09
re-visiting our compliance audit work in view of new material provided by Forestry.
January 2010 draft report
This draft report was prepared following the further analysis referred to above and included new chapters dealing with the legislative context in which Forestry operates, consideration of rates of return relevant to the forestry sector, comparison of financial performance, primarily focussed on profitability, with other publicly owned forestry entities and comparison and further summary
Appendix 1 — About this Report
141
Forestry Tasmania
financial analysis. It included seven recommendations and the conclusions outlined below:
New Context chapter
There is tension between Forestry’s legislative requirements in particular those relating to the need to manage the forests sustainably and to provide a commercial rate of return.
Forestry has not quantified or publicly reported all of the factors that impact on its profitability (this primarily related to its community service type obligations).
Forestry’s approved 2008–09 Corporate Plan anticipates that it will generate low rates of return. However, the Corporate Plan does not deal comprehensively with all of the financial and economic responsibilities outlined in the GBE Act or the Forestry Act.
New Rates of return chapter
Determining which performance measures to apply when assessing Forestry’s performance proved problematic. We decided to apply an accounting return model and to benchmark this against the Commonwealth’s long term bond rate.
Our initial assessment was that the rate of return targets set by Forestry in its Corporate Plan was low.
New Financial performance — summary chapter
Forestry’s operating margin totalled $173.237m during the 14 years ended 30 June 2008 with the annual average being $17.986m in the four years to 30 June 1998 but dropped to an average of $12.661m per annum thereafter. Its annual operating cash flows exceeded $19.000m over the 14 years under review but declined to $9.500m per annum in the three years to 30 June 2008.
Funds generated from the RFA totalled $71.000m, most of which was invested in infrastructure and plantation development. However, the RFA appears to have negatively impacted Forestry’s short term profitability the amount of which remains unquantified.
During the 14 years ended 30 June 2008, Forestry invested in excess of $370.000m in property, plant, equipment and plantation development. This included

Appendix 1 — About this Report
142
Forestry Tasmania
investment of funds generated from the RFA, $71.000m, and net proceeds from the sale of its plantation assets, $9.668m.
Forestry’s planning cycle is based on a conventional four year cycle, not on the life-cycle of its biological assets.
$139.115m was returned to the State government in the form of taxes, dividends and capital.
Over the period under review, particularly since 2002, Forestry’s cash position has tightened leading to debt of $40.800m and a situation where, at 30 June 2009, all of its cash on hand related to unspent TCFA monies.
Costs incurred on CSOs, and in satisfying other legislative responsibilities as well as the need to manage its forests in a sustainable manner, have cost Forestry between $30.000m and $40.000m since June 1998.
Previous Financial performance analysis chapter
Conclusions not included in the April 2009 draft report were:
Profits have trended downwards since 1995, particularly since 1997–98, mainly because of a substantial decline in softwood revenues.
Without stronger financial performance, investment in roads and plantations over the past 15 years may not yield future benefits to Forestry and arguably should be expensed rather than capitalised. On that basis, it can be argued that ordinary operations from 1994 to 2008 yielded little profit.
However, after adjusting for CSOs and accounting adjustments, such as the impacts on profitability of adjustments to the carrying amounts of biological assets, Forestry earned profits every year although the trend is downwards.
There is a need for Forestry to examine its indirect (fixed) costs and to manage its tight cash flow position.
Previous Economic performance chapter
Our conclusion was unchanged.
Previous Compliance chapter
Our findings were revised slightly with the main conclusion being that Forestry had complied with the majority of legislative and

Appendix 1 — About this Report
143
Forestry Tasmania
regulatory provisions required by the GBE Act and the Forestry Act. We noted compliance of 201 out of 207 criteria. The six exceptions were relatively minor and Forestry exhibited a high level of compliance across the remaining criteria.
Action taken following discussion of the January 2010 draft report
Soon after issuing the draft January 2010 report, meetings were held with senior management and with the Forestry Board. The January draft report had raised serious misgivings by Board members regarding the model applied to value its biological and forest estate assets (mainly land and road assets). The Board also concurred with our view that work was needed to identify and quantify the level of CSOs it provided.
These concerns led to the appointment of a United States-based firm (the valuer) with international expertise in the forestry sector to carry out a valuation effective 30 June 2010. We agreed to postpone finalisation of this Report until after the valuer had completed their work and until after completion of the June 2010 audit of Forestry’s financial statements.
Valuer’s valuation and resulting financial reporting impact
The valuer concluded that Forestry’s biological and forest estate assets should be valued as an integrated forestry business (in other words, an enterprise wide and integrated production unit approach). This approach resulted in significant changes to the valuation with consequent impacts on Forestry’s financial statements. It also quantified, for the first time, Forestry’s obligations as they related to managing the State’s formal reserves and special timber zones, collectively referred to as ‘obligations for non-commercial forest zones’.
On this basis, the combined amount, valued as an integrated forestry business, but before including joint venture assets, of Forestry’s biological and forest estate assets was $296.700m, a decline of $389.719m compared to the position reported at 30 June 2009. Table 20 below details what these valuations, and changes therein, comprise.
Appendix 1 — About this Report
144
Forestry Tasmania
Table 20: Component parts of integrated forest valuation
The change to the valuation approach adopted, and quantification of some CSOs, had a significant negative impact on Forestry’s net assets at 30 June 2010. This change has a major impact on any discussion about rates of return on assets or equity achieved by Forestry over a 16-year period. To illustrate this still further, Forestry’s total assets at the start and end dates of this audit were:
At 30 June 1994 $2.227bn
At 30 June 2010 $0.701bn.
This was discussed in Chapters 2 and 4.
Reasons for the changes outlined in Table 20, and how the Forestry Board chose to report them, were detailed on page 34 of the Report of the Auditor-General Volume 3 Government Business Enterprises, State Owned Companies and Superannuation Funds 2009–10 dated 18 November 2010 and are not repeated here.
We note however that, while the valuer was able to determine an amount representing Forestry’s obligation for managing the State’s non-commercial forest zones, Forestry did not separately identify those CSO-related costs it incurs in managing its commercial forests. These costs include, for example:
the possible negative financial impact of the legislative requirement to, each year, from multiple use forest land, make available, at prescribed specifications, for the veneer and sawmilling industries a minimum aggregate quantity of 300 000 cubic metres of eucalypt veneer logs and eucalypt sawlogs
fire protection and net fire fighting, research and conservation, provision of public road access, browsing
Appendix 1 — About this Report
145
Forestry Tasmania
mammal control and tourism related costs it incurs in commercial forests.
This was discussed in Chapter 5.
Updated economic analysis
Further discussions were held with the authors of the economic analysis referred to in Chapter 7 of this Report the outcomes from which are noted in that Chapter.
Compliance
Further evidence was obtained from Forestry in support of their view that our initial finding regarding their delegation arrangements needed revision.
Way forward for this Report
A strong focus in our first two draft reports was on Forestry’s profitability expressed as a percentage of either assets or equity. As previously indicated, we concluded in both our first two draft reports that the returns generated were poor.
A reason we identified from our first draft report was that Forestry’s assets may have been overstated. That conclusion has now been confirmed. In our second draft report we suggested that Forestry’s profitability, and therefore its rates of return, were negatively impacted by some of its — at that time — unquantified CSO obligations.
This could, therefore, suggest that if we re-performed our analysis based on the lower values for assets, assuming these lower values had applied throughout the period of review, and adjusted for fully quantified CSO costs, we might find that the rates of return achieved prior to recognising these costs were in fact stronger. There is substance to this argument particularly as it relates to, for example, the value attributed to land and non-commercial forest zone CSOs.
To illustrate the possible relevance of this approach, we include below Figure 1 prepared by Forestry.
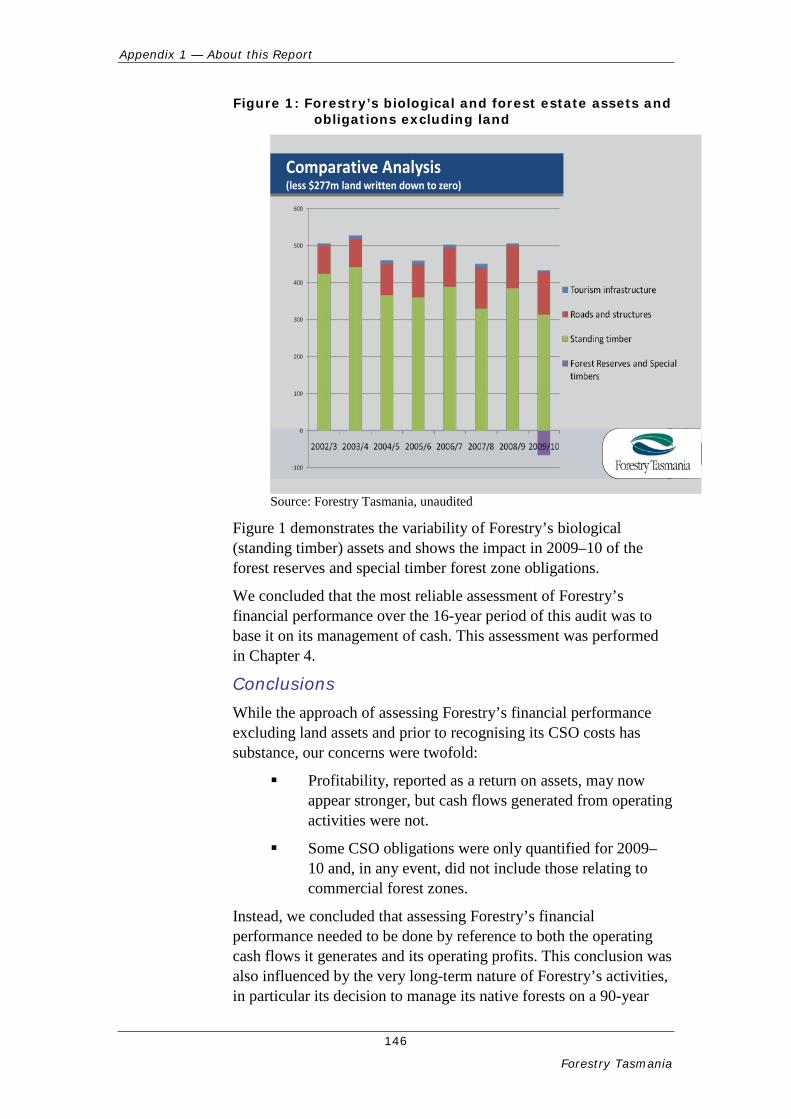
Appendix 1 — About this Report
146
Forestry Tasmania
Figure 1: Forestry’s biological and forest estate assets and obligations excluding land
Comparative Analysis (less $277m land written down to zero)Comparative Analysis (less $277m land written down to zero)
Source: Forestry Tasmania, unaudited
Figure 1 demonstrates the variability of Forestry’s biological (standing timber) assets and shows the impact in 2009–10 of the forest reserves and special timber forest zone obligations.
We concluded that the most reliable assessment of Forestry’s financial performance over the 16-year period of this audit was to base it on its management of cash. This assessment was performed in Chapter 4.
Conclusions While the approach of assessing Forestry’s financial performance excluding land assets and prior to recognising its CSO costs has substance, our concerns were twofold:
Profitability, reported as a return on assets, may now appear stronger, but cash flows generated from operating activities were not.
Some CSO obligations were only quantified for 2009–10 and, in any event, did not include those relating to commercial forest zones.
Instead, we concluded that assessing Forestry’s financial performance needed to be done by reference to both the operating cash flows it generates and its operating profits. This conclusion was also influenced by the very long-term nature of Forestry’s activities, in particular its decision to manage its native forests on a 90-year
Appendix 1 — About this Report
147
Forestry Tasmania
rotation. Profitability over this period can fluctuate significantly depending on where within the cycle Forestry is at any point in time.
Therefore, we concluded that this final report would focus on operating cash flows as well as on profits.