Auditing with technology: using generalized audit software in the
23
Teaching and educational note Auditing with technology: using generalized audit software in the classroom Robert Nieschwietz a , Kurt Pany b, *, Jian Zhang b a College of Business and Administration, University of Colorado at Denver, Denver, CO 80217, USA b School of Accountancy and Information Management, College of Business, Arizona State University, Tempe, AZ 85287, USA Received 1 June 2001; received in revised form 1 November 2001; accepted 1 February 2002 Abstract Over the past decade, improvements in generalized audit software have created a situation in which auditing ‘‘through’’ the computer may be both more effective and more efficient than in the past. This paper describes a series of assignments that allow an instructor to bring a meaningful application of generalized audit software to the undergraduate auditing classroom. The assign- ments we have developed are meant to supplement traditional audit coursework by providing students an experience of applying audit procedures electronically. # 2002 Elsevier Science Ltd. All rights reserved. Keywords: Generalized audit software; Technology; IDEA Advances in information technology have drastically changed the manner in which information is recorded, processed, and reported. Concurrent with those changes have been improvements in generalized audit software programs that have created a situation in which auditing through the computer has become much easier. For example, auditors may now access a variety of types of data through use of various commercial generalized audit software applications such as IDEA (Inter- active Data & Extraction & Analysis) and ACL (Audit Command Language). As indicated by authors such as Lanza (1998) and Warner (1998), these approaches allow auditors to be more efficient and often more effective as electronic environ- ments are becoming standard among clients. As the profession continues to respond J. of Acc. Ed. 20 (2002) 307–329 www.elsevier.com/locate/jaccedu 0748-5751/02/$ - see front matter # 2002 Elsevier Science Ltd. All rights reserved. PII: S0748-5751(02)00011-8 * Corresponding author. Tel.: +1-480-965-6849. E-mail address: [email protected] (K. Pany).
Transcript of Auditing with technology: using generalized audit software in the

Teaching and educational note
Auditing with technology: using generalizedaudit software in the classroom
Robert Nieschwietza, Kurt Panyb,*, Jian Zhangb
aCollege of Business and Administration, University of Colorado at Denver, Denver, CO 80217, USAbSchool of Accountancy and Information Management, College of Business,
Arizona State University, Tempe, AZ 85287, USA
Received 1 June 2001; received in revised form 1 November 2001; accepted 1 February 2002
Abstract
Over the past decade, improvements in generalized audit software have created a situation in
which auditing ‘‘through’’ the computer may be bothmore effective andmore efficient than in thepast. This paper describes a series of assignments that allow an instructor to bring a meaningfulapplication of generalized audit software to the undergraduate auditing classroom. The assign-ments we have developed are meant to supplement traditional audit coursework by providing
students an experience of applying audit procedures electronically. # 2002 Elsevier Science Ltd.All rights reserved.
Keywords: Generalized audit software; Technology; IDEA
Advances in information technology have drastically changed the manner inwhich information is recorded, processed, and reported. Concurrent with thosechanges have been improvements in generalized audit software programs that havecreated a situation in which auditing through the computer has become much easier.For example, auditors may now access a variety of types of data through use ofvarious commercial generalized audit software applications such as IDEA (Inter-active Data & Extraction & Analysis) and ACL (Audit Command Language). Asindicated by authors such as Lanza (1998) and Warner (1998), these approachesallow auditors to be more efficient and often more effective as electronic environ-ments are becoming standard among clients. As the profession continues to respond
J. of Acc. Ed. 20 (2002) 307–329
www.elsevier.com/locate/jaccedu
0748-5751/02/$ - see front matter # 2002 Elsevier Science Ltd. All rights reserved.
PI I : S0748-5751(02 )00011 -8
* Corresponding author. Tel.: +1-480-965-6849.
E-mail address: [email protected] (K. Pany).

to—and in some cases even lead—advances in technology, we believe that it isimportant to incorporate this technology into the audit classroom. This approachcan reinforce students’ understanding of basic audit concepts and prepare them forusing technology in the workplace.Our approach is consistent with a case presented by Gelinas, Levy, and Thibodeu
(2001) that uses ACL as an audit tool for the classroom. Our approach differs inthat we provide six relatively structured assignments that are designed to integratemore directly with the revenue and conversion cycles in the basic auditing course,followed by an unstructured assignment that requires detection of fraud. While ourassignments become increasingly complex, an instructor may choose to use one ormore of them, although solution of the final assignment by itself is difficult for mostwithout having worked at least some of the other exercises.1 Students may work theassignments either on their own computer or on the university’s system. In this paper,we describe the nature of various assignments we have created to help beginningauditing students to understand electronic audit procedures and to gain some profi-ciency in using generalized audit software. These assignments allow students toperform the procedures with a minimum of classroom introductory material (ordin-arily about 10–20 min per assignment). The assignments range from simple extrac-tion of data from a single file to analysis of multiple files of a relational database.As noted, two available audit software packages are IDEA and ACL.2 While we
have used and are familiar with both packages, the intent of this article is to presentinformation on assignments that we developed using as a base the IDEA GettingStarted Guide originally prepared by the Canadian Institute of Chartered Accoun-tants and the IDEA For Windows Case Study, developed by BDO Seidman, LLPand Dr. Jerry L. Turner. Although our emphasis is upon IDEA, the focus ofinstructor presentations should be upon the functionality of the software, makingthe learning experience applicable to any package students may encounter in theirprofessional careers.In the remainder of the paper we summarize a series of assignments that we have
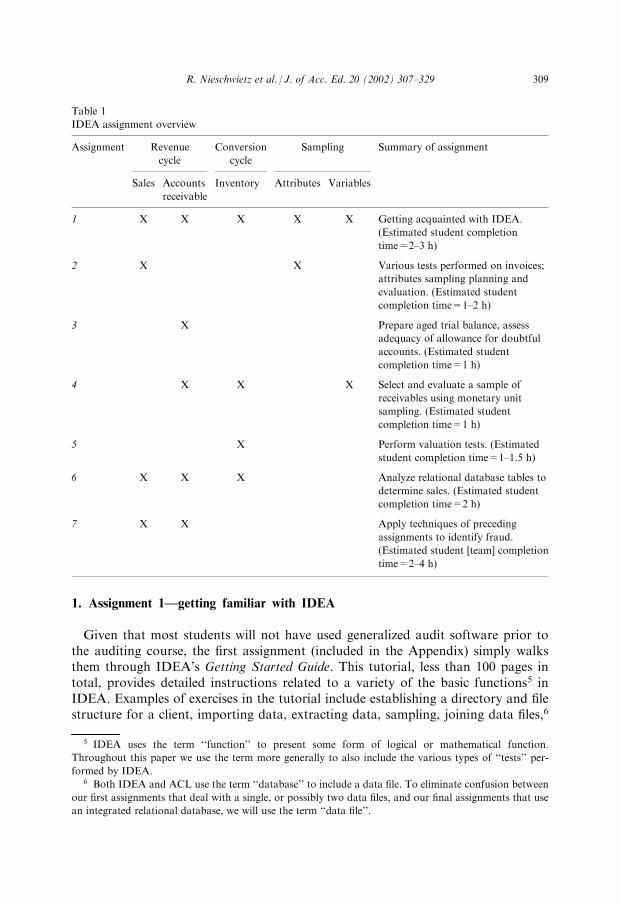
used at Arizona State University and at the University of Colorado at Denver. Wewill make these assignments available, without charge, to interested readers.3 Table 1provides an overview of the topical coverage of the assignments. The data used inthese assignments are either provided by IDEA or adapted from other sources. Theinstructor wishing to incorporate IDEA into the classroom should first contactAudimation Services, Inc.4 for information on obtaining the software, and then, ifso desired, obtain the assignments from us.
1 For example, an instructor may wish to move into this area gradually by using only the first assign-
ment which relies heavily on the simple IDEA Getting Started Guide.2 In addition to these packages, many larger firms have developed proprietary software that performs
similar functions.3 Several of the assignments are included in the Appendix. However, all of the assignments include
accessing data in an electronic format. The authors should be contacted for current versions of assign-
ments and data files.4 The address of Audimation Services, Inc. is: 16151 Cairnway, Suite 100, Houston, Texas 77084,
USA; Phone: +1-888-641-2800; fax: +1-281-345-2399; Web site: www.audimation.com.
308 R. Nieschwietz et al. / J. of Acc. Ed. 20 (2002) 307–329
1. Assignment 1—getting familiar with IDEA
Given that most students will not have used generalized audit software prior tothe auditing course, the first assignment (included in the Appendix) simply walksthem through IDEA’s Getting Started Guide. This tutorial, less than 100 pages intotal, provides detailed instructions related to a variety of the basic functions5 inIDEA. Examples of exercises in the tutorial include establishing a directory and filestructure for a client, importing data, extracting data, sampling, joining data files,6
Table 1
IDEA assignment overview
Assignment Revenue
cycle
Conversion
cycle
Sampling Summary of assignment
Sales Accounts
receivable
Inventory Attributes Variables
1 X X X X X Getting acquainted with IDEA.
(Estimated student completion
time=2–3 h)
2 X X Various tests performed on invoices;
attributes sampling planning and
evaluation. (Estimated student
completion time=1–2 h)
3 X Prepare aged trial balance, assess
adequacy of allowance for doubtful
accounts. (Estimated student
completion time=1 h)
4 X X X Select and evaluate a sample of
receivables using monetary unit
sampling. (Estimated student
completion time=1 h)
5 X Perform valuation tests. (Estimated
student completion time=1–1.5 h)
6 X X X Analyze relational database tables to
determine sales. (Estimated student
completion time=2 h)
7 X X Apply techniques of preceding
assignments to identify fraud.
(Estimated student [team] completion
time=2–4 h)
5 IDEA uses the term ‘‘function’’ to present some form of logical or mathematical function.
Throughout this paper we use the term more generally to also include the various types of ‘‘tests’’ per-
formed by IDEA.6 Both IDEA and ACL use the term ‘‘database’’ to include a data file. To eliminate confusion between
our first assignments that deal with a single, or possibly two data files, and our final assignments that use
an integrated relational database, we will use the term ‘‘data file’’.
R. Nieschwietz et al. / J. of Acc. Ed. 20 (2002) 307–329 309

and preparing reports. Working through the Guide ordinarily takes studentsapproximately 2–3 hours. Once done, they should have a cursory knowledge of howIDEA works along with a solid foundation to base future assignments. Because theguide presents information in a very ‘‘cookbook’’, detailed style, students are ordinarilyable to complete it with minimal, if any, instructor assistance.Our classroom introduction of the material involves making students familiar with
any nuances of our university’s computer system,7 motivating the use of generalizedaudit software, and quickly performing some of the procedures presented in theGetting Started Guide. For instance, one of the procedures included in the tutorial isto extract transactions occurring on a particular day of the week. We quickly per-form this procedure and then, to give this function practicality, frame it in the con-text of a business that is only open certain days of the week. By examining if anysales occurred on non-business days, the procedure is testing the existence assertionfor sales transactions recorded in the revenue cycle. In summary, the goal of this firstassignment is to provide the student with information on a number of the proce-dures and functions performed by IDEA. To the extent possible, we additionally tryto motivate the logic for the functions performed.
2. Assignment 2—attributes sampling for the revenue cycle
The second assignment (included in the Appendix) focuses on attributes samplingand tests of controls commonly performed in the revenue cycle. This assignmentdemonstrates how to electronically apply the attribute sampling methods studentshave discussed in class. In doing so, students learn how to calculate, test, and eval-uate the sample results using IDEA. Also, since each student is assigned a differentrandom seed for their sample, the results vary among students, helping them gain amore thorough understanding of sampling risk. Students use a population of 900sales transactions to complete three basic tests:
1. Search for duplicate invoices.2. Search for gaps in the sequence of invoices.3. Verify the clerical accuracy of invoices.
As searching for duplicate invoices is a function included in the first assignment,detailed instructions are not necessary for the first test. The second test is to searchfor gaps in the sequence of invoices. This would ordinarily also be a very simpleprocedure as IDEA includes a function to test the sequence. Yet, the population we
7 At Arizona State University, IDEA is installed on the university computer system. In addition, the
software is made available to students who wish to install it on their own computers. Audimation Ser-
vices (see note 4) makes the software available at a token cost (currently less than $5) and allows multiple
use of the software. For example, we acquired eight copies of the software and placed them on reserve
at the library where they were available to students for overnight checkout and installation on their
computers.
310 R. Nieschwietz et al. / J. of Acc. Ed. 20 (2002) 307–329
use tends to make this a bit more difficult as the field has been established in the fileas character (text) and not numeric, thus making the concept of a ‘‘sequence’’ inap-plicable. The character field must first be converted from character to numeric formatand students must then use IDEA’s ‘‘gap’’ function to identify gaps in the sequenceof invoices.The final test in this second assignment is to verify the clerical accuracy of the
extensions of sales transactions. This test provides professors an excellent opportu-nity to (1) compare electronic results to those obtained using the course’s text, and(2) compare the characteristics of a sample with those of the entire underlyingpopulation.Students first use IDEA to select and evaluate the extensions for a statistical
sample of invoices. We then ask students to reperform the analysis using the tablesincluded in their text and compare IDEA results with those using the text.8 Oper-ationally, each student bases sample selection on a random seed derived from his orher student ID’s last four digits. This makes each student’s sample unique andallows one to illustrate concepts such as the normal distribution of sample means,the risk of incorrect acceptance, and the (generally uncontrolled) risk of incorrectrejection.Having completed the sample evaluation, students then test the extensions of the
entire data file. As part of this task, students are asked to compare their results withthose from the sample they have previously taken. In particular, the elimination ofsampling risk through ‘‘file sweeping’’ to include every population item is stressed,along with the related efficiencies of doing so in an electronic environment. Since theassumption of audit sampling is that a sample can allow auditors to make accurateinference about the whole population, by comparing the upper deviation rate in therandom sample and the actual error rate by ‘‘file sweeping,’’ students will have ahands-on experience with sampling risk.
3. Assignments 3 and 4—substantive tests and sampling for the revenue cycle
Assignments 3 and 4 require the use of audit software to help students review allthe steps of a substantive test:
1. Determine the test objective.2. Define the population and sampling unit.3. Choose the audit sampling technique.4. Determine the sample size.5. Select the sample.6. Test the sample items.
8 The results are very similar, or identical. The manner in which the particular text being used handles
a finite and not an infinite population may differ from that of IDEA, thus resulting in very small differ-
ences in sample size. Also, due to space limitations in texts, the tables are more summarized than those
used in IDEA, thus creating small differences.
R. Nieschwietz et al. / J. of Acc. Ed. 20 (2002) 307–329 311

7. Evaluate the sample results.8. Document the sampling procedure.
3.1. Assignment 3—substantive testing for the revenue cycle
Assignment 3 begins by having students prepare an aged trial balance and adetailed report of accounts over a specific age. Students are then required to calcu-late an estimate of the client’s allowance for doubtful accounts and determine if it isadequate based on the current balance. We supplement the mathematical resultshere with a discussion of difficulties with estimates. For example, a straight aging ofaccounts receivable may reveal a particular amount is 120 days and older, whichseems questionable. Yet for a number of the customers with accounts over 120 daysold the client may be continuing to sell to them—accordingly greater portions of the‘‘younger’’ accounts than might normally be encountered may also be particularlyquestionable.Assignment 3 fits either with a discussion of substantive testing for the revenue
cycle or with an accounts receivable chapter, depending on the structure of the text.Because of the subjectivity involved with the allowance for doubtful accounts, oneshould expect differing answers from students. Also, slight modifications to theaging classes (e.g. adding a 120–150 day category or changing intervals such as 0–40days) is a simple way to modify the assignment from one semester to the next.
3.2. Assignment 4—substantive sampling of the revenue cycle
Assignment 4 uses the same data file as Assignment 3 and requires students toperform monetary unit sampling (also known as probability-proportionality-to-sizesampling).9 Once again, each student selects a sample based on student ID. Inaddition to making each student’s solution unique, this procedure allows theinstructor to provide an illustration of sampling risk and the conservative nature ofPPS sampling. This is demonstrated since some samples lead students to ‘‘accept’’the population as being materially correct, while others lead to ‘‘reject’’ decisions.Assignments 3 and 4 provide a realistic view of substantive testing procedures and
the relative importance of judgment when examining the valuation assertion. Wehave created a subpopulation of accounts with misstatements. Students comparetheir samples to a listing of all errors in the population to determine which, if any, ofthe accounts in their sample are misstated. They then are asked to compare theupper limit on mis-statements with the tolerable misstatement for the account todecide whether any adjustment is needed. Assignments 3 and 4 also fit well with adiscussion of the revenue cycle and/or accounts receivable. In addition, Assignment
9 This procedure can easily be complemented or substituted using other available sampling applica-
tions, such as stratified random sampling. This procedure is illustrated in the IDEA for Windows Case
Study developed by BDO Seidman, LLP and Dr. Jerry Turner. The case study also demonstrates how to
merge a sample with a template to create confirmations.
312 R. Nieschwietz et al. / J. of Acc. Ed. 20 (2002) 307–329
4 provides an electronic application of the monetary unit sampling technique pre-sented in virtually all auditing textbooks.
4. Assignment 5—substantive testing for inventory
Inventory is often the largest current asset on a company’s balance sheet and thelower of cost or market valuation method often provides difficult valuation issues.Therefore, Assignment 5 provides students with experience in testing the valuationassertion for inventory. Also, to provide an example of how the analytic functions ofaudit software can be used throughout the audit, this assignment focuses on severalfunctions of the software including field statistics, field manipulations, and extrac-tion. The field statistics function provides statistical information on the values ofnumeric fields within the data file such as net, maximum, minimum, and averagevalues as well as numbers of debit, credit, and zero value items. The field manipu-lation function allows for creation of virtual fields. While the initial columns of datacannot be altered, virtual fields can be used to manipulate data as needed. Forexample, in Assignment 2, a virtual field was used to create a numeric field from acharacter field so that the gap detection function could be utilized. Extraction orexception testing, described by IDEA as the most frequently used audit test of usersof the software, involves selecting certain items which satisfy a specific characteristic,for example payments of more than $100,000 or transactions before a particulardate.In Assignment 5, students are first required to calculate field statistics on the
inventory balance to gain a broad view of the characteristics of the population. Thisallows them to gain descriptive data relative to the size, variability, and nature of theinventory items. Following this analysis, students then use the field manipulationand extraction functions to perform various valuation tests such as lower of cost ormarket and slow moving inventory (both in terms of recent sales and turnover).Based on these tests, students then propose an adjusting entry.Following this adjustment, students are asked to differentiate the relative infor-
mational value between the lower of cost or market value test and other analyticalprocedures. For example, the lower of cost or market value test may lead moredirectly to a proposed adjusting entry than many analytical procedures that onlyprovide the auditor a hint on suspicious items and will lead to further investigationthat should be performed in order to identify obsolete items. As students’ proficiencywith the software should be increasing, they are then required to propose and designtheir own test of inventory and relate it back to specific financial statement asser-tions. This stresses the design of substantive procedures to test specific assertions.
5. Assignments 6 and 7—relational database analysis
Assignments 6 and 7 move away from using a single data file (or possibly two) toproviding students an experience in applying auditing concepts to a relational
R. Nieschwietz et al. / J. of Acc. Ed. 20 (2002) 307–329 313

database. As accounting software continues to utilize relational databases to storedata, it is important for auditors to be able to access data in this form. The data weuse is a modified version of the Northwind Database that is provided with theMicrosoft Access database system.
5.1. Assignment 6—overall relational database analysis
This assignment allows students to ‘‘get acquainted’’ with the manner in whichdatabase tables may be used with IDEA. Once students format the database in thecorrect manner using the join function, they are required to calculate a variety ofbalances including gross sales, sales by product, sales by salesperson, top suppliers,and sales per year. Students are provided with eight tables and an Access ‘‘relation-ship diagram’’. Before performing each step, students are required to consider whichof the tables they need for a particular part of the assignment, as well as which fieldsto include and/or summarize. The last step requires students to compare the salesamount per auditor and the sales amount per client, which is reported on tax returnsfiled with the Internal Revenue Service, and to identify any auditor professional andethical responsibilities relating to any discrepancy found.Our goal with this sixth assignment is to help students integrate computer infor-
mation systems knowledge with the IDEA software they have been using through-out the semester. While historically a number of our students have taken a formalrelational database course, many have not. For those who have taken a databasecourse, we suggest that they not only use IDEA, but also consider using their SQLprogramming knowledge to obtain the information and to then compare the relativeadvantages of each approach. In this manner, students are able to integrate knowl-edge from the two areas. For students who have not taken a relational databaseclass, the assignment somewhat allays their fears of such a system as they are able todirectly use IDEA, despite their very limited relational database knowledge. Insummary, this assignment is meant to serve as a structured introduction to themanner in which generalized audit software may be used to analyze a relationaldatabase.
5.2. Assignment 7—test for fraud
While Assignment 6 is fairly structured, Assignment 7, which also uses theNorthwind Database, is intentionally vague to encourage thought among the stu-dents. Students are given a message that there is ‘‘a crook within the company’’along with a few very general hints and are asked to devise, execute, and interpretseveral tests for fraud. Each semester we ‘‘embed’’ some form of fraud within thedatabase. For example, we have eliminated certain orders from the database tosimulate an employee shipping goods to his/her own address and then ‘‘destroyingthe evidence’’. Or, we have included extremely large sales prior to year-end.The purpose is not only to illustrate the complex nature of detecting fraud, but
also to allow students to apply the techniques of analysis that they have learned inthe first six assignments. Students are encouraged to think about where fraud can
314 R. Nieschwietz et al. / J. of Acc. Ed. 20 (2002) 307–329
occur, what procedures are needed to catch it, and how to evaluate the test result.Assignment 7 serves as a good capstone in that it requires the application of tech-niques learned earlier to a very unstructured area.
6. Concluding remarks
While these assignments cover many of the basic areas involved in an audit, theycan easily be expanded or contracted to suit an individual instructor’s needs. The onlyconstraint is on coordinating the assignments so that they coincide with the topics inthe course and the time required to complete them. Additionally, the procedures canbe easily altered so that they vary across semesters.
Appendix
Assignment 1
Getting familiar with IDEA
Estimated time: 2–3 hours
Congratulations! The partners at Kaplan and Tiffany, L.L.P. believe you are readyto use IDEA, a ‘‘real world’’ generalized audit software package. As part of yourfirst engagement, you will be using IDEA 2001 to complete various tests of controlsalong with substantive tests. Before going out to the client, you have been advised tofamiliarize yourself with the software.
The software comes equipped with a tutorial that demonstrates some of the basicfunctions of the package. Once completed, you will have the knowledge base necessaryto begin and complete the more complex tasks required while at the client.
Prior to Starting IDEA: Prior to starting the assignment, you will need a copy of‘‘IDEA 2001 Getting Started Guide’’ and prepare a diskette that will be used tostore your client information. Those wishing to work at home may store clientinformation on the hard drive.
Preparing a Diskette The software prepares and saves files created during thevarious functions that you will be performing in a separate client file. If you are notworking on a home computer, it will be necessary for you to maintain these files ona diskette. Therefore, prior to starting the assignment, create a folder (directory) onyour diskette called Tutorial. Also, you will need to copy the files MASTER.XLS,SALES.TXT, and INVEST.PRN to your diskette.
Be aware that when the guide refers to these files, they will now be located on theA:\ drive (such as Step 2 on pp. 4). Also, on Step 4, pp. 5 of the guide, make thefollowing modifications:
R. Nieschwietz et al. / J. of Acc. Ed. 20 (2002) 307–329 315

Client name: (your last name, Tutorial)
For future assignments, you must also copy additional files to your diskette aswell. These files will be needed for Assignments 2–7. You should create separatefolders (and client names) for each of the assignments. Use the same format asabove (your last name, assignment name).
These changes will allow you to maintain your work on your diskette rather than the
hard drive. If you do not make these changes, your files cannot be retrieved upon
returning to the campus computers and you will have to start over.
Completing the Assignment: All of the procedures you have been asked to com-plete are explained in the getting started guide. Take your time, as it will benefit youlater. Below are additional suggestions:
(1) In certain sections, you may need to switch from portrait to landscapesettings before printing. This can easily be done by going to File, and thento Print Setup. Also, if you wish to shorten the columns, just click on thecolumn dividers and move them in a manner similar to the same functionin Excel.
(2) If you do not finish the tutorial or any of the assignments, the next time youcome back to a computer site, you will have to reload IDEA. Afterwards,create a new client using the same client name and directory as before. Thefiles you created are on your diskette and you will be able to continue whereyou left off.
Concluding Remarks: This first assignment is intended to teach you the basics ofIDEA. Future assignments will make reference to this tutorial; therefore, it isimperative that you understand the key objectives in the Getting Started Tutorial.The tutorial typically takes between 2 and 3 hours to complete.
Required: Work through the Getting Started Tutorial. These sections are relativelywell laid out and will provide you with most of the guidance needed to workassignments 2–7. Print and turn in the following for Assignment 1:
1. Field Statistics: Page 202. Sample of Customers: Page 223. Large Credit Limits: Page 264. Stratification Report: Page 495. Exceeded Credit Limits: Page 786. Duplicate Invoices: Page 827. Gap Detection: Page 848. Sunday Transactions: Page 889. Sales Report (first 2 pages): Page 10410. Investments Database Page 118
316 R. Nieschwietz et al. / J. of Acc. Ed. 20 (2002) 307–329

This is an individual assignment; please do your own work.
INSTRUCTOR NOTES: This is the longest of the assignments due to the student’slack of familiarity with the software. However, the Getting Started Guide provided byIDEA provides detailed instructions, including screen shots, to help students learn thesoftware. Once students master the basic mechanics of the software, the remainingassignments can begin to focus on the functional aspects of the software, rather thanmechanical. Encourage students to take their time as this tutorial makes an excellentreference point for various tasks in future assignments.
Assignment 2
Attributes Sampling for the Revenue Cycle
Estimated time: 1–2 hours
Kaplan has informed you that he has other auditors performing a number of testsof controls relating to the revenue cycle and that you will perform three (3) basiccontrol tests. The first two are included in STEP 1; search for duplicate invoicenumbers (existence) and gaps in the sequence of invoices (completeness). The thirdtest relies on a sample from the population of 900 items and starts at STEP 2 andgoes through to STEP 7 (valuation).
The client has provided you with a listing of sales transactions (invoices.dbf),which lists all transactions for the period in question. There are 900 records in total.When using the Import Assistant, IDEA will automatically define column widthsand field names. The field names are self-explanatory and listed below. Import theinvoices.dbf, select generate Field Statistics, and name the database INVOICES.
Field Name Type From Length Dec DescriptionCUSTNO Character 1 5 Account NumberINV_NO Character 6 9 Invoice NumberINV_DATE Character 15 8 Date of SalePROD_CODE Character 23 2 Product CodeUNIT_PRICE Numeric 26 10 2 Unit PriceQTY Numeric 35 5 Quantity SoldAMOUNT Numeric 40 10 2 Sales in Dollars
You will perform the following steps for this assignment:
STEP 1: Use the population of 900 items (invoices.dbf). Test the entire populationto identify duplicated invoices and gaps.
a. Duplicate invoices (if any), that is invoices with the same number. Use the topmenu as:Data!Duplicate Key Detection
R. Nieschwietz et al. / J. of Acc. Ed. 20 (2002) 307–329 317

b. Gaps (if any) in the sequence of invoice numbers:Data!Gap Detection
Print and turn in ‘a’ and ‘b’.
HINT: When you use the ‘‘Import Assistant’’ to open the file ‘c’ it recognizes thefile as a dBase file and opens it. The columns are already defined (that is, you don’thave to give them names and separate them). This is because IDEA imports thedBase file ‘‘as is’’. This is all OK in your search for duplicate invoices. Ignore thefirst column entitled ‘‘Deleted’’.
A problem occurs when searching for ‘‘gaps’’ since IDEA does not offer INV_NOas a column for which you can search for gaps. This is because IDEA has read theINV_NO column as a character and not a numeric field. To overcome this problem,you need to create a numeric field using the INV_NO data. There is a functionavailable in the equation editor that easily can accomplish this task (@VAL). Youmight accomplish all this by using @VAL to add a new virtual column that dupli-cates the existing character field as numeric.
Once converted, one last small problem to overcome is that all invoices have twozeros at the end of them. Eliminate the last two zeros and you are ready to test for gaps.
INSTRUCTOR NOTES: This first step is relative straightforward. Students shouldhave a basic understanding of how to import data from the Getting Started Guide.They should be reminded to verify that they have all 900 items. Additionally, a controltotal can be added (this total may vary each semester as the data is manipulated).Duplicate Key Detection is one of the procedures in the Getting Started Guide, so PartA should be relatively easy. In Part B, while the procedure is not complicated, thecolumn must first be translated from character (text) to numeric data for the GapDetection function to work properly. This is done by creating a virtual field, using the@VAL function, and dividing by 100 to remove the last two zero’s in the INV_NOfield. One final point of interest is that the gaps and duplicate invoices have been set sothat they correspond with one another. This presents the opportunity for a discussion ofqualitative vs. quantitative errors.
STEP 2: Calculate required sample size.a. Use the text to calculate the required sample size using the following:
Expected Population Deviation Rate: 1%Tolerable Rate: 6%Risk of assessing control risk too low: 5%
Turn in your sample size.
b. Now use IDEA to generate the required sample size (that is, do STEP 2a overusing IDEA). You should use invoice.dbf or the derivation of that file you created
318 R. Nieschwietz et al. / J. of Acc. Ed. 20 (2002) 307–329
earlier (with the virtual column(s)). If you don’t have one of these open you willhave to open it.
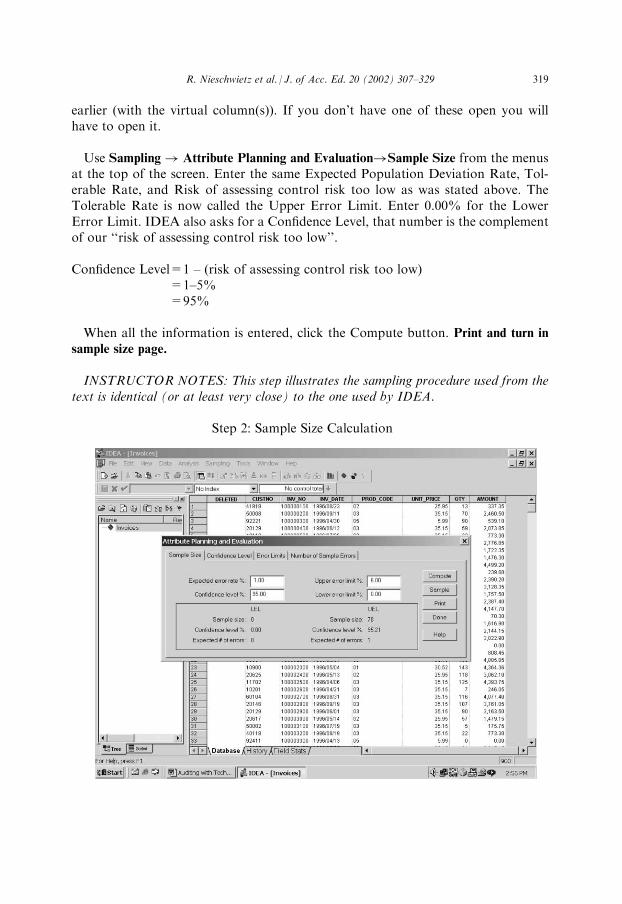
Use Sampling ! Attribute Planning and Evaluation!Sample Size from the menusat the top of the screen. Enter the same Expected Population Deviation Rate, Tol-erable Rate, and Risk of assessing control risk too low as was stated above. TheTolerable Rate is now called the Upper Error Limit. Enter 0.00% for the LowerError Limit. IDEA also asks for a Confidence Level, that number is the complementof our ‘‘risk of assessing control risk too low’’.
Confidence Level=1 – (risk of assessing control risk too low)=1–5%=95%
When all the information is entered, click the Compute button. Print and turn in
sample size page.
INSTRUCTOR NOTES: This step illustrates the sampling procedure used from thetext is identical (or at least very close) to the one used by IDEA.
Step 2: Sample Size Calculation
R. Nieschwietz et al. / J. of Acc. Ed. 20 (2002) 307–329 319

STEP 3: Use IDEA to select the sample. Use Sampling! Random from the topmenus (or just hit the sample button)
Click on the Sample button. Use the following:
� Starting Record: 1 (this should be the default)� Ending Record: 900 (this should be the default)� Number of records to select: Enter the sample size from your printout� Random number seed: Enter the last four digits of your student ID� Donot check ‘‘Allow duplicate records’’� File Description: Attribute Sample
NOTE: Make sure you enter the last four digits of your Student ID as your ran-dom seed. If the first digit begins with a zero (0) then use the next digit for the firstnumber (i.e., 0123 should be entered as 123).
Click on the OK button. Turn in your sample.
INSTRUCTOR NOTES: The purpose of having students use their Student ID forthe random seed is to create a distribution of results. Also, by using their ID versushaving IDEA generate a random seed, it is easy to verify they worked indepen-dently.
STEP 4: Test the extensions by cross-footing. This will determine if any of theamounts in your sample are miscalculated.
HINT: While there are several ways this test can be performed, it is suggested thatthe number of errors be determined using the extraction function. The followingformula, AMOUNT <> (UNIT_PRICE * QTY), results in a new databaseconsisting of incorrect invoices.
How many misstatements (if any) did you find? What invoice number(s) is inerror? Turn in the page that includes your sampled items and the page with themisstatements (if any). NOTE: If you have no misstatements in your sample themisstatements page will be blank.
INSTRUCTOR NOTES: While this step could be performed manually or withIDEA, IDEA is much more efficient. There are a number of ways the test could beperformed, any of which are acceptable. Students should be careful so that they testtheir sample population, not the entire population in this step.
STEP 5: Use the text to evaluate your results. What are your statistical results?(e.g. no exceptions were noted, therefore we may conclude that there is less than a5% risk that the population deviation rate is greater than 6%; or since one deviationwas found, etc. (your textbook should help here).
320 R. Nieschwietz et al. / J. of Acc. Ed. 20 (2002) 307–329

Step 6: Sample Evaluation
STEP 6: Use IDEA to evaluate your results. Go to Sampling!Attribute Planning
& Evaluation!and use Error Limits to evaluate your results.
Print and turn in page and discuss what these results mean.
INSTRUCTOR NOTES: Once again, STEPS 5 & 6 illustrate the compatibility ofthe text with what IDEA is doing. IDEA will be a bit more precise in determining theupper deviation limit since it can adjust for varying sample sizes whereas the text willpresent a range of values.
STEP 7: Redo STEP 4, but this time on the entire population of 900 invoices.Turn in the following: How many misstatements (if any) did you find? What invoicenumber(s) is in error? Evaluate your results. Discuss the advantages/disadvantagesof testing an entire database versus conducting a sample of items. How does thiseffect detection risk (AR=IR * CR * DR) and the substantive tests performed?
INSTRUCTOR NOTES: This is perhaps the most important step of the assignment.Since the entire population is tested, there is no need to adjust the deviation rate forsampling risk. This is relevant since if the population had a deviation rate of 4%, theupper deviation limited would be 4% (4% + 0%=4%). Based on the inputs used, ifthe sample had a deviation rate of 4%, the upper deviation limit would be 9.64% (thisis based on a sample size of 78 with 3 errors). The upper deviation limit consists of thedeviation rate of 3.85% plus the allowance for sampling risk of 5.79%. Thus, the
R. Nieschwietz et al. / J. of Acc. Ed. 20 (2002) 307–329 321

sample would not be able to support a planned level of control risk of low, but the ‘filesweeping’ would. This illustrates the risk of incorrect rejection that results in a lack ofefficiency. Of course, only students who found 2 or more errors would reject a plannedlevel of low, illustrating the distribution of results when utilizing sampling.
REQUIRED
Complete Steps 1–7 (Test of controls) and summarize your results in a memo tothe audit workpapers. Include all supporting printouts.
INSTRUCTOR NOTES: This assignment can be altered in a number of waysacross semesters. First, the number and correlation of gaps and duplicate invoices caneasily be adjusted. Second, the number of errors in the population can be manipulated.And last, the expected population deviation rate, the tolerable rate, and risk of asses-sing control risk too low can be modified to change the sample size.
Assignment #3
Substantive Testing for the Revenue Cycle
Estimated time: 1 hour
Kaplan and Tiffany want you to use a client file (arfile.asc) to prepare an aged trialbalance and a list of accounts over 180 days past due. You will also use the agedtrial balance to derive an estimate of the proper allowance for doubtful accounts.
The arfile.asc is the Accounts Receivable file of balance due as of 2001/12/31. Youmay download it from the course home page. You will be auditing the 2001 year-endnumbers. When you import arfile.asc you need to input the proper field names forthe various fields. In other words, you will adjust the field names and size. The fieldnames and sizes are:
Field Name Type From Length Dec DescriptionACCOUNT Character 1 11 Account NumberDIVISION Character 12 4STORE Character 16 4BALANCE Numeric 20 13 2DUEDATE Date 33 6 MMDDYY (mask)
Note: Account, division, and store are ordinarily treated as character because,even though the fields include numbers, adding up those numbers doesn’t ordinarilymake much sense. When setting up the columns, note and fix the fact that the importassistant thinks the first S is its own field, when in fact it is a part of the accountnumber. When you import the database, save the definition as arfile.rdf.
As the file is imported it should contain 993 records and the control total shouldbe $10,468,506.88. To verify the total, set the control total.
STEP 1: Aging Trial Balance Report for Accounts Receivables
322 R. Nieschwietz et al. / J. of Acc. Ed. 20 (2002) 307–329

Age the accounts receivable into the following six groups:0 days0–15 days15–30 days30–60 days60–90 days90–120 days120–180 days180 plus days
Hints: Aging is on the top menu as follows Analysis! Aging.
1. Change the Aging Date: to 2001/12/31
2. For Aging Field to use: select DUEDATE
3. For Amount Field: select BALANCE
4. Do not click Generate detailed aging database5. Do not click Generate key summary database
Print the Aged Accounts Receivable Report.
INSTRUCTOR NOTES: While this first step is basic, it quickly prepares an agedaccounts receivable report for use in the rest of the assignment. To vary the assignmentacross semesters, the aging intervals can easily be altered. Students should be remindedto verify the total of the report agrees to the control total and to modify the intervalsbased on the criteria given.
Step 1: Aging Report
R. Nieschwietz et al. / J. of Acc. Ed. 20 (2002) 307–329 323

STEP 2: Prepare Report of accounts that are over 180 days old.
Print the Aged report of accounts greater than 180 days and use IDEA to total thecolumns on your report. Use File!Create Report to prepare this report.
Turn in your report.
INSTRUCTOR NOTES: The report of the accounts over 180 days is useful indetermining which accounts, if any, should be written off. While the total can be seenthrough the control total, to print it out students must create a report added the total.This procedure is easily run using the extractions function. However, a common mis-take is to base the report on 07/01/2001. The correct date to examine accounts over180 days is 07/05/2001. Also, when entering the function in the equation editor, it isnecessary to put the date in quotes (DUEDATE < ‘‘2001070500).
STEP 3: Prepare adjusting entry for the Allowance of Doubtful Accounts
In the past, the auditors have found that the following percentages approximatethe eventual write-offs of doubtful accounts:
0 days 0.03%0–15 days 0.20%15–30 days 0.50%30–60 days 1.00%60–90 days 5.00%90–120 days 10.00%120–180 days 25.00%180 plus days 50.00%
The allowance for doubtful accounts currently has a balance of $100,200. Preparea proposed adjusting entry pertaining to the allowance for doubtful accounts. Youmay calculate these percentages with or without IDEA.
INSTRUCTOR NOTES: The final step is to prepare an adjusting entry based onthe write-off percentages given. These can easily be altered across semesters. Whilethere are multiple ways of calculating the allowance both within and outside of IDEA,one method is to export the aged report to excel and enter the write-off percentagesthere. To export, with the aging report open, go to FILE>SAVE AS. Afterward, thefile can be opened with Excel.
Turn In (1) The Age Analysis Report(2) The listing of all accounts over 180 days(3) The calculation of the allowance for doubtful accounts with the
proposed JE
324 R. Nieschwietz et al. / J. of Acc. Ed. 20 (2002) 307–329

Assignment 4
Substantive Sampling of the Revenue Cycle
Estimated time: 1 hour
Kaplan and Tiffany want you to continue to use information from the samereceivable file (arfile.asc). This assignment requires you to use PPS sampling to (1)plan a sample (calculate sample size and select a sample), and (2) evaluate results(you will be given a couple of misstatements to use to evaluate the results).
Because you have already imported and used the arfile.asc file in Assignment #3,you may use the same client and files. One additional file, errors.xls, will need to beimported to help determine the errors in your sample.
In this assignment you will have calculated a required sample size for the con-firming of receivables, selected the sample, mailed the confirmations (pretend),audited the sample (pretend) and calculated results. In general you should be able todo this assignment using information from the User Guide.
STEP 1: Planning the Sample
In planning you will derive a PPS (‘‘monetary unit’’ per the Canadians). As wehave discussed in class, there are a number of ways to perform PPS, and IDEAworks just a little different than that of the text that follows the AICPAapproach.
� Open the Accounts Receivable file (arfile.asc).
Select Sampling!Monetary Unit!Planning!Substantive Testing.Use the following:
� Confidence Level 90% (1 – risk of incorrect acceptance)� Total Value of Population $10,468,506.88� Materiality for the Audit $1,000,000.00� Assume this the materiality for the audit for Accounts Receivables� Expected Aggregate Error, Sampling $250,000.00� Expected Aggregate Error, Other $50,000� Do not check ‘‘Assume all taintings less than 60%’’� Do not check ‘‘Change Basic Precision Pricing (BPP) from 100%’’
Compute the Sample, print, and submit your results.
INSTRUCTOR NOTES: This first step is similar to the method used in the text.However, differences that should be noted are the Expected Aggregate Error forSampling and Other. Use of such information is dependent on the operationalization ofthe sample method, and should not be cause for students to be alarmed.
R. Nieschwietz et al. / J. of Acc. Ed. 20 (2002) 307–329 325

Step 1: Monetary Unit Sample Calculation
STEP 2: Select the Sample
While still on the sample size screen, click on the Extract button. This will bringyou to the Sampling screen. Make sure the ‘‘Fixed Interval Extraction’’ tab isselected.
Enter the following:
� Numeric Field to Sample: BALANCE� Sampling Interval: enter the interval computed in Planning� Random Starting Point (25�the last four digits of your student ID)� Description: PPS Sample� Do not check ‘‘Allow multiple hits on high value items’’� Check ‘‘Use absolute values for credit (negative) items’’ if necessary
Click OK to extract your sample from the database.
Note: The random starting point should be 25 times the last four digits of yoursocial security number, supplemented automatically by the ‘‘.0000 For example, ifyour last four digits are 8042 then the Random Starting Point becomes 201,050.00(25 * 8042). Click on ‘‘OK’’. You should now have your sample.
326 R. Nieschwietz et al. / J. of Acc. Ed. 20 (2002) 307–329

INSTRUCTOR NOTES: Having students start at different starting points willresult in variety of results which helps illustrate concepts of sampling risk and theconservative nature of PPS Sampling.
STEP 3: Print your Sample
Print and submit your sample.
STEP 4: Evaluate your results
Here we pretend that you used the above to print confirmations and that theyhave all come back (or alternative procedures have been applied). Use the errors.xlsfile to determine which of your sample items had errors. Once the file has beenimported, join the errors database to the sample database based on account number(uses matches only). Please note the spreadsheet contains errors from the entirepopulation, not just your sample. Knowing the true population will allow us todetermine how accurate your sample actually performed.
Modify the ‘‘audited amount’’ (AUDIT_AMT) in your file from STEPS 2 & 3above by selecting the corresponding cell within the PPS Sample database. Onlymodify those items appearing on both your sample on the error listing as shown inthe joined file.
Print and submit your sample with any errors discovered reflected in the audited
value. Highlight (manually) these accounts so they are easily visible.
INSTRUCTOR NOTES: This is one of the more difficult steps in the assignment. Itmust be explained that while you would not every know the true value of a givenpopulation, in this illustration we do. Once the accounts in error are determinedthrough the join process, the audit amount must be manually entered on the sampledatabase.
STEP 5: Evaluate results continues;
Select Sampling!Monetary Unit!Evaluation. Use the following:
� Audit value field: AUDIT_AMT� Book value field: BALANCE� Confidence level: 90%� Sampling interval: enter your interval from STEP 1� Sample size: enter your sample size� High value cut-off amount: enter the sampling interval from STEP 1� Do not check ‘‘Change basis precision pricing from 100%’’
Click OK. Print your results.
R. Nieschwietz et al. / J. of Acc. Ed. 20 (2002) 307–329 327

STEP 6: Assume the following:
From your Print out Text‘‘Gross Most Likely Error’’ = Projected misstatement.‘‘Total Precision’’ = Allowance for sampling risk*‘‘Net Upper Error Limit’’ = Upper Limit on Misstatement
*Basic precision + Incremental Allowance
What statistical conclusion do you arrive at given the output? Report your answeron the STEP 5 printout.
INSTRUCTOR NOTES: To evaluate the results, students should compare the netupper error limit to the materiality for the audit of accounts receivable of $1,000,000.Also, when entering the sampling size for evaluation, it may be slightly lower than thatcalculated in Step 1 due to multiple hits on large items and/or the random starting point.
Step 5: Monetary Unit Evaluation
References
Audimation Services, Inc. (undated).IDEA for Windows case study—Version 2.0.
Audimation Services, Inc. (1995). IDEA getting started guide: IDEA for Windows Version 3.
328 R. Nieschwietz et al. / J. of Acc. Ed. 20 (2002) 307–329

Gelinas, U. J., Levy, E. S., & Thibodeau, J. C. (2001). Norwood Office Supplies, Inc: a teaching case to
integrate computer-assisted auditing techniques into the auditing course. Issues in Accounting Educa-
tion, November, 603–635.
Lanza, R. B. (1998). Take my manual audit, please. Journal of Accountancy, June, 33–36.
Warner, P. D. (1998). ACL for Windows. The CPA Journal, November, 40–44.
R. Nieschwietz et al. / J. of Acc. Ed. 20 (2002) 307–329 329