Audited results and cash dividend declaration · served as a powerful strategic framework to guide...
42
Audited results and cash dividend declaration for the year ended 30 June 2018 RESULTS AND COMMENTARY
Transcript of Audited results and cash dividend declaration · served as a powerful strategic framework to guide...

Audited resultsand cash dividend declarationfor the year ended 30 June 2018
RESULTS AND COMMENTARY

Normalised profit from operations(R million)
2014
2015
2016
2017
2018
8 26
6
7 04
8
6 40
7
5 78
9
4 96
2
Normalised profit from
operations
up 17%to
R8 266 million
Embedded value
up 15%to
R65 624 million
Core new business API(R million)
2014
2015
2016
2017
2018
16 1
37
14 6
60
13 3
03
12 3
20
11 0
64
Embedded value(R million)
2014
2015
2016
2017
2018
65 6
24
57 2
94
53 0
80
52 2
95
43 0
50
Normalised headline earnings(R million)
2014
2015
2016
2017
2018
5 40
1
4 65
6
4 31
2
4 02
7
3 45
7
Core new business
API
up 10%to
R16 137 million
Normalised headline earnings
up 16%to
R5 401 million
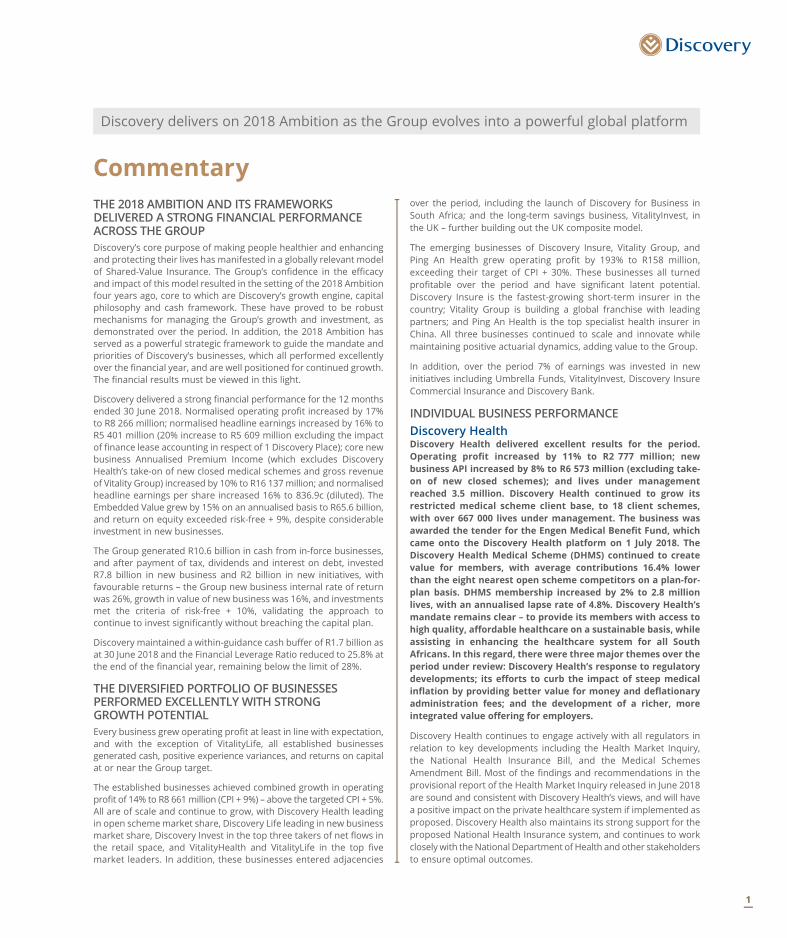
THE 2018 AMBITION AND ITS FRAMEWORKS DELIVERED A STRONG FINANCIAL PERFORMANCE ACROSS THE GROUP Discovery’s core purpose of making people healthier and enhancing and protecting their lives has manifested in a globally relevant model of Shared-Value Insurance. The Group’s confidence in the efficacy and impact of this model resulted in the setting of the 2018 Ambition four years ago, core to which are Discovery’s growth engine, capital philosophy and cash framework. These have proved to be robust mechanisms for managing the Group’s growth and investment, as demonstrated over the period. In addition, the 2018 Ambition has served as a powerful strategic framework to guide the mandate and priorities of Discovery’s businesses, which all performed excellently over the financial year, and are well positioned for continued growth. The financial results must be viewed in this light.
Discovery delivered a strong financial performance for the 12 months ended 30 June 2018. Normalised operating profit increased by 17% to R8 266 million; normalised headline earnings increased by 16% to R5 401 million (20% increase to R5 609 million excluding the impact of finance lease accounting in respect of 1 Discovery Place); core new business Annualised Premium Income (which excludes Discovery Health’s take-on of new closed medical schemes and gross revenue of Vitality Group) increased by 10% to R16 137 million; and normalised headline earnings per share increased 16% to 836.9c (diluted). The Embedded Value grew by 15% on an annualised basis to R65.6 billion, and return on equity exceeded risk-free + 9%, despite considerable investment in new businesses.
The Group generated R10.6 billion in cash from in-force businesses, and after payment of tax, dividends and interest on debt, invested R7.8 billion in new business and R2 billion in new initiatives, with favourable returns – the Group new business internal rate of return was 26%, growth in value of new business was 16%, and investments met the criteria of risk-free + 10%, validating the approach to continue to invest significantly without breaching the capital plan.
Discovery maintained a within-guidance cash buffer of R1.7 billion as at 30 June 2018 and the Financial Leverage Ratio reduced to 25.8% at the end of the financial year, remaining below the limit of 28%.
THE DIVERSIFIED PORTFOLIO OF BUSINESSES PERFORMED EXCELLENTLY WITH STRONG GROWTH POTENTIAL Every business grew operating profit at least in line with expectation, and with the exception of VitalityLife, all established businesses generated cash, positive experience variances, and returns on capital at or near the Group target.
The established businesses achieved combined growth in operating profit of 14% to R8 661 million (CPI + 9%) – above the targeted CPI + 5%. All are of scale and continue to grow, with Discovery Health leading in open scheme market share, Discovery Life leading in new business market share, Discovery Invest in the top three takers of net flows in the retail space, and VitalityHealth and VitalityLife in the top five market leaders. In addition, these businesses entered adjacencies
Commentaryover the period, including the launch of Discovery for Business in South Africa; and the long-term savings business, VitalityInvest, in the UK – further building out the UK composite model.
The emerging businesses of Discovery Insure, Vitality Group, and Ping An Health grew operating profit by 193% to R158 million, exceeding their target of CPI + 30%. These businesses all turned profitable over the period and have significant latent potential. Discovery Insure is the fastest-growing short-term insurer in the country; Vitality Group is building a global franchise with leading partners; and Ping An Health is the top specialist health insurer in China. All three businesses continued to scale and innovate while maintaining positive actuarial dynamics, adding value to the Group.
In addition, over the period 7% of earnings was invested in new initiatives including Umbrella Funds, VitalityInvest, Discovery Insure Commercial Insurance and Discovery Bank.
INDIVIDUAL BUSINESS PERFORMANCE Discovery HealthDiscovery Health delivered excellent results for the period. Operating profit increased by 11% to R2 777 million; new business API increased by 8% to R6 573 million (excluding take-on of new closed schemes); and lives under management reached 3.5 million. Discovery Health continued to grow its restricted medical scheme client base, to 18 client schemes, with over 667 000 lives under management. The business was awarded the tender for the Engen Medical Benefit Fund, which came onto the Discovery Health platform on 1 July 2018. The Discovery Health Medical Scheme (DHMS) continued to create value for members, with average contributions 16.4% lower than the eight nearest open scheme competitors on a plan-for-plan basis. DHMS membership increased by 2% to 2.8 million lives, with an annualised lapse rate of 4.8%. Discovery Health’s mandate remains clear – to provide its members with access to high quality, affordable healthcare on a sustainable basis, while assisting in enhancing the healthcare system for all South Africans. In this regard, there were three major themes over the period under review: Discovery Health’s response to regulatory developments; its efforts to curb the impact of steep medical inflation by providing better value for money and deflationary administration fees; and the development of a richer, more integrated value offering for employers.
Discovery Health continues to engage actively with all regulators in relation to key developments including the Health Market Inquiry, the National Health Insurance Bill, and the Medical Schemes Amendment Bill. Most of the findings and recommendations in the provisional report of the Health Market Inquiry released in June 2018 are sound and consistent with Discovery Health’s views, and will have a positive impact on the private healthcare system if implemented as proposed. Discovery Health also maintains its strong support for the proposed National Health Insurance system, and continues to work closely with the National Department of Health and other stakeholders to ensure optimal outcomes.
Discovery delivers on 2018 Ambition as the Group evolves into a powerful global platform
1

High medical inflation remains endemic, driven by a combination of supply and demand factors, as well as the recent increase in VAT. Supply-side factors include growth in new hospital facilities and new high-cost medicines and devices. Key demand-side factors include ongoing adverse selection trends and the increasing burden of chronic diseases and cancer, as well as the gradual ageing of the Scheme’s membership base.
To manage these trends, Discovery Health continued to invest substantially in risk management assets and systems; healthcare quality improvement programmes; an integrated digital technology platform; as well as data science and artificial intelligence capabilities and systems. Over the past year, approximately R140 million was invested in these and related initiatives, delivering significant improvements in operational efficiencies and enhancing Discovery Health’s globally leading Shared-Value health insurance model. This model benefits all of Discovery Health’s 19 medical scheme clients as well as their more than 3.5 million members, by securing the lowest cost of care available in the South African market, material improvements in the quality of healthcare services, and best-in-class client services.
Fraud control was another major focus, with recoveries for 2018 projected to be in excess of R500 million. In the case of DHMS, Discovery Health achieved risk management savings of approximately R5.7 billion during 2017, representing 11.9% of potential risk claims, and return on investment on the Scheme’s managed care fees of 269%.
In May 2018, Discovery Health launched Discovery for Business along with other Discovery business units. This is an integrated corporate offering including PrimaryCare, Discovery HealthyCompany (a digitally driven, science-based Employee Assistance Programme), as well as Umbrella Fund and Group Risk products. This new offering provides a complete health and wellness solution for businesses, contributing to increases in business productivity and wellbeing. The response has been extremely positive thus far, with strong growth and pipelines for all products.
Discovery Life Discovery Life delivered a robust performance with a focus on quality, prudence and enhancing the Shared-Value Insurance model. The business grew earnings by 7% to R3 837 million, benefiting from a strong second half, while new business Annualised Premium Income increased by 1% to R2 188 million. New business market share increased to 31%1 in the retail affluent protection segment, while the value of new business (individual) grew by 8%. Individual Life new business grew 4% in tough market conditions and Group Risk new business was down 29% off a high base, due to a single large scheme being acquired in the second half of the 2017 financial year.
Discovery Life continued to enhance the impact of the Shared-Value model, with considerable product innovation over the period. This led to growth in market share and VNB margin, with engaged Vitality members continuing to exhibit lower mortality experience. The Global Education Protector was recognised as one of the most innovative life insurance products globally2; while the new Purple Life plan led to a 23% increase in policies with cover over R10 million. The clinical refinement of the Vitality points structure, which accelerated over the period, resulted in positive behaviour change as clients strove to maintain their integration benefits (PayBacks of R973 million were paid to Discovery Life policyholders).
Another theme was the considerable focus on assumptions and financial and actuarial management. Discovery Life differs from its competitors in that it is less than two decades old and has grown in-force premium at 25% per annum organically from June 2002 to June 2018; transacts predominantly long-term Whole of Life business; and uses the Shared-Value Insurance model to dynamically adjust premiums and benefits based on Vitality engagement. While this results in additional complexity in predicting policyholder behaviour and its impact on profit emergence, the efficacy of the actuarial control framework was demonstrated over the period. Although management interventions resulted in a positive policy alterations variance for the second half of the financial year, further prudence was introduced by a strengthening of assumptions. The economic assumptions were updated to better align with the observed shapes of the yield curves. Additional prudence was introduced in the Embedded Value by limiting the term of valuing shareholder cash flows to 40 years.
Claims experience recovered in the second half of the year, at 91% of expected compared to 108.3% at December 2017. The claims experience in the first half was impacted by a number of large, non-natural deaths. Policy lapses were 82% of expectation, emphasising the efficacy of the model.
Discovery Life remains well-capitalised at 3.5x CAR cover and generated cash after tax of R3 519 million (including Discovery Invest) from the in-force book over the period (before reinsurance and acquisition-related costs). It invested the majority of this in profitable new business growth, ending in a net cash generation of R539 million. The implementation of SAM in 2018/19 is expected to result in a significant release of capital from Discovery Life, resulting in lower assets being held and lower associated investment income, although improving the business’s return on capital.
Discovery Invest Discovery Invest’s performance was robust amid weak financial markets. Operating profit grew 19% to R885 million, driven by an 18% increase in assets under administration to R81.8 billion, with 77% of linked funds in Discovery funds. Net flows grew by 10% to R6.4 billion. Discovery Invest also saw a significant improvement in new business in the second half of the year, smoothing out the first half to end flat for the full-year (excluding the effect of the R500 million corporate endowment sold in June 2017). The focus over the period was refining the use of the Shared-Value model in the context of long-term savings.
The Discovery Life Collective Investment Scheme remained in the top 10 retail flow takers while the Discovery Balanced Fund continued to perform well, placing in the first performance quartile over one, three, five and 10 years. In the PlexCrown Ratings, a widely-quoted unit trust rating agency in South Africa, Discovery Invest remained in the top five fund managers.
The business saw continued evidence of positive behaviour change as a result of the Shared-Value model. Discovery Invest’s Boosts led to demonstrable results in terms of members saving for longer, in greater quantities, getting healthier, and withdrawing less. This manifested in superior long-term retirement outcomes for clients, as well as sustainable profitability for the business. Discovery Invest also advanced its digital programme, launching an intuitive digital hub for advisers’ investment servicing and more interactive investment statements for clients.
1 NMG Life Insurance New Sales Report Q2 2018.2 EFMA Accenture Global Innovation in Insurance Awards, Paris 2018.
2 Audited results and cash dividend declaration June 2018

In May 2018, Discovery extended its Shared-Value model by launching an Umbrella Fund together with a revised Group Risk Payback product, under the banner of a new Discovery Employee Benefits solution.
Discovery Insure Discovery Insure had a strong period, turning to profitability to deliver a full-year profit of R68 million. Gross Premium Income grew 28% to R2.7 billion and new business increased by 17% to R1.05 billion. The business focused on executing its business model in the personal lines market, with proven results in selection, behaviour change, and selective lapsation, evidenced by the high quality of the in-force book. This bodes well for future growth in profitability as the quality of the in-force book improves with policy duration. Based on this experience, Discovery Insure launched a powerful interpretation of its shared-value model for the SME market.
Discovery Insure’s strong performance over the period was driven by the continued success of the Vitality Shared-Value Insurance model, which incentivises and rewards good driving behaviour. Loss ratios are highly correlated to engagement resulting in an improving book over time, with a 7.1% absolute reduction in loss ratio over the past 24 months. Data analytics played a role in improving efficiencies in pricing, fraud detection and network management. This resulted in the existing Discovery Insure book (excluding the impact of new business) producing R235 million in profit over the full financial year.
Based on the proven efficacy of the model, Discovery Insure entered the commercial insurance market over the period. The commercial offering deals with traditional physical risks as well as modern risks such as reputational and cyber, and uses technology to enhance risk assessment techniques. The fleet product rewards drivers and fleet owners, while a partnership with leading global business accelerator, Endeavor, offers clients a diagnostic to identify risks, as well as a curated market place with business development partners.
In terms of global strategy, Discovery Insure continues to explore the opportunity to extend the model into international markets as an extension of the Global Vitality Network.
Vitality UK businessesDiscovery’s UK business produced excellent results during the period, with combined new business increasing by 12% to R2.28 billion (£132 million); operating profit growing by 44% to R1.1 billion (£64 million); and total lives growing by 11% to 1.1 million. The composite business is attaining scale in the UK, with both the launch of VitalityInvest and the exceptional performance over the period creating considerable opportunity for continued growth. The value of in-force for the UK business increased by 25% to R12.5 billion over the period.
VitalityInvest brings together behavioural economics, savings and wellness to incentivise people to save sooner, invest for longer, manage their income drawdown and look after their health. Successful delivery relies on bespoke financial planning and cash flow modelling tools built on Vitality’s proprietary research and data on life expectancy. This has been developed in collaboration with partners such as the University of Cambridge and RAND Europe.
Vitality continued to see positive member engagement, with 46% growth in points-earning activities (includes screenings, nutrition and
physical activity) to 36 million, and high levels of benefit utilisation, from Starbucks to cinema tickets. Vitality also made ongoing investments in its brand, adding Disney in a partnership aimed at children; signing on two new ambassadors; and extending its presence and sponsorship in cricket, football and hockey.
VitalityHealth VitalityHealth delivered outstanding results. New business increased by 14% to R1.1 billion (£64 million), with the Individual segment up 13%, making up half of total sales. Operating profit increased by 108% to R589 million (£34 million), reflecting continued strong performance across all business metrics, including improved risk profile of new business, increased member engagement, sophisticated care pathways, enhanced robustness in claims management, and benefits from the Health Purchasing Alliance (HPA) arrangement.
The strong Vitality chassis and aspirational brand, combined with the effects of various interventions over the past few years (such as claims management) resulted in better selection, exceptional Vitality engagement and strong positive selective lapsation. The enhanced claims management initiatives resulted in excellent performance for the period. During the financial year the VitalityHealth back book generated excess cash of R1.6 billion. After new business acquisition costs and investment in developing the business, R475 million of cash surplus was generated.
VitalityLifeThis was an important period for VitalityLife, as it continued its focus on being fit for purpose in the low interest rate environment. New business increased by 10% to R1.17 billion (£67.7 million), with particularly strong sales in the second half of the year. VitalityLife’s operating profit increased by 6% to R515 million (£29.7 million). The business completely reengineered itself for a low interest rate environment, with all new business repriced and the business mix changed towards more term assurance and indexed business. The profit result also reflects a shift toward a passive investment rate assumption.
VitalityLife continued to innovate within the UK protection market. Following the success of the Optimiser products launched in 2016, VitalityLife introduced a new version of the product aimed at smaller policies. The combined impact resulted in over 70% of all new business being optimised. At the same time, VitalityLife continued to strongly promote the benefit of indexation of premiums in protecting customers from the financially eroding effect of inflation. The new business margin increased from 36% to 39% year-on-year.
Product development was supported by growth in the distribution footprint across all channels, which has positioned VitalityLife for continued sales growth in future. Strong sales for the year resulted in the business surpassing the milestone of half a million lives insured during 2018.
The fundamentals of the VitalityLife business remained strong, with positive claims variances over the year and improving lapse experience seen over the second half of the financial year. The VitalityLife investment rate assumption was reviewed and set in line with the long-term risk-adjusted yield expected from a basket of fixed interest securities. The move to a long-term view of the investment assumption improves the reliability and stability of IFRS results.
3

Vitality GroupVitality Group delivered excellent results for the period under review, transitioning to profitability with a profit of $2.6 million (R34 million), compared to an $8.5 million (R116 million) loss in 2017. Fee income reached $50 million (R645 million) and new business integrated insurance premiums grew 78% to $390 million (R5 billion). Insurance partners’ membership increased by 91% to over 750 000 and total Vitality Group membership reached 1.56 million*. All business segments are now profitable, achieved through strong growth and operational efficiencies, as well as continued investment in the Global Vitality Platform and its ability to serve partners and customers. Vitality Group is well positioned for growth, with a codified model for extracting maximum value per market, which includes the following broad strategies: 1) Exploiting latent potential by partnering with the leading insurers in the largest insurance markets; 2) partnering with Hannover Re to rapidly roll out repeatable Vitality offerings in smaller markets; and 3) expanding Vitality to adjacencies beyond insurance or traditional distribution channels. Importantly, the Vitality One technology infrastructure went live over the period, offering a globally unified systems architecture that all markets can access.
A significant development over the period was the launch of Vitality Shared-Value Insurance with Sumitomo Life in Japan. The launch took place in Tokyo on 17 July 2018, with excellent reception and media coverage, and Sumitomo Life has gone live on the Vitality One platform.
In addition to this, the partnership with Hannover Re will see three new markets signed on in the next 12 months.
Vitality USAVitality USA serves the employees of its corporate clients in the United States, and saw high and sustained engagement among users. Vitality USA is making significant progress in extending its offering to clients beyond employers with its Apple Watch and Active Rewards programmes. Vitality USA has also extended its platform through its Gateway offering by providing access to a curated list of health applications and services. This offering has broad application to all businesses interested in the value generated from behavioural change.
AIA VitalityAIA Vitality, the most mature Vitality Group insurance partnership, continued its exceptional performance across all launched territories. Over the period, new business Annualised Net Premium grew by 85% and Vitality membership grew by 110%. Vitality continues to gain traction in existing markets – as at 30 June 2018, Vitality was integrated with over 60 AIA products and was live in 10 AIA markets.
John Hancock and Manulife VitalityBoth John Hancock Vitality and Manulife Vitality demonstrated strong sales growth, increased engagement and an uptick in net promoter scores over the period. The increase in sales was achieved through the launch of new Vitality integrated products, increasing broker and consumer adoption, and the strong performance of the direct-to-consumer channel in the United States.
Generali VitalityGenerali Vitality operates in three markets, Germany, France and Austria, of which Germany and France are Generali’s second and third largest markets by premium volume respectively. Progress was made over the year to expand the distribution channels and develop the products in the markets. In the second half of the financial year, Vitality membership numbers grew by 40%, reflecting the successful launch of Generali Vitality in Austria and Germany’s biggest distribution force’s (DVAG’s) introduction to Generali Vitality-linked insurance products.
Ping An HealthPing An Health had an exceptional year with new business growing by 87% to RMB 2.9 billion and revenue growing by 80% to RMB 4.9 billion. Discovery’s share of Ping An Health’s profit, net of Discovery costs, increased by 279% to $4.4 million. The business fundamentals remained strong, with lapses meeting expectation and the overall loss ratio performing better than expectation. Ping An Health’s growth and strategy is being driven by five important factors: China’s health insurance market is expected to continue growing significantly; there is potential to extract more value from distribution by using technology; product strategies are being adapted to market realities; investments are being made into scaling operations; and Discovery is increasing the sophistication of risk management to ensure sustainability.
The business mix moved significantly towards individual retail products over the last two years, with Ping An Health’s internet product showing exceptional growth and performance. The Group high-end and individual mid-end products continued to make good progress, and the growth remains within the existing capital and business plan.
Ping An Health’s current performance implies that capital required to sustain business growth over the next three years is unlikely to exceed R500 million. Ping An Health is adequately capitalised from a solvency perspective, but additional capital is required to maintain an A credit rating by AM Best to retain its reinsurance licence (Ping An Health acquired a reinsurance licence to attain national distribution for its products. Ping An Life agents now sell Ping An Health products in regions where Ping An Health does not have an insurance licence, and Ping An Health gets access to the underwriting profits through a reinsurance agreement with Ping An Life). It should be noted that Ping An Health profit for FY2019 will be impacted by a higher effective tax rate.
The market for private healthcare in China has continued to grow on the back of macroeconomic factors that strengthen demand: more than 100 million people are expected to join the Chinese middle class in the next decade; and more than $100 billion in annual healthcare costs are still out-of-pocket. In addition, China leads the world in fintech adoption, which has led to the accelerated rise of premiums from health insurance products distributed through the internet.
Ping An Health’s strategic imperative is to utilise technology to become China’s largest health insurer. There has been considerable focus on expanding operations and investing in technology to sustain its fast growth. The objective is to continue growing the client base, while giving clients the best experience and increasing efficiencies. Ping An Health is also working on initiatives to develop additional distribution channels and expand into new cities and provinces.
* Membership represents full Vitality members only.
4 Audited results and cash dividend declaration June 2018

The Ping An Health App was launched in 2016 for the distribution of health insurance products and member servicing, and has since attracted over 8.5 million users. Premium revenue sold directly on the app exceeded RMB 100 million in the second half of the 2018 financial year. It was the first internet insurance app to reach breakeven within two years of its launch and is widely recognised by the industry.
In August 2018, Ping An Health launched the I-Kang Bao elderly medical product on the Ping An Health App, giving protection for cancer and accidental in-patient reimbursement. This product aims to get younger people to download the App and buy products for their parents, as the target age range is 45+. A similar product, targeting ages 0-70, was also launched for sale through all other channels including Ping An Life agents, and together these products have achieved a run rate of more than 1.5 million RMB in sales per day since launch.
The business also saw continued engagement in Run Vitality with Ping An Life, which reached over four million members on Vitality, with an engagement rate of 68%.
A CONSIDERABLE FOCUS WAS PLACED ON THE BUILD AND SHAREHOLDING OF DISCOVERY BANK Shareholders are referred to the SENS announcement on 16 October 2017 wherein they were advised that Discovery had been granted a banking licence by the Registrar of Banks (now the Chief Executive Officer of the Prudential Authority, SARB). At the time we also advised that the approval from the Registrar contained certain conditions relating to the shareholding of Discovery Bank, the impacts of which were being considered by all affected parties.
A condition relating to the shareholding of Discovery Bank imposed by the Registrar, is that the proposed 25.01% ultimate crossholding in Discovery Bank by FirstRand Investment Holdings Limited (“FRIHL”) should be reduced and ultimately exited over a period of time.
Given this condition, Discovery and FRIHL have since agreed that it would be preferable for FRIHL to exit entirely as soon as practically possible.
The proposed transaction therefore includes:
– the acquisition of the effective 25.01% interest of FRIHL in Discovery Bank
– acquiring the remaining 25.01% economic interest that FirstRand currently owns in the Discovery Card joint venture business
– Discovery Bank acquiring all rights to the Discovery card book and related assets which will be migrated over time
The transaction is subject to approval by certain regulatory authorities including the Prudential Authority and the Competition Authorities.
The total combined acquisition price payable by Discovery to the FirstRand Group will be R1.8 billion. Discovery has provided guidance that it plans to pursue existing growth initiatives without recourse to additional capital. As demonstrated in its performance during the period under review, the Group and its growth initiatives have delivered strongly, and the capital plan has evolved stronger than
expected. This gives Discovery the opportunity of continued growth accompanied by a stronger balance sheet with less leverage and larger cash buffers. Since the acquisition of the remaining 25% constitutes a new initiative and presents an important opportunity for the Group, the Board decided that this acquisition should be funded by way of an equity issuance limited to the purchase price. Given the relative immateriality, the transaction does not require shareholder approval.
Although these developments have delayed the process slightly, the Bank build is progressing well and remains within budget, and the launch is expected before the end of 2018.
In relation to this, Discovery Card’s performance was excellent, and bodes well for the Bank. In the group’s segmental reports, the Discovery Card joint venture profits and additional 54.99% profit share (received by way of after tax dividends) have been reallocated to Discovery Bank and disclosed in “All other segments” and comparatives were restated where appropriate. Profits for the Discovery Card JV with FNB grew by 17% to R414 million and revenue increased by 6% to R1 billion. In addition, Discovery’s credit card base is less sensitive to negative market conditions due to a substantially better risk profile. Both its percentage of non-performing loans and cost to income ratio were significantly below the average of other South African banks.
PROSPECTS FOR GROWTHDiscovery is well positioned for growth. Setting apart the effect of the Bank, Discovery expects continued growth without recourse to additional capital. The investment in Bank will impact earnings for the 2019 year, as post launch the amortisation of the build cost will emerge. Thereafter, the organic growth model is expected to revert to its long-term average.
On behalf of the Board
MI HILKOWITZ A GOREChairperson Group Chief Executive
Sandton3 September 2018
Notes to analysts:
– Any forecast financial information contained in this announcement has not been reviewed or reported on by the company’s external auditors.
– Discovery has published supplemental unaudited information on the website. For this and other results information, go to https://www.discovery.co.za/corporate/investor-relations and page down to Financial results and reports, Annual Results 2018.
5

R million
Group2018
Audited
Group2017
Audited
ASSETSAssets arising from insurance contracts 43 625 37 691 Property and equipment 4 272 1 210 Intangible assets 5 491 4 071 Deferred acquisition costs 1 150 1 025 Goodwill 2 247 2 107 Investment in equity-accounted investments 1 159 979 Financial assets– Available-for-sale investments 7 547 7 298 – Investments at fair value through profit or loss 71 246 58 948 – Derivatives 494 392 – Loans and receivables including insurance receivables 7 543 6 470 Deferred income tax 1 968 1 337 Current income tax asset 38 34 Reinsurance contracts 308 263 Cash and cash equivalents 10 894 9 098
Total assets 157 982 130 923
EQUITYCapital and reservesOrdinary share capital and share premium 8 308 8 306 Perpetual preference share capital 779 779 Other reserves 1 280 346 Retained earnings 27 227 22 859
37 594 32 290 Non-controlling interest * *
Total equity 37 594 32 290
LIABILITIESLiabilities arising from insurance contracts 61 488 52 477 Liabilities arising from reinsurance contracts 8 918 6 746 Financial liabilities– Negative reserve funding – 847 – Borrowings at amortised cost 14 079 8 524 – Investment contracts at fair value through profit or loss 17 927 14 867 – Derivatives 78 135 – Trade and other payables 9 043 7 369 Deferred income tax 8 007 6 963 Deferred revenue 324 291 Employee benefits 232 191 Current income tax liability 292 223
Total liabilities 120 388 98 633
Total equity and liabilities 157 982 130 923
* Amount is less than R500 000.
STATEMENT OF FINANCIAL POSITIONat 30 June 2018
6 Audited results and cash dividend declaration June 2018
R million
Group 2018
Audited
Group 2017
Audited%
change
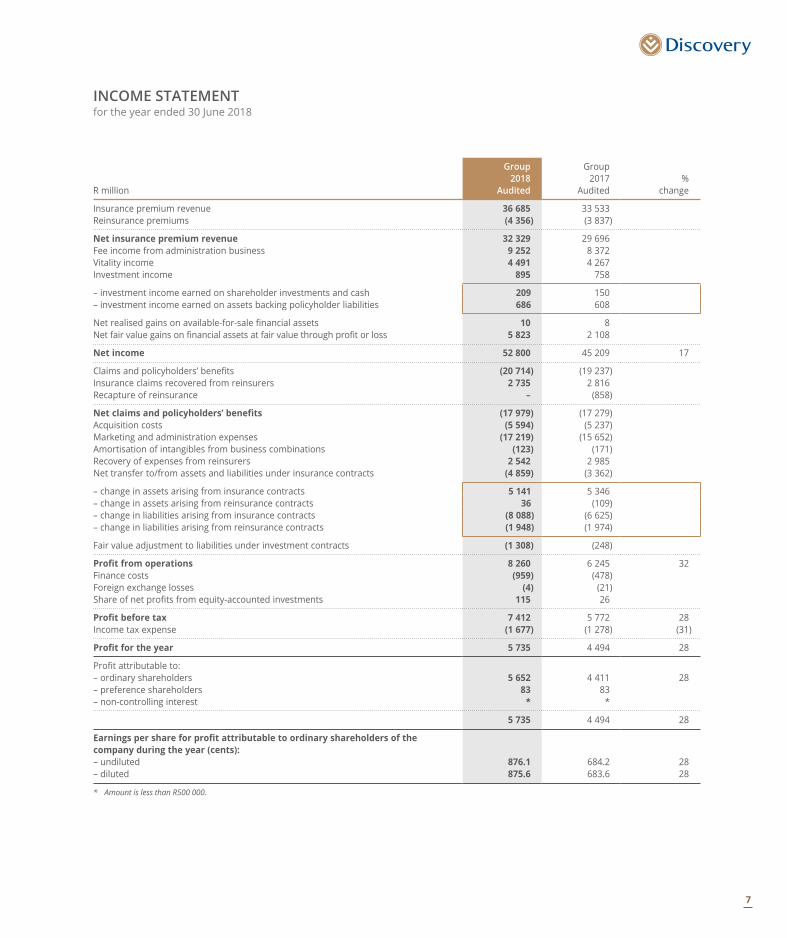
Insurance premium revenue 36 685 33 533 Reinsurance premiums (4 356) (3 837)
Net insurance premium revenue 32 329 29 696 Fee income from administration business 9 252 8 372 Vitality income 4 491 4 267 Investment income 895 758
– investment income earned on shareholder investments and cash 209 150 – investment income earned on assets backing policyholder liabilities 686 608
Net realised gains on available-for-sale financial assets 10 8 Net fair value gains on financial assets at fair value through profit or loss 5 823 2 108
Net income 52 800 45 209 17
Claims and policyholders’ benefits (20 714) (19 237)Insurance claims recovered from reinsurers 2 735 2 816 Recapture of reinsurance – (858)
Net claims and policyholders’ benefits (17 979) (17 279)Acquisition costs (5 594) (5 237)Marketing and administration expenses (17 219) (15 652)Amortisation of intangibles from business combinations (123) (171)Recovery of expenses from reinsurers 2 542 2 985 Net transfer to/from assets and liabilities under insurance contracts (4 859) (3 362)
– change in assets arising from insurance contracts 5 141 5 346 – change in assets arising from reinsurance contracts 36 (109)– change in liabilities arising from insurance contracts (8 088) (6 625)– change in liabilities arising from reinsurance contracts (1 948) (1 974)
Fair value adjustment to liabilities under investment contracts (1 308) (248)
Profit from operations 8 260 6 245 32Finance costs (959) (478)Foreign exchange losses (4) (21)Share of net profits from equity-accounted investments 115 26
Profit before tax 7 412 5 772 28Income tax expense (1 677) (1 278) (31)
Profit for the year 5 735 4 494 28
Profit attributable to:– ordinary shareholders 5 652 4 411 28– preference shareholders 83 83 – non-controlling interest * *
5 735 4 494 28
Earnings per share for profit attributable to ordinary shareholders of the company during the year (cents):– undiluted 876.1 684.2 28– diluted 875.6 683.6 28
* Amount is less than R500 000.
INCOME STATEMENTfor the year ended 30 June 2018
7

R million
Group2018
Audited
Group2017
Audited%
change
Profit for the year 5 735 4 494
Items that are or may be reclassified subsequently to profit or loss:
Change in available-for-sale financial assets 37 17
– unrealised gains 64 29 – capital gains tax on unrealised gains (19) (6)– realised gains transferred to profit or loss (10) (8)– capital gains tax on realised gains 2 2
Currency translation differences 840 (1 575)
– unrealised gains/(losses) 856 (1 581)– tax on unrealised (gains)/losses (16) 6
Cash flow hedges 2 33
– unrealised gains 200 159 – tax on unrealised gains (32) (25)– gains recycled to profit or loss (188) (123)– tax on recycled gains 22 22
Share of other comprehensive income from equity-accounted investments 42 (58)
– change in available-for-sale financial assets (9) (1)– currency translation differences 51 (57)
Other comprehensive income/(losses) for the year, net of tax 921 (1 583)
Total comprehensive income for the year 6 656 2 911 129
Attributable to:– ordinary shareholders 6 573 2 828 132– preference shareholders 83 83 – non-controlling interest * *
Total comprehensive income for the year 6 656 2 911 129
* Amount is less than R500 000.
STATEMENT OF OTHER COMPREHENSIVE INCOMEfor the year ended 30 June 2018
8 Audited results and cash dividend declaration June 2018

R million
Group 2018
Audited
Group 2017
Audited%
change
Basic earnings per share (cents):– undiluted 876.1 684.2 28– diluted 875.6 683.6 28
Headline earnings per share (cents):– undiluted 899.6 683.1 32– diluted 899.0 682.5 32
Normalised headline earnings per share (cents):– undiluted 837.4 722.2 16– diluted 836.9 721.5 16
The reconciliation between earnings and headline earnings is shown below:Net profit attributable to ordinary shareholders 5 652 4 411 28Adjusted for: – gain on disposal of property and equipment net of CGT (3) (1)– impairment of intangible assets net of tax 162 –– realised gains on available-for-sale financial assets net of CGT (8) (6)
Headline earnings 5 803 4 404 32– accrual of dividends payable to preference shareholders 1 (1)– amortisation of intangibles from business combinations net of deferred tax 109 154 – deferred tax asset raised on assessed losses (352) –– deferred tax timing difference related to new ‘adjusted IFRS’ tax basis (119) –– duplicate building costs 37 –– unrealised gains on foreign exchange contracts not designated as hedges (77) –– initial expenses related to Prudential Book transfer (1) –– rebranding and business acquisitions expenses – 99
Normalised headline earnings 5 401 4 656 16
Weighted number of shares in issue (000’s) 645 014 644 651 Diluted weighted number of shares (000’s) 645 408 645 236
Refer to ’Significant transactions affecting the current results’ for details on the accounting treatment of Discovery’s new head office.
Normalised operating profit per the segmental information, reflects the cash rental costs separately from the International Financial Reporting Standards (IFRS) finance lease treatment, as individual business expenses and margins are managed on underlying cash rental costs incurred by each business.
Normalised headline earnings adjusted for the impact of the accounting treatment of the new head office lease, would result in an increase of R208 million in normalised headline earnings to R5 609 million (increase of 20% compared to the prior financial year). The adjustment is calculated by replacing the depreciation of R126 million and finance charges of R210 million recognised in line with IFRS, with the actual market related rentals of R128 million.
Normalised headline earnings per share (with market related cash rentals)(cents) would be 869.5 on an undiluted basis and 869.0 on a diluted basis.
HEADLINE EARNINGSfor the year ended 30 June 2018
9

Attributable to equity holders of the Company
R million (audited)
Share capital and share premium
Preference share
capital
Share-basedpayment
reserve
Year ended 30 June 2018
At beginning of year 8 306 779 314
Total comprehensive income for the year – 83 –
Profit for the year – 83 – Other comprehensive income – – –
Transactions with owners 2 (83) 13
Delivery of treasury shares 2 – – Employee share option schemes:– Value of employee services – – 13 Dividends paid to preference shareholders – (83) – Dividends paid to ordinary shareholders – – –
At end of year 8 308 779 327
Year ended 30 June 2017
At beginning of year 8 300 779 319
Total comprehensive income for the year – 83 –
Profit for the year – 83 – Other comprehensive income – – –
Transactions with owners 6 (83) (5)
Increase in treasury shares (4) – – Delivery of treasury shares 11 – – Share buy-back (1) – – Employee share option schemes:– Share schemes cancelled – – (19)– Value of employee services – – 14 Dividends paid to preference shareholders – (83) – Dividends paid to ordinary shareholders – – –
At end of year 8 306 779 314
1 Thisrelatestothefairvalueadjustmentsofavailable-for-salefinancialassets.* Amount is less than R500 000.
STATEMENT OF CHANGES IN EQUITYfor the year ended 30 June 2018
10 Audited results and cash dividend declaration June 2018
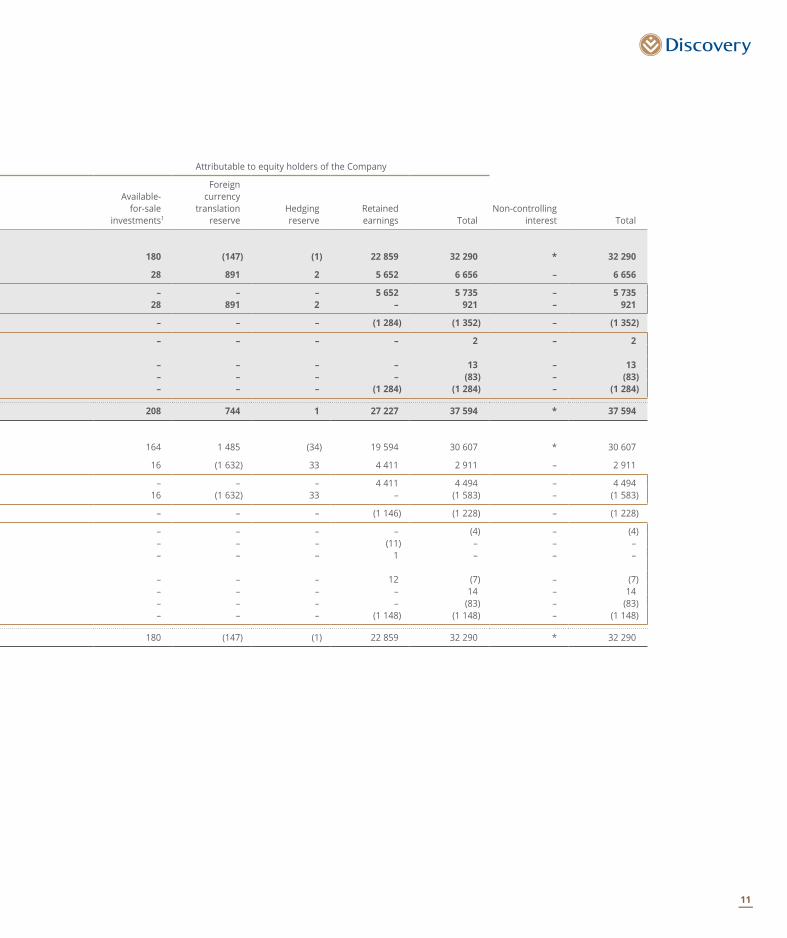
Attributable to equity holders of the Company
Available-for-sale
investments1
Foreign currency
translationreserve
Hedgingreserve
Retainedearnings Total
Non-controllinginterest Total
180 (147) (1) 22 859 32 290 * 32 290
28 891 2 5 652 6 656 – 6 656
– – – 5 652 5 735 – 5 735 28 891 2 – 921 – 921
– – – (1 284) (1 352) – (1 352)
– – – – 2 – 2
– – – – 13 – 13 – – – – (83) – (83) – – – (1 284) (1 284) – (1 284)
208 744 1 27 227 37 594 * 37 594
164 1 485 (34) 19 594 30 607 * 30 607
16 (1 632) 33 4 411 2 911 – 2 911
– – – 4 411 4 494 – 4 494 16 (1 632) 33 – (1 583) – (1 583)
– – – (1 146) (1 228) – (1 228)
– – – – (4) – (4) – – – (11) – – – – – – 1 – – –
– – – 12 (7) – (7) – – – – 14 – 14 – – – – (83) – (83) – – – (1 148) (1 148) – (1 148)
180 (147) (1) 22 859 32 290 * 32 290
11

R million
Group2018
Audited
Group2017
Audited
Cash flow from operating activities 3 414 (832)
Cash generated by operations 10 875 9 672 Purchase of investments held to back policyholder liabilities (24 217) (32 104)Proceeds from disposal of investments held to back policyholder liabilities 16 179 25 020 Working capital changes 250 (4 146)
3 087 (1 558)Dividends received 252 197 Interest received 2 062 1 711 Interest paid (759) (437)Taxation paid (1 228) (745)
Cash flow from investing activities (2 433) 15
Purchase of financial assets (23 631) (14 083)Proceeds from disposal of financial assets 23 621 16 208 Purchase of property and equipment (470) (239)Proceeds from disposal of property and equipment 7 5 Purchase of software and other intangible assets (1 940) (1 353)Proceeds from the sale of intangible assets – 7 Increase in investment in associate (20) (530)
Cash flow from financing activities 609 1 913
Dividends paid to ordinary shareholders (1 284) (1 152)Dividends paid to preference shareholders (83) (83)Increase in borrowings 2 654 3 514 Repayment of borrowings (678) (366)
Net increase in cash and cash equivalents 1 590 1 096 Cash and cash equivalents at beginning of year 9 097 8 614 Exchange losses on cash and cash equivalents 201 (613)
Cash and cash equivalents at end of year 10 888 9 097
Reconciliation to statement of financial positionCash and cash equivalents 10 894 9 098 Bank overdraft included in borrowings at amortised cost (6) (1)
Cash and cash equivalents at end of year 10 888 9 097
STATEMENT OF CASH FLOWSfor the year ended 30 June 2018
12 Audited results and cash dividend declaration June 2018

Fair value hierarchy of financial instrumentsThe Group’s financial instruments measured at fair value have been disclosed using a fair value hierarchy. The hierarchy has three levels that reflect the significance of the inputs used in measuring fair value. These are as follows:
Level 1 includes financial instruments that are measured using unadjusted, quoted prices in an active market for identical financial instruments. Quoted prices are readily and regularly available from an exchange, dealer, broker, industry group, pricing service or regulatory agency and those prices represent actual and regularly occurring market transactions on an arm’s length basis.
Level 2 includes financial instruments that are valued using techniques based significantly on observable market data. Instruments in this category are valued using:
(a) quoted prices for similar instruments or identical instruments in markets which are not considered to be active or
(b) valuation techniques where all the inputs that have a significant effect on the valuation are directly or indirectly based on observable market data.
Level 3 includes financial instruments that are valued using valuation techniques that incorporate information other than observable market data and where at least one input (which could have a significant effect on instruments’ valuation) cannot be based on observable market data.
30 June 2018
R million (audited) Level 1 Level 2 Level 3 Total
Financial assetsFinancial instruments at fair value through profit or loss:– Equity securities 29 769 873 – 30 642 – Equity linked notes – 211 – 211 – Debt securities 15 120 534 – 15 654 – Inflation linked securities 1 096 – – 1 096 – Money market securities 610 5 255 – 5 865 – Mutual funds 17 778 – – 17 778 Available-for-sale financial instruments:– Equity securities 166 9 – 175 – Equity linked notes – 20 – 20 – Debt securities 840 573 – 1 413 – Inflation linked securities 2 – – 2 – Money market securities 2 382 1 787 – 4 169 – Mutual funds 1 768 – – 1 768 Derivative financial instruments at fair value:– Hedges – 337 – 337 – Non-hedges – 157 – 157
69 531 9 756 – 79 287
Financial liabilitiesDerivative financial instruments at fair value:– Hedges – 51 – 51 – Non-hedges – 27 – 27
– 78 – 78
There were no transfers between level 1 and 2 during the current financial year.
ADDITIONAL INFORMATIONat 30 June 2018
13

Fair value hierarchy of financial instruments continuedSpecific valuation techniques used to value financial instruments in level 2– Discovery has invested in equity linked notes offered by international banks in order to back certain unit-linked contract liabilities. The
calculation of the daily value of the equity linked investments is made by the provider of the note. Discovery has procedures in place to ensure that these prices are correct. Aside from the daily reasonableness checks versus similar funds and movement since the prior day’s price, the fund values are calculated with reference to a specific formula or index, disclosed to the policyholders, which is recalculated by Discovery in order to check if the price provided by the provider is correct.
– If a quoted market price is not available on a recognised stock exchange or from a broker for non-exchange traded financial instruments, the fair value of the instrument is estimated by the asset managers, using valuation techniques including the use of recent arm’s length market transactions, reference to the current fair value of another instrument that is substantially the same, discounted cash flow techniques, option pricing models or other valuation techniques that provide a reliable estimate of prices obtained in actual market transactions.
– The fair value of the hedged derivatives is calculated as follows:
(a) The fair value of call options is calculated on a Black-Scholes model.
(b) The fair value of the return swaps is calculated by discounting the future cash flows of the instruments.
(c) The fair value of interest rate swaps is calculated as the present value of the estimated future cash flows based on observable yield curves.
30 June 2017
R million (audited) Level 1 Level 2 Level 3 Total
Financial assetsFinancial instruments at fair value through profit or loss:– Equity securities 24 069 – – 24 069 – Equity linked notes – 2 557 – 2 557 – Debt securities 11 815 462 – 12 277 – Inflation linked securities 386 – – 386 – Money market securities 590 5 628 – 6 218 – Mutual funds 13 441 – – 13 441 Available-for-sale financial instruments:– Equity securities 145 – – 145 – Equity linked notes – 17 – 17 – Debt securities 94 147 – 241 – Inflation linked securities 5 – – 5 – Money market securities 642 1 588 – 2 230 – Mutual funds 4 660 – – 4 660 Derivative financial instruments at fair value:– Hedges – 354 – 354 – Non-hedges – 38 – 38
55 847 10 791 – 66 638
Financial liabilitiesDerivative financial instruments at fair value:– Hedges – 29 – 29 – Non-hedges – 106 – 106
– 135 – 135
ADDITIONAL INFORMATION continuedat 30 June 2018
14 Audited results and cash dividend declaration June 2018
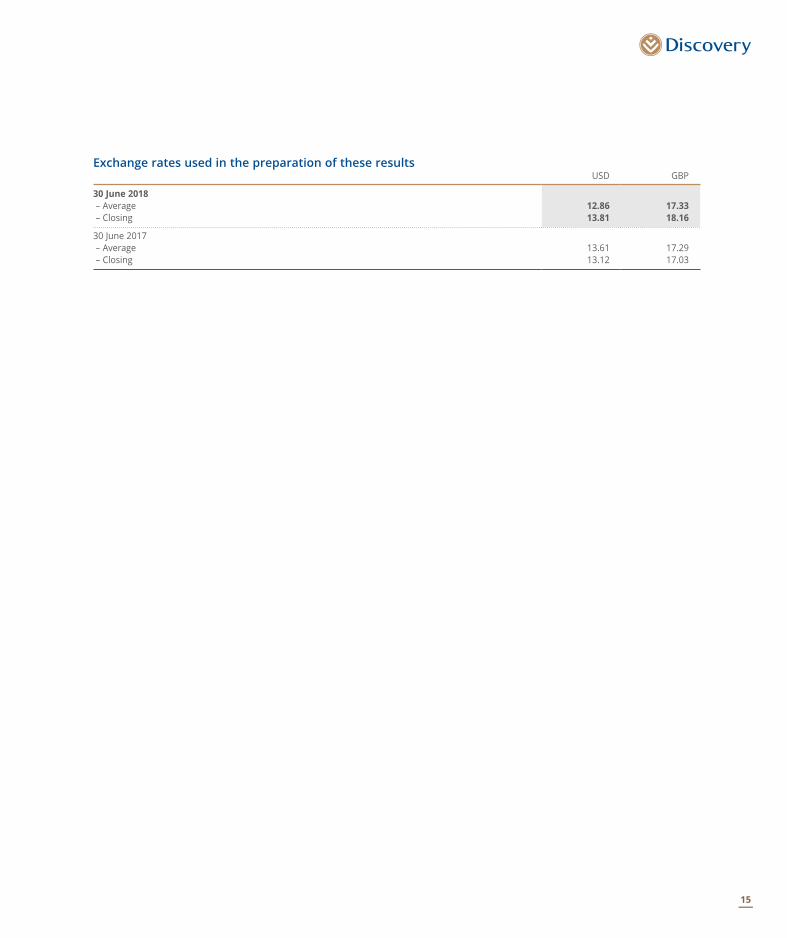
Exchange rates used in the preparation of these results USD GBP
30 June 2018 – Average 12.86 17.33 – Closing 13.81 18.16
30 June 2017 – Average 13.61 17.29 – Closing 13.12 17.03
15

SEGMENTAL INFORMATIONfor the year ended 30 June 2018
R million (audited)SA
HealthSA
LifeSA
InvestSA
Vitality
Income statementInsurance premium revenue 30 11 103 12 056 – Reinsurance premiums (2) (2 141) – –
Net insurance premium revenue 28 8 962 12 056 – Fee income from administration business 6 911 31 1 875 – Vitality income – – – 2 323 Investment income earned on assets backing policyholder liabilities – 472 44 – Finance charge on negative reserve funding – – – – Inter-segment funding1 – (708) 708 – Net fair value gains on financial assets at fair value through profit or loss 2 589 3 741 –
Net income 6 941 9 346 18 424 2 323
Claims and policyholders’ benefits (2) (6 943) (7 375) – Insurance claims recovered from reinsurers 1 1 534 – –
Net claims and policyholders’ benefits (1) (5 409) (7 375) – Acquisition costs (3) (1 606) (1 046) (76)Marketing and administration expenses– depreciation and amortisation (305) (8) – (3)– impairment (7) – – – – other expenses (3 855) (1 639) (808) (2 186)Recovery of expenses from reinsurers – – – – Transfer from assets/liabilities under insurance contracts– change in assets arising from insurance contracts – 3 405 – – – change in assets arising from reinsurance contracts – 25 – – – change in liabilities arising from insurance contracts (1) (35) (8 031) – – change in liabilities arising from reinsurance contracts – (239) – – Fair value adjustment to liabilities under investment contracts – (3) (279) – Share of net profits from equity-accounted investments 8 – – –
Normalised profit/(loss) from operations 2 777 3 837 885 58 Investment income earned on shareholder investments and cash 66 39 26 30 Net fair value gains on financial assets at fair value through profit or loss – – – – Net realised gains on available-for-sale financial assets – 6 1 – Initial expenses related to Prudential Book transfer – – – – Amortisation of intangibles from business combinations – – – – Market rentals related to Head Office building adjusted for finance costs and depreciation – – – – Finance costs (41) (9) – – Foreign exchange (losses)/gains (3) – (9) –
Profit before tax 2 799 3 873 903 88 Income tax expense (718) (929) (253) (25)
Profit for the year 2 081 2 944 650 63
1 Theinter-segmentfundingofR708millionreflectsanotionalallocationofinterestearnedonthenegativereservebackingpolicyholders’fundsofguaranteedinvestmentproducts and hence is transferred to Discovery Invest.
16 Audited results and cash dividend declaration June 2018

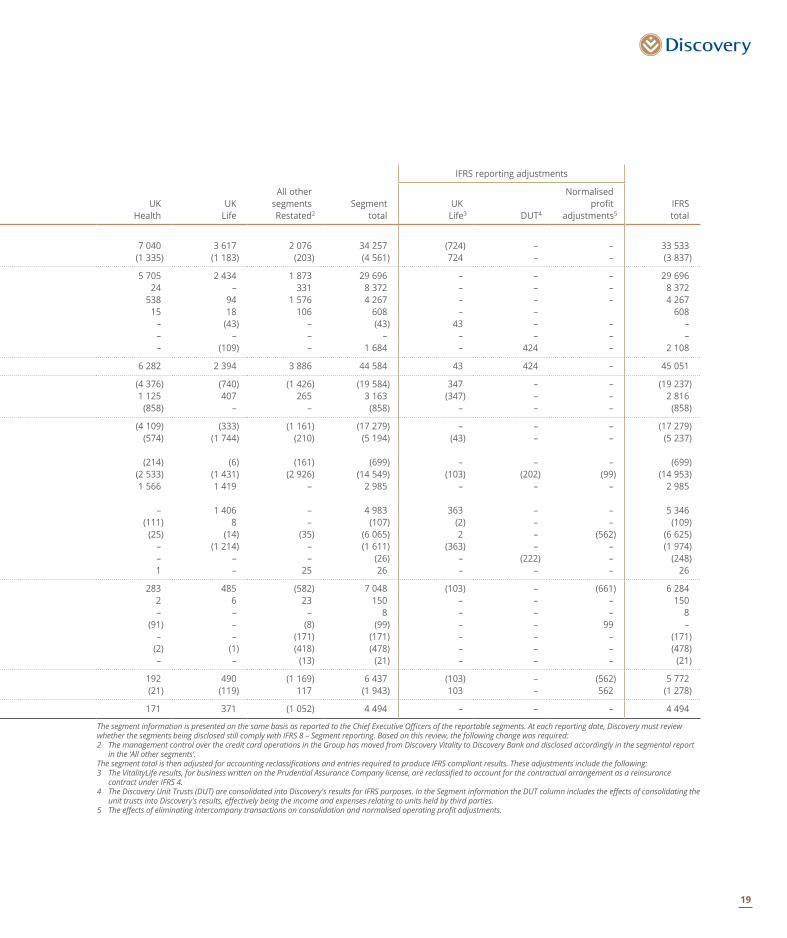
IFRS reporting adjustments
UKHealth
UKLife
All othersegments
Segmenttotal
UKLife2 DUT3
Normalised profit
adjustments4IFRStotal
7 471 4 031 2 665 37 356 (671) – – 36 685 (1 165) (1 559) (160) (5 027) 671 – – (4 356)
6 306 2 472 2 505 32 329 – – – 32 329 30 – 401 9 248 – – 4 9 252
444 91 1 633 4 491 – – – 4 491 11 18 141 686 – – – 686
– (160) – (160) 160 – – – – – – – – – – –
(1) 92 18 4 441 – 1 312 70 5 823
6 790 2 513 4 698 51 035 160 1 312 74 52 581
(4 029) (997) (1 590) (20 936) 447 (225) – (20 714)938 584 125 3 182 (447) – – 2 735
(3 091) (413) (1 465) (17 754) – (225) – (17 979) (536) (1 887) (280) (5 434) (160) – – (5 594)
(238) (18) (242) (814) – – (126) (940) (193) – – (200) – – – (200)
(2 849) (1 620) (3 163) (16 120) (27) – 68 (16 079)625 1 917 – 2 542 – – – 2 542
– 2 855 – 6 260 (1 119) – – 5 141 5 6 (1) 35 1 – – 36
76 (10) (49) (8 050) (1) (21) (16) (8 088) – (2 828) – (3 067) 1 119 – – (1 948) – – – (282) – (1 066) 40 (1 308) – – 107 115 – – – 115
589 515 (395) 8 266 (27) – 40 8 279 1 6 41 209 – – – 209 – – 110 110 – – (110) – – – 3 10 – – – 10 – (2) – (2) – – 2 – – – (123) (123) – – – (123)
– – (208) (208) – – 208 – (1) (2) (713) (766) – – (193) (959) – (3) 11 (4) – – – (4)
589 514 (1 274) 7 492 (27) – (53) 7 412 (13) (85) 303 (1 720) 27 – 16 (1 677)
576 429 ( 971) 5 772 – – (37) 5 735
ThesegmentinformationispresentedonthesamebasisasreportedtotheChiefExecutiveOfficersofthereportablesegments.ThesegmenttotalisthenadjustedforaccountingreclassificationsandentriesrequiredtoproduceIFRScompliantresults.Theseadjustmentsincludethefollowing:2 TheVitalityLiferesults,forbusinesswrittenonthePrudentialAssuranceCompanylicense,arereclassifiedtoaccountforthecontractualarrangementasareinsurance
contract under IFRS 4.3 TheDiscoveryUnitTrusts(DUT)areconsolidatedintoDiscovery’sresultsforIFRSpurposes.IntheSegmentinformationtheDUTcolumnincludestheeffectsofconsolidatingthe
unittrustsintoDiscovery’sresults,effectivelybeingtheincomeandexpensesrelatingtounitsheldbythirdparties.4 Theeffectsofeliminatingintercompanytransactionsonconsolidationandnormalisedoperatingprofitadjustments.
17

R million (Audited and restated)SA
HealthSA
LifeSA
Invest
SAVitality
Restated2
Income statementInsurance premium revenue 16 9 993 11 515 – Reinsurance premiums (2) (1 838) – –
Net insurance premium revenue 14 8 155 11 515 – Fee income from administration business 6 314 26 1 677 – Vitality income – – – 2 059 Investment income earned on assets backing policyholder liabilities – 431 38 – Finance charge on negative reserve funding – – – – Inter-segment funding1 – (573) 573 – Net fair value gains on financial assets at fair value through profit or loss – 476 1 317 –
Net income 6 328 8 515 15 120 2 059
Claims and policyholders’ benefits (1) (6 241) (6 800) – Insurance claims recovered from reinsurers 1 1 365 – – Recapture of reinsurance – – – –
Net claims and policyholders’ benefits – (4 876) (6 800) – Acquisition costs – (1 565) (1 022) (79)Marketing and administration expenses– depreciation and amortisation (303) (15) – – – other expenses (3 520) (1 521) (663) (1 955)Recovery of expenses from reinsurers – – – – Transfer from assets/liabilities under insurance contracts– change in assets arising from insurance contracts – 3 577 – – – change in assets arising from reinsurance contracts – (4) – – – change in liabilities arising from insurance contracts – (124) (5 867) – – change in liabilities arising from reinsurance contracts – (397) – – Fair value adjustment to liabilities under investment contracts – (2) (24) – Share of net profits from equity-accounted investments – – – –
Normalised profit/(loss) from operations 2 505 3 588 744 25 Investment income earned on shareholder investments and cash 55 26 21 17 Net realised gains on available-for-sale financial assets – 1 7 – Rebranding and business acquisitions expenses – – – – Amortisation of intangibles from business combinations – – – – Finance costs (49) (8) – – Foreign exchange losses – – (8) –
Profit before tax 2 511 3 607 764 42 Income tax expense (685) (1 008) (214) (13)
Profit for the year 1 826 2 599 550 29
1 Theinter-segmentfundingofR573millionreflectsanotionalallocationofinterestearnedonthenegativereservebackingpolicyholders’fundsofguaranteedinvestmentproducts and hence is transferred to Discovery Invest.
SEGMENTAL INFORMATION continuedfor the year ended 30 June 2017
18 Audited results and cash dividend declaration June 2018
IFRS reporting adjustments
UKHealth
UKLife
All othersegmentsRestated2
Segmenttotal
UKLife3 DUT4
Normalised profit
adjustments5IFRStotal
7 040 3 617 2 076 34 257 (724) – – 33 533 (1 335) (1 183) (203) (4 561) 724 – – (3 837)
5 705 2 434 1 873 29 696 – – – 29 696 24 – 331 8 372 – – – 8 372
538 94 1 576 4 267 – – – 4 267 15 18 106 608 – – 608
– (43) – (43) 43 – – – – – – – – – – – – (109) – 1 684 – 424 – 2 108
6 282 2 394 3 886 44 584 43 424 – 45 051
(4 376) (740) (1 426) (19 584) 347 – – (19 237) 1 125 407 265 3 163 (347) – – 2 816
(858) – – (858) – – – (858)
(4 109) (333) (1 161) (17 279) – – – (17 279) (574) (1 744) (210) (5 194) (43) – – (5 237)
(214) (6) (161) (699) – – – (699)
(2 533) (1 431) (2 926) (14 549) (103) (202) (99) (14 953) 1 566 1 419 – 2 985 – – – 2 985
– 1 406 – 4 983 363 – – 5 346 (111) 8 – (107) (2) – – (109)
(25) (14) (35) (6 065) 2 – (562) (6 625) – (1 214) – (1 611) (363) – – (1 974) – – – (26) – (222) – (248) 1 – 25 26 – – – 26
283 485 (582) 7 048 (103) – (661) 6 284 2 6 23 150 – – – 150 – – – 8 – – – 8
(91) – (8) (99) – – 99 – – – (171) (171) – – – (171)
(2) (1) (418) (478) – – – (478) – – (13) (21) – – – (21)
192 490 (1 169) 6 437 (103) – (562) 5 772 (21) (119) 117 (1 943) 103 – 562 (1 278)
171 371 (1 052) 4 494 – – – 4 494
ThesegmentinformationispresentedonthesamebasisasreportedtotheChiefExecutiveOfficersofthereportablesegments.Ateachreportingdate,DiscoverymustreviewwhetherthesegmentsbeingdisclosedstillcomplywithIFRS8–Segmentreporting.Basedonthisreview,thefollowingchangewasrequired:2 ThemanagementcontroloverthecreditcardoperationsintheGrouphasmovedfromDiscoveryVitalitytoDiscoveryBankanddisclosedaccordinglyinthesegmentalreport
inthe‘Allothersegments’.ThesegmenttotalisthenadjustedforaccountingreclassificationsandentriesrequiredtoproduceIFRScompliantresults.Theseadjustmentsincludethefollowing:3 TheVitalityLiferesults,forbusinesswrittenonthePrudentialAssuranceCompanylicense,arereclassifiedtoaccountforthecontractualarrangementasareinsurance
contract under IFRS 4. 4 TheDiscoveryUnitTrusts(DUT)areconsolidatedintoDiscovery'sresultsforIFRSpurposes.IntheSegmentinformationtheDUTcolumnincludestheeffectsofconsolidatingthe
unittrustsintoDiscovery'sresults,effectivelybeingtheincomeandexpensesrelatingtounitsheldbythirdparties.5 Theeffectsofeliminatingintercompanytransactionsonconsolidationandnormalisedoperatingprofitadjustments.
19
REVIEW OF GROUP RESULTSfor the year ended 30 June 2018
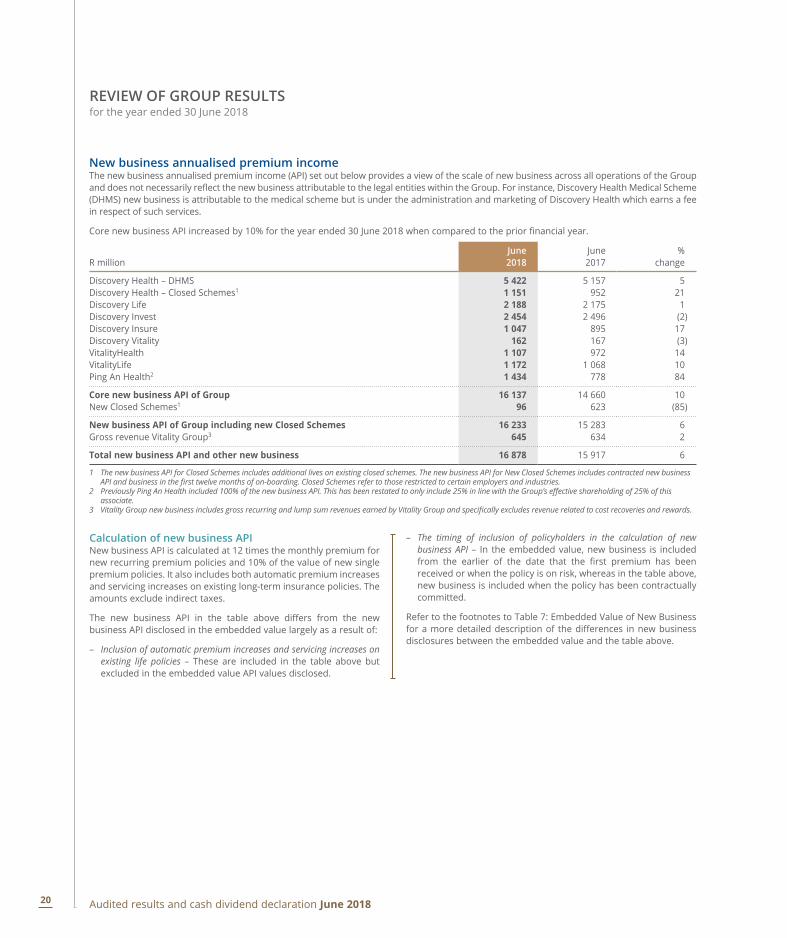
New business annualised premium incomeThe new business annualised premium income (API) set out below provides a view of the scale of new business across all operations of the Group and does not necessarily reflect the new business attributable to the legal entities within the Group. For instance, Discovery Health Medical Scheme (DHMS) new business is attributable to the medical scheme but is under the administration and marketing of Discovery Health which earns a fee in respect of such services.
Core new business API increased by 10% for the year ended 30 June 2018 when compared to the prior financial year.
R millionJune2018
June2017
%change
Discovery Health – DHMS 5 422 5 157 5Discovery Health – Closed Schemes1 1 151 952 21Discovery Life 2 188 2 175 1Discovery Invest 2 454 2 496 (2)Discovery Insure 1 047 895 17Discovery Vitality 162 167 (3)VitalityHealth 1 107 972 14VitalityLife 1 172 1 068 10Ping An Health2 1 434 778 84
Core new business API of Group 16 137 14 660 10New Closed Schemes1 96 623 (85)
New business API of Group including new Closed Schemes 16 233 15 283 6Gross revenue Vitality Group3 645 634 2
Total new business API and other new business 16 878 15 917 6
1 The new business API for Closed Schemes includes additional lives on existing closed schemes. The new business API for New Closed Schemes includes contracted new business APIandbusinessinthefirsttwelvemonthsofon-boarding.ClosedSchemesrefertothoserestrictedtocertainemployersandindustries.
2 PreviouslyPingAnHealthincluded100%ofthenewbusinessAPI.Thishasbeenrestatedtoonlyinclude25%inlinewiththeGroup’seffectiveshareholdingof25%ofthisassociate.
3 VitalityGroupnewbusinessincludesgrossrecurringandlumpsumrevenuesearnedbyVitalityGroupandspecificallyexcludesrevenuerelatedtocostrecoveriesandrewards.
Calculation of new business APINew business API is calculated at 12 times the monthly premium for new recurring premium policies and 10% of the value of new single premium policies. It also includes both automatic premium increases and servicing increases on existing long-term insurance policies. The amounts exclude indirect taxes.
The new business API in the table above differs from the new business API disclosed in the embedded value largely as a result of:
– Inclusion of automatic premium increases and servicing increases on existing life policies – These are included in the table above but excluded in the embedded value API values disclosed.
– The timing of inclusion of policyholders in the calculation of new business API – In the embedded value, new business is included from the earlier of the date that the first premium has been received or when the policy is on risk, whereas in the table above, new business is included when the policy has been contractually committed.
Refer to the footnotes to Table 7: Embedded Value of New Business for a more detailed description of the differences in new business disclosures between the embedded value and the table above.
20 Audited results and cash dividend declaration June 2018

Gross inflows under managementGross inflows under management measures the total funds collected by Discovery. Gross inflows under management increased by 9% for the year ended 30 June 2018 when compared to the prior financial year.
R millionJune2018
June2017
%change
Discovery Health 75 430 68 226 11Discovery Life 11 134 10 019 11Discovery Invest 19 901 19 461 2Discovery Insure 2 694 2 099 28Discovery Vitality1 2 323 2 059 13VitalityHealth 7 945 7 602 5VitalityLife 4 122 3 711 11All other businesses 2 005 1 884 6
Gross inflows under management 125 554 115 061 9Less: collected on behalf of third parties (74 459) (68 165) 9
Discovery Health (68 489) (61 896) 11Discovery Invest (5 970) (6 269) (5)
Gross income of Group per the segmental information 51 095 46 896 9
Gross income is made up as follows:– Insurance premium revenue 37 356 34 257 9– Fee income from administration business 9 248 8 372 10– Vitality income 4 491 4 267 5
Gross income of Group per the segmental information 51 095 46 896 9
1 ThecomparativehasbeenrestatedtoincludetheDiscoveryCardjointarrangementgrossinflowsundermanagementin‘Allotherbusinesses’,whichwaspreviouslyincludedinDiscoveryVitalitygrossinflowsundermanagement.ThisrestatementwasnecessaryasthemanagementcontroloverthecreditcardoperationsintheGrouphasmovedfrom DiscoveryVitalitytoDiscoveryBankanddisclosedaccordinglyinthesegmentalreport.TheDiscoveryCardjointarrangementgrossinflowsamountstoR427million (2017:R413million).
21

REVIEW OF GROUP RESULTS continuedfor the year ended 30 June 2018
Normalised profit from operationsThe following table shows the main components of the normalised profit from operations for the year ended 30 June 2018:
R millionJune2018
June2017
%change
Discovery Health 2 777 2 505 11Discovery Life 3 837 3 588 7Discovery Invest 885 744 19Discovery Vitality1 58 25 132VitalityHealth 589 283 108VitalityLife 515 485 6
Normalised profit from established businesses 8 661 7 630 14
Emerging businesses 158 (170) 193
– Discovery Insure 68 (21) 424– Vitality Group 90 (149) 160
Development and other segments (553) (412) (34)
Normalised profit from operations 8 266 7 048 17
1 ThecomparativeshavebeenrestatedtoreallocatetheDiscoveryCardjointarrangementandtheadditional54.99%DiscoveryCardprofitsharefromestablishedbusinessestothe‘Developmentandothersegments’.ThisrestatementwasnecessaryasmanagementcontroloverthecreditcardoperationsintheGrouphasmovedfromDiscoveryVitalitytoDiscoveryBankanddisclosedaccordinglyinthesegmentalreport.TheDiscoveryCardjointarrangementand54.99%DiscoveryCardprofitshareamountstoR259million(2017:R165million).Thelatterintheformofaftertaxdividends.
Emerging businesses are those businesses that have achieved sufficient scale to be profitable or profitable in the near future, although not yet significant in cash generation for the Group and likely to require funds to support new business growth. These businesses are approximately 5 years into their launch. Discovery Insure, which has been disclosed in ‘Emerging businesses’, excludes the commercial offering which is a new venture that commenced during the year under review and is shown in ‘Development and other segments’.
‘Development and other segments’ include costs of start-up businesses and expenses incurred to investigate new products and markets. Start-up costs include costs in relation to the Discovery Bank, Vitality Invest which is the recently launched UK investment business, a commercial offering in Discovery Insure, and an Umbrella Fund offering in Discovery Invest. Unallocated head office costs are also included in this segment.
Significant transactions affecting the current resultsDiscovery’s new head officeDiscovery has entered into a 15 year lease agreement for its new head office which comprises two phases of development. The lease commenced November 2017 and March 2018 for Phase I and Phase II respectively. Discovery started taking occupancy of the buildings at those dates, on a phased approach.
IAS 17: Leases, requires a lessee to classify a lease as either a finance lease or an operating lease. A lease is classified as a finance lease if it transfers substantially all the risks and rewards incidental to ownership. All other leases are classified as operating leases.
In terms of the indicators provided in IAS 17.10 and IAS 17.11, Discovery has classified the lease as a finance lease given that the present value of the minimum lease payments amounts to at least substantially all of the fair value of the leased asset. This accounting treatment has resulted in the recognition of an asset of R3 155 million, which has been disclosed in ‘Property and equipment’ and a corresponding lease liability, which has been disclosed in ‘Borrowings’ in the Statement of financial position. It should be noted that ownership of the building does not transfer at the end of the lease period but remains that of the landlord.
The treatment under IFRS 16: Leases, effective for reporting periods commencing on or after 1 January 2019, would result in a similar treatment with the lease capitalised and as a result the accounting treatment in respect of this particular lease is aligned with the future accounting standard effective not yet adopted by Discovery.
The recognised asset is depreciated over the lease term, using the straight-line method. R126 million depreciation has been recognised in profit or loss for the respective periods since beneficial occupancy. Finance charges of R210 million have been recognised in profit or loss in respect of the finance lease liability. Normalised profit from operations includes the market related rental paid.
As Discovery took occupancy of the new building on a phased approach various building costs, such as rental, have been duplicated during the transitional period in the current financial year as costs were incurred on both the new and old premises. For the calculation of normalised headline earnings, duplicate rental charges of R37 million have been added back.
22 Audited results and cash dividend declaration June 2018
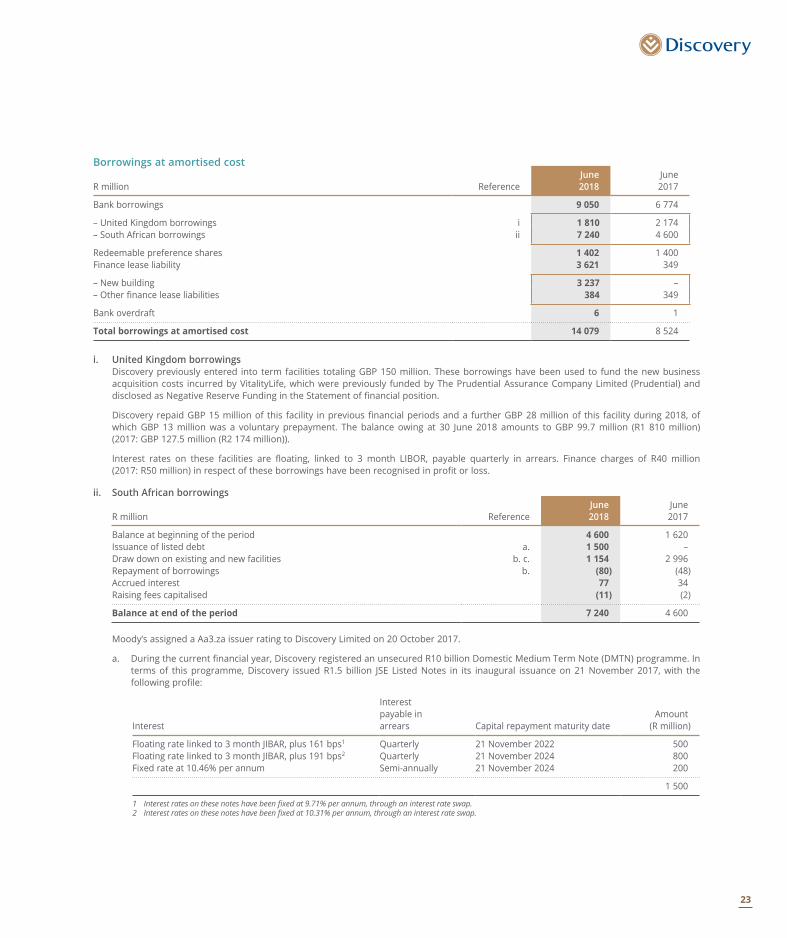
Borrowings at amortised cost
R million ReferenceJune2018
June 2017
Bank borrowings 9 050 6 774
– United Kingdom borrowings i 1 810 2 174– South African borrowings ii 7 240 4 600
Redeemable preference shares 1 402 1 400Finance lease liability 3 621 349
– New building 3 237 –– Other finance lease liabilities 384 349
Bank overdraft 6 1
Total borrowings at amortised cost 14 079 8 524
i. United Kingdom borrowings Discovery previously entered into term facilities totaling GBP 150 million. These borrowings have been used to fund the new business
acquisition costs incurred by VitalityLife, which were previously funded by The Prudential Assurance Company Limited (Prudential) and disclosed as Negative Reserve Funding in the Statement of financial position.
Discovery repaid GBP 15 million of this facility in previous financial periods and a further GBP 28 million of this facility during 2018, of which GBP 13 million was a voluntary prepayment. The balance owing at 30 June 2018 amounts to GBP 99.7 million (R1 810 million) (2017: GBP 127.5 million (R2 174 million)).
Interest rates on these facilities are floating, linked to 3 month LIBOR, payable quarterly in arrears. Finance charges of R40 million (2017: R50 million) in respect of these borrowings have been recognised in profit or loss.
ii. South African borrowings
R million ReferenceJune2018
June 2017
Balance at beginning of the period 4 600 1 620 Issuance of listed debt a. 1 500 –Draw down on existing and new facilities b. c. 1 154 2 996 Repayment of borrowings b. (80) (48)Accrued interest 77 34 Raising fees capitalised (11) (2)
Balance at end of the period 7 240 4 600
Moody’s assigned a Aa3.za issuer rating to Discovery Limited on 20 October 2017.
a. During the current financial year, Discovery registered an unsecured R10 billion Domestic Medium Term Note (DMTN) programme. In terms of this programme, Discovery issued R1.5 billion JSE Listed Notes in its inaugural issuance on 21 November 2017, with the following profile:
Interest
Interest payable in arrears Capital repayment maturity date
Amount (R million)
Floating rate linked to 3 month JIBAR, plus 161 bps1 Quarterly 21 November 2022 500Floating rate linked to 3 month JIBAR, plus 191 bps2 Quarterly 21 November 2024 800Fixed rate at 10.46% per annum Semi-annually 21 November 2024 200
1 500
1 Interestratesonthesenoteshavebeenfixedat9.71%perannum,throughaninterestrateswap.2 Interestratesonthesenoteshavebeenfixedat10.31%perannum,throughaninterestrateswap.
23

REVIEW OF GROUP RESULTS continuedfor the year ended 30 June 2018
b. Discovery Central Services, a subsidiary of the Discovery Group, concluded a 10 year loan facility agreement of R650 million in December 2016, of which R495 million was utilised in the previous financial year. The remaining portion of this facility of R155 million was utilised during this financial period and R73 million was repaid in terms of the agreement. Interest rates on the facility are fixed at a weighted average rate of 11.56% per annum, with capital and interest repayable in instalments over the duration of the loan facility.
c. Discovery Limited entered into a new unsecured R1 billion 5 year loan facility agreement in March 2018, which was fully drawn down in June 2018. Interest rates on this facility is linked to 3 month JIBAR, plus 245 bps. Interest is payable quarterly in arrears and capital is repayable in full at maturity on 2 March 2023. Interest rates on this facility have been fixed at 10.275% per annum, through an interest rate swap.
Finance charges of R512 million (2017: R368 million) in respect of these South African borrowings have been recognised in profit or loss.
Negative reserve funding (acquisition cost funding)This liability represents the acquisition costs in respect of business written on the Prudential Assurance Company’s (Prudential) life insurance license and were funded by Prudential. The liability is repaid on a matched basis as the cash flows emerge from this business. In the event that the cash flows do not emerge as anticipated, VitalityLife would be required to repay these liabilities from other resources.
In terms of the level premium reinsurance treaty entered into in respect of this business, a security deposit was required to be placed by the reinsurer, to reduce counterparty risk. At 30 June 2018, GBP 169 million (R3 065 million) (2017: GBP 147 million (R2 501 million)) was held as a security deposit. The contractual arrangement in respect of the business written on the Prudential license is accounted for as a reinsurance contract under IFRS 4 and as a result, the ‘deposit back’ held has been disclosed as a reduction of the negative reserve funding liability.
During the 2018 financial year, additional amounts were received as ‘deposit back’ in excess of the negative reserve funding. The agreements indicate that offset is applicable up to the amount of the negative reserve funding. Any additional amounts of the deposit back received thereafter, are included in cash. The corresponding liability to the reinsurer has been accounted for in Trade and other payables.
The decrease in the negative reserve funding liability in the current financial year, relates to the partial repayment of funding by VitalityLife as well as an increase in the amount of deposit back held, which has been offset against the liability. There is still an amount payable to Prudential of GBP120.5 million (R2 189 million) at 30 June 2018.
Consolidation of Discovery Unit TrustsThe Discovery Unit Trusts are consolidated into Discovery’s results for accounting purposes, which results in the recognition of the underlying assets and liabilities of each of the funds.
Assets and liabilities of the Discovery Unit Trusts increased by R7 689 million respectively compared to the prior financial year with movements in the following line items on the Group’s Statement of financial position:
– Investments at fair value through profit or loss increased by R8 269 million.
– Investment contracts at fair value through profit or loss increased by R7 836 million.
– Cash and cash equivalents decreased by R617 million.
– Trade and other payables decreased by R144 million.
– Other assets increased by R37 million.
– Other liabilities decreased by R3 million.
As these policies are linked, the consolidation of the Discovery Unit Trusts has no impact on the net asset value for Discovery shareholders.
Other significant items in these resultsMaterial transactions with related partiesDiscovery Health administers the Discovery Health Medical Scheme (DHMS) and provides managed care services for which it charges an administration fee and a managed healthcare fee respectively. These fees are determined on an annual basis and approved by the trustees of DHMS. The fees totalled R5 496 million for the year ended 30 June 2018 (2017: R5 090 million). Discovery offers the members of DHMS access to the Vitality programme.
Financial assets at fair value through profit or loss Financial assets at fair value through profit or loss have increased by R12.3 billion due to market growth and the sale of Discovery Invest products. This includes the impact of consolidating the Discovery Unit Trusts into the Group’s results. The increase in the financial assets at fair value through profit or loss has been presented in ‘Purchase of investments held to back policyholder liabilities’ of R24 217 million in the Statement of cash flows.
Deferred taxWith the promulgation of the South African Insurance Act 18 of 2017, in January 2018, the new ‘adjusted IFRS’ tax basis, effective 1 July 2018, has been substantively enacted as at 30 June 2018. As a result, deferred tax has been calculated on this basis and reflects the values at which the tax liabilities will ultimately be settled. A reduction in the deferred tax liability of R119 million has been recognised as a timing difference, and has been adjusted for in the calculation of normalised headline earnings.
During the current year a deferred tax asset has been recognised on the assessed loss in Discovery Insure. Further amounts were raised during the current year in respect of the VitalityHealth assessed losses. These amounted to R243 million and R109 million respectively, and have been added back in the calculation of normalised headline earnings.
Taxation For South African entities that are in a tax paying position, tax has been provided at 28% (2017: 28%) in the financial statements. Where an entity is in an assessed loss position, a deferred tax asset is recognised to the extent that it is probable that there will be future taxable profits against which assessed losses can be utilised.
24 Audited results and cash dividend declaration June 2018

Shareholder informationDirectorateChanges to the Board of Discovery Limited from 1 July 2017 to the date of this announcement are as follows:
– Mr R Farber relinquished his role as Chief Financial Officer and Group Financial Director of Discovery in the prior financial year and remained a director of the Board of Discovery Limited. Effective 1 April 2018, Mr R Farber was redesignated as a non-executive director.
– Mr JM Robertson has retired as executive director and Group Chief Information Officer from the Board of Discovery Limited with effect from 31 August 2018.
Dr BA Brink, Ms SE de Bruyn Sebotsa, Dr TV Maphai and Mr TT Mboweni retire by rotation at the forthcoming Annual General Meeting of shareholders and are eligible and available for re-election.
Dividend and capitalInterim dividends paid in respect of the 2018 financial yearThe following interim dividends were paid during the current financial year:
– B preference share dividend of 518.15068 cents (414.52054 cents net of dividend withholding tax), paid on 12 March 2018.
– Ordinary share dividend of 101 cents per share (80.8 cents net of dividend withholding tax), paid on 19 March 2018.
Final dividend declaration in respect of the 2018 financial yearB preference share cash dividend declaration:On 23 August 2018, the directors declared a final gross cash dividend of 501.91781 cents (401.53425 cents net of dividend withholding tax) per B preference share for the period 1 January 2018 to 30 June 2018, payable from the income reserves of the Company. A dividend withholding tax of 20% will be applicable to all shareholders who are not exempt.
The issued preference share capital at the declaration date is 8 million B preference shares.
The salient dates for the dividend were as follows:
Last day of trade to receive a dividend Tuesday, 11 September 2018
Shares commence trading "ex" dividend Wednesday, 12 September 2018
Record date Friday, 14 September 2018
Payment date Monday, 17 September 2018
B preference share certificates may not be dematerialised or rematerialised between Wednesday, 12 September 2018 and Friday, 14 September 2018, both days inclusive.
Ordinary share cash dividend declaration:Notice is hereby given that the directors have declared a final gross cash dividend of 114 cents (91.2 cents net of dividend withholding tax) per ordinary share, out of income reserves for the year ended 30 June 2018. A dividend withholding tax of 20% will be applicable to all shareholders who are not exempt.
The issued ordinary share capital at the declaration date is 646 844 992 ordinary shares.
The salient dates for the dividend will be as follows:
Last day of trade to receive a dividend Tuesday, 2 October 2018
Shares commence trading "ex" dividend Wednesday, 3 October 2018
Record date Friday, 5 October 2018
Payment date Monday, 8 October 2018
Share certificates may not be dematerialised or rematerialised between Wednesday, 3 October 2018 and Friday, 5 October 2018, both days inclusive.
Capital requirementsThe table below summarises the capital adequacy requirement (CAR) on the statutory basis, across the Group subsidiaries, and the actual solvency capital held in relation to this requirement, at 30 June.
Statutory CAR2018
cover Statutory CAR2017
cover
Discovery Life R866 million 3.5 times R705 million 3.9 timesDiscovery Insure R630 million 2.0 times R473 million 2.2 timesVitality Health GBP 87 million (R1 580 million) 1.4 times GBP 83 million (R1 420 million) 1.5 timesVitality Life GBP 133 million (R2 414 million) 1.9 times GBP 87.5 million (R1 490 million) 2.1 times
25

Events after reporting dateBankingAs detailed in the operating commentary, subsequent to balance sheet date, Discovery and FirstRand Investment Holdings Limited (FRIHL) have agreed that it would be preferable for FRIHL to exit their shareholding in Discovery Bank as soon as practically possible.
The proposed transaction includes:
(i) the acquisition of the effective 25.01% interest of FRIHL in Discovery Bank
(ii) Acquiring the remaining 25.01% economic interest that FirstRand Bank currently owns in the Discovery Card joint venture business
(iii) Discovery Bank acquiring all rights to the Discovery card book and related assets which will be migrated over time
The transaction is subject to approval by the regulatory authorities including The Chief Executive Officer of the Prudential Authority, SARB and The Competition Authorities.
The total combined acquisition price payable by Discovery to the FirstRand Group will be R1.8 billion. Since the acquisition of the remaining 25% constitutes a new initiative and presents an important opportunity for the Discovery Group, the Board have decided that this acquisition should be funded by way of an equity issuance, limited to the purchase price. Given the relative immateriality, the transaction does not require shareholder approval.
Listed debt issueOn 29 August 2018, as part of its ongoing capital management process, Discovery Limited issued further Floating Rate Notes in terms of its Domestic Medium Term Note Programme (DMTN) totalling R700 million. Capital repayment is on maturity date being 21 August 2026. The coupon interest rate in respect of the notes is linked to 3 month JIBAR plus 180 bps, with interest payable quarterly in arrears. Interest rates on these notes have been fixed at 10.29% per annum, through interest rate swap. This brings the total nominal value in issue under the DMTN programme to R2.2 billion.
Basis of preparationThe summary consolidated financial statements are prepared in accordance with the requirements of the JSE Limited Listings Requirements for preliminary reports, and the requirements of the Companies Act applicable to summary financial statements. The Listings Requirements require preliminary reports to be prepared in accordance with the framework concepts and the measurement and recognition requirements of International Financial Reporting Standards (IFRS) and the SAICA Financial Reporting Guides as issued by the Accounting Practices Committee and Financial Pronouncements as issued by the Financial Reporting Standards Council and to also, as a minimum, contain the information required by IAS 34 Interim Financial Reporting. The accounting policies applied in the preparation of the consolidated financial statements from which the summary consolidated financial statements were derived are in terms of International Financial Reporting Standards and are consistent with those accounting policies applied in the preparation of the previous consolidated annual financial statements.
REVIEW OF GROUP RESULTS continuedfor the year ended 30 June 2018
AuditThe summary consolidated financial statements are extracted from audited information, but are not audited. The annual financial statements were audited by PricewaterhouseCoopers Inc., who expressed an unmodified opinion thereon.
The audited annual financial statements and the auditor’s report thereon are available for inspection at the company’s registered office, together with the financial statements identified in the respective auditor’s reports.
The directors of Discovery take full responsibility for the preparation of this report and that the financial information has been correctly extracted from the underlying annual financial statements.
26 Audited results and cash dividend declaration June 2018

EMBEDDED VALUE STATEMENTfor the year ended 30 June 2018
The embedded value of Discovery consists of the following components:
the adjusted net worth attributed to the business at the valuation date; plus: the present value of expected future shareholder cash flows from the in-force covered business; less: the cost of required capital.
The present value of future shareholder cash flows from the in-force covered business is calculated as the value of projected future after-tax shareholder cash flows of the business in-force at the valuation date, discounted at the risk discount rate.
The required capital are the assets attributed to the covered business above the amount required to back covered business liabilities, whose distribution to shareholders is restricted as they are allocated to cover regulatory and internal capital requirements.
The value of new business is the present value, at the point of sale, of the projected future after-tax shareholder cash flows of the new business written by Discovery, discounted at the risk discount rate, less an allowance for the reserving strain, initial expenses and cost of required capital. The value of new business is calculated using the current reporting date assumptions.
For Discovery Life, the shareholder cash flows are based on the release of margins under the Statutory Valuation Method (“SVM”) basis.
The embedded value includes the insurance and administration profits of the covered business in the Discovery Limited group. Covered business includes business written in South Africa through Discovery Life (“Life”), Discovery Invest (“Invest”), Discovery Health (“Health”) and Discovery Vitality (“Vitality”), and in the United Kingdom through VitalityLife and VitalityHealth. For Vitality Group, Ping An Health, MyOwn Health, Discovery Insure and VitalityInvest, no published value has been placed on the current in-force business as the businesses have not yet reached suitable scale with predictable experience.
In August 2011, Discovery raised R800 million through the issue of non-cumulative, non-participating, non-convertible preference shares. For embedded value purposes this capital, net of share issue expenses, has been excluded from the adjusted net worth.
The 30 June 2018 embedded value results and disclosures were subjected to an external review.
27

Table 1: Group embedded value
R million30 June
201830 June
2017%
change
Shareholders’ funds 37 594 32 290 16Adjustment to shareholders’ funds from published basis1 (32 261) (27 558)
Adjusted net worth2 5 333 4 732
Value of in-force covered business before cost of required capital 62 702 54 756Cost of required capital (2 411) (2 194)
Discovery Limited embedded value 65 624 57 294 15
Number of shares (millions) 645.1 645.0Embedded value per share R101.73 R88.83 15Diluted number of shares (millions) 646.2 646.2Diluted embedded value per share3 R101.56 R88.67 15
1 Abreakdownoftheadjustmenttoshareholders’fundsisshowninthetablebelow.Anadditionaladjustmenthasbeenincludedasat30June2018toreversetheIAS17accounting treatment of the 1 Discovery Place lease contract. Future rental payments in respect of the covered businesses under the lease are capitalised in the value of in-force for covered business, consistent with the treatment of other renewal expenses. Note that where relevant, adjustments have been converted using the closing exchange rate of R18.16/GBP(June2017:R17.03/GBP):
R million30June
2018 30June
2017
Life net assets under insurance contracts (21 479) (18 354)Vitality Life Limited and Discovery funded VitalityLife business on the Prudential licence net assets under insurance contracts (4 834) (3620)VitalityHealth financial reinsurance asset (1 898) (1 440)VitalityHealthandVitalityHealthInsuranceLimiteddeferredacquisitioncosts(netofdeferredtax) (331) (252)VitalityLife receivable relating to the Unemployment Cover benefit (net of deferred tax) (27) (27)Goodwillandintangibleassets(netofdeferredtax)relatingtotheacquisitionofStandardLifeHealthcareandthePrudentialjoint venture (3 121) (3086)Net preference share capital (779) (779)Reversal of 1 Discovery Place IAS 17 financial lease accounting 208 –
(32261) (27 558)
2 Thefollowingtablesetsoutthecapitalpositionofthecoveredbusinesseswiththerequiredcapitalonaconsistentbasistothatusedintheembeddedvalue:
R million30June
201830June
2017
Shareholders’funds 37 594 32 290Adjustmenttoshareholders’funds (32261) (27 558)
Adjusted net worth 5 333 4 732Excess of available regulatory capital over adjusted net worth 5 411 4 100
Available regulatory capital 10 744 8 832Regulatoryrequiredcapital 5691 4 477Requiredcapitalbuffer 3 224 2664
Required capital 8 915 7 141
Excess available capital 1 829 1691
The excess of available regulatory capital over adjusted net worth reflects the difference between the adjusted net worth and the available regulatory capital. This includes the net preferencesharecapitalofR779millionwhichisincludedasavailableregulatorycapital.At30June2018,thisadjustmentalsoincludesthedifferencebetweenVitality Life Limited’sSolvencyIIPillar1OwnFundsanditsadjustednetworthandaddsbackthenegativereserveseliminatedontheDiscoveryfundedVitalityLifebusinesson the Prudentiallicence.TherequiredcapitalatJune2018forLifeisR1732million(June2017:R1409million),forHealthandVitalityisR840million(June2017:R797million),forVitalityHealthisR2 133 million(June2017:R1984million)andforVitalityLifeisR4210million(June2017:R2951million).ForLife,therequiredcapitalwassetequaltotwotimesthestatutoryCapitalAdequacyRequirement.ForHealthandVitality,therequiredcapitalwassetequaltotwotimesthemonthlyrenewalexpenseandVitalitybenefitcost.ForVitalityHealth,therequiredcapitalamountwassetequalto1.35times(previously1.4times)theSolvencyIIPillar1SolvencyCapitalRequirement.FortheVitalityLifebusinessonthePrudentiallicence,therequiredcapitalwassetequaltotheUKSolvencyIlongterminsurancecapitalrequirementaspertheagreementwithPrudential.ForthebusinesssoldontheVitality LifeLimitedlicence,therequiredcapitalwassetequaltotheexcessof1.4timestheSolvencyIIPillar1SolvencyCapitalRequirement.TheRegulatoryRequiredCapitalis calculatedastherelevantregulatorysolvencycapitalrequirementforeachinsurancebusiness.
3 ThedilutedembeddedvaluepershareallowsforDiscovery’sBEEtransactionwheretheimpactisdilutivei.e.wherethecurrentembeddedvaluepershareexceedsthecurrenttransaction value.
EMBEDDED VALUE STATEMENT continuedfor the year ended 30 June 2018
28 Audited results and cash dividend declaration June 2018

Table 2: Value of in-force covered business
R million
Value before cost of
required capital
Cost of required
capital
Value aftercost of
required capital
at 30 June 2018Health and Vitality 21 046 (380) 20 666 Life and Invest1 28 066 (909) 27 157 VitalityHealth2 7 057 (336) 6 721 VitalityLife2 6 533 (786) 5 747
Total 62 702 (2 411) 60 291
at 30 June 2017Health and Vitality 18 595 (352) 18 243Life and Invest1 25 102 (780) 24 322VitalityHealth2 5 959 (307) 5 652VitalityLife2 5 100 (755) 4 345
Total 54 756 (2 194) 52 562
1 IncludedintheLifeandInvestvalueofin-forcecoveredbusinessisR1317million(June2017:R1153million)inrespectofinvestmentmanagementservicesprovidedonoffbalance sheet investment business. The net assets of the investment service provider are included in the adjusted net worth.
2 Thevalueofin-forcehasbeenconvertedusingtheclosingexchangerateofR18.16/GBP(June2017:R17.03/GBP).
Table 3: Group embedded value earnings Year ended
R million30 June
201830 June
2017
Embedded value at end of period 65 624 57 294Less: Embedded value at beginning of period (57 294) (53 080)
Increase in embedded value 8 330 4 214Net change in capital1 (2) 4Dividends paid 1 367 1 231Transfer to hedging reserve 3 (29)Employee share option schemes (13) (7)
Embedded value earnings 9 685 5 413
Annualised return on opening embedded value 16.9% 10.2%
1 Thenetchangeincapitalreflectsanincrease(decrease)intreasurysharesintheperiod.
29

EMBEDDED VALUE STATEMENT continuedfor the year ended 30 June 2018
Table 4: Components of Group embedded value earnings
Year ended 30 June 2018Year ended
30 June 2017
R millionNet
worth
Cost of required
capital
Value of in-force covered
businessEmbedded
valueEmbedded
value
Total profit from new business (at point of sale) (4 151) (205) 7 182 2 826 2 437
Profit from existing business Expected return 5 450 (39) 544 5 955 5 220 Change in methodology and assumptions1 1 025 141 (379) 787 858 Experience variances 580 (45) (230) 305 66
Impairment, amortisation and fair value adjustment2 (54) – – (54) (95)Increase in goodwill and intangibles (246) – – (246) (203)Other initiative costs3 (308) – 23 (285) (691)Non-recurring expenses4 (30) – – (30) (103)Acquisition costs5 (124) – 2 (122) (196)Finance costs (714) – – (714) (500)Foreign exchange rate movements 272 (70) 814 1 016 (1 569)Other6 (6) 1 (10) (15) 4Return on shareholders' funds7 262 – – 262 185
Embedded value earnings 1 956 (217) 7 946 9 685 5 413
1 Thechangesinmethodologyandassumptionswillvaryovertimetoreflectadjustmentstothemodelandassumptionsasaresultofchangestotheoperatingandeconomicenvironment.Thecurrentperiod’schangesaredescribedindetailinTable6below(forpreviousperiodsrefertopreviousembeddedvaluestatements).
2 ThisitemreflectstheamortisationoftheintangibleassetsreflectingtheDiscoveryCardprofitsharearrangement,bankingcostsandthePrimeMedacquisition.3 Thisitemincludescostsofstart-upbusinessesandexpensesincurredtoinvestigatenewproductsandmarkets.Start-upcostsincludecostsinrelationtotheDiscoveryBank,the
recentlylaunchedUKinvestmentbusiness,VitalityInvest,acommercialofferinginDiscoveryInsure,andanUmbrellaFundofferinginDiscoveryInvest.Headofficecostswhichrelate to non-covered business are also included in this item.
4 Thisitemincludesonce-offcostsrelatingtosystemsdevelopmentspendinDiscoveryHealth.5 AcquisitioncostsrelatetocommissionpaidontheVitalityLifeandLifebusinessandexpensesincurredinwritingHealthandVitalitybusinessthathasbeenwrittenoverthe
periodbutwillonlybeactivatedandonriskafterthevaluationdate.Thesepoliciesarenotincludedintheembeddedvalueorthevalueofnewbusinessandthereforethecostsare not deducted from the value of new business.
6 Thisitemincludes,amongotheritems,thetaxbenefitsorlossesthatwillemergeastheVitalityHealthDACandintangiblesoftwareassetsamortiseorincrease.7 Thereturnonshareholders’fundsisshownnetoftaxandmanagementcharges.
30 Audited results and cash dividend declaration June 2018

Table 5: Experience variances Health and Vitality Life and Invest VitalityHealth VitalityLife
R millionNet
worth
Value of
in-forceNet
worth
Value of
in-forceNet
worth
Value of
in-forceNet
worth
Value of
in-force Total
Renewal expenses 210 – 46 (7) (17) – 15 – 247Lapses and surrenders 18 226 (176) 254 – (191) (141) (68) (78)Mortality and morbidity1 – – 57 (21) 673 – 27 – 736 Policy alterations – 60 (473) 399 – – (21) (32) (67)Premium and fee income2 (26) (691) (34) 11 – – 8 11 (721)Economic assumptions – – 10 (383) – – – – (373)Commission – – – – (95) – – – (95)Tax3 76 – 230 (267) 172 – 99 – 310 Reinsurance – – – – (43) – 46 (4) (1)Maintain modelling term4 – 304 – 77 – 9 – – 390 Vitality benefits (14) – – – – – – – (14)Other 52 (1) (111) 98 (22) – 14 (59) (29)
Total 316 (102) (451) 161 668 (182) 47 (152) 305
1 ThemortalityandmorbidityexperienceforVitalityHealtharisesduetoimprovementsinriskmanagement,salesandretentionmodels,claimpaymentprocesses,andanincrease in Vitality engagement, resulting in lower experience loss ratios over those expected.
2 ThepremiumandfeeincomeexperienceforHealthandVitalityreflectstheimpactonadministrationandmanagedcarefeesduetothein-periodinflationbeinglowerthanthat assumed.
3 The tax variance for Life and Invest arises due to a movement in the deferred tax asset which delays the payment of tax. 4 TheprojectiontermforHealthandVitality,GroupLifeandVitalityHealthat30June2018hasnotbeenchangedfromthatusedinthe30June2017embeddedvaluecalculation.
Therefore,anexperiencevariancearisesbecausethetotaltermofthein-forcecoveredbusinessiseffectivelyincreasedbytwelvemonths.
Table 6: Methodology and assumption changes Health and Vitality Life and Invest VitalityHealth VitalityLife
R millionNet
worth
Value of
in-forceNet
worth
Value of
in-forceNet
worth
Value of
in-forceNet
worth
Value of
in-force Total
Modelling changes1 – – (279) (610) – 343 (68) (101) (715)Expenses2 – 726 (19) (118) – – 75 17 681 Lapses3 – – 316 (1 744) – – (16) (59) (1 503)Mortality and morbidity – – – – – – – – – Benefit enhancements – – (20) (21) – – – – (41)Vitality benefits – – – – – – – – – Tax – – – 38 – – – 3 41 Economic assumptions4 – 798 (651) 2 127 – (23) 232 245 2 728 Premium and fee income – (317) – – – – (1) (64) (382)Reinsurance5 – – 1 746 (1 772) (18) (33) – – (77)Other6 – – (53) 62 – – (219) 265 55
Total – 1 207 1 040 (2 038) (18) 287 3 306 787
1 ForLifeandInvest,themodellingchangeitemincludesachangetotheprojectiontermlimitofthevalueofin-forcefromvaluingshareholdercashflowsovertheirfulltermtoashorter40yearprojectionterm.VitalityHealthchangedtheirmethodologytocalculatethevaluein-forcefrom30June2018.Underthenewmethodology,thevaluein-forceatthe valuation date is derived as the in-force written premium multiplied by the Margin multiplied by the Annuity Factor. The assumptions for the Margin and Annuity Factor are shown in Table 8.
2 ForHealthandVitality,theexpensesitemreflectsarevisiontotherenewalexpenseassumptioninlightofthelowerin-periodinflationrelativetoexpected.3 An increase was made to the Life lapse rate as a proxy for the impact of net policy alterations.4 The South African investment return assumptions for Life, Invest, Health and Vitality were changed from being applied in the model as a single interest rate to the full yield curve.
Consistentwiththis,therealyieldassumptionwassetrelativetotheobservedrealyieldcurve,adjustedtoremovevolatilityduetothenatureoftheindexlinkedgovernmentbondmarket.VitalityLifehaveadoptedapassiveinvestmentreturnandrealyieldassumption,withtheassumptionsremainingfixedunlessmarketconditionsdepartsignificantlyfromtheassumptionsatthefinancialyearend.
5 ForLifethereinsuranceitemprimarilyrelatestotheimpactofthefinancingreinsurancearrangements.6 ForVitalityLife,theotheritemrelatestothemarginresettooffsetacquisitioncostsandassumptionandmethodologychanges,aspertheaccountingpolicy,andanalignment
of the compulsory margins in VitalityLife to those used by Life.
31

EMBEDDED VALUE STATEMENT continuedfor the year ended 30 June 2018
Table 7: Embedded value of new business Year ended
R million30 June
201830 June
2017%
change
Health and VitalityPresent value of future profits from new business at point of sale 985 820Cost of required capital (29) (31)
Present value of future profits from new business at point of sale after cost of required capital 956 789 21
New business annualised premium income1 4 086 4 533 (10)
Life and InvestPresent value of future profits from new business at point of sale2 1 376 1 304Cost of required capital (74) (73)
Present value of future profits from new business at point of sale after cost of required capital 1 302 1 231 6
New business annualised premium income3 2 773 2 840 (2)Annualised profit margin4 5.6% 5.5%Annualised profit margin excluding Invest business 10.7% 10.2%
VitalityHealth5
Present value of future profits from new business at point of sale 263 157Cost of required capital (44) (46)
Present value of future profits from new business at point of sale after cost of required capital 219 111 97
New business annualised premium income (Rand)6 1 161 958 21Annualised profit margin4 3.1% 1.8%
VitalityLife7
Present value of future profits from new business at point of sale 407 432Cost of required capital (58) (126)
Present value of future profits from new business at point of sale after cost of required capital 349 306 14
New business annualised premium income (Rand) 898 844 6Annualised profit margin4 5.4% 5.2%
1 Health new business annualised premium income is the gross contribution to the medical schemes. The new business annualised premium income shown above excludes premiums in respect of members who join an existing employer where the member has no choice of medical scheme, as well as premiums in respect of new business written duringtheperiodbutonlyactivatedafter30June2018.
ThetotalHealthandVitalitynewbusinessannualisedpremiumincomewrittenovertheperiodwasR6735million(June2017:R6276million).2 IncludedintheLifeandInvestembeddedvalueofnewbusinessisR110million(June2017:R109million)inrespectofinvestmentmanagementservicesprovidedonoffbalance
sheet investment business. RiskbusinesswrittenpriortothevaluationdateallowscertainInvestbusinesstobewrittenatfinanciallyadvantageousterms,theimpactofwhichhasbeenrecognisedinthe
value of new business.3 LifenewbusinessisdefinedasLifepoliciestowhichLifebecamecontractuallyboundduringthereportingperiod,includingpolicieswhosefirstpremiumisdueafterthe
valuationdate.Investnewbusinessisdefinedasbusinesswhereatleastonepremiumhasbeenreceivedandwhichhasnotbeenrefundedafterreceipt.InvestnewbusinessalsoincludesDiscoveryRetirementOptimiserpoliciestowhichLifeandInvestbecamecontractuallyboundduringthereportingperiod,includingpolicieswhosefirstpremiumis due after the valuation date.
ThenewbusinessannualisedpremiumincomeofR2773million(June2017:R2840million)(singlepremiumAPE:R1195million(June2017:R1169million))shownaboveexcludes automatic premium increases and servicing increases in respect of existing business. The total new business annualised premium income written over the period, includingautomaticpremiumincreasesofR1254million(June2017:R1172million)andservicingincreasesofR615million(June2017:R659million),wasR4642million(June 2017:R4671million)(singlepremiumAPE:R1248million(June2017:R1277million)).Singlepremiumbusinessisincludedat10%ofthevalueofthesinglepremium.
Policy alterations and internal replacement policies, including Discovery Retirement Optimisers added to existing Life Plans, are shown in Table 5 as experience variances and not included as new business. Term extensions on existing contracts are not included as new business.
4 Theannualisedprofitmarginisthevalueofnewbusinessexpressedasapercentageofthepresentvalueoffuturepremiums.5 The VitalityHealth value of new business is calculated as the value at point of sale of the new business written premium in-force at the valuation date multiplied by the
Margin multipliedbytheAnnuityFactorlessthenewbusinesscashflowsfrompointofsaletothevaluationdate.TheassumptionsfortheMarginandAnnuityFactorare shown inTable8.
6 VitalityHealthnewbusinessisdefinedasindividualsandemployergroupswhichinceptedduringthereportingperiod.Thenewbusinessannualisedpremiumincomeshownabovehasbeenadjustedtoexcludepremiumsinrespectofmemberswhojoinanexistingemployergroupafterthefirstmonth,aswellaspremiumsinrespectofnewbusinesswrittenduringtheperiodbutonlyactivatedafter30June2018.
7 VitalityLifenewbusinessisdefinedaspoliciestowhichVitalityLifebecamecontractuallyboundduringthereportingperiod,includingpolicieswhosefirstpremiumisdueafterthe valuation date.
32 Audited results and cash dividend declaration June 2018

BASIS OF PREPARATIONTable 8: Embedded value economic assumptions
30 June
201830 June
2017
Beta coefficient 0.75 0.75 Equity risk premium (%) 3.5 3.5
Risk discount rate (%)Health and Vitality1 12.155 12.125Life and Invest1 12.875 12.875VitalityHealth 4.02 3.90VitalityLife 4.725 4.755
Rand/GB Pound exchange rateClosing 18.16 17.03Average 17.33 17.29
Margin over Expense inflation to derive Medical inflation (%) South Africa 3.00 3.00
Expense inflation (%)South Africa2 – Health and Vitality 6.85 6.25 – Life and Invest 7.48 6.25United Kingdom 3.30 3.25
Pre-tax investment return (%)South Africa – Cash1 8.75 8.75 – Life and Invest bonds3 10.25 10.25 – Health and Vitality bonds3 9.53 9.50 – Equity1 13.75 13.75United Kingdom – VitalityHealth investment return 1.40 1.28 – VitalityLife investment return 2.50 2.13
Income tax rate (%)South Africa 28 28United Kingdom – long term4 17 17
VitalityHealth Assumptions– Margin (net of tax and cost of capital) (%) 14.1 –– Annuity Factor 6.00 –
Projection term– Health and Vitality 20 years 20 years– Discovery Life – ViF 40 years No cap– Group Life 10 years 10 years– VitalityLife No cap No cap– VitalityHealth5 20 years 20 years
1 Derived as a margin over (or below for cash) the respective pre-tax investment return for bonds. 2 Theinflationassumptionisderivedasthedifferencebetweenthenominalandrealyieldcurveateachduration.Asanindication,thecashflowweightedaverageinflationis
shown in the table. 3 Asindications,thecashflowweightedaveragesderivedfromtherelevantyieldcurve(s)areshown.4 TheUnitedKingdomCorporationtaxrateassumedis20%in2017,19%in2018to2020,and17%beyondthat.5 The VitalityHealth projection term of 20 years is used in the derivation of the Annuity Factor.
33
EMBEDDED VALUE STATEMENT continuedfor the year ended 30 June 2018
The Discovery Limited embedded value is calculated based on a risk discount rate using the CAPM approach with specific reference to the Discovery beta coefficient. The assumed beta is fixed at 0.75. This has been set such that the risk discount rate proxies the result of a Weighted Average Cost of Capital approach with reference to the capital structure of the Group and the observed beta calculated using daily returns over a long time period. The observed beta is calculated with reference to the ALSI. The assumed beta will only change if the capital structure of the Group and/or the observed beta calculated using daily returns over a long time period suggest the beta assumption should depart significantly from the assumption at the financial year end. As beta values reflect the historic performance of share prices relative to the market they may not allow fully for non-market related and non-financial risk. Investors may want to form their own view on an appropriate allowance for these risks which have not been modelled explicitly.
Life and Invest mortality, morbidity, lapse and surrender assumptions were derived from internal experience, where available, augmented by reinsurance and industry information.
The Health and Vitality lapse assumptions were derived from the results of recent experience investigations.
The VitalityHealth assumptions were derived from internal experience.
VitalityLife assumptions were derived from internal experience, where available, augmented by reinsurance, industry and Discovery Limited group information.
Renewal expense assumptions were based on the results of the latest expense and budget information.
The initial expenses included in the calculation of the embedded value of new business are the actual costs incurred excluding expenses of an exceptional or non-recurring nature.
From 30 June 2018, the South African investment return assumptions for Life, Invest, Health and Vitality were based on the publicly available Prudential Authority risk-free nominal yield curve. The real yield assumption was set based on the publicly available Prudential Authority risk-free real yield curve, adjusted to remove volatility due to the nature of the index linked government bond market. Other economic assumptions were set relative to these two yield curves. The 30 June 2017 investment return assumptions, and other related economic assumptions, were based on a single interest rate derived from the risk-free zero coupon government bond yield curve.
The current and projected tax position of the policyholder funds within the Life company has been taken into account in determining the net investment return assumption.
The best estimate investment return assumption for VitalityHealth was based on the single interest rate derived from the risk-free zero coupon sterling yield curve.
From 30 June 2018, VitalityHealth calculate the value in-force at the valuation date as the in-force written premium multiplied by the Margin multiplied by the Annuity Factor, as set out in the table above. The Annuity Factor assumption is derived from assumed future lapse rates and premium increases. The Margin assumption reflects profit margins after tax and Cost of Capital. The assumptions underlying the Annuity Factor and Margin are set taking into account the current experience in the business at different durations.
VitalityLife adopts a passive approach for setting economic assumptions. The nominal investment return and real return rate are fixed unless market conditions depart significantly from the assumptions at the financial year end. Other economic assumptions were set relative to these two passive yields.
It is assumed that, for the purposes of calculating the cost of required capital, the Life and Invest required capital amount will be backed by surplus assets consisting of 100% equities and the Health, Vitality, and VitalityHealth required capital amounts will be fully backed by cash. Vitality Life Limited and the VitalityLife business on the Prudential licence required capital amount is assumed to earn the same return as the assets backing the VitalityLife policyholder liabilities. Allowance has been made for tax and investment expenses in the calculation of the cost of required capital. In calculating the capital gains tax liability, it is assumed that the portfolio is realised every 5 years. The Life and Invest cost of required capital is calculated using the difference between the gross of tax equity return and the equity return net of tax and expenses. The Health, Vitality, and VitalityHealth cost of required capital is calculated using the difference between the risk discount rate and the net of tax cash return. Vitality Life Limited and the VitalityLife business on the Prudential licence cost of required capital is calculated using the difference between the risk discount rate and the net of tax asset return assumption.
The embedded value has been calculated in accordance with the Actuarial Society of South Africa’s Advisory Practice Note (“APN”) 107: Embedded Value Reporting, except the recommended disclosure of Free Surplus and Required Capital has been adjusted to take into account the revised capital requirements and resources arising from Solvency II in the United Kingdom as can be seen in Table 1 note 2.
34 Audited results and cash dividend declaration June 2018

35
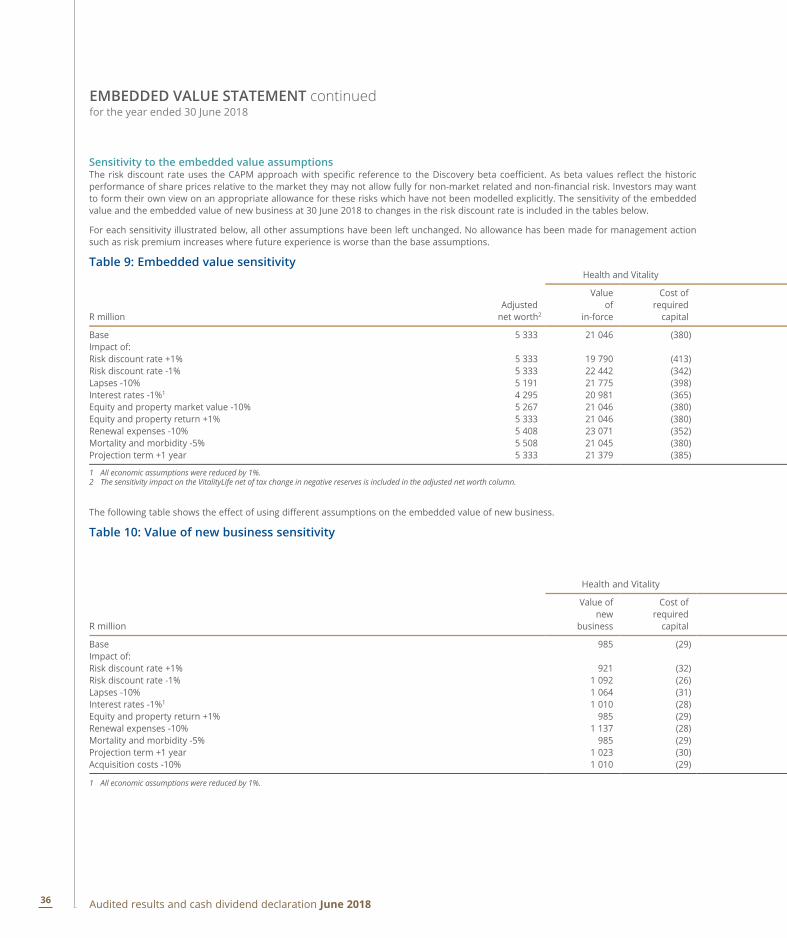
EMBEDDED VALUE STATEMENT continuedfor the year ended 30 June 2018
Sensitivity to the embedded value assumptionsThe risk discount rate uses the CAPM approach with specific reference to the Discovery beta coefficient. As beta values reflect the historic performance of share prices relative to the market they may not allow fully for non-market related and non-financial risk. Investors may want to form their own view on an appropriate allowance for these risks which have not been modelled explicitly. The sensitivity of the embedded value and the embedded value of new business at 30 June 2018 to changes in the risk discount rate is included in the tables below.
For each sensitivity illustrated below, all other assumptions have been left unchanged. No allowance has been made for management action such as risk premium increases where future experience is worse than the base assumptions.
Table 9: Embedded value sensitivity Health and Vitality
R millionAdjusted
net worth2
Value of
in-force
Cost of required
capital
Base 5 333 21 046 (380)Impact of:Risk discount rate +1% 5 333 19 790 (413)Risk discount rate -1% 5 333 22 442 (342)Lapses -10% 5 191 21 775 (398)Interest rates -1%1 4 295 20 981 (365)Equity and property market value -10% 5 267 21 046 (380)Equity and property return +1% 5 333 21 046 (380)Renewal expenses -10% 5 408 23 071 (352)Mortality and morbidity -5% 5 508 21 045 (380)Projection term +1 year 5 333 21 379 (385)
1 All economic assumptions were reduced by 1%.2 The sensitivity impact on the VitalityLife net of tax change in negative reserves is included in the adjusted net worth column.
The following table shows the effect of using different assumptions on the embedded value of new business.
Table 10: Value of new business sensitivity
Health and Vitality
R million
Value of new
business
Cost of required
capital
Base 985 (29)Impact of:Risk discount rate +1% 921 (32)Risk discount rate -1% 1 092 (26)Lapses -10% 1 064 (31)Interest rates -1%1 1 010 (28)Equity and property return +1% 985 (29)Renewal expenses -10% 1 137 (28)Mortality and morbidity -5% 985 (29)Projection term +1 year 1 023 (30)Acquisition costs -10% 1 010 (29)
1 All economic assumptions were reduced by 1%.
36 Audited results and cash dividend declaration June 2018

Life and Invest VitalityHealth VitalityLife
Embedded value
% change
Value of
in-force
Cost of required
capital
Value of
in-force
Cost of required
capital
Value of
in-force
Cost of required
capital
28 066 (909) 7 057 (336) 6 533 (786) 65 624
25 316 (811) 6 648 (316) 6 156 (939) 60 764 (7) 31 357 (1 028) 7 507 (357) 6 965 (572) 71 305 9 30 240 (976) 7 942 (377) 6 936 (554) 69 779 6 28 469 (956) 7 582 (357) 6 290 (1 266) 64 673 (1) 27 740 (909) 7 057 (336) 6 533 (786) 65 232 (1) 28 384 (909) 7 057 (336) 6 533 (786) 65 942 – 28 460 (907) 7 558 (336) 6 594 (743) 68 753 5 29 861 (893) 8 094 (336) 6 645 (769) 68 776 5 28 252 (914) 7 110 (338) 6 533 (786) 66 184 1
Life and Invest VitalityHealth VitalityLife
Value of new
business%
change
Value of new
business
Cost of required
capital
Value of new
business
Cost of required
capital
Value of new
business
Cost of required
capital
1 376 (74) 263 (44) 407 (58) 2 826
1 109 (66) 210 (46) 297 (64) 2 329 (18) 1 691 (84) 323 (51) 532 (45) 3 432 21 1 647 (79) 385 (54) 558 (71) 3 419 21 1 449 (78) 317 (51) 331 (82) 2 868 1 1 418 (74) 263 (44) 407 (58) 2 868 1 1 422 (74) 330 (44) 427 (54) 3 116 10 1 505 (73) 411 (44) 443 (54) 3 144 11 1 393 (74) 271 (49) 407 (58) 2 883 2 1 516 (74) 306 (44) 459 (58) 3 086 9
37

38 Audited results and cash dividend declaration June 2018

Transfer secretaries Computershare Investor Services Pty Limited (Registration number: 2004/003647/07) Rosebank Towers, 15 Biermann Avenue, Rosebank 2196 PO Box 61051, Marshalltown 2107
Sponsors Rand Merchant Bank (A division of FirstRand Bank Limited)
Secretary and registered office MJ Botha, Discovery Limited (Incorporated in the Republic of South Africa) (Registration number: 1999/007789/06) Company tax reference number: 9652/003/71/7
JSE share code: DSY ISIN: ZAE000022331 JSE share code: DSBP ISIN: ZAE000158564JSE bond code: DSY01 ISIN: ZAG000148362JSE bond code: DSY02 ISIN: ZAG000148347JSE bond code: DSY03 ISIN: ZAG000148354JSE bond code: DSY04 ISIN: ZAG000153271
1 Discovery Place, Sandton 2146 PO Box 786722, Sandton 2146 Tel: (011) 529 2888 Fax: (011) 539 8003
Directors MI Hilkowitz (Chairperson), A Gore* (Chief Executive Officer), HL Bosman, Dr BA Brink, SE de Bruyn Sebotsa, R Enslin (USA), R Farber1, HD Kallner*, F Khanyile, NS Koopowitz*, Dr TV Maphai, HP Mayers*, TT Mboweni, Dr A Ntsaluba*, AL Owen (UK), A Pollard*, JM Robertson2, B Swartzberg*, DM Viljoen* (Financial Director), SV Zilwa
* Executive.1 Redesignatedasanon-executivedirectoreffective1April2018.2 Retired 31 August 2018.
Annual financial statements – prepared by L van Jaarsveldt CA(SA) and A Nel CA(SA)– supervised by DM Viljoen CA(SA)
Embedded value statement– prepared by M Curtis FASSA, FIA– supervised by A Rayner FASSA, FIA

Discovery
Contact +27 11 529 2888 | [email protected] | www.discovery.co.za
Discovery is an authorised financial services provider.