Audited Financial Statements · 2018-08-14 · Equity Index Fund O Schedule of investments December...
67
INVESTMENT FUNDS FOR EMPLOYEE BENEFIT TRUSTS O Series Audited Financial Statements December 31, 2017 B LACK R OCK ®
Transcript of Audited Financial Statements · 2018-08-14 · Equity Index Fund O Schedule of investments December...

INVESTMENT FUNDS FOR EMPLOYEE BENEFIT TRUSTS
O Series
Audited Financial Statements
December 31, 2017
BLACKROCK®
O Series
Table of contents
Report of Independent Auditors 3
Financial statements
- Equity Index Fund O 5
- LifePath® Index 2020 Fund O 10
- LifePath® Index 2025 Fund O 15
- LifePath® Index 2030 Fund O 20
- LifePath® Index 2035 Fund O 25
- LifePath® Index 2040 Fund O 30
- LifePath® Index 2045 Fund O 35
- LifePath® Index 2050 Fund O 40
- LifePath® Index 2055 Fund O 45
- LifePath® Index 2060 Fund O 50
- LifePath® Index Retirement Fund O 55
Notes to financial statements 60
Regulatory statement 66
The Funds’ financial statements and summary schedules, as applicable, include:
Schedule of investmentsStatement of assets and liabilitiesStatement of operationsStatement of changes in net assetsFinancial highlightsSchedule of investments acquired, sold or redeemed (In summary)
BLACKROCK®2 December 31, 2017

Report of Independent Auditors
To the Board of Directors ofBlackRock Institutional Trust Company, N.A.
We have audited the accompanying financial statements of each of the funds listed in the table below (hereaftercollectively referred to as the “Funds”), which comprise the statements of assets and liabilities, including theschedules of investments, as of December 31, 2017, and the related statements of operations, of changes in netassets and the financial highlights for each of the periods listed in the table below. These financial statements andfinancial highlights are hereafter collectively referred to as “financial statements.”
Equity Index Fund O (1) LifePath® Index 2045 Fund O (1)
LifePath® Index 2020 Fund O (1) LifePath® Index 2050 Fund O (1)
LifePath® Index 2025 Fund O (1) LifePath® Index 2055 Fund O (1)
LifePath® Index 2030 Fund O (1) LifePath® Index 2060 Fund O (1)
LifePath® Index 2035 Fund O (1) LifePath® Index Retirement Fund O (1)
LifePath® Index 2040 Fund O (1)
(1) Statement of assets and liabilities, including the schedule of investments, as of December 31, 2017 and therelated statement of operations, of changes in net assets and the financial highlights for the year endedDecember 31, 2017.
Management’s Responsibility for the Financial Statements
Management is responsible for the preparation and fair presentation of the financial statements in accordancewith accounting principles generally accepted in the United States of America; this includes the design,implementation and maintenance of internal control relevant to the preparation and fair presentation of financialstatements that are free from material misstatement, whether due to fraud or error.
Auditors’ Responsibility
Our responsibility is to express an opinion on the financial statements based on our audits. We conducted ouraudits in accordance with auditing standards generally accepted in the United States of America. Those standardsrequire that we plan and perform the audit to obtain reasonable assurance about whether the financial statementsare free from material misstatement.
An audit involves performing procedures to obtain audit evidence about the amounts and disclosures in thefinancial statements. The procedures selected depend on our judgment, including the assessment of the risks ofmaterial misstatement of the financial statements, whether due to fraud or error. In making those riskassessments, we consider internal control relevant to the Fund’s preparation and fair presentation of the financialstatements in order to design audit procedures that are appropriate in the circumstances, but not for the purpose
3 December 31, 2017
of expressing an opinion on the effectiveness of the Fund’s internal control. Accordingly, we express no suchopinion. An audit also includes evaluating the appropriateness of accounting policies used and thereasonableness of significant accounting estimates made by management, as well as evaluating the overallpresentation of the financial statements. We believe that the audit evidence we have obtained is sufficient andappropriate to provide a basis for our audit opinion.
Opinions
In our opinion, for each of the Funds listed in the table above, the financial statements referred to above presentfairly, in all material respects, the financial position of each of the Funds as of December 31, 2017, and the resultsof each of their operations, changes in each of their net assets and each of the financial highlights for the periodslisted in the table above, in accordance with accounting principles generally accepted in the United States ofAmerica.
Other Matter
Our audits were conducted for the purpose of forming an opinion on each of the Funds’ financial statements takenas a whole. The schedule of investments acquired, sold or redeemed (in summary) of each of the Funds arepresented for purposes of additional analysis and are not a required part of the financial statements. Theinformation is the responsibility of management and was derived from and relates directly to the underlyingaccounting and other records used to prepare the financial statements. The information has been subjected to theauditing procedures applied in the audit of the financial statements and certain additional procedures, includingcomparing and reconciling such information directly to the underlying accounting and other records used toprepare the financial statements or to the financial statements themselves and other additional procedures, inaccordance with auditing standards generally accepted in the United States of America. In our opinion, theschedule of investments acquired, sold or redeemed (in summary) of each of the Funds is fairly stated, in allmaterial respects, in relation to the financial statements of each of the Funds taken as a whole.
San Francisco, California
March 16, 2018
4 December 31, 2017
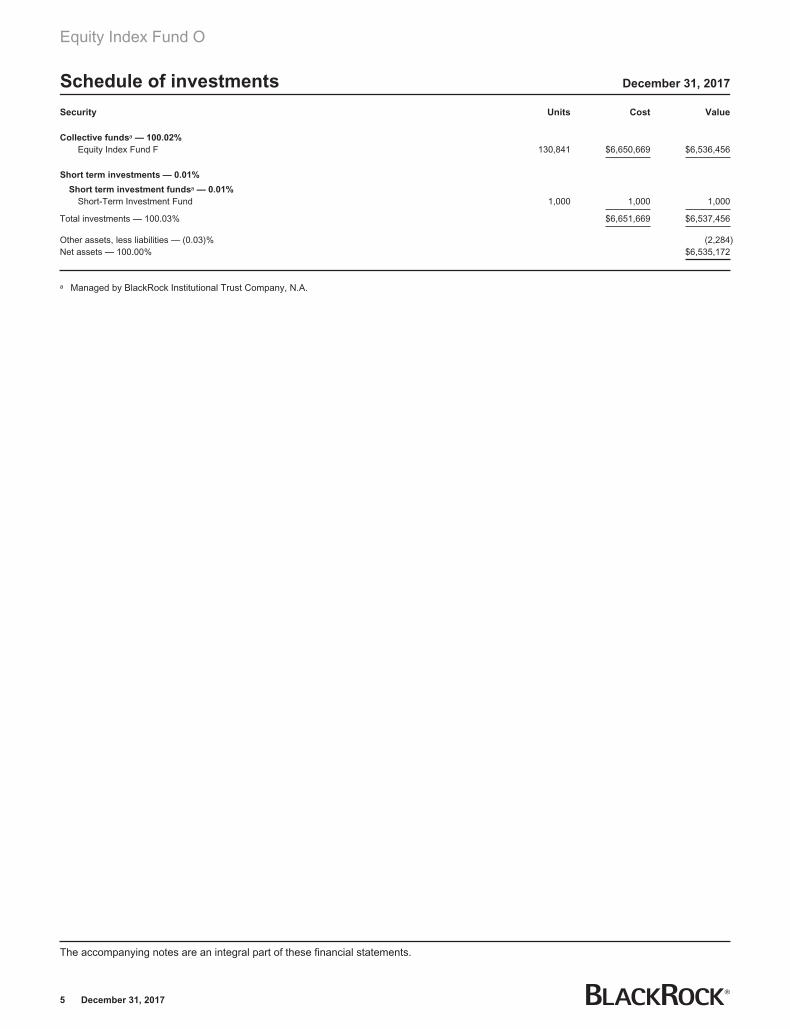
Equity Index Fund O
Schedule of investments December 31, 2017
Security Units Cost Value
Collective fundsa — 100.02%
Equity Index Fund F 130,841 $6,650,669 $6,536,456
Short term investments — 0.01%
Short term investment fundsa — 0.01%
Short-Term Investment Fund 1,000 1,000 1,000
Total investments — 100.03% $6,651,669 $6,537,456
Other assets, less liabilities — (0.03)% (2,284)Net assets — 100.00% $6,535,172
a Managed by BlackRock Institutional Trust Company, N.A.
The accompanying notes are an integral part of these financial statements.
BLACKROCK®5 December 31, 2017

Equity Index Fund O
Statement of assets and liabilities December 31, 2017
Value
Assets
Investment in collective funds, at fair value (cost $6,650,669) $ 6,536,456Short term investments, at fair value (cost $1,000) 1,000
Total investments 6,537,456
Receivable from investment advisor 883
6,538,339
Liabilities
Shareholder servicing fees payable 3,167
3,167
Net assets $ 6,535,172
Units outstanding 304,957
Unit value $ 21.43
The accompanying notes are an integral part of these financial statements.
BLACKROCK®6 December 31, 2017
Equity Index Fund O
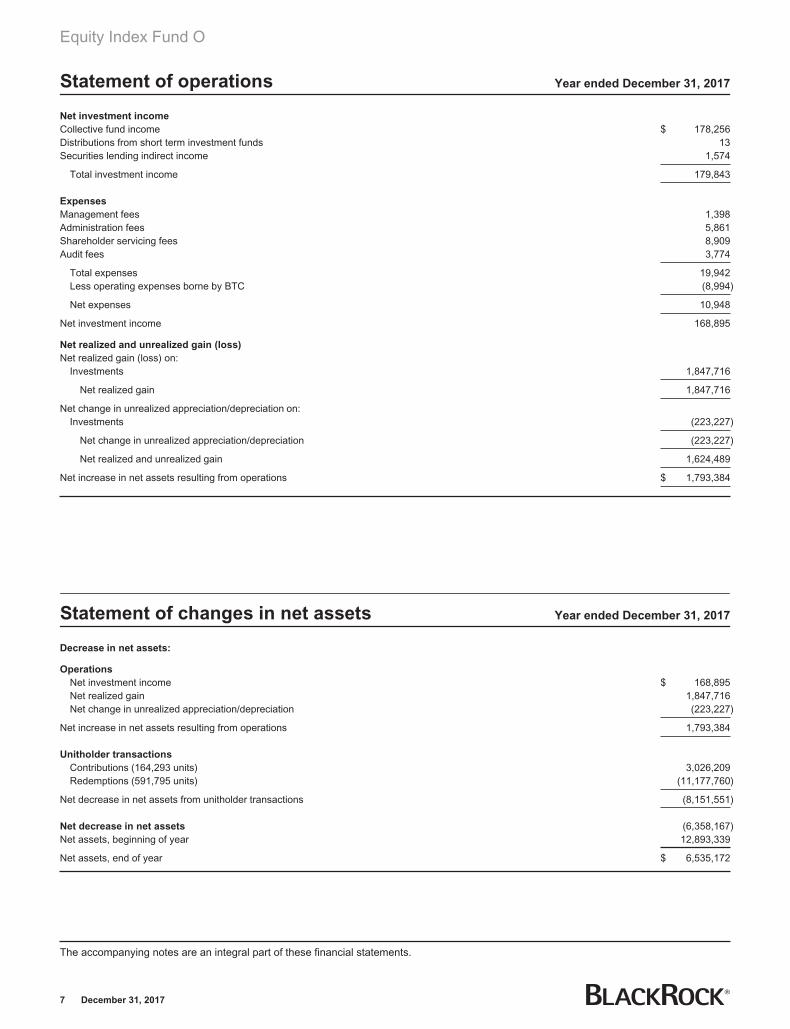
Statement of operations Year ended December 31, 2017
Net investment income
Collective fund income $ 178,256Distributions from short term investment funds 13Securities lending indirect income 1,574
Total investment income 179,843
Expenses
Management fees 1,398Administration fees 5,861Shareholder servicing fees 8,909Audit fees 3,774
Total expenses 19,942Less operating expenses borne by BTC (8,994)
Net expenses 10,948
Net investment income 168,895
Net realized and unrealized gain (loss)
Net realized gain (loss) on:Investments 1,847,716
Net realized gain 1,847,716
Net change in unrealized appreciation/depreciation on:Investments (223,227)
Net change in unrealized appreciation/depreciation (223,227)
Net realized and unrealized gain 1,624,489
Net increase in net assets resulting from operations $ 1,793,384
Statement of changes in net assets Year ended December 31, 2017
Decrease in net assets:
Operations
Net investment income $ 168,895Net realized gain 1,847,716Net change in unrealized appreciation/depreciation (223,227)
Net increase in net assets resulting from operations 1,793,384
Unitholder transactions
Contributions (164,293 units) 3,026,209Redemptions (591,795 units) (11,177,760)
Net decrease in net assets from unitholder transactions (8,151,551)
Net decrease in net assets (6,358,167)Net assets, beginning of year 12,893,339
Net assets, end of year $ 6,535,172
The accompanying notes are an integral part of these financial statements.
BLACKROCK®7 December 31, 2017

Equity Index Fund O
Financial highlights Year ended December 31, 2017
Per unit operating performance (per unit outstanding throughout the year)
Unit value, beginning of year $ 17.60Income from investment operations:
Net investment income (based on average units outstanding throughout the year) $ 0.36Net realized and unrealized gain on investment transactions 3.47
Total income from investment operations 3.83
Unit value, end of year $ 21.43
Total return 21.76%
Ratios to average net assets:
Expensesa 0.22%Net expensesa 0.12%Net investment income 1.88%
a The expenses incurred by underlying funds in which the fund invests are not included in this ratio. The collective fund income allocated to the fund fromunderlying funds is net of those expenses.
The accompanying notes are an integral part of these financial statements.
BLACKROCK®8 December 31, 2017

Equity Index Fund O
Schedule of investments acquired, sold or redeemed (In summary)For the year ended December 31, 2017
Sales and redemptions
Types of investmentsCost of investments
acquired ProceedsRealized
gain (loss)
Collective funds $ 2,372,605 $ 10,538,183 $ (1,004,348)
Collective funds-fund of fund gain (loss) — — 2,852,064
The accompanying notes are an integral part of these financial statements.
BLACKROCK®9 December 31, 2017

LifePath® Index 2020 Fund O
Schedule of investments December 31, 2017
Security Units Cost Value
Collective fundsa — 100.04%
LifePath® Index 2020 Fund F 75,789,469 $1,415,807,530 $1,516,585,169
Short term investments — 0.00%
Short term investment fundsa — 0.00%
Short-Term Investment Fund 1,000 1,000 1,000
Total investments — 100.04% $1,415,808,530 $1,516,586,169
Other assets, less liabilities — (0.04)% (580,996)Net assets — 100.00% $1,516,005,173
a Managed by BlackRock Institutional Trust Company, N.A.
The accompanying notes are an integral part of these financial statements.
BLACKROCK®10 December 31, 2017

LifePath® Index 2020 Fund O
Statement of assets and liabilities December 31, 2017
Value
Assets
Investment in collective funds, at fair value (cost $1,415,807,530) $ 1,516,585,169Short term investments, at fair value (cost $1,000) 1,000
Total investments 1,516,586,169
Receivable for unitholder contributions 2,034,284
1,518,620,453
Liabilities
Payable for investments purchased 1,475,264Payable for unitholder redemptions 559,020Management fees payable 580,551Administration fees payable 445
2,615,280
Net assets $ 1,516,005,173
Units outstanding 99,513,618
Unit value $ 15.23
The accompanying notes are an integral part of these financial statements.
BLACKROCK®11 December 31, 2017

LifePath® Index 2020 Fund O
Statement of operations Year ended December 31, 2017
Net investment income
Collective fund income $ 38,095,204Distributions from short term investment funds 49Securities lending indirect income 1,020,988
Total investment income 39,116,241
Expenses
Management fees 1,118,361Administration fees 5,742Audit fees 3,765
Total expenses 1,127,868
Net investment income 37,988,373
Net realized and unrealized gain (loss)
Net realized gain (loss) on:Investments 22,760,861
Net realized gain 22,760,861
Net change in unrealized appreciation/depreciation on:Investments 116,576,530
Net change in unrealized appreciation/depreciation 116,576,530
Net realized and unrealized gain 139,337,391
Net increase in net assets resulting from operations $ 177,325,764
Statement of changes in net assets Year ended December 31, 2017
Increase in net assets:
Operations
Net investment income $ 37,988,373Net realized gain 22,760,861Net change in unrealized appreciation/depreciation 116,576,530
Net increase in net assets resulting from operations 177,325,764
Unitholder transactions
Contributions (51,879,442 units) 728,735,203Redemptions (51,121,502 units) (735,960,127)
Net decrease in net assets from unitholder transactions (7,224,924)
Net increase in net assets 170,100,840Net assets, beginning of year 1,345,904,333
Net assets, end of year $ 1,516,005,173
The accompanying notes are an integral part of these financial statements.
BLACKROCK®12 December 31, 2017

LifePath® Index 2020 Fund O
Financial highlights Year ended December 31, 2017
Per unit operating performance (per unit outstanding throughout the year)
Unit value, beginning of year $ 13.63Income from investment operations:
Net investment income (based on average units outstanding throughout the year) $ 0.34Net realized and unrealized gain on investment transactions 1.26
Total income from investment operations 1.60
Unit value, end of year $ 15.23
Total return 11.74%
Ratios to average net assets:
Expensesa 0.07%Net investment income 2.37%
a The expenses incurred by underlying funds in which the fund invests are not included in this ratio. The collective fund income allocated to the fund fromunderlying funds is net of those expenses.
The accompanying notes are an integral part of these financial statements.
BLACKROCK®13 December 31, 2017

LifePath® Index 2020 Fund O
Schedule of investments acquired, sold or redeemed (In summary)For the year ended December 31, 2017
Sales and redemptions
Types of investmentsCost of investments
acquired ProceedsRealized
gain (loss)
Collective funds $ 381,517,994 $ 389,479,482 $ 5,963,751
Collective funds-fund of fund gain (loss) — — 16,797,110
The accompanying notes are an integral part of these financial statements.
BLACKROCK®14 December 31, 2017

LifePath® Index 2025 Fund O
Schedule of investments December 31, 2017
Security Units Cost Value
Collective fundsa — 100.04%
LifePath® Index 2025 Fund F 64,411,692 $1,158,908,188 $1,252,697,909
Short term investments — 0.00%
Short term investment fundsa — 0.00%
Short-Term Investment Fund 1,000 1,000 1,000
Total investments — 100.04% $1,158,909,188 $1,252,698,909
Other assets, less liabilities — (0.04)% (485,527)Net assets — 100.00% $1,252,213,382
a Managed by BlackRock Institutional Trust Company, N.A.
The accompanying notes are an integral part of these financial statements.
BLACKROCK®15 December 31, 2017

LifePath® Index 2025 Fund O
Statement of assets and liabilities December 31, 2017
Value
Assets
Investment in collective funds, at fair value (cost $1,158,908,188) $ 1,252,697,909Short term investments, at fair value (cost $1,000) 1,000
Total investments 1,252,698,909
Receivable for unitholder contributions 1,782,726
1,254,481,635
Liabilities
Payable for investments purchased 1,242,867Payable for unitholder redemptions 539,859Management fees payable 485,082Administration fees payable 445
2,268,253
Net assets $ 1,252,213,382
Units outstanding 77,982,341
Unit value $ 16.06
The accompanying notes are an integral part of these financial statements.
BLACKROCK®16 December 31, 2017

LifePath® Index 2025 Fund O
Statement of operations Year ended December 31, 2017
Net investment income
Collective fund income $ 31,560,887Distributions from short term investment funds 35Securities lending indirect income 726,643
Total investment income 32,287,565
Expenses
Management fees 905,311Administration fees 5,741Audit fees 3,765
Total expenses 914,817
Net investment income 31,372,748
Net realized and unrealized gain (loss)
Net realized gain (loss) on:Investments 36,027,264
Net realized gain 36,027,264
Net change in unrealized appreciation/depreciation on:Investments 99,634,248
Net change in unrealized appreciation/depreciation 99,634,248
Net realized and unrealized gain 135,661,512
Net increase in net assets resulting from operations $ 167,034,260
Statement of changes in net assets Year ended December 31, 2017
Increase in net assets:
Operations
Net investment income $ 31,372,748Net realized gain 36,027,264Net change in unrealized appreciation/depreciation 99,634,248
Net increase in net assets resulting from operations 167,034,260
Unitholder transactions
Contributions (45,482,665 units) 667,170,869Redemptions (35,512,766 units) (540,748,044)
Net increase in net assets from unitholder transactions 126,422,825
Net increase in net assets 293,457,085Net assets, beginning of year 958,756,297
Net assets, end of year $ 1,252,213,382
The accompanying notes are an integral part of these financial statements.
BLACKROCK®17 December 31, 2017

LifePath® Index 2025 Fund O
Financial highlights Year ended December 31, 2017
Per unit operating performance (per unit outstanding throughout the year)
Unit value, beginning of year $ 14.10Income from investment operations:
Net investment income (based on average units outstanding throughout the year) $ 0.36Net realized and unrealized gain on investment transactions 1.60
Total income from investment operations 1.96
Unit value, end of year $ 16.06
Total return 13.90%
Ratios to average net assets:
Expensesa 0.07%Net investment income 2.41%
a The expenses incurred by underlying funds in which the fund invests are not included in this ratio. The collective fund income allocated to the fund fromunderlying funds is net of those expenses.
The accompanying notes are an integral part of these financial statements.
BLACKROCK®18 December 31, 2017

LifePath® Index 2025 Fund O
Schedule of investments acquired, sold or redeemed (In summary)For the year ended December 31, 2017
Sales and redemptions
Types of investmentsCost of investments
acquired ProceedsRealized
gain (loss)
Collective funds $ 475,184,182 $ 349,334,488 $ 10,977,729
Collective funds-fund of fund gain (loss) — — 25,049,535
The accompanying notes are an integral part of these financial statements.
BLACKROCK®19 December 31, 2017

LifePath® Index 2030 Fund O
Schedule of investments December 31, 2017
Security Units Cost Value
Collective fundsa — 100.04%
LifePath® Index 2030 Fund F 116,544,521 $2,281,039,580 $2,487,013,469
Short term investments — 0.00%
Short term investment fundsa — 0.00%
Short-Term Investment Fund 1,000 1,000 1,000
Total investments — 100.04% $2,281,040,580 $2,487,014,469
Other assets, less liabilities — (0.04)% (885,005)Net assets — 100.00% $2,486,129,464
a Managed by BlackRock Institutional Trust Company, N.A.
The accompanying notes are an integral part of these financial statements.
BLACKROCK®20 December 31, 2017

LifePath® Index 2030 Fund O
Statement of assets and liabilities December 31, 2017
Value
Assets
Investment in collective funds, at fair value (cost $2,281,039,580) $ 2,487,013,469Short term investments, at fair value (cost $1,000) 1,000
Total investments 2,487,014,469
Receivable for unitholder contributions 3,699,877
2,490,714,346
Liabilities
Payable for investments purchased 3,571,875Payable for unitholder redemptions 128,001Management fees payable 884,560Administration fees payable 446
4,584,882
Net assets $ 2,486,129,464
Units outstanding 147,790,006
Unit value $ 16.82
The accompanying notes are an integral part of these financial statements.
BLACKROCK®21 December 31, 2017

LifePath® Index 2030 Fund O
Statement of operations Year ended December 31, 2017
Net investment income
Collective fund income $ 58,471,209Distributions from short term investment funds 69Securities lending indirect income 1,176,882
Total investment income 59,648,160
Expenses
Management fees 1,654,866Administration fees 5,743Audit fees 3,765
Total expenses 1,664,374Less operating expenses borne by BTC (15)
Net expenses 1,664,359
Net investment income 57,983,801
Net realized and unrealized gain (loss)
Net realized gain (loss) on:Investments 84,323,490
Net realized gain 84,323,490
Net change in unrealized appreciation/depreciation on:Investments 203,388,050
Net change in unrealized appreciation/depreciation 203,388,050
Net realized and unrealized gain 287,711,540
Net increase in net assets resulting from operations $ 345,695,341
Statement of changes in net assets Year ended December 31, 2017
Increase in net assets:
Operations
Net investment income $ 57,983,801Net realized gain 84,323,490Net change in unrealized appreciation/depreciation 203,388,050
Net increase in net assets resulting from operations 345,695,341
Unitholder transactions
Contributions (59,782,811 units) 908,757,940Redemptions (42,156,056 units) (658,571,630)
Net increase in net assets from unitholder transactions 250,186,310
Net increase in net assets 595,881,651Net assets, beginning of year 1,890,247,813
Net assets, end of year $ 2,486,129,464
The accompanying notes are an integral part of these financial statements.
BLACKROCK®22 December 31, 2017

LifePath® Index 2030 Fund O
Financial highlights Year ended December 31, 2017
Per unit operating performance (per unit outstanding throughout the year)
Unit value, beginning of year $ 14.52Income from investment operations:
Net investment income (based on average units outstanding throughout the year) $ 0.38Net realized and unrealized gain on investment transactions 1.92
Total income from investment operations 2.30
Unit value, end of year $ 16.82
Total return 15.84%
Ratios to average net assets:
Expensesa 0.07%Net expensesa 0.07%Net investment income 2.44%
a The expenses incurred by underlying funds in which the fund invests are not included in this ratio. The collective fund income allocated to the fund fromunderlying funds is net of those expenses.
The accompanying notes are an integral part of these financial statements.
BLACKROCK®23 December 31, 2017

LifePath® Index 2030 Fund O
Schedule of investments acquired, sold or redeemed (In summary)For the year ended December 31, 2017
Sales and redemptions
Types of investmentsCost of investments
acquired ProceedsRealized
gain (loss)
Collective funds $ 602,572,669 $ 353,455,698 $ 20,702,667
Collective funds-fund of fund gain (loss) — — 63,620,823
The accompanying notes are an integral part of these financial statements.
BLACKROCK®24 December 31, 2017

LifePath® Index 2035 Fund O
Schedule of investments December 31, 2017
Security Units Cost Value
Collective fundsa — 100.04%
LifePath® Index 2035 Fund F 52,446,677 $966,801,569 $1,065,606,339
Short term investments — 0.00%
Short term investment fundsa — 0.00%
Short-Term Investment Fund 999 999 999
Total investments — 100.04% $966,802,568 $1,065,607,338
Other assets, less liabilities — (0.04)% (389,986)Net assets — 100.00% $1,065,217,352
a Managed by BlackRock Institutional Trust Company, N.A.
The accompanying notes are an integral part of these financial statements.
BLACKROCK®25 December 31, 2017

LifePath® Index 2035 Fund O
Statement of assets and liabilities December 31, 2017
Value
Assets
Investment in collective funds, at fair value (cost $966,801,569) $ 1,065,606,339Short term investments, at fair value (cost $999) 999
Total investments 1,065,607,338
Receivable for unitholder contributions 2,271,166
1,067,878,504
Liabilities
Payable for investments purchased 2,240,739Payable for unitholder redemptions 30,427Management fees payable 389,543Administration fees payable 443
2,661,152
Net assets $ 1,065,217,352
Units outstanding 60,651,403
Unit value $ 17.56
The accompanying notes are an integral part of these financial statements.
BLACKROCK®26 December 31, 2017

LifePath® Index 2035 Fund O
Statement of operations Year ended December 31, 2017
Net investment income
Collective fund income $ 25,978,028Distributions from short term investment funds 30Securities lending indirect income 447,251
Total investment income 26,425,309
Expenses
Management fees 720,240Administration fees 5,861Audit fees 3,765
Total expenses 729,866Less operating expenses borne by BTC (8,843)
Net expenses 721,023
Net investment income 25,704,286
Net realized and unrealized gain (loss)
Net realized gain (loss) on:Investments 52,506,751
Net realized gain 52,506,751
Net change in unrealized appreciation/depreciation on:Investments 87,721,418
Net change in unrealized appreciation/depreciation 87,721,418
Net realized and unrealized gain 140,228,169
Net increase in net assets resulting from operations $ 165,932,455
Statement of changes in net assets Year ended December 31, 2017
Increase in net assets:
Operations
Net investment income $ 25,704,286Net realized gain 52,506,751Net change in unrealized appreciation/depreciation 87,721,418
Net increase in net assets resulting from operations 165,932,455
Unitholder transactions
Contributions (35,149,582 units) 550,587,750Redemptions (24,241,132 units) (393,565,344)
Net increase in net assets from unitholder transactions 157,022,406
Net increase in net assets 322,954,861Net assets, beginning of year 742,262,491
Net assets, end of year $ 1,065,217,352
The accompanying notes are an integral part of these financial statements.
BLACKROCK®27 December 31, 2017

LifePath® Index 2035 Fund O
Financial highlights Year ended December 31, 2017
Per unit operating performance (per unit outstanding throughout the year)
Unit value, beginning of year $ 14.92Income from investment operations:
Net investment income (based on average units outstanding throughout the year) $ 0.40Net realized and unrealized gain on investment transactions 2.24
Total income from investment operations 2.64
Unit value, end of year $ 17.56
Total return 17.69%
Ratios to average net assets:
Expensesa 0.07%Net expensesa 0.07%Net investment income 2.48%
a The expenses incurred by underlying funds in which the fund invests are not included in this ratio. The collective fund income allocated to the fund fromunderlying funds is net of those expenses.
The accompanying notes are an integral part of these financial statements.
BLACKROCK®28 December 31, 2017

LifePath® Index 2035 Fund O
Schedule of investments acquired, sold or redeemed (In summary)For the year ended December 31, 2017
Sales and redemptions
Types of investmentsCost of investments
acquired ProceedsRealized
gain (loss)
Collective funds $ 381,400,929 $ 224,822,271 $ 18,509,134
Collective funds-fund of fund gain (loss) — — 33,997,617
The accompanying notes are an integral part of these financial statements.
BLACKROCK®29 December 31, 2017

LifePath® Index 2040 Fund O
Schedule of investments December 31, 2017
Security Units Cost Value
Collective fundsa — 100.03%
LifePath® Index 2040 Fund F 116,351,535 $2,348,726,325 $2,595,395,521
Short term investments — 0.00%
Short term investment fundsa — 0.00%
Short-Term Investment Fund 999 999 999
Total investments — 100.03% $2,348,727,324 $2,595,396,520
Other assets, less liabilities — (0.03)% (875,815)Net assets — 100.00% $2,594,520,705
a Managed by BlackRock Institutional Trust Company, N.A.
The accompanying notes are an integral part of these financial statements.
BLACKROCK®30 December 31, 2017

LifePath® Index 2040 Fund O
Statement of assets and liabilities December 31, 2017
Value
Assets
Investment in collective funds, at fair value (cost $2,348,726,325) $ 2,595,395,521Short term investments, at fair value (cost $999) 999
Total investments 2,595,396,520
Receivable for unitholder contributions 5,703,773
2,601,100,293
Liabilities
Payable for investments purchased 4,207,554Payable for unitholder redemptions 1,496,220Management fees payable 875,371Administration fees payable 443
6,579,588
Net assets $ 2,594,520,705
Units outstanding 142,379,490
Unit value $ 18.22
The accompanying notes are an integral part of these financial statements.
BLACKROCK®31 December 31, 2017

LifePath® Index 2040 Fund O
Statement of operations Year ended December 31, 2017
Net investment income
Collective fund income (includes underlying fund-related operating expenses, $362 of which was borne by BTC) $ 59,138,747Distributions from short term investment funds 73Securities lending indirect income 885,925
Total investment income 60,024,745
Expenses
Management fees 1,623,379Administration fees 5,757Audit fees 3,765
Total expenses 1,632,901Less operating expenses borne by BTC (9,522)
Net expenses 1,623,379
Net investment income 58,401,366
Net realized and unrealized gain (loss)
Net realized gain (loss) on:Investments 124,124,423
Net realized gain 124,124,423
Net change in unrealized appreciation/depreciation on:Investments 226,415,963
Net change in unrealized appreciation/depreciation 226,415,963
Net realized and unrealized gain 350,540,386
Net increase in net assets resulting from operations $ 408,941,752
Statement of changes in net assets Year ended December 31, 2017
Increase in net assets:
Operations
Net investment income $ 58,401,366Net realized gain 124,124,423Net change in unrealized appreciation/depreciation 226,415,963
Net increase in net assets resulting from operations 408,941,752
Unitholder transactions
Contributions (39,009,300 units) 640,449,027Redemptions (17,653,032 units) (302,241,175)
Net increase in net assets from unitholder transactions 338,207,852
Net increase in net assets 747,149,604Net assets, beginning of year 1,847,371,101
Net assets, end of year $ 2,594,520,705
The accompanying notes are an integral part of these financial statements.
BLACKROCK®32 December 31, 2017

LifePath® Index 2040 Fund O
Financial highlights Year ended December 31, 2017
Per unit operating performance (per unit outstanding throughout the year)
Unit value, beginning of year $ 15.26Income from investment operations:
Net investment income (based on average units outstanding throughout the year) $ 0.42Net realized and unrealized gain on investment transactions 2.54
Total income from investment operations 2.96
Unit value, end of year $ 18.22
Total return 19.40%
Ratios to average net assets:
Expensesa 0.07%Net expensesa 0.07%Net investment income 2.50%
a The expenses incurred by underlying funds in which the fund invests are not included in this ratio. The collective fund income allocated to the fund fromunderlying funds is net of those expenses.
The accompanying notes are an integral part of these financial statements.
BLACKROCK®33 December 31, 2017

LifePath® Index 2040 Fund O
Schedule of investments acquired, sold or redeemed (In summary)For the year ended December 31, 2017
Sales and redemptions
Types of investmentsCost of investments
acquired ProceedsRealized
gain (loss)
Collective funds $ 557,105,857 $ 219,937,041 $ 20,795,310
Collective funds-fund of fund gain (loss) — — 103,329,113
The accompanying notes are an integral part of these financial statements.
BLACKROCK®34 December 31, 2017

LifePath® Index 2045 Fund O
Schedule of investments December 31, 2017
Security Units Cost Value
Collective fundsa — 100.04%
LifePath® Index 2045 Fund F 33,810,131 $632,497,820 $702,493,385
Short term investments — 0.00%
Short term investment fundsa — 0.00%
Short-Term Investment Fund 1,000 1,000 1,000
Total investments — 100.04% $632,498,820 $702,494,385
Other assets, less liabilities — (0.04)% (251,120)Net assets — 100.00% $702,243,265
a Managed by BlackRock Institutional Trust Company, N.A.
The accompanying notes are an integral part of these financial statements.
BLACKROCK®35 December 31, 2017
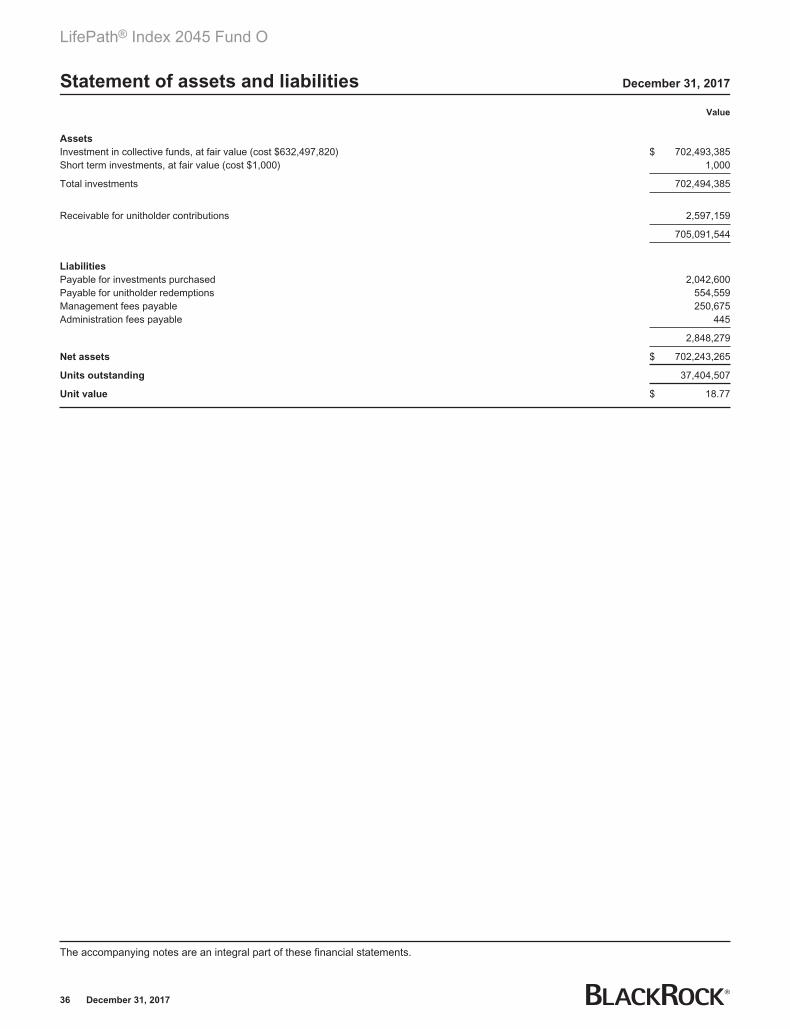
LifePath® Index 2045 Fund O
Statement of assets and liabilities December 31, 2017
Value
Assets
Investment in collective funds, at fair value (cost $632,497,820) $ 702,493,385Short term investments, at fair value (cost $1,000) 1,000
Total investments 702,494,385
Receivable for unitholder contributions 2,597,159
705,091,544
Liabilities
Payable for investments purchased 2,042,600Payable for unitholder redemptions 554,559Management fees payable 250,675Administration fees payable 445
2,848,279
Net assets $ 702,243,265
Units outstanding 37,404,507
Unit value $ 18.77
The accompanying notes are an integral part of these financial statements.
BLACKROCK®36 December 31, 2017

LifePath® Index 2045 Fund O
Statement of operations Year ended December 31, 2017
Net investment income
Collective fund income (includes underlying fund-related operating expenses, $170 of which was borne by BTC) $ 17,005,004Distributions from short term investment funds 18Securities lending indirect income 229,071
Total investment income 17,234,093
Expenses
Management fees 458,335Administration fees 5,837Audit fees 3,765
Total expenses 467,937Less operating expenses borne by BTC (9,602)
Net expenses 458,335
Net investment income 16,775,758
Net realized and unrealized gain (loss)
Net realized gain (loss) on:Investments 45,870,024
Net realized gain 45,870,024
Net change in unrealized appreciation/depreciation on:Investments 57,771,767
Net change in unrealized appreciation/depreciation 57,771,767
Net realized and unrealized gain 103,641,791
Net increase in net assets resulting from operations $ 120,417,549
Statement of changes in net assets Year ended December 31, 2017
Increase in net assets:
Operations
Net investment income $ 16,775,758Net realized gain 45,870,024Net change in unrealized appreciation/depreciation 57,771,767
Net increase in net assets resulting from operations 120,417,549
Unitholder transactions
Contributions (22,692,352 units) 376,395,962Redemptions (14,336,493 units) (247,306,999)
Net increase in net assets from unitholder transactions 129,088,963
Net increase in net assets 249,506,512Net assets, beginning of year 452,736,753
Net assets, end of year $ 702,243,265
The accompanying notes are an integral part of these financial statements.
BLACKROCK®37 December 31, 2017

LifePath® Index 2045 Fund O
Financial highlights Year ended December 31, 2017
Per unit operating performance (per unit outstanding throughout the year)
Unit value, beginning of year $ 15.59Income from investment operations:
Net investment income (based on average units outstanding throughout the year) $ 0.44Net realized and unrealized gain on investment transactions 2.74
Total income from investment operations 3.18
Unit value, end of year $ 18.77
Total return 20.40%
Ratios to average net assets:
Expensesa 0.07%Net expensesa 0.07%Net investment income 2.55%
a The expenses incurred by underlying funds in which the fund invests are not included in this ratio. The collective fund income allocated to the fund fromunderlying funds is net of those expenses.
The accompanying notes are an integral part of these financial statements.
BLACKROCK®38 December 31, 2017

LifePath® Index 2045 Fund O
Schedule of investments acquired, sold or redeemed (In summary)For the year ended December 31, 2017
Sales and redemptions
Types of investmentsCost of investments
acquired ProceedsRealized
gain (loss)
Collective funds $ 274,088,348 $ 145,281,959 $ 16,665,459
Collective funds-fund of fund gain (loss) — — 29,204,565
The accompanying notes are an integral part of these financial statements.
BLACKROCK®39 December 31, 2017

LifePath® Index 2050 Fund O
Schedule of investments December 31, 2017
Security Units Cost Value
Collective fundsa — 100.03%
LifePath® Index 2050 Fund F 98,937,558 $1,524,371,597 $1,689,111,466
Short term investments — 0.00%
Short term investment fundsa — 0.00%
Short-Term Investment Fund 1,000 1,000 1,000
Total investments — 100.03% $1,524,372,597 $1,689,112,466
Other assets, less liabilities — (0.03)% (551,792)Net assets — 100.00% $1,688,560,674
a Managed by BlackRock Institutional Trust Company, N.A.
The accompanying notes are an integral part of these financial statements.
BLACKROCK®40 December 31, 2017

LifePath® Index 2050 Fund O
Statement of assets and liabilities December 31, 2017
Value
Assets
Investment in collective funds, at fair value (cost $1,524,371,597) $ 1,689,111,466Short term investments, at fair value (cost $1,000) 1,000
Total investments 1,689,112,466
Receivable for unitholder contributions 9,349,232
1,698,461,698
Liabilities
Payable for investments purchased 9,122,499Payable for unitholder redemptions 226,733Management fees payable 551,347Administration fees payable 445
9,901,024
Net assets $ 1,688,560,674
Units outstanding 88,111,438
Unit value $ 19.16
The accompanying notes are an integral part of these financial statements.
BLACKROCK®41 December 31, 2017

LifePath® Index 2050 Fund O
Statement of operations Year ended December 31, 2017
Net investment income
Collective fund income (includes underlying fund-related operating expenses, $254 of which was borne by BTC) $ 36,876,973Distributions from short term investment funds 43Securities lending indirect income 480,699
Total investment income 37,357,715
Expenses
Management fees 992,449Administration fees 5,757Audit fees 3,765
Total expenses 1,001,971Less operating expenses borne by BTC (9,522)
Net expenses 992,449
Net investment income 36,365,266
Net realized and unrealized gain (loss)
Net realized gain (loss) on:Investments 79,184,664
Net realized gain 79,184,664
Net change in unrealized appreciation/depreciation on:Investments 151,440,506
Net change in unrealized appreciation/depreciation 151,440,506
Net realized and unrealized gain 230,625,170
Net increase in net assets resulting from operations $ 266,990,436
Statement of changes in net assets Year ended December 31, 2017
Increase in net assets:
Operations
Net investment income $ 36,365,266Net realized gain 79,184,664Net change in unrealized appreciation/depreciation 151,440,506
Net increase in net assets resulting from operations 266,990,436
Unitholder transactions
Contributions (36,988,602 units) 634,315,527Redemptions (13,858,583 units) (243,289,970)
Net increase in net assets from unitholder transactions 391,025,557
Net increase in net assets 658,015,993Net assets, beginning of year 1,030,544,681
Net assets, end of year $ 1,688,560,674
The accompanying notes are an integral part of these financial statements.
BLACKROCK®42 December 31, 2017

LifePath® Index 2050 Fund O
Financial highlights Year ended December 31, 2017
Per unit operating performance (per unit outstanding throughout the year)
Unit value, beginning of year $ 15.86Income from investment operations:
Net investment income (based on average units outstanding throughout the year) $ 0.45Net realized and unrealized gain on investment transactions 2.85
Total income from investment operations 3.30
Unit value, end of year $ 19.16
Total return 20.81%
Ratios to average net assets:
Expensesa 0.07%Net expensesa 0.07%Net investment income 2.55%
a The expenses incurred by underlying funds in which the fund invests are not included in this ratio. The collective fund income allocated to the fund fromunderlying funds is net of those expenses.
The accompanying notes are an integral part of these financial statements.
BLACKROCK®43 December 31, 2017

LifePath® Index 2050 Fund O
Schedule of investments acquired, sold or redeemed (In summary)For the year ended December 31, 2017
Sales and redemptions
Cost of investments RealizedTypes of investments acquired Proceeds gain (loss)
Collective funds $ 528,728,526 $ 138,313,648 $ 15,020,077
Collective funds-fund of fund gain (loss) — — 64,164,587
The accompanying notes are an integral part of these financial statements.
BLACKROCK®44 December 31, 2017

LifePath® Index 2055 Fund O
Schedule of investments December 31, 2017
Security Units Cost Value
Collective fundsa — 100.04%
LifePath® Index 2055 Fund F 14,887,821 $295,987,004 $329,951,332
Short term investments — 0.00%
Short term investment fundsa — 0.00%
Short-Term Investment Fund 1,000 1,000 1,000
Total investments — 100.04% $295,988,004 $329,952,332
Other assets, less liabilities — (0.04)% (118,022)Net assets — 100.00% $329,834,310
a Managed by BlackRock Institutional Trust Company, N.A.
The accompanying notes are an integral part of these financial statements.
BLACKROCK®45 December 31, 2017

LifePath® Index 2055 Fund O
Statement of assets and liabilities December 31, 2017
Value
Assets
Investment in collective funds, at fair value (cost $295,987,004) $ 329,951,332Short term investments, at fair value (cost $1,000) 1,000
Total investments 329,952,332
Receivable for unitholder contributions 2,803,316
332,755,648
Liabilities
Payable for investments purchased 2,695,536Payable for unitholder redemptions 107,780Management fees payable 117,577Administration fees payable 445
2,921,338
Net assets $ 329,834,310
Units outstanding 16,641,047
Unit value $ 19.82
The accompanying notes are an integral part of these financial statements.
BLACKROCK®46 December 31, 2017

LifePath® Index 2055 Fund O
Statement of operations Year ended December 31, 2017
Net investment income
Collective fund income (includes underlying fund-related operating expenses, $48 of which was borne by BTC) $ 8,145,047Distributions from short term investment funds 18Securities lending indirect income 107,465
Total investment income 8,252,530
Expenses
Management fees 220,875Administration fees 5,861Audit fees 3,765
Total expenses 230,501Less operating expenses borne by BTC (9,626)
Net expenses 220,875
Net investment income 8,031,655
Net realized and unrealized gain (loss)
Net realized gain (loss) on:Investments 24,489,590
Net realized gain 24,489,590
Net change in unrealized appreciation/depreciation on:Investments 26,441,727
Net change in unrealized appreciation/depreciation 26,441,727
Net realized and unrealized gain 50,931,317
Net increase in net assets resulting from operations $ 58,962,972
Statement of changes in net assets Year ended December 31, 2017
Increase in net assets:
Operations
Net investment income $ 8,031,655Net realized gain 24,489,590Net change in unrealized appreciation/depreciation 26,441,727
Net increase in net assets resulting from operations 58,962,972
Unitholder transactions
Contributions (8,976,555 units) 160,575,608Redemptions (7,101,554 units) (131,927,978)
Net increase in net assets from unitholder transactions 28,647,630
Net increase in net assets 87,610,602Net assets, beginning of year 242,223,708
Net assets, end of year $ 329,834,310
The accompanying notes are an integral part of these financial statements.
BLACKROCK®47 December 31, 2017

LifePath® Index 2055 Fund O
Financial highlights Year ended December 31, 2017
Per unit operating performance (per unit outstanding throughout the year)
Unit value, beginning of year $ 16.40Income from investment operations:
Net investment income (based on average units outstanding throughout the year) $ 0.46Net realized and unrealized gain on investment transactions 2.96
Total income from investment operations 3.42
Unit value, end of year $ 19.82
Total return 20.85%
Ratios to average net assets:
Expensesa 0.07%Net expensesa 0.07%Net investment income 2.53%
a The expenses incurred by underlying funds in which the fund invests are not included in this ratio. The collective fund income allocated to the fund fromunderlying funds is net of those expenses.
The accompanying notes are an integral part of these financial statements.
BLACKROCK®48 December 31, 2017

LifePath® Index 2055 Fund O
Schedule of investments acquired, sold or redeemed (In summary)For the year ended December 31, 2017
Sales and redemptions
Types of investmentsCost of investments
acquired ProceedsRealized
gain (loss)
Collective funds $ 120,139,752 $ 91,637,460 $ 11,004,775
Collective funds-fund of fund gain (loss) — — 13,484,815
The accompanying notes are an integral part of these financial statements.
BLACKROCK®49 December 31, 2017

LifePath® Index 2060 Fund O
Schedule of investments December 31, 2017
Security Units Cost Value
Collective fundsa — 100.03%
LifePath® Index 2060 Fund F 14,388,461 $173,153,369 $185,772,299
Short term investments — 0.00%
Short term investment fundsa — 0.00%
Short-Term Investment Fund 1,000 1,000 1,000
Total investments — 100.03% $173,154,369 $185,773,299
Other assets, less liabilities — (0.03)% (48,233)Net assets — 100.00% $185,725,066
a Managed by BlackRock Institutional Trust Company, N.A.
The accompanying notes are an integral part of these financial statements.
BLACKROCK®50 December 31, 2017

LifePath® Index 2060 Fund O
Statement of assets and liabilities December 31, 2017
Value
Assets
Investment in collective funds, at fair value (cost $173,153,369) $ 185,772,299Short term investments, at fair value (cost $1,000) 1,000
Total investments 185,773,299
Receivable for unitholder contributions 3,315,443
189,088,742
Liabilities
Payable for investments purchased 3,298,450Payable for unitholder redemptions 16,993Management fees payable 47,788Administration fees payable 445
3,363,676
Net assets $ 185,725,066
Units outstanding 14,398,404
Unit value $ 12.90
The accompanying notes are an integral part of these financial statements.
BLACKROCK®51 December 31, 2017

LifePath® Index 2060 Fund O
Statement of operations Year ended December 31, 2017
Net investment income
Collective fund income (includes underlying fund-related operating expenses, $17 of which was borne by BTC) $ 2,923,443Distributions from short term investment funds 14Securities lending indirect income 37,072
Total investment income 2,960,529
Expenses
Management fees 77,786Administration fees 5,860Audit fees 3,780
Total expenses 87,426Less operating expenses borne by BTC (9,640)
Net expenses 77,786
Net investment income 2,882,743
Net realized and unrealized gain (loss)
Net realized gain (loss) on:Investments 6,103,928
Net realized gain 6,103,928
Net change in unrealized appreciation/depreciation on:Investments 11,988,654
Net change in unrealized appreciation/depreciation 11,988,654
Net realized and unrealized gain 18,092,582
Net increase in net assets resulting from operations $ 20,975,325
Statement of changes in net assets Year ended December 31, 2017
Increase in net assets:
Operations
Net investment income $ 2,882,743Net realized gain 6,103,928Net change in unrealized appreciation/depreciation 11,988,654
Net increase in net assets resulting from operations 20,975,325
Unitholder transactions
Contributions (11,290,993 units) 133,574,440Redemptions (1,960,642 units) (22,952,329)
Net increase in net assets from unitholder transactions 110,622,111
Net increase in net assets 131,597,436Net assets, beginning of year 54,127,630
Net assets, end of year $ 185,725,066
The accompanying notes are an integral part of these financial statements.
BLACKROCK®52 December 31, 2017

LifePath® Index 2060 Fund O
Financial highlights Year ended December 31, 2017
Per unit operating performance (per unit outstanding throughout the year)
Unit value, beginning of year $ 10.68Income from investment operations:
Net investment income (based on average units outstanding throughout the year) $ 0.31Net realized and unrealized gain on investment transactions 1.91
Total income from investment operations 2.22
Unit value, end of year $ 12.90
Total return 20.79%
Ratios to average net assets:
Expensesa 0.08%Net expensesa 0.07%Net investment income 2.57%
a The expenses incurred by underlying funds in which the fund invests are not included in this ratio. The collective fund income allocated to the fund fromunderlying funds is net of those expenses.
The accompanying notes are an integral part of these financial statements.
BLACKROCK®53 December 31, 2017

LifePath® Index 2060 Fund O
Schedule of investments acquired, sold or redeemed (In summary)For the year ended December 31, 2017
Sales and redemptions
Types of investmentsCost of investments
acquired ProceedsRealized
gain (loss)
Collective funds $ 119,733,950 $ 9,149,160 $ 638,846
Collective funds-fund of fund gain (loss) — — 5,465,082
The accompanying notes are an integral part of these financial statements.
BLACKROCK®54 December 31, 2017
LifePath® Index Retirement Fund O
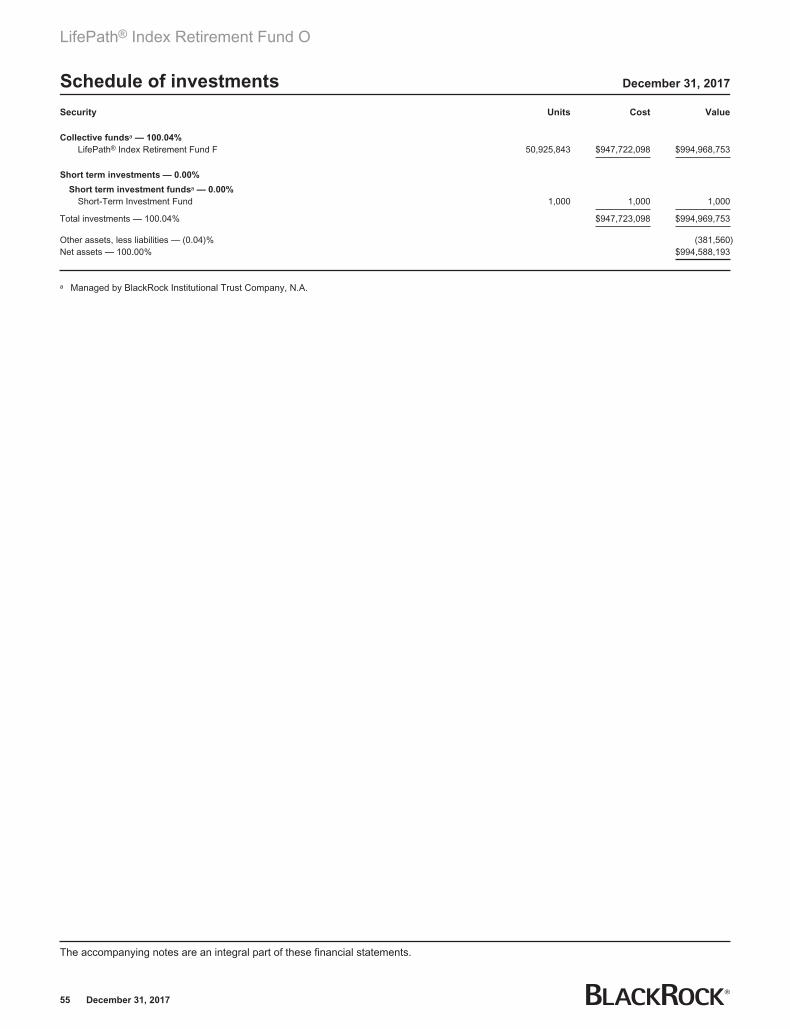
Schedule of investments December 31, 2017
Security Units Cost Value
Collective fundsa — 100.04%
LifePath® Index Retirement Fund F 50,925,843 $947,722,098 $994,968,753
Short term investments — 0.00%
Short term investment fundsa — 0.00%
Short-Term Investment Fund 1,000 1,000 1,000
Total investments — 100.04% $947,723,098 $994,969,753
Other assets, less liabilities — (0.04)% (381,560)Net assets — 100.00% $994,588,193
a Managed by BlackRock Institutional Trust Company, N.A.
The accompanying notes are an integral part of these financial statements.
BLACKROCK®55 December 31, 2017
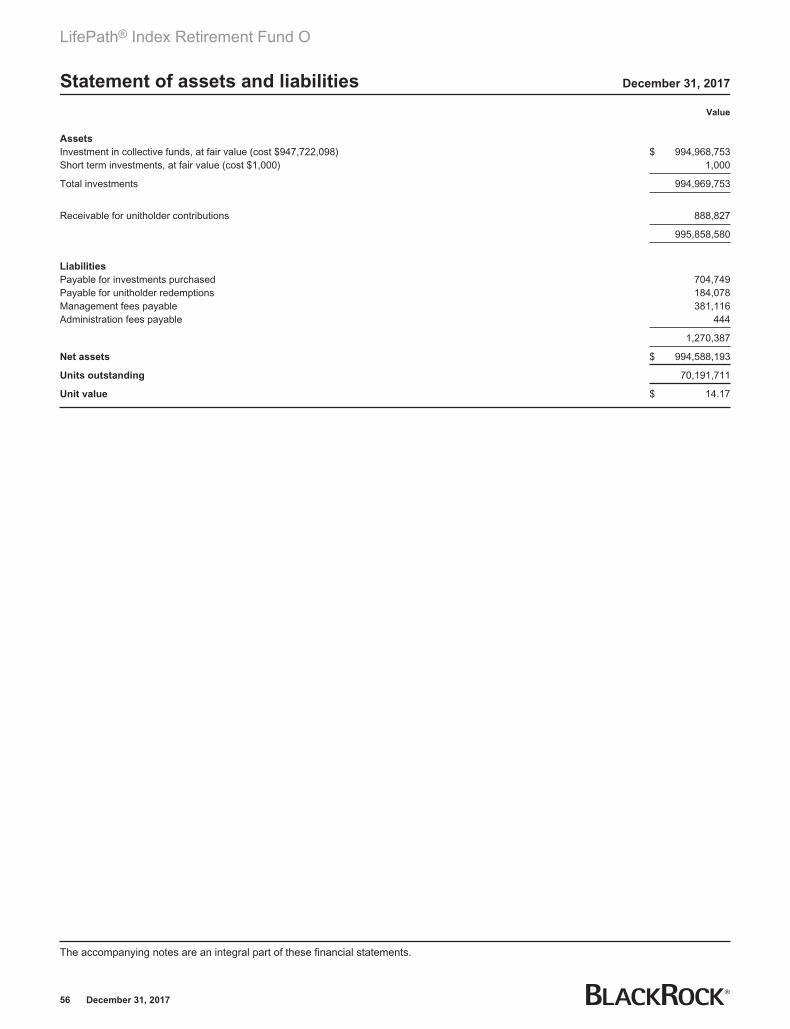
LifePath® Index Retirement Fund O
Statement of assets and liabilities December 31, 2017
Value
Assets
Investment in collective funds, at fair value (cost $947,722,098) $ 994,968,753Short term investments, at fair value (cost $1,000) 1,000
Total investments 994,969,753
Receivable for unitholder contributions 888,827
995,858,580
Liabilities
Payable for investments purchased 704,749Payable for unitholder redemptions 184,078Management fees payable 381,116Administration fees payable 444
1,270,387
Net assets $ 994,588,193
Units outstanding 70,191,711
Unit value $ 14.17
The accompanying notes are an integral part of these financial statements.
BLACKROCK®56 December 31, 2017

LifePath® Index Retirement Fund O
Statement of operations Year ended December 31, 2017
Net investment income
Collective fund income $ 24,830,159Distributions from short term investment funds 34Securities lending indirect income 730,796
Total investment income 25,560,989
Expenses
Management fees 738,462Administration fees 5,740Audit fees 3,765
Total expenses 747,967
Net investment income 24,813,022
Net realized and unrealized gain (loss)
Net realized gain (loss) on:Investments 32,954,357
Net realized gain 32,954,357
Net change in unrealized appreciation/depreciation on:Investments 44,425,860
Net change in unrealized appreciation/depreciation 44,425,860
Net realized and unrealized gain 77,380,217
Net increase in net assets resulting from operations $ 102,193,239
Statement of changes in net assets Year ended December 31, 2017
Increase in net assets:
Operations
Net investment income $ 24,813,022Net realized gain 32,954,357Net change in unrealized appreciation/depreciation 44,425,860
Net increase in net assets resulting from operations 102,193,239
Unitholder transactions
Contributions (33,150,898 units) 437,730,887Redemptions (34,605,593 units) (466,757,278)
Net decrease in net assets from unitholder transactions (29,026,391)
Net increase in net assets 73,166,848Net assets, beginning of year 921,421,345
Net assets, end of year $ 994,588,193
The accompanying notes are an integral part of these financial statements.
BLACKROCK®57 December 31, 2017

LifePath® Index Retirement Fund O
Financial highlights Year ended December 31, 2017
Per unit operating performance (per unit outstanding throughout the year)
Unit value, beginning of year $ 12.86Income from investment operations:
Net investment income (based on average units outstanding throughout the year) $ 0.32Net realized and unrealized gain on investment transactions 0.99
Total income from investment operations 1.31
Unit value, end of year $ 14.17
Total return 10.19%
Ratios to average net assets:
Expensesa 0.07%Net investment income 2.34%
a The expenses incurred by underlying funds in which the fund invests are not included in this ratio. The collective fund income allocated to the fund fromunderlying funds is net of those expenses.
The accompanying notes are an integral part of these financial statements.
BLACKROCK®58 December 31, 2017

LifePath® Index Retirement Fund O
Schedule of investments acquired, sold or redeemed (In summary)For the year ended December 31, 2017
Sales and redemptions
Cost of investments RealizedTypes of investments acquired Proceeds gain (loss)
Collective funds $ 242,395,094 $ 271,926,180 $ 10,903,957
Collective funds-fund of fund gain (loss) — — 22,050,400
The accompanying notes are an integral part of these financial statements.
BLACKROCK®59 December 31, 2017
Notes to financial statements
Each of the collective investment funds included in this report (individually, a “Fund”, and collectively, the “Funds”)is a trust maintained by BlackRock Institutional Trust Company, N.A. (“BTC”), which serves as trustee of theFunds. Each Fund is an entity that is legally separate from BTC, other collective investment funds, and theinvesting unitholders. The Funds are established under a plan document, as amended from time to time, which isnot within the scope of the audit, and sets forth the terms under which BTC manages and administers the Funds’assets.
Each Fund invests in one or more other collective investment funds (each, an “underlying fund”, and collectively,the “underlying funds”) to seek to meet its investment objectives. The plan document and the financial statementsof the underlying funds, both made available by BTC, provide information about the investment strategy andredemption terms of the underlying funds and should be read in conjunction with each Fund’s financialstatements. Investments in the underlying funds are presented in each Fund’s schedule of investments.
1. Significant accounting policies
The following significant accounting policies are consistently followed by each Fund in the preparation of itsfinancial statements in conformity with accounting principles generally accepted in the United States of America(“U.S. GAAP”). The preparation of financial statements in conformity with U.S. GAAP requires management tomake certain estimates and assumptions that affect the reported amounts of assets and liabilities at the date ofthe financial statements and the reported amounts of revenues and expenses during the reporting period. Actualresults could differ from those estimates. Each Fund is considered an investment company under U.S. GAAP andfollows the accounting and reporting guidance applicable to investment companies.
A. Valuation – Valuation of each Fund’s units occurs, at a minimum, each day the Fund is open for contributionsand redemptions and, for financial reporting purposes, as of the report date should the reporting period end on aday that the Fund is not open (each, a “valuation date”). Unit values are determined by dividing each Fund’s netassets by the number of units outstanding on the valuation date. Each Fund’s investments are valued at fair valueeach valuation date.
U.S. GAAP defines fair value as the price a fund would receive to sell an asset or pay to transfer a liability in anorderly transaction between market participants at the valuation date. The BlackRock Global ValuationMethodologies Committee (the “Global Valuation Committee”) provides oversight of the valuation of investmentsfor the Funds. The investments of each Fund are valued pursuant to the policies and procedures developed bythe Global Valuation Committee and approved by BTC (“BlackRock’s global valuation policy”).
Units of collective investment funds, including short term investment funds, are valued based on the unit valuedetermined for each fund on the valuation date.
In the event that application of these methods of valuation results in a price for an investment which is deemednot to be representative of the fair value of such investment or if a price is not available, the investment will bevalued by the Global Valuation Committee, in accordance with BlackRock’s global valuation policy. The fairvaluation approaches that may be utilized by the Global Valuation Committee to determine fair value includemarket approach, income approach and cost approach. The valuation techniques used under these approachestake into consideration inputs that include but are not limited to (i) attributes specific to the investment; (ii) theprincipal market for the investment; (iii) the customary participants in the principal market for the investment;(iv) data assumptions by market participants for the investment, if reasonably available; (v) quoted prices forsimilar investments in active markets; and (vi) other inputs, such as future cash flows, interest rates, yield curves,volatilities, prepayment speeds, loss severities, credit risks and default rates.
BLACKROCK®60 December 31, 2017

Notes to financial statements
The Global Valuation Committee employs various methods for calibrating valuation approaches for investmentswhere an active market does not exist, including regular due diligence of the Funds’ pricing vendors, a regularreview of key inputs and assumptions, transactional back-testing or disposition analysis to compare unrealizedgains and losses to realized gains and losses, reviews of missing or stale prices, reviews of large movements inmarket values, and reviews of market related activity.
Various inputs are used in determining the fair value of financial instruments. Inputs may be based onindependent market data (“observable inputs”) or they may be internally developed (“unobservable inputs”).These inputs to valuation techniques are categorized into a fair value hierarchy consisting of three broad levels forfinancial reporting purposes as follows:
Level 1 Unadjusted quoted prices in active markets for identical assets or liabilities;
Level 2 Inputs other than quoted prices included within Level 1 that are observable for the asset orliability either directly or indirectly, including quoted prices for similar assets or liabilities inmarkets that are active, quoted prices for identical or similar assets or liabilities in markets thatare not active, inputs other than quoted prices that are observable for the assets or liabilities(such as exchange rates, financing terms, interest rates, yield curves, volatilities, prepaymentspeeds, loss severities, credit risks and default rates) or other market–corroborated inputs; and
Level 3 Unobservable inputs for the asset or liability based on the best information available in thecircumstances, to the extent observable inputs are not available, including the Global ValuationCommittee’s assumptions used in determining the fair value of investments.
The hierarchy gives the highest priority to unadjusted quoted prices in active markets for identical assets orliabilities (Level 1 measurements) and the lowest priority to unobservable inputs (Level 3 measurements).Accordingly, the degree of judgement exercised in determining fair value is greatest for instruments categorized inLevel 3. The inputs used to measure fair value may fall into different levels of the fair value hierarchy. In suchcases, for disclosure purposes, the fair value hierarchy classification is determined based on the lowest level inputthat is significant to the fair value measurement in its entirety.
Changes in valuation techniques may result in transfers in or out of an assigned level within the fair valuehierarchy. Transfers between different levels of the fair value hierarchy are deemed to have occurred as of thebeginning of the reporting period. The categorization of values determined for financial instruments are based onthe pricing transparency of the financial instruments and are not necessarily an indication of the risks associatedwith investing in those securities.
As of December 31, 2017, the value of each of the Funds’ investments was classified as Level 2. The breakdownof each Fund’s investments into major categories is disclosed in its respective schedule of investments.
B. Security transactions and income recognition – Security transactions are accounted for on trade date. Interestincome and interest expense are accounted for on an accrual basis. Distributions from short term investment funds arerecognized on the ex-dividend date. Realized gains and losses are determined on a first-in, first-out (FIFO) cost basisas a specific identification cost relief method. Realized gains and losses reported by a fund may include a componentattributable to the fund’s pro-rata share of net realized gain or loss recognized by underlying funds.
Collective fund income represents the investing fund’s pro-rata share of net investment income (loss) fromunderlying funds. Collective fund income, as earned, is reinvested as of each valuation date. The components ofcollective fund income include interest income, dividend income, distributions from short term investment fundsreceived from underlying funds, withholding taxes, and expenses, as applicable. The investing fund’s pro-ratashare of the securities lending income from underlying funds is disclosed separately from collective fund incomeand is shown net of interest rebates and securities lending agent fees.
BLACKROCK®61 December 31, 2017

Notes to financial statements
C. Distribution of income – Net investment income and net realized gains are not distributed.
D. Contributions and redemptions of units – The value of units upon contribution to or redemption from a Fund isbased on the Fund’s unit value determined on that day. A unitholder’s ability to contribute to or redeem from eachFund occurs on a daily basis on a day BTC is open for business.
Unitholders may, at BTC’s discretion, contribute securities or other assets in lieu of cash (“in-kind contributions”) orredeem securities and/or units of underlying funds (“in-kind redemptions”) and will be charged any expenses and fees, asagreed, of the transfer. In-kind contributions and in-kind redemptions are priced in accordance with BlackRock’s globalvaluation policy and any expenses and fees, as agreed, of the transfer may be deducted from the contribution orredemption amount. For purposes of U.S. GAAP, these in-kind redemption transactions are treated as a sale of securitiesand the resulting gains and losses are recognized based on the market value of the securities on the date of the transfer.
E. Unitholders’ net assets – Each Fund’s unitholders have an undivided interest in the Fund’s net assets.Unitholders’ interests are represented by accounting entries in each Fund’s records as “units” and are notcertificated. Each Fund may issue an unlimited number of units, and units have no preferences as to conversion,transfer, dividend or redemption.
F. Income taxes – Each Fund complies with the requirements of the Federal and California tax authorities for exemptionfrom income taxes and, accordingly, no tax provision is required. BTC has analyzed tax laws and regulations and theirapplication to the Funds as of December 31, 2017, inclusive of the open tax return years, and does not believe there areany uncertain tax positions that require recognition of a tax liability in the Funds’ financial statements.
G. Expenses – Expenses are accounted for on an accrual basis. Expenses directly related to a Fund are chargedto that Fund. Other operating expenses shared by several funds, including other funds managed by BTC, arepro-rated among those funds on the basis of relative net assets or other appropriate methods.
2. Related party transactions
BTC is the trustee of the Funds and provides investment management and fiduciary services for the Funds. BTCis a subsidiary of BlackRock, Inc.
For its services as trustee and investment manager of the Funds, BTC charges investment management fees, accrueddaily, based on the net assets of the Funds. The Funds listed below have investment management fees as follows:
Fund name
Annual management
fee
Equity Index Fund O 0.015%
LifePath® Index 2020 Fund O 0.070%
LifePath® Index 2025 Fund O 0.070%
LifePath® Index 2030 Fund O 0.070%
LifePath® Index 2035 Fund O 0.070%
LifePath® Index 2040 Fund O 0.070%
LifePath® Index 2045 Fund O 0.070%
LifePath® Index 2050 Fund O 0.070%
LifePath® Index 2055 Fund O 0.070%
LifePath® Index 2060 Fund O 0.070%
LifePath® Index Retirement Fund O 0.070%
BLACKROCK®62 December 31, 2017

Notes to financial statements
The Funds may incur, directly or indirectly through their investment in underlying funds, operating expenses foradministration (including custody, fund accounting and related services including Form 5500 reporting), audit(including System and Organization Controls 1 Report review and other services), and other third-party expenses,including fees paid for proxy voting services, certain legal expenses, and shareholder servicing fees (paid at thedirection of the investing plan for services provided to the investing plans). BTC has, without recourse, agreed tobear all operating expenses in excess of a certain percent of the Funds’ respective net assets (“net operatingexpense ratio cap”). A Fund’s investment management fees and shareholder servicing fees are not included inthe operating expenses to which the net operating expense ratio cap applies. The effects of these expensearrangements, if any, have been reflected in the statement of operations as operating expenses borne by BTC.Net operating expense ratio caps in effect for the year ended December 31, 2017, were as follows:
Fund name
Net operating
expense ratio cap
Equity Index Fund O 0.01%
LifePath® Index 2020 Fund O 0.01%
LifePath® Index 2025 Fund O 0.01%
LifePath® Index 2030 Fund O 0.01%
LifePath® Index 2035 Fund O 0.01%
LifePath® Index 2040 Fund O 0.01%
LifePath® Index 2045 Fund O 0.01%
LifePath® Index 2050 Fund O 0.01%
LifePath® Index 2055 Fund O 0.01%
LifePath® Index 2060 Fund O 0.01%
LifePath® Index Retirement Fund O 0.01%
3. Securities lending
A fund may earn securities lending income indirectly by its investment in underlying funds that lend securities. Thestatement of operations provides information on securities lending income earned indirectly by a fund. Securitieslending income earned by an underlying fund consists of borrower fees and/or earnings from the investment ofcash collateral posted by borrowers. A portion of the return from investment of cash collateral may be paid to theborrowers of the securities as a negotiated rebate of interest earned on the cash collateral. The remainingsecurities lending income is allocated between the underlying funds and BTC, the securities lending agent. BTCbears all operational costs with respect to securities lending transactions. Securities lending by underlying fundsinvolves exposure to certain risks, including cash collateral reinvestment risk.
4. Commitments and contingencies
In the normal course of business, each Fund enters into contracts that contain a variety of representations whichprovide general indemnifications. The Funds’ maximum exposure under these arrangements is unknown as thiswould involve future claims that may be made against the Funds that have not yet occurred. However, based onexperience, each Fund expects the risk of loss to be remote.
5. Principal risks
In the normal course of business, each Fund’s investment activities expose it to various types of risk associatedwith the financial instruments and markets in which it invests. The significant types of financial risks each Fund isexposed to include, but are not limited to, market risk and credit risk.
BLACKROCK®63 December 31, 2017

Notes to financial statements
Market risk
Market risk arises mainly from uncertainty about future values of financial instruments influenced by price,currency and interest rate movements. It represents the potential loss a fund may suffer through holding marketpositions in the face of market movements. Each Fund is exposed to market risk by its investment in underlyingfunds. The financial statements of the underlying funds should be read in conjunction with these financialstatements. The fair value of securities held by a fund may decline due to general market conditions, economictrends or events that are not specifically related to the issuers of the securities including local, regional or globalpolitical, social or economic instability or to factors that affect a particular industry or group of industries. Theextent of a fund’s exposure to market risk is the market value of the investments held as shown in the fund’sschedule of investments.
A diversified portfolio, where this is appropriate and consistent with a fund’s objectives, minimizes the risk that aprice change of a particular investment will have a material impact on the net assets of a fund. The investmentconcentrations within each Fund’s portfolio are disclosed in its schedule of investments.
Credit risk
Credit risk is the risk that an issuer or guarantor of debt instruments or the counterparty to a financial transaction,including derivatives contracts, repurchase agreements or loans of portfolio securities, is unable or unwilling tomake timely interest and/or principal payments or to otherwise honor its obligations. BTC’s evaluation of thecreditworthiness of their counterparties may not prove sufficient and the absence of a regulated market tofacilitate settlement may increase the potential for losses by a fund. Financial assets, which potentially expose afund to issuer and counterparty credit risks, consist principally of financial instruments and receivables due fromcounterparties. The extent of each Fund’s exposure to credit and counterparty risks with respect to those financialassets is approximated by its value recorded in the statement of assets and liabilities.
6. Ownership concentration
The following table shows the number of unitholders with interests in excess of 10% of the net assets of therespective fund as of December 31, 2017. Investment activities of such unitholders could have a material impacton the operations of such fund. Such unitholders may be other collective investment funds with diversifiedunitholders.
Fund name
Number of fund unitholders with
interests in excess of 10% Aggregated%
Equity Index Fund O 1 100.00%
LifePath® Index 2020 Fund O 5 90.89%
LifePath® Index 2025 Fund O 3 76.83%
LifePath® Index 2030 Fund O 3 80.64%
LifePath® Index 2035 Fund O 4 91.21%
LifePath® Index 2040 Fund O 2 77.25%
LifePath® Index 2045 Fund O 3 84.59%
LifePath® Index 2050 Fund O 3 90.39%
LifePath® Index 2055 Fund O 2 84.06%
LifePath® Index 2060 Fund O 3 86.90%
LifePath® Index Retirement Fund O 5 90.74%
BLACKROCK®64 December 31, 2017

Notes to financial statements
7. Subsequent event
BTC has evaluated the impact of subsequent events on the Funds through March 16, 2018, the date the financialstatements were available to be issued, and has determined that there were no subsequent events requiringadjustment or disclosure in the financial statements.
BLACKROCK®65 December 31, 2017

Regulatory statement (unaudited)
BlackRock Institutional Trust Company, N.A.
Participation requirements. Participation in each Fund is available to accounts which meet the followingconditions:
� The account is (i) a retirement, pension profit sharing, stock bonus, or other employee benefit trust or custo-dial account that is exempt from Federal income taxation under Section 501(a) of the Internal RevenueCode of 1986, as amended from time to time (IRC) by reason of constituting part of a plan qualifying underSection 401(a) of the IRC, (ii) any eligible governmental plan trust or custodial account under Section 457(b)of the IRC that is exempt from Federal income taxation under Section 457(g) of the IRC, (iii) any gov-ernmental plan described in Section 401(a)(24) of the IRC that is not subject to Federal income taxation andis not funded by an annuity contract described in Section 403(b) of the IRC, (iv) a trust created under anemployees’ pension or profit sharing plan which is a Puerto Rican plan described in Section 1022(i)(1) ofERISA, (v) any common, collective, or commingled trust fund that consists solely of the assets of trusts andplans described herein and is exempt from Federal income taxation by reason of qualifying as a “group trust”under Revenue Ruling 81-100, (vi) a separate account maintained by an insurance company, the assets ofwhich are insulated from the claims of the insurance company’s general creditors, that consists solely ofassets of plans or trusts described herein, or (vii) any retirement income account described inSection 403(b)(9) of the IRC to the extent that the interest or participation therein is issued to a church, aconvention or association of churches, or an organization described in Section 414(e)(3)(A) of the IRCestablishing or maintaining the retirement income account or any trust established by any such entity inconnection with such retirement income account, that is not subject to Federal income taxation, or (viii) anyother plan, trust or custodial account, or other organization or entity the assets of which are permitted byRevenue Ruling 81-100 to be commingled in trust for investment purposes with the assets of other plans ortrusts as described herein with the resulting commingled trust being exempt from Federal income taxationunder Section 501(a) of the IRC by reason of qualifying as a “group trust”; provided, however, that theorganizational documents, maintenance, actions and activities of such plan or trust satisfy any applicableconditions of Revenue Ruling 81-100 and any other applicable legal requirements identified by BTC.
� The plan, trust or custodial account, or other organization or entity adopts documents establishing BTC’s col-lective funds.
� BlackRock Institutional Trust Company, N.A. has been appointed to hold assets of the account in any ca-pacity, including, but not limited to, as trustee, investment manager, managing agent, custodian or agent.
For additional details regarding participation requirements, see the Funds’ plan document.
Filing of annual report with Department of Labor. A plan administrator receiving this Annual Report may beeligible for a simplified reporting procedure described in Department of Labor Regulations §2520.103-3 for a planyear ending on or after the end of a Fund’s fiscal year. The fiscal year end for each Fund is December 31. Tosuch eligible plan administrators, BlackRock Institutional Trust Company, N.A. certifies that the statements ofassets and liabilities included in the Annual Report were filed with the Department of Labor on or before the dateupon which the annual report of such plans is required to be filed by the plan administrators in accordance withDepartment of Labor Regulation §2520.103-9. The “Employer Identification Number” of each Fund is as follows:
Fund name ID number
Equity Index Fund O 36-4723218
LifePath® Index 2020 Fund O 45-2849498
LifePath® Index 2025 Fund O 45-2849545
BLACKROCK®66 December 31, 2017

Regulatory statement (unaudited)
Fund name ID number
LifePath® Index 2030 Fund O 45-2849592
LifePath® Index 2035 Fund O 45-2849635
LifePath® Index 2040 Fund O 45-2858930
LifePath® Index 2045 Fund O 45-2858957
LifePath® Index 2050 Fund O 45-2859039
LifePath® Index 2055 Fund O 45-2859078
LifePath® Index 2060 Fund O 47-1996611
LifePath® Index Retirement Fund O 45-2859118
Regulatory requirement. Collective funds are authorized under the Office of the Comptroller of the Currency’sRegulation 9.18(a)(2) and are subject to other pertinent provisions of Regulation 9 as promulgated by the Office ofthe Comptroller of the Currency. In compliance with this Regulation, the trustee will provide detail of investmenttransactions upon request and without charge.
BLACKROCK®67 December 31, 2017