AUDITED ANNUAL FINANCIAL STATEMENTS FOR …...Deloitte LLP is a limited liability partnership...
69
AUDITED ANNUAL FINANCIAL STATEMENTS FOR THE YEAR ENDED DECEMBER 31, 2018 March 6, 2019
Transcript of AUDITED ANNUAL FINANCIAL STATEMENTS FOR …...Deloitte LLP is a limited liability partnership...

AUDITED ANNUAL FINANCIAL STATEMENTS
FOR THE YEAR ENDED
DECEMBER 31, 2018
March 6, 2019
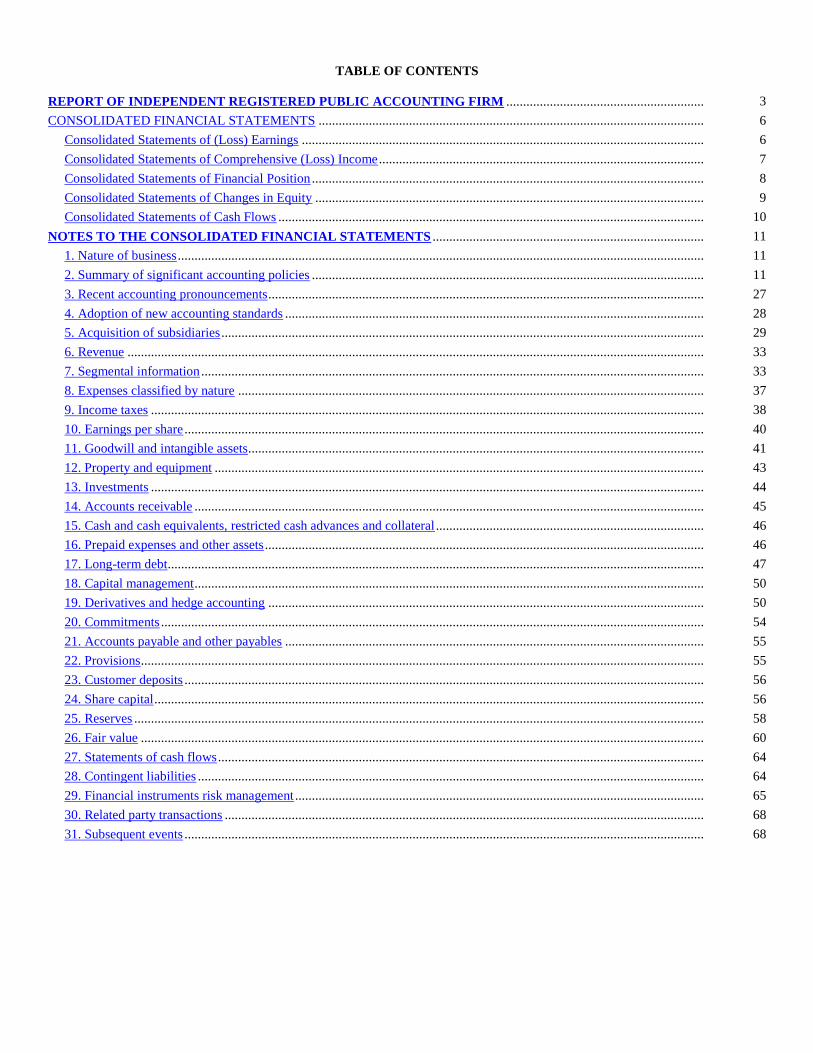
TABLE OF CONTENTS
REPORT OF INDEPENDENT REGISTERED PUBLIC ACCOUNTING FIRM ........................................................... 3
CONSOLIDATED FINANCIAL STATEMENTS ................................................................................................................... 6
Consolidated Statements of (Loss) Earnings ........................................................................................................................ 6
Consolidated Statements of Comprehensive (Loss) Income ................................................................................................. 7
Consolidated Statements of Financial Position ..................................................................................................................... 8
Consolidated Statements of Changes in Equity .................................................................................................................... 9
Consolidated Statements of Cash Flows ............................................................................................................................... 10
NOTES TO THE CONSOLIDATED FINANCIAL STATEMENTS ................................................................................. 11
1. Nature of business ............................................................................................................................................................. 11
2. Summary of significant accounting policies ..................................................................................................................... 11
3. Recent accounting pronouncements .................................................................................................................................. 27
4. Adoption of new accounting standards ............................................................................................................................. 28
5. Acquisition of subsidiaries ................................................................................................................................................ 29
6. Revenue ............................................................................................................................................................................ 33
7. Segmental information ...................................................................................................................................................... 33
8. Expenses classified by nature ........................................................................................................................................... 37
9. Income taxes ..................................................................................................................................................................... 38
10. Earnings per share ........................................................................................................................................................... 40
11. Goodwill and intangible assets........................................................................................................................................ 41
12. Property and equipment .................................................................................................................................................. 43
13. Investments ..................................................................................................................................................................... 44
14. Accounts receivable ........................................................................................................................................................ 45
15. Cash and cash equivalents, restricted cash advances and collateral ................................................................................ 46
16. Prepaid expenses and other assets ................................................................................................................................... 46
17. Long-term debt................................................................................................................................................................ 47
18. Capital management ........................................................................................................................................................ 50
19. Derivatives and hedge accounting .................................................................................................................................. 50
20. Commitments .................................................................................................................................................................. 54
21. Accounts payable and other payables ............................................................................................................................. 55
22. Provisions ........................................................................................................................................................................ 55
23. Customer deposits ........................................................................................................................................................... 56
24. Share capital .................................................................................................................................................................... 56
25. Reserves .......................................................................................................................................................................... 58
26. Fair value ........................................................................................................................................................................ 60
27. Statements of cash flows ................................................................................................................................................. 64
28. Contingent liabilities ....................................................................................................................................................... 64
29. Financial instruments risk management .......................................................................................................................... 65
30. Related party transactions ............................................................................................................................................... 68
31. Subsequent events ........................................................................................................................................................... 68
Deloitte LLP
Hill House
1 Little New Street
London
EC4A 3TR
Phone: +44 (0)20 7936 3000
Fax: +44 (0)20 7583 0112
www.deloitte.co.uk
Deloitte LLP is a limited liability partnership registered in England and Wales with registered number OC303675 and its registered office at 1 New Street Square, London, EC4A 3HQ, United
Kingdom.
Deloitte LLP is the United Kingdom affiliate of Deloitte NWE LLP, a member firm of Deloitte Touche Tohmatsu Limited, a UK private company limited by guarantee (“DTTL”). DTTL and
each of its member firms are legally separate and independent entities. DTTL and Deloitte NWE LLP do not provide services to clients. Please see www.deloitte.com/about to learn more about
our global network of member firms.
© 2019 Deloitte LLP. All rights reserved.
3
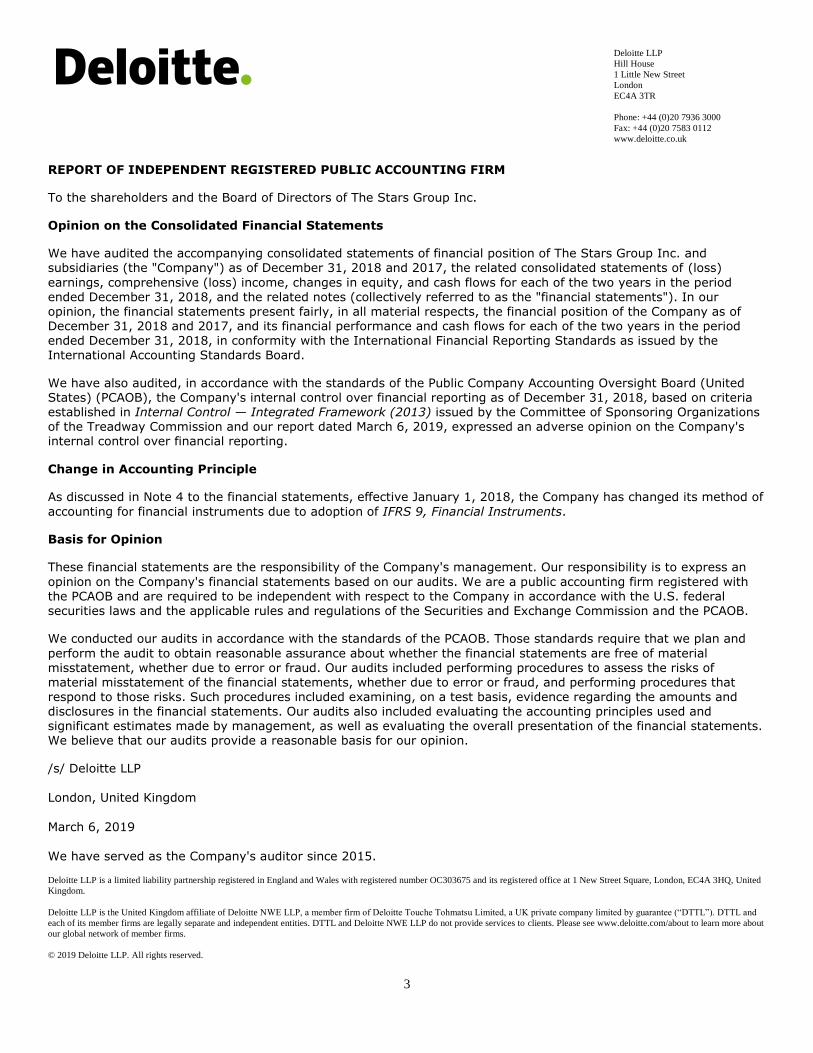
REPORT OF INDEPENDENT REGISTERED PUBLIC ACCOUNTING FIRM
To the shareholders and the Board of Directors of The Stars Group Inc.
Opinion on the Consolidated Financial Statements
We have audited the accompanying consolidated statements of financial position of The Stars Group Inc. and subsidiaries (the "Company") as of December 31, 2018 and 2017, the related consolidated statements of (loss)
earnings, comprehensive (loss) income, changes in equity, and cash flows for each of the two years in the period ended December 31, 2018, and the related notes (collectively referred to as the "financial statements"). In our opinion, the financial statements present fairly, in all material respects, the financial position of the Company as of December 31, 2018 and 2017, and its financial performance and cash flows for each of the two years in the period ended December 31, 2018, in conformity with the International Financial Reporting Standards as issued by the International Accounting Standards Board.
We have also audited, in accordance with the standards of the Public Company Accounting Oversight Board (United States) (PCAOB), the Company's internal control over financial reporting as of December 31, 2018, based on criteria established in Internal Control — Integrated Framework (2013) issued by the Committee of Sponsoring Organizations of the Treadway Commission and our report dated March 6, 2019, expressed an adverse opinion on the Company's internal control over financial reporting.
Change in Accounting Principle
As discussed in Note 4 to the financial statements, effective January 1, 2018, the Company has changed its method of
accounting for financial instruments due to adoption of IFRS 9, Financial Instruments.
Basis for Opinion
These financial statements are the responsibility of the Company's management. Our responsibility is to express an
opinion on the Company's financial statements based on our audits. We are a public accounting firm registered with the PCAOB and are required to be independent with respect to the Company in accordance with the U.S. federal securities laws and the applicable rules and regulations of the Securities and Exchange Commission and the PCAOB.
We conducted our audits in accordance with the standards of the PCAOB. Those standards require that we plan and
perform the audit to obtain reasonable assurance about whether the financial statements are free of material misstatement, whether due to error or fraud. Our audits included performing procedures to assess the risks of material misstatement of the financial statements, whether due to error or fraud, and performing procedures that respond to those risks. Such procedures included examining, on a test basis, evidence regarding the amounts and disclosures in the financial statements. Our audits also included evaluating the accounting principles used and significant estimates made by management, as well as evaluating the overall presentation of the financial statements. We believe that our audits provide a reasonable basis for our opinion.
/s/ Deloitte LLP
London, United Kingdom
March 6, 2019
We have served as the Company's auditor since 2015.

Deloitte LLP
Hill House
1 Little New Street
London
EC4A 3TR
Phone: +44 (0)20 7936 3000
Fax: +44 (0)20 7583 0112
www.deloitte.co.uk
Deloitte LLP is a limited liability partnership registered in England and Wales with registered number OC303675 and its registered office at 1 New Street Square, London, EC4A 3HQ, United
Kingdom.
Deloitte LLP is the United Kingdom affiliate of Deloitte NWE LLP, a member firm of Deloitte Touche Tohmatsu Limited, a UK private company limited by guarantee (“DTTL”). DTTL and
each of its member firms are legally separate and independent entities. DTTL and Deloitte NWE LLP do not provide services to clients. Please see www.deloitte.com/about to learn more about
our global network of member firms.
© 2019 Deloitte LLP. All rights reserved.
4
REPORT OF INDEPENDENT REGISTERED PUBLIC ACCOUNTING FIRM
To the shareholders and the Board of Directors of The Stars Group Inc.
Opinion on Internal Control over Financial Reporting
We have audited the internal control over financial reporting of The Stars Group Inc. and subsidiaries (the “Company”) as of December 31, 2018, based on criteria established in Internal Control — Integrated Framework (2013) issued by
the Committee of Sponsoring Organizations of the Treadway Commission (COSO). In our opinion, because of the effect of the material weaknesses identified below on the achievement of the objectives of the control criteria, the Company has not maintained effective internal control over financial reporting as of December 31, 2018, based on criteria established in Internal Control — Integrated Framework (2013) issued by COSO.
We have also audited, in accordance with the standards of the Public Company Accounting Oversight Board (United States) (PCAOB), the consolidated financial statements as of and for the year ended December 31, 2018, of the Company and our report dated March 6, 2019, expressed an unqualified opinion on those financial statements and included an explanatory paragraph regarding the Company’s change its method of accounting for financial instruments due to adoption of IFRS 9, Financial Instruments.
As described in Management’s Annual Report on Internal Control Over Financial Reporting, management excluded from its assessment the internal control over financial reporting at TSG Australia Pty Ltd and its subsidiaries and
affiliates, including TSGA Holdco Pty Limited and its subsidiaries and affiliates (“BetEasy”) and Cyan Blue Topco Limited and its subsidiaries and affiliates (“SBG”), which were acquired on February 27, 2018 and July 10, 2018, respectively. In respect of BetEasy, its financial statements constitute (1.0)% and 4.5% of net and total assets, respectively, 9.7% of revenue, and 18.1% of net loss of the consolidated financial statement amounts as of and for the year ended December 31, 2018. In respect of SBG, its financial statements constitute 113.5% and 48.2% of net
and total assets, respectively, 19.4% of revenue, and 111.9% of net loss of the consolidated financial statement amounts as of and for the year ended December 31, 2018. Accordingly, our audit did not include the internal control over financial reporting at BetEasy and SBG.
Basis for Opinion
The Company’s management is responsible for maintaining effective internal control over financial reporting and for its assessment of the effectiveness of internal control over financial reporting, included in the accompanying
Management’s Annual Report on Internal Control Over Financial Reporting. Our responsibility is to express an opinion on the Company’s internal control over financial reporting based on our audit. We are a public accounting firm
registered with the PCAOB and are required to be independent with respect to the Company in accordance with the U.S. federal securities laws and the applicable rules and regulations of the Securities and Exchange Commission and the PCAOB.
We conducted our audit in accordance with the standards of the PCAOB. Those standards require that we plan and perform the audit to obtain reasonable assurance about whether effective internal control over financial reporting was
maintained in all material respects. Our audit included obtaining an understanding of internal control over financial reporting, assessing the risk that a material weakness exists, testing and evaluating the design and operating effectiveness of internal control based on the assessed risk, and performing such other procedures as we considered necessary in the circumstances. We believe that our audit provides a reasonable basis for our opinion.

5
Definition and Limitations of Internal Control over Financial Reporting
A company’s internal control over financial reporting is a process designed to provide reasonable assurance regarding the reliability of financial reporting and the preparation of financial statements for external purposes in accordance with generally accepted accounting principles. A company’s internal control over financial reporting includes those policies and procedures that (1) pertain to the maintenance of records that, in reasonable detail, accurately and fairly reflect the transactions and dispositions of the assets of the company; (2) provide reasonable assurance that transactions are recorded as necessary to permit preparation of financial statements in accordance with generally
accepted accounting principles, and that receipts and expenditures of the company are being made only in accordance with authorizations of management and directors of the company; and (3) provide reasonable assurance regarding prevention or timely detection of unauthorized acquisition, use, or disposition of the company’s assets that could have
a material effect on the financial statements.
Because of its inherent limitations, internal control over financial reporting may not prevent or detect misstatements.
Also, projections of any evaluation of effectiveness to future periods are subject to the risk that controls may become inadequate because of changes in conditions, or that the degree of compliance with the policies or procedures may deteriorate.
Material Weaknesses
A material weakness is a deficiency, or a combination of deficiencies, in internal control over financial reporting, such that there is a reasonable possibility that a material misstatement of the company’s annual or interim financial statements will not be prevented or detected on a timely basis. The following two material weaknesses have been identified and included in management's assessment: i) the design of the control over the appropriate re-translation of foreign currency intercompany loans at each reporting period, and ii) the design of the control over the key inputs
and assumptions used in the valuation of an embedded derivative.
These material weaknesses were considered in determining the nature, timing, and extent of audit tests applied in our audit of the consolidated financial statements as of and for the year ended December 31, 2018, of the Company, and this report does not affect our report on such financial statements.
/s/ Deloitte LLP
London, United Kingdom
March 6, 2019

6
CONSOLIDATED FINANCIAL STATEMENTS
CONSOLIDATED STATEMENTS OF (LOSS) EARNINGS
Year Ended December 31,
In thousands of U.S. Dollars (except per share and share amounts) Note 2018 2017 *
Revenue 6,7 2,029,238 1,312,315
Cost of revenue (excluding depreciation and amortization) 8 (459,164 ) (247,497 )
Gross profit (excluding depreciation and amortization) 1,570,074 1,064,818
General and administrative 8 (984,194 ) (437,886 )
Sales and marketing (292,963 ) (154,358 )
Research and development (39,995 ) (25,180 )
Operating income 252,922 447,394
Net earnings (loss) from associates 1,068 (2,569 )
Net financing charges 7,8 (363,884 ) (158,332 )
(Loss) earnings before income taxes (109,894 ) 286,493
Income tax recovery (expense) 9 988 (27,208 )
Net (loss) earnings (108,906 ) 259,285
Net (loss) earnings attributable to
Shareholders of The Stars Group Inc. (102,452 ) 259,231
Non-controlling interest (6,454 ) 54
Net (loss) earnings (108,906 ) 259,285
(Loss) earnings per Common Share (U.S. dollars)
Basic 10 $ (0.49 ) $ 1.77
Diluted 10 $ (0.49 ) $ 1.27
Weighted average Common Shares outstanding (thousands)
Basic 10 208,270 146,819
Diluted 10 208,270 203,708
* Certain amounts were reclassified in the comparative period. See note 2.
See accompanying notes.

7
CONSOLIDATED STATEMENTS OF COMPREHENSIVE (LOSS) INCOME
Year Ended December 31,
In thousands of U.S. Dollars Note 2018 2017
Net (loss) earnings (108,906 ) 259,285
Items that are or may be reclassified to net (loss) earnings
Debt instruments at FVOCI – loss in fair value * 25 (286 ) —
Debt instruments at FVOCI – reclassified to net earnings * 25 (395 ) —
Available-for-sale investments – gain in fair value ** 25 — 32,474
Available-for-sale investments – reclassified to net earnings ** 25 — (37,090 )
Foreign operations – unrealized foreign currency
translation differences 25 (95,281 ) (189,012 )
Cash flow hedges – effective portion of changes in fair value *** 25 41,201 (151,311 )
Cash flow hedges – reclassified to net earnings *** 25 (45,271 ) 160,069
Other comprehensive loss (100,032 ) (184,870 )
Total comprehensive (loss) income (208,938 ) 74,415
Total comprehensive (loss) income attributable to:
Shareholders of The Stars Group Inc. (200,553 ) 74,361
Non-controlling interest (8,385 ) 54
Total comprehensive (loss) income (208,938 ) 74,415
* Net of income tax recovery of $53,000 for the year ended December 31, 2018 (December 31, 2017 – net of income tax expense of
$nil).
** Net of income tax of $nil for the year ended December 31, 2018 (December 31, 2017 - net of income tax of $160,380).
*** Net of income tax of $nil for the year ended December 31, 2018 (December 31, 2017 - $nil).
See accompanying notes.
8
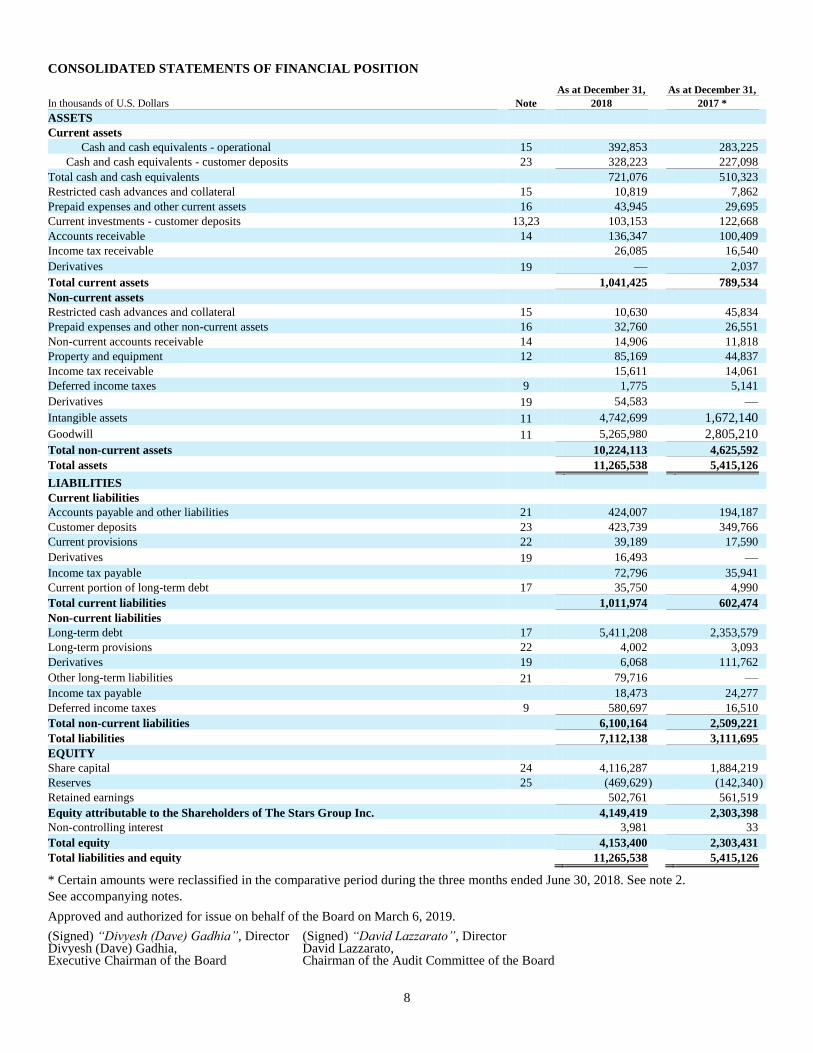
CONSOLIDATED STATEMENTS OF FINANCIAL POSITION
As at December 31, As at December 31,
In thousands of U.S. Dollars Note 2018 2017 *
ASSETS
Current assets
Cash and cash equivalents - operational 15 392,853 283,225
Cash and cash equivalents - customer deposits 23 328,223 227,098
Total cash and cash equivalents 721,076 510,323
Restricted cash advances and collateral 15 10,819 7,862
Prepaid expenses and other current assets 16 43,945 29,695
Current investments - customer deposits 13,23 103,153 122,668
Accounts receivable 14 136,347 100,409
Income tax receivable 26,085 16,540
Derivatives 19 — 2,037
Total current assets 1,041,425 789,534
Non-current assets
Restricted cash advances and collateral 15 10,630 45,834
Prepaid expenses and other non-current assets 16 32,760 26,551
Non-current accounts receivable 14 14,906 11,818
Property and equipment 12 85,169 44,837
Income tax receivable 15,611 14,061
Deferred income taxes 9 1,775 5,141
Derivatives 19 54,583 —
Intangible assets 11 4,742,699 1,672,140
Goodwill 11 5,265,980 2,805,210
Total non-current assets 10,224,113 4,625,592
Total assets 11,265,538 5,415,126
LIABILITIES
Current liabilities
Accounts payable and other liabilities 21 424,007 194,187
Customer deposits 23 423,739 349,766
Current provisions 22 39,189 17,590
Derivatives 19 16,493 —
Income tax payable 72,796 35,941
Current portion of long-term debt 17 35,750 4,990
Total current liabilities 1,011,974 602,474
Non-current liabilities
Long-term debt 17 5,411,208 2,353,579
Long-term provisions 22 4,002 3,093
Derivatives 19 6,068 111,762
Other long-term liabilities 21 79,716 —
Income tax payable 18,473 24,277
Deferred income taxes 9 580,697 16,510
Total non-current liabilities 6,100,164 2,509,221
Total liabilities 7,112,138 3,111,695
EQUITY
Share capital 24 4,116,287 1,884,219
Reserves 25 (469,629 ) (142,340 )
Retained earnings 502,761 561,519
Equity attributable to the Shareholders of The Stars Group Inc. 4,149,419 2,303,398
Non-controlling interest 3,981 33
Total equity 4,153,400 2,303,431
Total liabilities and equity 11,265,538 5,415,126
* Certain amounts were reclassified in the comparative period during the three months ended June 30, 2018. See note 2.
See accompanying notes.
Approved and authorized for issue on behalf of the Board on March 6, 2019.
(Signed) “Divyesh (Dave) Gadhia”, Director Divyesh (Dave) Gadhia, Executive Chairman of the Board
(Signed) “David Lazzarato”, Director David Lazzarato, Chairman of the Audit Committee of the Board

9
CONSOLIDATED STATEMENTS OF CHANGES IN EQUITY
For the years ended December 31, 2018 and 2017:
Share Capital
In thousands of U.S. Dollars, except share numbers Note
Common
Shares number
Preferred
Shares number
Common
Shares amount
Preferred
Shares amount
Reserves
(note 25)
Retained
earnings
Equity
attributable to the
Shareholders
of The Stars
Group Inc.
Non-
controlling
interest
Total
equity
Balance – January 1, 2017 145,101,127 1,139,249 1,178,404 684,385 35,847 302,288 2,200,924 804 2,201,728
Net earnings — — — — — 259,231 259,231 54 259,285
Other comprehensive loss — — — — (184,870 ) — (184,870 ) — (184,870 )
Total comprehensive income — — — — (184,870 ) 259,231 74,361 54 74,415
Issue of Common Shares in
relation to stock options and
equity awards
24
2,923,184 — 21,923 — (5,258 ) — 16,665 — 16,665
Share cancellation 24 (76,437 ) — (493 ) — 493 — — — -
Stock-based compensation — — — — 10,622 — 10,622 — 10,622
Deferred tax on stock-based
compensation
— — — — 359 — 359 — 359
Acquisition of non-controlling
interest
— — — — 467 — 467 (825 ) (358 )
Balance – December 31, 2017 147,947,874 1,139,249 1,199,834 684,385 (142,340 ) 561,519 2,303,398 33 2,303,431
Adjustment on adoption of IFRS
9
— — — — 213 43,694 43,907 — 43,907
Balance - January 1, 2018
(restated)
147,947,874 1,139,249 1,199,834 684,385 (142,127 ) 605,213 2,347,305 33 2,347,338
Net loss — — — — — (102,452 ) (102,452 ) (6,454 ) (108,906 )
Other comprehensive loss — — — — (98,101 ) — (98,101 ) (1,931 ) (100,032 )
Total comprehensive loss — — — — (98,101 ) (102,452 ) (200,553 ) (8,385 ) (208,938 )
Issue of Common Shares in
relation to stock options and
equity awards
24
1,791,860 — 38,048 — (6,982 ) — 31,066 — 31,066
Conversion of Preferred Shares to Common Shares
24 60,013,510 (1,139,249 ) 684,385 (684,385 ) — — — — —
Issue of Common Shares in
connection with acquired subsidiaries
24 41,049,398 — 1,477,478 — — — 1,477,478 — 1,477,478
Issue of Common Shares in
connection with Equity Offering 24
18,875,000 — 690,353 — — — 690,353 — 690,353
Issue of Common Shares in
connection with market access agreement
24 1,076,658 — 20,661 — — — 20,661 — 20,661
Issue of Common Shares in
connection with exercised warrants
24 2,422,944 — 14,688 — (14,688 ) — — — —
Stock-based compensation — — — — 12,806 — 12,806 — 12,806
Reversal of deferred tax on
stock-based compensation
— — — — (359 ) — (359 ) — (359 )
Equity fees 24 — — (5,413 ) — — — (5,413 ) — (5,413 )
Reversal of 2014 deferred tax * 24 — — (3,747 ) — — — (3,747 ) — (3,747 )
Acquisition of non-controlling interest in subsidiary
5 — — — — (220,178 ) — (220,178 ) 12,333 (207,845 )
Balance – December 31, 2018 273,177,244 — 4,116,287 — (469,629 ) 502,761 4,149,419 3,981 4,153,400
* During the year ended December 31, 2018, the Corporation made an adjustment totaling $3.7 million to the amounts recognized in
common stock in respect of a previous reversal of deferred tax recognized through the consolidated statements of (loss) earnings.
See accompanying notes.

10
CONSOLIDATED STATEMENTS OF CASH FLOWS Year Ended December 31,
In thousands of U.S. Dollars Note 2018 2017
Operating activities
Net (loss) earnings (108,906 ) 259,285
Add (deduct):
Income tax (recovery) expense recognized in net earnings (988 ) 27,208
Net financing charges 8 363,884 156,842
Depreciation and amortization 8 282,806 147,186
Stock-based compensation 25 12,806 10,622
Acquisition of market access rights in connection with Eldorado 20,661 —
Unrealized loss (gain) on foreign exchange 25,336 (10,324 )
Unrealized (gain) on investments (673 ) (170 )
Impairment (reversal of impairment) of property and equipment, intangible assets and
assets held for sale 6,156 (6,799 )
Net (earnings) loss from associates (1,068 ) 2,569
Realized loss (gain) on current investments and promissory note 2,727 (50,038 )
Income taxes paid (41,117 ) (9,357 )
Changes in non-cash operating elements of working capital 27 (9,403 ) (3,801 )
Customer deposit liability movement 7,637 (30,924 )
Other (14 ) 2,301
Net cash inflows from operating activities 559,844 494,600
Investing activities
Acquisition of subsidiaries, net of cash acquired 5 (1,865,262 ) (6,516 )
Additions to intangible assets (28,202 ) (1,893 )
Additions to property and equipment (33,952 ) (10,997 )
Additions to deferred development costs (51,574 ) (23,212 )
Net sale of investments utilizing customer deposits 19,515 117,106
Cash movement from (to) restricted cash 35,000 —
Settlement of promissory note — 8,084
Net investment in associates 1,068 (2,000 )
Proceeds on disposal of interest in associate classified as held for sale — 16,127
Sale of investments — 88,760
Settlement of minimum revenue guarantee (7,006 ) (9,311 )
Other (3,760 ) (1,298 )
Net cash (outflows) inflows from investing activities (1,934,173 ) 174,850
Financing activities
Issuance of Common Shares 24 717,250 —
Transaction costs on issuance of Common Shares (32,312 ) —
Issuance of Common Shares in relation to stock options 24 31,066 16,665
Redemption of SBG preferred shares 5 (663,407 ) —
Repayment of shareholder loan on acquisition 5 (10,879 ) —
Issuance of long-term debt 17 5,957,976 —
Transaction costs on long-term debt (36,559 ) (4,719 )
Repayment of long-term debt 17 (2,974,393 ) (139,913 )
Repayment of long-term debt assumed on business combination 5 (1,079,729 ) —
Interest paid (186,162 ) (124,627 )
Net proceeds on loan from non-controlling interest 17 31,730 —
Payment of deferred consideration 22 — (197,510 )
Settlement of derivatives 19 (125,822 ) 13,904
Acquisition of further interest in subsidiaries 5 (48,240 ) —
Settlement of margin — (7,602 )
Capital contribution from non-controlling interest 17 12,060 —
Net cash inflows (outflows) from financing activities 1,592,579 (443,802 )
Increase in cash and cash equivalents 218,250 225,648
Unrealized foreign exchange difference on cash and cash equivalents (7,497 ) 16,991
Cash and cash equivalents – beginning of period 510,323 267,684
Cash and cash equivalents - end of period 721,076 510,323
See accompanying notes.

11
NOTES TO THE CONSOLIDATED FINANCIAL STATEMENTS
1. NATURE OF BUSINESS
The Stars Group Inc. (“The Stars Group” or the “Corporation”) is a global leader in the online and mobile gaming and interactive
entertainment industries, entertaining millions of customers across its online real- and play-money poker, gaming and betting product
offerings. The Stars Group offers these products directly or indirectly under several ultimately owned or licensed gaming and related
consumer businesses and brands, including, among others, PokerStars, PokerStars Casino, BetStars, Full Tilt, BetEasy, Sky Bet, Sky
Vegas, Sky Casino, Sky Bingo, Sky Poker, and Oddschecker, as well as live poker tour and events brands, including the PokerStars
Players No Limit Hold’em Championship, European Poker Tour, PokerStars Caribbean Adventure, Latin American Poker Tour, Asia
Pacific Poker Tour, PokerStars Festival and PokerStars MEGASTACK.
As at December 31, 2018, The Stars Group had three reportable segments, the international business (“International”), the United
Kingdom business (“United Kingdom”) and the Australian business (“Australia”), each as described below, as well as a corporate cost
center (“Corporate”). There are up to four major lines of operations within the Corporation’s reportable segments, as applicable: real-
money online poker (“Poker”), real-money online betting (“Betting”), real-money online casino gaming and bingo (“Gaming”), and
other gaming-related revenue, including, without limitation, from social and play-money gaming, live poker events, branded poker
rooms, Oddschecker and other nominal sources of revenue (“Other”). As it relates to these lines of operations, online revenue includes
revenue generated through the Corporation’s real-money online, mobile and desktop client platforms, as applicable.
The Stars Group’s primary business and main source of revenue is its online gaming businesses. These currently consist of the operations
of Stars Interactive Holdings (IOM) Limited and its subsidiaries and affiliates (collectively, “Stars Interactive Group”), which it acquired
in August 2014 (the ‘‘Stars Interactive Group Acquisition’’), the operations of Cyan Blue Topco Limited and its subsidiaries and
affiliates (collectively, “Sky Betting & Gaming” or “SBG”), which it acquired in July 2018 (the “SBG Acquisition”), and TSG Australia
Pty Ltd (formerly CrownBet Holdings Pty Limited) and its subsidiaries and affiliates, including TSGA Holdco Pty Limited (formerly
William Hill Australia Holdings Pty Ltd) and its subsidiaries and affiliates (“TSGA” and where the context requires, collectively,
“BetEasy”), which it acquired an 80% equity interest in between February 2018 and April 2018 (BetEasy acquired TSGA in April 2018)
(collectively, the “Australian Acquisitions”). The Stars Interactive Group is headquartered in the Isle of Man and operates globally;
SBG is headquartered in and primarily operates in the United Kingdom; and BetEasy is headquartered in and primarily operates in
Australia.
The International segment currently includes the Stars Interactive Group business, and operates across all lines of operations and in
various jurisdictions around the world, including the United Kingdom, under the brands identified above in this note 1; the United
Kingdom segment currently consists of the business operations of Sky Betting & Gaming, including those outside of the United
Kingdom, and operates across all lines of operations primarily in the United Kingdom; and the Australia segment currently consists of
the business operations of BetEasy, and operates within the Betting line of operation and primarily in Australia under the BetEasy brand.
Prior segmental results for the year ended December 31, 2017 have been recast to be presented in a manner consistent with the changed
reporting segments. See note 7.
The Stars Group was incorporated on January 30, 2004 under the Companies Act (Quebec) and continued under the Business
Corporations Act (Ontario) on August 1, 2017. The registered head office is located at 200 Bay Street, South Tower, Suite 3205, Toronto,
Ontario, Canada, M5J 2J3 and its common shares (“Common Shares”) are listed on the Toronto Stock Exchange (the “TSX”) under the
symbol “TSGI”, and the Nasdaq Global Select Market (“Nasdaq”) under the symbol “TSG”.
For reporting purposes, the Corporation prepares its consolidated financial statements in U.S. dollars. Unless otherwise indicated, all
dollar (“$”) amounts and references to “USD” or “USD $” in these consolidated financial statements are expressed in U.S. dollars.
References to ‘‘EUR’’ or “€” are to European Euros, references to ‘‘CDN’’ or “CDN $” are to Canadian dollars, references to “GBP”
or “₤” are to British Pound Sterling and references to “AUD” or “AUD $” are to Australian dollars. Unless otherwise indicated, all
references to a specific “note” refer to these notes to the consolidated financial statements of the Corporation for the year ended
December 31, 2018. References to “IFRS” and “IASB” are to International Financial Reporting Standards and the International
Accounting Standards Board, respectively.
2. SUMMARY OF SIGNIFICANT ACCOUNTING POLICIES
Basis of Accounting
The Corporation’s consolidated financial statements have been prepared in accordance with IFRS as issued by the IASB and have been
approved and authorized for issuance by the Board of Directors on March 6, 2019.
The consolidated financial statements of the Corporation have been prepared on the historical cost basis, except derivative financial
instruments, financial instruments at fair value through profit or loss as well as financial instruments at fair value through other
comprehensive income, each of which are measured at fair value.
12
On January 1, 2018, the Corporation adopted the provisions in Financial Instruments (“IFRS 9”) and Revenue from Contracts with
Customers (“IFRS 15”). See note 4. Significant accounting policies in relation to these adoptions are detailed below.
As previously announced, in response to changes in the business following the Australian Acquisitions (as defined below and further
detailed in note 7), and to align with financial measures commonly used in the industry, the Corporation made certain reclassifications
during the second quarter to the comparative interim condensed consolidated financial statements to enhance their comparability with
the current period’s presentation. Consistent reclassifications have been made to the comparative balances in the consolidated financial
statements for the year ended December 31, 2018. As a result, certain line items have been amended in the comparative consolidated
statement of earnings and financial position and the related notes to the consolidated financial statements. These reclassifications are
outlined below:
Consolidated Statements of (Loss) Earnings
The following financial statement line items, which the Corporation first introduced during the second quarter of 2018, resulted in a re-
classification of the comparative period: Cost of revenue (excluding depreciation and amortization), Gross profit (excluding depreciation
and amortization) and Operating income.
• Cost of revenue (excluding depreciation and amortization) includes direct costs associated with revenue generating activities
such as the following material items:
- Gaming duty ($130.8 million for the year ended December 31, 2017), previously reported separately.
- Processor costs ($69.5 million for the year ended December 31, 2017), previously reported within General and
administrative expenses.
- Royalties ($30.2 million for the year ended December 31, 2017) and affiliates costs ($8.1 million for the year ended
December 31, 2017) which are directly related to revenue generating activities and previously reported within Selling
costs.
• The following material expense categories have been categorized as follows:
- General and administrative expenses now also include the following:
▪ Foreign exchange ($2.8 million loss for the year ended December 31, 2017) and bank charges ($0.9 million for
the year ended December 31, 2017), previously reported within Financial expenses.
▪ Gain on investments in certain equity instruments ($33.6 million for the year ended December 31, 2017),
previously reported separately as Gain from investments.
- Sales and marketing:
▪ Selling expenses remain as reported in previous periods, except as described above.
- Research and development:
▪ Previously reported within General and administrative expenses and now reported separately.
- Net financing charges:
▪ Financial expenses remain as previously reported, except for the inclusion of investment income ($0.9 million for
the year ended December 31, 2017) previously reported separately on the consolidated statements of (loss)
earnings and as noted above).
Consolidated Statements of Financial Position
The following re-classifications to the comparative period, which the Corporation first made during the second quarter of 2018, include
the following:
• Current assets: Prepaid expenses and deposits ($29.4 million as at December 31, 2017) and Inventories ($0.3 million as at
December 31, 2017) were reported separately in previous periods and are now reported within Prepaid expenses and other
current assets.
• Non-Current assets: Prepaid expenses and deposits ($16.5 million as at December 31, 2017), Long term investments ($7.0
million as at December 31, 2017) and Investment tax credits receivable ($3.1 million as at December 31, 2017) were reported
separately in previous periods and are now reported within Prepaid expenses and other non-current assets.
• Current Liabilities: Accounts payable and accrued liabilities ($151.5 million as at December 31, 2017) and Other payables
($42.7 million as at December 31, 2017) were reported separately in previous periods and are now reported within Accounts
payable and other liabilities.
13
Consolidated Statements of Cash Flows
There were no material reclassifications to the comparative period.
Going Concern
The Board of Directors of the Corporation (the “Board”) have, at the time of approving the consolidated financial statements, a reasonable expectation that the Corporation has adequate resources to continue in operational existence for the foreseeable future. As such, the Corporation continues to adopt the going concern basis of accounting in preparing the consolidated financial statements.
Principles of Consolidation
A subsidiary is an entity controlled by the Corporation. As such, the Corporation is exposed, or has rights, to variable returns from its involvement with such entity and has the ability to affect those returns through its current ability to direct such entity’s relevant activities (i.e., control over the entity).
The existence and effect of substantive voting rights that the Corporation potentially has the practical ability to exercise (i.e., substantive rights) are considered when assessing whether the Corporation controls another entity.
The Corporation’s consolidated financial statements include the accounts of the Corporation and its subsidiaries. Upon consolidation, management eliminated all inter-entity transactions and balances.
Non-controlling interests in subsidiaries are identified separately from the Corporation’s equity therein. Those non-controlling interests that are present ownership interests entitling their holders to a proportionate share of net assets upon liquidation may initially be measured at fair value or at the non-controlling interests’ proportionate share of the fair value of the subsidiary’s identifiable net assets. The choice of measurement is made on an acquisition-by-acquisition basis. Other non-controlling interests are initially measured at fair value. Subsequent to acquisition, the carrying amount of non-controlling interests is the amount of those interests at initial recognition plus the non-controlling interests’ share of subsequent changes in equity. “Total comprehensive income” is attributed to non-controlling interests even if this results in the non-controlling interests having a deficit balance.
Upon the loss of control of a subsidiary, the Corporation’s profit or loss on disposal is calculated as the difference between (i) the fair value of the consideration received and of any investment retained in the former subsidiary and (ii) the previous carrying amount of the assets (including any goodwill) and liabilities of the subsidiary and any non-controlling interests.
Revenue Recognition
The Corporation has applied IFRS 15 from January 1, 2018. As permitted, the Corporation applied IFRS 15 using the modified retrospective approach, whereby the cumulative impact of adoption is recognized in opening retained earnings. Comparative information for 2017 has not been restated. See note 4. The adoption of IFRS 15 did not have a material impact on the timing and amount of revenue recognized by the Corporation and the Corporation did not apply the available optional practical expedients.
Revenue from contracts with customers is recognized when control of the Corporation’s services is transferred to the customer at an amount that reflects the consideration to which the Corporation expects to be entitled in exchange for those services. The Corporation has concluded that it is the principal in its revenue arrangements because it controls the services before transferring them to the customer.
The Corporation has disclosed disaggregated revenue recognized from customers and revenue from other online activities in note 7.
The Company evaluates all contractual arrangements it enters into and evaluates the nature of the promised goods or services, and rights and obligations under the arrangement, in determining the nature of its performance obligations. Where such performance obligations are capable of being distinct and are distinct in the context of the contract, the consideration the Corporation expects to be entitled under the arrangement is allocated to each performance obligation based on its relative estimated stand-alone selling prices. Performance obligations that the Corporation concludes are not distinct are combined together into a single combined performance obligation. Revenue is recognized at an amount equal to the transaction price allocated to the specific performance obligation when it is satisfied, either at a point in time or over time, as applicable, based on the pattern of transfer of control.
The Company’s principal arrangements include the following sources of revenue:
Revenue from customers within the scope of IFRS 15
Poker revenue
Poker revenue represents primarily the commission charged at the conclusion of each poker hand in cash games (i.e., rake) and entry fees for participation in poker tournaments, and is net of certain promotional expenses, which are treated as a reduction to the transaction price. In poker tournaments, entry fee revenue is recognized when the tournament has concluded.
Gaming revenue
Gaming revenue primarily represents the difference between the amounts of bets placed by customers less amounts won (i.e., net house win) and is presented net of certain promotional expenses which are treated as a reduction to the transaction price. Gaming transactions are instantaneously settled and revenue is recognized at a point in time.

14
Poker and Gaming each consist of a single revenue performance obligation, notwithstanding the impact customer loyalty programs as noted below. Revenue is recognized at a point in time upon completion of the performance obligation as noted above. Poker and Gaming are each presented as revenue gross of applicable gaming duties, which are presented within cost of revenue.
Conversion margins
Revenue from conversion margins is the revenue earned on the processing of real-money deposits and cash outs in specified currencies.
Revenue from customer cross currency deposits and withdrawals is recognized when the transaction is complete at a point in time.
Revenue is recognized with reference to the underlying arrangement and agreement with the players and represents a single performance
obligation and is recorded within the applicable line of operations.
Other revenue from customers
Play-money gaming revenue - Customers can participate in online poker tournaments and social casino games using play-money, or
virtual currency. Customers can purchase additional play-money chips online to participate in the poker tournaments and social casino
games. The revenue is recognized at a point in time when the customer has purchased such chips as control has been transferred to the
customer and no further performance obligations exist. Once a customer has purchased such chips they are non-refundable and non-
cancellable.
Other - The Corporation sponsors certain live poker tours and events, uses its industry expertise to provide consultancy and support
services to the casinos that operate the events, and has marketing arrangements for branded poker rooms at various locations around the
world. The Corporation also provides customers with access to odds comparisons, tips and other information to assist with betting, and
provides other media and advertising services, and limited content development services with revenue generated by way of affiliate
commissions, revenue share arrangements and advertising income as applicable. Revenue is recognized upon satisfying the applicable
performance obligations, at a point in time or over time as applicable.
Revenue from customers out of the scope of IFRS 15
Betting revenue
The Corporation’s income generated from Betting product offerings does not fall within the scope of IFRS 15. Income generated from
these online transactions is disclosed as revenue although these transactions are accounted as derivative instruments in accordance with
IFRS 9 where the income meets the definition of gains or losses, as applicable.
Betting revenue primarily represents the difference between the amounts of bets placed by customers less amounts won (i.e., net house win). Open betting positions are carried at fair value, and gains and losses arising on these positions are recognized in revenue.
Betting is presented as revenue gross of applicable gaming duties, which are presented within cost of revenue.
Customer loyalty programs
The Corporation operates loyalty programs for its customers within each of its reporting segments that reward customers based on a number of factors, including volume of play, player impact on the overall ecosystem, whether the player is a net withdrawing or net depositing player, and product and game selection. For customer loyalty programs operated by the Corporation, applicable revenue received for which loyalty rights earned by our customers are recorded as a contract liability based on the rewards’ allocated amount and are subsequently recognized as revenue in a future period when the rewards are redeemed. Customer loyalty rewards are included in accounts payable and other liabilities on the consolidated statements of financial position.
The estimated selling price of loyalty rewards is determined using an equivalent cash cost approach which uses historical data of award
redemption patterns considering the alternative goods or services for which the rewards can be redeemed. The estimated selling price of
rewards is adjusted for an estimate of rewards that will not be redeemed based on historical redemption patterns. Historically non-
redeemed loyalty rewards have not been significant.
Other sources of revenue
Income from player funds
A portion of customer deposits is held as current investments. Income generated from current investments and dormant accounts does not fall within the scope of IFRS 15. Income generated from investments is disclosed as revenue despite being accounted for in accordance with IFRS 9 where it meets the definition of gains or losses, as applicable.
Income (loss) from dormant accounts
When a customer deposit account becomes dormant in accordance with Corporation’s terms and conditions, the deposit is removed from
customer liabilities and recorded within accounts payable and other liabilities. Income is generated from dormant accounts that are not
expected to be re-activated based on historical information and re-activation rates. Losses are recorded on dormant accounts that are re-
activated. Income (loss) generated from dormant accounts is disclosed as revenue despite being accounted for in accordance with IFRS
9 where it meets the definition of gains or losses, as applicable.

15
Cost of Revenue
Cost of revenue includes direct costs associated with revenue generating activities. Such direct costs include gaming duty, processor
costs, and royalties. Cost of revenue does not include depreciation and amortization.
Financial Instruments
The Corporation applied IFRS 9 retrospectively from January 1, 2018. In accordance with the practical expedients permitted under the standard, comparative information for 2017 has not been restated. As permitted by IFRS 9, the Corporation elected to continue to apply the hedge accounting requirements of International Accounting Standard (“IAS”) 39, Financial Instruments (“IAS 39”) rather than the new requirements of IFRS 9 and will comply with the revised annual hedge accounting disclosures as required by the related amendments to IFRS 7, Financial Instruments: Disclosures (“IFRS 7”).
For further information regarding the impact of the adoption of IFRS 9, see note 4.
Financial Assets
Recognition and Measurement
At initial recognition, the Corporation measures a financial asset at its fair value plus, in the case of a financial asset not measured at FVTPL (as defined below), transaction costs that are directly attributable to the acquisition of the financial asset. From January 1, 2018, the Corporation classifies financial assets into one of the following measurement categories:
• Those to be measured subsequently at fair value through profit or loss (“FVTPL”);
• Those to be measured subsequently through other comprehensive income (“FVOCI”); or
• Those to be measured at amortized cost.
The classification depends on the Corporation’s business model for managing the financial assets and the contractual terms of the cash flows. Except in very limited circumstances, the classification may not be changed subsequent to initial recognition. The Corporation only reclassifies debt instruments when its business model for managing those assets changes.
Debt instruments
Subsequent measurement of debt instruments depends on the Corporation’s business model for managing the asset and the cash flow characteristics of that asset. There are three measurement categories into which the Corporation classifies its debt instruments:
• Amortized cost: debt instruments are measured at amortized cost if they are held within a business model with the objective of collecting the contractual cash flows and those cash flows solely represent payments of principal and interest. A gain or loss on a debt instrument that is subsequently measured at amortized cost and is not part of a hedging relationship is recognized in profit or loss when the debt instrument is derecognized or impaired. Interest income from these debt instruments is recognized using the effective interest rate method. Cash, restricted cash and accounts receivable are classified as amortized cost.
• FVOCI: debt instruments are measured at FVOCI if they are held within a business model with the objective of either collecting the contractual cash flows or of selling the debt instrument, and those cash flows solely represent payments of principal and interest. Movements in the carrying amount are recorded in other comprehensive income, with impairment gains or losses, interest income and foreign exchange gains or losses recognized in profit or loss. When the debt instrument is derecognized, the cumulative gain or loss previously recognized in other comprehensive income is reclassified to profit or loss. Bonds recorded within current investments are classified as FVOCI.
• FVTPL: debt instruments that are not solely payments of principal and interest are classified and measured at FVTPL, irrespective of the business model. Notwithstanding the criteria for debt instruments to be classified at amortized cost or at FVOCI, as described above, debt instruments may be designated at FVTPL on initial recognition if doing so eliminates, or significantly reduces, an accounting mismatch. A gain or loss on a debt instrument that is subsequently measured at FVTPL and is not part of a hedging relationship is recognized in profit or loss and presented in the consolidated statements of (loss) earnings. Funds recorded within current investments are classified as FVTPL.
Equity instruments
The Corporation subsequently measures all equity instruments at fair value, except for equity instruments for which equity method accounting is applied. The classification of equity instruments depends on whether the Corporation has made an irrevocable election at the time of initial recognition to account for the equity instruments at FVOCI. There are two measurement categories into which the Corporation classifies its equity instruments:
• FVOCI: equity instruments are classified as FVOCI on an instrument-by-instrument basis when the conditions are met based on the nature of the instrument. Where the Corporation’s management makes an irrevocable election to present fair value gains and losses on equity instruments in other comprehensive income, there is no subsequent reclassification of fair value gains and losses to profit or loss upon the derecognition of those instruments. Dividends from such instruments continue to be recognized in profit or loss when the Corporation’s right to receive payment is established. The Corporation does not currently hold any equity instruments classified as FVOCI.
16
• FVTPL: equity instruments are classified as FVTPL if they are held for trading (they are acquired for the purpose of selling or
repurchasing in the near term) or equity investments which the Corporation had not irrevocably elected to classify at FVOCI.
Changes in the fair value of financial assets at FVTPL are recognized in the consolidated statements of (loss) earnings. Equity
in unquoted companies is classified as FVTPL.
Impairment of financial assets
At the end of each reporting period, the Corporation assesses on a forward-looking basis the expected credit losses associated with its debt instruments carried at amortized cost and FVOCI. The impairment methodology applied depends on whether there has been a significant increase in credit risk. The impairment provision recorded in respect of debt instruments carried at amortized cost and FVOCI is determined at 12-months expected credit losses on the basis that the Corporation considers these instruments as low risk.
The Corporation applies the simplified approach permitted by IFRS 9 for trade receivables and other financial assets held at amortized cost, which requires expected lifetime losses to be recognized from initial recognition of the receivables.
The forward-looking element in determining impairment for financial assets is derived from comparison of current and projected macroeconomic indicators covering primary markets in which the Corporation operates.
Financial Liabilities
Recognition and measurement
Financial liabilities are classified, at initial recognition, as either financial liabilities at FVTPL or other financial liabilities.
• FVTPL: Financial liabilities are classified as FVTPL if they are held for trading or are designated as FVTPL upon initial recognition if such designation eliminates or significantly reduces a measurement or recognition inconsistency that would otherwise arise or the financial liability is managed and its performance is evaluated on a fair value basis. Any gains or losses arising on re-measurement are recognized in the consolidated statements of (loss) earnings. Derivative instruments, the deferred contingent payment and certain other level 3 liabilities (see note 26) are classified as FVTPL.
• Other financial liabilities: Financial liabilities, including borrowings, are initially measured at fair value, net of transaction costs. Other financial liabilities are subsequently measured at amortized cost using the effective interest method. The effective interest method calculates the amortized cost of a financial liability and allocates interest expense over the relevant period. The effective interest rate is the rate that exactly discounts estimated future cash payments through the expected life of the financial liability (or a shorter period where appropriate) to the net carrying amount on initial recognition. Long-term debt is classified within other financial liabilities and is measured at amortized cost.
Debt modifications
The Corporation may pursue amendments to its credit agreements based on, among other things, prevailing market conditions. Such amendments, when completed, are considered by the Corporation to be debt modifications. For debt repayable at par with nominal break costs, the Corporation elected to account for such debt modifications as equivalent to repayment at no cost of the original financial instrument and an origination of a new debt at market conditions. Resetting the debt to market conditions with the same lender has the same economic substance as extinguishing the original financial instrument and originating new debt with a third-party lender at market conditions. The transaction is accounted for as an extinguishment of the original debt instrument, which is derecognized and replaced by the amended debt instrument, with any unamortized costs or fees incurred on the original debt instrument recognized as part of the gain or loss on extinguishment.
For all other debt, the accounting treatment of debt modifications depends upon whether the modified terms are substantially different than the previous terms. The terms of an amended debt agreement are considered substantially different when either: (i) the discounted present value of the cash flows under the new terms, discounted using the original effective interest rate, are at least ten percent different from the discounted present value of the remaining cash flows of the original debt or (ii) management determines that other changes to the terms of the amended agreement, such as a change in the environment in which a floating interest rate is determined, are substantially different. If the modification is considered to be substantially different, the transaction is accounted for as an extinguishment of the original debt instrument, which is derecognized and replaced by the amended debt instrument, with any unamortized costs or fees incurred on the original debt instrument recognized as part of the gain or loss on extinguishment. If the modification is not considered to be substantially different, an adjustment to the carrying amount of the original debt instrument is recorded, which is calculated as the difference between the original contractual cash flows and the modified cash flows discounted at the original effective interest rate with the difference recognized in net financing changes on the consolidated statements of (loss) earnings.
Transaction costs
Transaction costs that are directly attributable to the acquisition or issuance of financial assets and financial liabilities (other than financial assets and financial liabilities that are classified as FVTPL) are added to or deducted from, as applicable, the fair value of the financial instrument on initial recognition. These costs are expensed to financial expenses on the consolidated statements of (loss) earnings over the term of the related interest bearing financial asset or financial liability using the effective interest method. When a debt facility is retired by the Corporation, any remaining balance of related debt transaction costs is expensed to financial expenses in the period that the debt facility is retired. Transaction costs related to financial instruments at FVTPL are expensed when incurred.
17
Classification and impairment of financial assets other than derivatives prior to January 1, 2018 under IAS 39
Financial assets are initially recognized at fair value and are classified as either FVTPL, “available-for-sale” or as “loans and
receivables”. The classification depends on the purpose for which the financial instruments were acquired and their respective
characteristics.
Fair value through profit or loss
Financial assets at FVTPL are financial assets held-for-trading. A financial asset is classified in this category if acquired principally for
the purpose of selling in the short-term or as otherwise determined by management to be in this category. Financial assets classified at
FVTPL are measured at fair value with the realized and unrealized changes in fair value recognized each reporting period in the
consolidated statements of (loss) earnings. The Corporation classified certain short-term investments as FVTPL as at December 31,
2017.
Available-for-sale
Available-for-sale assets are financial assets that are either designated in this category or not classified in any of the other categories.
Such assets are included in other non-current financial assets unless management intends to dispose of them within 12 months of the
date of the consolidated statements of financial position. Financial assets classified as available-for-sale are carried at fair value with
changes in fair value recorded in the consolidated statements of comprehensive (loss) income. Interest on available-for-sale assets is
calculated using the effective interest rate method and is recognized in the consolidated statements of (loss) earnings. When a decline in
fair value is determined to be significant or prolonged, the cumulative loss included in accumulated other comprehensive income (loss)
is reclassified as such and then recognized in the consolidated statements of (loss) earnings. Gains and losses realized on the disposal of
available-for-sale assets are recognized in the consolidated statements of (loss) earnings. The Corporation classifies certain current and
noncurrent investments as available-for-sale.
Loans and receivables
Loans and receivables are financial assets with fixed or determinable payments but which are not quoted in an active market. All such
assets with maturities equal to or less than 12 months from the date of the consolidated statements of financial position are classified as
current assets, while those with maturities greater than 12 months from such date are classified as non-current assets. Financial
instruments classified as loans and receivables are initially recorded at fair value and subsequently measured at amortized cost using the
effective interest method. The Corporation classifies accounts receivable and promissory notes as loans and receivables.
Impairment
At the end of each reporting period, the Corporation assesses whether a financial asset or a group of financial assets, other than those
classified as FVTPL, is impaired. If there is objective evidence that impairment exists, the loss is recognized in the consolidated
statements of (loss) earnings. The impairment loss is measured as the difference between the acquisition cost and the current fair value,
less any impairment loss on that financial asset previously recognized in the consolidated statements of (loss) earnings.
Derivatives
As permitted by IFRS 9, the Corporation elected to continue to apply the hedge accounting requirements of IAS 39 rather than the new
requirements of IFRS 9 and will comply with the revised annual hedge accounting disclosures as required by the related amendments
to IFRS 7.
The Corporation uses derivative instruments for risk management purposes and does not use derivative instruments for speculative
trading purposes (except for derivatives with respect to the Corporation’s Betting line of operations, which are transactions within the
scope of IFRS 9 but reported as revenue as discussed above). All derivatives are recorded at fair value in the consolidated statements of
financial position. The accounting for subsequent changes in fair value depends on whether the derivative is designated as a hedging
instrument, and if so, the nature of the item being hedged. For derivatives not designated as hedging instruments, the re-measurement
of those derivatives each period is recognized in the consolidated statements of (loss) earnings.
Derivatives may be embedded in other financial liabilities and non-financial instruments (i.e., the host instrument). Embedded
derivatives are treated as separate derivatives when their economic characteristics and risks are not closely related to those of the host
instrument, the terms of the embedded derivative are the same as those of a stand-alone derivative and the combined instrument (i.e.,
the embedded derivative plus the host instrument) is not held-for-trading or designated at fair value. These embedded derivatives are
measured at fair value with subsequent changes recognized in the consolidated statements of (loss) earnings.
A derivative embedded within a hybrid contract containing a financial asset host is not accounted for separately under IFRS 9. The
financial asset host together with the embedded derivative is required to be classified in its entirety as a financial asset at FVTPL.
18
Hedge accounting
The Corporation designates certain derivatives as either:
• hedges of a particular risk associated with the cash flows of recognized assets and liabilities and highly probable forecast
transactions (cash flow hedges), or
• hedges of a net investment in a foreign operation (net investment hedges).
At inception of the hedge relationship, the Corporation formally documents how the hedging relationship meets the hedge accounting
criteria. It also records the economic relationship between the hedged item and the hedging instrument, including the nature of the risk,
the risk management objective and strategy for undertaking the hedge and the method that will be used to assess the effectiveness of the
hedging relationship at inception and on an ongoing basis.
Cash flow hedges
The Corporation uses derivatives for cash flow hedges. The effective portion of the change in fair value of the hedging instrument is
recorded in other comprehensive income and accumulated in the cash flow hedging reserve, while the ineffective portion is recognized
immediately in the consolidated statements of (loss) earnings. Gains and losses on cash flow hedges accumulated in other comprehensive
(loss) income are reclassified to the consolidated statements of (loss) earnings in the same period the hedged item affects the consolidated
statements of (loss) earnings. If the forecast transaction is no longer expected to occur, the hedge no longer meets the criteria for hedge
accounting, the hedging instrument expires or is sold, terminated or exercised, or the designation is revoked, the hedge accounting is
discontinued prospectively. If the forecast transaction is no longer expected to occur, then the amount accumulated in equity is
reclassified to the consolidated statements of (loss) earnings.
Net investment hedges
Hedges of net investments in foreign operations are accounted for similarly to cash flow hedges. Any gain or loss on the hedging item
relating to the effective portion of the hedge is recognized in other comprehensive income and accumulated under the heading cumulative
translation adjustments reserve. The gain or loss relating to the ineffective portion is recognized immediately in the consolidated
statements of (loss) earnings. Gains and losses accumulated in other comprehensive income are reclassified to the consolidated
statements of (loss) earnings when the foreign operation is partially disposed of or sold.
Determination of fair value
Fair value is the price that would be received to sell an asset or paid to transfer a liability in an orderly transaction between market
participants at the applicable measurement date. When measuring the fair value of an asset or a liability, the Corporation uses market
observable data to the extent possible. If the fair value of an asset or a liability is not directly observable, it is estimated by the Corporation
using valuation techniques that maximize the use of relevant observable inputs and minimize the use of unobservable inputs (e.g., by
the use of the market comparable approach that reflects recent transaction prices for similar items, discounted cash flow analysis, or
option pricing models refined to reflect the Corporation’s specific circumstances). Inputs used are consistent with the characteristics of
the asset or liability that market participants would take into account.
For the Corporation’s financial instruments which are recognized in the consolidated statements of financial position at fair value, the
fair value measurements are categorized based on the lowest level input that is significant to the fair value measurement in its entirety
and the degree to which the inputs are observable. The significance levels are classified as follows in the fair value hierarchy:
Level 1 – Quoted prices (unadjusted) in active markets for identical assets or liabilities;
Level 2 – Inputs other than quoted prices included in Level 1 that are observable for the asset or liability, either directly or
indirectly; and
Level 3 – Inputs for the asset or liability that are not based on observable market data.
Transfers between levels of the fair value hierarchy are recognized by the Corporation at the end of the reporting period during which
the transfer occurred.
Cash and cash equivalents
Cash and cash equivalents comprise cash in hand, bank deposits and other short-term highly liquid investments with maturities of three
months or less, which are generally used by the Corporation to meet short-term liquidity requirements.
Leases
Leases are classified as finance leases whenever the terms of the lease transfer substantially all the risks and rewards of ownership to
the lessee. All other leases are classified as operating leases. The Corporation assessed all its leases to be operating leases.

19
The Corporation as lessor
Rental income from operating leases is recognized on a straight-line basis over the term of the relevant lease. Initial direct costs incurred
in negotiating and arranging an operating lease are added to the carrying amount of the leased asset and recognized on a straight-line
basis over the lease term.
The Corporation as lessee
Rents payable under operating leases are recognized as an expense on a straight-line basis over the term of the relevant lease except
where another more systematic basis is more representative of the time pattern in which economic benefits from the leased asset are
consumed. Contingent rentals arising under operating leases are recognized as an expense in the period in which they are incurred.
In the event that lease incentives are received to enter into operating leases, such incentives are recognized as a liability. The aggregate
benefit of any such incentive is recognized as a reduction of rental expense on a straight-line basis over the lease term, except where
another systematic basis is more representative of the time pattern in which economic benefits from the leased asset are consumed.
Prepaid Expenses and Deposits
Prepaid expenses and deposits consist of amounts paid in advance or deposits made for which the Corporation will receive goods or
services.
Property and Equipment
Property and equipment which have finite lives are recorded at cost less accumulated depreciation and impairment losses. Depreciation
is expensed from the month the particular asset is available for use, over the estimated useful life of such asset at the following rates,
which in each case are intended to reduce the carrying value of the asset to the estimated residual value:
Furniture and fixtures Straight-line 4-10 years
Computer equipment Straight-line 2-5 years
Building Straight-line 25 years
Intangible Assets
Intangible assets which have finite lives are recorded at cost less accumulated amortization and impairment losses. Amortization is
expensed from the month the particular asset is available for use, over the estimated useful life of such asset at the following rates, which
in each case are intended to reduce the carrying value of the asset to the estimated residual value:
Software technology (including deferred
development costs)
Straight-line 5 years
Software technology (Defensive intangible asset) Straight-line 2 years
Customer relationships Straight-line 15 years
Brands (licensed) Straight-line 22 years
Brands N/A Indefinite useful life
Other intangibles Straight-line 4-10 years
The amortization method, useful life and residual values are assessed annually and the assets are tested for impairment, whenever events
or changes in circumstances indicate that the carrying amount may not be recoverable.
Upon retirement or disposal, the cost of the asset disposed of and the related accumulated amortization are removed from the
consolidated statements of financial position and any gain or loss is reflected in the consolidated statements of (loss) earnings.
Expenditures for repairs and maintenance are expensed as incurred.
The Corporation determined that its owned brands have indefinite useful lives as they have no foreseeable limit to the period over which
such assets are expected to contribute to the Corporation’s cash flows. In addition, the Corporation expects to continue to support its
brands with ongoing marketing efforts.
The Corporation tests its owned brands for impairment at least annually, or more frequently if circumstances such as significant declines
in expected sales, net earnings or cash flows indicate that the cash-generating units (“CGUs”) to which such brands relate might be
impaired.
Goodwill
Goodwill represents the excess of the purchase price over the fair value of the identifiable net assets acquired in a business acquisition.
After initial recognition, goodwill is measured at cost less any accumulated impairment losses.
20
Goodwill is tested for impairment at least annually, or more frequently if circumstances such as significant declines in expected sales,
net earnings or cash flows indicate that that the CGUs or group of CGUs to which goodwill is allocated might be impaired. The
Corporation monitors and tests goodwill for impairment at the operating segment level.
Research and Development
Research and development costs are expensed except in cases where development costs meet certain identifiable criteria for deferral.
Deferred development costs, which have probable future economic benefits, can be clearly defined and measured, and are incurred for
the development of new products or technologies, are capitalized. These development costs, net of related research and development
investment tax credits, are not amortized until the products or technologies are commercialized or when the asset is available for use, at
which time, they are amortized over the estimated life of the commercial production of such products or technologies.
The amortization method and the life of the commercial production are assessed annually and the assets are tested for impairment
whenever an indication exists that an asset might be impaired.
The Corporation claims research and development investment tax credits as a result of incurring scientific research and experimental
development expenditures. Research and development investment tax credits are recognized when the related expenditures are incurred
and there is reasonable assurance of their realization. Investment tax credits are accounted for by the cost reduction method whereby the
amounts of tax credits are applied as a reduction of the expense or deferred development costs.
Investments
Investments are stated at the lower of cost and fair market value. Cost is determined on a weighted average basis at a consolidated level.
Investments in Associates
An associate is an entity over which the Corporation has significant influence and that is neither a subsidiary nor an interest in a joint venture. Significant influence is the power to participate in the financial and operating policy decisions of the associate but is not the control or joint control over those policy decisions.
The results and assets and liabilities of associates are incorporated in these consolidated financial statements using the equity method of accounting, except when the investment is classified as held for sale, in which case it is accounted for in accordance with IFRS 5, Non-current Assets Held for Sale and Discontinued Operations.
Under the equity method, an investment in an associate is initially recognized in the consolidated statements of financial position at cost and adjusted thereafter to recognize the Corporation’s share of the profit or loss and other comprehensive income of the associate. When the Corporation's share of losses of an associate exceeds the Corporation's interest in that associate (which includes any long-term interests that, in substance, form part of the Corporation's net investment in the associate), the Corporation discontinues recognizing its share of further losses. Additional losses are recognized only to the extent that the Corporation has incurred legal or constructive obligations or made payments on behalf of the associate.
An investment in an associate is accounted for using the equity method from the date on which the investee becomes an associate. On acquisition of the investment in an associate, any excess of the cost of the investment over the Corporation's share of the net fair value of the identifiable assets and liabilities of the associate is recognized as goodwill, which is included within the carrying amount of the investment. Any excess of the Corporation's share of the net fair value of the identifiable assets and liabilities over the cost of the investment, after reassessment, is recognized immediately in the consolidated statements of (loss) earnings in the period in which the investment is acquired.
The requirements of IAS 36, Impairment of Assets (“IAS 36”) are applied to determine whether it is necessary to recognize any impairment loss with respect to the Corporation’s investment in an associate. When necessary, the entire carrying amount of the investment (including goodwill) is tested for impairment as a single asset by comparing its recoverable amount (higher of value in use and fair value less costs of disposal) with its carrying amount, any impairment loss recognized forms part of the carrying amount of the investment. Any reversal of that impairment loss is recognized to the extent that the recoverable amount of the investment subsequently increases.
Impairment of Non-Current Assets
Management assesses, at the end of the reporting period, whether there is an indication that an asset may be impaired. If any indication
exists, or when annual impairment testing for an asset is required, the Corporation estimates the asset’s recoverable amount. An asset’s
or CGU’s recoverable amount is the higher of the asset’s or CGU’s fair value less costs of disposal and its value in use. When the
carrying amount of an asset or CGU exceeds its recoverable amount, the asset is considered impaired and is written down to its
recoverable amount.
In assessing value in use, the estimated future cash flows are discounted to their present value using a pre-tax discount rate that reflects
current market assessments of the time value of money and the risks specific to the asset. In determining fair value less costs of disposal,
recent market transactions are taken into account. If no such transactions can be identified, an appropriate valuation model is used. These
calculations are corroborated by valuation multiples, quoted share prices for publicly traded companies or other available fair value
indicators.

21
The Corporation bases its impairment calculation on detailed budgets and forecast calculations, which are prepared for the Corporation’s
assets or CGU to which such assets are allocated. These budgets and forecast calculations generally cover a period of three to five years.
A long-term growth rate is calculated and applied to project future cash flows after the final year included in the forecast.
Impairment losses of continuing operations are recognized in the consolidated statements of (loss) earnings in expense categories
consistent with the function of the impaired asset. An impairment loss recognized for goodwill may not be reversed. At the end of the
reporting period, the Corporation assesses if there is an indication that impairment losses recognized in previous periods for other assets
have decreased or no longer exist. Where an impairment loss is subsequently reversed, the carrying amount of the asset or CGU is
increased to the revised estimate of its recoverable amount provided that the increased carrying amount does not exceed the carrying
amount that would have been determined had no impairment loss been recognized in prior years. A reversal of an impairment loss is
recognized immediately in profit or loss, unless the relevant asset is carried at a revalued amount, in which case the reversal of the
impairment loss is treated as a revaluation increase.
Taxation
Income tax expense represents the sum of current and deferred taxes. Current and deferred taxes are recognized in the consolidated
statements of (loss) earnings, except to the extent they relate to items recognized in the consolidated statements of comprehensive (loss)
income or directly in the consolidated statements of changes in equity.
Current tax
Current tax payable is based on taxable income for the year. Taxable income differs from earnings as reported in the consolidated
statements of (loss) earnings because of items of income or expense that are taxable or deductible in other years and items that are never
taxable or deductible. The Corporation’s liability for current tax is calculated using tax rates that have been enacted or substantively
enacted by the end of the particular reporting period.
Deferred tax
Deferred tax is recognized on temporary differences between the carrying amounts of assets and liabilities in the Corporation’s consolidated financial statements and the corresponding tax bases used in the computation of taxable income. Deferred tax liabilities are generally recognized for all taxable temporary differences. Deferred tax assets are recognized for all deductible temporary differences to the extent that it is probable that taxable income will be available against which those deductible temporary differences can be utilized. Such deferred tax assets and liabilities are not recognized if the temporary difference arises from the initial recognition of goodwill or from the initial recognition (other than in a business combination) of other assets and liabilities in a transaction that affects neither the taxable income nor the accounting earnings.
Deferred tax liabilities are recognized for taxable temporary differences associated with investments and interests in subsidiaries and associates, except where the Corporation is able to control the reversal of the temporary difference and it is probable that the temporary difference will not reverse in the foreseeable future. Deferred tax assets arising from deductible temporary differences associated with such investments and interests are only recognized to the extent that it is probable that there will be sufficient taxable income against which to utilize the benefits of the temporary differences and they are expected to reverse in the foreseeable future.
The carrying amount of deferred tax assets is reviewed at the end of each reporting period and reduced to the extent that it is no longer probable that sufficient taxable income will be available to allow all or part of any such asset to be recovered.
Deferred tax assets and liabilities are measured at the tax rates that are expected to apply in the period in which the liability is settled or the asset is realized, in each case based on tax rates and tax laws that have been enacted or substantively enacted by the end of the reporting period. The measurement of deferred tax liabilities and assets reflects the tax consequences that would follow from the manner in which the Corporation expects, at the end of the particular reporting period, to recover or settle the carrying amount of its assets and liabilities.
Deferred tax assets and liabilities are offset when there is a legally enforceable right to set off current tax assets against current tax liabilities and when they relate to income taxes levied by the same taxation authority and the Corporation intends to settle its current tax assets and liabilities on a net basis. Deferred tax assets and liabilities are not discounted. Current and deferred tax are recognized in the consolidated statements of (loss) earnings, except when they relate to items that are recognized in other comprehensive income or directly in equity, in which case, the current and deferred tax are also recognized in other comprehensive income or directly in equity, respectively. Where current tax or deferred tax arises from the initial accounting for a business combination, the tax effect is included in the accounting for the business combination.
Share based payments
The Corporation maintains an equity-based long-term incentive award program to align interests of its management team with those of its Shareholders by focusing the management team on long-term objectives over a multi-year period, with the value of the award fluctuating based on stock price appreciation. The Corporation has two equity-based award plans and accounts for grants under these plans in accordance with the fair value-based method of accounting for stock-based compensation for the applicable period. The Corporation currently makes its equity grants under its Equity Incentive Plan dated June 22, 2015 (the “2015 Equity Incentive Plan”), which provides for grants of stock options (“Options”), Restricted Share Units (“RSU”), Deferred Share Units (“DSU”), Performance
22
Share Units (“PSU”), Restricted Shares (“RS”), and other Common Share-based awards as the Board may determine. Prior to the Corporation’s 2015 annual shareholder meeting (the “2015 Annual Meeting”), equity-based awards were granted solely under the Corporation’s 2010 stock option plan, as amended from time to time (the “2010 Stock Option Plan” and together with the 2015 Equity Incentive Plan, the “Plans”) and consisted only of Options. The Corporation no longer grants Options under the 2010 Stock Option Plan, but it remains in effect only to govern the terms of outstanding Options granted prior to the date of the 2015 Annual Meeting.
Effective for 2017, the Corporation replaced the stock option component of the long-term incentive program for its management team
with a regular, annual grant program that is comprised of PSUs and RSUs. The RSUs are subject to service vesting conditions and the
PSUs are subject to service, market and non-market vesting conditions. The Corporation also offers DSUs, RSUs and RS for members
of its Board of Directors.
Non-employee equity-settled share-based payments are measured at the fair value of the goods and services received, except where that
fair value cannot be estimated reliably. If the fair value cannot be measured reliably, non-employee equity-settled share-based payments
are measured at the fair value of the equity instrument granted as measured at the date the entity obtains the goods or the counterparty
renders the service. Stock-based compensation expense is recognized over the contract life of the options or the option settlement date,
whichever is earlier.
Stock Options
Compensation expense for equity-settled stock options awarded to participants under the Plans is measured at the fair value at the grant date using the Black-Scholes-Merton valuation model and is recognized using the graded vesting method over the vesting period of the options granted. Stock-based compensation expense recognized is adjusted to reflect the number of options that have been estimated by management for which conditions attaching to service will be fulfilled as of the grant date until the vesting date so that the recognized expense corresponds to the options that have vested. Stock-based compensation expense is recorded in the equity reserve when the expense is recognized in the consolidated statements of (loss) earnings. When options are exercised, any consideration received from participants as well as the related compensation cost recorded within the equity reserve are credited to share capital.
Other equity-settled share based payments
Restricted Share Units
An RSU is a unit equivalent in value to a Common Share which entitles the holder to receive Common Shares after a specified vesting period determined by the Plan Administrator of the 2015 Equity Incentive Plan (the “Plan Administrator”), in its sole discretion. Upon settlement, holders will receive one fully paid Common Share in respect of each vested RSU. Generally, the RSUs vest in equal annual installments over a three or four-year period (graded vesting method), and subject to continued employment through each vesting date.
Performance Share Units
A PSU is a unit equivalent in value to a Common Share which entitles the holder to receive Common Shares based on the achievement of performance goals established by the Plan Administrator, including in consultation with management, over a performance period. Generally, the PSUs vest on the third anniversary of the date of the grant (cliff vesting), and based on a weighted mix of revenue and Adjusted EBITDA targets of the Corporation for the applicable three-year performance period as well as the individual remaining employed by, or continuing to provide services to, the Corporation. The grantee is eligible for additional PSUs (the “Additional PSUs”) up to 50% of the PSUs granted on the grant date, subject to an additional total shareholder return condition (the “TSR Condition”), and to the extent the other service and performance conditions are met. The Additional PSUs have service, non-market and market (i.e., the TSR Condition) vesting conditions, all of which must be satisfied to vest.
Upon settlement, holders will receive fully paid Common Shares in proportion to the number of vested PSUs held and the level of performance achieved. Any unearned PSUs will be forfeited.
Deferred Share Units
The Corporation offers DSU grants to the members of the Board. Upon settlement, holders will receive one fully paid Common Share in respect of each vested DSU. The Corporation recognizes services received in a share-based payment transaction as an expense over the requisite service period and recognizes a corresponding increase in equity as the services are received. DSUs vest immediately or over either a one-, two- or three-year period. The grant date is the date on which the Corporation and the Directors have a shared understanding of all the terms and conditions of the arrangement. If the grant date occurs after the service commencement date, then the Corporation estimates the grant-date fair value of the DSUs for the purpose of recognizing the expense from the service commencement date until the accounting grant date. All grants are subject to forfeiture if the director ceases to serve as a director prior to vesting and vested DSUs can only be settled at such time.
Restricted Shares
An RS is a fully paid Common Share that is subject to restrictions on transfer and a risk of forfeiture for a period of time, and which shall be held by the Corporation or its designee in escrow until such time as the restricted period lapses. The Plan Administrator shall have the authority to determine at the time of grant, the duration of the restricted period and other restrictions applicable to the restricted Common Shares. Except for the restrictions applicable to the restricted Common Shares, during the restricted period, the holder shall have all the rights and privileges of a holder of Common Shares as to the restricted Common Shares, including the right to vote. All previously outstanding RS vested and were settled during the year ended December 31, 2017.
23
With respect to RS, RSUs, PSUs and DSUs, the Corporation doesn’t currently expect to pay any dividends during the vesting period. Therefore, the fair market value of a RS, RSU, PSU or DSU is equal to the market price of the underlying Common Share at the grant date. On the grant date, the fair value of the awards is measured using the closing TSX stock price, or the closing Nasdaq stock price if the Common Shares are not traded on the TSX. The fair market value of the Additional PSUs is determined using a simulation based valuation to reflect the probability of the market condition being met. The service and non-market conditions, do not affect the fair value of the awards at grant date. Market conditions are reflected as an adjustment (discount) to the initial estimate of fair value at grant date of the instrument to be received and there is no true-up for differences between estimated and actual vesting due to market conditions.
Share-based compensation expense is recognized over the vesting period in the consolidated statements of (loss) earnings with a corresponding increase to the equity reserve. Once the awards vest and are settled with the counterparty, the related amount recorded within the equity reserves is credited to share capital.
Dividend Equivalents
RS, RSUs, PSUs and DSUs may be credited with dividend equivalents in the form of additional RS, RSUs, PSUs, DSUs and other share-based awards, as applicable. Dividend equivalents shall vest in proportion to the awards to which they relate. Such dividend equivalents shall be computed by dividing: (i) the amount obtained by multiplying the amount of the dividend declared and paid per Common Share by the number of RS, RSUs, PSUs, DSUs or other share-based awards, as applicable, held by the participant on the record date for the payment of such dividend, by (ii) the highest closing price of the Common Shares on any stock exchange on which the Common Shares are then listed on the date of grant, at the close of the first business day immediately following the dividend record-date.
Provisions
Provisions represent liabilities of the Corporation for which the amount or timing of payment is uncertain. Provisions are recognized when the Corporation has a present legal or constructive obligation as a result of past events, it is probable that an outflow of resources will be required to settle the obligation, and the amount can be reliably estimated. Provisions are measured at the present value of the expected expenditures required to settle the obligation using a discount rate that reflects current market assessments of the time value of money and the risks specific to the obligation. The increase in provisions due to the passage of time is recognized in interest accretion within net financing charges on the consolidated statements of (loss) earnings.
Contingent liabilities
Contingent liabilities are possible obligations the existence of which will be confirmed by uncertain future events that are not wholly within the control of the entity. Contingent liabilities also include obligations that are not recognized because their amount cannot be measured reliably or because settlement is not probable. A contingent liability is not recognized in the consolidated statements of financial position. However, unless the possibility of an outflow of economic resources is remote, a contingent liability is disclosed in the notes.
Translation of Foreign Operations and Foreign Currency Transactions
Functional and presentation currency
IFRS requires entities to consider primary and secondary indicators when determining functional currency. Primary indicators are closely linked to the primary economic environment in which the entity operates and are given more weight. Secondary indicators provide supporting evidence to determine an entity’s functional currency. Once the functional currency of an entity is determined, it should be used consistently, unless significant changes in economic factors, events and conditions indicate that the functional currency has changed.
A change in functional currency is accounted for prospectively from the date of the change by translating all items into the new functional
currency using the exchange rate at the date of the change.
Based on an analysis of the primary and secondary indicators, the functional currency of each of the Corporation and its subsidiaries
have been determined. The functional currency of the Corporation is CDN. The Corporation’s consolidated financial statements are
presented in U.S. dollars.
Transactions and balances
Foreign currency transactions are translated into the applicable functional currency using the exchange rates prevailing on the dates of
the transactions or valuation where items are re-measured. Foreign exchange gains and losses resulting from the settlement of such
transactions and from the translation at year-end exchange rates of monetary assets and liabilities denominated in foreign currencies are
recognized within general and administrative expenses.

24
Group companies
The results and financial position of the Corporation’s subsidiaries that have a functional currency different from the Corporation’s
presentation currency are translated into the presentation currency as follows:
(i) assets and liabilities for each statement of financial position presented are translated at the closing exchange rate on the date of
that statement of financial position;
(ii) income and expenses for each statement of net (loss) earnings and statement of other comprehensive (loss) income are translated
at the rates of exchange prevailing on the dates of the transactions; and
(iii) all resulting exchange rate differences are recognized in other comprehensive (loss) income and are transferred to net (loss)
earnings upon the sale or disposition of subsidiaries.
Business Combinations
Business combinations are accounted for using the acquisition method. Under this method, the identifiable assets acquired and liabilities
assumed, including contingent liabilities, are recognized in the consolidated statements of financial position at their respective fair
values. Goodwill is recorded based on the excess of the fair value of the consideration transferred over the fair value of the Corporation’s
interest in the acquiree’s net identifiable assets on the date of the acquisition. Any excess of the identifiable net assets over the
consideration transferred is immediately recognized in the consolidated statements of (loss) earnings.
The consideration transferred by the Corporation to acquire control of an entity is calculated as the sum of the acquisition-date fair
values of the assets transferred, liabilities incurred and equity interests issued by the Corporation, including the fair value of all the assets
and liabilities resulting from a deferred contingent payment arrangement. Acquisition-related costs are expensed as incurred.
Operating Segments
Segments are reported in a manner consistent with the internal reporting provided to the Corporation’s Chief Operating Decision Maker
(“CODM”). The Corporation’s CODM consists of its Chief Executive Officer, Chief Financial Officer and Chief Corporate
Development Officer, as this group is responsible for allocating resources to, and assessing the performance of, the operating segments
of the Corporation.
Key sources of estimation uncertainty
Determining the carrying amounts of some assets and liabilities requires estimation of the effects of uncertain future events on those
assets and liabilities at the end of the reporting period. The following discussion sets forth key sources of estimation uncertainty at the
end of the reporting period, that management believes have a significant risk of resulting in a material adjustment to the carrying amounts
of assets and liabilities within the next financial year.
Goodwill impairment
At least annually, the Corporation tests whether goodwill is subject to any impairment in accordance with the applicable accounting
policy set forth in note 2.
The Corporation applied judgment in the allocation of goodwill to the identified cash-generating units (“CGUs”). Prior to the SBG
Acquisition, the Corporation identified potential synergy benefits that management estimated would be realized in both the International
and United Kingdom CGUs and accordingly attributed a portion of the goodwill recognized from the SBG Acquisition to the
International CGU for impairment testing purposes, given the synergies were taken into account when determining an appropriate
purchase price. The annual recurring synergy benefit applicable to each CGU was calculated and the net present value of this recurring
benefit to each CGU was used to allocate the appropriate proportion of goodwill accordingly.
The recoverable amount for any CGU or group of CGUs is determined based on the higher of fair value less costs to sell and value in
use. Both valuation approaches require management to use judgments and estimates. Goodwill impairment exists when the carrying
value of a CGU or group of CGUs exceeds its recoverable amount. Estimates used in determining the recoverable amount include but
are not limited to expected cash flows, growth rates, capital expenditures and discount rates. A change in future earnings or any other
assumptions may have a material impact on the fair value of the CGU or group of CGUs, and could result in an impairment loss. See
note 11.
Valuation of deferred contingent payment on acquisition of non-controlling interest
As part of the incremental acquisition of an 18% equity interest in BetEasy, BetEasy’s management team will be entitled to an additional
payment of up to AUD 239 million in 2020, subject to certain performance conditions primarily related to its EBITDA, and payable in
cash and/or additional Common Shares at The Stars Group’s discretion. The Corporation considered this additional payment to be a
contingent consideration and accounted for it as part of the purchase price related to the acquisition of the 18% equity interest in BetEasy.
The deferred contingent payment is subsequently recorded at fair value at each balance sheet date, with re-measurements recorded within
net financing charges in the consolidated statements of (loss) earnings. In valuing the deferred contingent payment as at December 31,

25
2018, the Corporation used a discount rate of 10.5%, considering the term of the deferred contingent payment period and credit risk.
The Corporation applied a volatility of historical EBITDA for comparable companies of 25%, which was based on historical
performance and market indicators. See notes 5 and 26.
Uncertain tax positions
Determining the Corporation’s income tax and its provisions for income taxes involves a significant degree of estimation and judgment,
particularly in respect of open tax returns relating to prior years where the liabilities remain to be agreed with the local tax authorities.
The Corporation is also subject to tax authority audits and has a number of open tax enquiries. As a result, it has recognized a number
of provisions against uncertain tax positions that are recognized based on management’s best estimate of the outcome after taking into
consideration all available evidence, and where appropriate, after taking external advice. The tax provisions recorded in the
Corporation’s consolidated financial statements in respect of prior years relate to intercompany trading and financing arrangements
entered into in the normal course of business and tax audits that are currently in progress with fiscal authorities. Due to the uncertainty
associated with such tax items it is possible that at a future date, on resolution of the open tax matters, the final outcome may vary
significantly and there is the potential for a material adjustment to the carrying amounts of the liability recorded as a result of this
estimation uncertainty.
Critical accounting estimates and judgments
The preparation of the Corporation’s consolidated financial statements requires management to make estimates and assumptions
concerning the future. It also requires management to exercise its judgment in applying the Corporation’s accounting policies. Estimates
and judgments are continuously evaluated and are based on historical experience, general economic conditions, and trends and other
factors, including expectations of future events.
Estimates and their underlying assumptions are reviewed on a regular basis and the effects of any changes are recognized immediately.
Changes in the status of certain facts or circumstances could result in material changes to the estimates used in the preparation of the
consolidated financial statements and actual results could differ from the Corporation’s estimates.
The following discussion sets forth what management believes to be the most significant estimates and assumptions in determining the
value of assets and liabilities and the most significant judgments in applying the Corporation’s accounting policies.
Determination of purchase price allocations and deferred contingent payments
Management makes certain judgments and estimates in the recognition and measurement of assets and liabilities, including separately
identifiable intangibles acquired as part of a business combination. Further, management also makes judgments and estimates in
determining the value of deferred contingent payments that should be recorded as part of the consideration on the date of acquisition
and changes in deferred contingent payments payable in subsequent reporting periods. The deferred contingent payment relating to the
incremental acquisition of an 18% equity interest in BetEasy is discussed above in key sources of estimation uncertainty and in note 26.
Business combinations may result in the recognition of certain intangible assets, recognized at fair value, including but not limited to,
software technology, customer relationships, below market significant contracts, and brands. Judgment is applied in the identification
of “identifiable” intangible assets which requires that an asset must be separable or must arise from contractual or other legal rights to
distinguish it from goodwill. Specifically, customer relationships recognized in respect of the SBG Acquisition and the Australian
Acquisitions are primarily in respect of non-contractual relationships from which the acquired companies have a practice and history of
establishing contracts (i.e., customers that have previously engaged in online gaming transactions and are expected to engage in future
online gaming transactions)
Key estimates made by management in connection with the measurement of acquired intangible assets relating to the SBG Acquisition
and the Australian Acquisitions, included:
(i) Discount rates – The Corporation used discount rates ranging from 7% to 10%.
(ii) Attrition rates – The Corporation valued certain intangibles using estimated attrition rates ranging from 3% to 10%.
(iii) Technology migration – The Corporation valued technology intangibles using estimated useful lives of 5 to 7 years based on
the planned migration towards newer developed technology.
(iv) Technology royalty rate – The Corporation valued certain technology intangibles using royalty rates ranging from 5% to 10%.
(v) Brand royalty rate – The Corporation valued brands using royalty rates ranging from 2.5% to 5%.
(vi) Estimating future cash flows – The Corporation considered historical performance and industry assessments among other
sources in the estimation of the cash flows. Significant estimation uncertainty exists with respect to forecasting and growth
assumptions used in the valuation of intangibles.
26
Acquisition of BetEasy – Control assessment
The Corporation acquired a 62% equity interest in BetEasy on February 27, 2018, and a further 18% equity interest on April 24, 2018.
As is typical, the shareholders agreement entered into with the minority shareholders of BetEasy in connection with these transactions
includes a number of rights and protections for the minority shareholders in certain circumstances that are directly harmful to the
minority, including as it relates to significant changes to business scope, material acquisitions or financing. In the Corporation’s
judgment such minority shareholder rights are protective rights and the Corporation has control in accordance with IFRS 3, Business
Combinations.
Useful lives of long-lived assets
Estimates are used for each component of an asset’s useful life and is based on an analysis of all pertinent factors including, but not
limited to, the expected use of the asset and, in the case of intangible assets, where applicable, contractual provisions that enable the
renewal or extension of the asset’s legal or contractual life without substantial cost, as well as renewal history or the expected period of
future benefit of the intangible asset. Incorrect estimates of useful lives could result in an increase or decrease in the annual amortization
expense and future impairment charges.
As noted above, the Corporation acquired significant intangible assets in connection with the SBG Acquisition and the Australian
Acquisition. Management used estimates in determining the useful lives for these acquired intangible assets using information regarding,
among other things, details of the contractual terms, historical customer activity and attrition, forecasted cash flow information, and
market conditions and trends.
Debt extinguishment
The Corporation applied judgment in determining whether transactions related to its long-term debt during the period should be classified
as an extinguishment or modification of such debt. The Corporation considers long-term debt that is pre-payable with no significant
termination costs as being extinguished when contractual amendments are made. As discussed in note 17, on April 6, 2018, the
Corporation amended its long-term debt in connection with the Australian Acquisitions and recorded the amendment as an
extinguishment for accounting purposes as the debt was repayable at par, and no termination costs were incurred. On July 10, 2018, the
Corporation’s previous first lien term loans were repaid in full and the transaction was recorded as an extinguishment for accounting
purposes. No termination costs were incurred upon repayment.
Recognition and valuation of embedded derivatives
The Senior Notes (as defined below) include certain embedded features allowing the Corporation to redeem the Senior Notes or allowing
the holders to require a redemption of the Senior Notes. The Corporation applied its judgment in determining whether the features
represent embedded derivatives required to be bifurcated from the carrying value of the Senior Notes, including in relation to the
assessment of whether the features are closely related to the host contract (i.e., the Indenture (as defined below) governing the Senior
Notes). The Corporation considers redemption features with fixed redemption prices over a series of redemption dates as a single feature
for assessing whether the feature is closely related to the host contract. The Corporation also considers embedded features with the same
underlying risk exposure (i.e., interest rate risk exposure) as a combined derivative instrument for measurement, presentation and
disclosure. Certain features were bifurcated from the carrying value of the Senior Notes. Management used estimates, including an
implied credit spread of 3.8% as at December 31, 2018, in determining the fair value of the embedded derivatives. See notes 17, 19 and
26.
Functional currency
The Corporation’s worldwide operations expose the Corporation to transactions denominated in a number of different currencies, which
are required to be translated into one currency for consolidated financial statement reporting purposes. The Corporation’s foreign
currency translation policy is designed to reflect the economic exposure of the Corporation’s operations to various currencies. The
functional currencies of the Corporation’s subsidiaries are assessed on a regular basis as the operations of the Corporation evolve or as
result of business combinations or expansions. The functional currency of an operation or subsidiary is the currency of the primary
economic environment to which it is exposed.
Following the SBG Acquisition and the Australian Acquisitions, management applied judgment in determining the functional currencies
of the acquired subsidiaries and considered the impact of the acquisitions on the primary economic environment of the acquiring
subsidiaries. To determine the functional currencies, management considered the currency that influences sales prices of the goods and
services provided by the operations and the currency that influences the costs incurred by the operations. Where as a result of these
primary factors, the functional currency was not obvious, management examined secondary factors such as the currency in which funds
from financing are obtained, the currency in which cash receipts are retained and the levels of interactions with the parent company.
27
Contingent liabilities
The Corporation reviews outstanding legal cases following developments in legal proceedings at each balance sheet date, considering,
among other things: the nature of the litigation, claim or assessment; the legal processes and potential level of damages in the jurisdiction
in which the litigation, claim or assessment has been brought; the progress of the case (including progress after the date of the
consolidated financial statements but before those statements are issued); the opinions or views of legal counsel and other advisors;
experience of similar cases; and any decision of the Corporation’s management as to how it will respond to the litigation, claim or
assessment. The Corporation assesses the probability of an outflow of resources to settle the obligation as well as if the outflow can be
reliably measured. If these conditions are not met, no provision will be recorded and the relevant facts will be disclosed as a contingent
liability. To the extent that the Corporation’s assessments at any time do not reflect subsequent developments or the eventual outcome
of any claim, its future consolidated financial statements may be materially affected, with a favourable or adverse impact on the
Corporation’s business, financial condition or results of operations. See note 28.
3. RECENT ACCOUNTING PRONOUNCEMENTS
New accounting pronouncements - not yet effective
IFRS 16, Leases
In 2016, the IASB issued IFRS 16, Leases (“IFRS 16”) replacing IAS 17, Leases (“IAS 17”) and related interpretations. The standard
introduces a single lease accounting model for lessees that requires on-balance sheet recognition and measurement. Lessees are required
to recognize right-of-use assets representing the right to use the underlying assets and a lease liability representing the obligation to
make lease payments. At the commencement date of a lease, a lessee will measure the present value of in substance fixed future lease
payments as right-of-use assets and lease liabilities. Lessees will be required to recognize the interest expense related to recognizing the
lease liability and the depreciation expense on the right-of-use asset. IFRS 16 substantially carries forward the lessor accounting
requirements from IAS 17.
IFRS 16 became effective for the Corporation on January 1, 2019 for reporting periods after that date. The Corporation intends to adopt
the standard by applying the requirements of the standard retrospectively with the cumulative effects of initial application recorded in
opening retained earnings as at January 1, 2019 using a modified retrospective approach with no restatement of the comparative period.
The Corporation will make use of the practical expedient available on transition to IFRS 16, that does not require it to reassess whether
a past contract is or contains a lease. Accordingly, the definition of a lease in accordance with IAS 17 and related interpretations will
continue to apply to the Corporation’s leases entered into or modified before January 1, 2019. The Corporation will also elect to use the
exemptions provided by the standard on lease contracts with durations of 12 months or less as of the date of initial application and for
leases of underlying assets with low value. Under IFRS 16, right-of-use assets will be tested for impairment in accordance with IAS 36.
This will replace the previous requirement to recognize a provision for onerous lease contracts. However, as a transition practical
expedient, the Corporation elected to rely on the assessment of whether leases are onerous by applying IAS 37, Provisions, Contingent
Liabilities and Contingent Assets immediately before the date of initial application as an alternative to performing an impairment review.
In preparation for the first-time adoption of IFRS 16, the Corporation has also carried out an implementation project which has led
management to conclude that that the new definition in IFRS 16 will not change significantly the scope of contracts that meet the
definition of a lease for the Corporation.
On initial application of IFRS 16, for all leases for which the Corporation is a lessee, the Corporation expects to recognize a right-of-
use asset in the range of $54.0 million to $58.0 million and a corresponding lease liability in the range of $57.0 million to $61.0 million
in the consolidated statements of financial position, initially measured at the present value of the future lease payments.
Subsequent to initial application of IFRS 16, there will be a decrease in rent expense and an increase in depreciation and net finance
charges. For short-term leases and leases of low-value assets, the Corporation will opt to recognize a lease expense on a straight-line
basis as permitted by IFRS 16. For the year ending December 31, 2019, the corporation currently expects an decrease to net (loss)
earnings in the form of a reduction to operating rental expenses of between $14.0 million and $16.0 million and an increase in
depreciation expenses of between $12.5 million to $14.5 million, each as reported in general and administrative expenses on the
consolidated statements of (loss) earnings as well as an increase to interest accretion expense of between $1.5 million to $2.5 million
reported in net financing charges on the consolidated statements of (loss) earnings.
At the date of finalizing these consolidated financial statements, management are completing their reviews across certain non-material
contracts. Some of these contracts may be identified as leases under IFRS 16 and if so, the right of use asset and lease liability may
increase accordingly. As the corporation has no finance leases, there will be no impact as a result of the adoption of IFRS 16 with respect
to the same.

28
International Financial Reporting Interpretations Committee 23, Uncertainty over Income Tax Treatments (“IFRIC 23”)
In June 2017, the IASB published IFRIC 23, effective for annual periods beginning on or after January 1, 2019. The interpretation
requires an entity to assess whether it is probable that a tax authority will accept an uncertain tax treatment used, or proposed to be used,
by an entity in its income tax filings and to exercise judgment in determining whether each tax treatment should be considered
independently or whether some tax treatments should be considered together. The decision should be based on which approach provides
better predictions of the resolution of the uncertainty. An entity also has to consider whether it is probable that the relevant authority
will accept each tax treatment, or group of tax treatments, assuming that the taxation authority with the right to examine any amounts
reported to it will examine those amounts and will have full knowledge of all relevant information when doing so.
The Corporation intends to adopt the interpretation by applying the requirements retrospectively with the cumulative effects of initial
application recorded in opening retained earnings as at January 1, 2019 using a modified retrospective approach with no restatement of
the comparative period. The Corporation believes that the adoption of the interpretation will not have a material impact to the
consolidated financial statements.
4. ADOPTION OF NEW ACCOUNTING STANDARDS
IFRS 9, Financial Instruments
As referenced in note 2 above, the Corporation adopted IFRS 9 on January 1, 2018. As permitted by IFRS 9, the Corporation elected to
continue to apply the hedge accounting requirements of IAS 39 rather than the new requirements of IFRS 9 and will comply with the
revised annual hedge accounting disclosures as required by the related amendments to IFRS 7. The impact of the Corporation’s transition
to IFRS 9 is summarized below.
Classification of financial assets
As of January 1, 2018, management assessed which business models apply to the financial assets held by the Corporation and classified
those financial assets into the appropriate IFRS 9 categories as follows:
Financial assets - January 1, 2018 In thousands of U.S.
Dollars Available-for-
sale FVTPL FVOCI Total financial
assets
Opening balance - IAS 39 129,650 — — 129,650
Reclassification of bonds from Available-for-sale to FVOCI (115,343 ) — 115,343 —
Reclassification of funds from Available-for-sale to FVTPL (7,045 ) 7,045 — —
Reclassification of equity in unquoted companies from Available-
for-sale to FVTPL (6,981 ) 6,981 — —
Reclassification of equity in quoted companies from Available-for-
sale to FVTPL (281 ) 281 — —
Opening balance - IFRS 9 — 14,307 115,343 129,650
Impairment of financial assets
The Corporation holds three types of financial assets subject to the new expected credit losses model applicable under IFRS 9 as follows:
(i) Trade receivables carried at amortized cost; (ii) Debt instruments carried at FVOCI; and (iii) Other financial assets carried at
amortized cost.
The Corporation was required to revise its impairment methodology upon adoption of IFRS 9 for each of these classes of financial
assets. The impact of the change in impairment methodology on the opening carrying amounts of these financial assets and the opening
balance of retained earnings is disclosed in the measurement of financial instruments table below.
The nature of the Corporation’s business does not generate significant receivables and its investments are considered low risk as it
pursues an investment strategy that only permits highly liquid investments with reputable financial institutions.
Financial liabilities – debt modification
The Corporation was required to adjust the carrying amount of its existing long-term debt in respect of historic debt modifications upon
adoption of IFRS 9. The adjustment required in respect of each of the historic debt modifications was calculated as the difference
between the present value of the original contractual cash flows and the modified cash flows discounted at the original effective interest
rate. This differs from the treatment under IAS 39, which required an adjustment to the prevailing effective interest rate on the loan
rather than an adjustment to the carrying amount.

29
The impact of the change in treatment of historic debt modifications on the carrying amount of long-term debt and the opening balance
of retained earnings is disclosed in the measurement of financial instruments table below.
Measurement of financial instruments
The table below illustrates the result of adoption of IFRS 9 as of January 1, 2018, and the measurement impact on the respective
categories of financial instruments:
Measurement Category Carrying amount
In thousands of U.S. Dollars
Original
(IAS 39) New
(IFRS 9) Original
(IAS 39) New
(IFRS 9)
Adjustment to
opening retained
earnings
Bonds Available-for-sale FVOCI 115,343 115,343 213
Funds Available-for-sale FVTPL 7,045 7,045 —
Equity in unquoted companies Available-for-sale FVTPL 6,981 8,767 (1,786 )
Equity in quoted companies Available-for-sale FVTPL 281 281 —
Trade receivables Loans and
receivables Amortized cost
112,227 111,435 792
Cash and restricted cash Loans and
receivables Amortized cost
564,018 563,037 981
Long-term debt Amortized cost Amortized cost (2,358,569 ) (2,314,675 ) (43,894 )
(1,552,674 ) (1,508,767 ) (43,694 )
The Corporation has not designated any financial assets that meet the criteria for classification at amortized cost or FVOCI as FVTPL
on initial recognition. Prior to the application of IFRS 9, the Corporation did not have a material impairment allowance recorded in
respect of financial instruments. The adoption of IFRS 9 did not have a material impact on the impairment allowance recorded.
IFRS 15, Revenue from contracts with customers
As referenced in note 2 above, the Corporation adopted IFRS 15, Revenue from contracts with customers on January 1, 2018. The
adoption of IFRS 15 did not have a material impact on the timing and amount of revenue recognized by the Corporation.
The Corporation amended the presentation and disclosure of total revenue as a result of the requirement under IFRS 15 to show revenue
from contracts with customers separately from other sources of revenue. See note 6. Notwithstanding the presentation and disclosure
requirement of IFRS 15 for total revenue, the Corporation presents disaggregated revenue disclosures within the segmental information
note including details by segment, major line of operation and geographical region. See note 7.
5. ACQUISITION OF SUBSIDIARIES
BetEasy
As previously announced on February 27, 2018, a subsidiary of the Corporation acquired a 62% controlling equity interest in BetEasy, which it increased to an 80% controlling equity interest on April 24, 2018 as described below. Pursuant to a shareholders agreement (the “Shareholders Agreement”), the Corporation is entitled to, among other things, appoint a majority of the directors on the board of directors of BetEasy. The Corporation therefore obtained control through acquiring the majority equity interest in combination with such rights. The non-controlling interest in BetEasy is measured at the proportionate share of net assets of the subsidiary. The Corporation believes the Australian Acquisitions provide the Corporation with a strong market position in Australia and creates an opportunity for cost synergies.
In connection with the 62% equity interest in BetEasy, the Corporation entered into a put option deed with an exercise price equal to the purchase price of the 62% equity interest in BetEasy, $117.7 million (AUD$150.0 million), plus interest. The put option was set to expire on the earlier of February 28, 2019 or the completion of BetEasy’s purchase of TSGA (the latter occurred on April 24, 2018 as described above). On expiration, the $0.6 million mark to market of this put option previously recognized was derecognized and recorded in general and administrative in the consolidated statements of (loss) earnings.
On April 24, 2018, the Corporation acquired a further 18% equity interest in BetEasy for a total consideration of $229.2 million, comprising cash of $48.2 million (AUD$63.2 million), newly issued Common Shares valued at $96.4 million, see note 24, and deferred contingent payment valued at $84.6 million (AUD$111.0 million) at acquisition, which is included in other long-term liabilities on the consolidated statements of financial position. See note 26 for details regarding the valuation of the deferred contingent payment. To finance the cash portion of the purchase price for the transaction, the Corporation obtained incremental financing as part of the April 2018 Amend and Extend. In addition, a shareholder loan was issued to certain non-controlling shareholders of BetEasy. See note 17. The acquisition of the additional equity interest in BetEasy had no impact on the fair values of the goodwill and intangible assets acquired on February 27, 2018; however, the excess of the total consideration compared to the carrying value of the 18% non-controlling interest was recognized directly in equity as acquisition reserve. See note 25.

30
Also on April 24, 2018, in connection with the Corporation’s acquisition of the additional 18% interest in BetEasy, the Corporation
entered into a non-controlling interest put-call option in relation to the 20% interest in BetEasy held by its minority interest shareholders,
with an exercise price based on certain future operating performance conditions of the acquired business. This was determined to be a
non-controlling interest put-call option with a variable settlement amount that can be settled in either cash or shares or a combination of
both, and because the put-call option does not clearly grant the Corporation with present access to returns associated with the remaining
20% ownership interest, the Corporation recognized this put-call option as a net liability derivative. As at each of the acquisition date
and December 31, 2018, the Corporation determined that the fair value of this non-controlling interest derivative was $nil.
The provisional amounts recognized in respect of the identifiable assets acquired and liabilities assumed upon acquisition of BetEasy
are set out in the table below:
In thousands of U.S. Dollars As at February 27, 2018
Financial assets 29,062
Property and equipment 6,079
Identifiable intangible assets (note 11) 102,406
Financial liabilities (59,327 )
Deferred tax liability (19,444 )
Total identifiable assets 58,776
Non-controlling interest (956 )
Goodwill (note 11) 59,887
Total consideration 117,707
Satisfied by:
Cash 117,707
Less: Cash and cash equivalent balances acquired (17,003 )
Net cash outflow arising on acquisition 100,704
The fair value of the financial assets includes receivables with a fair value of $4.7 million and a gross contractual value of $7.8 million.
The Corporation’s best estimate at the acquisition date of the contractual cash flows not to be collected is $3.1 million.
Included in the amounts recognized is a deferred tax liability of $19.4 million, comprised of a $26.1 million deferred tax liability related
to acquired intangible assets as well as a deferred tax asset of $6.7 million wholly related to other temporary differences.
The main factors leading to the recognition of goodwill as a result of the acquisition are the value inherent in the acquired business that
cannot be recognized as a separate asset under IFRS, including future incremental earnings potential resulting from further
diversification of the Corporation’s business geographically and the expansion of its online betting product offerings. The goodwill is
not deductible for tax purposes.
The Corporation has not completed its assessment or valuation of certain assets acquired and liabilities assumed in connection with the
acquisition. Therefore, the information disclosed above for identifiable intangible assets, financial assets, financial liabilities and
deferred tax liability is completed on a provisional basis and is subject to change based on further review of assumptions and if any new
information is obtained about facts and circumstances that existed as of the acquisition date.
TSGA
On April 24, 2018, BetEasy acquired 100% of TSGA.
31
The provisional amounts recognized in respect of the identifiable assets acquired and liabilities assumed are set out in the table below:
In thousands of U.S. Dollars As at April 24, 2018
Financial assets 41,142
Property and equipment 2,048
Identifiable intangible assets (note 11) 267,346
Financial liabilities (71,024 )
Deferred tax liability (76,600 )
Total identifiable assets 162,912
Goodwill (note 11) 78,290
Total consideration 241,202
Satisfied by:
Cash 241,202
Less: Cash and cash equivalent balances acquired (32,352 )
Net cash outflow arising on acquisition 208,850
The fair value of the financial assets includes receivables with a fair value of $16.7 million and a gross contractual value of $33.1 million.
The Corporation’s best estimate at the acquisition date of the contractual cash flows not to be collected is $16.4 million.
Included in the amounts recognized is a deferred tax liability of $76.6 million, comprised of a $79.0 million deferred tax liability related
to acquired intangible assets and a $0.4 million deferred tax liability related to other temporary differences as well as a deferred tax asset
of $2.8 million wholly related to other temporary differences.
The main factors leading to the recognition of goodwill as a result of the acquisition are the value inherent in the acquired business that
cannot be recognized as a separate asset under IFRS, including future incremental earnings potential resulting from further
diversification of the Corporation’s business geographically and the expansion of its online betting product offerings. The goodwill is
not deductible for tax purposes.
Acquisition-related costs directly related to the Australian Acquisitions were $11.5 million and were included within general and
administrative expenses in the consolidated statements of (loss) earnings.
The Corporation has not completed its assessment or valuation of certain assets acquired and liabilities assumed in connection with the
acquisition. Therefore, the information disclosed above for identifiable intangible assets, financial assets, financial liabilities and
deferred tax liability is completed on a provisional basis and is subject to change based on further review of assumptions and if any new
information is obtained about facts and circumstances that existed as of the acquisition date. During the quarter ended September 30,
2018, the Corporation made an adjustment totalling $31.7 million as a reduction to the amounts recognized as non-controlling interest
in relation to the acquisition of TSGA with a corresponding reduction to goodwill.
During the third quarter, the Corporation substantially completed its migration and integration of TSGA into BetEasy. As a result,
revenue and earnings cannot be attributed to the individual acquired entities for the period subsequent to the migration and integration.
On a combined basis, BetEasy contributed $196.9 million of revenue and a loss of $16.7 million to the Corporation for the period
between the respective dates of acquisition and December 31, 2018. BetEasy revenue has been reported in Betting revenue in the
Australia segment. See note 7.
SBG
As previously announced, on July 10, 2018, the Corporation completed the SBG Acquisition, acquiring 100% of SBG. The Corporation
believes that this acquisition improves the Corporation’s revenue diversity across its major lines of operations; increases the
Corporation’s presence in locally regulated or taxed markets; develops sports betting as a second customer acquisition channel and
creates an opportunity to cross-sell customers across multiple lines of operations; and enhances the Corporation’s products and
technology.

32
The provisional amounts recognized in respect of the identifiable assets acquired and liabilities assumed are set out in the table below:
In thousands of U.S. Dollars As at July 10, 2018
Financial assets 416,359
Property and equipment 18,086
Identifiable intangible assets (note 11) 3,043,953
Other financial liabilities (394,177 )
Derivatives (5,031 )
Shareholder loans (663,407 )
Long-term debt (1,080,478 )
Preferred shares (10,879 )
Other non-current liabilities (1,453 )
Deferred tax liability (514,278 )
Total identifiable assets 808,695
Goodwill (note 11) 2,431,100
Total consideration 3,239,795
Satisfied by:
Non-cash consideration:
Common Shares Issued 1,381,044
Cash consideration:
Cash 1,858,751
Less: Cash and cash equivalent balances acquired (304,053 )
Net cash outflow arising on acquisition 1,554,698
Total consideration, net of cash acquired 2,935,742
The fair value of the financial assets includes receivables with a fair value of $2.9 million and a gross contractual value of $3.0 million.
The Corporation’s best estimate at the acquisition date of the contractual cash flows not to be collected is $0.1 million.
Financial liabilities include assumed liabilities for long-term debt and shareholder loans payable of $1.08 billion and $663.4 million,
respectively, SBG preferred shares of $10.9 million. Included in derivatives are cross-currency swap and interest rate swap instruments
with an aggregate fair value of $(5.0) million. The Corporation redeemed the preferred shares and repaid the long-term debt and
shareholder loans payable immediately upon closing of the SBG Acquisition. Subsequently during the quarter, the applicable cross-
currency and interest rate swaps were settled for a net cash payment of $1.0 million.
Included in the amounts recognized is a deferred tax liability of $514.3 million, comprised of $515.7 million deferred tax liability related
to acquired intangible assets and deferred tax assets of $1.0 million related to plant and equipment and $0.4 million related to other
temporary differences.
As at July 10, 2018, SBG had future financial commitments for marketing, technology and IT contracts of $110.2 million.
The main factors leading to the recognition of goodwill as a result of the acquisition are the value inherent in the acquired business that
cannot be recognized as a separate asset under IFRS, including future incremental earnings potential resulting from further
diversification of the Corporation’s business geographically, expansion of its online betting, primarily sports betting, gaming and other
product offerings, the ability to cross-sell across these product offerings, and the ability to achieve cost synergies across the Corporation.
The goodwill is not deductible for tax purposes.
Acquisition-related costs directly related to the SBG Acquisition were $42.8 million and were included within general and administrative
expenses on the consolidated statements of (loss) earnings.
SBG contributed $394.1 million of revenue and a loss of $121.9 million to the Corporation for the period between the date of acquisition
and December 31, 2018. SBG revenue has been reported as part of the United Kingdom segment across all revenue categories in the
segmental reporting. See note 7.
The Corporation has not completed its assessment or valuation of certain assets acquired and liabilities assumed in connection with the
acquisition. Therefore, the information disclosed above for identifiable intangible assets, financial assets, financial liabilities and
deferred tax liability is completed on a provisional basis and is subject to change based on further review of assumptions and if any new
information is obtained about facts and circumstances that existed as of the acquisition date.

33
Other
During the year ended December 31, 2018, a subsidiary of the Corporation also acquired 100% of the equity interests in two subsidiaries,
Publipoker S.R.L. and Keiem Ltd, for a total consideration, net of cash acquired, of $2.6 million, satisfied by cash consideration of $1.0
million and deferred consideration of $1.6 million. The balance outstanding on the deferred consideration as at December 31, 2018 is
$0.3 million.
If the above noted acquisitions had been completed on the first day of the financial year, the Corporation’s revenue for the year ended
December 31, 2018 would have been $2.6 billion and net loss for the year ended December 31, 2018 would have been $188.0 million.
The following tables shows acquired intangibles by asset class:
In thousands of U.S. Dollars
Software
Technology Acquired
through
Business
Combinations
Other
Intangibles
Customer
Relationships Brands
Brands
(licensed) Total
BetEasy 34,684 10,908 56,814 — — 102,406
TSGA 1,432 22,094 243,820 — — 267,346
SBG 264,709 13,666 2,233,235 22,447 509,896 3,043,953
Total 300,825 46,668 2,533,869 22,447 509,896 3,413,705
6. REVENUE
Year Ended December 31,
In thousands of U.S. Dollars 2018 2017
Poker revenue 892,557 877,296
Gaming revenue 585,846 334,781
Betting revenue 491,139 49,231
Other revenue from customers 56,419 34,155
Other sources of revenue 3,277 16,852
Total revenue 2,029,238 1,312,315
Revenue from contracts with customers have not been further disaggregated as the nature of the revenue streams, contract duration and
timing of transfer of services are all largely homogenous. For further information regarding revenue, including segment revenue by
major line of operations and geographic region. See note 7.
As at December 31, 2018, there are no significant contract assets or liabilities and no significant unsatisfied performance obligations. In
addition, there are no significant capitalized costs to obtain a contract.
7. SEGMENTAL INFORMATION
As a result of its previously announced Australian Acquisitions and SBG Acquisition, the Corporation revised the composition of its
reporting segments and the manner in which it has reported its operating results beginning with the unaudited interim condensed
consolidated financial statements for the second quarter of 2018. The Corporation believes that the new presentation better reflects its
current and expected management and operational structure. Earlier periods have been presented in a manner consistent with the revised
segmentation. The segmentation reflects the way the CODM evaluates performance of, and allocates resources within, the business.
The CODM considers the Corporation’s business from both a geographic and product offering or lines of operation perspective. Giving
effect to the reporting segment changes, for the years ended December 31, 2018 and 2017, the Corporation had three reportable segments:
International, United Kingdom and Australia, as well as a Corporate cost center. Revenue within these operating segments is further
divided into the Poker, Gaming, Betting and Other lines of operation, as applicable. The CODM receives geographic and lines of
operation revenue information throughout the year for the purpose of assessing their respective performance. Certain costs are included
in Corporate. “Corporate” in itself is not a reporting segment, but it comprises costs which are not directly allocable to any of the
operating segments or relate to a corporate function (tax and treasury).
Further, each reporting segment incurs certain costs, which are not segregated among major lines of operations within each reporting
segment as they share the same office infrastructure, the same workforce and the same administrative resources. The Corporation cannot
develop or produce reports that provide the true costs by major lines of operations within each reporting segment without unreasonable
effort or expense.

34
The primary measure used by the CODM for the purpose of decision making and/or evaluation of a segment is Adjusted EBITDA. The
Corporation defines Adjusted EBITDA as net earnings before financial expenses, income taxes expense (recovery), depreciation and
amortization, stock-based compensation, restructuring, net earnings (loss) on associate and certain other items as set out in the
reconciliation table below.
However, the CODM also uses other key measures as inputs, including, without limitation, revenue and capital expenditures, to
supplement the decision-making process.
Segmental net earnings for the year ended December 31, 2018:
Year Ended December 31, 2018
In thousands of U.S. Dollars International
United
Kingdom Australia Corporate
Intercompany
eliminations
** Consolidated
Revenue 1,440,177 394,131 196,930 — (2,000 ) 2,029,238
Poker 886,628 5,929 — — — 892,557
Gaming 428,364 157,482 — — — 585,846
Betting 79,117 215,921 196,101 — — 491,139
Other 46,068 14,799 829 — (2,000 ) 59,696
Adjusted EBITDA (*) 700,887 99,960 21,072 (40,970 ) — 780,949
Net financing charges — — — 363,884 — 363,884
Depreciation and amortization 144,304 108,879 29,476 147 — 282,806
Capital expenditures 81,189 18,971 12,386 1,182 — 113,728
Segmental net earnings for the year ended December 31, 2017:
Year Ended December 31, 2017
In thousands of U.S. Dollars International
United
Kingdom Australia Corporate
Intercompany
eliminations Consolidated
Revenue 1,312,315 — — — — 1,312,315
Poker 877,296 — — — — 877,296
Gaming 334,781 — — — — 334,781
Betting 49,231 — — — — 49,231
Other 51,007 — — — — 51,007
Adjusted EBITDA (*) 636,404 — — (36,098 ) — 600,306
Net financing charges — — — 158,332 — 158,332
Depreciation and amortization 147,027 — — 159 — 147,186
Capital expenditures 35,939 — — 163 — 36,102
* Adjusted EBITDA is used internally by the CODM when analyzing underlying segment performance.
** The Corporation has excluded from its consolidated results $2.0 million of Other revenue included in the International segment
related to certain non-gaming related transactions with the United Kingdom segment. A corresponding exclusion in the consolidated
results is recorded to sales and marketing expense in the United Kingdom segment.

35
A reconciliation of Adjusted EBITDA to Net earnings (loss) is as follows:
Year Ended December 31,
In thousands of U.S. Dollars 2018 2017
Consolidated
Adjusted EBITDA 780,949 600,306
Add (deduct) the impact of the following:
Acquisition-related costs and deal contingent forwards (115,569 ) —
Stock-based compensation (12,806 ) (10,622 )
(Loss) gain from investments and associates (1,667 ) 33,598
(Impairment) reversal of intangibles assets and assets held for sale (6,223 ) 6,799
Other costs (108,956 ) (35,501 )
Total adjusting items (245,221 ) (5,726 )
Depreciation and amortization (282,806 ) (147,186 )
Operating income 252,922 447,394
Net financing charges (363,884 ) (158,332 )
Net earnings (loss) from associates 1,068 (2,569 )
(Loss) earnings before income taxes (109,894 ) 286,493
Income tax recovery (expense) 988 (27,208 )
Net (loss) earnings (108,906 ) 259,285
The distribution of the Corporation’s assets by reporting segment is as follows:
International
United
Kingdom Australia Corporate Total
Total assets as at December 31, 2018 5,248,115 5,430,110 510,805 76,508 11,265,538
Total assets as at December 31, 2017 5,398,392 — — 16,734 5,415,126
The distribution of some of the Corporation’s non-current assets (goodwill, intangible assets and property and equipment) by geographic
region is as follows:
As at December 31,
In thousands of U.S. Dollars 2018 2017
Geographic Area
Canada 66,830 53,394
Isle of Man 4,346,599 4,446,503
Italy 30 35
United Kingdom 5,191,994 6,511
Australia 456,422 —
Other licensed or approved jurisdictions 31,973 15,744
10,093,848 4,522,187

36
The Corporation also evaluates revenue performance by geographic region based on the primary jurisdiction where the Corporation is
licensed or approved to offer, or offers through third party licenses or approvals, its products and services. The following tables set out
the proportion of revenue attributable to each gaming license or approval (as opposed to the jurisdiction where the customer was located)
that either generated a minimum of 5% of total consolidated revenue for the year ended December 31, 2018 or 2017, or that the
Corporation otherwise deems relevant based on its historical reporting of the same or otherwise:
Year Ended December 31, 2018
In thousands of U.S. Dollars International
United
Kingdom Australia
Intercompany
eliminations * Total
Geographic Area
Isle of Man 377,702 — — (2,000 ) 375,702
Malta 497,126 — — — 497,126
Italy 156,946 1,144 — — 158,090
United Kingdom 73,969 388,421 — — 462,390
Spain 121,776 86 — — 121,862
Australia — 190 196,930 — 197,120
Other licensed or approved
jurisdictions 212,658 4,290 — — 216,948
1,440,177 394,131 196,930 (2,000 ) 2,029,238
Year Ended December 31, 2017
In thousands of U.S. Dollars International
United
Kingdom Australia
Intercompany
eliminations * Total
Geographic Area
Isle of Man 378,714 — — — 378,714
Malta 434,845 — — — 434,845
Italy 134,965 — — — 134,965
United Kingdom 71,553 — — — 71,553
Spain 83,423 — — — 83,423
France 61,132 — — — 61,132
Other licensed or approved
jurisdictions 147,683 — — — 147,683
1,312,315 — — — 1,312,315
* The Corporation has excluded from its consolidated results $2.0 million of Isle of Man revenue included in the International segment
related to certain non-gaming related transactions with the United Kingdom segment. A corresponding exclusion in the consolidated
results is recorded to sales and marketing expense in the United Kingdom segment.
37
8. EXPENSES CLASSIFIED BY NATURE
Year Ended December 31,
In thousands of U.S. Dollars 2018 2017
Cost of revenue (excluding depreciation and amortization)
Direct selling costs 99,642 38,421
Gaming duty, levies and fees 268,857 137,953
Processor and other operating costs 90,665 71,123
459,164 247,497
General and administrative
Salaries and wages 285,234 179,929
Legal and professional fees 84,288 69,499
Impairment (reversal of impairment) of property and equipment, intangible assets and
assets held for sale (note 11) 6,156 (6,799 )
Loss (gain) on disposal of investments and other assets 1,992 (32,999 )
Acquisition-related costs 54,209 —
Acquisition of market access rights in connection with Eldorado 20,661 —
Foreign exchange (gain) loss 68,406 2,838
IT and software costs 74,334 20,599
Other operational costs 106,108 57,633
Depreciation and amortization 282,806 147,186
984,194 437,886
Net financing charges
Interest on long-term debt 186,720 109,624
Re-measurement of deferred contingent payment 1 (342 ) —
Re-measurement of Embedded Derivatives 2 6,100 —
Ineffectiveness on cash flow hedges (14,909 ) —
Accretion expense 42,431 40,793
Loss on debt extinguishment 146,950 —
Interest income (3,066 ) 1,056
Interest on deferred purchase price — 6,859
363,884 158,332
1 See notes 5 and 26 for details regarding the recognition and measurement of the deferred contingent payment.
2 See notes 17, 19 and 26 for details regarding the recognition and measurement of the Embedded Derivative (as defined below).
During the year ended December 31, 2017, the Corporation received $5.8 million in indemnification proceeds from the sellers of Stars
Interactive Group for gaming duty, professional fees and taxes owed for periods prior to the Stars Interactive Group Acquisition. The
amounts received from the sellers were classified as gaming duty, professional fees and income taxes. In addition, the Corporation
received a refund of $2.9 million in taxes and penalties from the Belgian tax authorities, and insurance indemnification proceeds of $2.9
million in respect of Autorité des marchés financiers (AMF) and other investigation professional fees. During the year ended December
31, 2018, the Corporation received an additional $8.0 million in insurance indemnification proceeds in respect of AMF and other
investigation professional fees. The amount received from the Belgian tax authorities was classified as income taxes and the insurance
indemnification was classified as professional fees.
The Corporation participates in defined contribution retirement plans for all qualifying employees, as applicable, across its segments.
The assets of the plans are held separate from those of the Corporation in funds under the control of the Corporation’s pension providers.
The obligations of the Corporation are limited to make the specified contributions in accordance with the plans. Included within salaries
and wages is $9.2 million recorded in respect of these plans.

38
9. INCOME TAXES
Details of income tax expense were as follows:
Year Ended December 31,
In thousands of U.S. Dollars 2018 2017
Current income tax expense 19,813 9,391
Current income tax expense (recovery) - provision true up (2,155 ) 21,923
Deferred income tax recovery relating to the origination and reversal of temporary
differences (17,971 ) (3,568 )
Deferred income tax (recovery) expense - provision true up (675 ) (538 )
Income tax (recovery) expense (988 ) 27,208
The Corporation’s applicable Canadian statutory tax rate is equal to the Federal and Provincial combined tax rate for the period
applicable in the jurisdiction within Canada where the Corporation’s head office is registered (i.e., Ontario where the provincial tax rate
is 11.5%, and Quebec, where the provincial tax rate is 11.7%) which resulted in a decrease of 0.2% in the statutory tax rate in 2018
compared to the prior year. The Corporations primary operations were previously in the Isle of Man and Malta and subsequent to the
Australian Acquisitions and SBG Acquisition, are now also in Australia and the United Kingdom. Income taxes reported differ from the
amount computed by applying the Canadian statutory rates to earnings before income taxes primarily due to differences in statutory
rates across the countries where the Corporation operates and where the Corporation is incorporated, among other factors. The
reconciliation is as follows:
Year Ended December 31,
In thousands of U.S. Dollars 2018 2017
Net (loss) earnings before income taxes (109,894 ) 286,493
Canadian statutory tax rate 26.5 % 26.7 %
Income taxes at Canadian statutory tax rate (29,122 ) 76,494
Non-taxable income (9,030 ) (143 )
Non-deductible expenses 34,815 3,590
Differences in effective income tax rates in foreign jurisdictions (97,919 ) (117,153 )
Deferred tax assets not recognized 103,098 43,035
Provision true up (2,830 ) 21,385
Income tax (recovery) expense (988 ) 27,208
The Corporation’s effective income tax rate for the year ended December 31, 2018, was 0.9% (December 31, 2017 – 9.5%) The income
tax recovery for the year ended December 31, 2018 includes $27.3 million (December 31, 2017 – nil) in relation to the income tax
recovery on the amortization expense of acquired intangible assets from the Australian Acquisitions and the SBG Acquisition.
The Corporation’s income taxes for the current year ended December 31, 2018 were impacted by the tax recovery on amortization of
intangible assets and the geographic diversity of its taxable earnings. The Corporation expects that this will continue in future periods
following the Australia Acquisitions and the SBG Acquisition, which have operations primarily in Australia and the United Kingdom,
respectively, where statutory corporate income tax rates are higher than the corporate income tax rates in the Isle of Man and Malta,
where the Corporation primarily operated from prior to these acquisitions.
During the year ended December 31, 2017, the Corporation received notification of a proposed tax assessment from the Canadian tax
authorities relating to transfer pricing. The proposed assessment covered periods prior to the Stars Interactive Group Acquisition
covering the 2003 to 2007 tax years. For the year ended December 31, 2017 the Corporation recorded a tax provision based on the
proposed assessments for both Federal and Provincial tax of $26.5 million including interest. During the year ended December 31, 2018
the Corporation received the Federal and Provincial tax assessments and submitted an objection to the relevant authorities regarding the
same. The Corporation intends to vigorously defend its position against the assessments. During the year ended December 31, 2018 the
provision was reduced to $24.2 million as a result of adjustments for interest, foreign exchange movements and a pre-payment made in
relation to the provincial assessment.

39
Deferred Tax
Recognized deferred tax assets and liabilities
Significant components of the Corporation’s deferred income tax asset balance at December 31, 2018 and 2017 are as follows:
In thousands of U.S. Dollars
Property &
Equipment Intangibles Tax Losses Other Total *
At January 1, 2017 25 — 139 976 1,140
Credited to net earnings 131 — 170 3,378 3,679
Credited to other comprehensive income — — — 146 146
Credited directly to equity - share-based payment
transactions — — — 359 359
Foreign exchange on translation — — (1 ) (13 ) (14 )
At December 31, 2017 156 — 308 4,846 5,310
Reclassifications (8 ) — (134 ) (362 ) (504 )
At January 1, 2018 148 — 174 4,484 4,806
Credited (charged) to net earnings 41 — 1,051 (1,008 ) 84
Credited to other comprehensive income — — — 53 53
Charged directly to equity - share-based payment
transactions — — — (359 ) (359 )
Acquisition of subsidiary 1,016 — — 9,921 10,937
Foreign exchange on translation (61 ) — (34 ) (1,177 ) (1,272 )
At December 31, 2018 1,144 — 1,191 11,914 14,249
Significant components of the Corporation’s deferred income tax liability balance at December 31, 2018 and 2017 are as follows:
In thousands of U.S. Dollars
Property &
Equipment Intangibles Tax Losses Other Total *
At January 1, 2017 — (17,300 ) — — (17,300 )
Credited to net earnings — 426 — — 426
Credited to other comprehensive income — 14 — — 14
Acquisition of subsidiary — (72 ) — — (72 )
Foreign exchange on translation — 253 — — 253
At December 31, 2017 — (16,679 ) — — (16,679 )
Reclassifications (45 ) 549 — — 504
At January 1, 2018 (45 ) (16,130 ) — — (16,175 )
(Charged) credited to net earnings (82 ) 15,525 — (513 ) 14,930
Acquisition of subsidiary — (620,796 ) — (465 ) (621,261 )
Foreign exchange on translation 6 29,278 — 51 29,335
At December 31, 2018 (121 ) (592,123 ) — (927 ) (593,171 )
* Deferred taxes by category above are presented on a gross basis. The statements of financial position present deferred taxes net for
amounts included within the same jurisdiction.
Unrecognized deferred tax assets
Deferred tax assets have not been recognized in respect of the items shown below. The amounts shown are the gross temporary
differences and to calculate the potential deferred asset it is necessary to multiply the amounts by the tax rates in each case.
As at December 31,
In thousands of U.S. Dollars 2018 2017
Tax losses 1,619,702 1,293,846
Other temporary differences 82,814 19,567
Total deferred tax asset unrecognized 1,702,516 1,313,413
Deferred tax assets have not been recognized in respect of these items because it is not probable that future taxable profits will be
available in these jurisdictions against which the Corporation can utilize the benefit from them.

40
Included in tax losses not recognized as at December 31, 2018 are Canadian non-capital tax losses of $129.2 million (December 31,
2017 - $100.2 million) that may be applied against earnings for up to 20 years from the end of the year the losses were generated and
the first year of expiry is 2034 for $13.9 million of the carried forward tax losses. Tax losses also include foreign subsidiary non-capital
losses of $1.49 billion (December 31, 2017 - $1.19 billion) that may be applied against future years. The majority of these losses of
$1.44 billion (December 31, 2017 - $1.17 billion) can be carried forward for up to 9 years from the end of the year the tax losses were
generated and the first year of expiry is 2023 for $401.5 million of the carried forward tax losses.
As a result of exemptions from taxation (corporate tax and withholding tax) applicable to dividends from subsidiaries, there are no
significant taxable temporary differences associated with investments in subsidiaries, branches, associates and interests in joint
arrangements and no material deferred tax liability arises on unremitted earnings totaling $1.87 billion (December 31, 2017 - $1.13
billion).
10. EARNINGS PER SHARE
The following table sets forth the computation of basic and diluted earnings per Common Share for the following periods:
Year Ended December 31,
2018 2017
Numerator
Numerator for basic and diluted earnings per Common Share - net earnings (loss)
attributable to shareholders of The Stars Group Inc. $ (102,452,000 ) $ 259,231,000
Denominator
Denominator for basic earnings per Common Share – weighted
average number of Common Shares
208,269,905 146,818,764
Effect of dilutive securities
Stock options 1,371,177 558,996
Performance share units 246,813 18,748
Deferred share units 7,593 —
Restricted share units 72,673 17,076
Warrants 569,304 717,792
Convertible Preferred Shares 32,231,301 55,576,213
Effect of dilutive securities * 34,498,861 56,888,825
Dilutive potential for diluted earnings per Common Share 208,269,905 203,707,589
Basic earnings (loss) per Common Share $ (0.49 ) $ 1.77
Diluted earnings (loss) per Common Share $ (0.49 ) $ 1.27
* The effect of dilutive securities for instruments that resulted in the issuance of Common Shares during the years ended December 31,
2018 and 2017 is included for the period during the applicable year prior to the issuance of the related Common Shares.
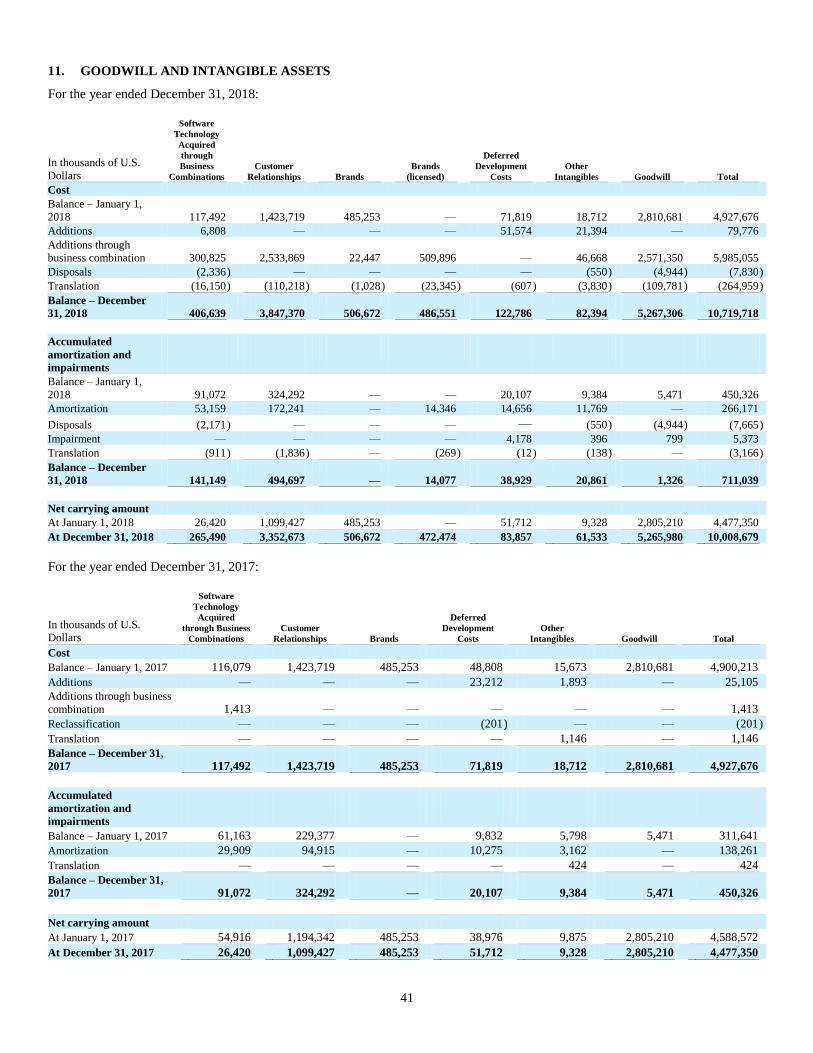
41
11. GOODWILL AND INTANGIBLE ASSETS
For the year ended December 31, 2018:
In thousands of U.S.
Dollars
Software
Technology
Acquired
through
Business
Combinations Customer
Relationships Brands
Brands
(licensed)
Deferred
Development
Costs
Other
Intangibles Goodwill Total
Cost
Balance – January 1,
2018 117,492 1,423,719 485,253 — 71,819 18,712 2,810,681 4,927,676
Additions 6,808 — — — 51,574 21,394 — 79,776
Additions through
business combination 300,825 2,533,869 22,447 509,896 — 46,668 2,571,350 5,985,055
Disposals (2,336 ) — — — — (550 ) (4,944 ) (7,830 )
Translation (16,150 ) (110,218 ) (1,028 ) (23,345 ) (607 ) (3,830 ) (109,781 ) (264,959 )
Balance – December
31, 2018 406,639 3,847,370 506,672 486,551 122,786 82,394 5,267,306 10,719,718
Accumulated
amortization and
impairments
Balance – January 1,
2018 91,072 324,292 — — 20,107 9,384 5,471 450,326
Amortization 53,159 172,241 — 14,346 14,656 11,769 — 266,171
Disposals (2,171 ) — — — — (550 ) (4,944 ) (7,665 )
Impairment — — — — 4,178 396 799 5,373
Translation (911 ) (1,836 ) — (269 ) (12 ) (138 ) — (3,166 )
Balance – December
31, 2018 141,149 494,697 — 14,077 38,929 20,861 1,326 711,039
Net carrying amount
At January 1, 2018 26,420 1,099,427 485,253 — 51,712 9,328 2,805,210 4,477,350
At December 31, 2018 265,490 3,352,673 506,672 472,474 83,857 61,533 5,265,980 10,008,679
For the year ended December 31, 2017:
In thousands of U.S.
Dollars
Software
Technology
Acquired
through Business
Combinations Customer
Relationships Brands
Deferred
Development
Costs
Other
Intangibles Goodwill Total
Cost
Balance – January 1, 2017 116,079 1,423,719 485,253 48,808 15,673 2,810,681 4,900,213
Additions — — — 23,212 1,893 — 25,105
Additions through business
combination 1,413 — — — — — 1,413
Reclassification — — — (201 ) — — (201 )
Translation — — — — 1,146 — 1,146
Balance – December 31,
2017 117,492 1,423,719 485,253 71,819 18,712 2,810,681 4,927,676
Accumulated
amortization and
impairments
Balance – January 1, 2017 61,163 229,377 — 9,832 5,798 5,471 311,641
Amortization 29,909 94,915 — 10,275 3,162 — 138,261
Translation — — — — 424 — 424
Balance – December 31,
2017 91,072 324,292 — 20,107 9,384 5,471 450,326
Net carrying amount
At January 1, 2017 54,916 1,194,342 485,253 38,976 9,875 2,805,210 4,588,572
At December 31, 2017 26,420 1,099,427 485,253 51,712 9,328 2,805,210 4,477,350

42
Impairment Testing
During the year ended December 31, 2018 the Corporation recognized impairment losses (classified in general and administrative
expenses) of $4.8 million for deferred development costs and other intangibles, related to discontinued development and other projects
within the International and United Kingdom segments and $0.8 million for Goodwill in certain of the Corporation’s subsidiaries within
the International segment (December 31, 2017 - $nil).
The Corporation performed an annual impairment test for its operations in connection with the preparation of its consolidated financial
statements for the year ended December 31, 2018. Goodwill is monitored at the operating segment and this is consistent with the lowest
level of CGU except as noted below.
As at December 31, 2018 As at December 31, 2017
In thousands of U.S. Dollars Goodwill Brand (Indefinite) Goodwill
Brand
(Indefinite)
International 2,806,485 485,253 2,805,210 485,253
United Kingdom * 2,333,476 21,419 — —
Australia 126,019 — — —
Total 5,265,980 506,672 2,805,210 485,253
* The United Kingdom segment includes a non-significant CGU which includes the indefinite lived brand as noted in the table above.
The Corporation has not identified any impairment in relation to the indefinite lived brand.
The recoverable amount of each CGU tested for impairment is determined from value in use calculations which are categorized as Level
3 fair value measures and use discounted cash flow projections. The key assumptions for the value in use calculations are the future cash
flow and growth projections (including estimates of future capital expenditures), discount rates, and perpetual growth rates. Management
estimates discount rates using post-tax rates that reflect current market assessments of the time value of money and the risks specific to
the CGU, including economic risk assumptions and estimates of the likelihood of achieving forecasted cash flow results. The pre tax
discount rate is then inferred by recalculation. The Corporation considers a range of reasonably possible amounts to use for key
assumptions and applies amounts that represent management’s best estimate of future outcomes.
The Corporation prepares cash flow forecasts derived from the most recent financial budgets approved by management for the next five
years.
• For the International segment, the sixth year (2024) cash flow assumes a revenue growth rate of 7.8% before a steady growth
rate of 3.0% is applied to the perpetual net cash flows.
• For the UK segment, the sixth year (2024) cash flow assumes a revenue growth rate of 4.0% before a steady growth rate of
3.0% is applied to the perpetual net cash flows;
• For the Australian segment, the year five cash flow is steadily reduced across 2024 to 2028 from a revenue growth rate of 7.9%
in 2024 to a perpetual growth rate of 2.0% applied to net cash flows from 2028 onwards to take into account known changes
in the segment’s customer base; and
The cash flows are discounted based on the discount rates as presented below. The estimated perpetual growth rates are based on
independent country specific market reports for online gaming growth projections.
The following table shows key assumptions used in the value in use calculations:
Assumptions used in value in use calculation
International United Kingdom Australia
Discount Rate (pre-tax) 11.2 % 9.3 % 14.1 %
Discount Rate (after-tax) 11.0 % 8.2 % 10.5 %
Perpetual Growth Rate 3.0 % 3.0 % 2.0 %
Revenue Growth Rate 6.6% - 11.5% 4.0% - 13.4% 3.9% - 11.5%
Adjusted EBITDA Margin as % of Revenue 38.9% - 43.0% 26.9% - 30.5% 16.5% - 19.4%
CAPEX as % of Revenue 4.5 % 4.5 % 4.4% - 5.4%
Based on the impairment test performed, the recoverable amount of the CGUs were in excess of their carrying amount and accordingly,
there is no impairment of the carrying value of the goodwill (except as noted above in respect of in certain of the Corporation’s
subsidiaries).

43
The Corporation believes that a reasonable change to the key assumptions applied to International would not cause its carrying value to
exceed its recoverable amounts. With respect to the United Kingdom and Australia, the recoverable amount exceeds the carrying amount
by $111 million and $152 million, respectively. The impairment assessment is highly sensitive to reasonably possible changes in a
number of key assumptions in the value in use calculation. The following table shows the changes to key assumptions used in the
impairment review that would be required for the carrying amount to equal the recoverable amount:
Change required for carrying value to equal recoverable
amount
United Kingdom Australia
pps pps
Discount Rate (pre-tax) 0.1 4.7
Discount Rate (after-tax) 0.1 3.3
Perpetual Growth Rate (0.2 ) (8.9 )
Revenue Growth Rate across the five year forecast (0.6 ) (5.4 )
Adjusted EBITDA Margin as % of Revenue across the five year forecast (0.6 ) (4.0 )
CAPEX as % of Revenue 0.7 3.5
A combination of reasonably possible changes in assumptions as set out in the table above could result in impairment in either or both
of the United Kingdom and Australia.
12. PROPERTY AND EQUIPMENT
For the year ended December 31, 2018:
In thousands of U.S. Dollars Furniture
and Fixtures
Computer
Equipment Building Total
Cost
Balance – January 1, 2018 12,497 26,155 23,928 62,580
Additions 11,283 22,669 — 33,952
Additions through business combinations 24,582 1,642 — 26,224
Disposals (338 ) (26 ) — (364 )
Impairment (1,521 ) — — (1,521 )
Translation (870 ) (634 ) (1,991 ) (3,495 )
Balance – December 31, 2018 45,633 49,806 21,937 117,376
Accumulated depreciation
Balance – January 1, 2018 5,324 9,402 3,017 17,743
Depreciation 7,682 7,960 991 16,633
Disposals (57 ) (12 ) — (69 )
Impairment (954 ) — — (954 )
Translation (528 ) (246 ) (372 ) (1,146 )
Balance – December 31, 2018 11,467 17,104 3,636 32,207
Net carrying amount
Balance – January 1, 2018 7,173 16,753 20,911 44,837
At December 31, 2018 34,166 32,702 18,301 85,169

44
For the year ended December 31, 2017:
In thousands of U.S. Dollars
Revenue-
Producing Assets
Furniture
and Fixtures
Computer
Equipment Building Total
Cost
Balance – January 1, 2017 84 9,356 18,627 21,605 49,672
Additions — 2,724 8,273 — 10,997
Disposals (84 ) (571 ) (1,251 ) — (1,906 )
Translation — 988 506 2,323 3,817
Balance – December 31, 2017 — 12,497 26,155 23,928 62,580
Accumulated depreciation
Balance – January 1, 2017 24 2,017 5,239 1,592 8,872
Depreciation — 3,198 4,764 963 8,925
Disposals (24 ) (301 ) (860 ) — (1,185 )
Translation — 410 259 462 1,131
Balance – December 31, 2017 — 5,324 9,402 3,017 17,743
Net carrying amount
At January 1, 2017 60 7,339 13,388 20,013 40,800
At December 31 2017 — 7,173 16,753 20,911 44,837
13. INVESTMENTS
The Corporation held the following investments:
As at December 31,
2018 2017
In thousands of U.S. Dollars
Carrying value &
fair value
Carrying value &
fair value
Bonds – Available-for-sale — 115,343
Funds – Available-for-sale — 7,045
Equity in quoted companies – Available-for-sale — 280
Equity in unquoted companies – Available-for-Sale — 6,981
Bonds – FVOCI 103,153 —
Equity in unquoted companies – FVTPL (note 16) 6,773 —
Total investments 109,926 129,649
Current portion 103,153 122,668
Non-current portion 6,773 6,981
Investments relate primarily to customer deposits held in accounts segregated from investments held for operational purposes.
Investments held in relation to customer deposits are liquid investments and are classified as current assets consistent with the current
classification of customer deposits to which the investments relate. Management’s investment strategy for the portfolio results in many
of the bonds being held to maturity. As of December 31, 2018, Customer deposits were covered by $103.2 million in investments and
$328.2 million in cash.
There were no impairments recognized on investments during the year ended December 31, 2018 (December 31, 2017: $nil). See note
29 for details on credit risk.
During the year ended December 31, 2017, the Corporation completed the disposition of all its securities of NYX Gaming Group Limited
(“NYX Gaming Group”) for net cash proceeds of $27.9 million resulting in a gain of $14.0 million. During the year ended December
31, 2017, the Corporation also completed the sale of its ordinary shares in Jackpotjoy plc (LSE: JPJ) for net cash proceeds of $59.8
million resulting in a gain of $15.0 million. These gains were recorded within loss (gain) on disposal of investments and other assets
included in general and administrative expenses
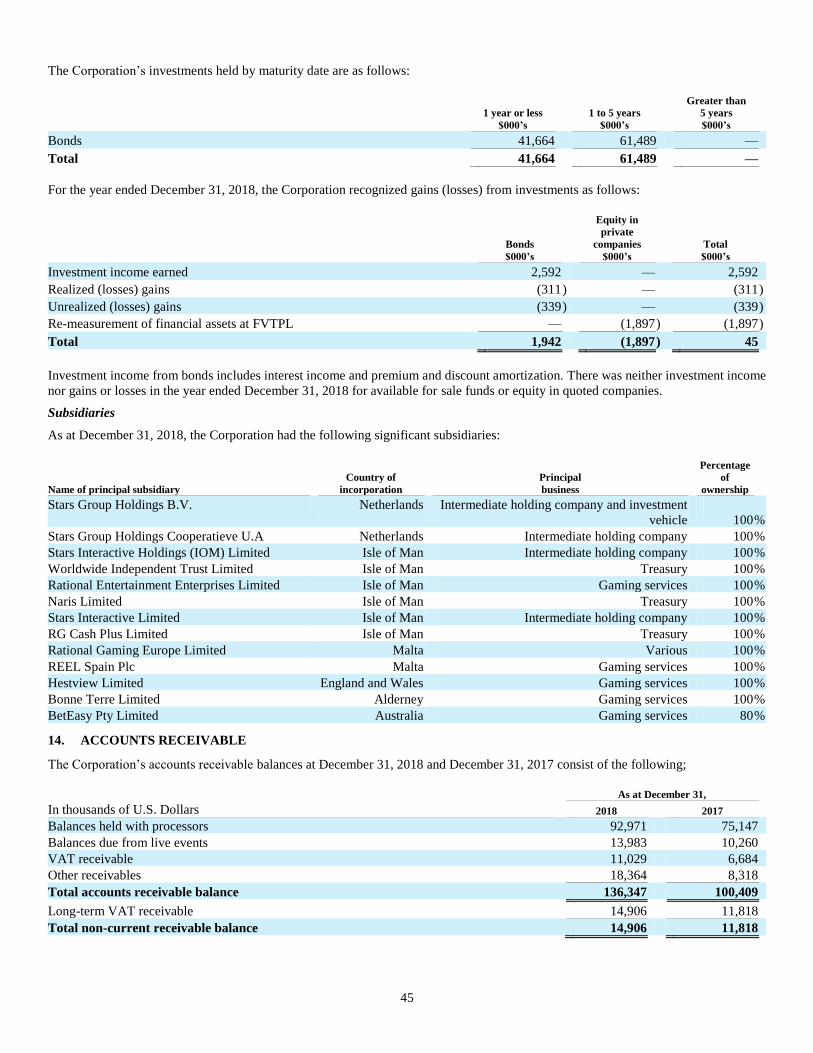
45
The Corporation’s investments held by maturity date are as follows:
1 year or less
$000’s 1 to 5 years
$000’s
Greater than
5 years $000’s
Bonds 41,664 61,489 —
Total 41,664 61,489 —
For the year ended December 31, 2018, the Corporation recognized gains (losses) from investments as follows:
Bonds
$000’s
Equity in
private companies
$000’s Total
$000’s
Investment income earned 2,592 — 2,592
Realized (losses) gains (311 ) — (311 )
Unrealized (losses) gains (339 ) — (339 )
Re-measurement of financial assets at FVTPL — (1,897 ) (1,897 )
Total 1,942 (1,897 ) 45
Investment income from bonds includes interest income and premium and discount amortization. There was neither investment income
nor gains or losses in the year ended December 31, 2018 for available for sale funds or equity in quoted companies.
Subsidiaries
As at December 31, 2018, the Corporation had the following significant subsidiaries:
Name of principal subsidiary
Country of
incorporation
Principal
business
Percentage
of
ownership
Stars Group Holdings B.V.
Netherlands
Intermediate holding company and investment
vehicle 100 %
Stars Group Holdings Cooperatieve U.A Netherlands Intermediate holding company 100 %
Stars Interactive Holdings (IOM) Limited Isle of Man Intermediate holding company 100 %
Worldwide Independent Trust Limited Isle of Man Treasury 100 %
Rational Entertainment Enterprises Limited Isle of Man Gaming services 100 %
Naris Limited Isle of Man Treasury 100 %
Stars Interactive Limited Isle of Man Intermediate holding company 100 %
RG Cash Plus Limited Isle of Man Treasury 100 %
Rational Gaming Europe Limited Malta Various 100 %
REEL Spain Plc Malta Gaming services 100 %
Hestview Limited England and Wales Gaming services 100 %
Bonne Terre Limited Alderney Gaming services 100 %
BetEasy Pty Limited Australia Gaming services 80 %
14. ACCOUNTS RECEIVABLE
The Corporation’s accounts receivable balances at December 31, 2018 and December 31, 2017 consist of the following;
As at December 31,
In thousands of U.S. Dollars 2018 2017
Balances held with processors 92,971 75,147
Balances due from live events 13,983 10,260
VAT receivable 11,029 6,684
Other receivables 18,364 8,318
Total accounts receivable balance 136,347 100,409
Long-term VAT receivable 14,906 11,818
Total non-current receivable balance 14,906 11,818
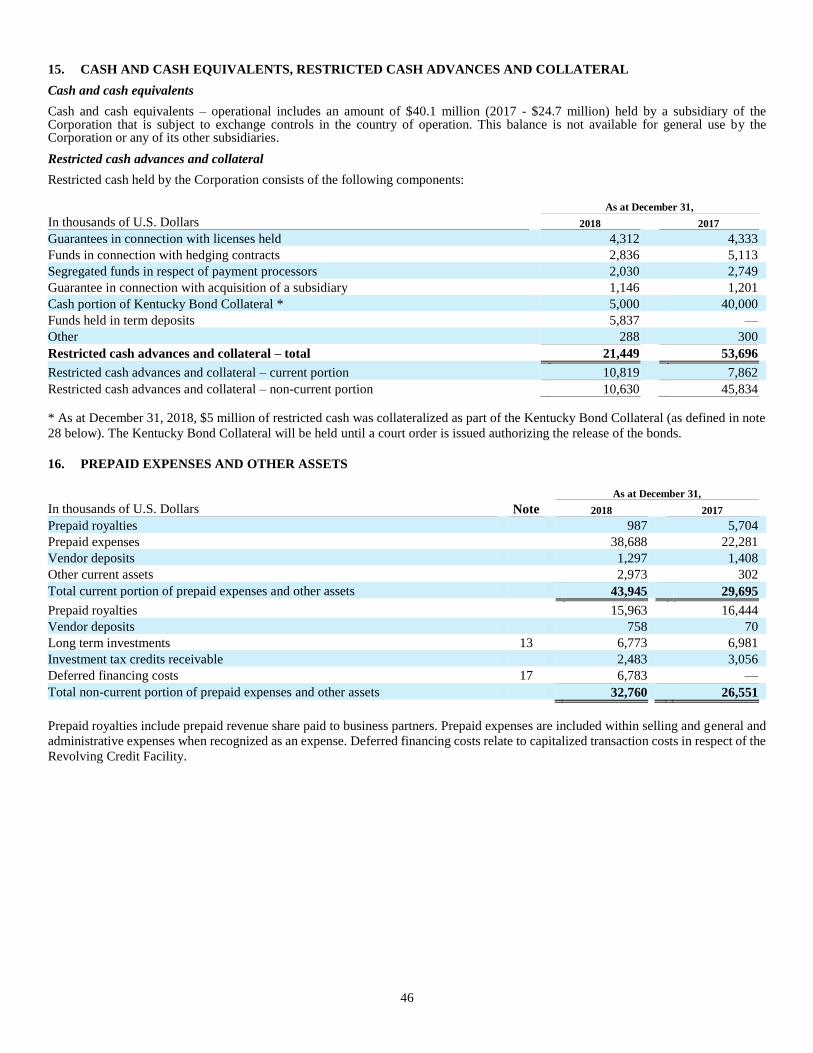
46
15. CASH AND CASH EQUIVALENTS, RESTRICTED CASH ADVANCES AND COLLATERAL
Cash and cash equivalents
Cash and cash equivalents – operational includes an amount of $40.1 million (2017 - $24.7 million) held by a subsidiary of the Corporation that is subject to exchange controls in the country of operation. This balance is not available for general use by the Corporation or any of its other subsidiaries.
Restricted cash advances and collateral
Restricted cash held by the Corporation consists of the following components: As at December 31,
In thousands of U.S. Dollars 2018 2017
Guarantees in connection with licenses held 4,312 4,333
Funds in connection with hedging contracts 2,836 5,113
Segregated funds in respect of payment processors 2,030 2,749
Guarantee in connection with acquisition of a subsidiary 1,146 1,201
Cash portion of Kentucky Bond Collateral * 5,000 40,000
Funds held in term deposits 5,837 —
Other 288 300
Restricted cash advances and collateral – total 21,449 53,696
Restricted cash advances and collateral – current portion 10,819 7,862
Restricted cash advances and collateral – non-current portion 10,630 45,834 * As at December 31, 2018, $5 million of restricted cash was collateralized as part of the Kentucky Bond Collateral (as defined in note
28 below). The Kentucky Bond Collateral will be held until a court order is issued authorizing the release of the bonds.
16. PREPAID EXPENSES AND OTHER ASSETS
As at December 31,
In thousands of U.S. Dollars Note 2018 2017
Prepaid royalties 987 5,704
Prepaid expenses 38,688 22,281
Vendor deposits 1,297 1,408
Other current assets 2,973 302
Total current portion of prepaid expenses and other assets 43,945 29,695
Prepaid royalties 15,963 16,444
Vendor deposits 758 70
Long term investments 13 6,773 6,981
Investment tax credits receivable 2,483 3,056
Deferred financing costs 17 6,783 —
Total non-current portion of prepaid expenses and other assets 32,760 26,551
Prepaid royalties include prepaid revenue share paid to business partners. Prepaid expenses are included within selling and general and
administrative expenses when recognized as an expense. Deferred financing costs relate to capitalized transaction costs in respect of the
Revolving Credit Facility.

47
17. LONG-TERM DEBT
The following is a summary of long-term debt outstanding at December 31, 2018, and 2017 (all capitalized terms used in the table below
relating to such long-term debt are defined below in this note):
In thousands of U.S. Dollars (except as noted) Interest rate
December 31,
2018, Principal
outstanding balance in
currency of
borrowing
December 31,
2018 Carrying amount in
USD
December 31,
2017, Principal
outstanding
balance in
currency of
borrowing
December 31,
2017 Carrying amount in
USD
Revolving Facility 5.64% — — — —
USD First Lien Term Loan 5.89% 3,557,125 3,479,823 — —
EUR First Lien Term Loan 3.75% 850,000 951,980 — —
Senior Notes 7.00% 1,000,000 980,008 — —
Loan payable to non-controlling interests 0.00% 49,936 35,147 — —
Previous USD first lien term loan 5.32% — — 1,895,654 1,848,397
Previous EUR first lien term loan 3.25% — — 382,222 453,540
USD second lien term loan 8.69% — — 95,000 56,632
Total long-term debt 5,446,958 2,358,569
Current portion 35,750 4,990
Non-current portion 5,411,208 2,353,579
During the year ended December 31, 2018, the Corporation incurred the following interest on its then-outstanding long-term debt
excluding its loan payable to non-controlling interests which is non-interest bearing:
In thousands of U.S. Dollars Effective
interest rate * Interest Interest
Accretion Total Interest
Revolving Facility 5.66% 4,006 699 4,705
USD First Lien Term Loan 6.54% 75,988 7,799 83,787
EUR First Lien Term Loan 4.26% 17,792 1,365 19,157
Senior Notes 7.47% 33,250 1,000 34,250
Previous USD first lien term loan ** 6.07% 42,885 112,135 155,020
Previous EUR first lien term loan ** 3.87% 9,693 41,502 51,195
USD second lien term loan ** 13.78% 2,216 4,643 6,859
Total 185,830 169,143 354,973
During the year ended December 31, 2017, the Corporation incurred the following interest on its then-outstanding long-term debt:
In thousands of U.S. Dollars Effective
interest rate Interest Interest
Accretion Total Interest
Previous USD first lien term loan 5.54 % 76,851 11,817 88,668
Previous EUR first lien term loan 4.37 % 16,824 1,271 18,095
USD second lien term loan 16.05 % 14,340 5,179 19,519
Total 108,015 18,267 126,282
* The effective interest rate calculation excludes the impact of the debt extinguishments in respect of the April 2018 Amend and Extend
and the repayment of the previous first lien term loans as well as the impact of the Swap Agreements.
** Interest accretion for the year ended December 31, 2018 includes a loss on debt extinguishment of $147.0 million included within
net financing charges in respect of the amendment and extension and subsequent repayment of the Corporation’s prior first lien term
loans.

48
The Corporation’s debt balance for the year ended December 31, 2018 was as follows:
In thousands of U.S. Dollars Opening
Balance
Adjustment
on
adoption of
IFRS 9 New debt Debt
repayments
Adjustments
to amortized
cost *
Interest
Accretion
** Translation Closing
Revolving Facility — — 100,000 (100,000 ) (699 ) 699 — —
USD First Lien Term Loan — — 3,575,000 (17,875 ) (85,101 ) 7,799 — 3,479,823
EUR First Lien Term Loan — — 999,535 — (23,823 ) 1,365 (25,097 ) 951,980
Senior Notes — — 1,000,000 — (20,992 ) 1,000 — 980,008
Loan payable to non-controlling interests — — 52,357 (6,167 ) (8,517 ) — (2,526 ) 35,147
Previous USD first lien term loan 1,848,397 (46,894 ) 268,921 (2,164,575 ) (17,984 ) 112,135 — —
Previous EUR first lien term loan 453,540 (30,725 ) 144,627 (585,450 ) (5,077 ) 41,502 (18,417 ) —
USD second lien term loan 56,632 33,725 — (95,000 ) — 4,643 — —
Total 2,358,569 (43,894 ) 6,140,440 (2,969,067 ) (162,193 ) 169,143 (46,040 ) 5,446,958 The Corporation’s debt balance for the year ended December 31, 2017 was as follows:
In thousands of U.S. Dollars Opening
Balance New debt Debt
repayments
Adjustments
to amortized
cost *
Interest
Accretion
** Translation Closing
Previous USD first lien term loan 1,965,928 — (125,442 ) (3,906 ) 11,817 — 1,848,397
Previous EUR first lien term loan 296,198 103,973 (3,444 ) (829 ) 1,271 56,371 453,540
USD second lien term loan 166,453 — (115,000 ) — 5,179 — 56,632
Total 2,428,579 103,973 (243,886 ) (4,735 ) 18,267 56,371 2,358,569
* Adjustments to amortized cost includes transaction costs incurred on the issuance or incurrence of each of the financial instruments
and, with respect to the Senior Notes (as defined below), the bifurcation of embedded features in 2018 as described below and debt
forgiveness in relation to the loan payable to non-controlling interests. In addition, unamortized deferred financing costs of $6.8 million
were reclassified to prepaid expenses and other non-current assets on the consolidated statements of financial position following the
repayment of $100.0 million previously drawn on the Revolving Facility.
** Interest accretion represents interest expense calculated at the effective interest rate less interest expense calculated at the contractual
interest rate and is recorded in net financing charges in the consolidated statements of (loss) earnings.
As at December 31, 2018, the contractual principal repayments of the Corporation’s outstanding long-term debt over the next five years
amount to the following:
In thousands of U.S. Dollars <1 Year 1-2 Years 2-3 Years 3-4 Years 4-5 Years >5 Years
Revolving Facility — — — — — —
USD First Lien Term Loan 35,750 35,750 35,750 35,750 35,750 3,378,375
EUR First Lien Term Loan — — — — — 973,803
Senior Notes — — — — — 1,000,000
Loan payable to non-controlling interests — 35,147 — — — —
Total 35,750 70,897 35,750 35,750 35,750 5,352,178
(a) Revolving Facility, First Lien Term Loans and Senior Notes
As previously disclosed, on July 10, 2018, the Corporation completed the SBG Acquisition. To finance the cash portion of the purchase
price, repay the Corporation’s previous first lien term loans and repay SBG’s existing long-term debt, which was assumed by the
Corporation as part of the acquisition, the Corporation used existing cash resources and raised $4.567 billion in First Lien Term Loans,
$1.00 billion in Senior Notes (each as defined below) and $621.8 million of net proceeds (before expenses), excluding the overallotment,
from the issuance of additional Common Shares as a result of the Equity Offering (as defined below). The Corporation also obtained a
new Revolving Facility (as defined below) of $700.0 million, of which it had drawn $100 million as of completion of the acquisition
(collectively with the foregoing, the “SBG Financing”). The debt portion of the SBG Financing is described below. For further details
on the Equity Offering portion of the SBG Financing, see note 24.

49
Revolving Facility
On July 10, 2018, as part of the SBG Financing, the Corporation replaced its previous revolving facility with a new first lien revolving
facility of $700 million (the “Revolving Facility”). Maturing on July 10, 2023, the Revolving Facility includes a margin of 3.25% for
borrowings which is subject to leverage-based step-downs. The commitment fee on the Revolving Facility varies from 0.250% to
0.375% based on first lien leverage. Borrowings under the Revolving Facility are subject to the satisfaction of customary conditions,
including the absence of a default and compliance with certain representations and warranties. The Revolving Facility requires, subject
to a testing threshold, that the Corporation comply on a quarterly basis with a maximum net first lien senior secured leverage ratio of
6.75 to 1.00.
The Revolving Facility can be used for working capital needs and for general corporate purposes. As at December 31, 2018 and
December 31, 2017 there were no amounts outstanding under the Revolving Facility and the Corporation’s previous revolving facility,
respectively. The Corporation had $74.2 million of letters of credit issued but undrawn as of December 31, 2018. Availability under the
Revolving Facility as of December 31, 2018 was $625.8 million.
First Lien Term Loans
On July 10, 2018, as part of the SBG Financing, the Corporation repaid its previous first lien term loans and issued new First Lien Term
Loans of $3.575 billion priced at LIBOR plus 3.50% (the “USD First Lien Term Loan”) and new EUR first lien term loans of €850
million priced at EURIBOR plus 3.75% (the “EUR First Lien Term Loan” and, together with the USD First Lien Term Loan, the “First
Lien Term Loans”), each with a maturity date of July 10, 2025 and a LIBOR and EURIBOR floor, as applicable, of 0%. Starting on the
last day of the first fiscal quarter ending after July 10, 2018, the USD First Lien Term Loan requires scheduled quarterly principal
payments in amounts equal to 0.25% of the aggregate principal amount of the USD First Lien Term Loan, with the balance due at
maturity. There is no amortization on the EUR First Lien Term Loan and the principal is due at maturity.
The Corporation, its lenders, Deutsche Bank AG New York Branch, as administrative agent, and certain other parties also entered into
a new credit agreement (the “Credit Agreement”) for the First Lien Term Loans and the Revolving Facility to, among other things,
reflect the foregoing transactions and add certain operational and financial flexibility, particularly as it relates to the Corporation on a
combined basis following the SBG Acquisition.
The Credit Agreement limits Stars Group Holdings B.V. and its subsidiaries’ ability to, among other things, (i) incur additional debt,
(ii) grant additional liens on their assets and equity, (iii) distribute equity interests and/or distribute any assets to third parties, (iv) make
certain loans or investments (including acquisitions), (v) consolidate, merge, sell or otherwise dispose of all or substantially all assets,
(vi) pay dividends on or make distributions in respect of capital stock or make restricted payments, (vii) enter into certain transactions
with affiliates, (viii) change lines of business, and (ix) modify the terms of certain debt or organizational documents, in each case subject
to certain exceptions. The Credit Agreement also provides for customary mandatory prepayments, including a customary excess cash
flow sweep if certain conditions are met.
Senior Notes
Also in connection with the SBG Financing, two of the Corporation’s subsidiaries, Stars Group Holdings B.V. and Stars Group (US)
Co-Borrower, LLC (the “Issuers”), issued 7.00% Senior Notes due 2026 (the “Senior Notes”) on July 10, 2018 at par in an aggregate
principal amount of $1.00 billion. The Senior Notes mature on July 15, 2026. Interest on the Senior Notes is payable semi-annually on
January 15 and July 15 of each year, commencing on January 15, 2019. The Senior Notes are guaranteed by each of the Issuers’ restricted
subsidiaries that guarantees the Revolving Facility. The Senior Notes are the Issuers’ senior unsecured obligations and rank equally in
right of payment with all of the Issuers’ existing and future senior unsecured indebtedness. The Senior Notes include the following
features which were collectively identified as the Embedded Derivative (as defined below) that required bifurcation from the carrying
value of the Senior Notes.
• Upon certain events constituting a change of control under the indenture governing the Senior Notes (the “Indenture”), the
holders of the Senior Notes have the right to require Stars Group Holdings B.V. to offer to repurchase the Senior Notes at a
purchase price equal to 101% of their principal amount, plus accrued and unpaid interest, to (but not including) the date of
purchase (the “Change of Control Put”).
• Prior to July 15, 2021, the Issuers may redeem up to 40% of the original aggregate principal of the Senior Notes with proceeds
from an equity offering at a redemption price of 107%, plus accrued and unpaid interest, if any, to (but not including) the
applicable redemption date (the “Equity Clawback”).
• Prior to July 15, 2021, the Issuers may redeem some or all of the Senior Notes at a redemption price equal to 100% of the
principal amount of the Senior Notes, plus accrued and unpaid interest, if any, to (but not including) the applicable redemption
date, plus an applicable ‘‘make-whole’’ premium. On or after July 15, 2021, the Issuers may redeem some or all of the Senior
Notes at declining redemption prices as set forth in the Indenture (collectively the “Redemption Option” and together with the
Change of Control Put and the Equity Clawback, the “Embedded Derivative”).
The fair value of the Embedded Derivative at issuance of the Senior Notes and at December 31, 2018 was $17.7 million and $11.6
million, respectively. See notes 19 and 26.

50
The Senior Notes include, among other terms and conditions, limitations on the Issuers’ ability to create, incur or allow certain liens;
create, assume, incur or guarantee additional indebtedness of certain of the Issuers’ subsidiaries; and consolidate or merge with, or
convey, transfer or lease all or substantially all of the Issuers’ and their subsidiaries’ assets, to another person.
(b) Minority shareholder loan
In connection with the acquisition of a 62% equity interest in BetEasy, the Corporation acquired financial liabilities of $59.2 million,
which included a loan of $15.5 million (AUD$19.7 million) from the minority shareholders of BetEasy. During the year ended December
31, 2018 a subsidiary of the Corporation repaid $6.2 million (AUD$8.2 million) of such loan and entered into an agreement with such
minority shareholders to forgive and discharge $8.6 million (AUD$11.5 million) of the outstanding loan balance.
As previously reported, on March 6, 2018, a subsidiary of the Corporation entered into agreement with the holders of the non-controlling
interest in BetEasy to increase its equity interest from 62% to 80% and for BetEasy to acquire TSGA. According to the agreement, the
non-controlling interest of BetEasy made a loan of $35.1 million (AUD$47.4 million) and equity contribution of $12.1 million
(AUD$15.8 million). During the year ended December 31, 2018, the non-controlling interest provided an additional shareholder loan of
$1.8 million (AUD$2.5 million). As at December 31, 2018, the outstanding loan balance was $36.1 million (AUD$49.9 million). The
loan is non-interest bearing and repayable on the earlier of 9 years and 364 days from the date of advance and the date of completion of
the 20% put-call option. See note 19.
(b) Previous first lien term loans, USD second lien term loan and previous revolving facility
On April 6, 2018, the Corporation successfully increased, repriced and extended its previous first lien term loans and previous revolving
facility and repaid its USD second lien term loan. The transaction was recorded as an extinguishment for accounting purposes. No
termination costs were incurred. Subsequently, in connection with the SBG Acquisition and SBG Financing, on July 10, 2018, the
Corporation repaid its previous first lien term loans, repaid the existing long-term indebtedness of SBG, entered into the new Credit
Agreement with respect to First Lien Term Loans and Revolving Facility, and issued the Senior Notes. The transaction was recorded as
an extinguishment for accounting purposes. No termination costs were incurred upon repayment.
18. CAPITAL MANAGEMENT
The Corporation’s objective in managing capital is to ensure it has sufficient liquidity to manage its business and growth objectives
while maximizing return to shareholders through the optimization of the use of debt and equity. Liquidity is necessary to meet the
Corporation’s existing general capital needs, fund the Corporation’s growth and expansion plans, and undertake certain capital markets
activities, including the repayment of debt.
The Corporation has historically met its liquidity needs through cash flow generated from operations and capital markets activities,
including the incurrence and issuance of debt and issuance of capital stock. The Corporation’s current objective is to meet all of its
current liquidity and existing general capital requirements from the cash flow generated from operations.
The capital structure of the Corporation and its subsidiaries consists of long-term debt, which is offset by cash balances, and total equity
attributable to shareholders. The Corporation’s capital management objectives are to optimize its capital structure and cost of capital.
The Corporation intends to deleverage by focusing on improving profitability and repaying of debt.
For additional information regarding the Corporation’s liquidity risks, see note 29.
19. DERIVATIVES AND HEDGE ACCOUNTING
The Corporation is exposed to interest rate and currency risk, refer to note 29. The Corporation uses derivative financial instruments for risk management purposes and anticipates that such instruments will mitigate interest rate and currency risk, as applicable. As such, any change in cash flows associated with derivative instruments is expected to be offset by changes in cash flows related to the hedged position.
Upon completion of the SBG Acquisition, the Corporation made a net cash payment of $1.0 million to unwind and settle certain
previously existing cross-currency swap agreements and interest rate swap agreements related to the hedging of SBG’s previously
outstanding long-term debt that were no longer required following the repayment of the same.
Subsequent to the SBG Financing, and as part of managing the Corporation’s exposure to foreign exchange risk and interest rate risk,
the Corporation entered into cross-currency interest rate swap agreements and interest rate swap agreements (collectively, the “Swap
Agreements”), each as discussed below. At the time of entering into the Swap Agreements, the Corporation made a cash payment of
$61.1 million to unwind and settle its previously existing swap agreements (the “Previous Swap Agreements)” as discussed below.

51
Derivatives
Swap Agreements
During the year ended December 31, 2018, a subsidiary of the Corporation entered into USD-EUR cross-currency interest rate swap
agreements (the “EUR Cross-Currency Interest Rate Swaps”) with a notional amount of €1.99 billion ($2.33 billion), which fix the USD
to EUR exchange rate at 1.167 and fix the Euro interest payments at an average interest rate of 3.6%, as well as EUR-GBP cross-
currency interest rate swap agreements (the “GBP Cross-Currency Interest Rate Swaps”) with a notional amount of £1.00 billion (€1.12
billion), which fix the EUR to GBP exchange rate at 0.889 and fix the GBP interest payments at an average interest rate of 5.4%. The
cross-currency interest rate swaps have a profile that amortizes in line with the USD First Lien Term Loan and each are set to mature in
July 2023. The Corporation also entered into an amortizing USD interest rate swap agreement (the “Interest Rate Swap”) with a notional
amount of $700 million, which is set to mature in July 2023, and swaps USD three-month LIBOR to a fixed interest rate of 2.82%.
Previous Swap Agreements
The Previous Swap Agreements hedged the interest rate and foreign exchange risk on the Corporation’s previous first lien term loans.
Therefore, in connection with the repayment of the previous first lien term Loans, the Corporation unwound and settled the remaining
USD notional principal of $1.39 billion related to the Previous Swap Agreements for a cash payment of $61.1 million.
Embedded Derivative
See note 17 for a discussion of the features embedded in the Senior Notes that the Corporation bifurcated as it determined that the
features were derivatives to be classified and recorded at fair value through profit or loss.
The fair value of the Embedded Derivative at issuance of the Senior Notes and at December 31, 2018 was $17.7 million and $11.6
million, respectively. The fair value of the Embedded Derivative was determined using an interest rate option pricing valuation model.
The key assumptions include the implied credit spread of 3.8% at issuance and 4.6% at December 31, 2018. The Embedded Derivative
is categorized as a Level 3 within the fair value hierarchy. The Corporation did not account for the Embedded Derivative as a qualifying
hedge.
Unsettled bets
Unsettled bets represent bets that are staked but the event to which the bet relates have not yet concluded. See note 2 for further details
regarding Betting revenue. The principal assumption used in the fair value determination of unsettled bets is the anticipated gross win
margin on the outcome of the events to which the bets relate. The Embedded Derivative is categorized as a Level 3 within the fair value
hierarchy.
Put and call options on 20% non-controlling interest in BetEasy
On April 24, 2018, in connection with the Corporation’s acquisition of the additional 18% interest in BetEasy, the Corporation entered
into a non-controlling interest put-call option in relation to the 20% interest in BetEasy held by its minority interest shareholders, with
an exercise price based on certain future operating performance conditions of the acquired business. This was determined to be a non-
controlling interest put-call option with a variable settlement amount that can be settled in either cash or shares or a combination of both,
and because the put-call option does not clearly grant the Corporation with present access to returns associated with the remaining 20%
ownership interest, the Corporation recognized this put-call option as a net liability derivative. As at each of the acquisition date and
December 31, 2018, the Corporation determined that the fair value of this non-controlling interest derivative was $nil as the fundamentals
of the underlying business operations remain consistent with the acquisition date.
Deal contingent forwards
In connection with the SBG Acquisition and the Australian Acquisitions, to economically hedge its risk of foreign exchange fluctuations
leading up to the acquisitions, the Corporation entered into deal contingent forward contracts. At the time of completion of the
acquisitions, the Corporation settled the deal contingent forwards and recognized an aggregate realized loss of $61.5 million included
in foreign exchange within the general and administrative category in the consolidated statements of (loss) earnings. The Corporation
did not account for the deal contingent forward contracts as qualifying hedges under IAS 39.
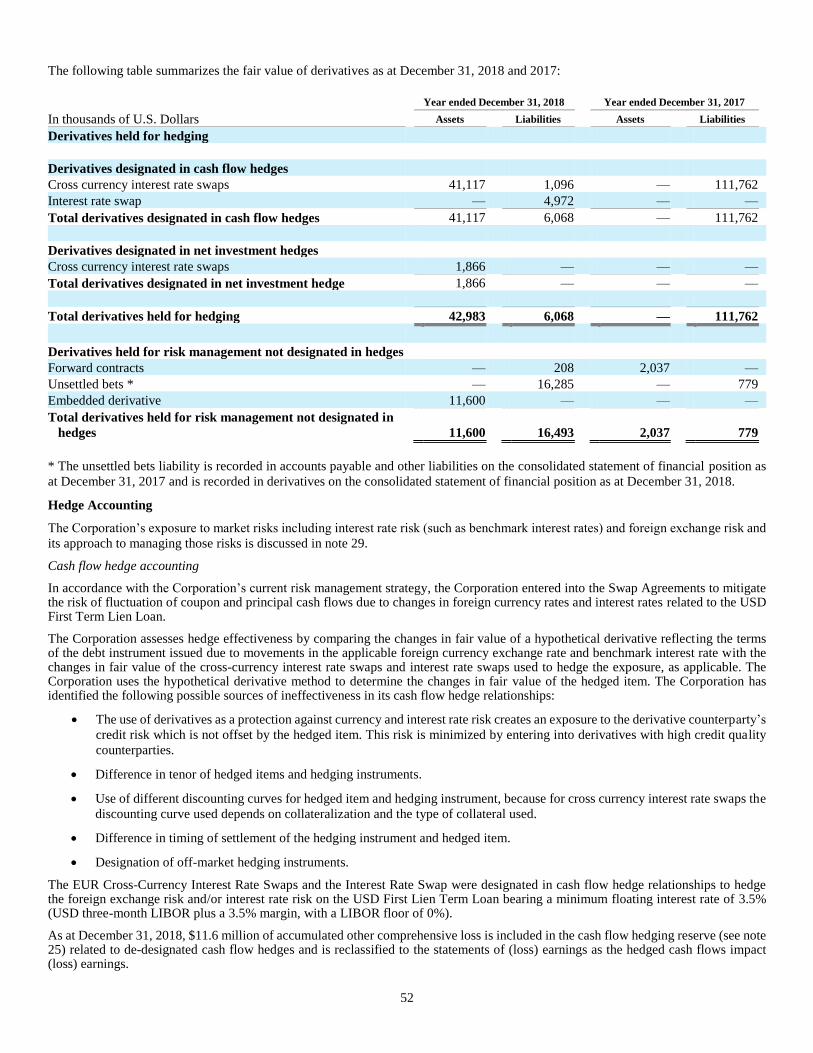
52
The following table summarizes the fair value of derivatives as at December 31, 2018 and 2017:
Year ended December 31, 2018 Year ended December 31, 2017
In thousands of U.S. Dollars Assets Liabilities Assets Liabilities
Derivatives held for hedging
Derivatives designated in cash flow hedges
Cross currency interest rate swaps 41,117 1,096 — 111,762
Interest rate swap — 4,972 — —
Total derivatives designated in cash flow hedges 41,117 6,068 — 111,762
Derivatives designated in net investment hedges
Cross currency interest rate swaps 1,866 — — —
Total derivatives designated in net investment hedge 1,866 — — —
Total derivatives held for hedging 42,983 6,068 — 111,762
Derivatives held for risk management not designated in hedges
Forward contracts — 208 2,037 —
Unsettled bets * — 16,285 — 779
Embedded derivative 11,600 — — —
Total derivatives held for risk management not designated in
hedges 11,600 16,493 2,037 779
* The unsettled bets liability is recorded in accounts payable and other liabilities on the consolidated statement of financial position as
at December 31, 2017 and is recorded in derivatives on the consolidated statement of financial position as at December 31, 2018.
Hedge Accounting
The Corporation’s exposure to market risks including interest rate risk (such as benchmark interest rates) and foreign exchange risk and
its approach to managing those risks is discussed in note 29.
Cash flow hedge accounting
In accordance with the Corporation’s current risk management strategy, the Corporation entered into the Swap Agreements to mitigate the risk of fluctuation of coupon and principal cash flows due to changes in foreign currency rates and interest rates related to the USD First Term Lien Loan.
The Corporation assesses hedge effectiveness by comparing the changes in fair value of a hypothetical derivative reflecting the terms of the debt instrument issued due to movements in the applicable foreign currency exchange rate and benchmark interest rate with the changes in fair value of the cross-currency interest rate swaps and interest rate swaps used to hedge the exposure, as applicable. The Corporation uses the hypothetical derivative method to determine the changes in fair value of the hedged item. The Corporation has identified the following possible sources of ineffectiveness in its cash flow hedge relationships:
• The use of derivatives as a protection against currency and interest rate risk creates an exposure to the derivative counterparty’s
credit risk which is not offset by the hedged item. This risk is minimized by entering into derivatives with high credit quality
counterparties.
• Difference in tenor of hedged items and hedging instruments.
• Use of different discounting curves for hedged item and hedging instrument, because for cross currency interest rate swaps the
discounting curve used depends on collateralization and the type of collateral used.
• Difference in timing of settlement of the hedging instrument and hedged item.
• Designation of off-market hedging instruments.
The EUR Cross-Currency Interest Rate Swaps and the Interest Rate Swap were designated in cash flow hedge relationships to hedge the foreign exchange risk and/or interest rate risk on the USD First Lien Term Loan bearing a minimum floating interest rate of 3.5% (USD three-month LIBOR plus a 3.5% margin, with a LIBOR floor of 0%).
As at December 31, 2018, $11.6 million of accumulated other comprehensive loss is included in the cash flow hedging reserve (see note 25) related to de-designated cash flow hedges and is reclassified to the statements of (loss) earnings as the hedged cash flows impact (loss) earnings.
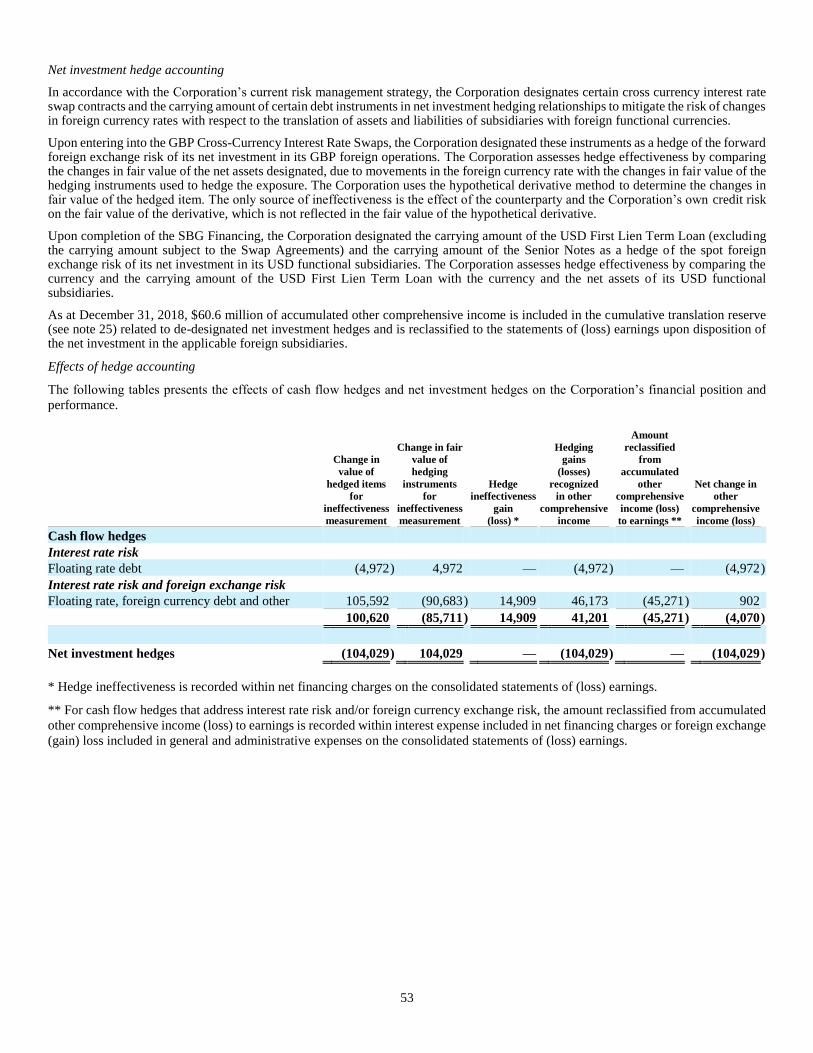
53
Net investment hedge accounting
In accordance with the Corporation’s current risk management strategy, the Corporation designates certain cross currency interest rate swap contracts and the carrying amount of certain debt instruments in net investment hedging relationships to mitigate the risk of changes in foreign currency rates with respect to the translation of assets and liabilities of subsidiaries with foreign functional currencies.
Upon entering into the GBP Cross-Currency Interest Rate Swaps, the Corporation designated these instruments as a hedge of the forward foreign exchange risk of its net investment in its GBP foreign operations. The Corporation assesses hedge effectiveness by comparing the changes in fair value of the net assets designated, due to movements in the foreign currency rate with the changes in fair value of the hedging instruments used to hedge the exposure. The Corporation uses the hypothetical derivative method to determine the changes in fair value of the hedged item. The only source of ineffectiveness is the effect of the counterparty and the Corporation’s own credit risk on the fair value of the derivative, which is not reflected in the fair value of the hypothetical derivative.
Upon completion of the SBG Financing, the Corporation designated the carrying amount of the USD First Lien Term Loan (excluding the carrying amount subject to the Swap Agreements) and the carrying amount of the Senior Notes as a hedge of the spot foreign exchange risk of its net investment in its USD functional subsidiaries. The Corporation assesses hedge effectiveness by comparing the currency and the carrying amount of the USD First Lien Term Loan with the currency and the net assets of its USD functional subsidiaries.
As at December 31, 2018, $60.6 million of accumulated other comprehensive income is included in the cumulative translation reserve (see note 25) related to de-designated net investment hedges and is reclassified to the statements of (loss) earnings upon disposition of the net investment in the applicable foreign subsidiaries.
Effects of hedge accounting
The following tables presents the effects of cash flow hedges and net investment hedges on the Corporation’s financial position and
performance.
Change in
value of
hedged items
for
ineffectiveness
measurement
Change in fair
value of
hedging
instruments
for
ineffectiveness
measurement
Hedge
ineffectiveness
gain
(loss) *
Hedging
gains
(losses)
recognized
in other
comprehensive
income
Amount
reclassified
from
accumulated
other
comprehensive
income (loss)
to earnings **
Net change in
other
comprehensive
income (loss)
Cash flow hedges
Interest rate risk
Floating rate debt (4,972 ) 4,972 — (4,972 ) — (4,972 )
Interest rate risk and foreign exchange risk
Floating rate, foreign currency debt and other 105,592 (90,683 ) 14,909 46,173 (45,271 ) 902
100,620 (85,711 ) 14,909 41,201 (45,271 ) (4,070 )
Net investment hedges (104,029 ) 104,029 — (104,029 ) — (104,029 )
* Hedge ineffectiveness is recorded within net financing charges on the consolidated statements of (loss) earnings.
** For cash flow hedges that address interest rate risk and/or foreign currency exchange risk, the amount reclassified from accumulated
other comprehensive income (loss) to earnings is recorded within interest expense included in net financing charges or foreign exchange
(gain) loss included in general and administrative expenses on the consolidated statements of (loss) earnings.

54
Reconciliation of accumulated other comprehensive income (loss):
Accumulated
other
comprehensive
income
(loss),
beginning of
year
Net changes in
other
comprehensive
income
(loss)
Accumulated
other
comprehensive
income
(loss),
end of year
Accumulated
other
comprehensive
income
(loss) on
designated
hedges
Accumulated
other
comprehensive
income (loss)
on de-
designated
hedges
Cash flow hedges *
Interest rate risk
Floating rate debt — (4,972 ) (4,972 ) (4,972 ) —
Interest rate risk and foreign exchange risk
Floating rate, foreign currency debt and other (33,983 ) 902 (33,081 ) (21,507 ) (11,574 )
(33,983 ) (4,070 ) (38,053 ) (26,479 ) (11,574 )
Net investment hedges ** 86,430 (104,029 ) (17,599 ) (66,749 ) 49,150
* Net changes in other comprehensive income (loss) is recorded through the cash flow hedging reserve. See note 25.
** Net changes in other comprehensive income (loss) is recorded through the cumulative translation reserve. See note 25.
20. COMMITMENTS
The Corporation as lessee and other contractual commitments
At December 31, 2018, the Corporation’s future minimum lease payments under non-cancellable operating leases and other obligations
aggregate to $346.4 million and are payable as follows:
In thousands of U.S. Dollars Within one year
Later than one year
but not later than 5 years More than 5 years
Lease obligations 61,423 154,374 26,013
Other contractual commitments 40,011 54,054 10,561
Total 101,434 208,428 36,574
The Corporation as lessor
At December 31, 2018, the Corporation’s future minimum lease receipts under non-cancellable operating leases aggregate to $14.8
million and are receivable as follows;
In thousands of U.S. Dollars Within one year
Later than one year
but not later than 5 years More than 5 years
Lease obligations 1,863 7,452 5,533
Total 1,863 7,452 5,533
Other commitments
The Corporation had $74.2 million of letters of credit issued but undrawn as of December 31, 2018. See note 17.

55
21. ACCOUNTS PAYABLE AND OTHER LIABILITIES
The Corporation’s accounts payable and other liabilities comprise the following:
As at December 31,
In thousands of U.S. Dollars 2018 2017
Accounts payable and accrued liabilities 282,630 98,493
VAT payable 18,792 18,757
Customer loyalty rewards 24,787 29,508
Employee benefits payable 57,143 39,050
Dormant funds 7,308 8,379
Accrued interest on Senior Notes 33,347 —
Total accounts payable and other current liabilities 424,007 194,187
Long-term lease liability 2,088 —
Deferred contingent payment (note 26) 77,628 —
Total long-term payables 79,716 —
VAT Payable
A significant portion of the VAT payable relates to amounts owing for VAT for prior periods as a result of engagement with the Swiss
tax authority on the application of the law. This is due to be settled by the end of first quarter of 2019.
22. PROVISIONS
The carrying amounts and the movements in the provisions during the year ended December 31, 2018 and 2017 are as follows:
In thousands of U.S. Dollars
Player
bonuses
and jackpots
Deferred
payment
provision
Restructuring
provision Other Total
Balance at January 1, 2017 1,571 202,515 — 17,636 221,722
Adjustment to provision recognized 48,146 (815 ) — (121 ) 47,210
Payments (44,121 ) (197,510 ) — (9,311 ) (250,942 )
Accretion of discount — 2,048 — 839 2,887
Reclassification (1,444 ) — — — (1,444 )
Foreign exchange translation losses 113 62 — 1,075 1,250
Balance at December 31, 2017 4,265 6,300 — 10,118 20,683
Provisions acquired in business combinations 8,349 — 1,614 5,297 15,260
Recognized — — 8,164 — 8,164
Adjustment to provision recognized 55,734 — — 654 56,388
Payments (48,902 ) — — (7,006 ) (55,908 )
Accretion of discount — — — 411 411
Foreign exchange translation losses (862 ) — (65 ) (880 ) (1,807 )
Balance at December 31, 2018 18,584 6,300 9,713 8,594 43,191
Current portion at December 31, 2017 4,265 6,300 — 7,025 17,590
Non-current portion at December 31, 2017 — — — 3,093 3,093
Current portion at December 31, 2018 18,584 6,300 9,713 4,592 39,189
Non-current portion at December 31, 2018 — — — 4,002 4,002
Provision for jackpots
The Corporation offers progressive jackpot games. Each time a progressive jackpot game is played, a portion of the amount wagered by
the player is contributed to the jackpot for that specific game or group of games. Once a jackpot is won, the progressive jackpot is reset
with a predetermined base amount. The Corporation maintains a provision for the reset of each jackpot and the progressive element
added as the jackpot game is played. The Corporation believes that its provisions are sufficient to cover the full amount of any required
payout.
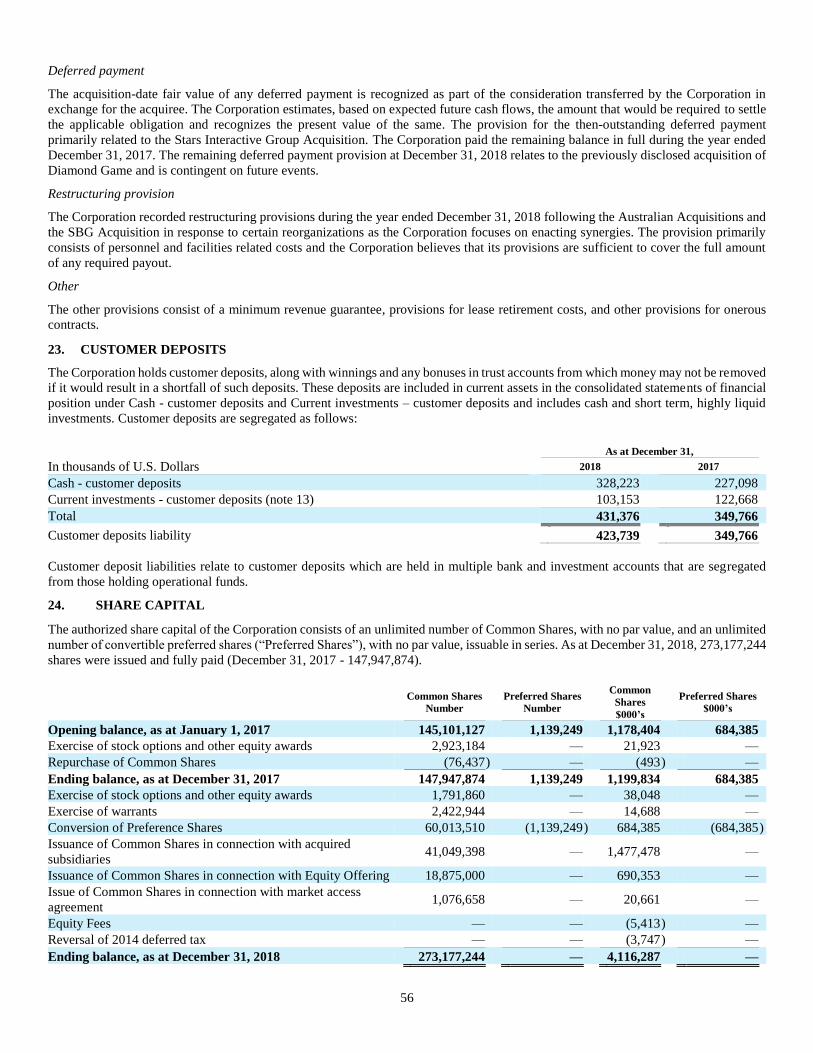
56
Deferred payment
The acquisition-date fair value of any deferred payment is recognized as part of the consideration transferred by the Corporation in
exchange for the acquiree. The Corporation estimates, based on expected future cash flows, the amount that would be required to settle
the applicable obligation and recognizes the present value of the same. The provision for the then-outstanding deferred payment
primarily related to the Stars Interactive Group Acquisition. The Corporation paid the remaining balance in full during the year ended
December 31, 2017. The remaining deferred payment provision at December 31, 2018 relates to the previously disclosed acquisition of
Diamond Game and is contingent on future events.
Restructuring provision
The Corporation recorded restructuring provisions during the year ended December 31, 2018 following the Australian Acquisitions and
the SBG Acquisition in response to certain reorganizations as the Corporation focuses on enacting synergies. The provision primarily
consists of personnel and facilities related costs and the Corporation believes that its provisions are sufficient to cover the full amount
of any required payout.
Other
The other provisions consist of a minimum revenue guarantee, provisions for lease retirement costs, and other provisions for onerous
contracts.
23. CUSTOMER DEPOSITS
The Corporation holds customer deposits, along with winnings and any bonuses in trust accounts from which money may not be removed
if it would result in a shortfall of such deposits. These deposits are included in current assets in the consolidated statements of financial
position under Cash - customer deposits and Current investments – customer deposits and includes cash and short term, highly liquid
investments. Customer deposits are segregated as follows:
As at December 31,
In thousands of U.S. Dollars 2018 2017
Cash - customer deposits 328,223 227,098
Current investments - customer deposits (note 13) 103,153 122,668
Total 431,376 349,766
Customer deposits liability 423,739 349,766
Customer deposit liabilities relate to customer deposits which are held in multiple bank and investment accounts that are segregated
from those holding operational funds.
24. SHARE CAPITAL
The authorized share capital of the Corporation consists of an unlimited number of Common Shares, with no par value, and an unlimited
number of convertible preferred shares (“Preferred Shares”), with no par value, issuable in series. As at December 31, 2018, 273,177,244
shares were issued and fully paid (December 31, 2017 - 147,947,874).
Common Shares
Number
Preferred Shares
Number
Common
Shares
$000’s
Preferred Shares
$000’s
Opening balance, as at January 1, 2017 145,101,127 1,139,249 1,178,404 684,385
Exercise of stock options and other equity awards 2,923,184 — 21,923 —
Repurchase of Common Shares (76,437 ) — (493 ) —
Ending balance, as at December 31, 2017 147,947,874 1,139,249 1,199,834 684,385
Exercise of stock options and other equity awards 1,791,860 — 38,048 —
Exercise of warrants 2,422,944 — 14,688 —
Conversion of Preference Shares 60,013,510 (1,139,249 ) 684,385 (684,385 )
Issuance of Common Shares in connection with acquired
subsidiaries 41,049,398
—
1,477,478
—
Issuance of Common Shares in connection with Equity Offering 18,875,000 — 690,353 —
Issue of Common Shares in connection with market access
agreement 1,076,658
—
20,661
—
Equity Fees — — (5,413 ) —
Reversal of 2014 deferred tax — — (3,747 ) —
Ending balance, as at December 31, 2018 273,177,244 — 4,116,287 —

57
Equity Offering
On June 26, 2018, the Corporation closed an underwritten public offering of Common Shares (the “Equity Offering”) at a price of $38.00 per Common Share. The Corporation sold a total of 17,000,000 Common Shares and certain selling shareholders of the Corporation sold 8,000,000 Common Shares. The net proceeds to the Corporation (excluding the over-allotment proceeds), after underwriting discounts and commissions, but before expenses of the Equity Offering payable by the Corporation, were $621.8 million. The Equity Offering also included an over-allotment option granted to the underwriters to purchase an additional 1,875,000 Common Shares from the Corporation and 1,875,000 Common Shares from the selling shareholders at a price of $38.00 per Common Share. The underwriters exercised this over-allotment option in full on July 20, 2018, which closed on July 24, 2018 and resulted in additional net proceeds to the Corporation after underwriting discounts and commissions, but before expenses of the over-allotment option payable by the Corporation, of $68.6 million.
Preferred Share Conversion
On June 5, 2018, the Corporation announced that it elected to effect the conversion of all Preferred Shares pursuant to their terms (the “Preferred Share Conversion”) as a result of meeting the applicable price and liquidity conditions with respect to the same. As a result, on July 18, 2018, all of the Corporation’s outstanding Preferred Shares were converted into Common Shares at a rate of 52.7085 Common Shares per Preferred Share, resulting in the cancellation of all of the Preferred Shares and the issuance of 51,999,623 million Common Shares to the holders thereof. All the Preferred Shares were cancelled and all rights associated therewith were terminated.
Prior to completion of the Preferred Share Conversion, Polar Multi-Strategy Master Fund (and certain affiliated funds) and Verition Canada Master Fund Ltd. applied to the Ontario Superior Court of Justice for a declaration that the mandatory conversion would contravene the Corporation’s articles of continuance. On July 17, 2018 the Superior Court ruled in favor of the Corporation and dismissed the application. As a result, the Corporation proceeded with the conversion as indicated above. The applicants subsequently appealed the Superior Court decision and in the appeal are seeking, among other things, rescission of the conversion or potential damages.
In addition to the Common Shares issued in connection with the Equity Offering and Preferred Share Conversion as described above, during the year ended December 31, 2018:
• The Corporation issued 1,731,761 Common Shares for cash consideration of $31.0 million as a result of the exercise of stock options. The exercised stock options were initially valued at $5.8 million. Upon exercise, the values originally allocated to the stock options in the Equity reserve were reallocated to the Common Shares so issued.
• The Corporation issued 60,099 Common Shares in connection with the settlement of other equity-based awards, initially valued at $1.2 million. Upon settlement of such equity-based awards, the values originally allocated to the equity-based awards in the Equity reserve were reallocated to the Common Shares issued.
• The Corporation issued 2,422,944 Common Shares as a result of the exercise of 4,000,000 warrants. There are no further outstanding warrants as at December 31, 2018. The exercised warrants were initially valued at $14.7 million. Upon the exercise of such warrants, the value originally allocated to the Warrants reserve was reallocated to the Common Shares so issued.
• The Corporation issued 8,013,887 Common Shares as a result of the voluntary conversion of 152,698 Preferred Shares prior to the Preferred Share Conversion. The converted Preferred Shares were initially valued at $114.9 million. Upon the conversion of the Preferred Shares, the value originally allocated to the Preferred Shares was reallocated to the Common Shares so issued. 8,000,000 of the Common Shares issued as a result of such voluntary conversion were then sold by the holders thereof in the Equity Offering.
• The Corporation issued 3,115,344 Common Shares, valued at $96.4 million, to the sellers of BetEasy as partial consideration for the acquisition of an additional 18% of the equity interests in BetEasy.
• The Corporation issued 37,934,054 Common Shares, valued at $1.38 billion, to the sellers of SBG as partial consideration for the SBG Acquisition.
• The Corporation issued 1,076,658 Common Shares, valued at $20.7 million, to Eldorado Resorts, Inc. (“Eldorado”) in connection with an agreement with Eldorado which, among other things, grants the Corporation an option to operate online betting and gaming in certain states where Eldorado currently or in the future owns or operates casino properties.
During the year ended December 31, 2017:
• The Corporation issued 2,899,184 Common Shares for cash consideration of $16.6 million as a result of the exercise of stock options and the settlement of other equity awards. The exercised stock options and other equity awards were initially valued at $5.3 million. Upon the exercise of stock options and the settlement of other equity awards, the values originally allocated to the stock options and other equity awards in the Equity reserve were reallocated to the Common Shares so issued.
• The Corporation cancelled 76,437 common shares related to the previously disclosed acquisition of Amaya (Alberta) Inc. (formerly Chartwell Technology Inc.) (“Chartwell”) in 2011 that were unclaimed and surrendered to the Corporation. These securities were cancelled due to the expiration of the “sunset” provisions set forth in the arrangement agreement for the purchase, which provided for the cancellation of a right of the holder to receive cash consideration, for any certificates formerly representing Chartwell shares that were not deposited with all other documents as required by the applicable plan arrangement on or before the fourth anniversary of the date of purchase. The difference between the aggregate purchase price and the book value of the reclaimed shares was accounted for in the Treasury Reserve.

58
25. RESERVES
The following table highlights the classes of reserves included in the Corporation’s equity:
In thousands of U.S. Dollars
Acquisition
reserve Warrants Equity Treasury Cumulative
translation
Available for
sale investments
Financial
assets at
FVOCI
Cash
flow
hedging Other Total
Balance – January 1, 2017 — 14,638 31,142 (30,035 ) 77,171 (9,983 ) — (48,335 ) 1,249 35,847
Cumulative translation adjustments — — — — (189,012 ) — — — — (189,012 )
Stock-based compensation — — 10,622 — — — — — — 10,622
Exercise of equity awards — — (5,258 ) — — — — — — (5,258 )
Realized (losses) gains — — — — — (37,090 ) — 160,069 — 122,979
Unrealized gains (losses) — — — — — 32,474 — (151,311 ) — (118,837 )
Reclassification * — 50 — — (8,868 ) 9,197 — — (379 ) —
Deferred tax on stock-based
compensation — — 359 — — — — — — 359
Other — — — 493 — — — 5,594 (5,127 ) 960
Balance – December 31, 2017 — 14,688 36,865 (29,542 ) (120,709 ) (5,402 ) — (33,983 ) (4,257 ) (142,340 )
Impact of adoption of IFRS 9 — — — — — 45 168 — — 213
Reclassification ** — — — — 15 5,357 — — (5,372 ) —
Balance - January 1, 2018 (restated)
(note 4) — 14,688 36,865 (29,542 ) (120,694 ) — 168 (33,983 ) (9,629 ) (142,127 )
Cumulative translation adjustments — — — — (93,350 ) — — — — (93,350 )
Stock-based compensation — — 12,806 — — — — — — 12,806
Exercise of stock options and release
of equity awards — — (6,982 ) — — — — — — (6,982 )
Re-allocation from warrants reserve to share capital for exercised warrants — (14,688 ) — — — — — — — (14,688 )
Realized gains (losses) — — — — — — (311 ) (45,271 ) — (45,582 )
Unrealized (losses) gains — — — — — — (339 ) 41,201 — 40,862
Deferred Tax on Re-measurements — — — — — — 53 — — 53
Reversal of deferred tax on stock-
based compensation — — (359 ) — — — — — — (359 )
Impairment of debt instruments at
FVOCI — — — — — — (84 ) — — (84 )
Further acquisition of subsidiary (220,023 ) — — — — — — — (155 ) (220,178 )
Balance – December 31, 2018 (220,023 ) — 42,330 (29,542 ) (214,044 ) — (513 ) (38,053 ) (9,784 ) (469,629 )
* During the year ended December 31, 2017, the principal reclassification made by the Corporation was $9.2 million from the
Cumulative translation adjustments reserve to the “Available-for-sale investments” reserve to correct an error in a previous period.
** Upon adoption of IFRS 9, the Corporation reclassified amounts in the available for sale investments reserve to the financial assets at
FVOCI reserve. The Corporation identified $5.4 million of other reserves not directly related to available for sale investments and
reclassified this balance the other reserve.
Acquisition reserve
On February 27, 2018, a subsidiary of the Corporation completed its acquisition of a 62% interest in BetEasy. On April 24, 2018, a
subsidiary of the Corporation acquired an additional 18% interest in BetEasy and on the same date, BetEasy completed its acquisition
of 100% of TSGA. The carrying amounts of the controlling and non-controlling interest were adjusted to reflect the changes in the
Corporation’s equity interest in BetEasy. The change in carrying amounts were recognized directly in equity in acquisition reserve and
any difference between the amount by which the non-controlling interest was adjusted and the fair value of the consideration paid was
attributed to the Corporation.
Cumulative translation adjustments
Exchange differences relating to the translation of the net assets of the Corporation’s foreign operations from their functional currency
into the Corporation’s presentational currency are recognized directly in the Cumulative translation adjustment reserve. This reserve
also recognizes the realized and unrealized gains and losses in derivative instruments designated as net investment hedges. See note 19.
Cash flow hedging reserve
This reserve recognizes realized and unrealized gains and losses in derivative instruments designated as cash flow hedges. See note 19.
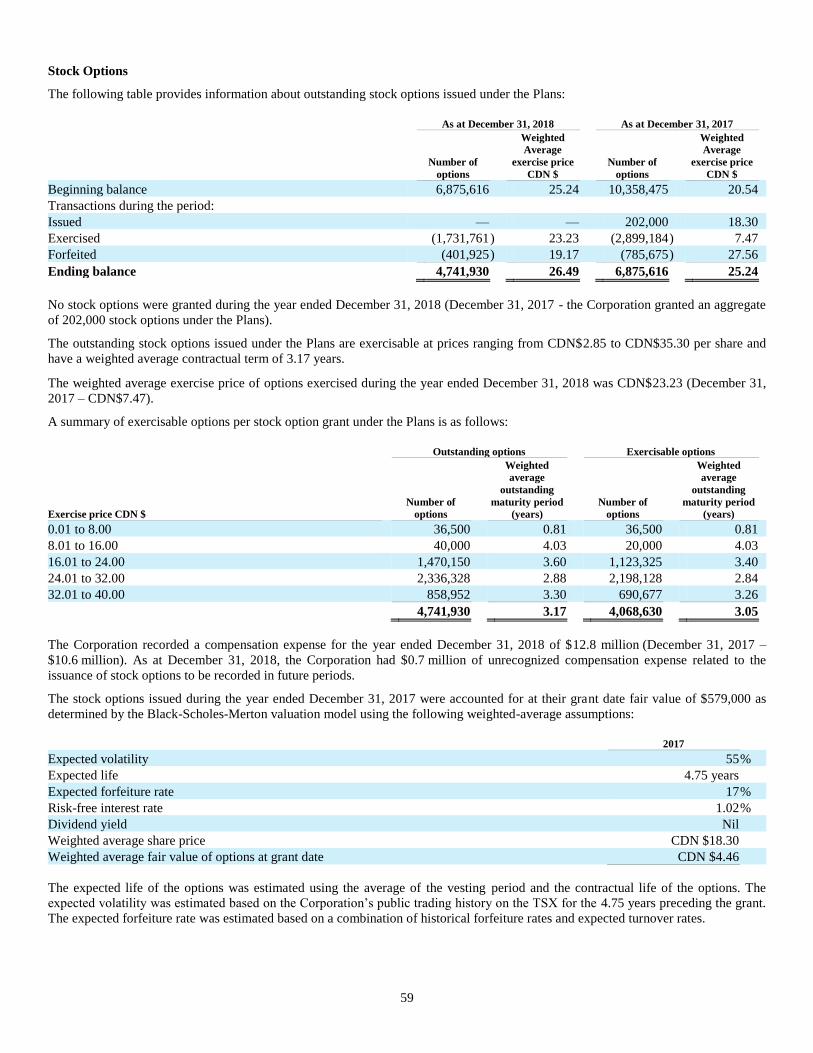
59
Stock Options
The following table provides information about outstanding stock options issued under the Plans:
As at December 31, 2018 As at December 31, 2017
Number of
options
Weighted
Average
exercise price
CDN $
Number of
options
Weighted
Average
exercise price
CDN $
Beginning balance 6,875,616 25.24 10,358,475 20.54
Transactions during the period:
Issued — — 202,000 18.30
Exercised (1,731,761 ) 23.23 (2,899,184 ) 7.47
Forfeited (401,925 ) 19.17 (785,675 ) 27.56
Ending balance 4,741,930 26.49 6,875,616 25.24
No stock options were granted during the year ended December 31, 2018 (December 31, 2017 - the Corporation granted an aggregate
of 202,000 stock options under the Plans).
The outstanding stock options issued under the Plans are exercisable at prices ranging from CDN$2.85 to CDN$35.30 per share and
have a weighted average contractual term of 3.17 years.
The weighted average exercise price of options exercised during the year ended December 31, 2018 was CDN$23.23 (December 31,
2017 – CDN$7.47).
A summary of exercisable options per stock option grant under the Plans is as follows:
Outstanding options Exercisable options
Exercise price CDN $
Number of
options
Weighted
average
outstanding
maturity period
(years)
Number of
options
Weighted
average
outstanding
maturity period
(years)
0.01 to 8.00 36,500 0.81 36,500 0.81
8.01 to 16.00 40,000 4.03 20,000 4.03
16.01 to 24.00 1,470,150 3.60 1,123,325 3.40
24.01 to 32.00 2,336,328 2.88 2,198,128 2.84
32.01 to 40.00 858,952 3.30 690,677 3.26
4,741,930 3.17 4,068,630 3.05
The Corporation recorded a compensation expense for the year ended December 31, 2018 of $12.8 million (December 31, 2017 –
$10.6 million). As at December 31, 2018, the Corporation had $0.7 million of unrecognized compensation expense related to the
issuance of stock options to be recorded in future periods.
The stock options issued during the year ended December 31, 2017 were accounted for at their grant date fair value of $579,000 as
determined by the Black-Scholes-Merton valuation model using the following weighted-average assumptions:
2017
Expected volatility 55 %
Expected life 4.75 years
Expected forfeiture rate 17 %
Risk-free interest rate 1.02 %
Dividend yield Nil
Weighted average share price CDN $18.30
Weighted average fair value of options at grant date CDN $4.46
The expected life of the options was estimated using the average of the vesting period and the contractual life of the options. The
expected volatility was estimated based on the Corporation’s public trading history on the TSX for the 4.75 years preceding the grant.
The expected forfeiture rate was estimated based on a combination of historical forfeiture rates and expected turnover rates.

60
RSUs
The following table provides information about outstanding RSUs issued by the Corporation under the 2015 Equity Incentive Plan.
2018 No. of units
Weighted Average
Fair Value 2017 No. of units
Weighted
Average Fair
Value
Balance as at January 1 141,064 $22.46 — —
Issued 123,833 $31.92 153,064 $22.41
Vested and settled (35,268 ) $22.47 (12,000 ) $21.80
Forfeited (9,429 ) $22.58 — —
Balance as at December 31 220,200 $29.72 141,064 $22.46
PSUs
The following table provides information about outstanding PSUs issued by the Corporation under the 2015 Equity Incentive Plan. In
addition to the issued and outstanding PSUs, the Corporation will issue additional PSUs of up to 50% upon the achievement of market
vesting conditions.
2018
No. of units
Weighted
Average Fair
Value
2017
No. of units
Weighted
Average Fair
Value
Balance as at January 1 282,036 $22.47 — —
Issued 423,374 $30.09 282,036 $22.47
Vested and settled — — — —
Forfeited (19,464 ) $22.58 — —
Balance as at December 31 685,946 $27.17 282,036 $22.47
DSUs
The following table provides information about outstanding DSUs issued by the Corporation under the 2015 Equity Incentive Plan.
2018 No. of units
Weighted
Average Fair
Value 2017 No. of units
Weighted
Average Fair
Value
Balance as at January 1 92,703 $15.26 — —
Issued 133,383 $22.96 92,703 $15.26
Vested and settled (24,831 ) $23.17 — —
Forfeited — — — —
Balance as at December 31 201,255 $19.39 92,703 $15.26
Dividend Equivalents
During the years ended December 31, 2018 and 2017, no dividends were declared.
Warrants
The following table provides information about outstanding warrants at December 31, 2018 and 2017:
As at December 31, 2018 As at December 31, 2017
Number of
warrants
Weighted
Average
exercise price
CDN $
Number of
warrants
Weighted
Average
exercise price
CDN $
Beginning balance 4,000,000 19.17 4,000,000 19.17
Issued — — — —
Exercised (4,000,000 ) 19.17 — —
Expired — — — —
Ending balance — — 4,000,000 19.17
26. FAIR VALUE
The Corporation determined that the carrying values of its short-term financial assets and liabilities approximate their fair value because
of the relatively short periods to maturity of these instruments and low risk of credit.
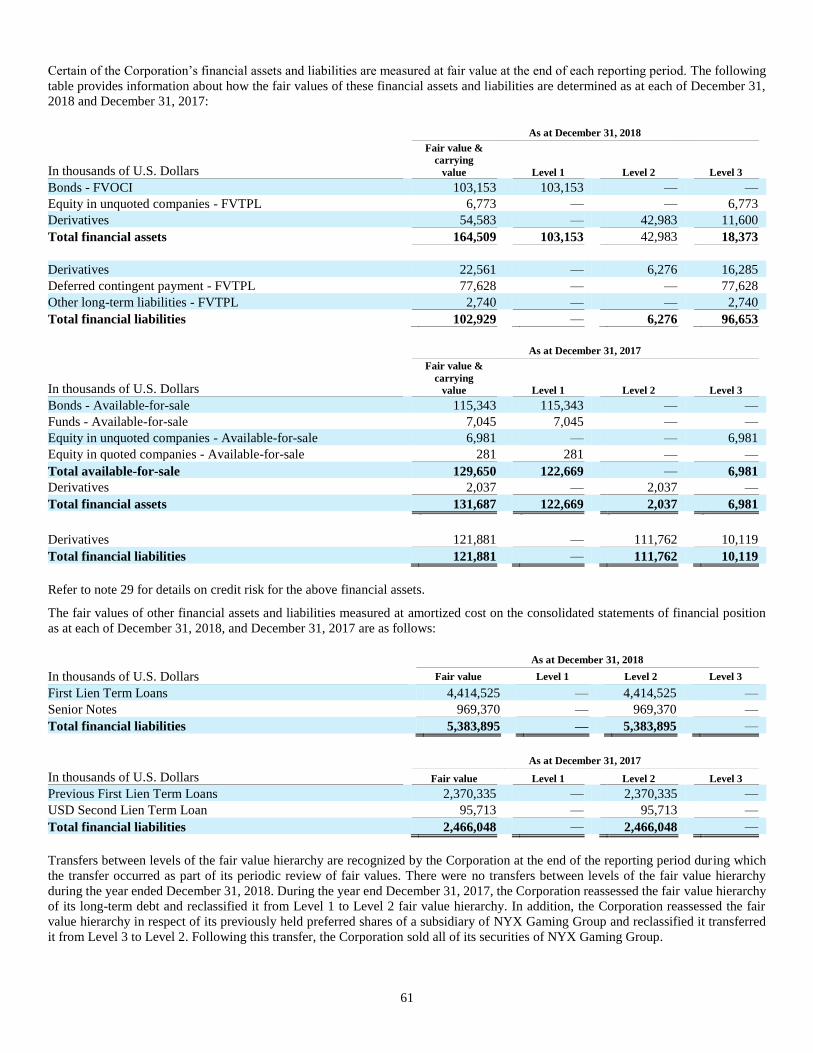
61
Certain of the Corporation’s financial assets and liabilities are measured at fair value at the end of each reporting period. The following
table provides information about how the fair values of these financial assets and liabilities are determined as at each of December 31,
2018 and December 31, 2017:
As at December 31, 2018
In thousands of U.S. Dollars
Fair value &
carrying value
Level 1 Level 2 Level 3
Bonds - FVOCI 103,153 103,153 — —
Equity in unquoted companies - FVTPL 6,773 — — 6,773
Derivatives 54,583 — 42,983 11,600
Total financial assets 164,509 103,153 42,983 18,373
Derivatives 22,561 — 6,276 16,285
Deferred contingent payment - FVTPL 77,628 — — 77,628
Other long-term liabilities - FVTPL 2,740 — — 2,740
Total financial liabilities 102,929 — 6,276 96,653
As at December 31, 2017
In thousands of U.S. Dollars
Fair value &
carrying value Level 1 Level 2 Level 3
Bonds - Available-for-sale 115,343 115,343 — —
Funds - Available-for-sale 7,045 7,045 — —
Equity in unquoted companies - Available-for-sale 6,981 — — 6,981
Equity in quoted companies - Available-for-sale 281 281 — —
Total available-for-sale 129,650 122,669 — 6,981
Derivatives 2,037 — 2,037 —
Total financial assets 131,687 122,669 2,037 6,981
Derivatives 121,881 — 111,762 10,119
Total financial liabilities 121,881 — 111,762 10,119
Refer to note 29 for details on credit risk for the above financial assets.
The fair values of other financial assets and liabilities measured at amortized cost on the consolidated statements of financial position
as at each of December 31, 2018, and December 31, 2017 are as follows:
As at December 31, 2018
In thousands of U.S. Dollars Fair value Level 1 Level 2 Level 3
First Lien Term Loans 4,414,525 — 4,414,525 —
Senior Notes 969,370 — 969,370 —
Total financial liabilities 5,383,895 — 5,383,895 —
As at December 31, 2017
In thousands of U.S. Dollars Fair value Level 1 Level 2 Level 3
Previous First Lien Term Loans 2,370,335 — 2,370,335 —
USD Second Lien Term Loan 95,713 — 95,713 —
Total financial liabilities 2,466,048 — 2,466,048 —
Transfers between levels of the fair value hierarchy are recognized by the Corporation at the end of the reporting period during which
the transfer occurred as part of its periodic review of fair values. There were no transfers between levels of the fair value hierarchy
during the year ended December 31, 2018. During the year end December 31, 2017, the Corporation reassessed the fair value hierarchy
of its long-term debt and reclassified it from Level 1 to Level 2 fair value hierarchy. In addition, the Corporation reassessed the fair
value hierarchy in respect of its previously held preferred shares of a subsidiary of NYX Gaming Group and reclassified it transferred
it from Level 3 to Level 2. Following this transfer, the Corporation sold all of its securities of NYX Gaming Group.
62
Valuation of Level 2 fair values
Long-Term Debt
The Corporation estimates the fair value of its long-term debt by using a composite price derived from observable market data for a
basket of similar instruments.
Derivative Financial Instruments
Currently, the Corporation uses cross currency swap and interest rate swap agreements to manage its interest rate and foreign currency
risk and foreign currency forward and option contracts to manage foreign currency risk. The valuation of these instruments is determined
using widely accepted valuation techniques including discounted cash flow analysis on the expected cash flows of each derivative. This
analysis reflects the contractual terms of the derivatives, including the period to maturity, and uses observable market-based inputs,
including interest rate curves, as well as spot and forward rates.
To comply with the provisions of IFRS 13, Fair value measurement, the Corporation incorporates credit valuation adjustments to
appropriately reflect both its own non-performance risk and the respective counterparty’s non-performance risk in the fair value
measurements. In adjusting the fair value of its derivative contracts for the effect of non-performance risk, the Corporation has
considered the impact of netting and any applicable credit enhancements, such as collateral postings, thresholds, mutual puts, and
guarantees.
Although the Corporation has determined that the majority of the inputs used to value its derivatives fall within Level 2 of the fair value
hierarchy, the credit valuation adjustments associated with its derivatives utilize Level 3 inputs, such as estimates of current credit
spreads to evaluate the likelihood of default by itself and its counterparties. However, as of December 31, 2018 and December 31, 2017,
the Corporation has assessed the significance of the impact of the credit valuation adjustments on the overall valuation of its derivative
positions, with the exception of the Embedded Derivative which is classified as Level 3, and determined that the credit valuation
adjustments are not significant to the overall valuation of its derivatives. As a result, the Corporation determined that its valuations of
the Swap Agreements and Previous Swap Agreements in their entirety are classified in Level 2 of the fair value hierarchy.
Reconciliation of Level 3 fair values
Some of the Corporation’s financial assets and liabilities are classified as Level 3 of the fair value hierarchy because the respective fair
value determinations use inputs that are not based on observable market data. As at December 31, 2018 and December 31, 2017, for
each Level 3 asset or liability the valuation techniques and key inputs used by the Corporation were as follows:
- Equity in private companies (Level 3 Asset): The Corporation values its equity investment in private companies with reference
to earnings measures from similar businesses in the same or similar industry and adjusts for any significant changes in the
earnings multiple and the valuation. Changes in the fair value of equity in private companies are recorded in loss (gain) on
disposal of investments and other assets within general and administrative expense on the consolidated statements of (loss)
earnings.
- Promissory note (Level 3 Asset): The Corporation recognized a promissory note in connection with the sale of a former
subsidiary. The Corporation received the full balance of the promissory note during the year ended December 31, 2017.
- Deferred contingent payment (Level 3 Liability) in connection with the acquisition of the additional 18% equity interest in
BetEasy (see note 5): The Corporation used a risk-neutral derivative-based simulation of the underlying EBITDA forecast to
determine the fair value of the deferred contingent payment, used a discount rate of 10.5% and an EBITDA forecast with an
estimated volatility of 25% of the historic EBITDA of comparable companies. A five percentage point increase or decrease in
the estimated volatility would have a $3.8 million or $0.7 million impact on fair value, respectively. Changes in the fair value
of the deferred contingent payment are recorded in net financing changes on the consolidated statements of (loss) earnings.
- Embedded Derivative (Level 3 Asset) in connection with the Senior Notes issuance: The Corporation used an interest rate
option pricing valuation model to determine the fair value of the Redemption option using an implied credit spread of 3.8% at
issuance and 4.6% at December 31, 2018. A 10 basis point increase or decrease in the implied credit spread would have a $1.0
million or $0.9 million impact on fair value, respectively. Changes in the fair value of the Embedded Derivative are recorded
in net financing changes on the consolidated statements of (loss) earnings.
- Unsettled bets (Level 3 Liability): The principal assumptions used in the valuation of unsettled bets is the anticipated outcomes
for the events related to the unsettled bets (gross win margin). A reasonable change in the gross win margin would not have a
material impact on fair value. Changes in the fair value of the deferred contingent payment are recorded in revenue on the
consolidated statements of (loss) earnings.

63
- Included within other level 3 liabilities:
o EBITDA support agreement (Level 3 Liability): As previously disclosed, in connection with the initial public offering
Innova Gaming Group Inc. (TSX: IGG) (“Innova”), the Corporation entered into an EBITDA support agreement with
Innova. The Corporation uses a net present value approach for the EBITDA support agreement using a 5.7% discount
rate (2017 – 5.7% discount rate). A reasonable change in the discount rate would not have a material impact on fair
value. The fair value of the support agreement as at December 31, 2018 was $2.7 million and is included in accounts
payable and other liabilities. Changes in the fair value of the EBITDA support agreement are recorded in net financing
changes on the consolidated statements of (loss) earnings.
o Licensing Agreement (Level 3 Liability): As previously disclosed, a subsidiary of the Corporation entered into a
supplier licensing agreement with NYX Gaming Group (the “Licensing Agreement”). The Licensing Agreement
expired during the year ended December 31, 2018.
The following table shows a reconciliation from opening balances to the closing balances for Level 3 fair values:
In thousands of U.S Dollars Level 3 Equity Level 3
Promissory note Level 3 Embedded
Derivative
Balance – January 1, 2017 15,249 4,827 —
Transfers into Level 3 (8,526 ) — —
Re-measurement of fair value 258 3,257 —
Settlement — (8,084 ) —
Balance – December 31, 2017 6,981 — —
Adjustment on adoption of IFRS 9 1,787 — —
Balance – January 1, 2018 (restated) 8,768 — —
Recognized — — 17,700
Re-measurement of fair value (1,974 ) — (6,100 )
Translation (22 ) — —
Balance – December 31, 2018 6,772 — 11,600
In thousands of U.S Dollars Level 3 Deferred
contingent payment Level 3 Unsettled
Bets * Other
Balance – January 1, 2017 195,506 519 23,230
Settlement (197,510 ) 179 (14,905 )
Re-measurement of fair value 2,004 38 718
Translation — 43 1,076
Balance – December 31, 2017 — 779 10,119
Acquired on business combination 84,662 19,226 —
Settlements — 968 (7,006 )
Re-measurement of fair value (342 ) (4,782 ) 215
Translation (6,692 ) 94 (588 )
Balance – December 31, 2018 77,628 16,285 2,740
* The unsettled bets liability is recorded in accounts payable and other liabilities on the consolidated statement of financial position as
at December 31, 2017 and is recorded in derivatives on the consolidated statement of financial position as at December 31, 2018.
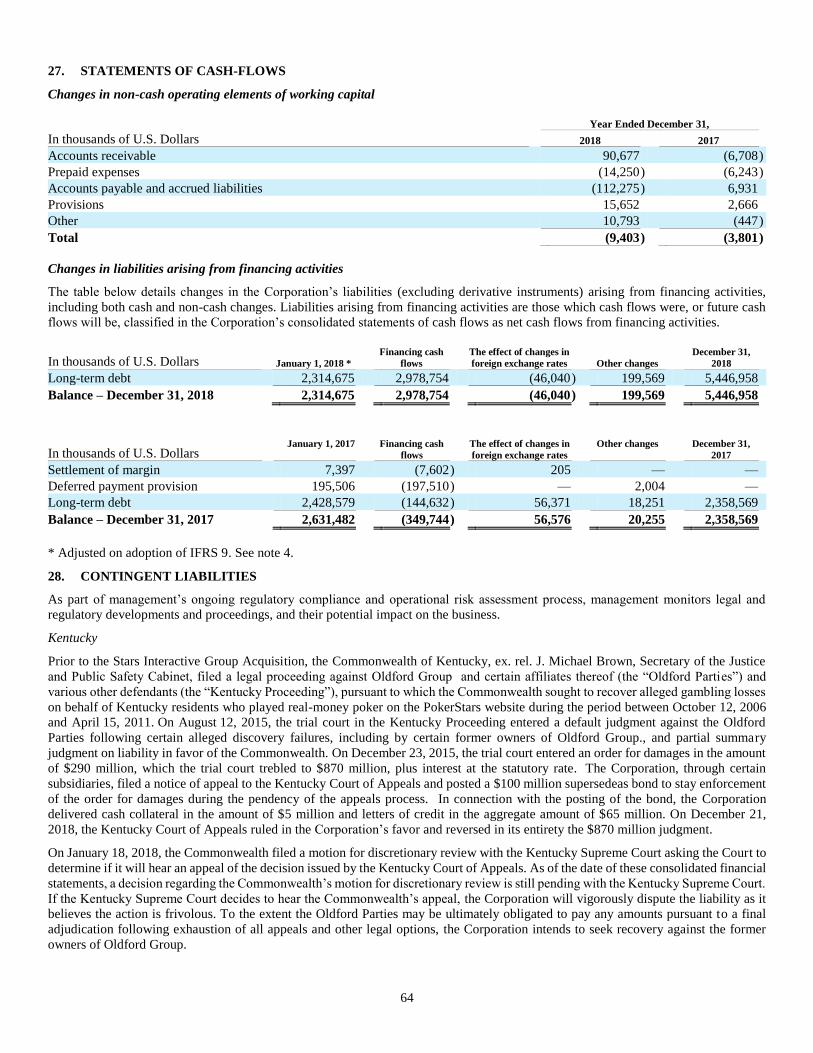
64
27. STATEMENTS OF CASH-FLOWS
Changes in non-cash operating elements of working capital
Year Ended December 31,
In thousands of U.S. Dollars 2018 2017
Accounts receivable 90,677 (6,708 )
Prepaid expenses (14,250 ) (6,243 )
Accounts payable and accrued liabilities (112,275 ) 6,931
Provisions 15,652 2,666
Other 10,793 (447 )
Total (9,403 ) (3,801 )
Changes in liabilities arising from financing activities
The table below details changes in the Corporation’s liabilities (excluding derivative instruments) arising from financing activities,
including both cash and non-cash changes. Liabilities arising from financing activities are those which cash flows were, or future cash
flows will be, classified in the Corporation’s consolidated statements of cash flows as net cash flows from financing activities.
In thousands of U.S. Dollars January 1, 2018 * Financing cash
flows The effect of changes in
foreign exchange rates Other changes December 31,
2018
Long-term debt 2,314,675 2,978,754 (46,040 ) 199,569 5,446,958
Balance – December 31, 2018 2,314,675 2,978,754 (46,040 ) 199,569 5,446,958
In thousands of U.S. Dollars January 1, 2017 Financing cash
flows
The effect of changes in
foreign exchange rates
Other changes
December 31,
2017
Settlement of margin 7,397 (7,602 ) 205 — —
Deferred payment provision 195,506 (197,510 ) — 2,004 —
Long-term debt 2,428,579 (144,632 ) 56,371 18,251 2,358,569
Balance – December 31, 2017 2,631,482 (349,744 ) 56,576 20,255 2,358,569
* Adjusted on adoption of IFRS 9. See note 4.
28. CONTINGENT LIABILITIES
As part of management’s ongoing regulatory compliance and operational risk assessment process, management monitors legal and
regulatory developments and proceedings, and their potential impact on the business.
Kentucky
Prior to the Stars Interactive Group Acquisition, the Commonwealth of Kentucky, ex. rel. J. Michael Brown, Secretary of the Justice
and Public Safety Cabinet, filed a legal proceeding against Oldford Group and certain affiliates thereof (the “Oldford Parties”) and
various other defendants (the “Kentucky Proceeding”), pursuant to which the Commonwealth sought to recover alleged gambling losses
on behalf of Kentucky residents who played real-money poker on the PokerStars website during the period between October 12, 2006
and April 15, 2011. On August 12, 2015, the trial court in the Kentucky Proceeding entered a default judgment against the Oldford
Parties following certain alleged discovery failures, including by certain former owners of Oldford Group., and partial summary
judgment on liability in favor of the Commonwealth. On December 23, 2015, the trial court entered an order for damages in the amount
of $290 million, which the trial court trebled to $870 million, plus interest at the statutory rate. The Corporation, through certain
subsidiaries, filed a notice of appeal to the Kentucky Court of Appeals and posted a $100 million supersedeas bond to stay enforcement
of the order for damages during the pendency of the appeals process. In connection with the posting of the bond, the Corporation
delivered cash collateral in the amount of $5 million and letters of credit in the aggregate amount of $65 million. On December 21,
2018, the Kentucky Court of Appeals ruled in the Corporation’s favor and reversed in its entirety the $870 million judgment.
On January 18, 2018, the Commonwealth filed a motion for discretionary review with the Kentucky Supreme Court asking the Court to
determine if it will hear an appeal of the decision issued by the Kentucky Court of Appeals. As of the date of these consolidated financial
statements, a decision regarding the Commonwealth’s motion for discretionary review is still pending with the Kentucky Supreme Court.
If the Kentucky Supreme Court decides to hear the Commonwealth’s appeal, the Corporation will vigorously dispute the liability as it
believes the action is frivolous. To the extent the Oldford Parties may be ultimately obligated to pay any amounts pursuant to a final
adjudication following exhaustion of all appeals and other legal options, the Corporation intends to seek recovery against the former
owners of Oldford Group.
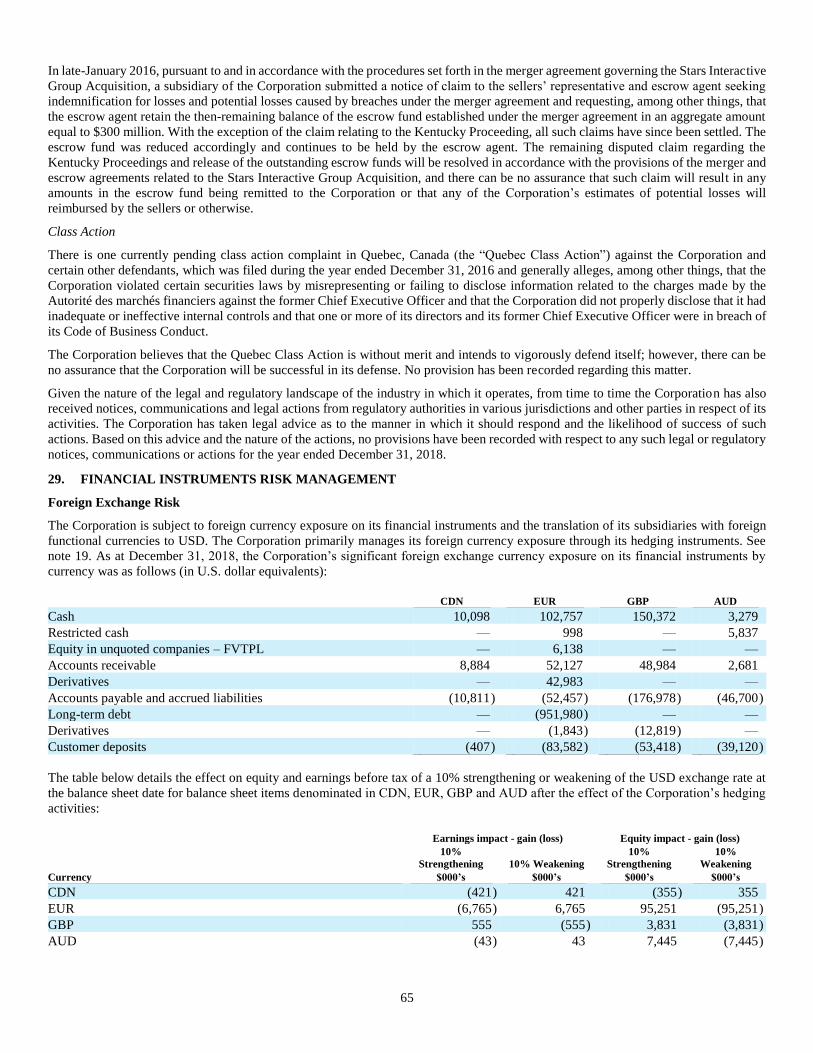
65
In late-January 2016, pursuant to and in accordance with the procedures set forth in the merger agreement governing the Stars Interactive
Group Acquisition, a subsidiary of the Corporation submitted a notice of claim to the sellers’ representative and escrow agent seeking
indemnification for losses and potential losses caused by breaches under the merger agreement and requesting, among other things, that
the escrow agent retain the then-remaining balance of the escrow fund established under the merger agreement in an aggregate amount
equal to $300 million. With the exception of the claim relating to the Kentucky Proceeding, all such claims have since been settled. The
escrow fund was reduced accordingly and continues to be held by the escrow agent. The remaining disputed claim regarding the
Kentucky Proceedings and release of the outstanding escrow funds will be resolved in accordance with the provisions of the merger and
escrow agreements related to the Stars Interactive Group Acquisition, and there can be no assurance that such claim will result in any
amounts in the escrow fund being remitted to the Corporation or that any of the Corporation’s estimates of potential losses will
reimbursed by the sellers or otherwise.
Class Action
There is one currently pending class action complaint in Quebec, Canada (the “Quebec Class Action”) against the Corporation and
certain other defendants, which was filed during the year ended December 31, 2016 and generally alleges, among other things, that the
Corporation violated certain securities laws by misrepresenting or failing to disclose information related to the charges made by the
Autorité des marchés financiers against the former Chief Executive Officer and that the Corporation did not properly disclose that it had
inadequate or ineffective internal controls and that one or more of its directors and its former Chief Executive Officer were in breach of
its Code of Business Conduct.
The Corporation believes that the Quebec Class Action is without merit and intends to vigorously defend itself; however, there can be
no assurance that the Corporation will be successful in its defense. No provision has been recorded regarding this matter.
Given the nature of the legal and regulatory landscape of the industry in which it operates, from time to time the Corporation has also
received notices, communications and legal actions from regulatory authorities in various jurisdictions and other parties in respect of its
activities. The Corporation has taken legal advice as to the manner in which it should respond and the likelihood of success of such
actions. Based on this advice and the nature of the actions, no provisions have been recorded with respect to any such legal or regulatory
notices, communications or actions for the year ended December 31, 2018.
29. FINANCIAL INSTRUMENTS RISK MANAGEMENT
Foreign Exchange Risk
The Corporation is subject to foreign currency exposure on its financial instruments and the translation of its subsidiaries with foreign
functional currencies to USD. The Corporation primarily manages its foreign currency exposure through its hedging instruments. See
note 19. As at December 31, 2018, the Corporation’s significant foreign exchange currency exposure on its financial instruments by
currency was as follows (in U.S. dollar equivalents):
CDN EUR GBP AUD
Cash 10,098 102,757 150,372 3,279
Restricted cash — 998 — 5,837
Equity in unquoted companies – FVTPL — 6,138 — —
Accounts receivable 8,884 52,127 48,984 2,681
Derivatives — 42,983 — —
Accounts payable and accrued liabilities (10,811 ) (52,457 ) (176,978 ) (46,700 )
Long-term debt — (951,980 ) — —
Derivatives — (1,843 ) (12,819 ) —
Customer deposits (407 ) (83,582 ) (53,418 ) (39,120 )
The table below details the effect on equity and earnings before tax of a 10% strengthening or weakening of the USD exchange rate at
the balance sheet date for balance sheet items denominated in CDN, EUR, GBP and AUD after the effect of the Corporation’s hedging
activities:
Earnings impact - gain (loss) Equity impact - gain (loss)
10%
Strengthening 10% Weakening 10%
Strengthening
10%
Weakening
Currency $000’s $000’s $000’s $000’s
CDN (421 ) 421 (355 ) 355
EUR (6,765 ) 6,765 95,251 (95,251 )
GBP 555 (555 ) 3,831 (3,831 )
AUD (43 ) 43 7,445 (7,445 )

66
The table below details the effect on equity of a 10% strengthening or weakening of the EUR:USD or the EUR:GBP exchange rates on
the valuations of the Swap Agreements that hedge the USD First Lien Term Loan. 10% is the sensitivity rate used when reporting foreign
currency risk internally to key management personnel and represents management’s assessment of the reasonably possible change in
foreign exchange rates.
$000's
- 10% + 10%
USD:EUR exchange rate (242,072 ) 266,280
EUR:GBP exchange rate (133,285 ) 146,614
Interest Rate Risk
The Corporation’s exposure to changes in interest rates (particularly, fluctuations in LIBOR) relates primarily to interest paid on the
Corporation’s long-term indebtedness, as well as the interest earned on and market value of its cash and investments. The Corporation
is also exposed to fair value interest rate risk with respect to its Senior Notes and cash flow interest rate risk on the unhedged elements
of the USD First Lien Term Loan, and the EUR First Lien Term Loan which bear interest at variable rates. The Corporation manages
its foreign currency exposure through its hedging instruments. See note 19.
The table below details the effect on earnings before tax of a 100 basis points strengthening or weakening of the LIBOR and EURIBOR
interest rates on these loans after the effect of the Corporation’s hedging activities. 100 basis points sensitivity is the sensitivity rate used
when reporting interest rate risk internally to key management personnel and represents management’s assessment of the reasonably
possible change in interest rates:
Net earnings (loss) $000's
- 100 bps + 100 bps
USD LIBOR 7,249 (7,886 )
EURIBOR — (4,734 )
The USD First Lien Term Loan has a floor of 0% for the LIBOR and as such, the interest rate cannot decrease below 3.50% respectively.
The EUR First Lien Term Loan has a floor of 0% for the EURIBOR and as such, the interest rate cannot decrease below 3.75%.
Management monitors movements in the interest rates by reviewing the EURIBOR and LIBOR on a quarterly basis. During the year
ended December 31, 2018 the EURIBOR was negative.
The table below details the effect on equity of a 100 basis points strengthening or weakening of the LIBOR and EURIBOR interest rates
on the valuations of the Swap Agreements that hedge the USD First Lien Term Loan. 100 basis points is the sensitivity rate used when
reporting interest rate risk internally to key management personnel and represents management’s assessment of the reasonably possible
change in interest rates:
$000's
- 100 bps + 100 bps
LIBOR (6,690 ) 6,097
GBP LIBOR (60,259 ) 57,436
EURIBOR (50,227 ) 47,596
In July 2017, the Financial Conduct Authority (the authority that regulates LIBOR) announced it intends to stop compelling banks to submit rates for the calculation of LIBOR after 2021. The Alternative Reference Rates Committee ("ARRC") has proposed that the Secured Overnight Financing Rate ("SOFR") is the rate that represents best practice as the alternative to USD-LIBOR for use in derivatives and other financial contracts that are currently indexed to USD-LIBOR. ARRC has proposed a paced market transition plan to SOFR from USD-LIBOR and organizations are currently working on industry wide and company specific transition plans as it relates to derivatives and cash markets exposed to USD-LIBOR. The Company has material contracts that are indexed to USD-LIBOR and is monitoring this activity and evaluating the related risks.
Credit Risk
Credit risk refers to the risk that a counterparty will default on its contractual obligations resulting in financial loss to the Corporation. The Corporation has adopted a policy of only dealing with creditworthy counterparties and obtaining sufficient collateral where appropriate, as a means of mitigating the risk of financial loss from defaults. The Corporation’s policy is to transact wherever possible with investment grade counterparties. This information is supplied by independent rating agencies where available, and if not available, the Corporation uses other publicly available financial information and its own trading records to rate its major customers. The Corporation’s exposure and the credit ratings of its counterparties are continuously monitored and the aggregate value of transactions concluded is spread amongst approved counterparties. Credit exposure is managed by the Corporation’s treasury and finance groups in accordance with the Corporation’s treasury investment policy, which was approved by the Corporation’s Audit Committee.
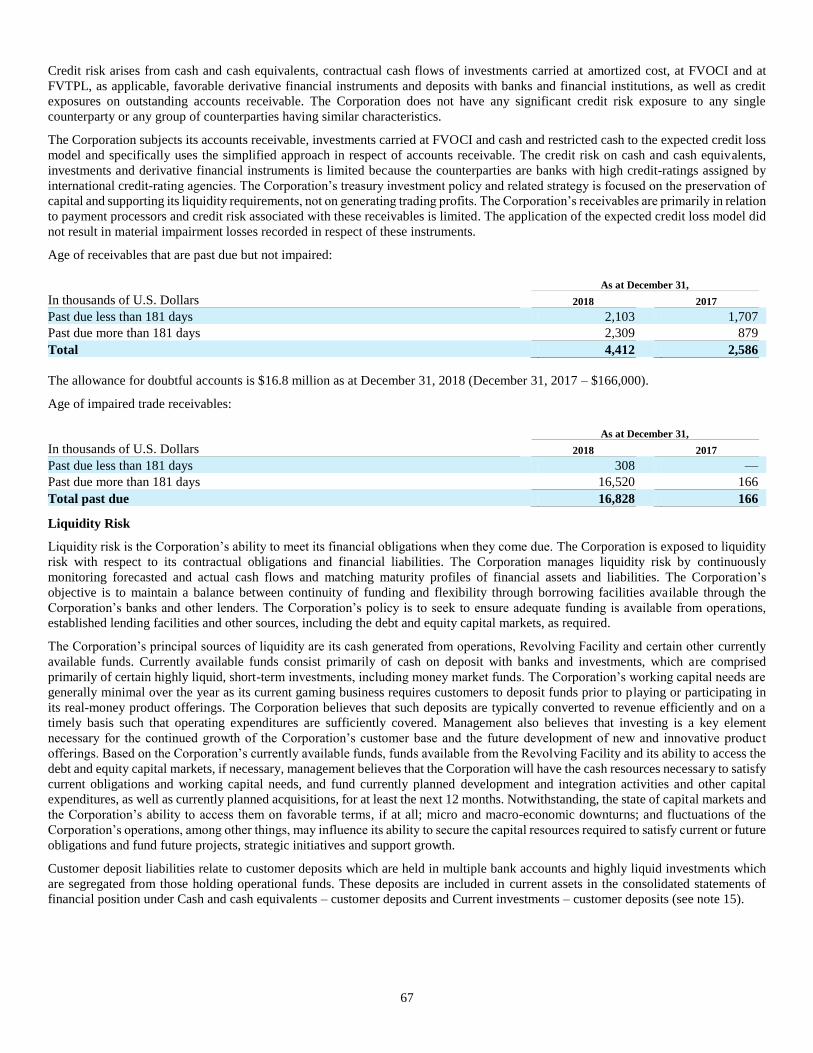
67
Credit risk arises from cash and cash equivalents, contractual cash flows of investments carried at amortized cost, at FVOCI and at
FVTPL, as applicable, favorable derivative financial instruments and deposits with banks and financial institutions, as well as credit
exposures on outstanding accounts receivable. The Corporation does not have any significant credit risk exposure to any single
counterparty or any group of counterparties having similar characteristics.
The Corporation subjects its accounts receivable, investments carried at FVOCI and cash and restricted cash to the expected credit loss
model and specifically uses the simplified approach in respect of accounts receivable. The credit risk on cash and cash equivalents,
investments and derivative financial instruments is limited because the counterparties are banks with high credit-ratings assigned by
international credit-rating agencies. The Corporation’s treasury investment policy and related strategy is focused on the preservation of
capital and supporting its liquidity requirements, not on generating trading profits. The Corporation’s receivables are primarily in relation
to payment processors and credit risk associated with these receivables is limited. The application of the expected credit loss model did
not result in material impairment losses recorded in respect of these instruments.
Age of receivables that are past due but not impaired:
As at December 31,
In thousands of U.S. Dollars 2018 2017
Past due less than 181 days 2,103 1,707
Past due more than 181 days 2,309 879
Total 4,412 2,586
The allowance for doubtful accounts is $16.8 million as at December 31, 2018 (December 31, 2017 – $166,000).
Age of impaired trade receivables:
As at December 31,
In thousands of U.S. Dollars 2018 2017
Past due less than 181 days 308 —
Past due more than 181 days 16,520 166
Total past due 16,828 166
Liquidity Risk
Liquidity risk is the Corporation’s ability to meet its financial obligations when they come due. The Corporation is exposed to liquidity
risk with respect to its contractual obligations and financial liabilities. The Corporation manages liquidity risk by continuously
monitoring forecasted and actual cash flows and matching maturity profiles of financial assets and liabilities. The Corporation’s
objective is to maintain a balance between continuity of funding and flexibility through borrowing facilities available through the
Corporation’s banks and other lenders. The Corporation’s policy is to seek to ensure adequate funding is available from operations,
established lending facilities and other sources, including the debt and equity capital markets, as required.
The Corporation’s principal sources of liquidity are its cash generated from operations, Revolving Facility and certain other currently
available funds. Currently available funds consist primarily of cash on deposit with banks and investments, which are comprised
primarily of certain highly liquid, short-term investments, including money market funds. The Corporation’s working capital needs are
generally minimal over the year as its current gaming business requires customers to deposit funds prior to playing or participating in
its real-money product offerings. The Corporation believes that such deposits are typically converted to revenue efficiently and on a
timely basis such that operating expenditures are sufficiently covered. Management also believes that investing is a key element
necessary for the continued growth of the Corporation’s customer base and the future development of new and innovative product
offerings. Based on the Corporation’s currently available funds, funds available from the Revolving Facility and its ability to access the
debt and equity capital markets, if necessary, management believes that the Corporation will have the cash resources necessary to satisfy
current obligations and working capital needs, and fund currently planned development and integration activities and other capital
expenditures, as well as currently planned acquisitions, for at least the next 12 months. Notwithstanding, the state of capital markets and
the Corporation’s ability to access them on favorable terms, if at all; micro and macro-economic downturns; and fluctuations of the
Corporation’s operations, among other things, may influence its ability to secure the capital resources required to satisfy current or future
obligations and fund future projects, strategic initiatives and support growth.
Customer deposit liabilities relate to customer deposits which are held in multiple bank accounts and highly liquid investments which
are segregated from those holding operational funds. These deposits are included in current assets in the consolidated statements of
financial position under Cash and cash equivalents – customer deposits and Current investments – customer deposits (see note 15).

68
The following table provides information about the terms of the Corporation’s financial obligations and liabilities:
On Less than 1 2 to 5 Greater than
demand year years 5 years
$000’s $000’s $000’s $000’s
Accounts payable and other liabilities * 131,268 242,108 79,716 —
Customer deposits 431,376 — — —
Derivatives — 16,493 6,068 —
Provisions — 39,189 3,844 158
Long-term debt ** — 349,328 1,363,382 5,816,656
Total 562,644 647,118 1,453,010 5,816,814
* Excludes VAT and other taxes as well as the interest accrual on Senior Notes, which are all included in accounts payable and other
liabilities on the statements of financial position
** Includes principal and interest, including the interest accrual on Senior Notes
30. RELATED PARTY TRANSACTIONS
Key management of the Corporation includes the members of the Board, the Chief Executive Officer, Chief Financial Officer, Chief
Operating Officer, Chief Corporate Development Officer, Executive Vice-President and Chief Legal Officer, Chief Technology Officer,
and certain other key members of management.
The compensation of such key management for the years ended December 31, 2018 and 2017 included the following:
Year Ended December 31,
In thousands of U.S. Dollars 2018 2017
Salaries, bonuses and short-term employee benefits 10,320 4,514
Director retainers 796 729
Stock-based payments 6,824 3,799
17,940 9,042
The remuneration of the Chief Executive Officer, Chief Financial Officer, Chief Technology Officer, Chief Operating Officer, Chief
Corporate Development Officer, Executive Vice-President and Chief Legal Officer consists primarily of a salary, cash bonuses and
share-based awards and was negotiated at arm’s length. Director retainers include both retainers, committee fees and share-based awards.
31. SUBSEQUENT EVENTS
Prepayment of First Lien Term Loans
On February 22, 2019, the Corporation prepaid $100.0 million of its USD First Lien Term Loan (as defined above), including accrued
and unpaid interest, using cash on its balance sheet.

69