AUDITED ANNUAL FINANCIAL STATEMENTS 2017 - … · 2017-11-24 · CONTENTS 1 Directors’...
76
AUDITED ANNUAL FINANCIAL STATEMENTS 2017
Transcript of AUDITED ANNUAL FINANCIAL STATEMENTS 2017 - … · 2017-11-24 · CONTENTS 1 Directors’...

AUDITED ANNUAL FINANCIAL STATEMENTS 2017

CONTENTS
1 Directors’ responsibility statement1 Certificate by the company secretary2 Directors’ report3 Audit and risk committee report6 Independent auditor’s report
10 Consolidated statement of comprehensive income11 Consolidated statement of financial position12 Consolidated statement of changes in equity14 Consolidated statement of cash flows15 Notes to the consolidated statement of cash flows16 Segmental analysis18 Accounting policies31 Notes to the annual financial statements66 Company statement of comprehensive income66 Company statement of financial position67 Company statement of changes in equity68 Company statement of cash flows68 Notes to the company statement of cash flows69 Interest in subsidiary companies70 Analysis of shareholders72 Shareholders’ diary73 Corporate information
AUDITED ANNUAL FINANCIAL STATEMENTS for the year ended 31 August 2017
These are the audited annual financial statements of the group and the company for the year ended 31 August 2017. They have been prepared under the supervision of the chief financial officer, M Fleming CA (SA).

DIRECTORS’ RESPONSIBILITY STATEMENT
CERTIFICATE BY THE COMPANY SECRETARY
The directors are responsible for the preparation and fair presentation of the annual financial statements and group annual financial statements of Clicks Group Limited, comprising the statements of financial position at 31 August 2017, and the statements of comprehensive income, changes in equity and cash flows for the year then ended, and the notes to the financial statements which include a summary of significant accounting policies and other explanatory notes, in accordance with International Financial Reporting Standards and the requirements of the Companies Act of South Africa and including the audit and risk committee report on page 3. In addition, the directors are responsible for preparing the directors’ report.
The directors are also responsible for such internal control as the directors determine is necessary to enable the preparation of financial statements that are free from material misstatement, whether due to fraud or error, and for maintaining adequate accounting records and an effective system of risk management.
The directors have made an assessment of the ability of the company and the group to continue as going concerns and have no reason to believe that the businesses will not be going concerns in the year ahead. The financial statements have accordingly been prepared on this basis.
The auditor is responsible for reporting on whether the financial statements are fairly presented in accordance with the applicable financial reporting framework.
APPROVAL OF ANNUAL FINANCIAL STATEMENTSThe consolidated and separate annual financial statements of Clicks Group Limited, as identified in the first paragraph, were approved by the board of directors on 10 November 2017 and signed by:
DM Nurek DA KnealeIndependent non-executive chairman Chief executive officer
Cape Town10 November 2017
I certify that Clicks Group Limited has filed all Clicks Group returns and notices as required by a public company in terms of section 88(2)e of the Companies Act No. 71 of 2008, as amended, and that such returns and notices are, to the best of my knowledge and belief, true, correct and up to date.
M WelzCompany secretary
Cape Town10 November 2017
1
Clicks Group Audited Annual Financial Statements 2017

DIRECTORS’ REPORT
NATURE OF BUSINESSThe company is an investment holding company listed in the Food and Drug Retailers sector of the JSE Limited. Its subsidiaries include the country’s leading provider of health and beauty merchandise through a network of 795 stores in southern Africa. The company’s subsidiaries cover the pharmaceutical supply chain from wholesale and distribution to retail pharmacy, as well as beauty and cosmetic products. The company operates primarily in southern Africa.
GROUP FINANCIAL RESULTSThe results of operations for the year are set out in the consolidated statement of comprehensive income on page 10. The profit attributable to ordinary shareholders for the year is R1 278 million (2016: R1 094 million).
SHARE CAPITALDuring the year under review the company had the following movements in share capital:
9 612 240 shares held by subsidiaries of the company as treasury shares at 31 August 2016
(168 795) shares cancelled on 1 February 20179 443 445 shares held by subsidiaries of the company
as treasury shares at 31 August 2017
DIVIDENDS TO SHAREHOLDERSInterimThe directors approved an interim ordinary dividend of 88 cents per ordinary share (2016: 76 cents per ordinary share) from distributable reserves. The dividend was paid on 3 July 2017 to shareholders registered on 30 June 2017.
FinalThe directors have approved a final ordinary dividend of 234 cents per ordinary share (2016: 196 cents per ordinary share) and a dividend of 32.2 cents per “A” share (2016: 27.2 cents) for participants in the employee share ownership programme. The source of such dividends will be from distributable reserves. The dividend will be payable on 29 January 2018 to shareholders registered on 26 January 2018.
EVENTS AFTER THE FINANCIAL YEAR-ENDOther than the declaration of the final dividend, no significant events took place between the end of the financial year and the date of this report.
DIRECTORS AND SECRETARYDr Nkaki Matlala retired as a director with effect from 26 January 2017.
The names of the directors in office at the date of this report are:
Independent non-executive directorsDavid Nurek (chairman)Fatima Abrahams
John BesterFatima JakoetNonkululeko Gobodo (appointed 1 March 2017)Martin Rosen
Executive directorsDavid Kneale (chief executive officer)Michael Fleming (chief financial officer)Bertina Engelbrecht
The company secretary’s details are set out on the inside back cover.
RETIREMENT AND RE-ELECTION OF DIRECTORSIn accordance with the company’s memorandum of incorporation Fatima Abrahams, John Bester, Bertina Engelbrecht and Michael Fleming retire by rotation at the forthcoming annual general meeting. All of these directors, being eligible, offer themselves for re-election at the 2018 AGM. Nonkululeko Gobodo, having been appointed by the board in the course of the year, is also standing for election at the 2018 AGM.
DIRECTORS’ INTEREST IN SHARESIn terms of the cash-settled long-term employee incentive scheme which requires all participants at the end of the three-year incentive performance period to purchase shares on the open market to the equivalent of 25% of the after-tax cash settlement value, the executive directors of the company made the following purchases on 1 December 2016 at an average price of R120.00 per share: David Kneale purchased 16 080 shares, Michael Fleming purchased 6 028 shares and Bertina Engelbrecht purchased 3 970 shares. On 2 December 2016 at an average price of R119.99 per share: David Kneale purchased 9 488 shares, Michael Fleming purchased 3 556 shares and Bertina Engelbrecht purchased 2 343 shares. Directors’ shareholdings are set out on page 71.
INCENTIVE SCHEMESInformation relating to the incentive schemes is set out on pages 47 to 49.
SPECIAL RESOLUTIONSSpecial resolutions passed at the annual general meeting held on 26 January 2017:
Special Resolution No. 1: General authority to repurchase shares
Special Resolution No. 2: Approval of directors’ fees
Special Resolution No. 3: General approval to provide financial assistance
Special Resolution No. 4: Specific authority to repurchase shares from New Clicks Holdings Share Trust
SUBSIDIARY COMPANIESThe names of the company’s main subsidiaries and financial information relating thereto appear on page 69.
2

AUDIT AND RISK COMMITTEE REPORTThe Clicks Group audit and risk committee is a formal statutory committee in terms of the Companies Act and sub-committee of the board. The committee functions within documented terms of reference and complies with relevant legislation, regulation and governance codes. This report of the audit and risk committee is presented to shareholders in compliance with the requirements of the Companies Act and the revised King Code of Governance Principles (“King IV”).
ROLE OF THE COMMITTEEThe audit and risk committee (“the committee”) has an independent role with accountability to both the board and to shareholders. The committee’s responsibilities include the statutory duties prescribed by the Companies Act, activities recommended by King lV as well as additional responsibilities assigned by the board.
The responsibilities of the committee are as follows:
Integrated reporting• Review the annual financial statements, interim
report, preliminary results announcement and summarised integrated information and ensure compliance with International Financial Reporting Standards;
• Consider the frequency of interim reports and whether interim results should be assured;
• Review and approve the appropriateness of accounting policies, disclosure policies and the effectiveness of internal financial controls;
• Perform an oversight role on the group’s integrated reporting and consider factors and risks that could impact on the integrity of the integrated report;
• Review sustainability disclosure in the integrated report and ensure it does not conflict with financial information;
• Consider external assurance of material sustainability issues; and
• Recommend the integrated report for approval by the board.
Combined assurance• Ensure the combined assurance model addresses
all significant risks facing the group; and
• Monitor the relationship between external and internal assurance providers and the group.
Finance function• Consider the expertise and experience of the chief
financial officer; and
• Consider the expertise, experience and resources of the group’s finance function.
Internal audit• Oversee the functioning of the internal audit
department and approve the appointment and performance assessment of the group head of internal audit;
• Approve the annual internal audit plan; and
• Ensure the internal audit function is subject to independent quality review as appropriate.
Risk management• Ensure the group has an effective policy and plan for
risk management;
• Oversee the development and annual review of the risk management policy and plan;
• Monitor implementation of the risk management policy and plan;
• Make recommendations to the board on levels of risk tolerance and risk appetite;
• Ensure risk management is integrated into business operations;
• Ensure risk management assessments are conducted on a continuous basis;
• Ensure frameworks and methodologies are implemented to increase the possibility of anticipating unpredictable risks;
• Ensure that management considers and implements appropriate risk responses;
• Express the committee’s opinion in the effectiveness of the system and process of risk management; and
• Ensure risk management reporting in the integrated report is comprehensive and relevant.
External audit• Nominate the external auditor for appointment by
shareholders;
• Approve the terms of engagement and remuneration of the auditor;
• Ensure the appointment of the auditor complies with relevant legislation;
• Monitor and report on the independence of the external auditor;
• Define a policy for non-audit services which the auditor may provide and approve non-audit service contracts;
• Review the quality and effectiveness of the external audit process; and
• Ensure a process is in place for the committee to be informed of any reportable irregularities identified by the external auditor.
3
Clicks Group Audited Annual Financial Statements 2017

AUDIT AND RISK COMMITTEE REPORT (CONTINUED)
COMPOSITION OF THE COMMITTEEThe committee comprised three independent non-executive directors during the period. These directors include suitably skilled directors having recent and relevant financial experience. The committee is elected by shareholders at the annual general meeting.
The following directors served on the committee during the period under review:
Independent non-executive director QualificationsJohn Bester (Chairman) B Com (Hons), CA (SA), CMS
(Oxon)Fatima Jakoet B Sc, CTA, CA (SA), Higher
certificate in financial marketsDavid Nurek (resigned March 2017)
Dip Law, Grad Dip Company Law
Nkaki Matlala (retired January 2017)
B Sc, M Sc, M D, M Med (Surgery), FCS
Nonkululeko Gobodo (appointed March 2017)
B Compt (Hons), CA (SA)
Biographical details of the committee members appear on pages 46 and 47 of the Integrated Report, with supplementary information contained in annexure 2 to the notice of annual general meeting on page 8.
Fees paid to the committee members for 2017 and the proposed fees for 2018 are disclosed in the rewarding value creation report on pages 66 and 67 of the Integrated Report.
Nkaki Matlala retired as a non-executive director of the Clicks Group on 26 January 2017. Independent non-executive director David Nurek made himself available for election to the committee from this date until 1 March 2017, when Nonkululeko Gobodo was appointed by the board to the committee.
The executive directors, group head of internal audit and senior management attend meetings at the invitation of the committee, together with the external auditor.
The committee also meets separately with the external and internal auditors, without members of executive management being present.
The effectiveness of the committee is assessed as part of the annual board and committee self-evaluation process.
INTERNAL AUDITThe internal audit function provides information to assist in the establishment and maintenance of an effective system of internal control to manage the risks associated with the business. The role of internal audit is contained in the internal audit charter. The charter is reviewed annually and is aligned with the recommendations of King lV.
Internal audit facilitates the combined assurance process and is responsible for the following:
• evaluating governance processes, including ethics;
• assessing the effectiveness of the risk methodology and internal financial controls; and
• evaluating business processes and associated controls in accordance with the annual audit plan and combined assurance model.
The internal audit function is established by the board and its responsibilities are determined by the committee. Administratively the group head of internal audit reports to the chief financial officer who, in turn, reports to the chief executive officer. The group head of internal audit has direct and unrestricted access to the chairman of the committee. The group head of internal audit is appointed and removed by the committee, which also determines and recommends remuneration for the position. The chairman of the committee meets with the group head of internal audit on a quarterly basis.
INTERNAL CONTROLSystems of internal control are designed to manage, rather than eliminate, the risk of failure to achieve business objectives and to provide reasonable, but not absolute, assurance against misstatement or loss.
While the board is responsible for the internal control systems and for reviewing their effectiveness, responsibility for their actual implementation and maintenance rests with executive management. The systems of internal control are based on established organisational structures, together with written policies and procedures, and provide for suitably qualified employees, segregation of duties, clearly defined lines of authority and accountability. They also include cost and budgeting controls, and comprehensive management reporting.
INTERNAL FINANCIAL CONTROLSThe committee has considered the results of the formal documented review of the company’s system of internal financial controls and risk management, including the design, implementation and effectiveness of the internal financial controls, conducted by the internal audit function during the 2017 year. The committee has also assessed information and explanations given by management and discussions with the external auditor on the results of the audit. Through this process no material matter has come to the attention of the audit and risk committee or the board that has caused the directors to believe that the company’s system of internal controls and risk management is not effective and that the internal financial controls do not form a sound basis for the preparation of reliable financial statements.
4

AUDIT AND RISK COMMITTEE REPORT (CONTINUED)
EXTERNAL AUDITThe committee appraised the independence, expertise and objectivity of EY as the external auditor, as well as approving the terms of engagement and the fees paid to EY.
The external auditor has unrestricted access to the group’s records and management. The auditor furnishes a written report to the committee on significant findings arising from the annual audit and is able to raise matters of concern directly with the chairman of the committee.
The audit partner in charge of the audit is rotated off the audit after 5 years. In terms of this policy, the current audit partner will be rotating next year and a new audit partner appointed in his stead. The group has received confirmation from the external auditor that the partners and staff responsible for the audit comply with all legal and professional requirements with regard to rotation and independence. The committee is satisfied that the external auditor is independent of the company and complies with the JSE Listings Requirements.
POLICY ON NON-AUDIT SERVICESNon-audit services provided by the external auditor should not exceed 25% of the total auditors’ remuneration. These services should exclude any work which may be subject to external audit and which could compromise the auditor’s independence. All non-audit services undertaken during the year were approved in accordance with this policy.
During the year EY received fees of R495 069 (2016: R1 370 534) for non-audit services, equating to 12.2% (2016: 29.0%) of the total audit remuneration. These services related mainly to agreed upon procedures for third party confirmation and assurance on specified controls related to distribution services provided by UPD to third parties.
EY satisfied the committee that appropriate safeguards have been adopted to maintain the independence of the external auditor when providing non-audit services.
ACTIVITIES OF THE COMMITTEEThe committee met four times during the financial year and attendance at the meetings is detailed in creating value through good governance in the Integrated Annual Report on page 50. Members of the committee, the external auditor and the group head of internal audit may request a non-scheduled meeting if they consider this necessary. The chairman of the committee will determine if such a meeting should be convened.
Minutes of the meetings of the committee, except those recording private meetings with the external and internal auditors, are circulated to all directors and supplemented by an update from the committee chairman at each board meeting. Matters requiring action or improvement are identified and appropriate recommendations made to the board.
The chairman of the committee attends all statutory shareholder meetings to answer any questions on the committee’s activities.
The committee performed the following activities relating to the audit function during the year under review, with certain of these duties being required in terms of the Companies Act:
• recommended to the board and shareholders the appointment of the external auditors, approved their terms of engagement and remuneration, and monitored their independence, objectivity and effectiveness;
• determined the nature and extent of any non-audit services which the external auditor may provide to the group and preapproved any proposed contracts with the external auditors;
• reviewed the group’s internal financial control and financial risk management systems;
• monitored and reviewed the effectiveness of the group’s internal audit functions;
• reviewed and recommended to the board for approval the integrated annual report and annual financial statements; and
• evaluated the effectiveness of the committee.
Refer to the corporate governance report on the website for an overview of the risk management process and function.
EVALUATION OF CHIEF FINANCIAL OFFICER AND FINANCE FUNCTIONThe committee is satisfied that the expertise and experience of the chief financial officer is appropriate to meet the responsibilities of the position. This is based on the qualifications, levels of experience, continuing professional education and the board’s assessment of the financial knowledge of the chief financial officer.
The committee is also satisfied as to the appropriateness, expertise and adequacy of resources of the finance function and the experience of senior members of management responsible for the finance function.
APPROVAL OF THE AUDIT AND RISK COMMITTEE REPORTThe committee confirms that it has functioned in accordance with its terms of reference for the 2017 financial year and that its report to shareholders has been approved by the board.
John Bester Chairman: Audit and risk committee
10 November 2017
5
Clicks Group Audited Annual Financial Statements 2017

INDEPENDENT AUDITOR’S REPORT to the shareholders of Clicks Group Limited
REPORT ON THE AUDIT OF THE CONSOLIDATED AND SEPARATE FINANCIAL STATEMENTSOpinion We have audited the consolidated and separate financial statements of Clicks Group Limited and its subsidiaries (the group) set out on pages 10 to 69, which comprise the consolidated and separate statements of financial position as at 31 August 2017, and the consolidated and separate statements of comprehensive income, the consolidated and separate statements of changes in equity and the consolidated and separate statements of cash flows for the year then ended, and notes to the consolidated and separate financial statements, including a summary of significant accounting policies.
In our opinion, the consolidated and separate financial statements present fairly, in all material respects, the consolidated and separate financial position of Clicks Group Limited as at 31 August 2017, and its consolidated and separate financial performance and consolidated and separate cash flows for the year then ended in accordance with International Financial Reporting Standards and the requirements of the Companies Act of South Africa.
Basis for opinionWe conducted our audit in accordance with International Standards on Auditing (ISAs). Our responsibilities under those standards are further described in the Auditor’s Responsibilities for the Audit of the Consolidated and Separate Financial Statements section of our report. We are independent of Clicks Group Limited in accordance with the Independent Regulatory Board for Auditors Code of Professional Conduct for
Registered Auditors (IRBA Code), the International Ethics Standards Board for Accountants Code of Ethics for Professional Accountants (IESBA Code) and other independence requirements applicable to performing audits of Clicks Group Limited. We have fulfilled our other ethical responsibilities in accordance with the IRBA Code, IESBA Code, and in accordance with other ethical requirements applicable to performing the audit of Clicks Group Limited. We believe that the audit evidence we have obtained is sufficient and appropriate to provide a basis for our opinion.
Key audit mattersKey audit matters are those matters that, in our professional judgement, were of most significance in our audit of the consolidated and separate financial statements of the current period. These matters were addressed in the context of our audit of the consolidated and separate financial statements as a whole, and in forming our opinion thereon, and we do not provide a separate opinion on these matters. For each matter below, our description of how our audit addressed the matter is provided in that context.
We have fulfilled the responsibilities described in the Auditor’s Responsibilities for the Audit of the Consolidated and Separate Financial Statements section of our report, including in relation to these matters. Accordingly, our audit included the performance of procedures designed to respond to our assessment of the risks of material misstatement of the financial statements. The results of our audit procedures, including the procedures performed to address the matters below, provide the basis for our audit opinion on the accompanying financial statements.
Key audit matter How the matter was addressed in the audit
Provisions against inventories
Inventories are disclosed in note 17 – Inventories.
Management identifies slow moving, obsolete and damaged inventories on a regular basis and these are recorded at the lower of cost or estimated net realisable value.
Inventory provisions require management to make significant accounting estimates and judgements. These include identification of damaged, slow moving and obsolete inventory and assessing the level of provisions required including based on comparing the inventory holding to the projected likely future sales less estimated selling costs using factors existing at the reporting date.
Given this, and the quantum of the inventories balance we have considered the provisions against inventories to be a key audit matter.
Our procedures included, amongst others:
• Assessing the reasonableness of the methodologies applied by management for consistency with prior years and our knowledge of industry practice.
• Evaluating the assumptions and estimates applied to the methodologies for slow moving, obsolete and damaged inventories by:
– testing the identification of such inventory for each business;
– testing the accuracy of historical information and data trends;
– assessing changing trends applied against the current inventory balances; and
– performing analytical procedures on obsolescence levels and write down rates.
• Testing the estimated future sales values, less estimated costs to sell against the carrying value of the inventories.
• Recalculating the arithmetical accuracy of the computations.
6

INDEPENDENT AUDITOR’S REPORT (CONTINUED)
Key audit matter How the matter was addressed in the audit
Share based compensation arrangements: Long-Term Incentive (LTI) Scheme and Employee Share Ownership Programme (ESOP)
The Group has a Long-term Incentive (LTI) scheme as set out in note 23, which includes the Total Shareholder Return LTI and an Employee Share Ownership Programme (ESOP) as set out in note 20, both of which are considered to be share based compensation arrangements and are accounted for in terms of IFRS 2: Share-based Payment.
The Group uses derivative financial instruments to hedge market risk relating to the cash-settled share based compensation LTI scheme which are classified as cash flow hedges.
The share based compensation arrangements require the use of judgement and estimates, including, where applicable, to determine fair values of the incentives at grant date and at the reporting date. The valuation of the derivative financial instruments requires the use of an option pricing model. Cash flow hedge accounting requires an assessment of the effective and ineffective portion of the hedge.
In addition, the Group has a recharge arrangement for the ESOP between the Company, Clicks Group Limited, and subsidiary companies.
The taxation considerations of these arrangements result in deductible temporary differences which gives rise to deferred taxation assets.
Given the accounting complexity and quantitative materiality of the LTI and ESOP arrangements and level of judgement involved in management estimates that are required to value the ESOP, LTI and derivative financial instruments together with considering hedge accounting, recharge arrangements and taxation consequences we consider these share based compensation arrangements to be a key audit matter.
Our procedures included, amongst others:
• Evaluating the arrangements and accounting consequences in terms of the requirements of IFRS.
• Assessing the methodology, models and assumptions employed by management in determining the values for ESOP options, the derivative financial instruments and cash-settled liabilities and recalculating the values determined by management, including, where appropriate, through the use of our quantitative advisory specialists.
• Testing the hedge effectiveness of the derivative financial instrument using our quantitative advisory specialists.
• Recalculating the recharge arrangement in terms of the Company’s accounting policy.
• Assessing the taxation consequences, including by using our taxation specialists, and recalculating the deductible temporary differences and resulting deferred taxation assets.
• Assessing whether the recognition and measurement criteria used in the accounting records was consistent with the requirements of IFRS.
• Considering the adequacy and accuracy of the related disclosures in the financial statements.
7
Clicks Group Audited Annual Financial Statements 2017

Other InformationThe directors are responsible for the other information. The other information comprises the directors’ report, the audit and risk committee’s report, the company secretary’s certificate as required by the Companies Act of South Africa and the directors’ responsibility statement, analysis of shareholders, shareholders’ diary and corporate information, which we obtained prior to the date of this report, and the Integrated Annual Report and five-year review, which is expected to be made available to us after that date. Other information does not include the consolidated and separate financial statements and our auditor’s report thereon.
Our opinion on the consolidated and separate financial statements does not cover the other information and we do not express an audit opinion or any form of assurance conclusion thereon.
In connection with our audit of the consolidated and separate financial statements, our responsibility is to read the other information and, in doing so, consider whether the other information is materially inconsistent with the consolidated and separate financial statements or our knowledge obtained in the audit, or otherwise appears to be materially misstated.
If, based on the work we have performed on the other information obtained prior to the date of this auditor’s report, we conclude that there is a material misstatement of this other information, we are required to report that fact. We have nothing to report in this regard.
When we read the Integrated Annual Report and five-year review, if we conclude that there is a material misstatement therein, we are required to communicate the matter to those charged with governance.
Responsibilities of the Directors for the Consolidated and Separate Financial StatementsThe directors are responsible for the preparation and fair presentation of the consolidated and separate financial statements in accordance with International Financial Reporting Standards and the requirements of the Companies Act of South Africa, and for such internal control as the directors determine is necessary to enable the preparation of consolidated and separate financial statements that are free from material misstatement, whether due to fraud or error.
In preparing the consolidated and separate financial statements, the directors are responsible for assessing the Group’s or Company’s ability to continue as a going concern, disclosing, as applicable, matters related to going concern and using the going concern basis of accounting unless the directors either intend to liquidate
the Group or Company or to cease operations, or have no realistic alternative but to do so.
Auditor’s Responsibilities for the Audit of the Consolidated and Separate Financial StatementsOur objectives are to obtain reasonable assurance about whether the consolidated and separate financial statements as a whole are free from material misstatement, whether due to fraud or error, and to issue an auditor’s report that includes our opinion. Reasonable assurance is a high level of assurance, but is not a guarantee that an audit conducted in accordance with ISAs will always detect a material misstatement when it exists. Misstatements can arise from fraud or error and are considered material if, individually or in the aggregate, they could reasonably be expected to influence the economic decisions of users taken on the basis of these consolidated and separate financial statements.
As part of an audit in accordance with ISAs, we exercise professional judgement and maintain professional scepticism throughout the audit. We also:
• Identify and assess the risks of material misstatement of the consolidated and separate financial statements, whether due to fraud or error, design and perform audit procedures responsive to those risks, and obtain audit evidence that is sufficient and appropriate to provide a basis for our opinion. The risk of not detecting a material misstatement resulting from fraud is higher than for one resulting from error, as fraud may involve collusion, forgery, intentional omissions, misrepresentations, or the override of internal control.
• Obtain an understanding of internal control relevant to the audit in order to design audit procedures that are appropriate in the circumstances, but not for the purpose of expressing an opinion on the effectiveness of the Group’s or Company’s internal control.
• Evaluate the appropriateness of accounting policies used and the reasonableness of accounting estimates and related disclosures made by the directors.
• Conclude on the appropriateness of the directors’ use of the going concern basis of accounting and based on the audit evidence obtained, whether a material uncertainty exists related to events or conditions that may cast significant doubt on the Group’s or Company’s ability to continue as a going concern. If we conclude that a material uncertainty exists, we are required to draw attention in our auditor’s report to the related disclosures in the consolidated and separate financial statements or,
INDEPENDENT AUDITOR’S REPORT (CONTINUED)
8

if such disclosures are inadequate, to modify our opinion. Our conclusions are based on the audit evidence obtained up to the date of our auditor’s report. However, future events or conditions may cause the Group or Company to cease to continue as a going concern.
• Evaluate the overall presentation, structure and content of the consolidated and separate financial statements, including the disclosures, and whether the consolidated and separate financial statements represent the underlying transactions and events in a manner that achieves fair presentation.
• Obtain sufficient appropriate audit evidence regarding the financial information of the entities or business activities within the Group or Company to express an opinion on the consolidated and separate financial statements. We are responsible for the direction, supervision and performance of the Group’s and Company’s audit. We remain solely responsible for our audit opinion.
We communicate with the directors regarding, among other matters, the planned scope and timing of the audit and significant audit findings, including any significant deficiencies in internal control that we identify during our audit.
We also provide the directors with a statement that we have complied with relevant ethical requirements regarding independence, and to communicate with them all relationships and other matters that may reasonably be thought to bear on our independence, and where applicable, related safeguards.
INDEPENDENT AUDITOR’S REPORT (CONTINUED)
From the matters communicated with the directors, we determine those matters that were of most significance in the audit of the consolidated and separate financial statements of the current period and are therefore the key audit matters. We describe these matters in our auditor’s report unless law or regulation precludes public disclosure about the matter or when, in extremely rare circumstances, we determine that a matter should not be communicated in our report because the adverse consequences of doing so would reasonably be expected to outweigh the public interest benefits of such communication.
Report on Other Legal and Regulatory RequirementsIn terms of the IRBA Rule published in Government Gazette Number 39475 dated 4 December 2015, we report that Ernst & Young Inc. has been the auditor of Clicks Group Limited for 5 years.
Ernst & Young Inc.Director - Malcolm Peter RapsonChartered Accountant (SA)Registered Auditor
3rd Floor, Waterway House 3 Dock Road V&A Waterfront Cape Town 8001
10 November 2017
9
Clicks Group Audited Annual Financial Statements 2017

CONSOLIDATED STATEMENT OF COMPREHENSIVE INCOMEfor the year ended 31 August
Notes2017
R’0002016
R’000
Revenue 1 28 342 607 25 530 967
Turnover 1 26 809 101 24 170 879
Cost of merchandise sold (21 185 124) (19 156 612)
Gross profit 5 623 977 5 014 267
Other income 1 1 523 005 1 353 833
Total income 7 146 982 6 368 100
Expenses (5 333 405) (4 796 464)
Depreciation and amortisation 2 (283 227) (252 662)
Occupancy costs 3 (794 796) (682 827)
Employment costs 4 (2 845 838) (2 550 731)
Other costs 5 (1 409 544) (1 310 244)
Operating profit 1 813 577 1 571 636
Loss on disposal of property, plant and equipment (4 868) (6 388)
Profit before financing costs 1 808 709 1 565 248
Net financing costs 6 (37 337) (52 851)
Financial income 1, 6 10 501 6 255
Financial expense 6 (47 838) (59 106)
Profit before earnings from associate 1 771 372 1 512 397
Share of profit of an associate 13 2 900 2 254
Profit before taxation 1 774 272 1 514 651
Income tax expense 7 (496 630) (420 779)
Profit for the year 1 277 642 1 093 872
Other comprehensive (loss)/income:
Items that will not be subsequently reclassified to profit or loss 3 236 –
Remeasurement of post-employment benefit obligations 23 4 495 –
Deferred tax on remeasurement 7 (1 259) –
Items that may be subsequently reclassified to profit or loss
Exchange differences on translation of foreign subsidiaries 22 (6 561) (526)
Cash flow hedges (13 234) (6 580)
Change in fair value of effective portion 21 (17 892) (9 139)
Deferred tax on movement of effective portion 7 4 658 2 559
Other comprehensive loss for the year, net of tax (16 559) (7 106)
Total comprehensive income for the year 1 261 083 1 086 766
Profit attributable to:
Equity holders of the parent 1 277 642 1 093 872
Non-controlling interest – –
1 277 642 1 093 872
Total comprehensive income attributable to:
Equity holders of the parent 1 261 083 1 086 766
Non-controlling interest – –
1 261 083 1 086 766
Earnings per share (cents)
Basic 8 540.2 460.5
Diluted 8 505.7 436.7
10

CONSOLIDATED STATEMENT OF FINANCIAL POSITIONat 31 August
Notes2017
R’0002016
R’000
ASSETS
Non-current assets 2 854 281 2 507 207
Property, plant and equipment 9 1 533 935 1 345 024
Intangible assets 10 457 603 434 083
Goodwill 11 103 510 103 510
Deferred tax assets 12 572 223 347 400
Investment in an associate 13 20 039 20 282
Loans receivable 14 4 500 9 521
Financial assets at fair value through profit or loss 15 27 580 16 145
Derivative financial assets 16 134 891 231 242
Current assets 6 866 834 5 869 689
Inventories 17 3 753 794 3 478 717
Trade and other receivables 18 2 212 719 2 012 696
Loans receivable 14 9 000 8 476
Cash and cash equivalents 700 473 369 800
Derivative financial assets 16 190 848 –
Total assets 9 721 115 8 376 896
EQUITY AND LIABILITIES
Equity 3 300 350 2 452 241
Share capital 19 2 752 2 754
Share premium 19 3 497 3 497
Treasury shares 19 (702 848) (704 298)
Share option reserve 20 747 613 483 188
Cash flow hedge reserve 21 15 382 28 616
Foreign currency translation reserve 22 (756) 5 805
Distributable reserve 3 234 710 2 632 679
Non-current liabilities 402 257 405 541
Employee benefits 23 209 231 215 132
Operating lease liability 24 193 026 190 409
Current liabilities 6 018 508 5 519 114
Trade and other payables 25 5 475 182 5 148 411
Employee benefits 23 394 460 241 986
Provisions 26 6 733 6 939
Income tax payable 132 991 92 476
Derivative financial liabilities 16 9 142 26 971
Financial liability at fair value through profit or loss 27 – 2 331
Total equity and liabilities 9 721 115 8 376 896
11
Clicks Group Audited Annual Financial Statements 2017

CONSOLIDATED STATEMENT OF CHANGES IN EQUITYfor the year ended 31 August
Numberof shares(Note 19)
’000
Sharecapital
(Note 19)R’000
Sharepremium(Note 19)
R’000
Shareoption
reserve(Note 20)
R’000
Treasury shares
(Note 19)R’000
Cash flow hedge
reserve(Note 21)
R’000
Foreign currency
translation reserve
(Note 22)R’000
DistributablereserveR’000
TotalequityR’000
Balance at 1 September 2015 239 886 2 754 3 497 254 592 (414 127) 35 196 6 331 2 124 564 2 012 807
Transactions with owners, recorded directly in equity
Dividends paid to shareholders – – – – – – – (585 757) (585 757)
Share-based payment reserve movement – – – 228 596 – – – – 228 596
Net cost of own shares purchased (3 360) – – – (290 171) – – – (290 171)
Total transactions with owners (3 360) – – 228 596 (290 171) – – (585 757) (647 332)
Total comprehensive income for the year – – – – – (6 580) (526) 1 093 872 1 086 766
Profit for the year – – – – – – – 1 093 872 1 093 872
Cash flow hedge reserve – – – – – (6 580) – – (6 580)
Exchange differences on translation of foreign subsidiaries – – – – – – (526) – (526)
Balance at 31 August 2016 236 526 2 754 3 497 483 188 (704 298) 28 616 5 805 2 632 679 2 452 241
Transactions with owners, recorded directly in equity
Dividends paid to shareholders – – – – – – – (677 399) (677 399)
Share-based payment reserve movement – – – 264 425 – – – – 264 425
Treasury shares cancelled – (2) – – 1 450 – – (1 448) –
Total transactions with owners – (2) – 264 425 1 450 – – (678 847) (412 974)
Total comprehensive income for the year – – – – – (13 234) (6 561) 1 280 878 1 261 083
Profit for the year – – – – – – – 1 277 642 1 277 642
Remeasurement of post-employment benefit obligations – – – – – – – 3 236 3 236
Cash flow hedge reserve – – – – – (13 234) – – (13 234)
Exchange differences on translation of foreign subsidiaries – – – – – – (6 561) – (6 561)
Balance at 31 August 2017 236 526 2 752 3 497 747 613 (702 848) 15 382 (756) 3 234 710 3 300 350
12

Numberof shares(Note 19)
’000
Sharecapital
(Note 19)R’000
Sharepremium(Note 19)
R’000
Shareoption
reserve(Note 20)
R’000
Treasury shares
(Note 19)R’000
Cash flow hedge
reserve(Note 21)
R’000
Foreign currency
translation reserve
(Note 22)R’000
DistributablereserveR’000
TotalequityR’000
Balance at 1 September 2015 239 886 2 754 3 497 254 592 (414 127) 35 196 6 331 2 124 564 2 012 807
Transactions with owners, recorded directly in equity
Dividends paid to shareholders – – – – – – – (585 757) (585 757)
Share-based payment reserve movement – – – 228 596 – – – – 228 596
Net cost of own shares purchased (3 360) – – – (290 171) – – – (290 171)
Total transactions with owners (3 360) – – 228 596 (290 171) – – (585 757) (647 332)
Total comprehensive income for the year – – – – – (6 580) (526) 1 093 872 1 086 766
Profit for the year – – – – – – – 1 093 872 1 093 872
Cash flow hedge reserve – – – – – (6 580) – – (6 580)
Exchange differences on translation of foreign subsidiaries – – – – – – (526) – (526)
Balance at 31 August 2016 236 526 2 754 3 497 483 188 (704 298) 28 616 5 805 2 632 679 2 452 241
Transactions with owners, recorded directly in equity
Dividends paid to shareholders – – – – – – – (677 399) (677 399)
Share-based payment reserve movement – – – 264 425 – – – – 264 425
Treasury shares cancelled – (2) – – 1 450 – – (1 448) –
Total transactions with owners – (2) – 264 425 1 450 – – (678 847) (412 974)
Total comprehensive income for the year – – – – – (13 234) (6 561) 1 280 878 1 261 083
Profit for the year – – – – – – – 1 277 642 1 277 642
Remeasurement of post-employment benefit obligations – – – – – – – 3 236 3 236
Cash flow hedge reserve – – – – – (13 234) – – (13 234)
Exchange differences on translation of foreign subsidiaries – – – – – – (6 561) – (6 561)
Balance at 31 August 2017 236 526 2 752 3 497 747 613 (702 848) 15 382 (756) 3 234 710 3 300 350
13
Clicks Group Audited Annual Financial Statements 2017

CONSOLIDATED STATEMENT OF CASH FLOWSfor the year ended 31 August
The statement of cash flows has been prepared by applying the indirect method.
Notes2017
R’0002016
R’000
Cash effects from operating activities
Profit before working capital changes 2 040 098 1 846 993
Working capital changes (5 790) (19 467)
Cash generated by operations 2 034 308 1 827 526
Interest received 10 501 6 255
Interest paid (41 591) (45 086)
Taxation paid (472 023) (443 793)
Cash inflow from operating activities before dividends paid 1 531 195 1 344 902
Dividends paid to shareholders 28 (677 399) (585 757)
Net cash effects from operating activities 853 796 759 145
Cash effects from investing activities
Investment in property, plant and equipment and intangible assets to maintain operations (111 666) (129 040)
Investment in property, plant and equipment and intangible assets to expand operations (406 184) (303 919)
Proceeds from disposal of property, plant and equipment 3 485 603
Acquisition of unlisted investment in associate 13 (2 500) (17 415)
Decrease/(increase) in loans receivable 4 497 (4 994)
Net cash effects from investing activities (512 368) (454 765)
Cash effects from financing activities
Purchase of treasury shares – (290 171)
Acquisition of derivative financial asset (39 064) (45 147)
Settlement of derivative financial asset 28 309 –
Net cash effects from financing activities (10 755) (335 318)
Net increase/(decrease) in cash and cash equivalents 330 673 (30 938)
Cash and cash equivalents at the beginning of the year 369 800 400 738
Cash and cash equivalents at the end of the year 700 473 369 800
14

NOTES TO THE CONSOLIDATED STATEMENT OF CASH FLOWSfor the year ended 31 August
2017R’000
2016R’000
Cash flow information
Profit before working capital changes
Profit before taxation 1 774 272 1 514 651
Adjustment for: 228 489 279 491
Depreciation and amortisation 297 066 264 144
Movement in operating lease liability 2 617 9 941
Release of cash flow hedge to profit and loss (123 779) (65 422)
Loss on disposal of property, plant and equipment 4 868 6 388
Equity-settled share option costs 58 909 64 533
Decrease in financial assets at fair value through proft or loss 1 161 523
Gain on consolidation of the New Clicks Foundation Trust (12 596) –
Net distributed/(undistributed) profits of an associate 243 (616)
Net financing cost 37 337 52 851
2 040 098 1 846 993
Working capital changes
Increase in inventories (275 077) (228 803)
Increase in trade and other receivables (200 023) (145 248)
Increase in trade and other payables 329 611 251 161
Increase in employee benefits 139 905 102 229
(Decrease)/increase in provisions (206) 1 194
(5 790) (19 467)
Taxation paid
Income tax payable at the beginning of the year (92 476) (111 749)
Normal tax charged to profit or loss (512 538) (424 520)
Income tax payable at the end of the year 132 991 92 476
(472 023) (443 793)
Cash and cash equivalents at the end of the year
Current accounts 232 873 276 900
Short-term deposits 467 600 92 900
700 473 369 800
15
Clicks Group Audited Annual Financial Statements 2017

SEGMENTAL ANALYSISfor the year ended 31 August
Retail (Note 35) Distribution (Note 35) Intragroup elimination Total operationsR’000 2017 2016 2017 2016 2017 2016 2017 2016Statement of financial positionProperty, plant and equipment 1 307 594 1 119 803 226 341 225 221 – – 1 533 935 1 345 024 Intangible assets 440 279 416 026 17 324 18 057 – – 457 603 434 083 Goodwill 6 529 6 529 96 981 96 981 – – 103 510 103 510 Inventories 2 529 009 2 338 453 1 266 559 1 180 637 (41 774) (40 373) 3 753 794 3 478 717 Trade and other receivables 380 874 330 818 2 426 754 2 163 393 (594 909) (481 515) 2 212 719 2 012 696 Cash and cash equivalents 678 428 328 730 22 045 41 070 – – 700 473 369 800 Other assets 1 408 638 1 084 710 1 504 140 1 452 403 (1 953 697) (1 904 047) 959 081 633 066 Total assets 6 751 351 5 625 069 5 560 144 5 177 762 (2 590 380) (2 425 935) 9 721 115 8 376 896
Employee benefits – non-current 192 637 198 623 16 594 16 509 – – 209 231 215 132 Operating lease liability 193 026 190 409 – – – – 193 026 190 409 Trade and other payables 2 577 264 2 225 538 3 497 676 3 409 163 (599 758) (486 290) 5 475 182 5 148 411 Employee benefits – current 355 630 218 891 38 830 23 095 – – 394 460 241 986 Other liabilities 1 650 895 1 581 116 451 776 451 830 (1 953 805) (1 904 229) 148 866 128 717 Total liabilities 4 969 452 4 414 577 4 004 876 3 900 597 (2 553 563) (2 390 519) 6 420 765 5 924 655
Net assets 1 781 899 1 210 492 1 555 268 1 277 165 (36 817) (35 416) 3 300 350 2 452 241
Statement of comprehensive incomeTurnover 18 893 563 16 640 227 12 320 584 11 054 959 (4 405 046) (3 524 307) 26 809 101 24 170 879 Gross profit 5 420 035 4 845 305 204 876 179 019 (934) (10 057) 5 623 977 5 014 267 Other income 915 108 758 770 732 096 688 113 (124 199) (93 050) 1 523 005 1 353 833 Total income 6 335 143 5 604 075 936 972 867 132 (125 133) (103 107) 7 146 982 6 368 100 Expenses (4 850 342) (4 298 388) (606 795) (591 127) 123 732 93 051 (5 333 405) (4 796 464)Operating profit 1 484 801 1 305 687 330 177 276 005 (1 401) (10 056) 1 813 577 1 571 636
RatiosIncrease in turnover (%) 13.5 12.8 11.4 6.1 25.0 13.6 10.9 9.5 Selling price inflation (%) 4.9 4.3 5.8 5.4 – – 5.3 4.9 Comparable stores turnover growth (%) 8.0 9.8 – – – – 8.0 9.8 Gross profit margin (%) 28.7 29.1 1.7 1.6 – – 21.0 20.7 Total income margin (%) 33.5 33.7 7.6 7.8 – – 26.7 26.3 Operating expenses as a percentage of turnover (%) 25.7 25.8 4.9 5.3 – – 19.9 19.8 Increase in operating expenses (%) 12.8 11.2 2.7 7.4 – – 11.2 10.5 Increase in operating profit (%) 13.7 13.5 19.6 6.7 – – 15.4 12.6 Operating profit margin (%) 7.9 7.8 2.7 2.5 – – 6.8 6.5 Inventory days 69 72 38 40 – – 65 66 Trade debtor days 6 6 57 58 – – 40 43 Trade creditor days 44 42 86 92 – – 68 70 Number of stores 795 689 – – – – 795 689
as at 31 August 2016/2015 689 657 – – – – 689 657 opened 120 41 – – – – 120 41 closed (14) (9) – – – – (14) (9)
Number of pharmacies 473 400 – – – – 473 400 as at 31 August 2016/2015 400 361 – – – – 400 361 new/converted 74 40 – – – – 74 40 closed (1) (1) – – – – (1) (1)
Total leased area (m2) 378 672 349 866 – – – – 378 672 349 866 Weighted retail trading area (m2) 293 479 277 874 – – – – 293 479 277 874 Weighted annual sales per m2 (R) 64 167 59 677 – – – – 64 167 59 677 Number of permanent full-time and part-time flexible employees 14 135 13 508 538 585 – – 14 673 14 093
The intragroup turnover elimination for the year comprises R4 360.9 million (2016: R3 467.9 million) of sales from Distribution to Retail and R44.1 million (2016: R56.4 million) of sales from Retail to Distribution.
Non-South African turnover represents less than 4% (2016: less than 4%) of group turnover.
Depreciation and amortisation for the Retail segment totalled R252.2 million (2016: R223.4 million) and for the Distribution segment R31.0 million (2016: R29.3 million).
16

Retail (Note 35) Distribution (Note 35) Intragroup elimination Total operationsR’000 2017 2016 2017 2016 2017 2016 2017 2016Statement of financial positionProperty, plant and equipment 1 307 594 1 119 803 226 341 225 221 – – 1 533 935 1 345 024 Intangible assets 440 279 416 026 17 324 18 057 – – 457 603 434 083 Goodwill 6 529 6 529 96 981 96 981 – – 103 510 103 510 Inventories 2 529 009 2 338 453 1 266 559 1 180 637 (41 774) (40 373) 3 753 794 3 478 717 Trade and other receivables 380 874 330 818 2 426 754 2 163 393 (594 909) (481 515) 2 212 719 2 012 696 Cash and cash equivalents 678 428 328 730 22 045 41 070 – – 700 473 369 800 Other assets 1 408 638 1 084 710 1 504 140 1 452 403 (1 953 697) (1 904 047) 959 081 633 066 Total assets 6 751 351 5 625 069 5 560 144 5 177 762 (2 590 380) (2 425 935) 9 721 115 8 376 896
Employee benefits – non-current 192 637 198 623 16 594 16 509 – – 209 231 215 132 Operating lease liability 193 026 190 409 – – – – 193 026 190 409 Trade and other payables 2 577 264 2 225 538 3 497 676 3 409 163 (599 758) (486 290) 5 475 182 5 148 411 Employee benefits – current 355 630 218 891 38 830 23 095 – – 394 460 241 986 Other liabilities 1 650 895 1 581 116 451 776 451 830 (1 953 805) (1 904 229) 148 866 128 717 Total liabilities 4 969 452 4 414 577 4 004 876 3 900 597 (2 553 563) (2 390 519) 6 420 765 5 924 655
Net assets 1 781 899 1 210 492 1 555 268 1 277 165 (36 817) (35 416) 3 300 350 2 452 241
Statement of comprehensive incomeTurnover 18 893 563 16 640 227 12 320 584 11 054 959 (4 405 046) (3 524 307) 26 809 101 24 170 879 Gross profit 5 420 035 4 845 305 204 876 179 019 (934) (10 057) 5 623 977 5 014 267 Other income 915 108 758 770 732 096 688 113 (124 199) (93 050) 1 523 005 1 353 833 Total income 6 335 143 5 604 075 936 972 867 132 (125 133) (103 107) 7 146 982 6 368 100 Expenses (4 850 342) (4 298 388) (606 795) (591 127) 123 732 93 051 (5 333 405) (4 796 464)Operating profit 1 484 801 1 305 687 330 177 276 005 (1 401) (10 056) 1 813 577 1 571 636
RatiosIncrease in turnover (%) 13.5 12.8 11.4 6.1 25.0 13.6 10.9 9.5 Selling price inflation (%) 4.9 4.3 5.8 5.4 – – 5.3 4.9 Comparable stores turnover growth (%) 8.0 9.8 – – – – 8.0 9.8 Gross profit margin (%) 28.7 29.1 1.7 1.6 – – 21.0 20.7 Total income margin (%) 33.5 33.7 7.6 7.8 – – 26.7 26.3 Operating expenses as a percentage of turnover (%) 25.7 25.8 4.9 5.3 – – 19.9 19.8 Increase in operating expenses (%) 12.8 11.2 2.7 7.4 – – 11.2 10.5 Increase in operating profit (%) 13.7 13.5 19.6 6.7 – – 15.4 12.6 Operating profit margin (%) 7.9 7.8 2.7 2.5 – – 6.8 6.5 Inventory days 69 72 38 40 – – 65 66 Trade debtor days 6 6 57 58 – – 40 43 Trade creditor days 44 42 86 92 – – 68 70 Number of stores 795 689 – – – – 795 689
as at 31 August 2016/2015 689 657 – – – – 689 657 opened 120 41 – – – – 120 41 closed (14) (9) – – – – (14) (9)
Number of pharmacies 473 400 – – – – 473 400 as at 31 August 2016/2015 400 361 – – – – 400 361 new/converted 74 40 – – – – 74 40 closed (1) (1) – – – – (1) (1)
Total leased area (m2) 378 672 349 866 – – – – 378 672 349 866 Weighted retail trading area (m2) 293 479 277 874 – – – – 293 479 277 874 Weighted annual sales per m2 (R) 64 167 59 677 – – – – 64 167 59 677 Number of permanent full-time and part-time flexible employees 14 135 13 508 538 585 – – 14 673 14 093
The intragroup turnover elimination for the year comprises R4 360.9 million (2016: R3 467.9 million) of sales from Distribution to Retail and R44.1 million (2016: R56.4 million) of sales from Retail to Distribution.
Non-South African turnover represents less than 4% (2016: less than 4%) of group turnover.
Depreciation and amortisation for the Retail segment totalled R252.2 million (2016: R223.4 million) and for the Distribution segment R31.0 million (2016: R29.3 million).
17
Clicks Group Audited Annual Financial Statements 2017

ACCOUNTING POLICIES
Clicks Group Limited is a company domiciled in South Africa. The consolidated financial statements as at and for the year ended 31 August 2017 comprise the company, its subsidiaries and associate (collectively referred to as “the group”).
BASIS OF PREPARATIONThe consolidated financial statements for the group and for the company are prepared in accordance with International Financial Reporting Standards (“IFRS”) and its interpretations adopted by the International Accounting Standards Board (“IASB”), the South African Institute of Chartered Accountants’ Financial Reporting Guides as issued by the Accounting Practices Committee and Financial Reporting Pronouncements as issued by the Financial Reporting Standards Council, the South African Companies Act, No. 71 of 2008 as amended and the JSE Listings Requirements.
The financial statements are presented in South African Rands (“Rands”), rounded to the nearest thousand. They are prepared on the basis that the group and the company are going concerns, using the historical cost basis of measurement, except for certain financial instruments which have been measured at fair value.
The accounting policies set out below have been applied consistently in all material respects to all periods presented in these consolidated financial statements.
The following new or revised IFRS standards have effective dates applicable to the group’s current financial year-end:
• IAS 1 – Disclosure Initiative (Amendments)
The preparation of financial statements in accordance with IFRS requires management to make estimates, judgements and assumptions that affect the accounting policies and the reported amounts of assets, liabilities, income and expenses. Such estimates and assumptions are based on historical experience and various other factors that are believed to be reasonable under the circumstances. Actual results may differ from these estimates. Uncertainty about these assumptions and estimates could result in outcomes that require a material adjustment to the carrying amount of assets or liabilities affected in future periods.
Estimates and the underlying assumptions are reviewed on an ongoing basis. Revisions to accounting estimates are recognised in the period in which the estimates are revised.
SIGNIFICANT ACCOUNTING ESTIMATES AND JUDGEMENTSEstimates and judgements that have a significant risk of causing a material adjustment to the carrying amounts of assets and liabilities within the next financial year are outlined below and disclosed in the relevant notes to the financial statements.
Allowance for net realisable value of inventories The group evaluates its inventory to ensure that it is carried at the lower of cost or net realisable value. Provision is made against slow moving, obsolete and damaged inventories. Damaged inventories are identified and written down through the inventory counting procedures conducted within each business. Allowance for slow moving and obsolete inventories is assessed by each business as part of their ongoing financial reporting. Obsolescence is assessed based on comparison of the level of inventory holding to the projected likely future sales less selling costs using factors existing at the reporting date. Refer to note 17 for further detail.
Rebates received from vendors The group enters into agreements with many of its vendors providing for inventory purchase rebates based upon achievement of specified volumes of purchases, with many of these agreements applying to the calendar year. For certain agreements, the rebates increase as a proportion of purchases as higher quantities or values of purchases are made relative to the prior period. The group accrues the receipt of vendor rebates as part of its cost of sales for products sold, taking into consideration the cumulative purchases of inventory to date. Rebates are accrued monthly, with an extensive reassessment of the rebates earned being performed at the reporting date. Consequently the rebates actually received may vary from that accrued in the financial statements.
Impairment of financial assetsAt the reporting date the group assesses whether objective evidence exists that a financial asset or group of financial assets is impaired.
Trade receivables: An allowance for impairment loss is made against accounts that in the judgement of management may be impaired. The impairment is assessed monthly, with a detailed formal review of balances and security being conducted at the reporting date. Determining the recoverability of an account involves estimates and judgement as to the likely financial condition of the customer and their ability to make payment. Refer to note 18 for further detail.
Impairment of non-financial assetsGoodwill and intangible assets with an indefinite useful life are tested for impairment at least annually. Intangible assets with a finite useful life and property, plant and equipment are considered for impairment when an indication of possible impairment exists. An asset is impaired when its carrying value exceeds its recoverable amount. The recoverable amount is the higher of an asset’s fair value less costs of disposal and its value in use. In assessing value in use, the estimated future cash flows are discounted to their
18

present value using a pre-tax discount rate that reflects current market assessments of the time value of money and the risks specific to the asset. In determining fair value less costs of disposal, recent market transactions are taken into account. If no such transactions can be identified an appropriate valuation model is used. Details of the assumptions used in the intangible assets’ impairment test are detailed in note 10.
Goodwill: Determining whether goodwill is impaired requires an estimation of the value in use of the cash-generating units to which goodwill has been allocated. The value in use calculation requires the directors to estimate the future cash flows expected to arise from the cash-generating unit and a suitable pre-tax discount rate that is reflective of the cash-generating unit’s risk profile, in order to calculate the value in use. Details of the assumptions used in the impairment test are detailed in note 11.
Assessment of useful lives and residual values of property, plant and equipment: Assessments of estimated useful lives and residual values are performed annually after considering factors such as technological innovation, maintenance programmes, relevant market information and management consideration. In assessing residual values the group considers the remaining life of the asset, its projected disposal value and future market conditions.
Income taxesThe group is subject to income tax in numerous jurisdictions. Significant judgement is required in determining the provision for tax as there are many transactions and calculations for which the ultimate tax determination is uncertain during the ordinary course of business. The group recognises liabilities for anticipated tax issues based on estimates of the taxes that are likely to become due. Where the final tax outcome of these matters is different from the amounts that were initially recorded, such differences will impact the income tax and deferred tax provisions in the period in which such determination is made.
The group recognises the net future tax benefit related to deferred income tax assets to the extent that it is probable that the deductible temporary differences will reverse in the foreseeable future. Assessing the recoverability of deferred income tax assets requires the group to make significant estimates related to expectations of future taxable income. Estimates of future taxable income are based on forecast cash flows from operations and the application of existing tax laws in each jurisdiction. To the extent that future cash flows and taxable income differ significantly from estimates, the ability of the group to realise the net deferred tax assets recorded at the end of the reporting period could be impacted. Refer to notes 7 and 12 for further detail.
Provision for employee benefitsPost-retirement defined benefits are provided for certain existing and former employees. Actuarial valuations are performed to assess the financial position of the relevant funds and are based on assumptions which include mortality rates, healthcare inflation, the expected long-term rate of return on investments, the discount rate and current market conditions. Refer to note 23 for further detail, including a sensitivity analysis.
Measurement of share-based paymentsThe cumulative expense recognised in terms of the group’s share-based payment schemes reflects the extent, in the opinion of management, to which the vesting period has expired and the number of rights to equity instruments granted that will ultimately vest. At the end of each reporting date the unvested rights are adjusted by the number forfeited during the period to reflect the actual number of instruments outstanding. Management is of the opinion that this represents the most accurate estimate of the number of instruments that will ultimately vest. The fair value attached to share options granted is valued using the Monte Carlo option pricing model. The key assumptions used in the calculation include estimates of the group’s expected share price volatility, dividend yield, risk-free interest rate and forfeiture rate.
Clicks ClubCard customer loyalty schemeThe fair value of the credits awarded recognised as deferred income includes an expected redemption rate based on historical experience, which is subject to uncertainty.
Consolidation of the Foundation Trust and the group’s share trustsDuring the year New Clicks Foundation Trust assumed certain responsibilities, resulting in the group having exposure to variable returns. In the judgement of management, the group controls the trust in accordance with IFRS 10.
The group also operates a combined share incentive scheme and broad-based black economic empowerment scheme through The Employee Share Ownership Trust. The trust is funded by loan accounts from group companies and dividends received from Clicks Group Limited. In the judgement of management, the group controls the trust in accordance with IFRS 10.
Insurance cell captiveThe group has determined that it does not have control over its insurance cell captive as the assets and liabilities are considered to belong to the insurer and not the investee. The cell captive has therefore not been consolidated and as the group is exposed to financial risk rather than insurance risk, the group has accounted for its investment as a financial asset at fair value through profit or loss in accordance with IAS 39.
ACCOUNTING POLICIES (CONTINUED)
19
Clicks Group Audited Annual Financial Statements 2017

The Clicks Helping Hand TrustThe Clicks Helping Hand Trust, founded by the group, is not consolidated in terms of IFRS 10. In the judgement of management, the group is not exposed to variable returns from the trust and any non-financial benefit is considered to be insignificant.
Measurement of financial instrumentsThe fair value of financial instruments that are not traded in an active market and are material to the group, is determined by using valuation techniques, which may include the use of external independent valuators, to value these unquoted financial instruments.
BASIS OF CONSOLIDATIONThe group financial statements include the financial statements of the company and subsidiaries that it controls. Control is achieved when the group is exposed, or has rights, to variable returns from its involvement with the investee and has the ability to affect those returns through its power over the investee. The group considers all relevant facts and circumstances in assessing whether it has the power over an investee and reassesses whether or not it controls an investee if facts and circumstances indicate that there are changes to one or more of the elements of control. The financial results of subsidiaries are included in the consolidated financial statements from the date that control was obtained and, where applicable, up to the date that control ceased.
All intragroup transactions and balances, including any unrealised gains and losses arising from intragroup transactions, are eliminated on consolidation. Unrealised losses are eliminated in the same way as unrealised gains but only to the extent that there is no evidence of impairment. The financial statements of the subsidiaries are prepared for the same reporting period as the parent company using consistent accounting policies.
The company carries its investments in subsidiaries at cost less accumulated impairment.
FAIR VALUE MEASUREMENTThe group measures financial instruments, such as derivatives and certain investments at fair value, at each reporting date. The fair values of financial instruments measured at amortised cost are disclosed should it be determined that the carrying value of these instruments does not reasonably approximate their fair value at each reporting date.
Fair value is the price that would be received to sell an asset or paid to transfer a liability in an orderly transaction between market participants at the measurement date. The fair value measurement is based on the presumption that the transaction to sell the asset or transfer the liability takes place either:
• in the principal market for the asset or liability; or
• in the absence of a principal market, in the most advantageous market for the asset or liability.
The principal or the most advantageous market must be accessible by the group.
The fair value of an asset or a liability is measured using the assumptions that market participants would use when pricing the asset or liability, assuming that market participants act in their economic best interest. A fair value measurement of a non-financial asset takes into account a market participant’s ability to generate economic benefits by using the asset in its highest and best use or by selling it to another market participant that would use the asset in its highest and best use.
The group uses valuation techniques that are appropriate in the circumstances and for which sufficient data are available to measure fair value, maximising the use of relevant observable inputs and minimising the use of unobservable inputs. All assets and liabilities for which fair value is measured or disclosed in the financial statements are categorised within the fair value hierarchy, described as follows, based on the lowest level input that is significant to the fair value measurement as a whole:
Level 1 — Quoted (unadjusted) market prices in active markets for identical assets or liabilities
Level 2 — Valuation techniques for which the lowest level input that is significant to the fair value measurement is directly or indirectly observable
Level 3 — Valuation techniques for which the lowest level input that is significant to the fair value measurement is unobservable
For assets and liabilities that are recognised in the financial statements on a recurring basis, the group determines whether transfers have occurred between the levels in the hierarchy by reassessing categorisation (based on the lowest level input that is significant to the fair value measurement as a whole) at the end of each reporting period.
For the purpose of fair value disclosures the group has determined classes of assets and liabilities on the basis of the nature, characteristics and risks of the asset or liability and the level of the fair value hierarchy as explained above.
BUSINESS COMBINATIONS AND GOODWILLBusiness combinations are accounted for using the acquisition method. The cost of an acquisition is measured as the aggregate of the consideration transferred, measured at fair value at acquisition date and the amount of any non-controlling interest in the acquiree. For each business combination the group elects whether the acquirer measures the non-controlling interest in the acquiree either at fair value or at the proportionate share of the acquiree’s identifiable net assets. Acquisition costs incurred are expensed.
ACCOUNTING POLICIES (CONTINUED)
20

When the group acquires a business it assesses the financial assets acquired and liabilities assumed for appropriate classification and designation in accordance with the contractual terms, economic circumstances and pertinent conditions as at the acquisition date. This includes the separation of embedded derivatives in host contracts by the acquiree.
Goodwill is initially measured at cost, being the excess of the consideration transferred over the group’s net identifiable assets acquired and liabilities assumed. If this consideration is lower than the fair value of the net assets of the subsidiary acquired, the difference is recognised in profit or loss. After initial recognition goodwill is measured at cost less any accumulated impairment losses.
Where goodwill forms part of a cash-generating unit and part of the operation within that unit is disposed of, the goodwill associated with the operation disposed of is included in the carrying amount of the operation when determining the gain or loss on disposal of the operation. Goodwill disposed of in this circumstance is measured based on the relative values of the operation disposed of and the portion of the cash-generating unit retained.
INVESTMENT IN ASSOCIATESAn associate is an entity in which the group has significant influence. Significant influence is the power to participate in the financial and operating policy decisions of the investee but is not control or joint control of those policies. The group’s interests in associates are accounted for using the equity method. On initial recognition the investment in associate is recognised at cost and subsequently the carrying amount is increased or decreased to recognise the group’s share of the net assets of the associate after date of acquisition. Goodwill relating to the associate is included in the carrying amount of the investment and is neither amortised nor individually tested for impairment.
The group’s share of the associate’s profit or loss is recognised in profit or loss, outside of operating profit and represents profit or loss after tax of the associate. Where there has been a change recognised directly in other comprehensive income or equity of the associate the group recognises its share of any changes and discloses this, where applicable, in the group statement of other comprehensive income or group statement of changes in equity. Distributions received from the associate reduce the carrying amount of the investment.
Unrealised gains and losses resulting from transactions between the group and the associate are eliminated to the extent of the group’s interest in the associate.
After application of the equity method the group determines whether it is necessary to recognise any additional impairment loss with respect to its net investment in the associate. The group determines at each reporting date whether there is objective evidence that the investment in the associate is impaired. If there is such evidence the group calculates the amount of
impairment as the difference between the recoverable amount of the investment and its carrying value and then recognises the loss in profit or loss.
Where the group’s interest in an associate is reduced but the equity method continues to be applied, the group reclassifies to profit or loss the proportion of the gain or loss previously recognised in other comprehensive income relative to that reduction in ownership interest. The use of the equity method should cease from the date that significant influence is lost.
The company carries its investments in associates at cost less accumulated impairment in its separate financial statements.
FOREIGN CURRENCYFunctional and presentation currencyAll items in the financial statements of the group’s subsidiaries are measured using the currency of the primary economic environment in which the subsidiary operates (“the functional currency”). The group’s consolidated financial statements are presented in Rands, which is the company’s functional and the group’s presentation currency.
Foreign currency transactions and balancesTransactions in foreign currencies are translated to the respective functional currencies of group entities at rates of exchange ruling at the transaction date. Monetary assets and liabilities denominated in foreign currencies at the reporting date are translated to the functional currency at the rates of exchange ruling at that date. The foreign currency gain or loss on monetary items is the difference between amortised cost in the functional currency at the beginning of the period, adjusted for the effective interest and payments during the period. Non-monetary items that are measured in terms of historical cost in a foreign currency are translated using the exchange rates at the dates of the initial transactions. Non-monetary assets and liabilities denominated in foreign currencies that are measured at fair value are translated to the functional currency at the exchange rate at the date that the fair value was determined.
Foreign exchange differences arising on translation are recognised in profit or loss.
Foreign operationsThe assets and liabilities of foreign operations, including goodwill and fair value adjustments arising on acquisition, are translated to South African Rands at exchange rates at the reporting date. The income and expenses of foreign operations are translated to South African Rands at the average exchange rates for the period.
Gains and losses on translation are recognised in other comprehensive income and presented within equity in the foreign currency translation reserve (“FCTR”).
When a foreign operation is disposed of, in part or in full, the related amount in the FCTR is transferred to profit or loss.
ACCOUNTING POLICIES (CONTINUED)
21
Clicks Group Audited Annual Financial Statements 2017

FINANCIAL INSTRUMENTSInitial recognition and measurementThe group recognises a financial asset or financial liability when it becomes a party to the contractual provisions of the instrument. It initially measures the financial instrument at fair value, plus, in the case of a financial asset or financial liability not at fair value through profit or loss, transaction costs that are directly attributable to the acquisition or issue of the financial asset or liability.
Subsequent measurementThe subsequent measurement of financial assets depends on their classification as described below:
Financial instruments are classified at fair value through profit or loss if they are held for trading or are designated as such upon initial recognition. Financial instruments are designated at fair value through profit or loss if the group manages such investments and makes purchase and sale decisions based on their fair value in accordance with the group’s documented risk management or investment strategy. Derivatives, including separated embedded derivatives are also classified as held for trading unless they are designated as effective hedging instruments as defined by IAS 39. Financial instruments at fair value through profit or loss are measured at fair value and changes therein are recognised in profit or loss.
Trade and other receivables and loans receivableTrade and other receivables and loans receivable are categorised as loans and receivables. These financial assets originate by the group providing goods, services or money directly to a debtor and, subsequent to initial recognition, are measured at amortised cost using the effective interest method less any accumulated impairment losses.
Financial assets at fair value through profit or lossThe net investment in the insurance cell captive and investments in equity and other similar instruments are designated as financial assets at fair value through profit or loss. This is classified at fair value with any fair value gains and losses recognised in other costs.
Cash and cash equivalentsCash and cash equivalents are categorised as loans and receivables and, subsequent to initial recognition, are measured at amortised cost.
For the purpose of the statement of cash flows, cash and cash equivalents comprise cash on hand, deposits held on call with banks and investments in money market instruments, net of bank overdrafts, all of which are available for use by the group unless otherwise stated.
Outstanding payments are included in trade and other payables.
Interest-bearing borrowingsInterest-bearing borrowings are financial liabilities with fixed or determinable payments. Subsequent to initial recognition these financial instruments are measured at amortised cost, with any difference between cost and redemption value being recognised in profit or loss over the period of the borrowings on an effective interest basis.
Trade and other payablesSubsequent to initial recognition trade and other payables are measured at amortised cost.
Financial liability at fair value through profit or lossThe contingent consideration arising from the investment in the associate is measured at fair value through profit or loss with any fair value gains and losses recognised in other costs.
Derivative financial instruments and hedging activitiesThe group uses derivative financial instruments to hedge its exposure to foreign exchange and interest rate risks arising from operational, financing and investing activities, as well as market risk arising on cash-settled share-based compensation schemes and employee benefits. In accordance with its treasury policy, the group does not hold or issue derivative financial instruments for trading purposes. Subsequent to initial recognition derivatives are measured at fair value. The method of recognising the resulting gain or loss depends on whether the derivative is designated as a hedging instrument and, if so, the nature of the item being hedged. Where a derivative financial instrument is used to hedge the variability in cash flows that is attributable to a particular risk associated with a recognised asset or liability or a highly probable forecast transaction or the foreign currency risk in a firm commitment, the hedge is classified as a cash flow hedge.
Hedge relationships are formally documented and designated at inception. The documentation includes identification of the hedged item and the hedging instrument and details the risk that is being hedged and the way in which effectiveness will be assessed at inception and during the period of the hedge. If the hedge is not highly effective in off-setting changes in fair values or cash flows attributable to the hedged risk, consistent with the documented risk management strategy, hedge accounting is discontinued.
Cash flow hedgesWhere a derivative financial instrument is designated as a hedge of the variability in cash flows of a recognised asset or liability or a highly probable forecast transaction, the effective portion of the gain or loss on the hedging instrument is recognised in other comprehensive income. The ineffective portion is recognised in profit or loss.
ACCOUNTING POLICIES (CONTINUED)
22

When the forecast transaction results in the recognition of a financial asset or financial liability the cumulative gain or loss is reclassified from other comprehensive income in the same period in which the hedged forecast cash flows/hedged item affect profit or loss. Otherwise the cumulative gain or loss is removed from other comprehensive income and recognised in profit or loss at the same time as the hedged transaction.
When the forecast transaction that is hedged results in the recognition of a non-financial asset (for example, inventory or property, plant and equipment) the gains and losses previously deferred in equity are transferred from equity and included in the initial measurement of the cost of the asset. The deferred amounts are ultimately recognised in cost of goods sold in the case of inventory or in depreciation in the case of property, plant and equipment.
Hedge accounting is discontinued if the hedge no longer meets the criteria for hedge accounting; if the hedging instrument expires or is sold, terminated or exercised; if the forecast transaction is no longer expected to occur; or if hedge designation is revoked. On the discontinuance of hedge accounting (except where a forecast transaction is no longer expected to occur), the cumulative unrealised gain or loss recognised in other comprehensive income is recognised in profit or loss when the forecast transaction occurs and affects profit or loss. Where a forecast transaction is no longer expected to occur the cumulative unrealised gain or loss is recognised immediately in profit or loss.
Derivatives not qualifying for hedge accountingCertain derivative instruments do not qualify for hedge accounting. Such derivatives are classified as at fair value through profit or loss and changes in the fair value of any derivative instruments that do not qualify for hedge accounting are recognised immediately in profit or loss.
DerecognitionFinancial assetsA financial asset (or, where applicable, a part of a financial asset or part of a group of similar financial assets) is derecognised when the contractual rights to the cash flows from the asset expire, or it transfers the rights to receive the contractual cash flows on the financial asset in a transaction in which substantially all the risks and rewards of ownership or control of the financial asset are transferred.
Where the group has transferred its rights to receive cash flows from an asset and has neither transferred nor retained substantially all the risks and rewards of the asset nor transferred control of the asset, the asset is recognised to the extent of the group’s continuing involvement in the asset. Continuing involvement that takes the form of a guarantee over the transferred asset is measured at the lower of the original carrying amount of the asset and the maximum amount of consideration that the group could be required to repay.
Financial liabilitiesA financial liability is derecognised when the obligation under the liability is discharged, cancelled or expires. Where an existing financial liability is replaced by another from the same lender on substantially different terms, or the terms of an existing liability are substantially modified, such an exchange or modification is treated as a derecognition of the original liability and the recognition of a new liability, and the difference in the respective carrying amounts is recognised in profit or loss.
OffsetFinancial assets and financial liabilities are off-set and the net amount reported in the statement of financial position when the group has a legally enforceable right to set off the recognised amounts and intends either to settle on a net basis, or to realise the asset and settle the liability simultaneously.
PROPERTY, PLANT AND EQUIPMENTRecognition and measurementItems of property, plant and equipment, including owner-occupied buildings, are stated at historical cost less accumulated depreciation and accumulated impairment losses. Land is stated at cost less impairment losses.
Cost includes expenditure that is directly attributable to the acquisition of the asset. Installation and other costs, which comprise materials and direct labour costs necessarily incurred in order to acquire property, plant and equipment, are also included in cost.
When parts of property, plant and equipment have different useful lives they are accounted for as separate items (major components) of property, plant and equipment.
Borrowing costs are capitalised in line with the accounting policy outlined under financial expenses.
Gains or losses on the disposal of property, plant and equipment, comprising the difference between the net disposal proceeds and the carrying amount of the asset, are recognised in profit or loss.
Subsequent costsSubsequent expenditure relating to an item of property, plant and equipment is capitalised when it is probable that future economic benefits embodied within the item will flow to the group and its cost can be measured reliably. All other subsequent expenditure is recognised as an expense in the period in which it is incurred.
DepreciationDepreciation is recognised in profit or loss on a straight-line basis over the estimated useful life of each part of the asset in order to reduce the cost of the asset to its residual value. Residual value is the amount that an entity could receive for the asset at the reporting date
ACCOUNTING POLICIES (CONTINUED)
23
Clicks Group Audited Annual Financial Statements 2017

if the asset were already of the age and the condition that it will be in when the entity expects to dispose of it. Residual value does not include expected future inflation. Land is not depreciated.
The estimated useful lives for the current and comparative periods are as follows:
Buildings 50 yearsComputer equipment 3 to 7 yearsEquipment 3 to 10 yearsFurniture and fittings 5 to 10 yearsMotor vehicles 5 years
Depreciation methods, useful lives and residual values are reviewed at each reporting date.
LEASESLeases of assets under which substantially all of the risks and rewards of ownership are effectively retained by the lessor are classified as operating leases. Minimum lease payments under an operating lease are recognised as an expense on a straight-line basis over the lease term. The resulting difference arising from the straight-line basis and contractual cash flows is recognised as an operating lease obligation or asset. Contingent rentals, such as those relating to turnover, are expensed in the year in which they arise.
INTANGIBLE ASSETS (OTHER THAN GOODWILL)Intangible assets (other than goodwill) are initially recognised at cost if acquired externally, or at fair value if acquired as part of a business combination. Expenditure on internally generated development activity is capitalised if the product or process is technically and commercially feasible, the group has sufficient resources to complete development, the group has intention to complete and use or sell it, it is probable that future economic benefits relating to the asset will flow to the group and the cost can be measured reliably. The expenditure capitalised includes the cost of materials, direct labour and an appropriate proportion of overheads. Subsequent expenditure is capitalised only when it increases the future economic benefits embodied in the associated intangible asset. Other research and development expenditure is recognised in profit or loss as an expense when incurred.
No value is attached to internally developed and maintained trademarks or brand names. Expenditure incurred to maintain trademarks and brand names is recognised in profit or loss as incurred.
Intangible assets which have finite useful lives are measured at cost less accumulated amortisation and accumulated impairment. Intangible assets that are assessed as having a finite useful life are amortised over their useful lives on a straight-line basis from the date they become available for use and are tested for impairment if indications exist that they may be impaired. Intangible assets with indefinite useful lives are not amortised and are tested annually for impairment.
The estimated useful lives of intangible assets with finite lives for the current and comparative periods are as follows:
Capitalised software development 5 to 10 yearsPurchased computer software 3 to 5 yearsContractual rights 5 yearsClicks trademark Indefinite useful lifeOther trademarks 10 years
Amortisation methods, residual values and remaining useful lives of intangible assets with finite useful lives are reassessed annually.
INVENTORIESMerchandise for resale is valued on the weighted average cost basis and is stated at the lower of cost and net realisable value. The cost of inventories comprises all costs of purchase, conversion and other costs incurred in bringing the inventories to their present location and condition, and is stated net of purchase incentives. Net realisable value is the estimated selling price in the ordinary course of business less the estimated costs to complete and sell the product. The cost of merchandise sold includes normal shrinkage, wastage and inventory losses. Obsolete, redundant and slow moving inventories are identified on a regular basis and are written down to their net realisable value. The carrying amount of inventory is recognised as an expense in the period in which the related revenue is recognised.
IMPAIRMENT OF ASSETSNon-financial assetsThe carrying amounts of the group’s non-financial assets other than inventories (see accounting policy note for inventories) and deferred tax assets (see accounting policy note for deferred tax), are reviewed at each reporting date to determine whether there is any indication of impairment. If any such indication exists, the asset’s recoverable amount is estimated.
For goodwill, intangible assets that have an indefinite useful life and intangible assets that are not yet available for use, the recoverable amount is estimated at each reporting date.
Whenever the carrying amount of an asset or its cash-generating unit exceeds its recoverable amount, an impairment loss is recognised in profit or loss.
As goodwill is not capable of generating cash flows independently of other assets, in assessing the recoverable amount of goodwill, it is allocated to cash-generating units on a reasonable and consistent basis. Where appropriate, corporate assets are also allocated to cash-generating units on a reasonable and consistent basis. The recoverable amount of the cash-generating unit (including an allocation of goodwill and corporate assets) is assessed with reference to the future cash flows of the cash-generating unit. Where an impairment is identified for a cash-generating unit, the impairment is applied first to the goodwill allocated to the cash-
ACCOUNTING POLICIES (CONTINUED)
24

generating unit and then to other assets on a pro rata basis comprising the cash-generating unit provided that each identifiable asset is not reduced to below its recoverable amount.
Recoverable amountThe recoverable amount of an asset is the greater of its fair value less costs of disposal and its value in use. Recoverable amounts are estimated for individual assets or, if an asset does not generate largely independent cash flows, for a cash-generating unit. A cash-generating unit is the smallest collection of assets capable of generating cash flows independent of other assets or other cash-generating units.
The fair value less costs of disposal is the amount obtainable from the sale of an asset or cash-generating unit in an orderly transaction between market participants at the measurement date. Value in use is the present value of estimated future cash flows expected to arise from the continuing use of an asset or cash-generating unit and from its disposal at the end of its useful life. The estimated future cash flows are discounted using a pre-tax discount rate that reflects current market assessments of the time value of money and the risks specific to the asset.
Reversal of impairment losses Impairment losses recognised in prior years are assessed at each reporting date for any indicators that the losses have decreased or no longer exist. Reversal of impairment losses recognised in prior years are recorded when there is an indication that the impairment losses recognised for the asset no longer exist or have decreased, either as a result of an event occurring after the impairment loss was recognised or if there has been a change in the estimates used to calculate the recoverable amount.
An impairment loss is reversed only to the extent that the carrying amount of the affected asset is not increased to an amount higher than the carrying amount that would have been determined, net of depreciation or amortisation, had no impairment loss been recognised in prior years. The reversal is recorded as income in profit or loss.
An impairment loss in respect of goodwill is never reversed.
Financial assetsThe group assesses, at each reporting date, whether there is objective evidence that a financial asset or a group of financial assets is impaired. A financial asset or a group of financial assets is deemed to be impaired if there is objective evidence of impairment as a result of one or more events that has occurred since the initial recognition of the asset (an incurred “loss event”) and that loss event has an impact on the estimated future cash flows of the financial asset or the group of
financial assets that can be reliably estimated. Evidence of impairment may include indications that the debtors or a group of debtors is experiencing significant financial difficulty, default or delinquency in interest or principal payments, the probability that they will enter bankruptcy or other financial reorganisation and observable data indicating that there is a measurable decrease in the estimated future cash flows, such as changes in arrears or economic conditions that correlate with defaults.
For financial assets carried at amortised cost, the group first assesses whether objective evidence of impairment exists individually for financial assets that are individually significant, or collectively for financial assets that are not individually significant. If the group determines that no objective evidence of impairment exists for an individually assessed financial asset, whether significant or not, it includes the asset in a group of financial assets with similar credit risk characteristics and collectively assesses them for impairment. Assets that are individually assessed for impairment and for which an impairment loss is, or continues to be, recognised are not included in a collective assessment of impairment. If there is objective evidence that an impairment loss has been incurred the amount of the loss is measured as the difference between the asset’s carrying amount and the present value of estimated future cash flows (excluding future expected credit losses that have not yet been incurred). The present value of the estimated future cash flows is discounted at the financial asset’s original effective interest rate.
The carrying amount of the asset is reduced through the use of an allowance account and the loss is recognised in profit or loss. Interest income continues to be accrued on the reduced carrying amount and is accrued using the rate of interest used to discount the future cash flows for the purpose of measuring the impairment loss. The interest income is recorded as finance income in the statement of comprehensive income. Receivables together with the associated allowance are written off when there is no realistic prospect of future recovery and all collateral has been realised or has been transferred to the group. If, in a subsequent year, the amount of the estimated impairment loss increases or decreases because of an event occurring after the impairment was recognised the previously recognised impairment loss is increased or reduced by adjusting the allowance account.
SHARE CAPITALShare capitalOrdinary share capital represents the par value of ordinary shares issued.
Share premiumShare premium represents the excess consideration received by the company over the par value of ordinary shares issued and is classified as equity.
ACCOUNTING POLICIES (CONTINUED)
25
Clicks Group Audited Annual Financial Statements 2017

Incremental costs directly attributable to the issue of ordinary shares are recognised as a deduction from share premium, net of any tax effect.
Treasury sharesOrdinary shares in Clicks Group Limited which have been acquired by the group in terms of an approved share repurchase programme, held by the Share Incentive Trust or held by The Clicks Group Employee Share Ownership Trust, are classified as treasury shares. The cost of these shares is deducted from equity and the number of shares is deducted from the weighted average number of shares. Dividends received on treasury shares are eliminated on consolidation.
When treasury shares are sold or reissued the amount received is recognised as an increase in equity and the resulting surplus or deficit over the cost of these shares on the transaction is transferred to or from distributable reserves.
Upon settlement (take-up) of the share options by employees the difference between the proceeds received from the employees and the cost price of shares is accounted for directly in equity.
EMPLOYEE BENEFITSShort-term employee benefitsThe cost of all short-term employee benefits is recognised as an expense during the period in which the employee renders the related service.
Accruals for employee entitlements to wages, salaries, bonuses and annual leave represent the amount which the group has a present obligation to pay as a result of employees’ services provided up to the reporting date. The accruals have been calculated at undiscounted amounts based on current wage and salary rates.
Other long-term employee benefitsLiabilities for long-term employee benefits, other than pension plans, which are not expected to be settled within twelve months, are discounted to present value using the market yields at the reporting date on government bonds with maturity dates that most closely match the terms of maturity of the group’s related liabilities.
Defined contribution retirement fundsA defined contribution plan is a post-employment benefit plan under which an entity pays fixed contributions into a separate entity and will have no legal or constructive obligation to pay further amounts.
The group operates a retirement scheme comprising a number of defined contribution funds in South Africa, the assets of which are held in separate trustee-administered funds. The retirement schemes are funded by payments from employees and the relevant group entity. Obligations for contributions to these funds are
recognised as an expense in profit or loss as incurred. Prepaid contributions are recognised as an asset to the extent that a cash refund or reduction in future payments is available.
Post-retirement medical aid benefits – defined benefit plansA defined benefit plan is a post-employment benefit plan other than a defined contribution plan.
The group’s obligation to provide post-retirement medical aid benefits to certain employees is calculated by estimating the amount of future benefit that qualifying employees have earned in return for their service in the current and prior periods. This benefit is discounted to determine its present value using a discount rate based on the market yields at the reporting date on government bonds with maturity dates that most closely match the terms of maturity of the group’s obligation. The calculation is performed by a qualified actuary using the projected unit credit method.
Past service costs are recognised in profit or loss at the earlier of the date of the plan amendment or curtailment, and the date that the group recognises restructuring-related costs.
The group recognises actuarial gains or losses from defined benefit plans immediately in other comprehensive income.
Equity-settled share-based compensation benefitsThe group grants share options to certain employees under an employee share plan. The fair value is measured at grant date and spread over the period during which the employees become unconditionally entitled to the options. The fair value of the options granted as part of the Clicks Group employee share option plan is measured using the Monte Carlo option pricing model, taking into account the terms and conditions under which the options were granted. The amount recognised as an expense with a corresponding increase in equity is adjusted at each reporting date to reflect the actual number of share options that vest or are expected to vest. Where an option is cancelled (other than by forfeiture when vesting conditions are not satisfied), it is treated as if it had vested on the date of cancellation and any expense not yet recognised for the option is recognised immediately.
Group share scheme recharge arrangements A recharge arrangement exists whereby the cost of acquiring shares, issued in accordance with certain share schemes granted by the parent company, is funded by way of contributions from subsidiary companies in respect of participants who are their employees. The recharge arrangement is accounted for separately from the underlying equity-settled share-based payment upon initial recognition, as follows:
ACCOUNTING POLICIES (CONTINUED)
26

• The subsidiary recognises a recharge liability and a corresponding adjustment against equity for the capital contribution recognised in respect of the share-based payment.
• The parent recognises a recharge asset and a corresponding adjustment to the carrying amount of the investment in the subsidiary.
The recharge arrangement is eliminated on consolidation.
Subsequent to initial recognition the recharge arrangement is remeasured at fair value at each subsequent reporting date until settlement date to the extent vested. The amount of the recharge in excess of the capital contribution recognised in respect of a share-based payment (in the subsidiary’s financial statements) or the cost of investment in the subsidiary (in the parent’s financial statements) is recognised as a return of capital. In the parent’s financial statements the recharge is recognised as a reduction in the cost of the investment in the subsidiary and the excess of the recharge reduces the cost of the investment in the subsidiary until it has a balance of zero. Any further decreases in the cost of investment in subsidiary will be recognised by the parent as dividend income in profit or loss. In the subsidiary’s financial statements the excess is treated as a distribution/dividend to its parent.
Cash-settled share-based compensation benefitsThe group grants cash-settled appreciation rights to management in terms of a long-term incentive scheme. The value of these appreciation rights are linked to the total shareholder return (capital gain plus dividends) over the vesting period. The cost of cash-settled transactions is measured initially at fair value at the grant date, further details of which are given in note 23.1. This fair value is expensed over the period until the vesting date with recognition of a corresponding liability. The liability is remeasured to fair value at each reporting date up to and including the settlement date, with changes in fair value recognised in employee benefits expense (see note 4).
Cash-settled earnings-based compensation benefitsThe group grants cash-settled appreciation rights to management in terms of a long-term incentive scheme. The value of these appreciation rights are linked to the performance of diluted HEPS. The liability which is not expected to be settled within twelve months is discounted to present value using market yields, at the reporting date, on government bonds with maturity dates that most closely match the terms of maturity of the group’s related liabilities. Any difference between projected performance and actual performance is recognised through an actuarial gain or loss based on the projected unit credit method which is recognised immediately in profit or loss.
PROVISIONSA provision is recognised when the group has a present legal or constructive obligation as a result of a past event and it is probable that an outflow of economic benefits will be required to settle the obligation, and a reliable estimate can be made of the amount of the obligation. Where the effect of the time value of money is material, the amount of a provision is determined by discounting the anticipated future cash flows expected to be required to settle the obligation at a pre-tax rate that reflects the risks specific to the liability.
A provision for onerous contracts is recognised when the expected benefits to be derived by the group from a contract are lower than the unavoidable cost of meeting the obligations under the contract. The provision is measured at the present value of the lower of the expected cost of terminating the contract and net cost of continuing with the contract. Before a provision is established, the group recognises any impairment loss on the asset associated with that contract.
Provisions are reviewed at each reporting date and adjusted to reflect the current best estimate.
GUARANTEESA financial guarantee is a contract that requires the issuer to make specified payments to reimburse the holder for a loss it incurs because a specified debtor fails to make payment when due in accordance with the original or modified terms of a debt instrument.
REVENUETurnoverTurnover comprises net sales to customers. Turnover is measured at the fair value of the consideration received or receivable net of returns, trade discounts, discounts on ClubCard and volume rebates, and is stated exclusive of value-added and general sales tax. Revenue from sales is recognised when the significant risks and rewards of ownership are transferred to the buyer, there is no continuing managerial involvement, costs can be measured reliably and receipt of the future economic benefits is probable.
Revenue recognition – ClubCardThe group operates a loyalty scheme through Clicks ClubCard. The card allows customers to accumulate ClubCard points that entitle them, subject to certain criteria, to vouchers that may be used in-store. The fair value which includes the expected redemption rate, attributed to the credits awarded is deferred as a liability and recognised as revenue on redemption of the vouchers by customers.
Financial incomeFinancial income comprises interest income and dividend income. Interest income is recognised in profit or loss on a time proportion basis, taking account of the principal outstanding and the effective interest rate
ACCOUNTING POLICIES (CONTINUED)
27
Clicks Group Audited Annual Financial Statements 2017

over the period to maturity when it is probable that such income will accrue to the group.
Dividend income is recognised when the right to receive payment is established.
Distribution and logistics fee incomeRevenue in respect of services rendered is recognised in profit or loss as the services are rendered.
Other recovery income Other recovery income is recognised in profit or loss when the group becomes entitled to the income or when it is virtually certain that the conditions required to be fulfilled before payment is received will be fulfilled.
Rental incomeIncome from operating leases in respect of property is recognised in profit or loss on a straight-line basis over the lease term.
FINANCIAL EXPENSESFinancial expenses comprise interest payable on borrowings calculated using the effective interest method and unwinding of the discount on provisions and long-term employee benefits.
Borrowing costs directly attributable to the acquisition, construction or production of qualifying assets, which are assets that necessarily take a substantial period of time to get ready for their intended use or sale, are added to the cost of those assets, until such time as the assets are substantially ready for their intended use or sale.
INCOME TAXESIncome tax expense on the profit or loss for the year comprises current and deferred tax. Income tax is recognised in profit or loss except to the extent that it relates to items recognised in other comprehensive income or directly in equity in which case the tax is recognised in other comprehensive income or in equity, respectively.
Current tax is the expected tax payable on the taxable profit for the current year using tax rates enacted or substantively enacted at the reporting date and any adjustment to tax payable in respect of previous years.
Deferred tax is recognised for all temporary differences between the tax value of an asset or liability and the carrying amount for financial reporting purposes, except for the initial recognition of goodwill, the initial recognition of assets or liabilities in a transaction that is not a business combination and that affects neither accounting nor taxable profit, and differences relating to investments in subsidiaries and jointly controlled entities, to the extent that they will probably not reverse in the foreseeable future.
Deferred tax is measured at the tax rates that are expected to be applied to the temporary differences
when they reverse, based on the laws that have been enacted or substantively enacted at the reporting date. Deferred tax assets and liabilities are off-set if there is a legally enforceable right to off-set current tax liabilities and assets, and they relate to income taxes levied by the same tax authority on the same taxable entity, or on different tax entities, but they intend to settle current tax liabilities and assets on a net basis or their tax assets and liabilities will be realised simultaneously.
Deferred tax assets are recognised for all deductible temporary differences and tax losses to the extent that it is probable that future taxable profit will be available against which the deductible temporary differences and tax losses can be utilised.
Deferred tax assets are reviewed at each reporting date and are reduced to the extent that it is no longer probable that the related tax benefit will be realised.
DIVIDENDS WITHHOLDING TAXDividends withholding tax is levied on the beneficial owner of the shares instead of the group. The tax is withheld by the group and paid over to the South African Revenue Service (“SARS”) on the beneficiaries’ behalf. The resultant tax expense and liability has been transferred to the shareholder and is no longer accounted for as part of the tax charge for the group. Amounts not yet paid over to SARS are included in trade and other payables and the measurement of the dividend amount is not impacted by the withholding tax.
SEGMENT REPORTINGThe group has adopted the “management approach” to reporting segment information, basing this on the group’s internal management reporting data used internally by the chief operating decision-maker (“CODM”).
An operating segment is defined as a component of an entity that engages in business activities from which it may earn revenues and incur expenses (including revenues and expenses relating to transactions with other components of the same entity) whose operating results are regularly reviewed by the entity’s CODM to make decisions about resources to be allocated to the segment and assess its performance and for which discrete financial information is available.
EARNINGS PER SHAREThe group presents basic and diluted earnings per share (“EPS”) for its ordinary shares. Basic EPS is calculated by dividing the profit or loss attributable to the ordinary shareholders by the weighted average number of ordinary shares outstanding during the period. Diluted EPS is determined by adjusting the profit or loss attributable to ordinary shareholders and the weighted average number of ordinary shares outstanding for the dilutive effects of all share options granted to employees.
ACCOUNTING POLICIES (CONTINUED)
28

RECENT ACCOUNTING DEVELOPMENTS Standards, amendments and interpretations issued but not yet effective and under review as to their effect on the groupThe International Accounting Standards Board (“IASB”) and IFRIC issued the following standards, amendments and interpretations, with an effective date after the date of these financial statements, which management believes could impact the group in future periods.
The group has elected not to early adopt any of these standards.
StandardStandard’s name and effective date Description
IFRS 9 Financial Instruments
1 January 2018
IFRS 9, as issued, reflects the final phase of the IASB’s work on the replacement of IAS 39. It applies to the following:
• classification and measurement of financial assets and financial liabilities as defined in IAS 39;
• a new general hedge accounting model; and
• a new expected loss impairment model and introducing limited amendments to the classification and measurement requirements for financial assets.
Management’s preliminary assessment is that the standard will primarily relate to the impairment of trade receivables but is not expected to have a material impact on the financial statements. However, an evaluation is being performed.
IFRS 15 Revenue from Contracts with Customers
1 January 2018
IFRS 15 specifies how and when to recognise revenue as well as requiring entities to provide users of financial statements with more informative, relevant disclosures. The standard provides a single, principles-based five-step model to be applied to all contracts with customers.
Management’s preliminary assessment is that the standard will not have a material impact on the financial statements. However, an evaluation is being performed.
IFRS 16 Leases
1 January 2019
IFRS 16 establishes the principles for the recognition, measurement, presentation and disclosure of leases. The standard provides a single lessee accounting model, requiring lessees to recognise assets and liabilities for all leases unless the lease term is 12 months or less or the underlying asset has a low value. Lessors continue to classify leases as operating or finance with the standard’s approach to lessor accounting substantially unchanged from its predecessor, IAS 17.
An evaluation has been performed to determine the likely impact on the financial statements after the effective date of 1 January 2019, reporting period ending on 31 August 2020.
Management’s assessment has indicated that changes to the statement of financial position line items and statement of comprehensive income can be expected. These include, but are not limited to, property, plant and equipment, lease liabilities, lease assets, depreciation, occupancy costs and financial expense.
Refer to note 24 of the annual financial statements for disclosure of operating lease liabilities and lease commitments.
IAS 7 Disclosure Initiative (Amendments)
1 January 2017
The amendment requires disclosures that enable users of financial statements to evaluate changes in liabilities arising from financing activities, including changes arising from both cash flow and non-cash flow changes.
This amendment will impact the disclosure in the group’s financial statements.
ACCOUNTING POLICIES (CONTINUED)
29
Clicks Group Audited Annual Financial Statements 2017

The following standards, amendments and interpretations which have been issued but are not yet effective have been assessed for applicability to the group. Management has concluded that they are not applicable to the business of the group and are not expected to have a significant impact on future financial statements.
IFRS 10 and IAS 28 – Sale or Contribution of Assets between an Investor and its Associate or Joint Venture (Amendments): effective period has been postponed indefinitely by the IASB pending the outcome of its research project on the equity method of accounting
Annual improvements to IFRS Standards 2014 – 2016 Cycle: effective for periods on or after 1 January 2017
IFRS 2 – Amendments to classification and measurement of share-based payment transactions: effective for periods on or after 1 January 2018
IFRS 4 – Applying IFRS 9 – Financial Instruments with IFRS 4 – Insurance Contracts: effective for periods on or after 1 January 2018
IAS 40 – Clarification of the requirements on transfers to or from investment property: effective for periods on or after 1 January 2018
IFRIC 22 – Foreign Currency Transactions and Advance Considerations – addresses the exchange rate to use in transactions that involve advance consideration paid or received in a foreign currency: effective for periods on or after 1 January 2018
IFRS 17 – Insurance Contracts: effective for annual periods on or after 1 January 2021
IFRIC 23 – Uncertainty over Income Tax Treatment: effective for annual periods on or after 1 January 2019
ACCOUNTING POLICIES (CONTINUED)
30

NOTES TO THE ANNUAL FINANCIAL STATEMENTSfor the year ended 31 August
Group2017
R’0002016
R’0001 Revenue
Turnover 26 809 101 24 170 879 Finance income 10 501 6 255 Other income 1 523 005 1 353 833
Distribution and logistics fees 683 022 651 730 Rental income 437 399 Advertising income, cost recoveries and other 839 546 701 704
28 342 607 25 530 967
2 Depreciation and amortisationDepreciation of property, plant and equipment (see note 9) 259 657 237 824 Amortisation of intangible assets (see note 10) 37 409 26 320 Total depreciation and amortisation 297 066 264 144 Depreciation included in cost of merchandise sold and inventories (13 839) (11 482)Depreciation and amortisation included in expenses 283 227 252 662
3 Occupancy costsOperating leases 746 130 654 097 Turnover rental expense 46 255 17 595 Movement in operating lease liability (see note 24) 2 617 9 941 Movement in provision for onerous contracts (see note 26) (206) 1 194
794 796 682 827
4 Employment costsDirectors’ emoluments (excluding incentives, see note 4.1) 21 630 19 790
Non-executive fees 3 210 2 926 Executive 18 420 16 864
Salary 17 182 14 780 Other benefits 1 238 2 084
Equity-settled share option costs (see note 20) 58 909 64 533 Long-term incentive scheme – TSR (see note 23) 149 020 96 119 Release of gain on cash flow hedge to profit or loss (see note 21) (123 779) (65 422)Long-term incentive scheme – HEPS (see note 23) 49 113 52 063 Staff salaries and wages 2 477 494 2 203 402 Contributions to defined contribution plans 143 419 123 874 Leave pay costs (see note 23) 16 480 17 107 Bonuses (see note 23) 151 931 137 245 Increase in liability for defined benefit plans (see note 23) 1 074 1 473 Total employment costs 2 945 291 2 650 184Employment costs included in cost of merchandise sold and inventories (99 453) (99 453)Employment costs included in expenses 2 845 838 2 550 731
For further detail of directors’ emoluments refer to the remuneration report on pages 65 to 67 of the Integrated Report or note 4.1.
Included in total employment costs are the following aggregate amounts (including directors’ emoluments) relating to transactions with key management personnel:
168 049 86 130 Short-term employee benefits 28 944 25 174 Post-employment benefits 2 217 2 938 Short-term incentive scheme 14 055 12 833 Long-term incentive scheme 122 743 43 630 Termination benefits – 1 465 Share-based payments 90 90
Non-executive directors’ fees 3 210 2 926 171 259 89 056
31
Clicks Group Audited Annual Financial Statements 2017

NOTES TO THE ANNUAL FINANCIAL STATEMENTSfor the year ended 31 August
4 Employment costs (continued)4.1 Directors’ remuneration
Executive directors’ remuneration
Director(R’000) Salary
Pension fund
Other benefits
Total annual
guaran-teed pay
RONA short-
term incentive
Per-fomance-
based long-term incentive*
Total variable
pay Total
2017
Bertina Engelbrecht 3 220 380 – 3 600 1 508 17 081 18 589 22 189
Michael Fleming 4 879 284 57 5 220 2 186 25 883 28 069 33 289
David Kneale** 9 083 515 2 9 600 6 031 48 000 54 031 63 631
Total 17 182 1 179 59 18 420 9 725 90 964 100 689 119 109
2016
Bertina Engelbrecht 2 833 472 – 3 305 1 368 5 155 6 523 9 828
Michael Fleming 4 140 587 57 4 784 1 981 7 826 9 807 14 591
David Kneale 7 807 966 2 8 775 5 449 20 876 26 325 35 100
Total 14 780 2 025 59 16 864 8 798 33 857 42 655 59 519
* Payments relating to the performance for the year ended 31 August are paid in November. The expense is provided for over the three-year vesting period in the relevant financial year
** The LTI payment to Mr Kneale has been capped at five times annual guaranteed pay in accordance with the rules of the scheme
The total number of ordinary shares in issue is 245 968 968 (2016: 246 137 763). The percentage of issued share capital held by directors is 0.22% (2016: 0.20%).
Details of all dealings in Clicks Group shares by directors during the financial year are contained in the directors’ report on page 2 and directors’ shareholdings are set out on page 71, which has been audited.
Non-executive directors’ remuneration
Director
2017Directors’
fees(R’000)
2016Directors’
fees(R’000)
David Nurek 1 059 950
Fatima Abrahams* 459 409
John Bester 581 521
Nonkululeko Gobodo** 213 –
Fatima Jakoet 408 359
Nkaki Matlala*** 161 417
Martin Rosen 329 270
Total 3 210 2 926
Total directors’ remuneration
Executive directors 119 109 59 519
Non-executive directors 3 210 2 926
Total directors’ remuneration 122 319 62 445
* The fees paid to Professor Abrahams include an amount of R24 610 (2016: R21 740) for performing the role of chairman of The Clicks Group Employee Share Ownership Trust
** Appointed with effect from 1 March 2017*** Retired with effect from 26 January 2017
32

NOTES TO THE ANNUAL FINANCIAL STATEMENTS (CONTINUED)for the year ended 31 August
Group
2017R’000
2016R’000
5 Other costsOther operating costs include:
Fees paid for outside services
Technical services 22 024 19 035
Loss in financial assets at fair value through profit or loss 1 161 523
Foreign exchange losses – realised 1 996 1 461
Impairment allowances raised/(reversed) – trade receivables (see note 18) 6 518 (86)
Water and electricity 165 304 155 634
Retail 152 562 145 010
Distribution 12 742 10 624
6 Net financing costsRecognised in profit or loss:
Interest income on bank deposits 9 977 5 763
Other interest income 524 492
Financial income 10 501 6 255
Interest expense on financial liabilities measured at amortised cost 47 838 59 106
Cash interest expense 41 591 45 086
Other interest expense 6 247 14 020
Financial expense 47 838 59 106
Net financing cost (37 337) (52 851)
33
Clicks Group Audited Annual Financial Statements 2017
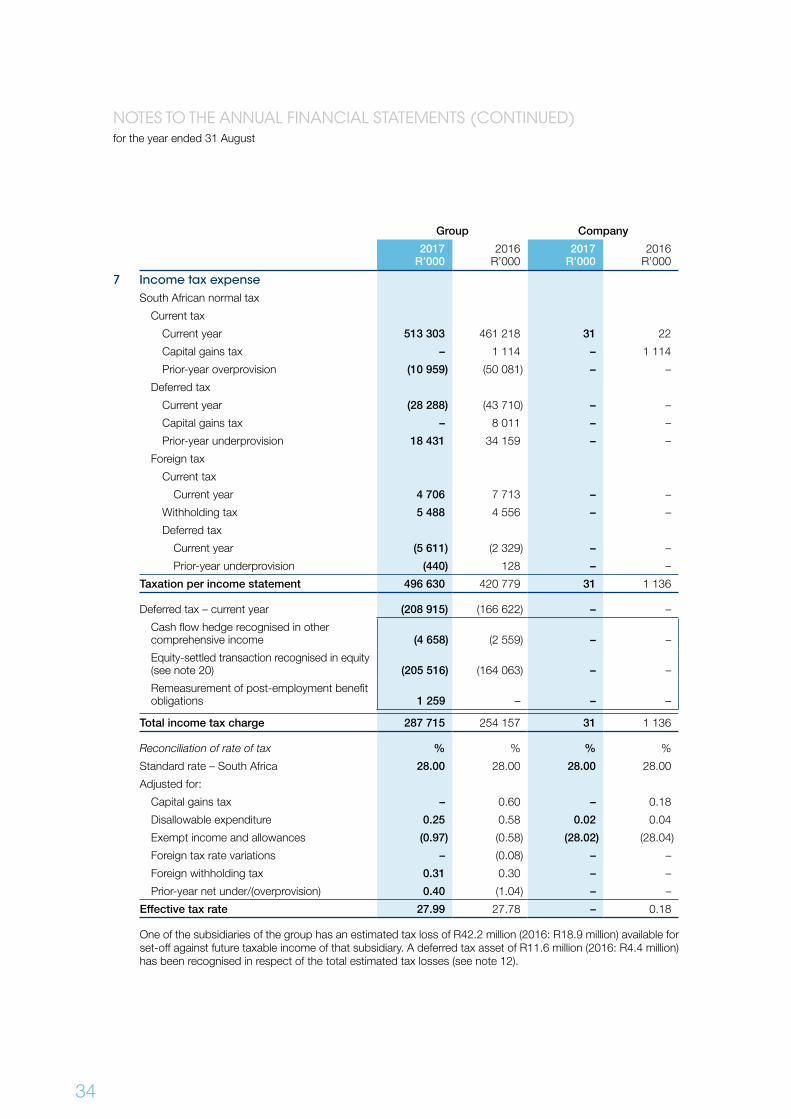
NOTES TO THE ANNUAL FINANCIAL STATEMENTS (CONTINUED)for the year ended 31 August
Group Company
2017R’000
2016R’000
2017R’000
2016R’000
7 Income tax expenseSouth African normal tax
Current tax
Current year 513 303 461 218 31 22
Capital gains tax – 1 114 – 1 114
Prior-year overprovision (10 959) (50 081) – –
Deferred tax
Current year (28 288) (43 710) – –
Capital gains tax – 8 011 – –
Prior-year underprovision 18 431 34 159 – –
Foreign tax
Current tax
Current year 4 706 7 713 – –
Withholding tax 5 488 4 556 – –
Deferred tax
Current year (5 611) (2 329) – –
Prior-year underprovision (440) 128 – –
Taxation per income statement 496 630 420 779 31 1 136
Deferred tax – current year (208 915) (166 622) – –
Cash flow hedge recognised in other comprehensive income (4 658) (2 559) – –
Equity-settled transaction recognised in equity (see note 20) (205 516) (164 063) – –
Remeasurement of post-employment benefit obligations 1 259 – – –
Total income tax charge 287 715 254 157 31 1 136
Reconciliation of rate of tax % % % %
Standard rate – South Africa 28.00 28.00 28.00 28.00
Adjusted for:
Capital gains tax – 0.60 – 0.18
Disallowable expenditure 0.25 0.58 0.02 0.04
Exempt income and allowances (0.97) (0.58) (28.02) (28.04)
Foreign tax rate variations – (0.08) – –
Foreign withholding tax 0.31 0.30 – –
Prior-year net under/(overprovision) 0.40 (1.04) – –
Effective tax rate 27.99 27.78 – 0.18
One of the subsidiaries of the group has an estimated tax loss of R42.2 million (2016: R18.9 million) available for set-off against future taxable income of that subsidiary. A deferred tax asset of R11.6 million (2016: R4.4 million) has been recognised in respect of the total estimated tax losses (see note 12).
34

NOTES TO THE ANNUAL FINANCIAL STATEMENTS (CONTINUED)for the year ended 31 August
Group
2017R’000
2016R’000
8 Earnings per shareThe calculation of basic and headline earnings per share at 31 August 2017 was based on profit for the year attributable to ordinary shareholders of Clicks Group Limited of R1 277.6 million (2016: R1 093.9 million) and headline earnings of R1 268.6 million (2016: R1 098.5 million) divided by the weighted average number of ordinary shares as follows:
Reconciliation of headline earnings
Profit attributable to equity holders of the parent 1 277 642 1 093 872
Adjusted for:
(9 090) 4 599
Loss on disposal of property, plant and equipment 4 868 6 388
Tax on disposal of property, plant and equipment (1 362) (1 789)
Gain on consolidation of the New Clicks Foundation Trust (12 596) –
Headline earnings 1 268 552 1 098 471
2017cents
2016cents
Earnings per share 540.2 460.5
Headline earnings per share 536.3 462.4
Diluted earnings per share 505.7 436.7
Diluted headline earnings per share 502.1 438.5
2017’000
2016’000
Reconciliation of shares in issue to weighted average number of shares in issue
Total number of shares in issue at the beginning of the year 246 138 246 138
Treasury shares held for the full year and/or cancelled (9 612) (6 254)
Treasury shares purchased during the year weighted for the period held – (2 319)
Weighted average number of shares in issue for the year 236 526 237 565
Reconciliation of weighted average number of shares to weighted average diluted number of shares in issue
Weighted average number of shares in issue for the year (net of treasury shares) 236 526 237 565
Dilutive effect of share options (net of treasury shares) 16 115 12 936
Weighted average diluted number of shares in issue for the year 252 641 250 501
35
Clicks Group Audited Annual Financial Statements 2017

NOTES TO THE ANNUAL FINANCIAL STATEMENTS (CONTINUED)for the year ended 31 August
Group2017 2016 2015
CostR’000
Accumulateddepreciation
andimpairment
lossesR’000
CostR’000
Accumulateddepreciation
andimpairment
lossesR’000
CostR’000
Accumulateddepreciation
andimpairment
lossesR’000
9 Property, plant and equipmentLand 25 809 – 25 809 – 25 809 – Buildings 409 525 54 038 398 102 48 402 372 891 46 815 Computer equipment 463 033 290 547 439 496 295 039 367 010 252 768 Equipment 282 149 174 130 269 975 166 331 250 151 145 615 Furniture and fittings 1 812 027 963 570 1 564 466 859 538 1 360 727 725 890 Motor vehicles 46 061 22 384 50 213 33 727 46 296 30 138
3 038 604 1 504 669 2 748 061 1 403 037 2 422 884 1 201 226
All group property is owner-occupied.
The carrying amount of the group’s property, plant and equipment is reconciled as follows:
LandR’000
BuildingsR’000
Computerequipment
R’000Equipment
R’000
Furnitureand fittings
R’000
Motorvehicles
R’000Total
R’000Carrying amount at 1 September 2015 25 809 326 076 114 242 104 536 634 837 16 158 1 221 658 Additions – 25 220 76 954 23 719 237 117 5 171 368 181 Disposals – – (60) (244) (6 324) (363) (6 991)Depreciation – (1 596) (46 679) (24 367) (160 702) (4 480) (237 824)Carrying amount at 31 August 2016 25 809 349 700 144 457 103 644 704 928 16 486 1 345 024 Additions – 11 423 83 587 29 429 318 743 12 785 455 967 Disposals – – (205) (1 552) (4 691) (951) (7 399)Depreciation – (5 636) (55 353) (23 502) (170 523) (4 643) (259 657)Carrying amount at 31 August 2017 25 809 355 487 172 486 108 019 848 457 23 677 1 533 935
36

NOTES TO THE ANNUAL FINANCIAL STATEMENTS (CONTINUED)for the year ended 31 August
Group2017 2016 2015
CostR’000
Accumulatedamortisation
andimpairment
lossesR’000
CostR’000
Accumulatedamortisation
andimpairment
lossesR’000
CostR’000
Accumulatedamortisation
andimpairment
lossesR’000
10 Intangible assetsClicks trademark (see note 10.1) 272 000 – 272 000 - 272 000 –Link trademark 6 000 6 000 6 000 6 000 6 000 6 000 Other trademarks 1 116 581 1 116 469 1 116 357 Capitalised and purchased computer software development 334 974 153 826 332 749 171 313 268 499 145 633 Contractual rights (see note 10.2) 22 015 18 095 17 020 17 020 17 020 17 020
636 105 178 502 628 885 194 802 564 635 169 010
The carrying amount of the group’s intangible assets is reconciled as follows:
Clickstrademark
R’000
Othertrademarks
and contractual
rightsR’000
Capitalisedsoftware
developmentR’000
TotalR’000
Carrying amount at 1 September 2015 272 000 759 122 866 395 625 Additions – – 64 778 64 778 Amortisation – (112) (26 208) (26 320)Carrying amount at 31 August 2016 272 000 647 161 436 434 083 Additions – 4 995 56 888 61 883 Amortisation – (1 187) (36 222) (37 409)Disposals – – (954) (954)Carrying amount at 31 August 2017 272 000 4 455 181 148 457 603
Assessment of impairment of intangible assets 10.1 The Clicks trademark is part of the Clicks cash-generating unit and is considered to have an indefinite useful
life. There is no apparent legal or other restriction to the use of the trademark or risk of technical or other obsolescence. Given the strategic importance of the trademark to the future sustainability of the group, the group’s intention is to continue to use the trademark indefinitely. The directors consider that there is no foreseeable limit to the period over which this asset is expected to generate cash inflows for the group and, on this basis, the directors have concluded that the indefinite useful life assumption is appropriate.
In accordance with the group’s accounting policy, an impairment test was performed on the carrying values of intangible assets with indefinite useful lives at year-end. The recoverable amount was determined based on the value in use.
Budgeted operating cash flows for the related business units were projected and discounted at the group’s weighted average pre-tax cost of capital. The impairment calculations performed indicated that the trademarks were not impaired.
The following key assumptions were made in determining the value in use: (i) A forecast horizon of three years was used. The forecast horizon comprises the three-year plan
drafted in the last quarter of the 2017 financial year, whereafter a perpetuity growth rate of 7.0% (2016: 6.5%) is used.
(ii) The values assigned to the three-year plan revenue and cost growth assumptions reflect current trends, anticipated market developments and management’s experience.
(iii) The key assumptions for the recoverable amount are the long-term growth rate and the discount rate. The long-term growth rate used is purely for the impairment testing of intangible assets under IAS 36 – Impairment of Assets and does not reflect long-term planning assumptions used by the group for investment proposals or for any other assessments.
(iv) A discount rate of 14.0% (2016: 13.5%) per annum, being the group’s pre-tax weighted average cost of capital, was used. The group’s pre-tax weighted average cost of capital is deemed appropriate as, together with the Distribution business, both businesses largely operate within South Africa and are subject to similar market risks.
Management believes that any reasonably possible change in any of these assumptions would not cause the carrying amounts to exceed their recoverable amounts.
10.2 The group acquired the pharmacy business of Amalgamated Pharmacy Group Proprietary Limited in 2010. As part of the acquisition the group acquired the contractual rights to certain medical aid contracts.
These contractual rights have been amortised over five years. During the year the group acquired contractual rights relating to medicine formulas.
37
Clicks Group Audited Annual Financial Statements 2017

NOTES TO THE ANNUAL FINANCIAL STATEMENTS (CONTINUED)for the year ended 31 August
Group2017
R’0002016
R’00011 Goodwill
Goodwill 103 510 103 510Goodwill comprises:United Pharmaceutical Distributors Proprietary Limited (“UPD”) (see note 11.1). 96 277 96 277 Kalahari Medical Distributors Proprietary Limited (“Kalahari”) (see note 11.2). 704 704 Amalgamated Pharmacy Group Proprietary Limited (“Amalgamated Pharmacy Group”) (see note 11.3). 6 529 6 529
Assessment of impairment of goodwill 11.1 Budgeted operating cash flows for the UPD business unit were projected and discounted at the group’s
weighted average pre-tax cost of capital. The impairment calculations performed indicated that the goodwill was not impaired.
The following key assumptions were made in determining the value in use of the UPD cash-generating unit:
(i) A forecast horizon of three years was used. The forecast horizon comprises the three-year plan drafted in the last quarter of the 2017 financial year, whereafter a perpetuity growth rate of 6.5% (2016: 6.5%) is used.
(ii) The values assigned to the three-year plan revenue and cost growth assumptions reflect current trends, anticipated market developments and management’s experience.
(iii) The key assumptions for the recoverable amount are the long-term growth rate and the discount rate. The long-term growth rate used is purely for the impairment testing of goodwill under IAS 36 – Impairment of Assets and does not reflect long-term planning assumptions used by the group for investment proposals or for any other assessments.
(iv) A discount rate of 14.0% (2016: 13.5%) per annum, being the group’s pre-tax weighted average cost of capital, was used. The group’s pre-tax weighted average cost of capital is deemed appropriate as, together with the Clicks business, both businesses largely operate within South Africa and are subject to similar market risks.
Management believes that any reasonably possible change in any of these assumptions would not cause the carrying amounts to exceed their recoverable amounts.
11.2 The same assumptions were applied to Kalahari as this company is in the same business as UPD and accordingly none of the assumptions would change significantly. The fact that Kalahari operates out of Botswana was considered, but this is also not expected to change the assumptions. The goodwill relating to Kalahari has been attributed to the UPD business as a cash-generating unit.
11.3 Due to the synergies that arose on acquisition, the goodwill relating to the purchase of the pharmacy business from Amalgamated Pharmacy Group has been attributed to the Clicks business as a cash-generating unit, which represents the lowest level within the group at which the goodwill is monitored for internal management purposes.
Applying IAS 36, goodwill relating to the above acquisition has been tested for impairment at the same level as the Clicks business unit.
Budgeted operating cash flows for the related business units were projected and discounted at the group’s weighted average pre-tax cost of capital. The impairment calculations performed indicated that goodwill was not impaired.
The following key assumptions were made in determining the value in use:
(i) A forecast horizon of three years was used. The forecast horizon comprises the three-year plan drafted in the last quarter of the 2017 financial year, whereafter a perpetuity growth rate of 7.0% (2016: 6.5%) is used.
(ii) The values assigned to the three-year plan revenue and cost growth assumptions reflect current trends, anticipated market developments and management’s experience.
38

NOTES TO THE ANNUAL FINANCIAL STATEMENTS (CONTINUED)for the year ended 31 August
11. Goodwill (continued) Assessment of impairment of goodwill (continued) (iii) The key assumptions for the recoverable amount are the long-term growth rate and the discount rate.
The long-term growth rate used is purely for the impairment testing of goodwill under IAS 36 – Impairment of Assets and does not reflect long-term planning assumptions used by the group for investment proposals or for any other assessments.
(iv) A discount rate of 14.0% (2016: 13.5%) per annum, being the group’s pre-tax weighted average cost of capital, was used. The group’s pre-tax weighted average cost of capital is deemed appropriate as, together with the Clicks business, both businesses largely operate within South Africa and are subject to similar market risks.
Management believes that any reasonably possible change in any of these assumptions would not cause the carrying amounts to exceed their recoverable amounts.
The tests performed on all cash-generating units did not indicate any impairment as at year-end.
Group Company2017
R’0002016
R’0002017
R’0002016
R’00012 Deferred tax assets/(liabilities)
Deferred tax assets 572 223 347 400 – – 572 223 347 400 – –
Balance at the beginning of the year 347 400 177 037 – – Current deferred tax credit to profit or loss (see note 7) 15 908 3 741 – – Current deferred tax credit to other comprehensive income or equity (see note 7) 208 915 166 622 – – Balance at the end of the year 572 223 347 400 – –
Arising as a result of:Capital gains tax (48 110) (48 110) – – Derivative financial assets and liabilities (106 893) (67 009) – – Employee obligations 718 112 457 544 – – Income and expense accrual 125 767 113 903 – – Inventory 30 628 28 080 – – Onerous leases 1 940 1 943 – – Operating lease liability 54 471 53 478 – – Prepayments (19 225) (18 585) – – Property, plant and equipment (112 696) (94 777) – – Tax losses 11 665 4 369 – – Trademarks (76 172) (76 172) – – Other (7 264) (7 264) – –
Balance at the end of the year 572 223 347 400 – –
The capital gains deferred tax liability arises on the revaluation of a forward purchase of shares by the company in a subsidiary company.
Derivative financial assets and liabilities include a credit of R4.7 million (2016: R2.6 million liability) recognised in other comprehensive income (see note 21). Employee obligations includes an asset of R471.7 million (2016: R266.1 million) recognised in equity (see note 20).
In respect of the deferred tax asset recognised by one (2016: one) subsidiary company, the directors consider that sufficient future taxable income will be generated by that subsidiary company to utilise the deferred tax assets recognised.
39
Clicks Group Audited Annual Financial Statements 2017

NOTES TO THE ANNUAL FINANCIAL STATEMENTS (CONTINUED)for the year ended 31 August
13 Investment in an associateThe group acquired a strategic 25% interest in Sorbet Brands Proprietary Limited (“Sorbet Brands”) on 1 September 2015. R15 million was paid on signing of the contract with two contingent payments of R2.5 million each, paid during 2016 and 2017 respectively, on achievement of turnover targets.
Refer to note 27 detailing this contingent liability. Sorbet Brands holds all the trademark rights of the Sorbet brand in South Africa.
The group’s interest in Sorbet Brands is accounted for using the equity method in the consolidated financial statements.
The following amounts represent the assets and liabilities, income and expenses of the associate:
Group
2017R’000
2016R’000
Assets
Non-current assets 80 000 80 000
Current assets 2 744 5 656
Liabilities
Current liabilities 2 146 3 123
Equity 80 598 82 533
Group’s carrying amount of the investment 20 039 20 282
Summarised Statement of comprehensive income
Income 16 490 12 755
Expenses (380) (236)
Profit before taxation 16 110 12 519
Income tax expense (4 511) (3 505)
Profit for the year 11 599 9 014
Total comprehensive income for the year 11 599 9 014
Group’s proportionate share of profit for the year 2 900 2 254
Dividends received from associate 3 143 1 638
Group2017
R’0002016
R’00014 Loans receivable
New Clicks Foundation Trust (see note 14.1) – 5 021 Sign and Seal Trading 205 Proprietary Limited (“Style Studio”) (see note 14.3) 4 500 4 500 Non-current loans receivable 4 500 9 521
Triton Pharmacare Capital Investments Proprietary Limited (“Triton”) (see note 14.2) 9 000 8 476Current loans receivable 9 000 8 476Total loans receivable 13 500 17 997
14.1 The loan to New Clicks Foundation Trust is unsecured, interest free and no fixed date for repayment has been determined. During the current year New Clicks Foundation Trust was consolidated in accordance with IFRS 10 – Consolidated Financial Statements. Subsequently, the loan became an intergroup loan which was eliminated on consolidation.
14.2 The loan to Triton is interest free, carried at amortised cost and is repayable on demand.
A second mortgage bond over property purchased by Triton and a special notarial bond over movable assets serve as security for the loan.
14.3 The loan to Style Studio is unsecured, interest free and repayable within 10 business days of demand.
40

NOTES TO THE ANNUAL FINANCIAL STATEMENTS (CONTINUED)for the year ended 31 August
Group2017
R’0002016
R’00015 Financial assets at fair value through profit or loss
Investment in Guardrisk Insurance Company Limited (Cell number 171) (see note 15.1)
11 279 16 145
Listed equity instruments (see note 15.2) 10 941 –Collective investment schemes (see note 15.2) 3 896 –Listed preference shares (see note 15.2) 1 464 –Total financial assets at fair value through profit or loss 27 580 16 145
15.1 The investment in Guardrisk Insurance Company Limited is the net investment in the group’s insurance cell captive which is not deemed to be in the group’s control in accordance with IFRS 10 – Consolidated Financial Statements.
15.2 In the current year New Clicks Foundation Trust has been consolidated in the group in accordance with IFRS 10. The trust invests in various financial assets comprising listed equity instruments, collective investment schemes and listed preference shares.
Group2017 2016
AssetsR’000
LiabilitiesR’000
AssetsR’000
LiabilitiesR’000
16 Derivative financial instrumentsEquity derivative hedge – non-current 134 891 – 231 242 – Equity derivative hedge – current 190 848 – – – Forward exchange contracts – current – (9 142) – (26 971)
All derivatives noted above are classified as held for trading and measured at fair value through profit or loss.
Equity derivative hedge European call options have been purchased to hedge the cash-settled share-based payment obligation relating to
tranches 9, 10 and 11 of the total shareholder return long-term incentive scheme (refer to note 23.1). The expiration date of these hedging instruments and the vesting dates of the hedged items coincide on 31 August 2017, 2018 and 2019 respectively.
Refer to note 21 detailing the equity derivative hedges’ impact on profit and loss and other comprehensive income.
The fair value of these equity derivative hedges are calculated using a Monte Carlo option pricing model with reference to the closing share price, 250-day historical volatility, the 12-month trailing dividend yield and the risk-free rate.
Forward exchange contracts For currency derivatives, fair values are calculated using standard market calculation conventions with reference
to the relevant closing market spot rates, forward foreign exchange and interest rates. The notional principal amounts of the outstanding forward foreign exchange contracts at 31 August 2017 was R623.5 million (2016: R493.1 million). Refer to note 21 detailing the foreign exchange hedging impact on profit or loss and other comprehensive income.
41
Clicks Group Audited Annual Financial Statements 2017

NOTES TO THE ANNUAL FINANCIAL STATEMENTS (CONTINUED)for the year ended 31 August
Group
2017R’000
2016R’000
17 InventoriesInventories comprise:
Goods for resale 3 636 496 3 375 540
Goods in transit 117 298 103 177
3 753 794 3 478 717
Inventories stated at net realisable value 40 685 62 781
The value of inventories stated at net realisable value is determined based on management’s best estimate of the likely selling price at which the inventories in question could be sold in the ordinary course of business less the directly attributable selling costs.
Group
2017R’000
2016R’000
18 Trade and other receivablesTrade and other receivables comprise:
Trade receivables 1 732 032 1 643 043
Less: impairment of trade receivables (30 599) (24 081)
Trade receivables – net 1 701 433 1 618 962
Prepayments 101 281 91 755
Income accruals 177 972 160 278
Logistics fees receivable 223 251 118 725
Other (refer to note 18.1) 8 782 22 976
2 212 719 2 012 696
The carrying amount of trade and other receivables approximates their fair value. Trade and other receivables are predominantly non-interest bearing. Refer to note 30.4 for the credit risk management of trade and other receivables.
The movement in the doubtful debt provision in respect of trade receivables during the year was as follows:
Group
2017R’000
2016R’000
Balance at 1 September 24 081 28 678
Impairment provision raised/(reversed) 6 518 (86)
Impairment loss utilised – (4 511)
Balance at 31 August 30 599 24 081
18.1 Other receivables consist of staff loans and sundry customer receivables.
42
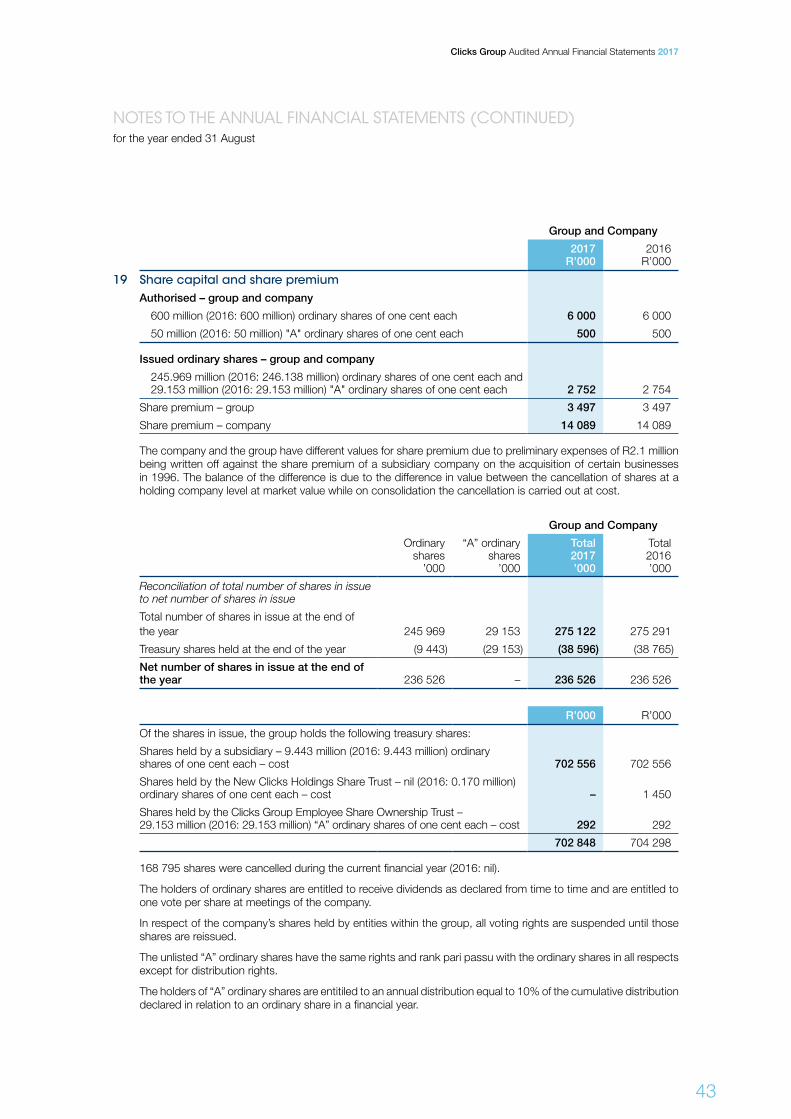
NOTES TO THE ANNUAL FINANCIAL STATEMENTS (CONTINUED)for the year ended 31 August
Group and Company
2017R’000
2016R’000
19 Share capital and share premiumAuthorised – group and company
600 million (2016: 600 million) ordinary shares of one cent each 6 000 6 000
50 million (2016: 50 million) "A" ordinary shares of one cent each 500 500
Issued ordinary shares – group and company
245.969 million (2016: 246.138 million) ordinary shares of one cent each and 29.153 million (2016: 29.153 million) "A" ordinary shares of one cent each 2 752 2 754
Share premium – group 3 497 3 497
Share premium – company 14 089 14 089
The company and the group have different values for share premium due to preliminary expenses of R2.1 million being written off against the share premium of a subsidiary company on the acquisition of certain businesses in 1996. The balance of the difference is due to the difference in value between the cancellation of shares at a holding company level at market value while on consolidation the cancellation is carried out at cost.
Group and Company
Ordinary shares
’000
“A” ordinary shares
’000
Total2017’000
Total2016’000
Reconciliation of total number of shares in issue to net number of shares in issue
Total number of shares in issue at the end of the year 245 969 29 153 275 122 275 291
Treasury shares held at the end of the year (9 443) (29 153) (38 596) (38 765)
Net number of shares in issue at the end of the year 236 526 – 236 526 236 526
R’000 R’000
Of the shares in issue, the group holds the following treasury shares:
Shares held by a subsidiary – 9.443 million (2016: 9.443 million) ordinary shares of one cent each – cost 702 556 702 556
Shares held by the New Clicks Holdings Share Trust – nil (2016: 0.170 million) ordinary shares of one cent each – cost – 1 450
Shares held by the Clicks Group Employee Share Ownership Trust – 29.153 million (2016: 29.153 million) “A” ordinary shares of one cent each – cost 292 292
702 848 704 298
168 795 shares were cancelled during the current financial year (2016: nil).
The holders of ordinary shares are entitled to receive dividends as declared from time to time and are entitled to one vote per share at meetings of the company.
In respect of the company’s shares held by entities within the group, all voting rights are suspended until those shares are reissued.
The unlisted “A” ordinary shares have the same rights and rank pari passu with the ordinary shares in all respects except for distribution rights.
The holders of “A” ordinary shares are entitiled to an annual distribution equal to 10% of the cumulative distribution declared in relation to an ordinary share in a financial year.
43
Clicks Group Audited Annual Financial Statements 2017

NOTES TO THE ANNUAL FINANCIAL STATEMENTS (CONTINUED)for the year ended 31 August
20 Share option reserveEquity-settled share-based paymentOptions issued in terms of the Employee Share Ownership Programme (“ESOP”)In October 2010 Clicks Group Limited announced an employee share ownership programme.
In terms of the Clicks Group Employee Ownership Trust deed the group issued unlisted “A” ordinary shares (“A” shares) equating to 10% of the issued share capital of the group, net of treasury shares.
Upon vesting options are converted into Clicks Group ordinary shares, 50% in February 2018 and 50% in February 2019, after the repayment of the notional debt.
Group
Number of shares
2017
Number of shares
2016
“A” shares issued in terms of the ESOP 29 153 295 29 153 295
Details of share option allocations
Grant date Option
price
Balance at the
beginningof the year
Grantedduring
the year
Deliveredduring
the year
Forfeitedduring
the year
Balance atthe end of
the year
2017
February 2011 R41.54 13 031 548 – – (174 241) 12 857 307
February 2012 R41.11 2 186 475 – – (269 146) 1 917 329
February 2013 R60.00 3 736 083 – – (651 922) 3 084 161
February 2014 R56.78 2 526 052 – – (404 620) 2 121 432
February 2015 R90.32 2 337 431 – – (246 037) 2 091 394
February 2016 R86.75 385 383 – – (49 285) 336 098
February 2017 R120.29 – 209 163 – – 209 163
Unallocated share options 6 536 411
29 153 295
2016
February 2011 R41.54 14 040 004 – – (1 008 456) 13 031 548
February 2012 R41.11 2 350 520 – – (164 045) 2 186 475
February 2013 R60.00 4 108 925 – – (372 842) 3 736 083
February 2014 R56.78 2 934 104 – – (408 052) 2 526 052
February 2015 R90.32 2 822 693 – – (485 262) 2 337 431
February 2016 R86.75 – 385 383 – – 385 383
Unallocated share options 4 950 323
29 153 295
44

NOTES TO THE ANNUAL FINANCIAL STATEMENTS (CONTINUED)for the year ended 31 August
20 Share option reserve (continued)Fair value of share-based payments in respect of optionsOptions granted have been valued using the Monte Carlo option pricing model by an independent, external valuator. The fair value of the options determined at the grant date is amortised over the vesting period to the extent that the options are ultimately exercised or are expected to be exercised.
The assumptions used in estimating the fair values at grant date are listed below:
Share price at
grant date
Risk-free rate (%)
Expecteddividend
yield (%)
Expectedvolatility
(%)
Expectedforfeiture
rate (%)
February 2011 – seven-year vesting period R41.54 8.45 3.89 24.56 15.33 February 2011 – eight-year vesting period R41.54 8.60 4.11 24.56 15.33 February 2012 – six-year vesting period R41.11 7.38 2.80 27.00 14.20 February 2012 – seven-year vesting period R41.11 7.38 2.80 27.00 14.20 February 2013 – five-year vesting period R60.00 7.17 2.70 24.00 14.20 February 2013 – six-year vesting period R60.00 7.17 2.70 24.00 14.20 February 2014 – four-year vesting period R56.78 8.55 2.50 23.00 11.00 February 2014 – five-year vesting period R56.78 8.55 2.50 23.00 11.00 February 2015 – three-year vesting period R90.32 6.46 2.40 23.00 11.00 February 2015 – four-year vesting period R90.32 6.46 2.40 23.00 11.00 February 2016 – two-year vesting period R86.75 7.85 2.00 25.00 10.00 February 2016 – three-year vesting period R86.75 7.85 2.00 25.00 10.00 February 2017 – one-year vesting period R120.29 7.36 2.00 24.00 9.00 February 2017 – two-year vesting period R120.29 7.36 2.00 24.00 9.00
The risk-free rate is derived from the Swap BD curve published by the Bond Exchange of South Africa.
The dividend yield is the historical five-year average dividend yield as of the grant date, which has been converted to a continuously compounded dividend yield.
The expected volatility is the historic annualised standard deviation of the continuously compounded rates of return on the share, based on the most recent period as of the grant date that is commensurate with the expected term of the share option.
The expected exercise rate is based on the historic trend of option forfeitures and excludes options already exercised. The options already exercised are reflected in the share option reserve in addition to the value of options that are expected to be exercised based on the expected exercise rate.
The share option reserve recognises the cost at the fair value of the options on the date issued to employees, accrued over the vesting period.
Group
2017R’000
2016R’000
Share option reserve
Balance at the beginning of the year 483 188 254 592
264 425 228 596
Equity-settled share-based payment expense 58 909 64 533
Deferred tax recorded directly in equity arising on consolidation 205 516 164 063
Balance at the end of the year 747 613 483 188
275 959 217 050
Equity-settled share-based payment expense in opening retained earnings 217 050 152 517
Equity-settled share-based payment expense 58 909 64 533
Deferred tax recorded directly in equity arising on consolidation 471 654 266 138
Estimate of options not yet vested but expected to vest 747 613 483 188
45
Clicks Group Audited Annual Financial Statements 2017

NOTES TO THE ANNUAL FINANCIAL STATEMENTS (CONTINUED)for the year ended 31 August
Group
2017R’000
2016R’000
21 Cash flow hedge reserveThe cash flow hedge reserve represents the effective portion of fair value gains or losses in respect of cash flow hedges.
Reconciliation of cash flow hedging reserve
Balance at the beginning of the year 28 616 35 196
Movement in cash flow hedge (17 892) (9 139)
Movement in cash flow hedge relating to forward exchange contracts 22 145 (49 196)
Movement in cash flow hedge relating to the equity derivative hedge (40 037) 40 057
Deferred tax recognised in other comprehensive income 4 658 2 559
Balance at the end of the year 15 382 28 616
The cash flow hedge reserve represents the cumulative portion of gains or losses on hedging instruments deemed effective in cash flow hedges. The cumulative deferred gain or loss on the hedging instrument is reclassified to profit or loss only when the hedged transaction affects profit or loss. During the year there was a mark-to-market gain of R48.3 million (2016: R119.3 million) and a net gain of R66.2 million was recycled to profit or loss (2016: R128.4 million). R57.6 million loss (2016: R63 million gain) of the amount recycled is included in cost of merchandise sold and R123.8 million gain (2016: R65.4 million gain) is included under employment costs. R2.2 million gain (2016: R49.2 million loss) will be recycled to profit or loss in 2018 relating to forward exchange contracts and R19.1 million gain (2016: R40.1 million gain) will be recycled to profit or loss as and when the related employment costs affect profit or loss relating to the equity derivative hedge.
Refer to note 16 – Derivative financial instruments for further information.
Group
2017R’000
2016R’000
22 Foreign currency translation reserveUnrealised gain on the translation of assets and liabilities of subsidiaries whose financial statements are denominated in foreign currencies (756) 5 805
(756) 5 805
Reconciliation of foreign currency translation reserve
Balance at the beginning of the year 5 805 6 331
Exchange differences on translation of foreign subsidiaries (6 561) (526)
Balance at the end of the year (756) 5 805
46

NOTES TO THE ANNUAL FINANCIAL STATEMENTS (CONTINUED)for the year ended 31 August
Group
2017R’000
2016R’000
23 Employee benefitsLong-term incentive schemes 150 628 156 488
Post-retirement medical obligations 58 603 58 644
Total long-term employee benefits 209 231 215 132
Accounted for as follows:
Long-term employee benefits recognised in terms of IFRS 2 – Share-based Payments (see note 23.1) 98 567 116 947
Long-term employee benefits recognised in terms of IAS 19 – Employee Benefits (see note 23.2) 110 664 98 185
Total long-term employee benefits 209 231 215 132
Long-term employee benefits recognised in terms of IFRS 2 – Share-based Payments
Long-term cash-settled share-based payment liability
Long-termincentive
scheme – TSR(note 23.1)
R’000
Balance at 1 September 2015 22 851
Expense from cash-settled share-based payment 96 119
Early settlement (2 023)
Balance at 31 August 2016 116 947
Expense from cash-settled share-based payment 149 020
Early settlement (1 751)
Reclassification to short-term benefits (165 649)
Balance at 31 August 2017 98 567
47
Clicks Group Audited Annual Financial Statements 2017

NOTES TO THE ANNUAL FINANCIAL STATEMENTS (CONTINUED)for the year ended 31 August
23 Employee benefits (continued)23.1 Long-term incentive scheme – total shareholder return (“TSR”)
During 2017 the group issued 0.9 million (2016: 1.1 million) cash-settled appreciation rights to management. The value of these appreciation rights are linked to the TSR (capital gain plus dividends) over a three-year vesting period. These appreciation rights are classified as cash-settled share-based payment benefits and the liability has been valued using the Monte Carlo option pricing model by an independent, external valuator.
The September 2014 options outstanding at year-end are due for settlement.
The contractual life of the September 2015 options outstanding at year-end was one year.
The contractual life of the September 2016 options outstanding at year-end was two years.
Details of share option allocations – 2017
Option price
Balance at the
beginningof the year
Grantedduring
the year
Deliveredduring
the year
Forfeitedduring
the year
Balance atthe end of
the year
September 2014 options R159.52 1 225 514 – – (49 657) 1 175 857
September 2015 options R114.72 1 012 390 – – (48 370) 964 020
September 2016 options R53.51 – 861 807 – (40 537) 821 270
The assumptions used in estimating the fair value at year-end is listed below:
Share price at
grant date
Risk-free rate
(%)
Expecteddividend
yield (%)
Expectedvolatility
(%)
Expectedforfeiture
rate (%)
September 2014 options – three-year vesting period R66.34 6.75 1.92 20.10 4.00
September 2015 options – three-year vesting period R93.82 6.75 1.92 20.10 4.00
September 2016 options – three-year vesting period R126.03 6.75 1.92 20.10 4.00
Details of share option allocations – 2016
Option price
Balance at the
beginningof the year
Grantedduring
the year
Deliveredduring
the year
Forfeitedduring
the year
Balance atthe end of
the year
September 2014 options R120.56 1 300 507 – – (74 993) 1 225 514
September 2015 options R77.07 – 1 090 359 – (77 969) 1 012 390
The assumptions used in estimating the fair value at year-end is listed below:
Share price at
grant date
Risk-free rate
(%)
Expecteddividend
yield (%)
Expectedvolatility
(%)
Expectedforfeiture
rate (%)
September 2014 options – three-year vesting period R66.34 7.65 2.07 33.20 4.00
September 2015 options – three-year vesting period R93.82 7.65 2.07 33.20 4.00
The risk-free rate is derived from the zero coupon curve published by the Bond Exchange of South Africa.
The dividend yield is the twelve-month trailing yield (nominal annual and compounded annuity).
The implied volatility is the 250-day historic volatility of the share price.
The expected exercise rate is based on the historic trend of option forfeitures and excludes options already exercised or forfeited.
48

NOTES TO THE ANNUAL FINANCIAL STATEMENTS (CONTINUED)for the year ended 31 August
23 Employee benefits (continued)23.2 Long-term employee benefits recognised in terms of IAS 19 – Employee Benefits
Long-term employee benefits
Long-termincentive
scheme – HEPS
(note 23.3)R’000
Post-retirement
medicalobligations(note 23.4)
R’000Total
R’000
Balance at 1 September 2015 51 281 53 903 105 184
Current service cost 48 088 1 473 49 561
Benefit payments (2 139) (1 377) (3 516)
Interest cost 7 265 4 645 11 910
Actuarial loss recognised in profit or loss 3 975 – 3 975
Reclassification to short-term employee benefits (68 929) – (68 929)
Balance at 31 August 2016 39 541 58 644 98 185
Current service cost 49 733 1 074 50 807
Benefit payments (516) (1 170) (1 686)
Interest cost 6 710 4 550 11 260
Actuarial gain recognised in profit or loss (620) – (620)
Actuarial gain recognised in other comprehensive income – (4 495) (4 495)
Reclassification to short-term employee benefits (42 787) – (42 787)
Balance at 31 August 2017 52 061 58 603 110 664
23.3 Long-term incentive scheme – headline earnings per share (“HEPS”) During 2017 the group issued 2.1 million (2016: 2.2 million) cash-settled appreciation rights to
management. The value of these appreciation rights are linked to the performance of diluted HEPS over a three-year period. The amount to be provided in the current year is based on a three-year projection of diluted HEPS.
Any difference between projected performance and actual performance is recognised through an actuarial (gain)/loss based on the projected unit credit method which is taken to profit or loss.
The exercise price of each appreciation right was determined as R52.62 (2016: R46.07) per right (“base value”). In order to determine the amount to be provided a fixed factor of 12 is applied to the HEPS at the end of the three-year period. The differential between the factor multiplied by HEPS and the base value is the amount that will be paid out per right.
Should employees leave during the vesting period the rights will be forfeited.
49
Clicks Group Audited Annual Financial Statements 2017

NOTES TO THE ANNUAL FINANCIAL STATEMENTS (CONTINUED)for the year ended 31 August
23 Employee benefits (continued) 23.4 Post-retirement medical obligations The group subsidises a portion of the medical aid contributions of certain retired employees.
An actuarial valuation of the Clicks post-retirement medical aid scheme has determined that the unfunded liability in respect of pensioner post-retirement medical benefits amounts to R58.6 million (2015: R53.9 million). Provision has been made for the full unfunded liability.
The principal actuarial assumptions at the last valuation date (31 August 2017) are:
(i) a discount rate of 8.7% per annum;
(ii) general increases to medical aid contributions of 7.2%;
(iii) a retirement age of 65;
(iv) husbands are on average four years older than their spouses;
(v) mortality of pensioners determined in accordance with PA90 ultimate tables; and
(vi) mortality of in-service members determined in accordance with SA 85-90 ultimate table.
The post-retirement medical aid provision is sensitive to assumptions around medical aid inflation, discount rate, retirement age and life expectancy. A change in any of these factors would have a significant impact on the amount to be provided (expense/(credit) to other comprehensive income):
2017R’000
2016R’000
– Medical aid inflation increases by 1% per annum over assumptions made 10 163 7 400
– Medical aid inflation decreases by 1% per annum over assumptions made (8 258) (5 102)
– Discount rate increases by 1% per annum over assumptions made (7 990) (5 593)
– Discount rate decreases by 1% per annum over assumptions made 9 975 6 728
– Retirement age decreases by two years 6 920 6 875
– Life expectancy of male pensioners increases by one year 1 171 972
– Life expectancy of male pensioners decreases by one year (1 176) (995)
– Life expectancy of female pensioners increases by one year 1 349 1 333
– Life expectancy of female pensioners decreases by one year (1 332) (1 350)
The following undiscounted payments are expected contributions in future years from post-retirement medical obligations.
Within 12 months 1 800 1 458
Between 2 and 5 years 9 330 7 679
Between 5 and 10 years 18 397 16 311
Between 10 and 20 years 89 631 90 500
Between 20 and 30 years 159 301 183 088
Between 30 and 40 years 148 732 188 023
Beyond 40 years 98 278 134 813
Total expected payments 525 469 621 872
The average duration of the post-retirement medical obligations at year-end is 19.2 years (2016: 21.9 years).
50

NOTES TO THE ANNUAL FINANCIAL STATEMENTS (CONTINUED)for the year ended 31 August
23 Employee benefits (continued)23.4 Post-retirement medical obligations (continued)
Amounts for the current and previous four periods are as follows:
Post-retirement medical obligations
2017R’000
2016R’000
2015R’000
2014R’000
2013R’000
Defined benefit obligation 58 603 58 644 53 903 49 380 45 306
Experience adjustments on plan liabilities – – (1 063) – (1 221)
Short-term employee benefits
Long-termincentive
scheme – TSR
(note 23.1)R’000
Long-termincentive
scheme – HEPS
(note 23.2)R’000
Leave payaccrual
(note 23.5)R’000
Bonusaccrual
(note 23.6)R’000
Overtimeaccrual
(note 23.7)R’000
TotalR’000
Balance at 1 September 2015 – 48 805 56 672 106 997 2 469 214 943
Reclassification from long-term employee benefits – 68 929 – – – 68 929
Benefit payments – (48 798) (12 451) (135 509) (7 243) (204 001)
Charge included in profit or loss – – 17 107 137 245 7 763 162 115
Balance at 31 August 2016 – 68 936 61 328 108 733 2 989 241 986
Reclassification from long-term employee benefits 165 649 42 787 – – – 208 436
Benefit payments – (71 022) (8 316) (143 954) (8 067) (231 359)
Charge included in profit or loss – – 16 480 151 931 6 986 175 397
Balance at 31 August 2017 165 649 40 701 69 492 116 710 1 908 394 460
23.5 The leave pay accrual is based on actual leave days by an employee multiplied by the employee’s current total daily cost to company.
23.6 The bonus accrual includes a guaranteed thirteenth cheque and an incentive bonus based on the business’s or group’s performance. The bonus is provided for all employees who qualify in respect of the expected cash payment.
51
Clicks Group Audited Annual Financial Statements 2017

NOTES TO THE ANNUAL FINANCIAL STATEMENTS (CONTINUED)for the year ended 31 August
23 Employee benefits (continued) 23.7 The overtime accrual is in respect of overtime worked in August 2017 which is paid in September 2017.
Pension and provident funds Three funds, which are registered and governed in terms of the Pension Funds Act, 24 of 1956, are
operated by the group. These funds are:
• the Clicks Group Retirement Fund;
• the Clicks Group Negotiated Pension Fund; and
• the Clicks Group Negotiated Provident Fund.
All permanent full-time staff members in South Africa, Lesotho and Swaziland are obliged to join one of the funds. Employees in Namibia are members of the Namflex Umbrella Pension Fund and those in Botswana are members of the Sentlhaga Pension Fund.
The funds are all defined contribution schemes and the group carries no liability in relation to these funds. All funds provide death and disability cover, while the negotiated funds also include a funeral benefit. Combined membership across the funds was 14 307 (2016: 13 705) at year-end.
Medical aid funds Membership of one of the Horizon Medical Aid Scheme benefit options is actively encouraged and all
existing members of Discovery Health may continue their membership.
At year-end 2 464 (2016: 2 227) South African employees were principal members of a medical aid scheme, of whom 1 817 (2016: 1 552) were principal members with Horizon, 535 (2016: 573) were principal members of a Discovery Health medical aid scheme and 112 (2016: 102) were principal members of various other medical aid schemes.
At year-end six (2016: five) Botswana employees were principal members with BOMaid and one with PULA, 15 (2016: 16) Namibian employees were principal members of Namibia Health Plan and 17 (2016: 16) Swaziland employees were principal members of Swazimed.
At year-end 29.4% (2016: 26.2%) of the permanent full-time employees were members of a medical aid scheme. Increasing the health benefits available to employees will be a focus area for the group in the years ahead.
Employee and company contributions to the above funds are included in employment costs detailed in note 4.
52

NOTES TO THE ANNUAL FINANCIAL STATEMENTS (CONTINUED)for the year ended 31 August
Group
2017R’000
2016R’000
24 Lease commitmentsOperating lease liability 193 026 190 409
Operating leases with fixed escalations are charged to the statement of comprehensive income on a straight-line basis.
The associated liability will reverse during the latter part of each lease term when the actual cash flow exceeds the profit or loss charge.
Operating lease commitmentsThe group leases all its retail premises under operating leases. The lease agreements provide for minimum payments together, in certain instances, with contingent rental payments determined on the basis of achieving a specified turnover threshold.
Future minimum lease payments under non-cancellable operating leases due:
– Not later than one year 714 035 650 493
– Later than one year, not later than five years 4 191 244 3 223 857
– Later than five years 858 545 781 238
5 763 824 4 655 588
Future minimum lease payments receivable under non-cancellable operating leases due, which relate to Intercare Management Healthcare Proprietary Limited:
– Not later than one year 3 183 4 126
– Later than one year, not later than five years 5 779 8 962
8 962 13 088
The net future minimum lease payments under non-cancellable operating leases due:
– Not later than one year 710 852 646 367
– Later than one year, not later than five years 4 185 465 3 214 895
– Later than five years 858 545 781 238
5 754 862 4 642 500
Generally, leases are taken out on five or ten-year lease terms with an option to extend for a further five years in the instance of Clicks while shorter periods are committed to for Musica, The Body Shop, GNC and Claire’s.
53
Clicks Group Audited Annual Financial Statements 2017

NOTES TO THE ANNUAL FINANCIAL STATEMENTS (CONTINUED)for the year ended 31 August
Group
2017R’000
2016R’000
25 Trade and other payablesThe following are included in trade and other payables:Trade payables 4 500 821 4 212 129 Other loyalty programme deferred income (see note 25.1) 97 190 81 765 Non-trade payables and accruals (see note 25.2) 877 171 854 517
5 475 182 5 148 411
25.1 Other loyalty programme deferred incomeThe deferred income relating to points is determined based on the value of unredeemed vouchers in issue, as well as the value of points on qualifying sales that have not been converted into vouchers.
Based on the historic redemption rate, it is assumed that 74% of all points in issue are ultimately redeemed.
Estimates are made based on historic trends regarding the value of points on qualifying sales that will ultimately convert into vouchers issued.
25.2 Non-trade payables and accruals consist of expense and payroll accruals, value-added tax and unredeemed gift cards.
26 ProvisionsProvision for onerous contractsBalance at the beginning of the year 6 939 5 745 Movement in provision during the year recognised in occupancy costs (206) 1 194 Balance at the end of the year 6 733 6 939
Current 6 733 6 939 Non-current – –
6 733 6 939
Onerous contracts are identified where the present value of future obligations in terms of the contracts in question exceeds the estimated benefits accruing to the group from the contracts.
The provision relates to certain leases where the site is either vacant or the commercial activity on the site is incurring losses.
Future cash flows are determined in accordance with the contractual lease obligations and are adjusted by market-related sub-let rentals and discounted at the group’s risk-adjusted pre-tax weighted average cost of capital rate.
The provision is further reduced to the extent that a straight-line operating lease accrual has already been recognised (see note 24).
27 Financial liability at fair value through profit or lossContingent consideration arising from investment in associate – 2 331 Total financial liabilities at fair value through profit or loss – 2 331
The group acquired a 25% interest in Sorbet Brands Proprietary Limited in the prior year for a purchase price of R15.0 million on signing of the contract and settled two contingent payments of R2.5 million each during the prior year and current year respectively.
54

NOTES TO THE ANNUAL FINANCIAL STATEMENTS (CONTINUED)for the year ended 31 August
Group
2017R’000
2016R’000
28 Dividends to shareholdersPrevious year final cash dividend out of distributable reserves – 196 cents per share paid 30 January 2017 (2016: 169.5 cents per share paid 25 January 2016 out of distributable reserves) 482 430 417 204
Current year interim cash dividend out of distributable reserves – 88 cents per share paid 3 July 2017 (2016: 76 cents per share paid 4 July 2016 out of distributable reserves) 216 452 187 064
“A” shares – Previous year final cash dividend out of distributable reserves – 27.2 cents per share paid 30 January 2017 (2016: 23.5 cents per share paid 25 January 2016) 7 930 6 851
Total dividends to shareholders 706 812 611 119
Dividends on treasury shares (28 507) (24 780)
Dividends on “A” shares held in trust (906) (582)
Dividends paid outside the group 677 399 585 757
On 24 October 2017 the directors approved the final proposed dividend of 234 cents per share and 32.2 cents per “A” share.
The source of such a dividend will be from distributable reserves and paid in cash and will be recognised in the statement of changes in equity in 2018.
Dividend policy The dividend payout ratio is 60%.
For further details refer to the directors’ report on page 2.
29 Financial risk management The group’s activities expose it to a variety of financial risks: market risk (including currency risk, price risk, interest
rate risk), credit risk and liquidity risk.
This note presents information about the group’s exposure to each of the above risks, the group’s objectives, policies and processes for measuring and managing risk, and the management of capital. Further quantitative disclosures are included throughout these consolidated financial statements.
The group’s overall risk management programme focuses on the unpredictability of financial markets and seeks to minimise potential adverse effects on the group’s financial performance. The group uses derivative financial instruments to hedge certain risk exposures.
The group treasury functions within the parameters of the treasury policy and reports to a sub-committee of management.
Market risk Market risk is the risk that changes in market prices, such as foreign exchange rates, interest rates and equity
prices will affect the group’s income or the value of its holdings of financial instruments.
The objective of market risk management is to manage and control market risk exposures within acceptable parameters, while optimising the return on risk.
The group buys derivatives to hedge economic exposures in the ordinary course of business to manage certain market risks.
55
Clicks Group Audited Annual Financial Statements 2017

NOTES TO THE ANNUAL FINANCIAL STATEMENTS (CONTINUED)for the year ended 31 August
29 Financial risk management (continued) Currency risk The group is exposed to foreign exchange risk through its imports of merchandise. The currencies in which these
transactions are primarily denominated are USD, EUR, GBP and CNY. The group’s treasury risk management policy is to take out forward exchange contracts to cover both committed and anticipated exposures.
The impact of a 10% strengthening or weakening of the currency against the USD, EUR, GBP and CNY with all other variables held constant is disclosed in note 30.2. The effect of this movement is based on the outstanding forward foreign exchange contracts held by the group at year-end.
Interest rate risk As the group has no significant interest-bearing assets, the group’s income and operating cash flows are
substantially independent of changes in market interest rates.
The group’s interest rate risk arises from short-term borrowings. Borrowings issued at variable rates expose the group to cash flow interest rate risk. Borrowings issued at fixed rates expose the group to fair value interest rate risk. During 2016 and 2017 the group’s borrowings at variable rates were denominated in Rands.
There were no material interest rate sensitivities at year-end.
Price risk The group’s exposure to other price risk relates to fluctuations in the share price of the company as a result of
the options that have been granted to employees in terms of the long-term incentive scheme (refer to note 23.1). The group uses derivative financial instruments in the form of options to hedge exposure in respect of fluctuations in the share scheme obligation arising from movements in the company’s share price. Sufficient options were purchased in order to settle the total expected future obligation. As a result of the hedging relationship, movements in the company share price will not have a material impact on either profit or loss or equity of the group.
Credit risk Credit risk is the risk of financial loss to the group if a customer or counterparty to a financial instrument fails
to meet its contractual obligations and arises primarily from the group’s receivables. Credit risk is managed on a group basis. Credit risk arises from cash and cash equivalents, derivative financial instruments and deposits with banks and financial institutions, as well as credit exposures to Distribution and Retail customers, including outstanding receivables and committed transactions.
Trade and other receivables The group’s exposure to credit risk is influenced mainly by the individual characteristics of each customer.
In relation to the Retail business, trade receivables primarily relate to recoverables from vendors with which the group has a trading relationship and medical aids with respect to pharmacy recoverables, while in Distribution, customers (excluding intercompany) are primarily hospitals and independent pharmacists.
In relation to the Distribution business, the risk management has been delegated to the management of the subsidiary business.
Management has a credit policy in place and the exposure to credit risk is monitored on an ongoing basis. Credit evaluations are performed on all customers.
Credit Guarantee Insurance Corporation of Africa Limited is utilised to cover the majority of wholesale customers with a credit balance over a predetermined amount.
Goods are sold subject to retention of title clauses in Distribution so that in the event of non-payment the group may have a secured claim.
The group establishes an allowance for impairment that represents its estimate of incurred losses in respect of trade and other receivables.
The main components of this allowance are specific loss components that relate to individually significant exposures and a collective loss component established for groups of similar assets in respect of losses that have been incurred but not yet identified.
The collective loss allowance is determined based on historical data of payment statistics of similar financial assets.
56

NOTES TO THE ANNUAL FINANCIAL STATEMENTS (CONTINUED)for the year ended 31 August
29 Financial risk management (continued) Liquidity risk Liquidity risk is the risk that the group will not be able to meet its financial obligations as they fall due.
The group’s approach is to ensure, as far as possible, that it will always have sufficient liquidity to meet its liabilities when due, under both normal and stressed conditions, without incurring unacceptable losses or risk damage to the group’s reputation. Due to the dynamic nature of the underlying businesses, group treasury maintains flexibility in funding by holding availability through credit lines. At year-end the group’s total uncommitted facilities available was R2 173 million and USD46 million (2016: R2 025 million and USD48 million) of which the full balance remained undrawn (2016: nil drawn down).
See note 30.5 for details for maturity analysis of the group’s financial liabilities.
Capital risk management The group’s objectives when managing capital are to safeguard the group’s ability to continue as a going concern
in order to provide returns for shareholders and benefits for other stakeholders, and to maintain an optimal capital structure to reduce the cost of capital.
In order to maintain or adjust the capital structure, the group may adjust the amount of dividends paid to shareholders, return capital to shareholders, issue new shares or sell assets to reduce debt. The group’s target of maintaining a ratio of shareholders’ interest to total assets is in the range of 25% to 30%. This is obtained through achieving the group’s earnings targets, management of working capital, share buy-backs and dividends.
In 2017 the shareholders’ interest to total assets was 34.0% (2016: 29.3%).
30 Financial instruments Market risk 30.1 Treasury risk management The treasury committee meets on a regular basis to analyse currency and interest rate exposures and re-
evaluate treasury management strategies.
30.2 Foreign exchange risk management The group is exposed to foreign currency risk as it imports merchandise. This risk is mitigated by entering
into forward exchange contracts. These contracts are matched with anticipated future cash flows in foreign currencies.
The group does not use forward exchange contracts for speculative purposes.
The group has measured these instruments at fair value (see note 16).
31 August 2017 31 August 2016
Exposure to currency risk – foreign exchange contracts
USD’000
GBP’000
EUR’000
CNY’000
USD’000
GBP’000
EUR’000
CNY’000
Forecast purchases and payables due at the end of the year 27 634 4 653 4 913 90 941 18 498 3 251 2 263 103 377
Forward exchange contracts subject to cash flow hedging 26 574 2 382 2 785 87 153 17 546 1 845 1 978 62 803
Net exposure 1 060 2 271 2 128 3 788 952 1 406 285 40 574
The following exchange rates applied during the year:
Average rateReporting date mid-
spot rate
2017 2016 2017 2016
USD 13.46 14.74 13.02 14.49
GBP 17.24 21.48 16.98 19.06
EUR 14.99 16.56 15.79 16.30
CNY 1.97 2.26 1.97 2.18
57
Clicks Group Audited Annual Financial Statements 2017

NOTES TO THE ANNUAL FINANCIAL STATEMENTS (CONTINUED)for the year ended 31 August
30 Financial instruments (continued)30.2 Foreign exchange risk management (continued)
Foreign exchange rate sensitivity analysisThe following table details the group’s sensitivity to a 10% strengthening in the South African Rand against the relevant foreign currencies. 10% is the sensitivity rate used when reporting foreign currency risk internally to management personnel and represents management’s assessment of a reasonable possible change in foreign exchange rates. The sensitivity analysis includes only outstanding foreign currency denominated monetary items and their adjusted translation for a 10% change in foreign currency rates.
USD impact GBP impact EUR impact CNY impact
2017R’000
2016R’000
2017R’000
2016R’000
2017R’000
2016R’000
2017R’000
2016R’000
Decrease in pre-tax other comprehensive income (36 640) (27 456) (4 130) (4 069) (4 236) (3 322) (17 344) (14 464)
Increase in profit before tax 1 392 1 384 3 857 2 680 3 359 464 830 8 845
For a 10% weakening of the South African Rand against the relevant currency, there would be an equal but opposite increase in pre-tax other comprehensive income and decrease in profit before tax.
30.3 Fair values of financial instruments
The fair values of financial assets and liabilities, together with the carrying amounts shown in the statement of financial position, are as follows:
31 August 2017 31 August 2016
Carrying valueR’000
Fair valueR’000
Carrying valueR’000
Fair value
R’000
Financial assets
Trade receivables (see note 18) Loans and receivables 1 701 433 1 701 433 1 618 962 1 618 962
Logistics fees receivable (see note 18) Loans and receivables 223 251 223 251 118 725 118 725
Other receivable (see note 18) Loans and receivables 8 782 8 782 22 976 22 976
Loans receivable (see note 14) Loans and receivables 13 500 13 500 17 997 17 997
Financial assets at fair value through profit or loss (see note 15) Assets at fair value 27 580 27 580 16 145 16 145
Cash and cash equivalents Loans and receivables 700 473 700 473 369 800 369 800
Equity derivative contracts used for cash flow hedging (see note 16) Assets at fair value 325 739 325 739 231 242 231 242
Financial liabilities
Forward exchange contracts used for cash flow hedging (see note 16)
Financial liabilities measured at fair value 9 142 9 142 26 971 26 971
Financial liability at fair value through profit or loss (see note 27)
Financial liabilities measured at fair value – – 2 331 2 331
Trade and other payables (see note 25)
Financial liabilities measured at amortised cost 5 260 353 5 260 353 4 968 333 4 968 333
58

NOTES TO THE ANNUAL FINANCIAL STATEMENTS (CONTINUED)for the year ended 31 August
30 Financial instruments (continued) 30.3 Fair values of financial instruments (continued) Basis for determining fair values The following summarises the significant methods and assumptions used in estimating the fair values of
financial instruments reflected in the table above.
Derivatives Fair values of currency, interest rate and equity derivatives are calculated using standard market calculation
conventions with reference to the relevant closing market spot rates, forward foreign exchange, interest rates and share price.
Non-derivative financial assets and liabilities Fair value is calculated based on the present value of future principal and interest cash flows, discounted
at the market rate of interest at the reporting date except for the insurance cell captive where fair value is determined based on the net asset value at the reporting date.
The fair value of listed equity and other similar instruments is determined by reference to the quoted price in active markets.
Interest rates used in determining fair value The interest rates used to discount estimated cash flows, where applicable, are based on the government
yield curve at the reporting date plus an adequate constant credit spread, and were as follows:
2017 %
2016%
Borrowings 10.25 10.50
Leases n/a n/a
The table below provides the valuation method of financial instruments carried at fair value. The different levels have been defined as follows:
Level 1 – Quoted prices (unadjusted) in active markets for identical assets and liabilities.
Level 2 – Inputs other than quoted prices included within level 1 that are observable for the asset or liability, either directly (i.e. prices) or indirectly (i.e. derived from prices).
Level 3 – Inputs for the asset or liability that are not based on observable market data (unobservable inputs).
The fair value of financial instruments that are not traded in an active market is determined by using valuation techniques. These valuation techniques maximise the use of observable market data where it is available and rely as little as possible on entity-specific estimates. If all significant inputs required to fair value an instrument are observable, the instrument is included in level 2.
If one or more of the significant inputs is not based on observable market data, the instrument is included in level 3.
59
Clicks Group Audited Annual Financial Statements 2017

NOTES TO THE ANNUAL FINANCIAL STATEMENTS (CONTINUED)for the year ended 31 August
30 Financial instruments (continued)30.3 Fair values of financial instruments (continued)
Financial assets and financial liabilities measured at fair value
GroupLevel 1
R’000Level 2
R’000Level 3
R’000Total
R’0002017Financial assetsFinancial assets at fair value through profit or loss (see note 15) 16 301 11 279 – 27 580Equity derivative contracts used for cash flow hedging (see note 16) – 325 739 – 325 739 Total 16 301 337 018 – 353 319
Financial liabilitiesForward exchange contracts used for cash flow hedging (see note 16) – 9 142 – 9 142 Total – 9 142 – 9 142
2016Financial assetsFinancial assets at fair value through profit or loss (see note 15) – 16 145 – 16 145 Equity derivative contracts used for cash flow hedging (see note 16) – 231 242 – 231 242 Total – 247 387 – 247 387
Financial liabilitiesForward exchange contracts used for cash flow hedging (see note 16) – 26 971 – 26 971 Financial liability at fair value through profit or loss (see note 27) – – 2 331 2 331 Total – 26 971 2 331 29 302
There have been no transfers between level 1, 2 and 3 during the period.
30.4 Credit risk management Credit risk refers to the risk that a counterparty may default on its contractual obligation resulting in financial
loss to the group. The group is exposed to credit risk arising from cash equivalents, derivative financial instruments and deposits with banks and financial institutions, as well as credit exposures to Distribution and Retail customers, including outstanding receivables and committed transactions. Management have a formal credit policy in place as a means of mitigating the risk of financial loss to the group.
The carrying amount of financial assets represents the maximum credit exposure. The maximum exposure to credit risk at the reporting date was:
Carrying amount
2017R’000
2016R’000
Derivative financial assets (see note 16) 325 739 231 242
Trade receivables (see note 18) 1 701 433 1 618 962
Logistics fees receivable (see note 18) 223 251 118 725
Other receivable (see note 18) 8 782 22 976
Cash and cash equivalents 700 473 369 800
Loans receivable (see note 14) 13 500 17 997
2 973 178 2 379 702
60

NOTES TO THE ANNUAL FINANCIAL STATEMENTS (CONTINUED)for the year ended 31 August
30 Financial instruments (continued) 30.4 Credit risk management (continued) Trade receivables The group’s exposure to credit risk is influenced mainly by the individual characteristics of each customer.
Management has a credit policy in place and exposure to credit risk is monitored on an ongoing basis. Credit evaluations are performed on all customers who purchase from the group.
Trade receivables can be categorised into Distribution customers and Retail customers.
The maximum exposure to credit risk, after impairment, for trade receivables at the reporting date by type of customer was:
Carrying amount
2017R’000
2016R’000
Retail customers 103 035 80 622
Distribution customers 1 598 398 1 538 340
1 701 433 1 618 962
Retail customers The ageing of trade receivables at the reporting date was:
2017 2016
Gross R’000
ImpairmentR’000
NetR’000
Gross R’000
ImpairmentR’000
NetR’000
Not past due 101 605 (4 700) 96 905 84 922 (4 300) 80 622
Past due 0 – 30 days 2 347 (100) 2 247 – – –
Past due more than 31 days 7 083 (3 200) 3 883 – – –
Total 111 035 (8 000) 103 035 84 922 (4 300) 80 622
Retail trade receivables mainly relate to receivables from medical aids with respect to pharmacy debtors.
Trade debtors are classified as past due when they have passed their payment date by one day.
Distribution customers The ageing of trade receivables at the reporting date was:
2017 2016
Gross R’000
ImpairmentR’000
NetR’000
Gross R’000
ImpairmentR’000
NetR’000
Not past due 1 431 141 – 1 431 141 1 276 046 (65) 1 275 981
Past due 0 – 30 days 145 774 – 145 774 185 993 (700) 185 293
Past due more than 31 days 44 082 (22 599) 21 483 96 082 (19 016) 77 066
Total 1 620 997 (22 599) 1 598 398 1 558 121 (19 781) 1 538 340
Trade debtors are classified as past due when they have passed their payment date by one day.
Distribution customers are primarily hospitals and independent pharmacists.
The Distribution business minimises its exposure to credit risk by insuring debtors with balances greater than a predetermined amount.
There is an excess (which varies between hospitals and independent pharmacists) that is carried by the Distribution business, with the balance being covered by Credit Guarantee Insurance Corporation of Africa Limited.
61
Clicks Group Audited Annual Financial Statements 2017

NOTES TO THE ANNUAL FINANCIAL STATEMENTS (CONTINUED)for the year ended 31 August
30 Financial instruments (continued)30.4 Credit risk management (continued)
The split between insured and uninsured debtors is as follows:
Gross amount
2017R’000
2016R’000
Insured 1 563 908 1 548 178
Uninsured 57 089 9 943
1 620 997 1 558 121
Uninsured debtors consist mainly of a concentration of debtors with a monthly turnover of less than R40 000 and low-risk debtors such as government debtors.
The exposure to credit risk in respect of these debtors is managed through credit evaluations.
Impairment loss The impairment is determined based on information regarding the financial position of each trade receivable
at year-end.
The group’s trade receivables are stated net of impairment losses. An analysis of impairment losses are as follows:
Retail Distribution
2017R’000
2016R’000
2017R’000
2016R’000
Balance at the beginning of the year (4 300) (5 900) (19 781) (22 778)
Additional allowances made (3 700) – (2 818) 86
Trade receivables written off during the year as uncollectible – 1 600 – 2 911
Balance at the end of the year (8 000) (4 300) (22 599) (19 781)
The creation of impairment losses have been included in “other costs” in profit or loss (see note 5).
Amounts charged to the allowance account are generally written off to profit or loss when there is no expectation of recovery.
Cash and cash equivalents The group’s banking facilities are with reputable institutions, all of which have a strong credit rating.
Other loans Other loans are reviewed at least on an annual basis to assess their recoverability. None of the loans are
considered to be impaired at the end of the financial year.
30.5 Liquidity risk management Liquidity risk is the risk that the group will not be able to meet its financial obligations as they fall due.
The group’s approach to managing liquidity is to ensure, as far as possible, that it will always have sufficient liquidity to meet its liabilities when due, under both normal and stressed conditions, without incurring unacceptable losses or risk damage to the group’s reputation.
62

NOTES TO THE ANNUAL FINANCIAL STATEMENTS (CONTINUED)for the year ended 31 August
30 Financial instruments (continued) 30.5 Liquidity risk management (continued) Liquidity and interest risk tables The following tables detail the group’s remaining contractual maturity for its financial liabilities, including
interest payments and excluding the impact of netting agreements:
Carrying amount
R’000
Contractual cash flows
R’000
One year or lessR’000
2017
Liabilities
Derivative financial liabilities (see note 16) 9 142 9 142 9 142
Trade and other payables (see note 25) 5 260 353 5 260 353 5 260 353
5 269 495 5 269 495 5 269 495
2016
Liabilities
Derivative financial liabilities (see note 16) 26 971 26 971 26 971
Financial liability at fair value through profit or loss (see note 27) 2 331 2 500 2 500
Trade and other payables (see note 25) 4 968 333 4 968 333 4 968 333
4 997 635 4 997 804 4 997 804
31 Capital commitments Group
2017R’000
2016R’000
Capital expenditure approved by the directors
Contracted 184 028 25 866
Not contracted 496 485 551 534
680 513 577 400
The capital expenditure will be financed from borrowings and internally generated funds.
32 Financial guarantees Group companies provide surety for other group companies to the value of R2 173 million and USD46 million
(2016: R2 025 million and USD48 million) with respect to facilities held with various banks. At year-end these facilities had no drawings by group companies (2016: nil). The fair values of the financial guarantees are considered negligible.
33 Related party transactions 33.1 Group Clicks Group Limited is the ultimate holding company of the group.
Transactions between group subsidiaries During the year, in the ordinary course of business, certain companies within the group entered into
transactions with one another. These intragroup transactions have been eliminated on consolidation. For a list of the group’s subsidiaries, see page 69.
63
Clicks Group Audited Annual Financial Statements 2017

NOTES TO THE ANNUAL FINANCIAL STATEMENTS (CONTINUED)for the year ended 31 August
33 Related party transactions (continued) 33.1 Group (continued) Related party transactions include:
(i) dividends paid and received from subsidiary companies and associates;
(ii) interest received from or paid to subsidiary companies; and
(iii) loans to or from subsidiary companies.
Directors and key management Certain non-executive directors are also non-executive directors of other public companies which transact
with the group. The relevant directors do not believe that they have control, joint control or significant influence over the financial or operating policies of those companies.
Executive directors’ employment contracts do not provide for a defined period of employment, but specify a notice period for the chief executive officer of 12 months and six months for the other executive directors. During this notice period all standard benefits accrue to the directors in question. Contracts do not provide for predetermined compensation on termination other than that accorded to employees in terms of the group’s remuneration policies.
Employee benefits paid to directors and key management personnel are detailed in note 4.
Shares held by directors and their related entities The audited percentage of shares held by directors of the company at year-end is disclosed on page 70.
Group
2017R’000
2016R’000
Transactions with Sorbet Brands Proprietary Limited
Dividends received 3 143 1 638
Royalties paid 2 984 3 117
Other related partiesThe group has identified The Clicks Helping Hand Trust as a related party because of the group’s involvement in the charitable and developmental activities of the trust. The group has not consolidated the trust as it is not exposed to variable returns and any non-financial benefit is considered to be insignificant. The total net assets for the trust is R2.5 million (2016: R7.9 million) and a net loss of R5.4 million (2016: R3.5 million, net income). Donations to the trust during the year from subsidiary companies were:
The Clicks Helping Hand Trust 4 087 8 097
No financial benefits were derived by the group from this relationship.
Contributions to pension and provident fundContributions paid to pension and provident funds are included in note 4 and additional information in note 23.
64

NOTES TO THE ANNUAL FINANCIAL STATEMENTS (CONTINUED)for the year ended 31 August
Company
2017R’000
2016R’000
33 Related party transactions (continued)33.2 Company
The company has the following related party transactions:
33.2.1 Dividends received
New Clicks South Africa Proprietary Limited 706 812 624 055
Total dividends received from related parties 706 812 624 055
33.2.2 Dividends paid
New Clicks South Africa Proprietary Limited 28 507 24 366
Clicks Group Employee Share Ownership Trust 7 930 6 851
New Clicks Holdings Share Trust 331 414
Total dividends paid to related parties 36 768 31 631
33.2.3 Loans to/(by) subsidiary companies
New Clicks South Africa Proprietary Limited (217 997) (216 903)
Clicks Group Employee Share Ownership Trust 291 291
Clicks Centurion Proprietary Limited 9 000 9 000
New Clicks Holdings Share Trust (19 682) –
(228 388) (207 612)
A schedule of the loans and investments in related parties is included on page 69.
Details regarding dividends relating to treasury shares are included in note 28.
34 Borrowing powers In terms of the memorandum of incorporation, the borrowing powers of the company are unlimited.
35 Operating segments The group has identified two reportable segments, as described below.
For each of the operating brands, the group’s chief decision-makers review internal management reports on a monthly basis. The following describes the operations in each of the group’s reportable segments:
Retail Retail comprises of Clicks, a specialist health, beauty and homeware retailer; Claire’s, a specialty retailer of
fashionable jewellery and accessories at affordable prices; GNC, a specialty retailer of health and wellness products; Musica, a retailer of entertainment-related merchandise; and The Body Shop, which specialises in naturally inspired luxury toiletries, cosmetics, gifting and grooming, with stores in the Republic of South Africa, Namibia, Swaziland, Botswana and Lesotho.
Distribution UPD is a national full-range pharmaceutical wholesaler and also provides distribution services for the Clicks Group.
UPD operates within the Republic of South Africa and in Botswana.
The information regarding the results of each reportable segment is included on page 16. Performance is measured based on segment operating profit, as included in the internal management reports that are reviewed by the group’s chief operating decision-makers. Segmental profit is used to measure performance as management believes that such information is the most relevant in evaluating the results of certain segments relative to other entities that operate within these industries. Inter-segment transactions are on an arm’s length basis.
Major customers There are no external customers that account for more than 10% of the group’s revenue.
65
Clicks Group Audited Annual Financial Statements 2017

COMPANY STATEMENT OF COMPREHENSIVE INCOME
COMPANY STATEMENT OF FINANCIAL POSITION
for the year ended 31 August
as at 31 August
Notes2017
R’0002016
R’000
Assets
Non-current assets
Interest in subsidiary companies (see page 69) 345 610 307 477
Current assets 653 122
Cash and cash equivalents 653 122
Total assets 346 263 307 599
Equity 337 676 298 891
Share capital 19 2 752 2 754
Share premium 19 14 089 14 089
Share option reserve 20 276 959 218 050
Distributable reserve 43 876 63 998
Current liabilities 8 587 8 708
Trade and other payables 2 115 2 115
Income tax payable 6 472 6 593
Total equity and liabilities 346 263 307 599
Notes2017
R’0002016
R’000
Dividend income – subsidiary 706 812 624 055
Bank charges (6) (4)
Operating costs (522) (975)
Profit before financing cost 706 284 623 076
Financial income 117 83
Profit before taxation 706 401 623 159
Income tax expense 7 (31) (1 136)
Profit for the year 706 370 622 023
Other comprehensive income for the year, net of tax – –
Total comprehensive income for the year 706 370 622 023
66

COMPANY STATEMENT OF CHANGES IN EQUITYfor the year ended 31 August
Number ofshares
(Note 19)’000
Sharecapital
(Note 19)R’000
Sharepremium(Note 19)
R’000
Share optionreserve
(Note 20R’000)
DistributablereserveR’000
TotalR’000
Balance at 1 September 2015 275 291 2 754 14 089 152 517 53 094 222 454
Equity-settled capital contribution to subsidiary – – – 65 533 – 65 533
Total comprehensive income for the year – – – – 622 023 622 023
Dividends to shareholders (see note 28) – – – – (611 119) (611 119)
Balance at 31 August 2016 275 291 2 754 14 089 218 050 63 998 298 891
Equity-settled capital contribution to subsidiary – – – 58 909 – 58 909
Treasury shares cancelled (169) (2) – – (19 680) (19 682)
Total comprehensive income for the year – – – – 706 370 706 370
Dividends to shareholders (see note 28) – – – – (706 812) (706 812)
Balance at 31 August 2017 275 122 2 752 14 089 276 959 43 876 337 676
67
Clicks Group Audited Annual Financial Statements 2017

COMPANY STATEMENT OF CASH FLOWS
NOTES TO THE COMPANY STATEMENT OF CASH FLOWS
for the year ended 31 August
for the year ended 31 August
2017R’000
2016R’000
Cash effects of operating activities
Loss before working capital changes (528) (979)
Dividends received 706 812 624 055
Financial income 117 83
Working capital changes – (142)
Cash generated by operations 706 401 623 017
Taxation paid (152) (402)
Cash inflow from operating activities before dividends paid 706 249 622 615
Dividends paid to shareholders (706 812) (611 119)
Net cash effects of operating activities (563) 11 496
Cash effects of investing activities
Increase/(decrease) in subsidiary loans payable 1 094 (11 686)
Net cash effects of investing activities 1 094 (11 686)
Net movement in cash and cash equivalents 531 (190)
Cash and cash equivalents at the beginning of the year 122 312
Cash and cash equivalents at the end of the year 653 122
2017R’000
2016R’000
Loss before working capital changes
Profit before taxation 706 401 623 159
Adjustment for:
Dividend received (706 812) (624 055)
Financial income (117) (83)
(528) (979)
Working capital changes
Decrease in trade and other payables – (142)
– (142)
Taxation paid
Income tax payable at the beginning of the year 6 593 5 859
Current tax charge 31 1 136
Income tax payable at the end of the year (6 472) (6 593)
152 402
68

INTEREST IN SUBSIDIARY COMPANIESat 31 August
Shares at cost less amounts written off
Amount owing (to)/by subsidiaries
Name of company/entity and nature of business
Country of incorporation
Ordinary issued share capital/trust capital
2017 R’000
2016 R’000
2017 R’000
2016 R’000
Directly held
(i) Trading
New Clicks South Africa Proprietary Limited South Africa R500 272 439 272 439 (217 997) (216 903)
(ii) Clicks Group Employee Share Ownership Trust South Africa R1 000 – – 291 291
(iii) Property owning
Clicks Centurion Proprietary Limited South Africa R10 * * 9 000 9 000
(iv) New Clicks Holdings Share Trust South Africa R16 673 700 – – (19 682) –
(v) New Clicks Foundation Trust** South Africa R5 000 – – – –
Indirectly held
(i) Trading
Safeway (Swaziland) Proprietary Limited Swaziland E2 – – – –
The Clicks Organisation (Botswana) Proprietary Limited Botswana BWP3 000 – – – –
Clicks Group (Namibia) Proprietary Limited Namibia N$100 – – – –
Clicks Stores (Lesotho) Proprietary Limited Lesotho M1 000 – – – –
Unicorn Pharmaceuticals Proprietary Limited South Africa R10 – – – –
Clicks Retailers Proprietary Limited South Africa R200 – – – –
Clicks Investments Proprietary Limited South Africa R16 685 175 000 – – – –
BTB Media Proprietary Limited South Africa R120 – – – –
Kalahari Medical Distributors Proprietary Limited Botswana BWP200 – – – –
(ii) Name protection and dormant
Two companies (2016: Five companies) – – – –
272 439 272 439 (228 388) (207 612)
Shares at cost less amounts written off 272 439 272 439
Amounts owing to subsidiary companies (228 388) (207 612)
Share-based payments capitalised 301 559 242 650
Interest in subsidiaries 345 610 307 477
All subsidiary companies/entities are wholly owned with the exception of The Link Investment Trust (“Link”). Clicks Group Limited has a 56% interest in Link.
All other loans are interest free, unsecured and repayable by agreement.
* Values less than R1 000** In the current year Clicks Group Limited obtained control of New Clicks Foundation Trust for no consideration. As a result the group has
consolidated the fair value of the net assets of the trust amounting to R12.6 million which comprises investments in listed equity and other similar instruments
69
Clicks Group Audited Annual Financial Statements 2017

ANALYSIS OF SHAREHOLDERSat 31 August
Public and non-public shareholdersNumber of
sharesPercentage
of sharesPublic shareholders 235 980 664 96.0Non-public shareholders
Shares held by directors 544 859 0.2Treasury stock held by New Clicks South Africa Proprietary Limited 9 443 445 3.8
Total non-public shareholders 9 988 304 4.0Total shareholders 245 968 968 100.0
According to the company’s register of shareholders, read in conjunction with the company’s register of disclosure of beneficial interests made by registered shareholders acting in a nominee capacity, the following shareholders held 3% or more of the issued share capital at 31 August 2017:
Major beneficial shareholders holding 3% or more
2017Percentage
of shares
2016Percentage
of sharesGovernment Employees Pension Fund 15.5 15.6GIC Private Limited 4.3 4.4Fidelity International Growth Fund 3.4 3.2Beneficial shareholder no longer holding 3%:Mawer International Equity Pooled Fund 2.4 3.0
Major fund managers managing 3% or more
2017Percentage
of shares
2016Percentage
of sharesPublic Investment Corporation (SA) 14.2 14.5Baillie Gifford & Co (UK) 5.5 5.3Fidelity Management & Research (US) 5.2 5.0GIC (Singapore) 4.3 4.3JPMorgan Asset Management (UK and US) 4.1 2.9Mawer Investment Management (CA) 3.8 4.7The Vanguard Group (US) 3.4 2.9MFS Investment Management (US) 3.3 2.4Fund managers no longer managing over 3%:Wasatch Advisors (US) 2.5 3.7Aberdeen Asset Management (UK) 1.7 3.6
GEOGRAPHIC DISTRIBUTION OF SHAREHOLDERS
South Africa and Namibia 33.9%
USA and Canada 45.8%
United Kingdom and Ireland 6.9%
Europe 6.7%
Other countries 6.7%
2017
OFFSHORE SHAREHOLDING
12.3%
2009
60.6%
2011
64.1%
2013
61.7%
2015
66.1%
2017
70

Directors’ shareholdings
2017 2016
Director
Directbeneficial
shares
Indirectbeneficial
shares Total
Directbeneficial
shares
Indirectbeneficial
shares Total
David Nurek – 100 000 100 000 – 100 000 100 000
John Bester 12 000 10 000 22 000 12 000 10 000 22 000
Bertina Engelbrecht 105 068 – 105 068 98 755 – 98 755
Michael Fleming 30 421 – 30 421 20 837 – 20 837
David Kneale 285 370 – 285 370 259 802 – 259 802
Martin Rosen – 2 000 2 000 – 2 000 2 000
Total 432 859 112 000 544 859 391 394 112 000 503 394
The total number of ordinary shares in issue is 245 968 968 (2016: 246 137 763). The percentage of issued share capital held by directors is 0.22% (2016: 0.20%). Details of all dealings in Clicks Group shares by directors during the financial year are contained in the directors’ report on page 2.
Classification of registered shareholdingsNumber of
sharesPercentage
of shares
Banks/Brokers 150 029 981 61.0
Retirement funds 46 551 718 18.9
Mutual funds 29 560 326 12.0
Treasury shares 9 443 445 3.8
Individuals 3 809 994 1.5
Insurance companies 3 583 423 1.5
Trusts 1 632 163 0.7
Endowment funds 469 309 0.2
Other 888 609 0.4
245 968 968 100.0
Distribution of registered shareholdingsNumber of
holdersPercentage
of holdersNumber of
sharesPercentage
of shares
1 – 1 000 2 918 67.7 809 319 0.3
1 001 – 10 000 971 22.5 3 169 373 1.3
10 001 – 100 000 275 6.4 9 179 843 3.7
100 001 – 1 000 000 105 2.5 33 218 058 13.5
1 000 001 shares and over 40 0.9 199 592 375 81.2
4 309 100.0 245 968 968 100.0
71
Clicks Group Audited Annual Financial Statements 2017
SHAREHOLDERS’ DIARY
Annual general meeting 31 January 2018
Preliminary results announcements
Interim results to February 2018 on or about 19 April 2018
Final results to August 2018 on or about 25 October 2018
Publication of 2018 Integrated Annual Report November 2018
Ordinary share dividend2017 final dividend
Last day to trade with dividend included 23 January 2018
Date of dividend payment 29 January 2018
2018 interim dividend
Last day to trade with dividend included July 2018
Date of dividend payment July 2018
2018 final dividend
Last day to trade with dividend included January 2019
Date of dividend payment January 2019
72

CORPORATE INFORMATION
Clicks Group LimitedIncorporated in the Republic of South AfricaRegistration number 1996/000645/06Income tax number 9061/745/71/8
JSE share code: CLSISIN: ZAE000134854ADR ticker symbol: CLCGYADR CUSIP code: 18682W205
Registered addressCnr Searle and Pontac StreetsCape Town 8001Telephone: +27 (0)21 460 1911
Postal addressPO Box 5142Cape Town 8000
Company secretaryMatthew Welz, LLBE-mail: [email protected]
AuditorsErnst & Young Inc. (EY)
Principal bankersThe Standard Bank of South Africa
JSE sponsorInvestec Bank Limited
Transfer secretariesComputershare Investor Services Proprietary LimitedBusiness address: Rosebank Towers, 15 Biermann Avenue, Rosebank 2196Postal address: PO Box 61051, Marshalltown 2107Telephone: +27 (0)11 370 5000
Investor relations consultantsTier 1 Investor RelationsTelephone: +27 (0)21 702 3102E-mail: [email protected]
For more information, please visit our website at www.clicksgroup.co.za
73
Clicks Group Audited Annual Financial Statements 2017