Audit Committee Effectiveness
21
MIR MUHIBUL ISLAM AUDIT COMMITTEE EFFECTIVENESS AND FINANCIAL REPORTING QUALITY
-
Upload
muhib-islam -
Category
Investor Relations
-
view
314 -
download
0
Transcript of Audit Committee Effectiveness

M I R M U H I B U L I S L A M
AUDIT COMMITTEE EFFECTIVENESS AND FINANCIAL REPORTING QUALITY

BACKGROUND AND MOTIVATION
• Jeon, Choi and Park, 2004 and Wild, 1994: Korean Companies - Level of significance was low between the ACE and FRQ; and
US Companies- Strong relationship between the ACE and FRQ.
• Klein (2002)- Companies (US) with AC strong on independence had significantly lower amount of abnormal accruals than others.
• Xie, Davidson and DaDalt (2003)- Better FRQ in companies (US) that had majority of corporate experienced as well as independent directors.
• Two similar empirical research in Australia :Davidson et. al. (2005)- inverse relationship between the percentage of non-executive directors and the suspected amount of earnings management.
Baxter, P (2007)- Significant difference between the FRQ of a company before and after the establishment of audit committee, however any subsequent improvement or change in the AC seemed to not have any major impact on FRQ.
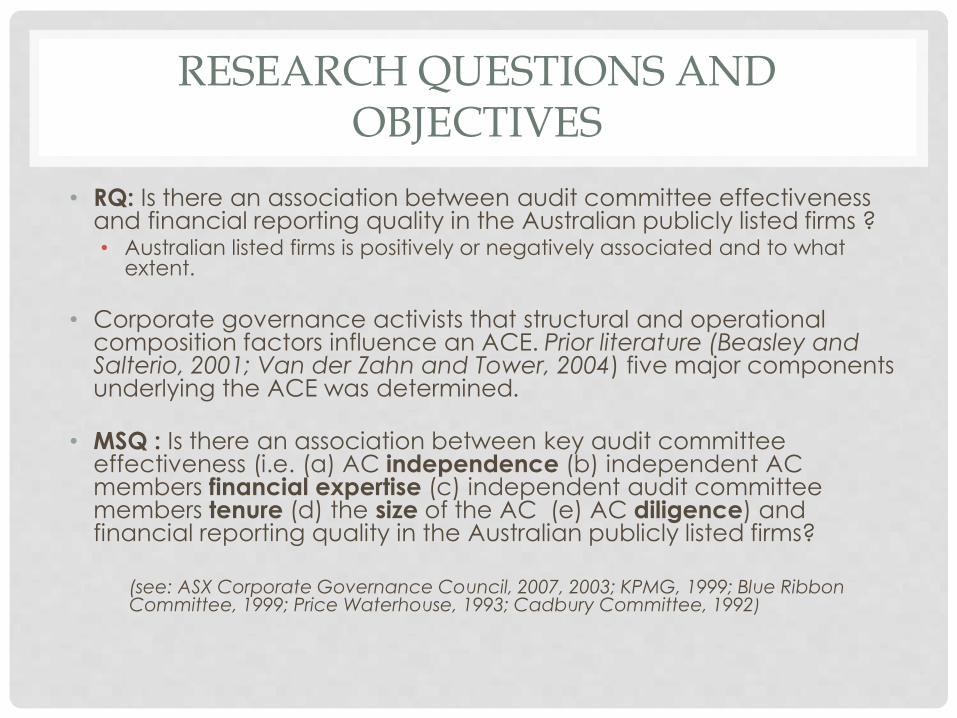
RESEARCH QUESTIONS AND OBJECTIVES
• RQ: Is there an association between audit committee effectiveness and financial reporting quality in the Australian publicly listed firms ?• Australian listed firms is positively or negatively associated and to what
extent.
• Corporate governance activists that structural and operational composition factors influence an ACE. Prior literature (Beasley and Salterio, 2001; Van der Zahn and Tower, 2004) five major components underlying the ACE was determined.
• MSQ : Is there an association between key audit committee effectiveness (i.e. (a) AC independence (b) independent AC members financial expertise (c) independent audit committee members tenure (d) the size of the AC (e) AC diligence) and financial reporting quality in the Australian publicly listed firms?
(see: ASX Corporate Governance Council, 2007, 2003; KPMG, 1999; Blue Ribbon Committee, 1999; Price Waterhouse, 1993; Cadbury Committee, 1992)
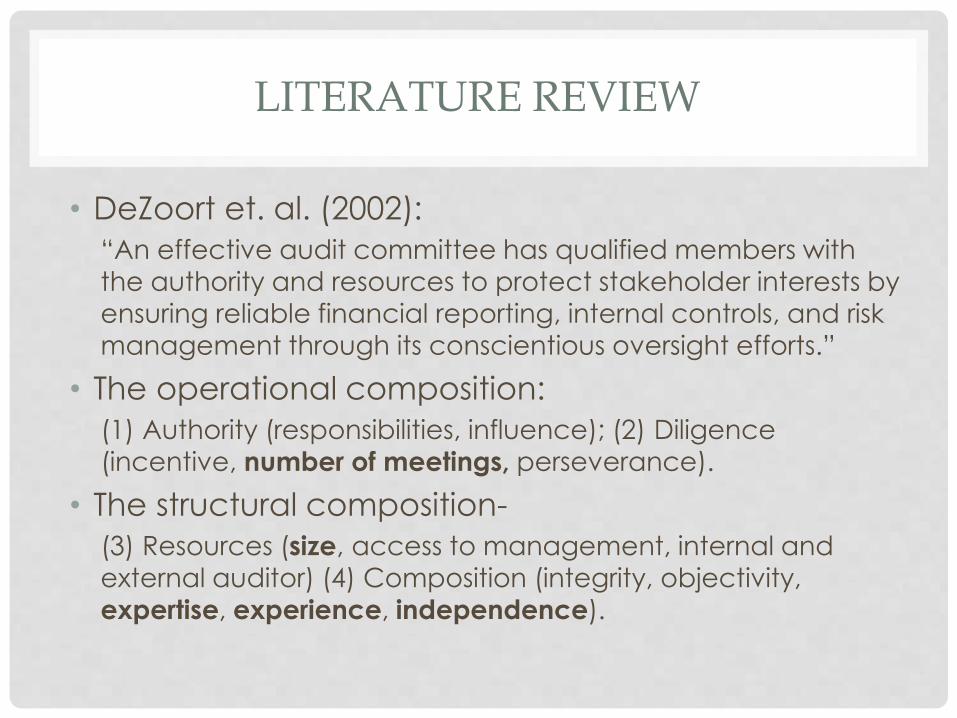
LITERATURE REVIEW
• DeZoort et. al. (2002):
“An effective audit committee has qualified members with
the authority and resources to protect stakeholder interests by
ensuring reliable financial reporting, internal controls, and risk
management through its conscientious oversight efforts.”
• The operational composition:
(1) Authority (responsibilities, influence); (2) Diligence
(incentive, number of meetings, perseverance).
• The structural composition-
(3) Resources (size, access to management, internal and external auditor) (4) Composition (integrity, objectivity,
expertise, experience, independence).
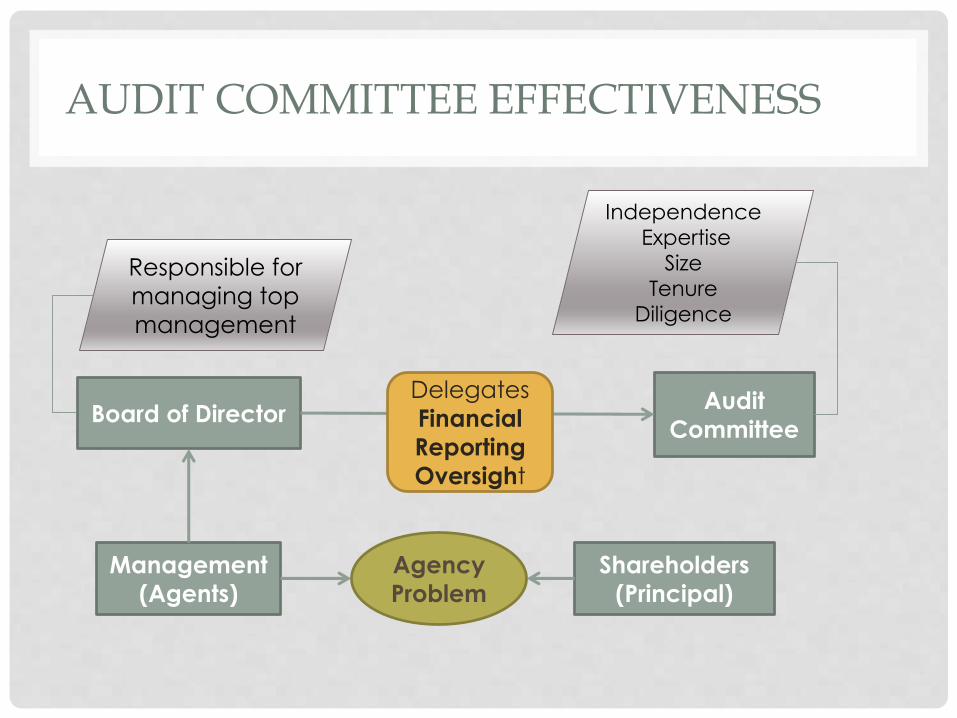
Board of Director
Management
(Agents)
Shareholders
(Principal)
Audit
Committee
Agency
Problem
Responsible for
managing top
management
Delegates
Financial
Reporting
Oversight
Independence
Expertise
Size
Tenure
Diligence
AUDIT COMMITTEE EFFECTIVENESS
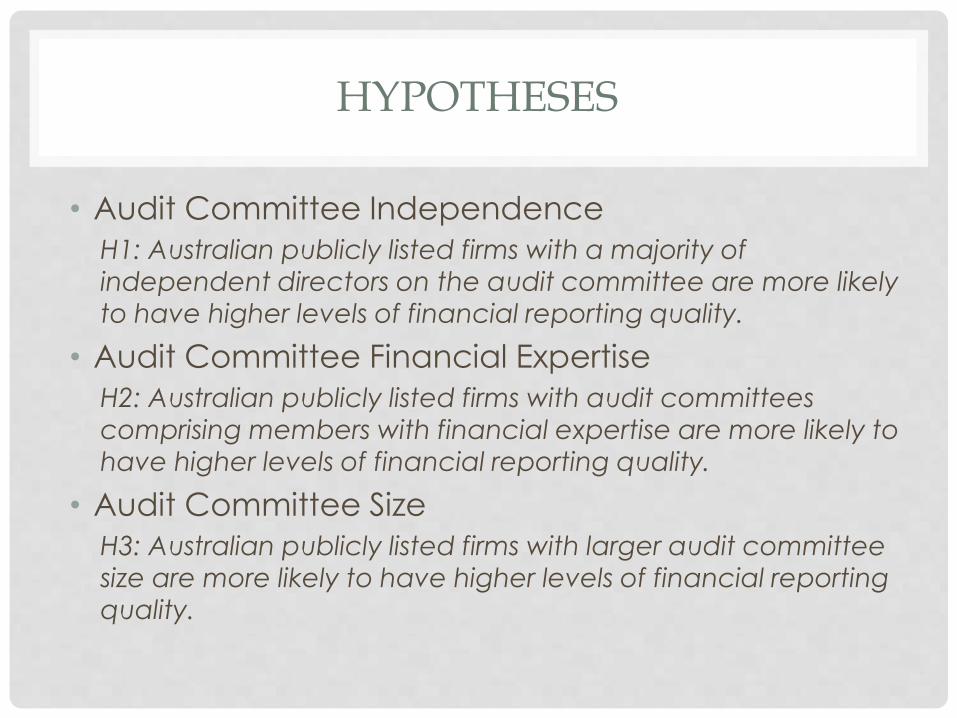
HYPOTHESES
• Audit Committee Independence
H1: Australian publicly listed firms with a majority of
independent directors on the audit committee are more likely
to have higher levels of financial reporting quality.
• Audit Committee Financial Expertise
H2: Australian publicly listed firms with audit committees
comprising members with financial expertise are more likely to
have higher levels of financial reporting quality.
• Audit Committee Size
H3: Australian publicly listed firms with larger audit committee size are more likely to have higher levels of financial reporting
quality.

HYPOTHESES
• Audit Committee Tenure
H4: Australian publicly listed firms with audit committees
comprising members with prior audit committee experience
are more likely to have higher levels of financial reporting
quality.
• Audit Committee Diligence
H5: Australian publicly listed firms with more diligence audit
committees (i.e. meet more frequently) are more likely to
have higher levels of financial reporting quality.
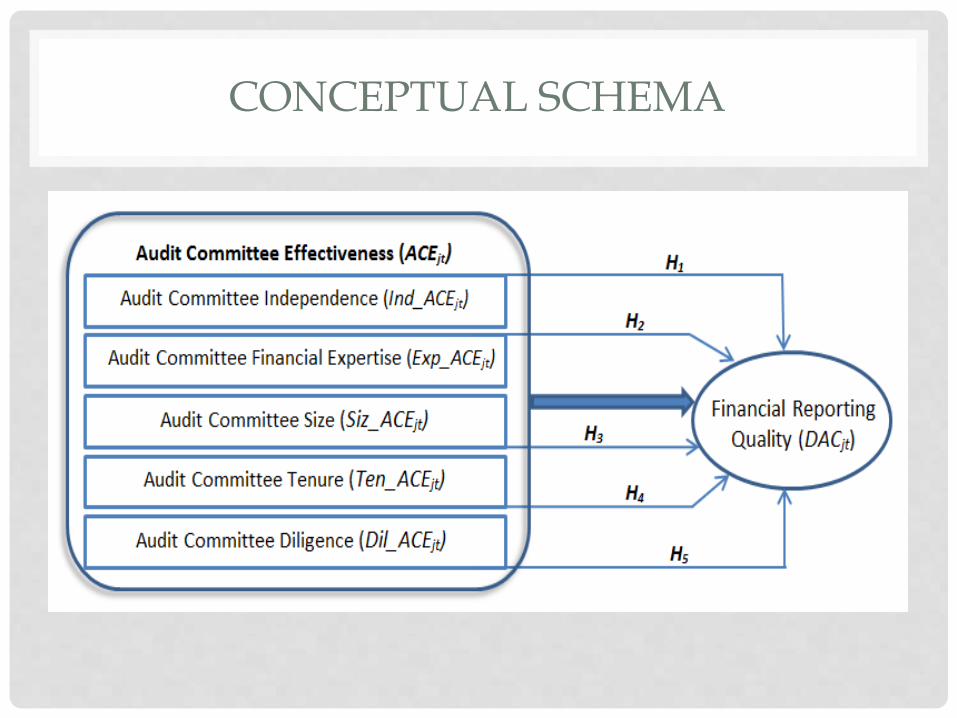
CONCEPTUAL SCHEMA

SAMPLE SELECTION
• The analysis involves data of one calendar year period (Jan 2008 – Dec 2000). • Selected data is considering the fact 2008 as a pre global financial
crisis
• The initial sample comprised of 110 random Australian publicly listed firms registered with the ASX as at Jan 1 2008.• FinAnalysis or DatAnalysis (Aspect Huntley on-line repositories) has
been utilized to identify the firms. Consistent with prior research financial and banking industries firms was excluded (Ball et. al. 2000; Goodwin, 2003).
• From the resulting sample pool, 93 firms is selected for which all the data is available.
• Data of ACE has been collected analyzing the Annual Reports.

RESEARCH METHODOLOGY:MODIFIED JONES MODEL
• TAi,t/Ai,t-1 = αi[1/Ai,t-1] + β1i[ΔREVi,t - ΔRECi,t /Ai,t-1] +
β2i[PPEit/Ai,t-1] + εi,t
• Ai,t-1 = Total assets in year t - 1 for firm i;
• ΔREVi,t = Revenues in year t less revenues in year t - 1 for firm i;
• ΔRECi,t = Net receivables in year t less net receivables in year t -
1 for firm i;
• PPEi,t = Gross property, plant and equipment in year t for firm i;
• εi,t = Error term in year t for firm i.
• TAi,t is a dependent variable, and all other variable put into the equation are independent. Some variable such as αi,
εi,t are firm specific variable
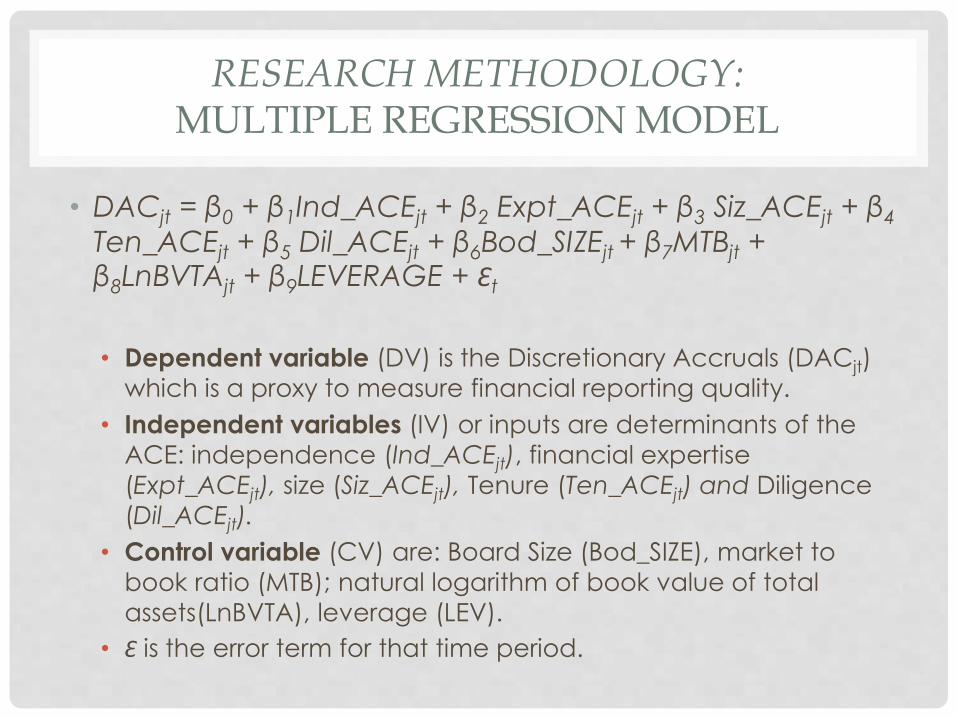
RESEARCH METHODOLOGY:MULTIPLE REGRESSION MODEL
• DACjt = β0 + β1Ind_ACEjt + β2 Expt_ACEjt + β3 Siz_ACEjt + β4
Ten_ACEjt + β5 Dil_ACEjt + β6Bod_SIZEjt + β7MTBjt + β8LnBVTAjt + β9LEVERAGE + Ɛt
• Dependent variable (DV) is the Discretionary Accruals (DACjt)
which is a proxy to measure financial reporting quality.
• Independent variables (IV) or inputs are determinants of the
ACE: independence (Ind_ACEjt), financial expertise
(Expt_ACEjt), size (Siz_ACEjt), Tenure (Ten_ACEjt) and Diligence
(Dil_ACEjt).
• Control variable (CV) are: Board Size (Bod_SIZE), market to
book ratio (MTB); natural logarithm of book value of total
assets(LnBVTA), leverage (LEV).
• Ɛ is the error term for that time period.
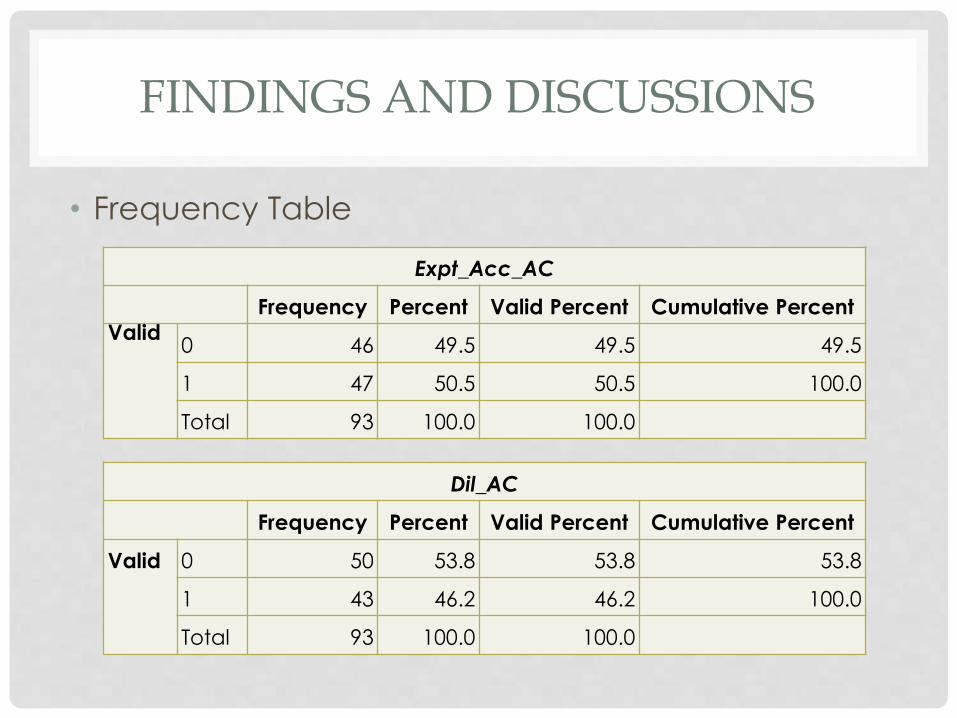
FINDINGS AND DISCUSSIONS
• Frequency Table
Expt_Acc_AC
Frequency Percent Valid Percent Cumulative Percent
Valid0 46 49.5 49.5 49.5
1 47 50.5 50.5 100.0
Total 93 100.0 100.0
Dil_AC
Frequency Percent Valid Percent Cumulative Percent
Valid 0 50 53.8 53.8 53.8
1 43 46.2 46.2 100.0
Total 93 100.0 100.0

FINDINGS AND DISCUSSIONS
• Descriptive Statistics
Size_AC Ind_AC_per AC_Ten Bod_Size MTB LnBVTA LEV
NValid 93 93 93 93 93 93 93
Missing 0 0 0 0 0 0 0
Mean 3.02 .6219 6.16091 5.43 2.7957 18.1398255 2.57280
Median 3.00 .6667 5.30639 5.00 1.7400 17.9247766 1.87000
Mode 3 1.00 1.370a 3 .00 13.20117a 1.040
Std. Deviation .921 .38806 4.035975 2.214 3.45763 2.35192525 3.992350
Variance .847 .151 16.289 4.900 11.955 5.532 15.939
Minimum 1 .00 .779 3 -5.49 13.20117 -.990
Maximum 6 1.00 22.037 12 17.87 23.42657 36.490
a. Multiple modes exist. The smallest value is shown
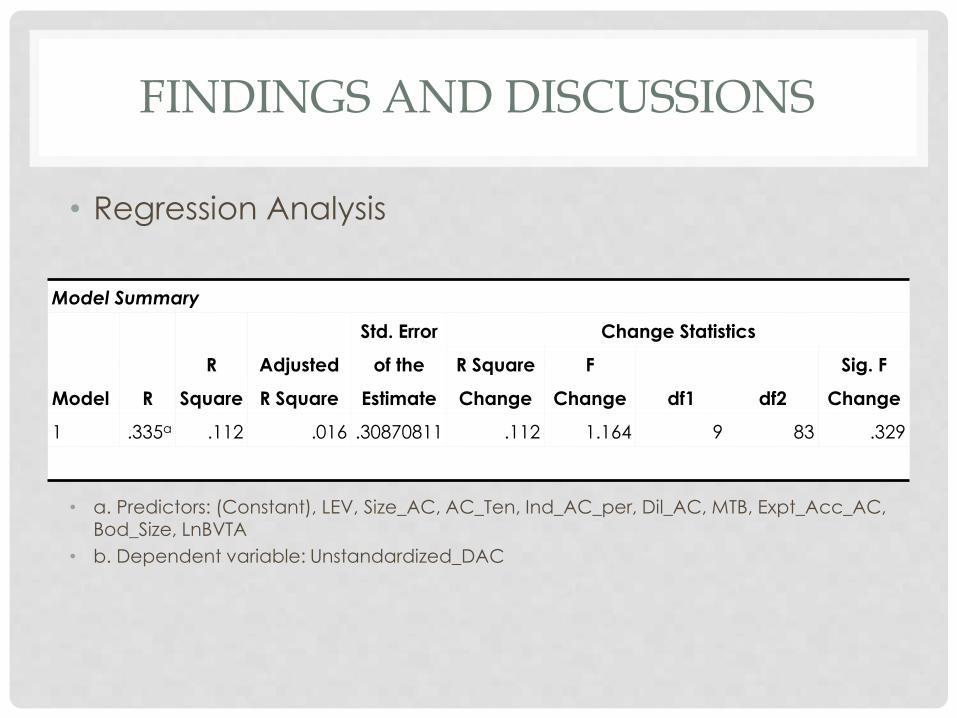
FINDINGS AND DISCUSSIONS
• Regression Analysis
• a. Predictors: (Constant), LEV, Size_AC, AC_Ten, Ind_AC_per, Dil_AC, MTB, Expt_Acc_AC, Bod_Size, LnBVTA
• b. Dependent variable: Unstandardized_DAC
Model Summary
Model R
R
Square
Adjusted
R Square
Std. Error
of the
Estimate
Change Statistics
R Square
Change
F
Change df1 df2
Sig. F
Change
1 .335a .112 .016 .30870811 .112 1.164 9 83 .329
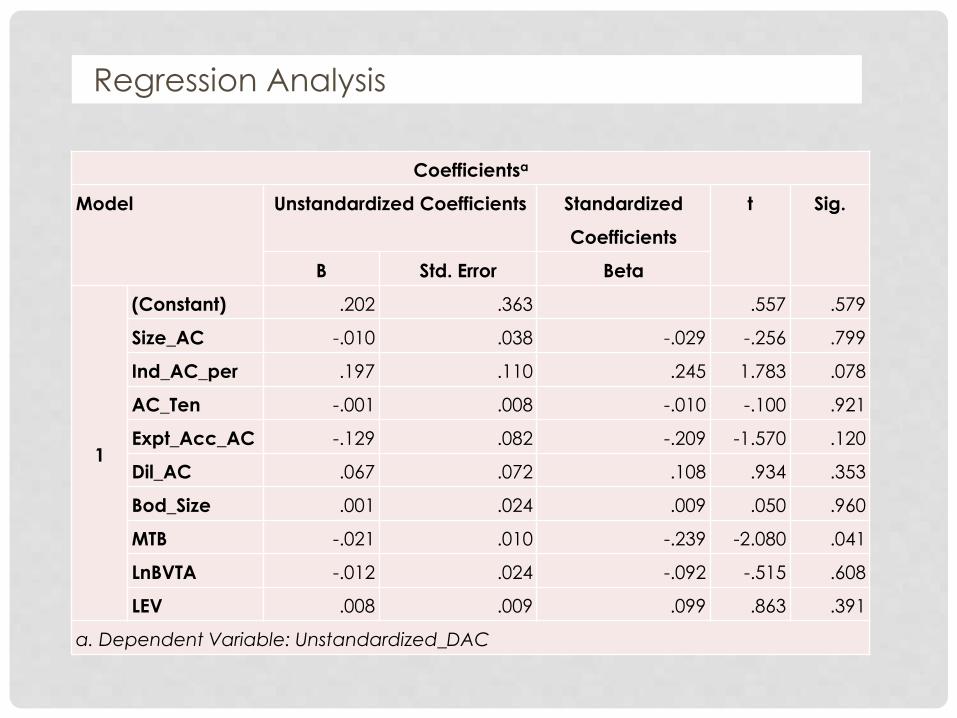
Regression Analysis
Coefficientsa
Model Unstandardized Coefficients Standardized
Coefficients
t Sig.
B Std. Error Beta
1
(Constant) .202 .363 .557 .579
Size_AC -.010 .038 -.029 -.256 .799
Ind_AC_per .197 .110 .245 1.783 .078
AC_Ten -.001 .008 -.010 -.100 .921
Expt_Acc_AC -.129 .082 -.209 -1.570 .120
Dil_AC .067 .072 .108 .934 .353
Bod_Size .001 .024 .009 .050 .960
MTB -.021 .010 -.239 -2.080 .041
LnBVTA -.012 .024 -.092 -.515 .608
LEV .008 .009 .099 .863 .391
a. Dependent Variable: Unstandardized_DAC
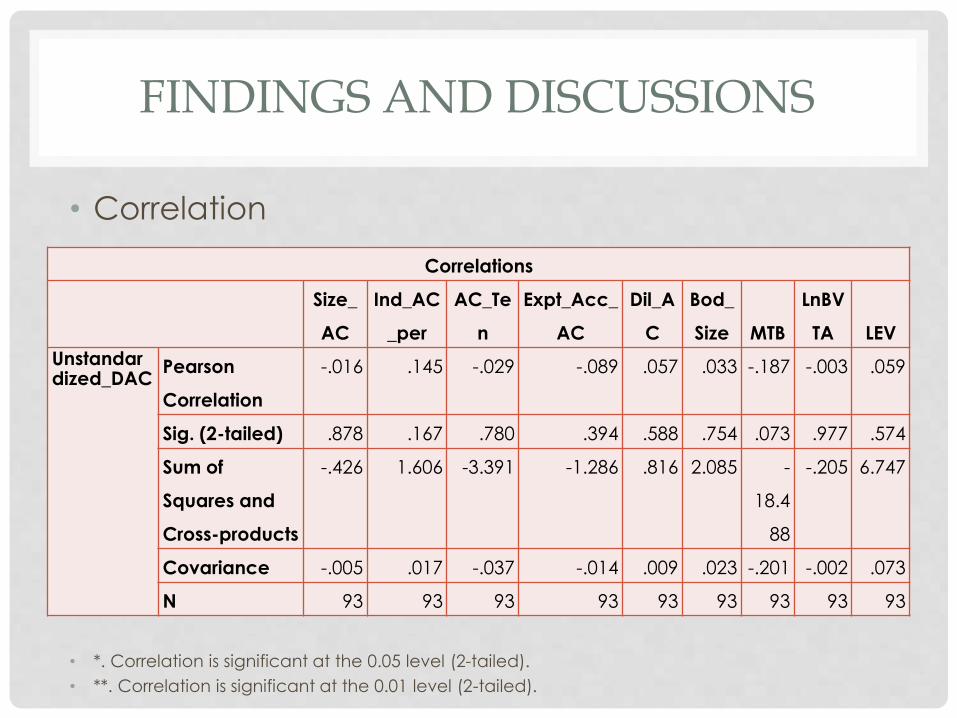
FINDINGS AND DISCUSSIONS
• Correlation
• *. Correlation is significant at the 0.05 level (2-tailed).
• **. Correlation is significant at the 0.01 level (2-tailed).
Correlations
Size_
AC
Ind_AC
_per
AC_Te
n
Expt_Acc_
AC
Dil_A
C
Bod_
Size MTB
LnBV
TA LEV
Unstandardized_DAC
Pearson
Correlation
-.016 .145 -.029 -.089 .057 .033 -.187 -.003 .059
Sig. (2-tailed) .878 .167 .780 .394 .588 .754 .073 .977 .574
Sum of
Squares and
Cross-products
-.426 1.606 -3.391 -1.286 .816 2.085 -
18.4
88
-.205 6.747
Covariance -.005 .017 -.037 -.014 .009 .023 -.201 -.002 .073
N 93 93 93 93 93 93 93 93 93
LIMITATIONS
• Data collection is limited to 110 ASX limited companies and of one year.
• The data for the variable to measure the ACE will be extracted from the annual reports in order to test the hypotheses, thus it limits the extent and type of data that can be collected.
• Few specific attributes is considered to examine the ACE whereas ACE is a multi-dimensional paradigm; and complete information about the AC work is not possible to derive.
SIGNIFICANCE
• This study established association between the ACE and
the FRQ thus it can be deduced the agency conflicts
can be resolved by presence of an ACE.
• Research methodology involves 5 determinants of the
ACE. Prior studies generally used combination of two or
three aforementioned determinants.
• Each of the determinant is separately tested as well which
determined the level of influence of each determinant.
• Can be used practically for CG purpose by the board of
directors in decision making purpose considering the
trends identified and implemented to improve the FRQ.

REFERENCE LIST
ASX Corporate Governance Council (2003), Principles of Good Corporate Governance and Best Practice
Recommendations, ASX Corporate Governance Council, Sydney.
ASX Corporate Governance Council (2007), Corporate Governance Principles and Recommendations, 2nd
ed., ASX Corporate Governance Council, Sydney.
Ball, R., Kothari, S. P., and Robin, A.(2000). The effect of institutional factors on properties of accounting
earnings. Journal of Accounting and Economics.
Blue Ribbon Committee (1999), “Report and recommendations of the blue ribbon committee on improving
the effectiveness of corporate audit committees”, The Business Lawyer, Vol. 54 No. 2, pp. 1067-95.
Cadbury Committee 1992, Report of The Committee on the Financial Aspects of Corporate Governance.
DeZoort, F. T, Dana R. Hermanson, Deborah S. Archambeault, and Scott A. Reed. "Audit Committee
Effectiveness: A Synthesis of the Empirical Audit Committee Literature." [In English]. Journal of
Accounting Literature 21 (2002): 38-75.
Goodwin, J. (2003). The relationship between the audit committee and the internal audit function: Evidence
from Australia and New Zealand. International Journal of Auditing.
Jeon, K., Choi, J. and Park, J. 2004, 'The relationship between new audit committee establishment and
earnings management', Korean Accounting Review, vol. 29, no. 1, pp. 143-178

Klein, A. 2002b, 'Economic determinants of audit committee independence', The Accounting Review, vol. 77,
no. 2, pp. 435-452.
KPMG, 1999. Shaping the Audit Committee Agenda, KPMG, Montvale, NJ.
Price Waterhouse 1993, Improving Audit Committee Performance: What Works Best. Institute of Internal
Auditors Research Foundation, Altamonte Springs.
Wild, J. 1994, 'The audit committee and earnings quality', Journal of Accounting Auditing and Finance, vol.
22, no. 1, pp. 247-276.
Xie, B., Davidson, W. and DaDalt, P. 2003, 'Earnings management and corporate governance: the role of the
board and the audit committee', Journal of Corporate Finance, vol. 9, no. 3, pp. 295-316
REFERENCE LIST

THE END
QUEST ION AND ANSWERS???