Audiences and Economic Indicators SPOTLIGHT ON CANADIAN DOCUMENTARIES Prepared for the Documentary...
34
Audiences and Economic Indicators SPOTLIGHT ON CANADIAN DOCUMENTARIES Prepared for the Documentary Policy Advisory Group
-
Upload
nathan-collins -
Category
Documents
-
view
218 -
download
1
Transcript of Audiences and Economic Indicators SPOTLIGHT ON CANADIAN DOCUMENTARIES Prepared for the Documentary...

Audiences and Economic Indicators
SPOTLIGHT ON CANADIAN
DOCUMENTARIES
Prepared for the Documentary Policy Advisory Group

Canadian Documentaries:Economic Indicators:•Recoupment
•Sales
•Branding
•Jobs
Reaching Audiences:•Feature Film
•Non-Theatrical
•Television

Economic Indicators
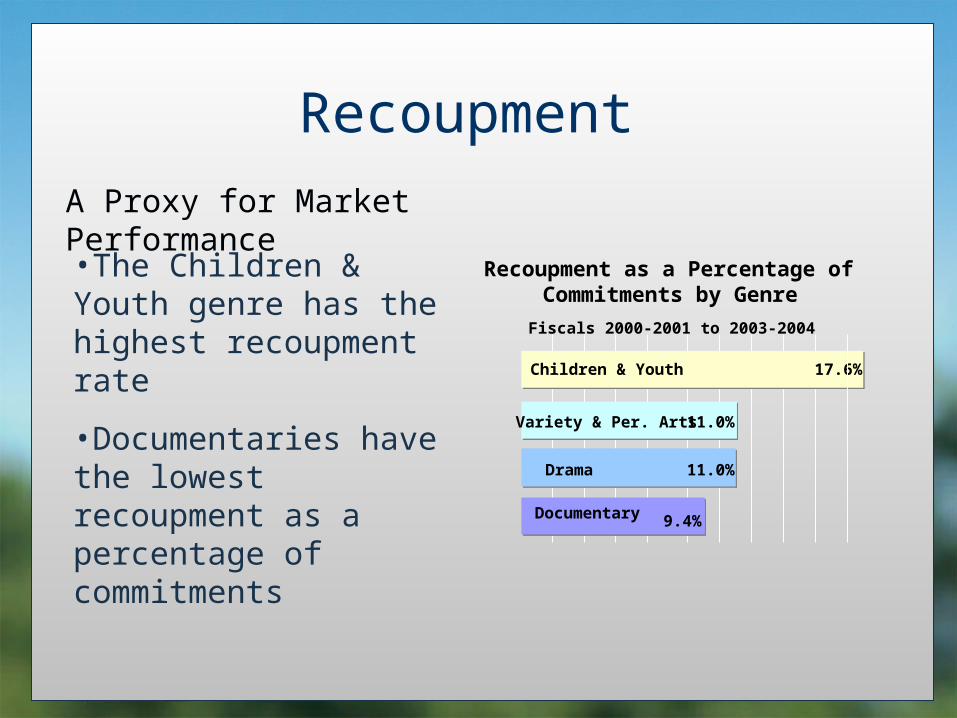
Recoupment
•The Children & Youth genre has the highest recoupment rate
•Documentaries have the lowest recoupment as a percentage of commitments
Recoupment as a Percentage of Commitments by Genre
Fiscals 2000-2001 to 2003-2004
9.4%
11.0%
11.0%
17.6%
Documentary
Drama
Variety & Per. Arts
Children & Youth
A Proxy for Market Performance

Recoupment
•The on-going series sub-format has the highest recoupment rate with almost 11 percent of the commitment amount
•Mini-series have the lowest recoupment rate
Fiscals 1995-1996 to 2001-2002
3.2%
4.6%
10.9%
Mini-series One-off Series
Recoupment as a Percentage of Commitments by Genre
A Proxy for Market Performance

Sales
Canadian Sales30%
ForeignSales70%
Total Sales for 35 Projects
•Total sales of 35 documentary projects supported by Telefilm and the NFB* after financing were almost $5 million
•30% of the sales after financing took place in the Canadian market and 70% in international markets
• The most profitable Canadian documentaries have export capacity.
*Most profitable documentaries from 1998-1999

Sales
$157,584
$97,649
English Projects
French Projects
Average Sales per Project by Language of Production
•Of the 35 NFB and Telefilm projects, twenty-five were produced in English and ten were produced in French
•English-language projects had about 61% higher dollar-sales-per-project than the French-language productions
Sales
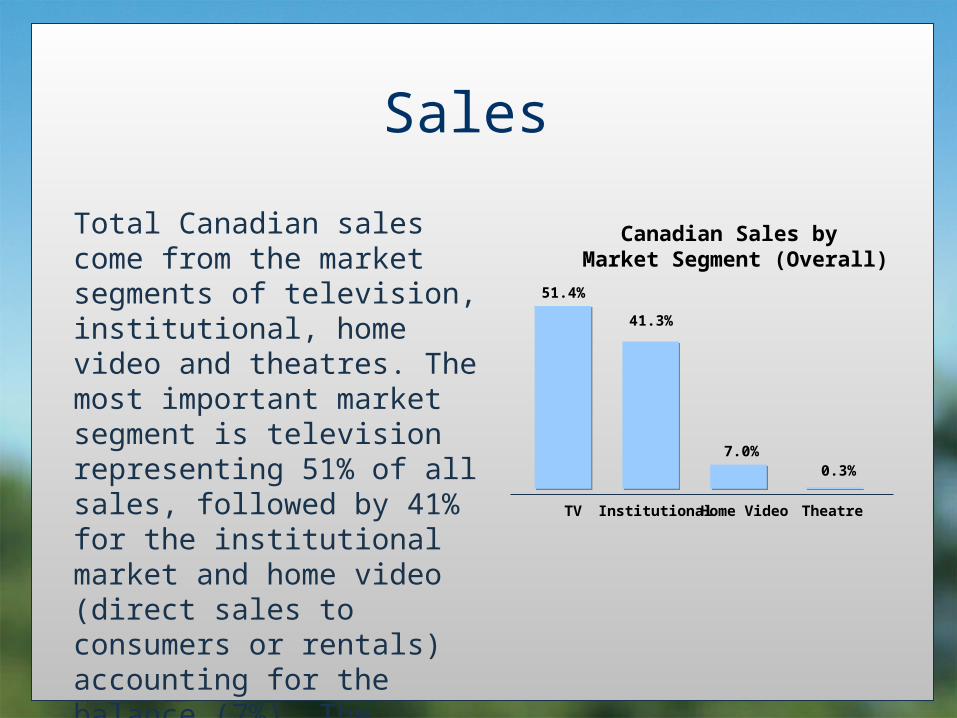
Total Canadian sales come from the market segments of television, institutional, home video and theatres. The most important market segment is television representing 51% of all sales, followed by 41% for the institutional market and home video (direct sales to consumers or rentals) accounting for the balance (7%). The receipts from the theatrical market are marginal
51.4%
41.3%
7.0%0.3%
TV Institutional Home Video Theatre
Canadian Sales by Market Segment (Overall)
Sales
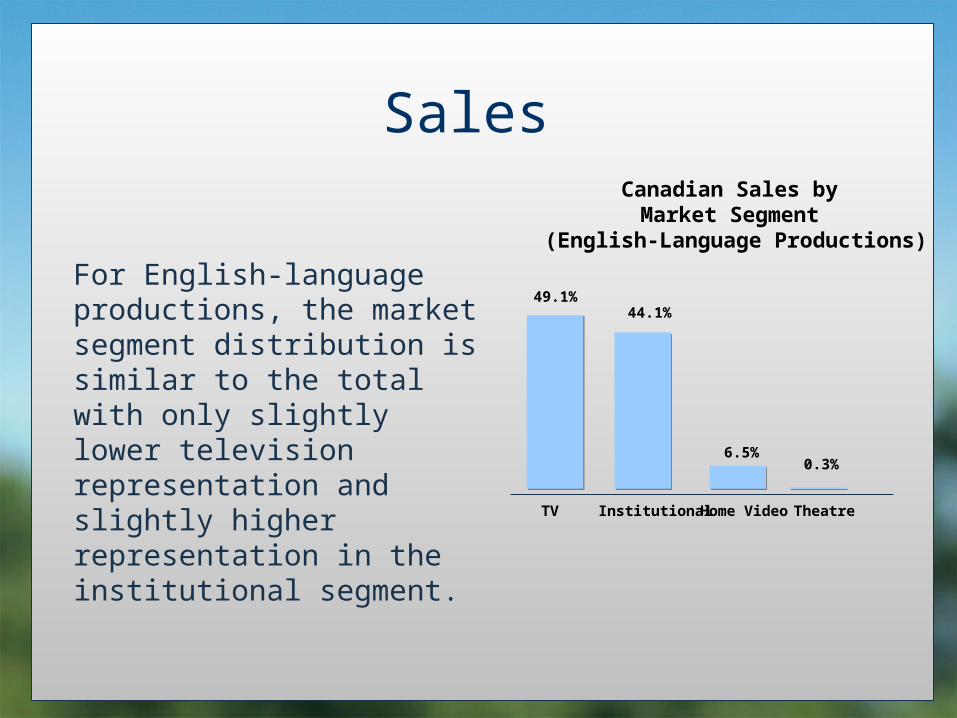
For English-language productions, the market segment distribution is similar to the total with only slightly lower television representation and slightly higher representation in the institutional segment.
49.1%44.1%
6.5%0.3%
TV Institutional Home Video Theatre
Canadian Sales by Market Segment
(English-Language Productions)
Sales
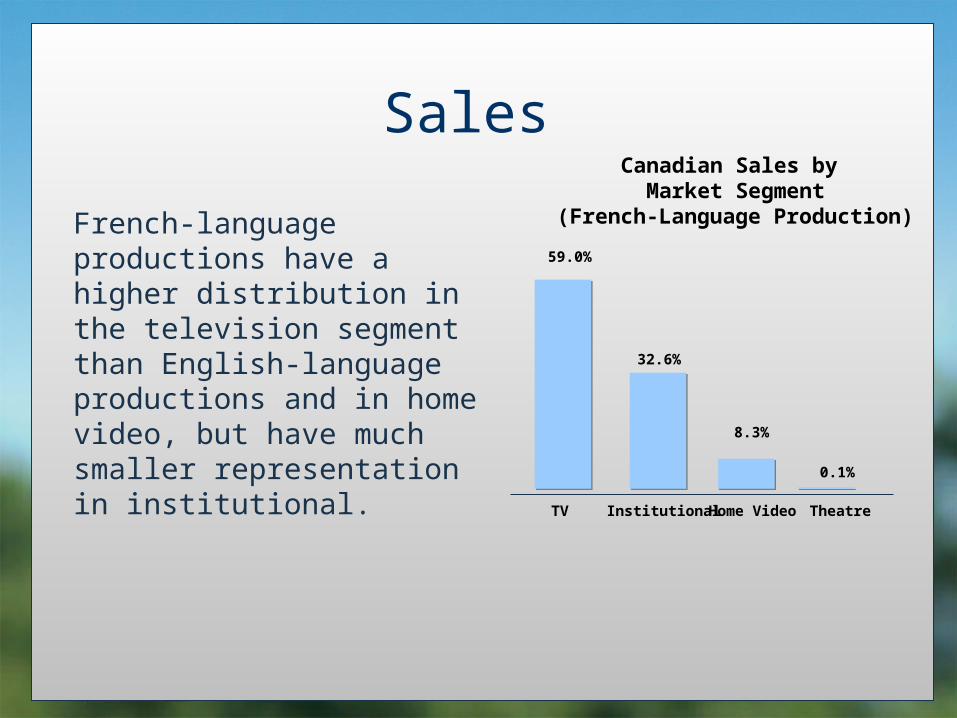
French-language productions have a higher distribution in the television segment than English-language productions and in home video, but have much smaller representation in institutional.
59.0%
32.6%
8.3%
0.1%
TV Institutional Home Video Theatre
Canadian Sales by Market Segment
(French-Language Production)
Sales
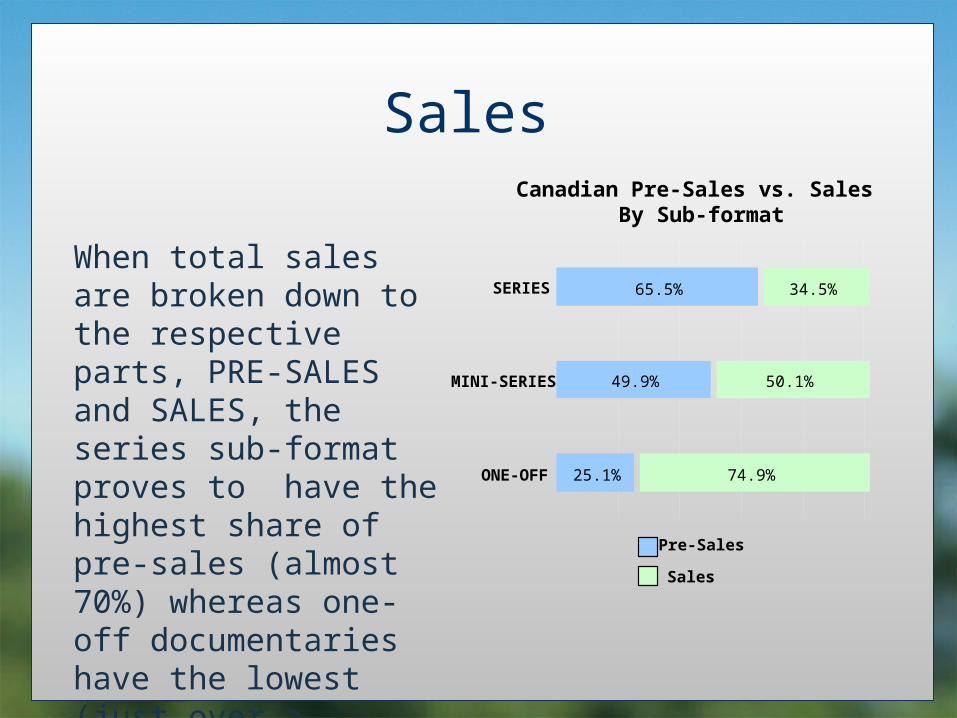
When total sales are broken down to the respective parts, PRE-SALES and SALES, the series sub-format proves to have the highest share of pre-sales (almost 70%) whereas one-off documentaries have the lowest (just over a quarter).
Canadian Pre-Sales vs. Sales By Sub-format
25.1%
49.9%
65.5%
74.9%
50.1%
34.5%
ONE-OFF
MINI-SERIES
SERIES
Pre-Sales
Sales

Sales
TV82.2%
Institutional17.8%
TV34.8%
Institutional54.0%
Home Video10.7%
Theatres0.4%
Canadian Sales by Market Segment
Telefilm Canada The National Film Board
Sales
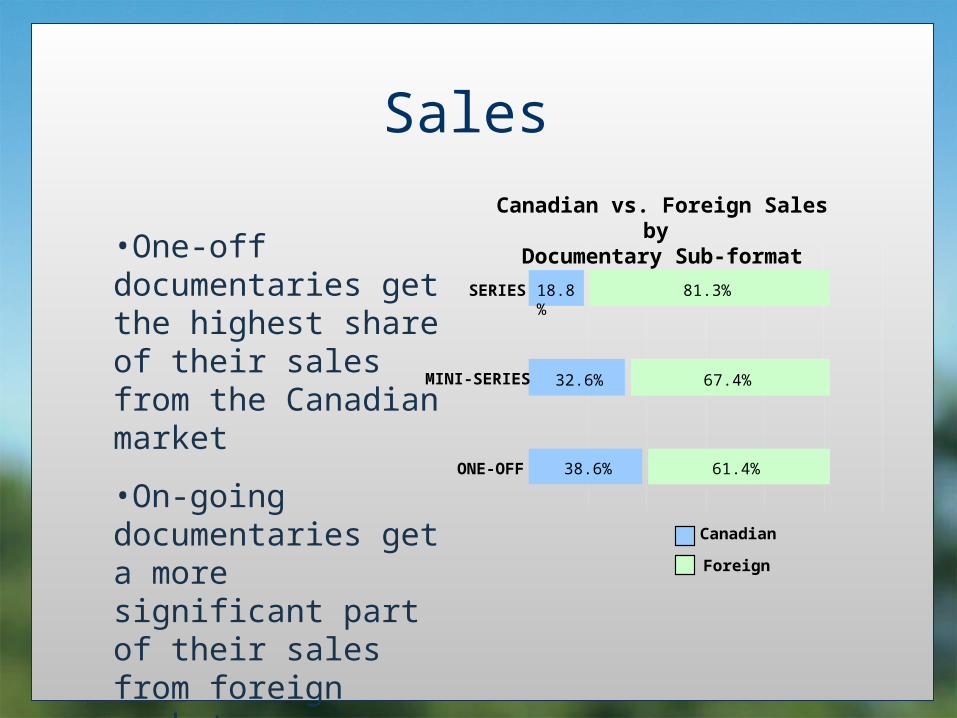
38.6%
32.6%
18.8%
61.4%
67.4%
81.3%
ONE-OFF
MINI-SERIES
SERIES
Canadian
Foreign
•One-off documentaries get the highest share of their sales from the Canadian market
•On-going documentaries get a more significant part of their sales from foreign markets
Canadian vs. Foreign Sales by Documentary Sub-format

Branding
Range of Rates (30 sec spot) for Canadian Documentaries Compared to other programs
$360.00
$21,620.00
$38,970.00
$76,990.00
Documentaries - High end of range
Corner Gas
Law & Order SVU
American Idol Finale
Range of Costs per Thousand for Canadian DocumentariesCompared to other programs
$12.69
$40.32
$57.40
Documentaries – High end of range
CSI
The OC
An analysis of rates for 30 second spots as well as cost-per-thousands among major Canadian network show that they are
valued much lower than other popular prime time programs

Branding Canadian specialty services place a higher premium on the
brand of documentary programming. Of a sub-set of relevant specialty services, 21 percent of their advertising revenue is
generated by documentary. Only three percent is generated on the conventional national networks.
24.49%
3%
Specialty Services
ConventionalNetworks
Portion of Advertising Revenue generated by documentary programming
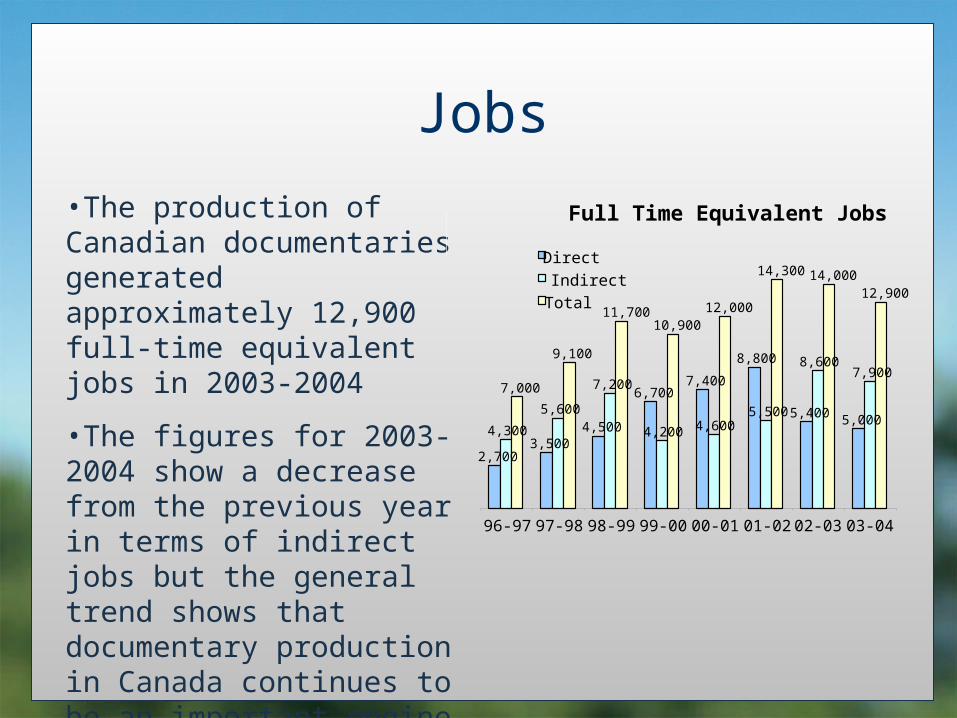
Jobs•The production of Canadian documentaries generated approximately 12,900 full-time equivalent jobs in 2003-2004
•The figures for 2003-2004 show a decrease from the previous year in terms of indirect jobs but the general trend shows that documentary production in Canada continues to be an important engine for the creation of Canadian jobs
Full Time Equivalent Jobs
2,7003,500
4,500
6,7007,400
8,800
5,400 5,0004,300
5,600
7,200
4,200 4,6005,500
8,6007,900
7,000
9,100
11,70010,900
12,000
14,300 14,00012,900
96-97 97-98 98-99 99-00 00-01 01-02 02-03 03-04
Direct
Indirect
Total

Audiences and Economic Indicators
SPOTLIGHT ON CANADIAN
DOCUMENTARIES
Prepared for the Documentary Policy Advisory Group

Reaching Audiences
Feature Film
Trends
Documentary Box Office
($000s)
0
5,000
10,000
15,000
20,000
25,000
30,000
2002 2003 2004
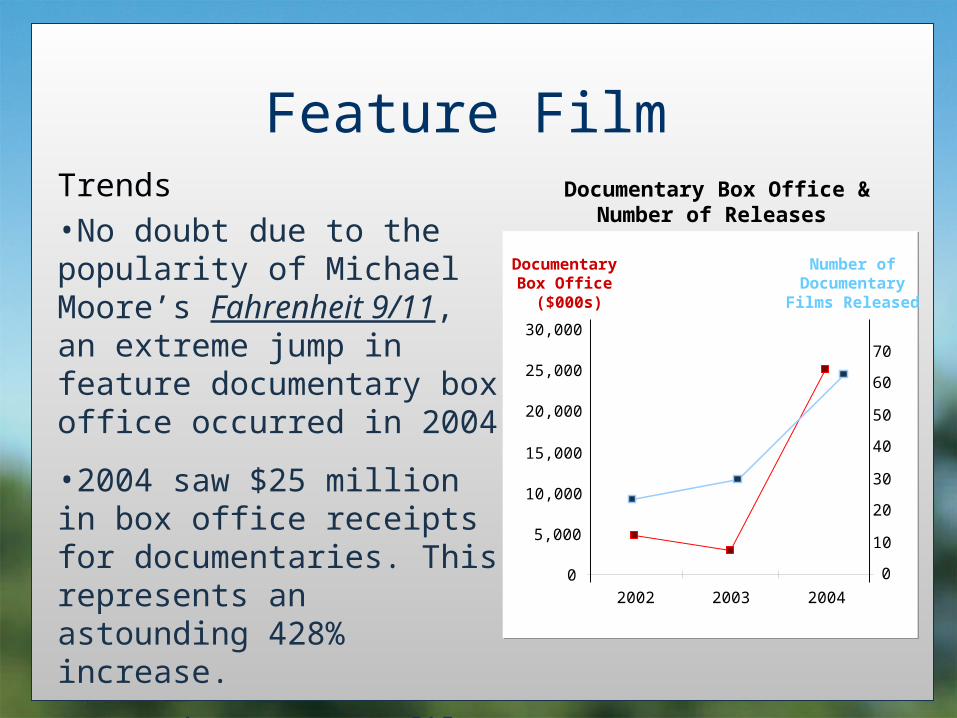
•No doubt due to the popularity of Michael Moore’s Fahrenheit 9/11, an extreme jump in feature documentary box office occurred in 2004
•2004 saw $25 million in box office receipts for documentaries. This represents an astounding 428% increase.
•More documentary films were released in 2004 than in 2002 and 2003 combined
Number of Documentary
Films Released
0
10
20
30
40
50
60
70
Documentary Box Office &Number of Releases

Feature Film
Trends
Average Feature Film Shelf Life (in weeks)
0
2
4
6
8
10
12
14
2002 2003 2004
Documentaries Fiction
•Feature documentaries are remaining in theatres a lot longer than they use to
•Feature documentaries are increasing their screen longevity at the same time, fiction films are proving to have a shorter shelf life.

Feature Film
Canadian Documentaries
•Similar to overall documentary growth, Canadian-made feature documentaries exhibited a startling growth in box office for 2004
•In 2004, Canadian documentaries accounted for over $2 million dollars in box office sales compared to $145,000 for the previous year
Canadian Documentary Box
Office ($000s)
0
500
1000
1500
2000
2500
2002 2003 2004
Feature Film
Canadian Documentaries
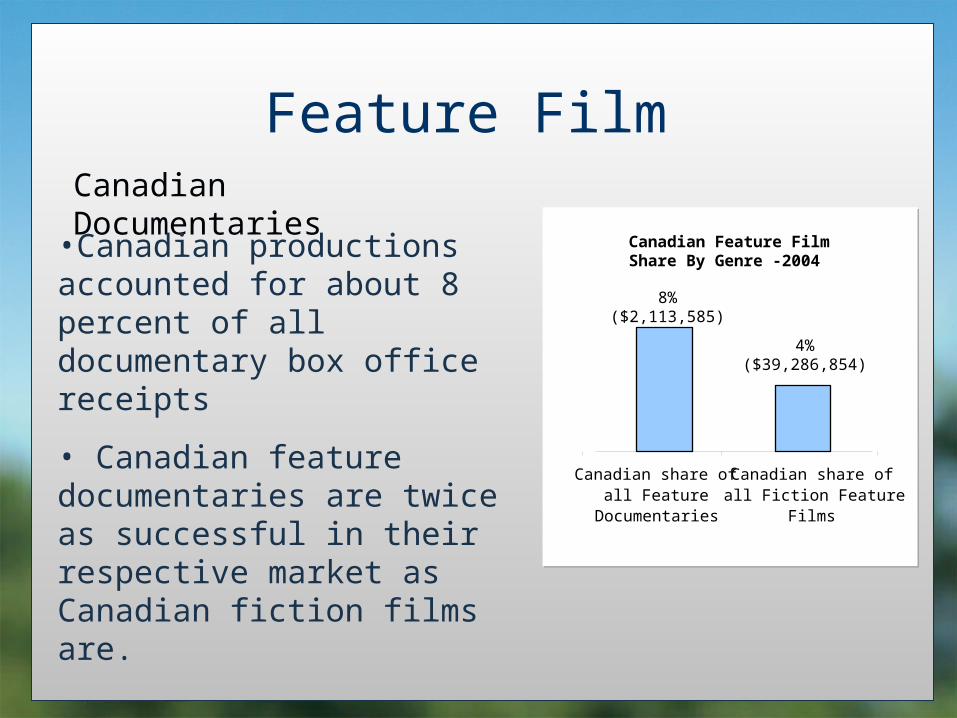
•Canadian productions accounted for about 8 percent of all documentary box office receipts
• Canadian feature documentaries are twice as successful in their respective market as Canadian fiction films are.
Canadian Feature Film Share By Genre -2004
8%($2,113,585)
4%($39,286,854)
Canadian share ofall Feature
Documentaries
Canadian share ofall Fiction Feature
Films
Feature Film
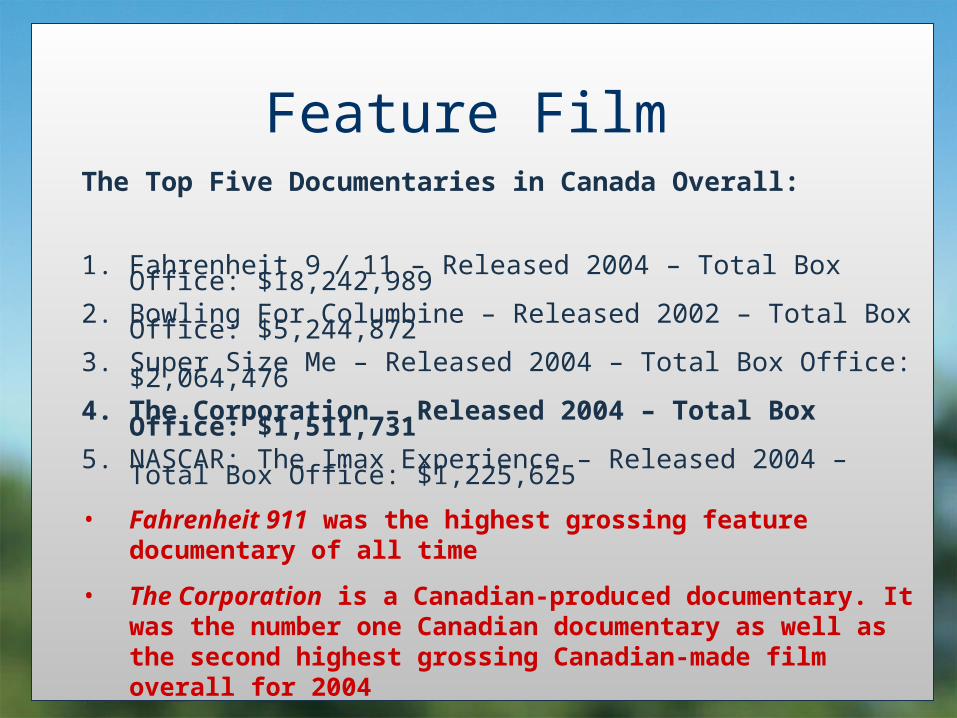
The Top Five Documentaries in Canada Overall:
1. Fahrenheit 9 / 11 – Released 2004 – Total Box Office: $18,242,9892. Bowling For Columbine – Released 2002 – Total Box Office: $5,244,872 3. Super Size Me – Released 2004 – Total Box Office: $2,064,4764. The Corporation – Released 2004 – Total Box Office: $1,511,7315. NASCAR: The Imax Experience – Released 2004 – Total Box Office: $1,225,625
• Fahrenheit 911 was the highest grossing feature documentary of all time
• The Corporation is a Canadian-produced documentary. It was the number one Canadian documentary as well as the second highest grossing Canadian-made film overall for 2004
• The highest grossing French-language Canadian documentary was Ce Qu’il Reste de Nous. It took seventh place overall with over $300,000 at the box office

Non-Theatrical
Colleges & Universities
SchoolsLibraries
Non-Theatrical Markets – Up to the Early 1990s - Generalized

Non-Theatrical
Educational & Specialty
TV
Social Services Agencies
Community Associations
Multimedia
Health
Home Video
Business & Industry
Non-theatrical Market – Early 1990s to Present - Specialised
Non-Theatrical
Diversity and reach of the non-theatrical sector
Diverse audiences are being reached at home, at the workplace and in the educational milieu
Example: The National Film Board
•Libraries - over the last five years - almost 1 million documentaries in loans and rentals•Educational milieu- almost 400,000 documentaries sold
More research is required to measure this consumption in the future

Television
Share of all TV Hours Tuned
Foreign-Produced
52%
Canadian-Produced
48%
Source: BBM National Meter Service, Weeks 1-26, 2003-2004 Broadcast Year
•Canadians consumed over 14 billion hours of television during the first half of the 2003-2004 broadcast season
•Of all that viewing, a slim majority (52%) was to foreign programming
Overview

Television Trends•In both English and French markets, there have been significant increases in documentary programming AVAILABLILITY on television
•Despite the increase in availability, consumption has been relatively flat – no increase at all in the English market, and a slight increase in the French market
English-Language
Documentary Programming Supply vs. Viewing (hours/week/person)
Supply Viewing
French-Language
1996/97 1998/99 2000/01 2002/03
1996/97 1998/99 2000/01 2002/03
Source: CBC Research/Nielsen Media 1996-2003 Primetime
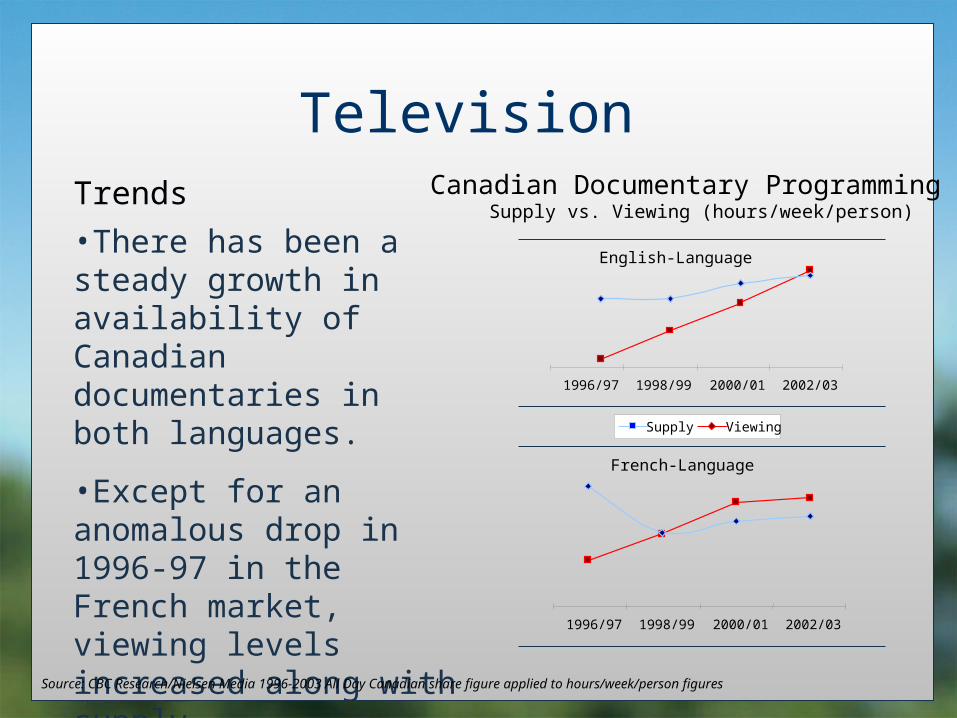
Television Trends•There has been a steady growth in availability of Canadian documentaries in both languages.
•Except for an anomalous drop in 1996-97 in the French market, viewing levels increased along with supply.
Source: CBC Research/Nielsen Media 1996-2003 All Day Canadian share figure applied to hours/week/person figures
English-Language
Canadian Documentary Programming Supply vs. Viewing (hours/week/person)
Supply Viewing
French-Language
1996/97 1998/99 2000/01 2002/03
1996/97 1998/99 2000/01 2002/03
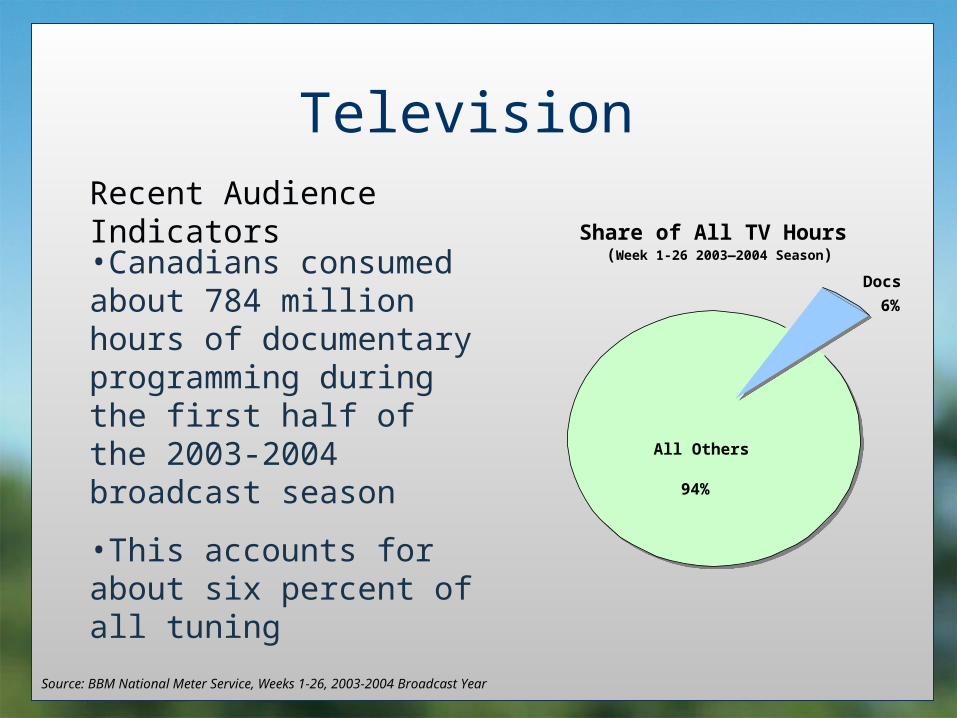
Television Recent Audience Indicators
•Canadians consumed about 784 million hours of documentary programming during the first half of the 2003-2004 broadcast season
•This accounts for about six percent of all tuning
Source: BBM National Meter Service, Weeks 1-26, 2003-2004 Broadcast Year
Share of All TV Hours (Week 1-26 2003—2004 Season)
All Others
94%
Docs
6%
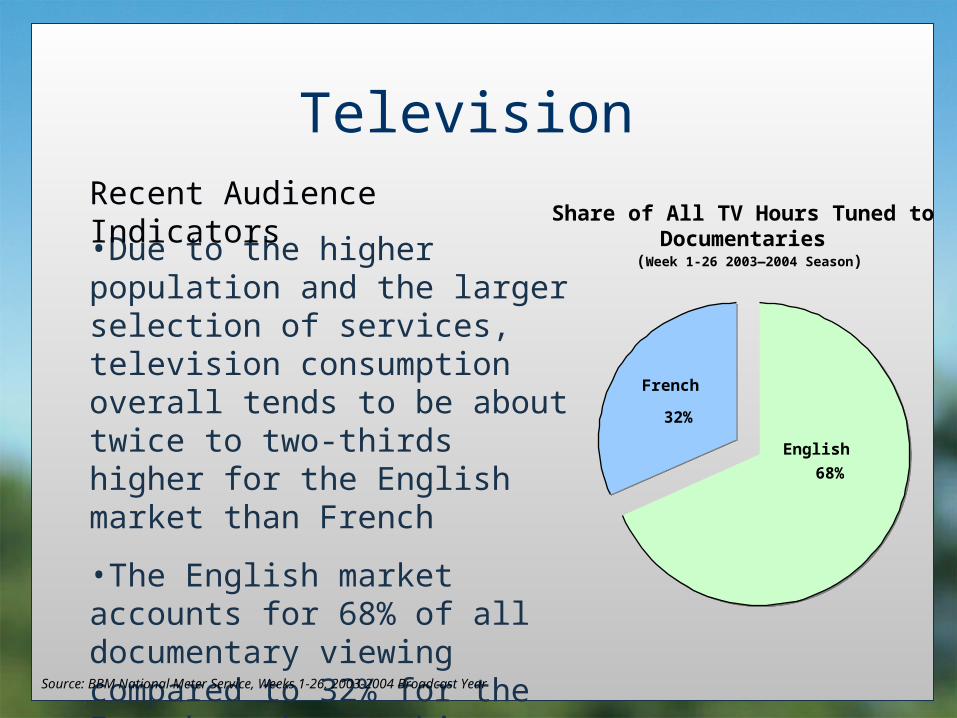
Television
Share of All TV Hours Tuned to Documentaries
(Week 1-26 2003—2004 Season)
English
68%
French
32%
•Due to the higher population and the larger selection of services, television consumption overall tends to be about twice to two-thirds higher for the English market than French
•The English market accounts for 68% of all documentary viewing compared to 32% for the French market – this indicates that the language markets have an equal interest in documentaries
Recent Audience Indicators
Source: BBM National Meter Service, Weeks 1-26, 2003-2004 Broadcast Year
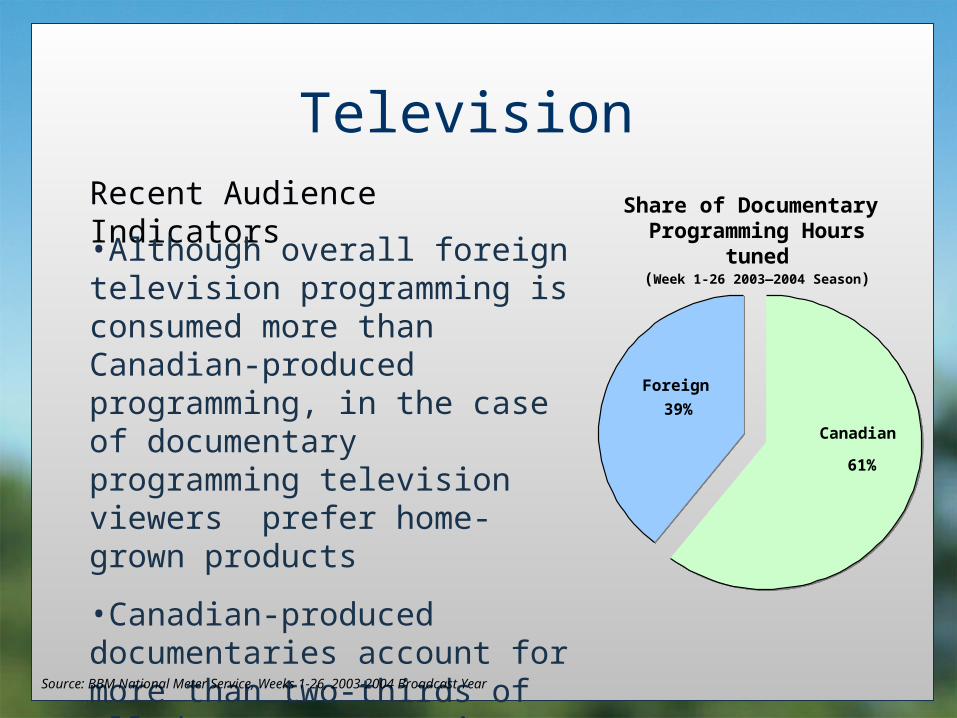
Television Share of Documentary
Programming Hours tuned(Week 1-26 2003—2004 Season)
Canadian
61%
Foreign
39%
Recent Audience Indicators
•Although overall foreign television programming is consumed more than Canadian-produced programming, in the case of documentary programming television viewers prefer home-grown products
•Canadian-produced documentaries account for more than two-thirds of all documentary tuning on television
Source: BBM National Meter Service, Weeks 1-26, 2003-2004 Broadcast Year

Television Recent Audience Indicators
•The on-going series sub-format accounts for the majority of hours tuned to documentary programming
•However, the distribution of TUNING almost exactly matches the distribution of AVAILABILITY which suggests that the sub-formats are equally appealing to Canadians
Source: BBM National Meter Service, Weeks 1-26, 2003-2004 Broadcast Year
Sub-Format Share of all Viewing to
Canadian Documentary Programming
Miniseries
4% One off
14%
Series
82%

Television Recent Audience Indicators
•CUMULATIVELY, on-going series account for the most viewing, but one-offs and mini-series tend to have higher SINGLE-VIEW AUDIENCES.The top five single-airing audiences for documentaries were all one-offs or mini-series.
Source: BBM National Meter Service, Weeks 1-26, 2003-2004 Broadcast Year
Documentary Programming - Sept 2003 to Feb 2004
Program Ntwrk. CountryInd.2+ AMA
(000)EnglishBorn Rich CTV Foreign 1,263.1City Of Ruins CBC Canada 964.5Behind The Lens:Prime Suspect Pt. 2 CBC Canada 791.4Documentaries CTV Canada 733.6Asteroid! The Doomsday Rock CBC Canada 727.3
FrenchCéline Dion: 1 fille & 4 types TVA Canada 1545.1Wilfred Le Bouthillier TVA Canada 842.17 mensonges de George Bush TVA Other 805.5À hauteur d'homme SRC Canada 762.6SP: Marc Dupré TVA Canada 650.4