Audience segmentation to improve the targeting of hunters ...
32
This article has been accepted for publication and undergone full peer review but has not been through the copyediting, typesetting, pagination and proofreading process, which may lead to differences between this version and the Version of Record. Please cite this article as doi: 10.1111/cobi.13275. This article is protected by copyright. All rights reserved. Audience segmentation to improve the targeting of hunters by conservation interventions around Gola forest, Liberia Sorrel Jones 1* , Aidan Keane 2 , Freya St John 3 , Juliet Vickery 4 , Sarah Papworth 1 1 School of Biological Sciences, Royal Holloway, University of London, Egham, Surrey, TW20 0EX, U.K. 2 School of GeoSciences, University of Edinburgh, Edinburgh EH9 3JW, U.K. 3 School of Environment, Natural Resources and Geography, Bangor University, Deiniol Road, Bangor LL57 2UW, U.K. 4 Royal Society for the Protection of Birds, The Lodge, Sandy, Bedfordshire SG19 2DL, U.K. *email [email protected] Running head: Audience segmentation Keywords: conservation marketing, bushmeat; Gola Forest; livelihood support; target audience; West Africa, hunting Article Impact Statement Audience segmentation defines hunter groups for conservation intervention. brought to you by CORE View metadata, citation and similar papers at core.ac.uk provided by Royal Holloway - Pure
Transcript of Audience segmentation to improve the targeting of hunters ...
This article has been accepted for publication and undergone full peer review but has not been
through the copyediting, typesetting, pagination and proofreading process, which may lead to
differences between this version and the Version of Record. Please cite this article as doi:
10.1111/cobi.13275.
This article is protected by copyright. All rights reserved.
Audience segmentation to improve the targeting of hunters by conservation interventions around Gola
forest, Liberia
Sorrel Jones1*
, Aidan Keane2, Freya St John
3, Juliet Vickery
4, Sarah Papworth
1
1 School of Biological Sciences, Royal Holloway, University of London, Egham, Surrey, TW20 0EX,
U.K.
2 School of GeoSciences, University of Edinburgh, Edinburgh EH9 3JW, U.K.
3 School of Environment, Natural Resources and Geography, Bangor University, Deiniol Road,
Bangor LL57 2UW, U.K.
4 Royal Society for the Protection of Birds, The Lodge, Sandy, Bedfordshire SG19 2DL, U.K.
*email [email protected]
Running head: Audience segmentation
Keywords: conservation marketing, bushmeat; Gola Forest; livelihood support; target audience; West
Africa, hunting
Article Impact Statement
Audience segmentation defines hunter groups for conservation intervention.
brought to you by COREView metadata, citation and similar papers at core.ac.uk
provided by Royal Holloway - Pure
This article is protected by copyright. All rights reserved.
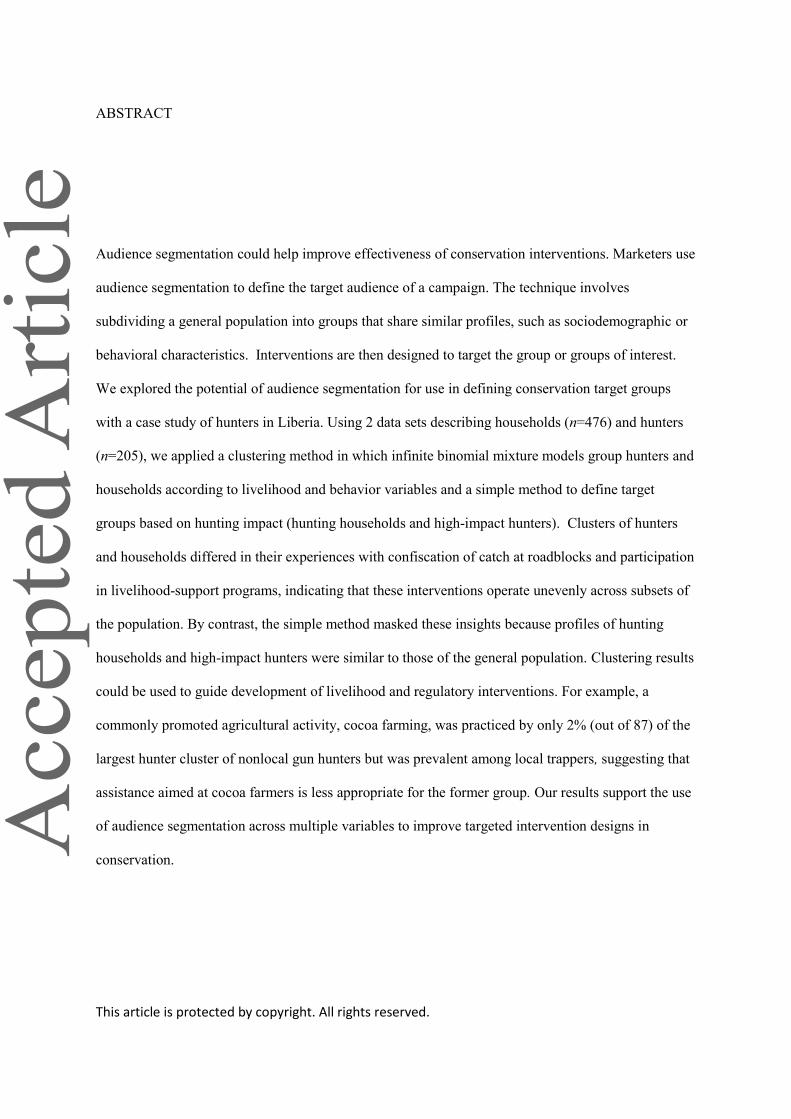
ABSTRACT
Audience segmentation could help improve effectiveness of conservation interventions. Marketers use
audience segmentation to define the target audience of a campaign. The technique involves
subdividing a general population into groups that share similar profiles, such as sociodemographic or
behavioral characteristics. Interventions are then designed to target the group or groups of interest.
We explored the potential of audience segmentation for use in defining conservation target groups
with a case study of hunters in Liberia. Using 2 data sets describing households (n=476) and hunters
(n=205), we applied a clustering method in which infinite binomial mixture models group hunters and
households according to livelihood and behavior variables and a simple method to define target
groups based on hunting impact (hunting households and high-impact hunters). Clusters of hunters
and households differed in their experiences with confiscation of catch at roadblocks and participation
in livelihood-support programs, indicating that these interventions operate unevenly across subsets of
the population. By contrast, the simple method masked these insights because profiles of hunting
households and high-impact hunters were similar to those of the general population. Clustering results
could be used to guide development of livelihood and regulatory interventions. For example, a
commonly promoted agricultural activity, cocoa farming, was practiced by only 2% (out of 87) of the
largest hunter cluster of nonlocal gun hunters but was prevalent among local trappers, suggesting that
assistance aimed at cocoa farmers is less appropriate for the former group. Our results support the use
of audience segmentation across multiple variables to improve targeted intervention designs in
conservation.
This article is protected by copyright. All rights reserved.
INTRODUCTION
Conservation practitioners are frequently faced with the challenge of influencing human behavior and
must make choices about which approach to use in any given site. Conservation interventions are
typically implemented using a combination of actions that require managers to make site-specific
decisions about which to use. Such decisions should be based on a clear understanding of who the
action intends to influence (Veríssimo 2013; Reddy et al. 2017) given that different types of people
are likely to be responsive to different mechanisms (Kotler & Lee 2008). An appropriately defined
target group is therefore fundamental to guide intervention design, yet many projects either fail to
specify who they aim to influence or employ a broad definition such as all residents within a
geographic area (Spiteri & Nepal 2006). As a result, intervention designs may be broadly aimed at an
average person across an entire community, which is inefficient if the population is comprised of
heterogeneous groups responding differently to interventions (Agrawal & Gibson 1999; Wright et al.
2015). Intervention designs may be improved by paying greater attention to the process and methods
of defining target groups.
Techniques from marketing may be well suited to improve the way target groups are defined in
conservation. Audience segmentation is a commonly used approach of subdividing populations into
groups with shared characteristics, such as sociodemographic, behavioral, or psychographic profiles
(Wedel & Kamakura 2012). Ideally, segmentation defines groups of individuals who can be expected
to respond similarly to interventions, allowing managers to design approaches that are oriented to
target the specific group or groups of interest (Kotler & Lee 2008). Effective segmentation depends
on selecting appropriate characteristics for defining groups (Wedel & Kamakura 2012). These should
be variables linked to behavior and which have practical consequences for management decisions.
This article is protected by copyright. All rights reserved.
Attributes most commonly used in marketing include broad demographic, socioeconomic and
geographic factors, but increasingly focus is on individual traits, such as personality, attitudes, beliefs,
lifestyle, risk preference, and social group affiliations (Lee et al. 2014; Hardcastle & Hagger 2016).
Segmentation has rarely been applied in conservation, but it is a valuable tool in social marketing
(Kotler & Lee 2008). For example, segmentation has been used to design public health campaigns
that target those most at risk (Forthofer & Bryant 2000; Dietrich et al. 2015) or most likely to be
responsive to interventions (Rimal et al. 2009). Key environmental problems, such as climate change,
energy use, transport, and sustainable lifestyle choices, have also been the subject of segmentation
studies to guide policy and messaging campaigns (Anable 2005; Maibach et al. 2011; McKenzie-
Mohr et al. 2011; Poortinga & Darnton 2016). In a rare example of segmentation in conservation,
Zabala et al. (2017) applied the approach to guide the introduction of conservation-friendly farming
practices in Mexico by using attitude statements of farmers to define groups of early adopters and
followers. Harrison et al (2015) also used a straightforward segmentation of authorised versus
unauthorised resource users to generate valuable management insight in a Ugandan protected area.
There are currently no methodological guidelines to inform the process of defining target groups in
conservation, despite this being of great practical interest to managers. Methods used within
marketing to subdivide populations range from the relatively simplistic approach of splitting
populations according to single variables, to more complex clustering approaches that differentiate
groups across multiple variables (Wedel & Kamakura 2012). A major challenge in conservation is the
gap in understanding of factors that underpin behavior. Detailed psychographic data sets of the sort
used in marketing studies are rarely available or difficult to obtain where target behaviors are illegal
(Gavin et al. 2010). Given these typical constraints, segmentation based on multiple variables may
This article is protected by copyright. All rights reserved.
perform little better than simplistic target group definitions based on a single trait, such as whether or
not someone hunts. Multivariate methods may have higher costs associated with data collection and
analysis, so a practical management consideration is whether these costs are justified by improved
conservation outcomes.
We evaluated segmentation approaches with a case study of bushmeat hunting in the Gola Forest,
Liberia. Hunting reduction is a conservation priority for many sites across the tropics (Cronin et al.
2017; Benítez-López et al. 2017). However, bushmeat provides a valuable source of food and income
for rural populations who are often economically vulnerable (e.g. Fa et al. 2003). Therefore, many
hunting reduction programs have a human welfare element (Davies 2002), and interventions generally
fall into 5 categories: support for sustainable livelihoods; provision of alternative protein sources;
financial mechanisms; regulatory and enforcement mechanisms; and education and awareness raising
campaigns (van Vliet 2011). The most effective hunting interventions are likely to be highly context
specific, so managers require a clear understanding of the intended target group or groups to guide
intervention design.
We assessed the usefulness of 2 audience-segmentation methods under realistic constraints of site-
based conservation programs: a cluster method, where groups were differentiated based on multiple
variables describing livelihoods and behavior, and a simple method, where the population was divided
into 2 groups of either high or low hunting impact. We asked do segmentation methods generate
insights to guide decisions about appropriate livelihood support interventions and does either
segmentation approach (cluster or simple) differentiate groups with profiles that suggest targeted
intervention design is appropriate?
This article is protected by copyright. All rights reserved.
METHODS
Study site
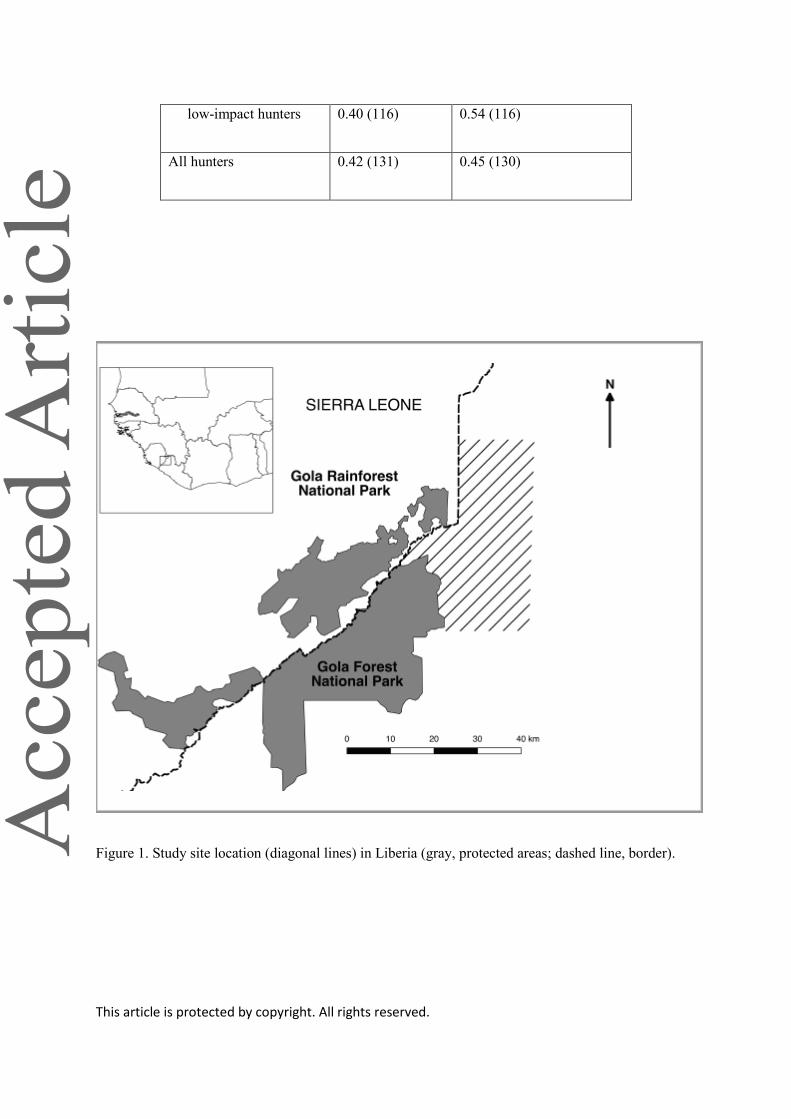
We collected data from July 2016 – July 2017 in Kongba district, Liberia, at the site of a
community-based conservation project, GolaMA, which started in 2014 (GRNP 2015).
Project activities focused on establishment of conservation-friendly community forests, based
on livelihood-support approaches and hunting regulations. Overhunting is a primary
conservation threat in Liberia. Wild meat is consumed widely (Junker et al. 2015; Ordaz-
Németh et al. 2017) and thus provides substantial income for hunters and traders (Hoyt 2004;
Greengrass 2016). Hunting of species listed as protected under the Wildlife Act (1988,
revised 2016) is illegal, as is hunting in national parks, although both types of hunting are
widespread (S.J., personal observation). The Gola Forest National Park (established 2016) is
adjacent to the study site, and wild meat being transported to the capital city of Monrovia is
irregularly confiscated at a checkpoint. The west of the study area extends to the Sierra Leone
border and is a short distance from the Gola Rainforest National Park (Fig. 1).
The site retains relatively high forest cover and low population density. Economic immigration for
mining, logging and hunting has resulted in an ethnically diverse population with 20 tribes
represented. At the time of the study, two-thirds of the population (65%) belonged to 1 of 3 dominant
tribes (Gola, Mende, and Kissi) (Supporting Information). Residents self-identify as local or nonlocal
citizens. Those who consider themselves local typically have at least 1 parent with local ancestry.
Residents who identify as nonlocal are typically individuals born outside the district or without local
ancestry, such that long-term residents and recent arrivals may identify as nonlocal. The largest group
This article is protected by copyright. All rights reserved.
of nonlocals were from Nimba county in Liberia (about 26% of nonlocals), and 15% of all residents
were Sierra Leonean nationals. At least 7% of the population were transient migrants.
Data collection
We collected data through questionnaires administered during face-to-face interviews
(Supporting Information). Hunting is an everyday activity in Liberia and is practiced openly,
but some degree of social desirability bias is likely given that it is illegal (Nuno & St John
2014). However, an initial pilot study suggested that most hunters were willing to talk openly
about their activities, and we judged the level of bias in data obtained from direct questioning
to be acceptably low for our purposes. Ethical approval for the use of human subjects was
obtained from the Royal Holloway University of London Research Ethics Committee.
The sample included 18 villages, consisting of all villages that participated in the GolaMA
conservation project and two neighbouring villages (Fig. 1). The latter were selected based on their
geographic proximity and had similar sociodemographic characteristics. In each village, we surveyed
households and hunters separately. The household survey included all households, except in the
largest village where an estimated 60% of households were surveyed (mean households per village =
28, range = 2-111). The hunter survey included all identified hunters in all villages and
semipermanent camps that came under village jurisdiction (mean hunters per village = 10.8, range =
0-28). Hunters were identified during the household survey, through key informants and snow-ball
sampling. If a hunter or household was not initially available, interviewers returned at least three
times. It was not possible to match the hunter and household surveys because hunters were rarely
This article is protected by copyright. All rights reserved.
encountered at their homes, and nonunique names created ambiguity in determining which household
a hunter belonged to.
Questionnaires for the household survey were used to obtain information about livelihood activities
and demography, and those for hunters contained additional questions about hunting behavior (Table
1). Estimates of mean biomass harvest for each hunter were derived from the total estimated body
mass of their most recent catch, divided by the duration of both the hunting trip and days spent resting
in the town. Hunters reported the composition of their last catch and the total estimated body mass
was calculated using mean adult values for each species from Kingdon (2015) and Jones et al (2009).
Simple and cluster methods
We defined 2 simple target groups: hunting households, based on the household survey, and high-
impact hunters, based on the hunter survey (Table 1).
We performed separate cluster analyses on the household and hunter data sets with infinite binomial
mixture models implemented with the R package BayesBinMix (R Core Development Team 2014;
Papastamoulis & Rattray 2017). Cluster assignment used the equivalence classes representative
algorithm (Papastamoulis 2014). A truncated Poisson distribution was used as the prior distribution
for cluster number, allowing a maximum of 20 clusters. We used a metropolis-coupled Markov chain
Monte Carlo sampling algorithm with parallel tempering to improve mixing. Fifteen heated parallel
chains were run with 20,000 iterations. Convergence was assessed with the Geweke diagnostic
(Geweke, 1992).
This article is protected by copyright. All rights reserved.
Variables used for clustering related to livelihood activities, citizenship and hunting behavior are
listed in Table 1. Livelihood activities relevant to intervention design and principle candidates for
support interventions by the GolaMA project were cocoa farming, palm farming, small-scale mining,
and petty-goods trading. These variables were chosen to be simple for managers to interpret without
prior knowledge of which factors mediate behavior and which could be measured where
psychological scales have yet to be developed and validated. Incorporating a broader set of
sociodemographic and psychographic variables was beyond the scope of this study, which is intended
to provide an initial assessment of segmentation in a novel context. Continuous variables were
transformed to binary responses with cut-off values selected to provide straightforward management
interpretations. Biomass harvest was coded as 1 for values exceeding the mean body mass of the most
frequently killed species (Maxwell’s duiker [Philantomba maxwelli]) and hunters’ self-estimated
profit was coded as 1 if in excess of US$100 / month, a typical entry wage from local employment
sources.
Generation of insights to guide intervention targeting
Livelihood profiles represent basic information to guide decisions about appropriate livelihood
support interventions. We compared prevalence of livelihood activities in clusters and simple groups
with those of the complete data sets to explore whether segmentation supplied novel perspectives.
Group profiles were supplemented with qualitative descriptions based on sociodemographic
information: age, marital status, education and household size. We defined education as high school
level if hunters had at least 6 years of formal education (hunter data set) or if any member of the
household did (household data set).
This article is protected by copyright. All rights reserved.
Segmentation should group people who may respond similarly to a given intervention in order to
guide intervention targeting. Interventions had not been fully implemented at the time of the study, so
direct measures of intervention response were unavailable. Instead, we tested whether groups differed
for the following indirect measures. For households, we evaluate participation in livelihood support
programs being piloted by the GolaMA project because this could indicate future participation (Ajzen
2011). Available programs were beekeeping, cocoa farmer training, small loans groups, and
community agriculture. We considered only villages where at least 1 program was offered and
combined programs so households either did or did not engage in a livelihood intervention. For
hunters, we evaluated killing of any of 4 high-profile protected species (Forest Elephant [Loxodonta
cyclotis], Pygmy Hippopotamus [Hexaprotodon liberiensis], Western Chimpanzee [Pan troglodytes
verus], or Leopard [Panthera pardus]) and experience of confiscation of catch by authorities, usually
taking place at road blocks. The former indicated hunters with the means and disposition to target
large-bodied species, which are widely known to be protected by law, and the latter was a combined
measure of both exposure to and tolerance of law enforcement efforts.
We use Pearson’s chi-square to evaluate distribution of these traits between clusters and simple target
groups. Analysis of variance was used to evaluate group differences in age and household size.
RESULTS
Hunting in the study area
Of the 476 households in the survey, 39% had members who hunted and 26% had been hunting
during the previous week. Local citizens headed 54% of all households and 45% of hunting
households. Of the 205 hunters interviewed in the survey, 41% were local citizens, 75% used guns to
This article is protected by copyright. All rights reserved.
hunt and 56% used snares. Mean trip length was 3.9 days (SD 3.0) and mean estimated biomass
harvest was 14.4 kg/day (SD 14.5).
Household clusters
The most likely number of clusters was 6 (probability 0.53). Size varied from 10 to 176 households.
The 2 largest clusters held 64% of all households. Citizenship was a prominent feature defining
clusters (Table 2); the largest cluster held almost 70% of all local-headed households. High school
education (of any household member) was unevenly distributed across clusters (n=471, 2 = 15.09, df
= 5, p< 0.01). The clusters were labeled for convenience (Table 2). Local farmers had a relatively low
rate of high school education (37%) compared with 60% for nonlocal hunting households, merchants,
salaried workers, and local plantation farmers (Supporting Information).
The cluster of nonlocal farmers contained 128 households, of which 96% were nonlocal. Most (98%)
practised annual or biennial agriculture. The majority (61%) were hunting households – representing
40% of all hunting households in the sample. Relatively common nonhunting activities were petty
goods trade (70%), palm farming (51%), and mining (38%).
The cluster of local farmers contained 176 households, all of which were local. Hunting was practiced
by 40% of these households. Most households (97%) practiced annual or biennial agriculture, 89%
were cocoa farming households, and 65% traded petty goods. Mean household size was the largest of
any group (mean number of adults 3.4 [SD 2.1], mean children 3.8 [SD 1.8]) (Supporting
Information).
This article is protected by copyright. All rights reserved.
The cluster of nonlocal hunting households contained 31 households, of which 84% were nonlocal
and 97% hunted. None were cocoa farming households, and few farmed annual or biennial crops (16
and 23% respectively), distinguishing this group from the nonlocal farmers, many of whom also
hunted.
The merchant and salaried workers’ cluster contained 63 households, of which 74% were local and
3% hunted. Most (98%) traded petty goods, and 49% had some form of employment – representing
66% of all households with employment.
The nonlocal miners’ cluster contained 68 households, of which 81% were nonlocal, 97% engaged in
mining, and 12% hunted. Cocoa and palm farming were rare (4% and 3% respectively). Most (72%)
were resident in the same village. Households had fewer children on average than other groups (mean
[SD]=2.1 [1.7] compared with 3.3 [1.9] across all households) (Supporting Information).
The cluster of local plantation farmers was the smallest (10 households), and all households farmed
cocoa or palm, grew subsistence crops, and gained additional income from selling charcoal, but they
lacked other income sources. No households hunted. Six were resident in the same village.
Hunter clusters
Hunters fell into five clusters (probability of 0.58). Size ranged from 10 to 87 hunters. Citizenship
and hunting methods were prominent defining features (Table 3). Marital status or number of children
This article is protected by copyright. All rights reserved.
were not associated with cluster membership. Age differed significantly between clusters (F4,194=4.16,
p<0.01). High school education was not evenly distributed across clusters ( n=202, =10.03, df=4,
p=0.04) (Supporting Information).
The cluster of nonlocal gun hunters contained 87 hunters, 98% of whom were nonlocal citizens
(residents with nonlocal ancestry). Mean residency in villages was 9.2 years (SD 5.1). All used guns.
Most hunted over 14 days/month (78%), and 61% generated over $100/month. Mining and petty
trading were practiced by some individuals (24 and 22% respectively), but other income sources were
rare. Rates of high school education were the highest of any group (47% relative to 35% among all
hunters).
The cluster of local trappers contained 31 hunters; 87% were local and all used snares. Mean offtake
per hunter was higher than any other group (19.7 kg / day), but only 33% spent over 14 days per
month hunting. Income from palm, cocoa, and mining were relatively common (65%, 48%, and 23%
respectively). Local trappers were younger than nonlocal gun hunters (mean age [SD]=34.6 years
[10.7] and 43.6 years [11.1] respectively, Tukey test difference in means=9.0, 95% CI 2.7-15.3,
p<0.01). Only 26% had high school education.
The cluster of local gun hunters contained 49 hunters, 90% were local and all used guns. Despite
relatively low offtake (mean = 10.8 kg / day), most generated over $100 / month (62%). This group
showed the highest prevalence of skilled crafts people (14%) and few miners (8%). Cocoa and palm
were relatively common (55%, 37% respectively). Mean residency in villages was longer than any
This article is protected by copyright. All rights reserved.
group (mean [SD]=24.1 years [17.0] relative to mean [SD]=14.4 years [12.8] among all hunters)
(Supporting Information).
The nonlocal trapper cluster contained 28 hunters, of which 85% were nonlocal. All only used snares
to hunt. Effort and offtake were intermediate, but only 15% generated over $100 / month. There was
low prevalence of income from nonhunting livelihoods. Members had settled in villages relatively
recently compared with other groups (mean residency [SD]=8.5 years [8.0]) (Supporting
Information).
The cluster of occassional hunters contained only 10 members. Eight were local and 9 used guns.
Most had multiple income sources. All were petty traders, and cocoa, palm, and mining were
prevalent. None earned over $100/month, and most (90%) spent under 14 days/month hunting.
Generation of insights to guide intervention targeting
The cluster method produced groups which differed in livelihood profiles compared to the simple
method of no targeting for households and hunters. Among four activities considered candidates for
support interventions, the most prevalent was petty trading among all households (no targeting, 73%)
and hunting households (simple targeting, 72%), but cocoa farming among the largest cluster of local
farmers (89%). The prevalence of livelihood activities in the simple target groups were generally
similar to the general population (Supporting Information).
This article is protected by copyright. All rights reserved.
Among hunters, mining was prevalent in the largest cluster of nonlocal gun hunters (24%), whereas
this consistently ranked below other activities under simple or no targeting (Supporting Information).
Livelihood activity profiles of hunters differed from those of households, with prevalence of petty
trading being much higher among households (72%) than hunters (23%).
Pilot livelihood support programmes were offered to 184 households, of which 82% (151 households)
participated. It was not possible to test whether participation was evenly distributed across all clusters
because low expected values for small clusters violated the assumptions of Pearson’s chi-square test.
Therefore, we only compared the 2 largest clusters. Participation was unevenly distributed (n=156,
2= 6.23, df = 1, p = 0.013). Nonlocal farmer households had lower participation (67% of 39
households) than the expected value of 81.4%, while local farmers had higher participation (86%, of
117 households). In contrast, participation had no significant association with the simple target groups
of hunting and nonhunting households (85% of 66 hunting households and 81% of 118 nonhunting
households participated, n=184, 2= 0.29, df = 1, p = 0.59).
Prevalence of killing any of four protected species was 42% across all hunters who were asked this
question (n=131). A total of 34% had killed western chimpanzee during their hunting career, 18% had
killed pygmy hippopotamus, 18% had killed leopard, and 2% had killed forest elephant. There was no
association between prevalence of protected species killing and groups defined using either the simple
or cluster method (Table 4) (n=131, simple method: 2 = 2.26 df = 1, p = 0.13; cluster method: 2
=
6.95, df = 4, p = 0.14). This was also true for western Chimpanzees specifically (n=131, simple
method: 2 = 1.01, df = 1, p= 0.31; cluster method 2
= 1.01, df = 1, p= 0.31). It was not possible to
evaluate the other species individually due to low expected values which violated test assumptions.
This article is protected by copyright. All rights reserved.
A total of 45% of hunters had previously had their catch confiscated by authorities. This was
significantly associated with clusters (n=130, 2 = 28.08, df = 4, p< 0.0001), but not the simple target
groups of low versus high impact hunters (2 = 1.09 e-31, df = 1, p= 1.00). In the largest cluster,
nonlocal gun hunters, 67% of hunters had a catch confiscated, but only 11% of local trappers had a
catch confiscated, the second largest cluster.
DISCUSSION
Valuable insights for intervention design were obtained from a cluster method to subdivide
households and hunters. By contrast, the simple approach of defining target groups based only on
hunting impact (hunting households and high-impact hunters) was relatively uninformative with
respect to targeting because these groups had profiles that were similar to the general population.
Cluster profiles offered a basis to improve intervention targeting and differentiated groups that are
likely to differ in responsiveness to regulatory and livelihood mechanisms, despite being limited to
basic livelihood and behavior variables. This implies that segmentation could be successfully applied
in many conservation settings, with further advantages expected from dedicated studies that more
directly focus on human behavior. Effective targeting is likely to be achieved by considering multiple
variables to define target groups, whereas using overly simplistic criteria or failing to define target
groups at all may contribute to poorly designed interventions.
Cluster profiles gave insight into targeting of livelihood support interventions and provided a
compelling case that distinct needs of different groups are important considerations for intervention
design. For instance, the 2 largest hunter clusters, nonlocal gun hunters and local trappers, differed
This article is protected by copyright. All rights reserved.
notably in prevalence of cocoa and palm farming. Livelihood support programmes which aim to
increase income from cocoa and palm farming are commonly implemented across West Africa, often
based on the assumption that supporting these livelihoods will lead to a decrease in hunting (Roe et al.
2015). Our findings imply that supporting cocoa or palm farmers may be appropriate for local
trappers, but a significant subset of hunters, the nonlocal gun hunters, currently have little
involvement in these activities and thus are unlikely to participate. This was mirrored at the household
level, with the largest cluster comprising mainly cocoa farmers (89%), whereas only 27% of the
nonlocal farmer cluster had cocoa plantations. This pattern could be due to barriers preventing
nonlocal citizens from farming cocoa, such as challenges of land-tenure security or a stronger
preference for shorter term investments due to plans to return to their original home (Sward 2017;
S.J., personal observation). The simple approach to defining target groups masked this pattern and
could lead managers toward a more simplistic impression that cocoa is relatively prevalent among
high-impact hunters or hunting households.
Participation in livelihood programmes and exposure to hunting penalties were found to differ
between clusters, revealing that current livelihood and law enforcement mechanisms operate
differently across sections of society. Given these traits were not differentiated between groups
defined simply as having high versus low hunting impact, this supports an argument that clustering
identifies groups with distinct requirements when it comes to intervention design, whereas simpler
approaches may not. Ways to improve both the effectiveness and equitability of interventions could
be revealed by determining the mechanisms behind these patterns. For instance, households in the
nonlocal farmer cluster had lower rates of participation in pilot-phase livelihood support programmes
than the local farmers, suggesting that such programmes may not be equally accessible to both groups.
We also found that most hunters in the cluster of nonlocal gun hunters had been penalized for hunting
(67%), whereas this was far lower among local trappers (11%). Reasons for this could include trading
This article is protected by copyright. All rights reserved.
patterns, since local trappers may export a smaller proportion of catch and face less risk of
confiscation. However, bias in the enforcement of laws may also play a role because locals could be
expected to have stronger inter-personal relationships with park staff. Evidently these penalties had
proven ineffective as hunting deterrents for those in our sample, while any individuals who had
ceased hunting due to law enforcement efforts would not have been included in our study. In contrast,
killing of large-bodied protected species did not differ for clusters or simply defined groups,
suggesting that neither segmentation approach could offer insight for targeting when it comes to this
aspect of hunting behavior. Whether or not hunters had killed protected species during their career
may represent an imprecise indicator of multiple factors, including hunters’ skill, methods and
awareness of protected species laws, which do not appear to have been captured in the cluster
analysis.
An unforeseen advantage of segmentation may be to help identify potentially vulnerable groups
within the population. We found a relatively small subset of households, the nonlocal hunting
household cluster, had a high prevalence of hunting but relatively few other income sources and
particularly low participation in shifting agriculture or plantation cropping. As incomers these
households do not have equal status with local citizens when it comes to many aspects of land tenure,
decision making, or local judicial processes and could face high costs of hunting reductions that may
not be adequately offset by agricultural livelihood support. Nonlocal citizens had typically distinct
livelihood portfolios and hunting behavior from locals, both at the scale of households and individual
hunters. Kümpel et al. (2009) similarly found immigrant hunters have distinct behavioral profiles
from locals. This pattern is particularly relevant in the context of community-based natural resource
management which seeks to shift control of resources to local management bodies whilst ensuring
opportunity costs are not unduly borne by the poorest (Duffy et al. 2016). A major challenge is
ensuring equitable distribution of benefits and power (Law et al. 2018), and marginalization of
This article is protected by copyright. All rights reserved.
nonlocal immigrants could be a concern, particularly if livelihood patterns are a result of inequalities
such as land tenure rights.
Our case study describes a promising first step in developing segmentation as a tool in site-based
conservation. However, further work is required to realise the potential of this technique, particularly
when it comes to identifying appropriate variables for clustering. Many aspects of behavior are likely
to be underpinned by psychographic traits such as risk attitudes and personality (Hunecke et al. 2010;
Wolff et al. 2010; Boslaugh et al. 2005) and an understanding of these could generate deeper insight
for intervention design. Moving beyond socioeconomic descriptions toward approaches drawing on
behavioral theory and fields such as psychology may do much to improve intervention design
(Saunders et al. 2006; Bennett et al. 2017; St John et al. 2018) and leverage the potential of tools such
as audience segmentation. There is also a need to place relevant psychosocial attributes more squarely
at the heart of monitoring programs to improve understanding of factors that facilitate behavior-
change outcomes.
Translating cluster attributes into practical recommendations for intervention design requires a
rigorous process of testing and development (Verissimo et al. 2011), which can be facilitated by
adaptive management (McCarthy & Possingham 2007). An important limitation of our study is that
we did not directly assess peoples’ responses to interventions. A priority for future segmentation
studies should be to integrate a robust validation of groups into the monitoring and development
process, based on direct measures of behavior (Boslaugh et al. 2005). This will also contribute to
understanding of behavior-change mechanisms more generally and build a stronger evidence base to
guide decision making. Segmentation analysis over larger scales could generate valuable insights for
This article is protected by copyright. All rights reserved.
regional conservation planning, and an interesting question remains of whether cluster profiles
identified in our study are consistent at other sites.
Given its current role in social and commercial marketing applications, audience segmentation could
be a valuable tool that is relevant in many conservation settings. The approach of defining population
structure across multiple variables provides managers with a more comprehensive view of who they
intend to influence. This promotes the view that populations are composed of heterogenous groups
and places their different needs and behavior at the center of decision making. Our case study
demonstrates that segmentation can be informative even when only basic livelihood data sets are used,
and we encourage more widespread adoption of the approach within the conservation community.
Acknowledgments
We thank the Forestry Development Authority of Liberia for permission to conduct this study. We
also thank Tonglay, Normon, and Zuie clans and each of the communities that participated. We thank
the Society for Conservation of Nature of Liberia and the staff of the GolaMA project, with special
thanks for M. Garbo, A. Gardner, and the field research team. Finally, we thank the Royal Society for
the Protection of Birds and the European Union for supporting this work.
SUPPORTING INFORMATION
Livelihood and behavior profiles of groups defined using the cluster and simple methods (Appendix
S1) , sociodemographic descriptions of groups defined using the cluster and simple methods
(Appendix S2), demographic information (Appendix S3), and questionnaires administered to
households and hunters (Appendix S4) are available online. The authors are solely responsible for the
content and functionality of these materials. Queries (other than absence of the material) should be
directed to the corresponding author.
This article is protected by copyright. All rights reserved.
LITERATURE CITED
Agrawal A, & Gibson CC. 1999. Enchantment and disenchantment: The role of community in natural
resource conservation. World Development 27: 629–649.
Ajzen, I. 2011. The theory of planned behaviour: Reactions and reflections. Psychology & Health,
26:1113–1127.
Anable, J. 2005. ‘Complacent car addicts’ or ‘aspiring environmentalists’? Identifying travel
behaviour segments using attitude theory. Transport Policy 12: 65–78.
Benítez-López A, Alkemade R, Schipper AM, Ingram DJ, Verweij PA, Eikelboom JAJ, Huijbregts
MAJ. 2017. The impact of hunting on tropical mammal and bird populations. Science 356: 180–
83.
Bennett, NJ. et al., 2017. Mainstreaming the social sciences in conservation. Conservation Biology
31: 56–66.
Boslaugh SE, Kreuter MW, Nicholson RA, Naleid K. 2005. Comparing demographic, health status
and psychosocial strategies of audience segmentation to promote physical activity. Health
Education Research 20: 430–438.
Cronin, DT. et al. 2017. Conservation strategies for understanding and combating the primate
bushmeat trade on Bioko Island, Equatorial Guinea. American Journal of Primatology (e22663)
DOI: 10.1002/ajp.22663 .
Davies, G. 2002. Bushmeat and International Development. Conservation Biology 16:587–589.
Dietrich T, Rundle-Thiele S, Schuster L, Drennan J, Russell-Bennett R, Leo C, Gullo MJ, Connor JP.
2015. Differential segmentation responses to an alcohol social marketing program. Addictive
behaviors 49:68–77.
This article is protected by copyright. All rights reserved.
Duffy R, St John FAV, Büscher B, Brockington D. 2016. Toward a new understanding of the links
between poverty and illegal wildlife hunting. Conservation Biology 30: 14–22.
Fa JE, Currie D, Meeuwig J. 2003. Bushmeat and food security in the Congo Basin: linkages between
wildlife and people’s future. Environmental Conservation 30(1):71–78.
Forthofer MS, Bryant CA. 2000. Using audience-segmentation techniques to tailor health behavior
change strategies. American Journal of Health Behavior 24: 36-43
Gavin MC, Solomon JN, Blank SG. 2010. Measuring and monitoring illegal use of natural resources.
Conservation Biology 24:89–100.
Geweke, J. 1992 Evaluating the accuracy of sampling-based approaches to the calculation of posterior
moments. Pages 169-193 in Bernardo JM, Berger JO, Dawid AP, Smith AFM,
editors. Bayesian statistics. Volume 4. Clarendon Press, Oxford.
Greengrass, E. 2016. Commercial hunting to supply urban markets threatens mammalian biodiversity
in Sapo National Park, Liberia. Oryx 50:397–404.
GRNP (Gola Rainforest National Park). 2015. Availble from https://www.golarainforest.org/gola-
liberia (accessed November 2018)
Hardcastle SJ, Hagger MS. 2016. Psychographic Profiling for Effective Health Behavior Change
Interventions. Frontiers in Psychology 6: 1988 DOI: 10.3389/fpsyg.2015.01988
Harrison M, Baker J, Twinamatsiko M, Milner-Gulland EJ. 2015. Profiling unauthorized natural
resource users for better targeting of conservation interventions. Conservation Biology 29:
1636–1646
Hoyt, R. 2004. Wild Meat Harvest and Trade in Liberia: managing biodiversity, economic and social
impacts. Overseas Development Institute wildlife policy briefing number 6. Overseas
This article is protected by copyright. All rights reserved.
Development Institue, London.
Hunecke M, Haustein , hler , Grischkat S.2010. Attitude-based target groups to reduce the
ecological impact of daily mobility behavior. Environment and Behavior, 42: 3–43.
Jones KE, et al. 2009. PanTHERIA: a species-level database of life history, ecology, and geography
of extant and recently extinct mammals. Ecology 90:2648
Junker J, Boesch C, Mundry R, Stephens C, Lormie M, Tweh C, Kühl HS. 2015. Education and
access to fish but not economic development predict chimpanzee and mammal occurrence in
West Africa. Biological Conservation 182:27–35.
Kingdon, J. 2015. The Kingdon field guide to African mammals. 2nd
edition. Princeton University
Press, Princeton, New Jersey.
Kotler P, Lee N. 2008. Social marketing influencing behaviors for good. Sage Publications, Thousand
Oaks, California.
Kümpel NF, Rowcliffe JM, Cowlishaw G, Milner-Gulland EJ. 2009. Trapper Profiles and Strategies:
Insights into Sustainability from Hunter Behaviour. Animal Conservation 12: 531–39.
Law EA, Bennett NJ, Ives CD, Friedman R, Davis KJ, Archibald C, Wilson KA. 2018. Equity trade-
offs in conservation decision making. Conservation Biology 32: 294–303.
Lee YO, Jordan JW, Djakaria M, Ling P. 2014. Using peer crowds to segment black youth for
smoking intervention. Health Promotion Practice 15:530–537.
Maibach EW, Leiserowitz A, Roser-renouf C, Mertz CK. 2011. Identifying Like-Minded Audiences
for Global Warming Public Engagement Campaigns : An Audience egmentation Analysis and
Tool Development. PLoS ONE 6 (e17571) DOI: 10.1371/journal.pone.0017571.
McCarthy MA, Possingham HP. 2007. Active Adaptive Management for Conservation. Conservation
This article is protected by copyright. All rights reserved.
Biology 21:956–963.
McKenzie-Mohr D, Lee NR, Kotler P, Schultz PW. 2011. Social marketing to protect the
environment: What works. Sage Publications, Thousand Oaks, California.
Nuno A, St John FAV. 2014. How to ask sensitive questions in conservation: A review of specialized
questioning techniques. Biological Conservation 189: 5–15
Ordaz-Németh I. et al. 2017. The socio-economic drivers of bushmeat consumption during the West
African Ebola crisis. PLoS Neglected Tropical Diseases (e0005450)
DOI: 10.1371/journal.pntd.0005450
Papastamoulis P. 2014. Handling the Label Switching Problem in Latent Class Models Via the ECR
Algorithm. Communications in Statistics - Simulation and Computation 43: 913–927.
Papastamoulis P, Rattray M. 2017. BayesBinMix: an R Package for Model Based Clustering of
Multivariate Binary Data. The R Journal 9: 403–420.
Poortinga W, Darnton A. 2016. Segmenting for sustainability: The development of a sustainability
segmentation model from a Welsh sample. Journal of Environmental Psychology 45:221–232.
R Core Development Team, 2014. R: A language and environment for statistical computing.
Available at: www.R-project.org.
Reddy SM, Montambault J, Masuda YJ, Keenan E, Butler W, Fisher JR, Asah ST, Gneezy A. 2017.
Advancing conservation by understanding and influencing human behavior. Conservation
Letters 10: 248–56
Rimal RN, Brown J, Mkandawire G, Folda L, Böse K, Creel AH. 2009. Audience Segmentation as a
Social-Marketing Tool in Health Promotion : Use of the Risk Perception Attitude Framework in
HIV Prevention in Malawi. American Journal of Public Health 99:.2224–2230.
This article is protected by copyright. All rights reserved.
Roe, D. et al., 2015. Are alternative livelihood projects effective at reducing local threats to specified
elements of biodiversity and/or improving or maintaining the conservation status of those
elements? Environmental Evidence 4:1-22
Saunders CD, Brook AT, Myers OE. 2006. Using psychology to save biodiversity and human well-
being. Conservation Biology 20:702–705.
Spiteri A, Nepal SK. 2006. Incentive-based conservation programs in developing countries: A review
of some key issues and suggestions for improvements. Environmental Management 37:1–14.
St John FAV, Linkie M, Martyr DJ, Milliyanawati B, McKay JE, Mangunjaya FM, Leader-Williams
N, Struebig MJ. 2018. Intention to kill: tolerance and illegal persecution of Sumatran tigers and
sympatric species. Conservation Letters 11:1–8
Sward, J. 2017. In-migration, customary land tenure, and complexity: exploring the relationship
between changing land tenure norms and differentiated migrant livelihoods in Brong Ahafo,
Ghana. Population and Environment 39:87–106.
Van Vliet, N. 2011. Livelihood alternatives for the unsustainable use of bushmeat. Report prepared
for the CBD Bushmeat Liaison Group. Technical series 60. Secretariat of the Convention on
Biological Diversity, Montreal.
Veríssimo, D. 2013. Influencing human behaviour : an underutilised tool for biodiversity
management. Conservation Evidence 10: 29–31
Verissimo D, MacMillan DC, Smith RJ. 2011. Toward a systematic approach for identifying
conservation flagships. Conservation Letters 4:1–8.
Wedel, M., & Kamakura, W. A. (2012). Market segmentation: conceptual and methodological

This article is protected by copyright. All rights reserved.
foundations. Volume 8. Kluwer, Dordrecht, Netherlands.
Wolff LS, Massett HA, Maibach EW, Weber D, Hassmiller S, Mockenhaupt RE. 2010. Validating a
health consumer segmentation model: Behavioral and attitudinal differences in disease
prevention-related practices. Journal of Health Communication, 15:167–188.
Wright AJ. et al. 2015. Competitive outreach in the 21st century: Why we need conservation
marketing. Ocean and Coastal Management 115:41–48.
Zabala A, Pascual U, García-barrios L. 2017. Payments for pioneers? Revisiting the role of external
rewards for sustainable innovation under heterogeneous motivations. Ecological Economics 135:
234–45.
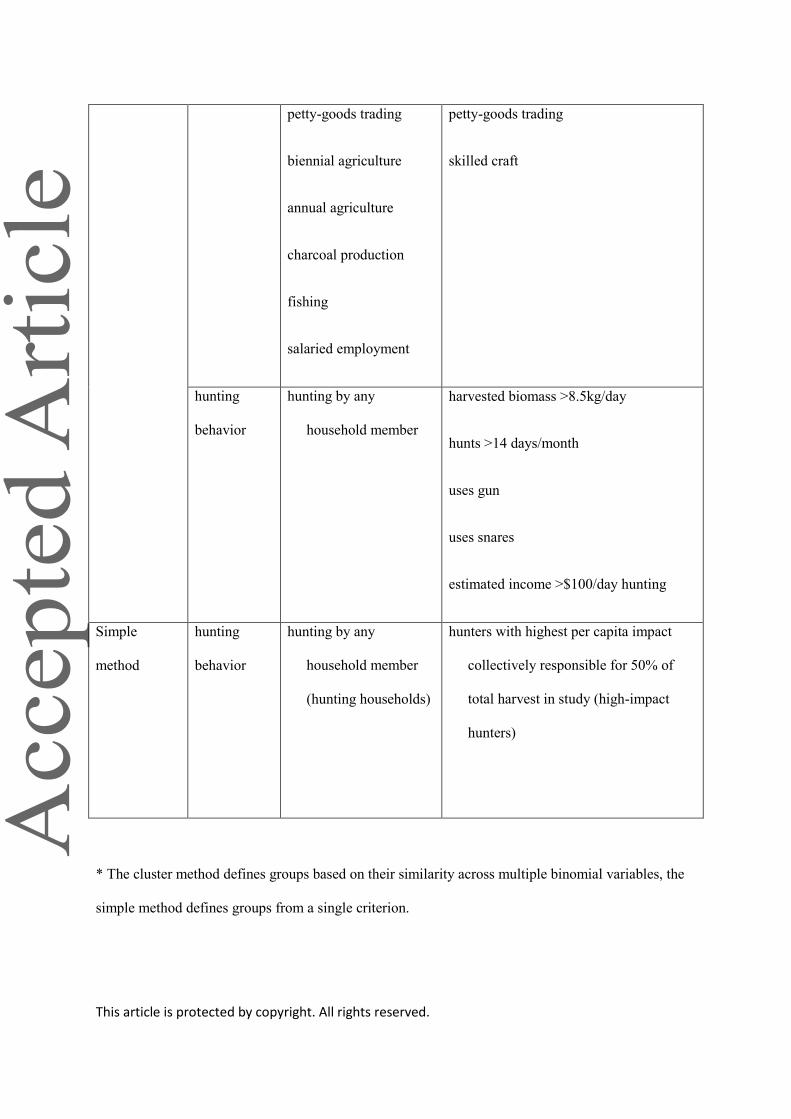
Table 1. Variables and criteria used to define hunter and household target groups for conservation
interventions
Method to
define target
group*
Variable
type
Household data set Hunter data set
Cluster
method
citizenship household head is local hunter is local
livelihood
activities
palm farming
cocoa farming
small-scale mining
palm farming
cocoa farming
small-scale mining
This article is protected by copyright. All rights reserved.
petty-goods trading
biennial agriculture
annual agriculture
charcoal production
fishing
salaried employment
petty-goods trading
skilled craft
hunting
behavior
hunting by any
household member
harvested biomass >8.5kg/day
hunts >14 days/month
uses gun
uses snares
estimated income >$100/day hunting
Simple
method
hunting
behavior
hunting by any
household member
(hunting households)
hunters with highest per capita impact
collectively responsible for 50% of
total harvest in study (high-impact
hunters)
* The cluster method defines groups based on their similarity across multiple binomial variables, the
simple method defines groups from a single criterion.
This article is protected by copyright. All rights reserved.
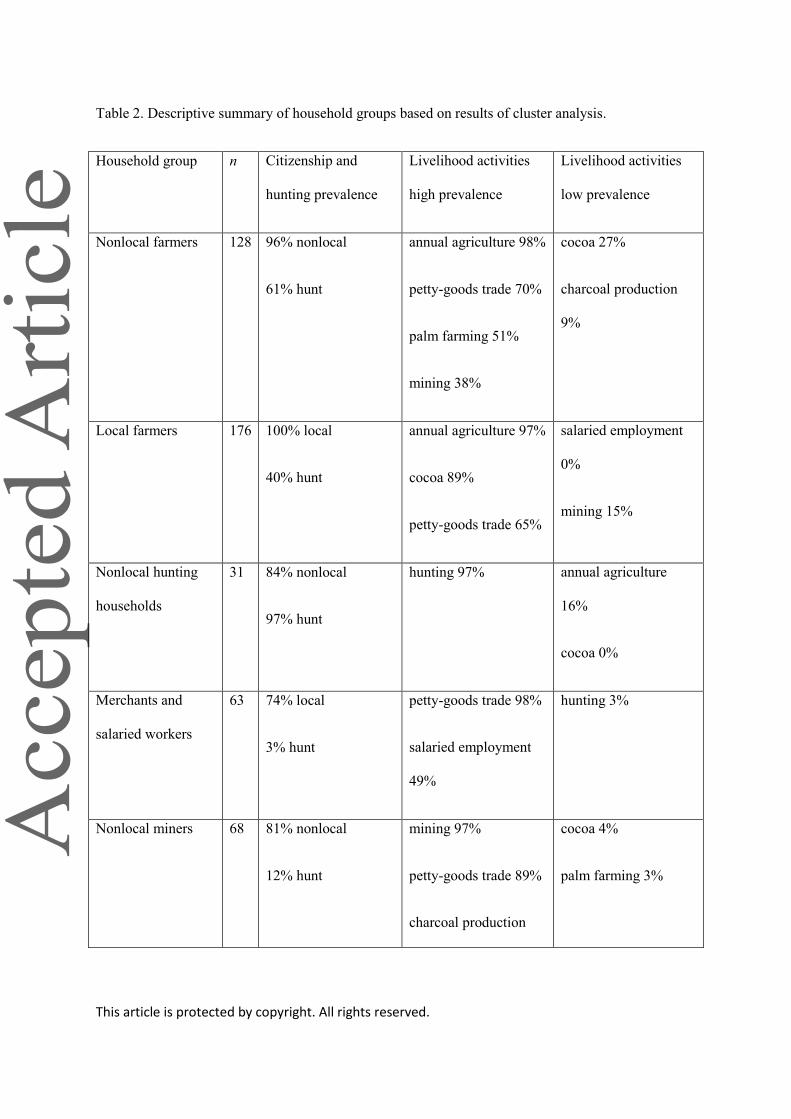
Table 2. Descriptive summary of household groups based on results of cluster analysis.
Household group n Citizenship and
hunting prevalence
Livelihood activities
high prevalence
Livelihood activities
low prevalence
Nonlocal farmers 128 96% nonlocal
61% hunt
annual agriculture 98%
petty-goods trade 70%
palm farming 51%
mining 38%
cocoa 27%
charcoal production
9%
Local farmers 176 100% local
40% hunt
annual agriculture 97%
cocoa 89%
petty-goods trade 65%
salaried employment
0%
mining 15%
Nonlocal hunting
households
31 84% nonlocal
97% hunt
hunting 97% annual agriculture
16%
cocoa 0%
Merchants and
salaried workers
63 74% local
3% hunt
petty-goods trade 98%
salaried employment
49%
hunting 3%
Nonlocal miners 68 81% nonlocal
12% hunt
mining 97%
petty-goods trade 89%
charcoal production
cocoa 4%
palm farming 3%
This article is protected by copyright. All rights reserved.
32%
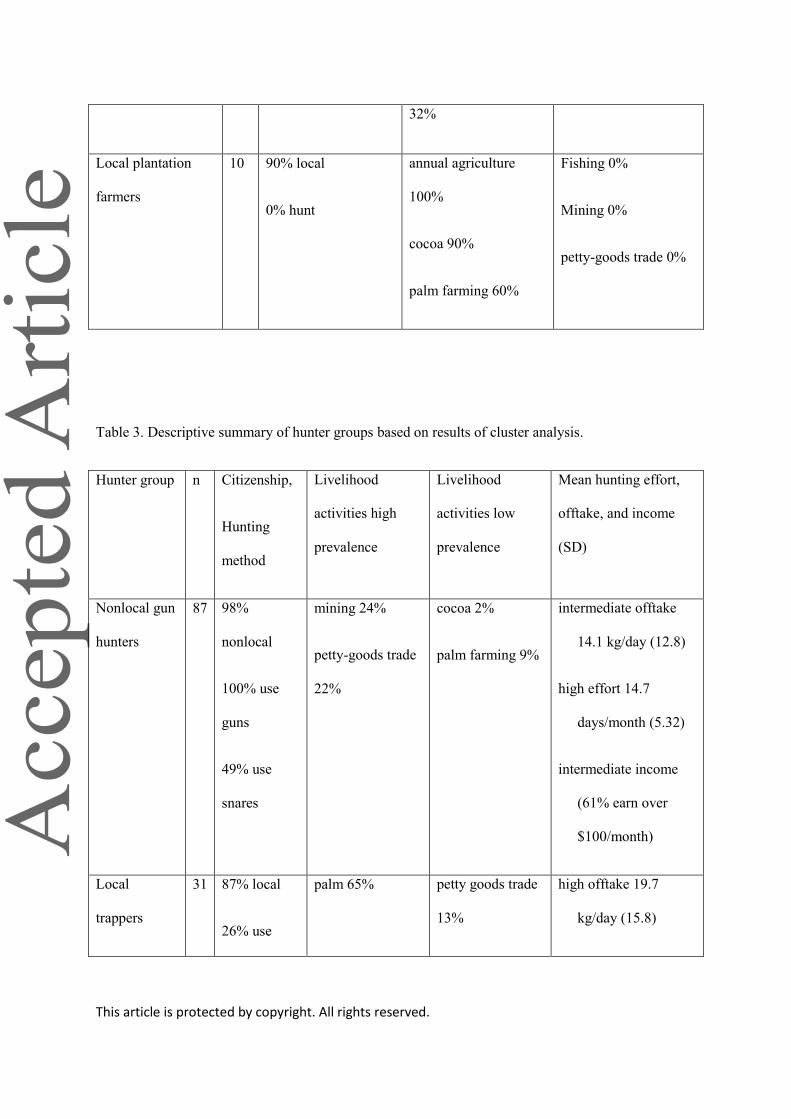
Local plantation
farmers
10 90% local
0% hunt
annual agriculture
100%
cocoa 90%
palm farming 60%
Fishing 0%
Mining 0%
petty-goods trade 0%
Table 3. Descriptive summary of hunter groups based on results of cluster analysis.
Hunter group n Citizenship,
Hunting
method
Livelihood
activities high
prevalence
Livelihood
activities low
prevalence
Mean hunting effort,
offtake, and income
(SD)
Nonlocal gun
hunters
87 98%
nonlocal
100% use
guns
49% use
snares
mining 24%
petty-goods trade
22%
cocoa 2%
palm farming 9%
intermediate offtake
14.1 kg/day (12.8)
high effort 14.7
days/month (5.32)
intermediate income
(61% earn over
$100/month)
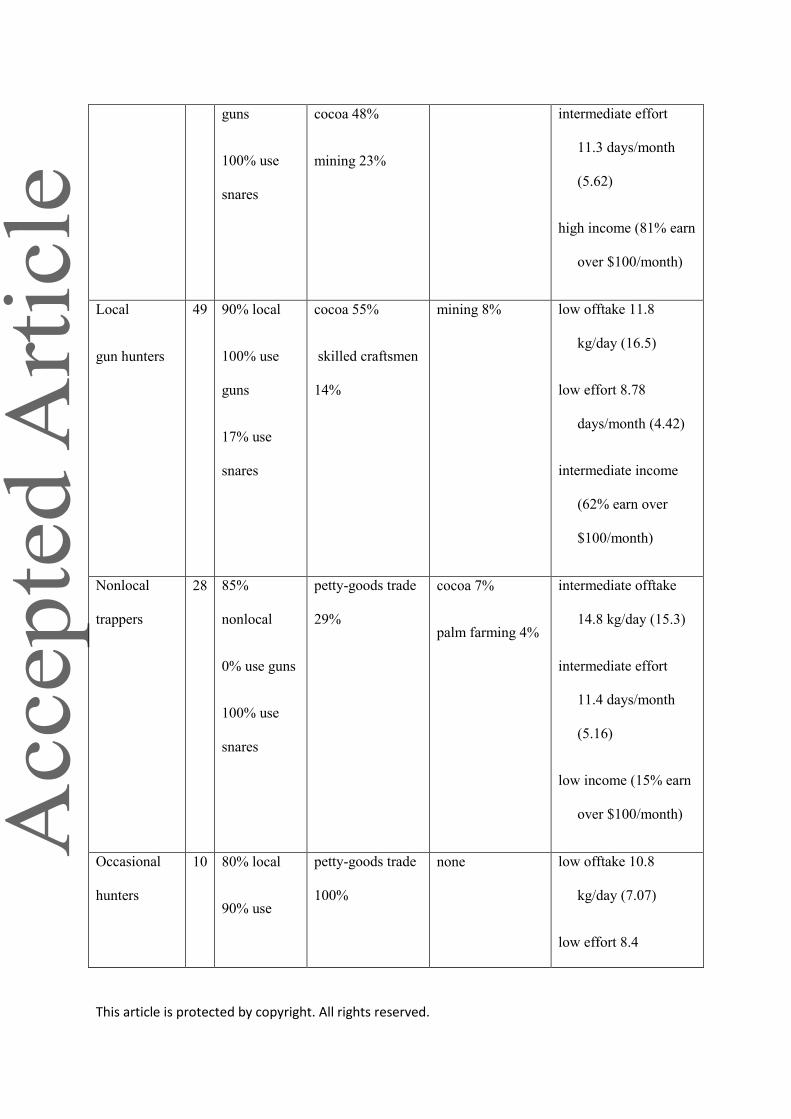
Local
trappers
31 87% local
26% use
palm 65% petty goods trade
13%
high offtake 19.7
kg/day (15.8)
This article is protected by copyright. All rights reserved.
guns
100% use
snares
cocoa 48%
mining 23%
intermediate effort
11.3 days/month
(5.62)
high income (81% earn
over $100/month)
Local
gun hunters
49 90% local
100% use
guns
17% use
snares
cocoa 55%
skilled craftsmen
14%
mining 8% low offtake 11.8
kg/day (16.5)
low effort 8.78
days/month (4.42)
intermediate income
(62% earn over
$100/month)
Nonlocal
trappers
28 85%
nonlocal
0% use guns
100% use
snares
petty-goods trade
29%
cocoa 7%
palm farming 4%
intermediate offtake
14.8 kg/day (15.3)
intermediate effort
11.4 days/month
(5.16)
low income (15% earn
over $100/month)
Occasional
hunters
10 80% local
90% use
petty-goods trade
100%
none low offtake 10.8
kg/day (7.07)
low effort 8.4
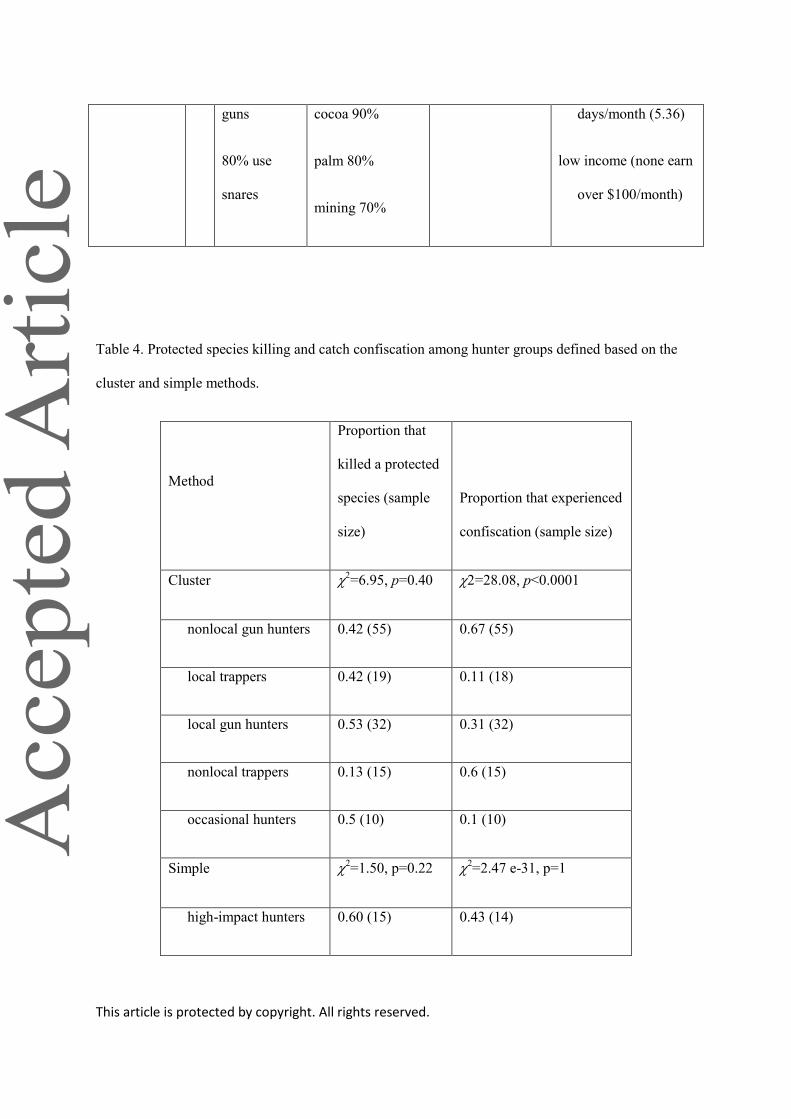
This article is protected by copyright. All rights reserved.
guns
80% use
snares
cocoa 90%
palm 80%
mining 70%
days/month (5.36)
low income (none earn
over $100/month)
Table 4. Protected species killing and catch confiscation among hunter groups defined based on the
cluster and simple methods.
Method
Proportion that
killed a protected
species (sample
size)
Proportion that experienced
confiscation (sample size)
Cluster =6.95, p=0.40 =28.08, p<0.0001
nonlocal gun hunters 0.42 (55) 0.67 (55)
local trappers 0.42 (19) 0.11 (18)
local gun hunters 0.53 (32) 0.31 (32)
nonlocal trappers 0.13 (15) 0.6 (15)
occasional hunters 0.5 (10) 0.1 (10)
Simple 2=1.50, p=0.22 2
=2.47 e-31, p=1
high-impact hunters 0.60 (15) 0.43 (14)
This article is protected by copyright. All rights reserved.
low-impact hunters 0.40 (116) 0.54 (116)
All hunters 0.42 (131) 0.45 (130)
Figure 1. Study site location (diagonal lines) in Liberia (gray, protected areas; dashed line, border).