Auctions for Charity: The Curse of the...
36
Auctions for Charity: The Curse of the Familiar * Jeffrey Carpenter † Damian S. Damianov ‡ Peter Hans Matthews § February 17, 2017 Abstract Recently there has been considerable interest in the use of raffles and auctions to fund public goods. Economists have developed theories that predict which of the standard mechanisms should do well and they have run a variety of experiments to test the per- formance of these mechanisms. One aspect that has been largely overlooked, however, is whether new mechanisms can yield even more of the public good. We run fundrais- ing events in the field at the meetings of a well-known service organization across the United States to examine the properties of five mechanisms: one that is common in the literature (first-price all-pay auction), two that are familiar to practitioners in the field (the English/live auction and the raffle), and two that are new (the “bucket” auction and a lottery-auction hybrid). Consistent with theory, we find large differences in per- formance between the two most familiar formats but these disparities are dwarfed by the differentials achieved using the new and less common formats. Our results demon- strate the continued potential of mechanism design to inform the provision of public goods and fundraising. Keywords: Public Good, Raffle, Lottery, Auction, Fundraising, Mechanism Design, Field Experiment. JEL Codes: C93, D44, D64, H41 * We thank Catherine Collins, Brent Davis, Ryan Freling, Joshua Foster, Ellen Green, Daniel Jones, Malcolm Kass, James Kelly, Andrew Kloosterman, Peter Kriss, Nick Lovejoy, Jens Schubert and Anand Shukla for research assistance. We also acknowledge the financial support of Middlebury College and the National Science Foundation (SES 0617778). † Corresponding author, Department of Economics, Middlebury College and IZA; [email protected]. ‡ Department of Economics and Finance, Durham University; [email protected]. § Department of Economics, Middlebury College; [email protected]. 1
Transcript of Auctions for Charity: The Curse of the...

Auctions for Charity: The Curse of the Familiar∗
Jeffrey Carpenter† Damian S. Damianov‡ Peter Hans Matthews§
February 17, 2017
Abstract
Recently there has been considerable interest in the use of raffles and auctions to fund
public goods. Economists have developed theories that predict which of the standard
mechanisms should do well and they have run a variety of experiments to test the per-
formance of these mechanisms. One aspect that has been largely overlooked, however,
is whether new mechanisms can yield even more of the public good. We run fundrais-
ing events in the field at the meetings of a well-known service organization across the
United States to examine the properties of five mechanisms: one that is common in the
literature (first-price all-pay auction), two that are familiar to practitioners in the field
(the English/live auction and the raffle), and two that are new (the “bucket” auction
and a lottery-auction hybrid). Consistent with theory, we find large differences in per-
formance between the two most familiar formats but these disparities are dwarfed by
the differentials achieved using the new and less common formats. Our results demon-
strate the continued potential of mechanism design to inform the provision of public
goods and fundraising.
Keywords: Public Good, Raffle, Lottery, Auction, Fundraising, Mechanism Design,
Field Experiment.
JEL Codes: C93, D44, D64, H41
∗We thank Catherine Collins, Brent Davis, Ryan Freling, Joshua Foster, Ellen Green, Daniel Jones,Malcolm Kass, James Kelly, Andrew Kloosterman, Peter Kriss, Nick Lovejoy, Jens Schubert and AnandShukla for research assistance. We also acknowledge the financial support of Middlebury College and theNational Science Foundation (SES 0617778).
†Corresponding author, Department of Economics, Middlebury College and IZA; [email protected].‡Department of Economics and Finance, Durham University; [email protected].§Department of Economics, Middlebury College; [email protected].
1
1 Introduction
“[T]he onus is on philanthropists, nonprofit leaders and social entrepreneurs to
innovate. But philanthropic innovation is not just about creating something new.
It also means applying new thinking to old problems, processes and systems.”
Laura Arrillaga-Andreessen, philanthropist
The regular conversion of donated goods and services into more liquid assets to fund public
goods is a familiar exercise to most charities and non-profits. According to the Internal
Revenue Service, for the reporting year 2012, almost 50 percent of the nearly 46 million
households that itemize deductions claimed non-cash charitable contributions. The esti-
mated fair market value of these contributions was almost 47 million dollars. Indeed, for
some organizations, this “transformation problem” is a formidable logistical challenge. Raf-
fles and auctions are common solutions to this problem and, over the last decade or two, a
vibrant literature on mechanism choice for non-profits has emerged. Along with the anal-
ysis of standard formats, a nascent literature has arisen that has offered new ones, which,
in theory, should do better. For both analytical and empirical reasons, however, an order-
ing of mechanism performance based on expected revenue, not to mention participation, is
complicated.
As a theoretical matter, revenue equivalence does not hold, even in the simplest strategic
environments wherein non-profits use the revenues to provide a public good. For example, the
sealed-bid analysis of Goeree et al. (2005), working within the structure developed in Morgan
(2000), was perhaps the first to show that in a world of altruistic, risk neutral bidders with
independent private valuations each of whom (also) receives a benefit that is proportional to
the total amount raised (aka “revenue proportional benefits”) “all-pay mechanisms,” includ-
ing raffles, should do better.1 The intuition is straightforward: in “winner-pay mechanisms,”
a class that includes most, but not all, familiar auction formats, a bidder who “tops” her
rivals foregoes the externalities associated with their bids. What remains unclear, however,
is the robustness of this result to the addition of new, perhaps dynamic, formats.
It is also hard to assess the relative performance of auction and raffle mechanisms with
revenue proportional benefits because the few experiments that have been conducted tend
to be modest as a consequence of each auction yielding just one revenue observation. In
addition, experiments often compare just a few existing formats and new ones have yet
to be tested or compared to the formats that are typically chosen by charities and other
1Engers and McManus (2007) confirm many of these predictions while extending the literature by ana-lyzing strategic choices of the auctioneer to set reserve prices or dissolve the auction. Carpenter et al. (2009)compare the same sealed bid mechanisms but allow participation to be endogenous.
2

organizations investing in the public good. On top of all this, aside from a few important
stylized facts, the experimental results have been inconclusive.
Considering standard formats, the experimental literature began with the study of char-
itable raffles. Morgan and Sefton (2000), in a laboratory study, confirm the hypothesis
(central to Morgan, 2000) that the provision of a public good will be enhanced by the addi-
tion of a raffle. Subsequently, Dale (2004) extended these results by examining the difference
in performance of raffles with fixed and endogenously determined prizes, confirming another
hypothesis of Morgan (2000) that fixed prize raffles do better. More recently, Carpenter and
Matthews (2015) use a field experiment to assess whether adjusting the incentives of the
raffle can affect performance on the extensive and intensive margins and result in greater
public good provision, a conjecture borne out in the data. Using a nonlinear pricing scheme
to make the raffle more efficient increases donations as does using a different scheme that
equalizes the chances of winning to increase participation.
The examination of auctions, in addition to raffles, in the lab began with the study of
Davis et al. (2006) who compared the raffle to an English auction and found that the raffle
did uniformly better, despite changes in the productivity of the public good and underlying
distribution of private values. Schram and Onderstal (2009) then compared the raffle to
first-price winner-pay and first-price all-pay auctions finding, as predicted by Goeree et al.
(2006), that the all-pay format does best. Corazzini et al. (2010), however, also in the lab,
find that the raffle tops the all-pay auction. In the field, Carpenter et al. (2008) compare
auction formats and also find that the all-pay auction does poorly when participation is
endogenous, a result confirmed by another field experiment - Onderstal et al. (2013).
The literature comparing new formats is much thinner. Evaluating two-stage versions
of the standard 50-50 raffle (in which the charity keeps half the proceeds and the other
half forms the prize), Goerg et al. (2015) discover that a “no draw-down” variant of the
standard format in which tickets are purchased in two stages and participants can see how
many were bought after the first stage performs best. The model of Goeree et al. (2005)
predicts that the k + 1th-price all-pay auction should always do better than the kth-price.
This means the second-price should do better than the first-price and, in the extreme, the
last-price all-pay auction should outperform any other sealed bid auction. Orzen (2008)
examines this conjecture in the lab and confirms it in the later rounds of his experiment.
Similarly in the lab, Carpenter et al. (2014) develop a dynamic version of a second-price
all-pay auction based on the war-of-attrition and show that it raises more money than other,
standard, sealed bid formats.
The experiment described in this paper was designed to extend the developing literature
on charitable mechanism design in a number of important dimensions. We report the results
3
of a field experiment conducted on behalf of a national service organization at almost a
hundred events across eleven US states. Our purpose was to provide a robust evaluation of
five auction mechanisms in a natural setting. The choice of which mechanisms to include
was driven by three considerations. First, to make our results as useful to practitioners as
possible, we included common mechanisms, ones that are used most frequently by charities
in the field. Considering there are only a few mechanisms that are used with any regularity,
the first two choices were straightforward: we included the English or “live” auction and
the common raffle. Not only does including these two formats allow us to test how familiar
formats compare to new and less familiar ones, a comparison of just these two mechanisms
is novel and should be of general interest for those organizations that might be reluctant to
try something new.
Second, and with a nod to recent theoretical developments, we included two formats that
ought to do better than those commonly used in the field. Goeree et al. (2005) show that
the all-pay auction, in which the highest bid wins but all bids are forfeited, should yield
more revenue than any winner-pay format like the second-price auction or, by extension,
its strategic equivalent, the live auction. Further, Orzen (2008) finds that in the common
value setting, the all-pay also does better than the raffle because, in essence, it is just an
inefficient version of the all-pay auction.2 More recently, Carpenter et al. (2014) show
that a “bucket auction” in which bidders take turns making monetary contributions to a
“bucket” and the winner of the prize is the person who makes the last contribution should
do even better than the standard all-pay because it too is all-pay but has the incentives
of a war of attrition, incentives that are particularly salient to competitive bidders. We
study theoretically a version of the bucket auction that captures the relationship between
the incentive to participate and the incentives to compete for entrants. While the bucket
auction is predicted to be dominated on participation by the standard formats, we show that
it should still be the best performing mechanism in terms of revenue, largely because of the
competitive environment it instills in participants.
Third, to examine the field validity of erstwhile empirical results, we were also careful to
consider mechanisms that have previously done well in the lab. Though already included,
both the all-pay and bucket auctions have done well in the lab environment (Orzen, 2008;
Schram and Onderstal, 2009; Corazzini et al., 2010; Carpenter et al., 2014) but this per-
formance is judged solely on the revenue properties of the mechanisms. Because we are
interested in participation too, we included a “hybrid” auction, one that combines a lottery
2The “topping” rational for the inferriority of winner-pay formats has already been discussed; however,considering the raffle, the bidder who buys the most tickets (i.e., bids the most) is only the most likely winnerwhile in the all-pay auction this bidder wins for sure.
4

for participants financed by entry fees with a live auction for those who choose to enter. Our
model predicts that this hybrid format should generate a level of entry on par with the com-
monly used formats (the live and the raffle) and it should outperform the all-pay formats
(the all-pay and the bucket). Behaviorally, this auction attracted the highest number of
bidders in laboratory experiments in which a large number of fundraising mechanisms were
studied (Carpenter et al. 2010).
We compare not just (unconditional) revenues across mechanisms but, to understand
the observed differences better, both their extensive (that is, participation) and intensive
(bids conditional on participation) margins. Our title is intended to underscore both our
central result and one of the most important lessons of our work: whatever the revenue
differential between the two most familiar auctions, both perform much less well than the
new mechanisms, a pattern that suggests that behavioral mechanism design has much to
contribute.
2 Study Design
When considering where to run our experiment, we sought regional variation to broaden
the representativeness of our results but we also required a host that, to a great extent,
could provide a controlled environment, one with a common setting and philanthropically
minded participants. After a successful local pilot, we decided to conduct our auctions at
meetings of various local Rotary International clubs across the United States. Rotary is
a service organization with 34,000 chapters and 1.2 million members worldwide. Members
believe in the “commitment to service above self” and when they are not volunteering in
their communities, members help raise money to support education and job training, provide
access to clean water, combat hunger, improve health and sanitation, and eradicate polio.3
Local Rotary clubs meet weekly over a meal (usually breakfast or lunch) and are accustomed
to hosting speakers and events in addition to the weekly business conducted at the meetings.
We “piggybacked” on this structure, which allowed us to control for the meeting environment
across different locations, to conduct charity auctions with randomly assigned formats at
various chapters across the country.
We chose a prize for each event that would be site-independent and context-free (hence,
gift certificates to local establishments were out). We decided that the prize should also be
familiar, something that would be natural at a fund-raiser and that it should be acquired
easily at our different field locations. Our lot consisted of two bottles of relatively high quality
wine (both received Wine Spectator scores of 90 out of 100). We included one bottle of non-
3https://www.rotary.org/en/about-rotary.
5

vintage prosecco (that showed a “good blend of baked apple, sour lemon and grapefruit”)
and one bottle of South American cabernet sauvignon (with “crushed plum, fig and black
currant fruit woven with Mauro tobacco and bittersweet cocoa”). The combined retail value
of the wine was $35. At each event, we provided the prize and all proceeds from the auction
went directly to supplement the fund-raising efforts of the local Rotary chapter that hosted
the event.
To conduct the events, we recruited eleven auctioneers from various graduate programs
in economics in addition to our two local research assistants. Each auctioneer attended a
training session at Middlebury College at which we explained the background and goals of
the research project, worked through the details of the protocol for each format, and met
with the president of the local Rotary chapter to strategize about the best way to gain
access to clubs. Shortly after arriving home, each auctioneer received a standard provision
of supplies that allowed him or her to conduct events. The auctioneers worked first to get on
the meeting schedule for clubs in their local area and were able to use our local president as a
reference. Once the schedule was set, we randomly assigned mechanisms to clubs, stratifying
on location with the purpose of making sure that each of our auctioneers would run multiple
different mechanisms.
Prior to every event, the Rotary chapter contacts let the members know that our research
assistant was going to visit to conduct a fundraiser for Rotary and then talk about raising
money for charity, more broadly. However, neither the leaders nor the members knew the
details of the event in advance. Most importantly, they did not know which mechanism
would be used. Once an event started, the auctioneer followed a highly scripted protocol.
Club members were given a large manila envelope and told to take out a survey to complete
while they ate. Once the surveys (and meals) had been completed, the auctioneer introduced
her- or himself and said that (s)he was there to talk about ways of turning donations in-kind
into cash but that they would start with an example – our wine auction. The auctioneer
then displayed and described the two bottles of wine (but did not reveal the retail price)
and stressed that we had donated the wine but all the revenue from the auction would go
directly to Rotary. Participants took out printed instructions from the envelope and read
along as the auctioneer explained the rules, all of which, including any mechanism-specific
language, are provided in the appendix.
Once any questions were clarified (by returning to the appropriate section of the instruc-
tions), the auction began. Club members were instructed to first pull out a “registration”
card on which they indicated whether or not they would participate. For the sealed bid
mechanisms (all-pay, raffle) this card also recorded their bids.
The bidding in each mechanism proceeded as follows. For the live auction, and the live
6

component of the hybrid auction, the auctioneer was told to always start by asking for an
opening bid of $25 and to reduce the opening bid by $5 decrements until someone entered.
Once the bidding began, the auctioneer was instructed to increase the price by $5 incre-
ments until (s)he could no longer and then drop to $1 increments until the final price was
determined. In the all-pay, participants wrote their bids on the registration cards and in-
cluded them with payment in a sealed envelope.4 In the raffle, participants indicated on the
registration card the number of $5 tickets they would like to purchase and the auctioneer
collected payments before randomly selecting the winning ticket. In the bucket, each partic-
ipant was given a common endowment: a clear bag that contained 30 red poker chips, each
worth $5. Participants were told that they would only have to pay for the chips that they
used and that more chips were available, if needed. They were then sorted by their randomly
assigned participant numbers and organized into a circle. The auctioneer presented a small
galvanized bucket to the person with the lowest participant number who started the auction.
This person could either place a $5 chip into the bucket or withdraw from the auction. The
auctioneer then cycled with the bucket around the circle (in order of increasing participant
numbers) asking each person to add a chip to the bucket or withdraw. Eventually all but
one bidder dropped out and the last remaining bidder was declared the auction winner. In
the hybrid, before getting to the live auction, members who wanted to participate had to pay
a $5 entry fee for which they received one lottery ticket. After the live auction had finished,
the auctioneer drew one of the tickets at random and the ticketholder won half of the entry
fees. The remaining half was added to the auction revenue and donated to Rotary (this is
known as a 50-50 lottery).
Once winners were determined and payments reconciled, the auctioneer awarded the
wine, announced how much money had been raised and publicly gave the chapter president
the auction proceeds. After this, there was typically enough time for the auctioneer to
do a quick debriefing. Members were given a two-page summary of the project with some
previous lab results and the auctioneer answered questions and discussed the problem of
in-kind donations and the virtues of the different charity auction mechanisms.
3 Participation, Bid and Revenue Predictions
To get a sense of the expected fundraising capabilities of the five mechanisms implemented
in the field, we study their equilibria and compare their relative performance on both the
extensive (participation) and intensive (expected bid) margins as a means to decompose
4It was common knowledge that payments could be made via credit card, check (made out directly toRotary) or cash (and that the auctioneer could make change, if needed).
7

any expected revenue differences. As a conceptual framework for our comparisons we use
and extend the baseline raffle model of Morgan (2000) by developing two new features:
endogenous participation, and alternative methods for fundraising, including the static and
dynamic auctions studied in our field experiment. This approach has recently been used to
gain insights into the way various aspects of the environment and the mechanism affect giving,
including heterogeneity in participant income (Corazzini et al. 2010), alternative payment
rules (Orzen, 2008), the use of multiple prizes (Lange et al. 2007) and the performance
of provisional mechanisms in which the prize is allocated only if total donations exceed its
value (Duffy and Matros, 2016). An alternative theoretical framework that has also been
considered in the recent literature is the symmetric independent private value model (see
e.g. Goeree et al. 2005 or Engers and McManus, 2007), yet in this framework it is difficult
to derive the equilibria of some mechanisms, e.g. the raffle.
Our focus on the complete information framework, though a simplification, is justified on
several grounds. As a practical matter, a complete information model allows us to provide
a complete characterization of equilibria and to generate theoretical predictions (on both
the extensive and intensive margins) for all five mechanisms, including the raffle.5 Further,
our theoretical set-up provides a unique equilibrium prediction for entry and competition in
almost all fundraising mechanisms.6 The common value assumption also affords comparative
static exercises with respect to changes in the value of the object for sale and the marginal
per capita return on the public good generated. We explore theoretically how the object used
and the appeal of the charitable cause to donors affect participation and giving behavior in
the different mechanisms both in absolute terms and in terms of ranking the five formats.
Such an exercise is not available in alternative models (such as those with independent
private values). Lastly, the complete information model allows us to analyze the changes
in the patterns of entry and competition that are due only to changes in the rules of the
fund-raising mechanism rather than other changes in the environment such beliefs about
other bidder’s preferences for the object and for the charitable cause (see e.g. Gneezy and
Smorodinsky, 2006 for a similar argument).
Complete information also allows us to explicitly model and explore the relationship be-
tween the competitiveness of the bidding environment created by the mechanism and the
entry of participants. While it has long been recognized that entry has important impli-
5As pointed out in Goeree et al. (2005), Fey (2008) and Ewerhart (2014), when participant values aredrawn privately closed form bid functions are hard, if not impossible, to derive for the raffle because of theformat’s inefficiency.
6The only exception is the hybrid format which supports three equilibria in its second (competition)stage–a feature which also affects the entry decisions. Yet, as we will see, these equilibria do not producesubstantial differences in the ranking of mechanisms.
8
cations for revenue, most of the extant theoretical literature considers a fixed number of
participants. The main question of interest in this literature, thus, has been the design
of mechanisms which extract the largest surplus from participants without taking into ac-
count that donors will tend to be less attracted to mechanisms that generate a high level of
competition. Our structure allows us to consider this aspect of fundraising too.
One apparent restriction of our setting is the focus on two competing donors. We impose
this restriction for exposition purposes only, because with two donors all equilibria can
be presented in closed form, and it is easier to observe the impact of parameter changes on
participation and contribution levels.7 As an important touchstone, we will see that while our
approach necessitated some compromise, it preserves the baseline logic of the more general
independent private value models. In fact, we show that the revenue ordering derived in
Goeree et al. 2005 can be recovered from our formulation when the prize is of sufficient
value to the bidders.
3.1 Preliminaries
Two participants i = 1, 2 compete for a single indivisible object of common value, V , which
will be awarded at the fundraising event using one of five specific mechanisms. Following the
recent theoretical literature on charitable fundraising (see e.g. Goeree et al. 2005; Engers
and McManus, 2007; Carpenter et al. 2010; Corazzini et al. 2010) we assume that donors
have altruistic preferences captured by the positive marginal per capita return, α, that
they derive from the charitable contributions. We can interpret the studied mechanisms
as incentive-based schemes for fundraising which differ in their degree of effectiveness in
exchanging a monetary value of size V for donations by harnessing the bidders’ preferences
for the charitable cause.
Bidders decide either to enter the fundraiser or not, whereby non-entry implies a contribu-
tion of 0. If they enter, participants must contribute at least 1 monetary unit (corresponding
to $5 in the field experiment), yet the mechanism structure allows them to compete further
for the item by raising their contribution levels to 2 monetary units. Specifically, bidding 1
or 2 in the sealed bid formats – which we associate with entry – corresponds to purchasing 1
or 2 tickets in the raffle, and submitting a sealed bid of 1 or 2 monetary units in the all-pay
auction. Entry in the dynamic, or interactive, formats (the bucket, the live auction and
the hybrid auction) is associated with a bid of 1, although bidders can compete further by
7Indeed, little intuition is gained from expanding the number of donors and the cost is substantial -equilibria would need to be presented as solutions to systems of equations rather than closed form expressions.This would limit the ability to attribute changes in performance to changes in the relevant value and publicgood productivity parameters.
9
raising their bids to 2.
In the following analysis we derive the symmetric equilibria of the five mechanisms. We
begin with the common, static, formats and then analyze the dynamic mechanisms, including
our two novel formats.
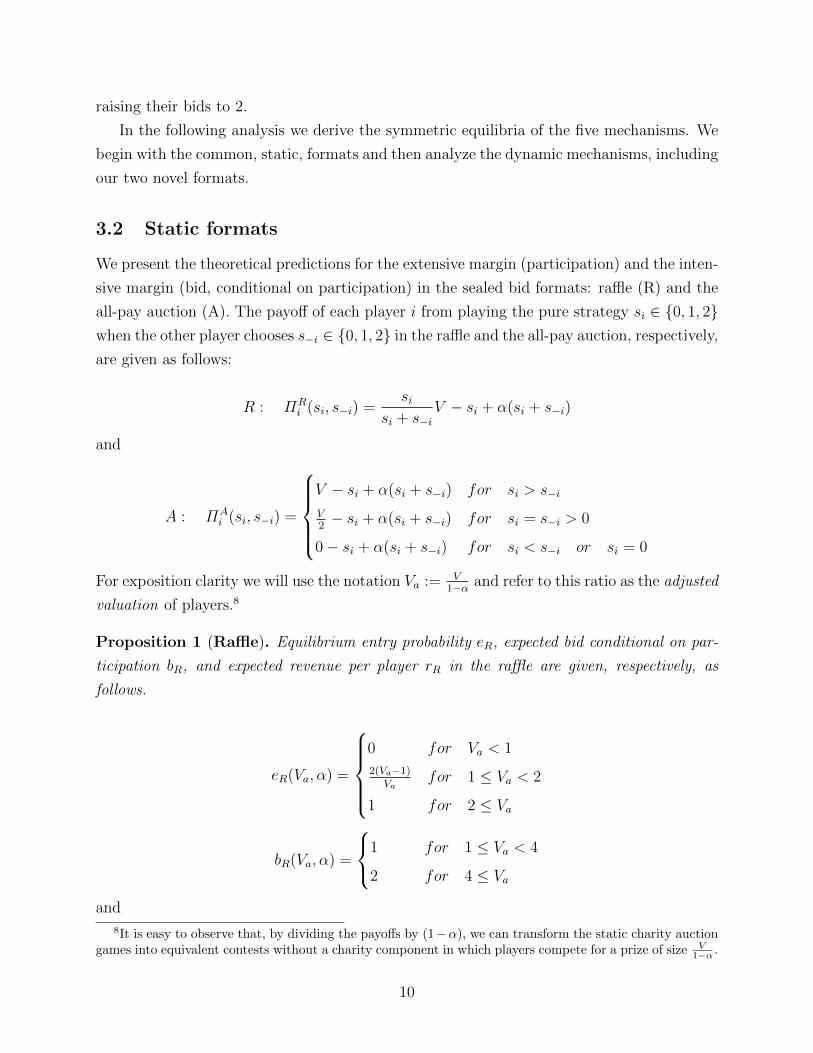
3.2 Static formats
We present the theoretical predictions for the extensive margin (participation) and the inten-
sive margin (bid, conditional on participation) in the sealed bid formats: raffle (R) and the
all-pay auction (A). The payoff of each player i from playing the pure strategy si ∈ {0, 1, 2}when the other player chooses s−i ∈ {0, 1, 2} in the raffle and the all-pay auction, respectively,
are given as follows:
R : ΠRi (si, s−i) =
sisi + s−i
V − si + α(si + s−i)
and
A : ΠAi (si, s−i) =
V − si + α(si + s−i) for si > s−i
V2− si + α(si + s−i) for si = s−i > 0
0− si + α(si + s−i) for si < s−i or si = 0
For exposition clarity we will use the notation Va := V1−α and refer to this ratio as the adjusted
valuation of players.8
Proposition 1 (Raffle). Equilibrium entry probability eR, expected bid conditional on par-
ticipation bR, and expected revenue per player rR in the raffle are given, respectively, as
follows.
eR(Va, α) =
0 for Va < 1
2(Va−1)Va
for 1 ≤ Va < 2
1 for 2 ≤ Va
bR(Va, α) =
1 for 1 ≤ Va < 4
2 for 4 ≤ Va
and
8It is easy to observe that, by dividing the payoffs by (1−α), we can transform the static charity auctiongames into equivalent contests without a charity component in which players compete for a prize of size V
1−α .
10
rR(Va, α) =
0 for Va < 1
2(Va−1)Va
for 1 ≤ Va < 2
1 for 2 ≤ Va < 4
2 for 4 ≤ Va
Proof. See Appendix.
A notable property of the raffle is that players do not employ mixed strategies in their
decisions to purchase a second raffle ticket. That is, they do not randomize between non-
entry and the purchasing of two tickets or between purchasing one ticket and purchasing two
tickets. This is due to the decreasing marginal benefit of purchasing a second ticket: the
second ticket reduces the chances of a bidder winning with her first ticket.
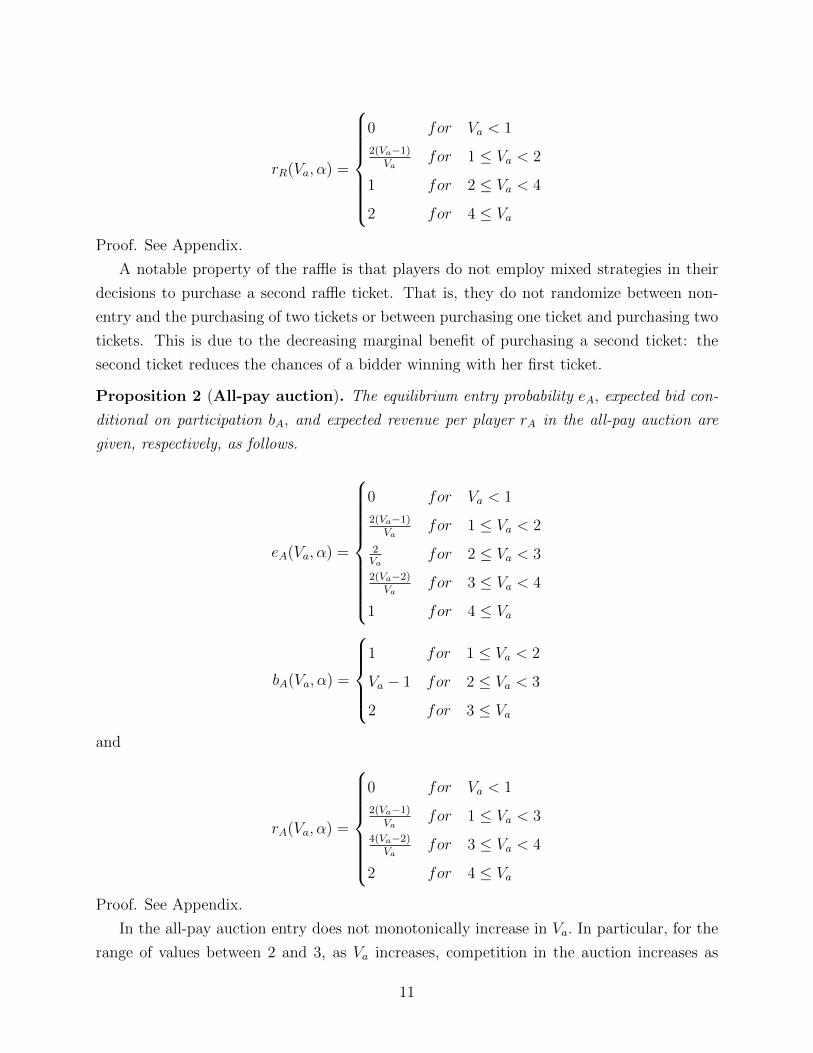
Proposition 2 (All-pay auction). The equilibrium entry probability eA, expected bid con-
ditional on participation bA, and expected revenue per player rA in the all-pay auction are
given, respectively, as follows.
eA(Va, α) =
0 for Va < 1
2(Va−1)Va
for 1 ≤ Va < 2
2Va
for 2 ≤ Va < 3
2(Va−2)Va
for 3 ≤ Va < 4
1 for 4 ≤ Va
bA(Va, α) =
1 for 1 ≤ Va < 2
Va − 1 for 2 ≤ Va < 3
2 for 3 ≤ Va
and
rA(Va, α) =
0 for Va < 1
2(Va−1)Va
for 1 ≤ Va < 3
4(Va−2)Va
for 3 ≤ Va < 4
2 for 4 ≤ Va
Proof. See Appendix.
In the all-pay auction entry does not monotonically increase in Va. In particular, for the
range of values between 2 and 3, as Va increases, competition in the auction increases as
11

players bid 2 more often, a behavior which discourages entry for this interval of values. As
we will see in the subsequent analysis, such equilibrium behavior is observed in other all-pay
formats (e.g., the bucket auction).
3.3 Dynamic formats
The dynamic formats used in the field experiment are the bucket auction (B), the live auction
(L) and the Lottery-auction hybrid (H). We begin with a description of the rules and then
analyze bidding in these three formats. In all dynamic formats, bidders first decide whether
to enter or not, an action that is observed by the other player. If no player enters, the item
remains unsold and the mechanism has raised no funds. If only one player enters, this player
wins the item and pays 1.9 If both players enter, they can decide either to compete further,
i.e. raise their bids, or not. With these preliminaries, we describe the payoffs in the three
dynamic mechanisms. Payoffs in the bucket auction are given by
B : ΠBi (si, s−i) =
V − 1 + α for si ∈ {1, 2} and s−i = 0
V − 2 + 3α for si = 2 and s−i = 1
V2− 2 + 4α for si = s−i = 2
V2− 1 + 2α for si = s−i = 1
−1 + 3α for si = 1 and s−i = 2
α for si = 0 and s−i ∈ {1, 2}
0 for si = s−i = 0
In the Lottery-auction hybrid the payoffs are given as follows
H : ΠHi (si, s−i) =
V − 12
+ α2
for si ∈ {1, 2} and s−i = 0
V − 32
+ 2α for si = 2 and s−i = 1
V2− 1 + 2α for si = s−i = 2
V2− 1
2+ α for si = s−i = 1
2α for si = 1 and s−i = 2
α2
for si = 0 and s−i ∈ {1, 2}
0 for si = s−i = 0
9In the Lottery-auction hybrid, players receive 1 lottery ticket for their participation. Half of the fundsraised go toward funding the lottery prize, and the expected payment for participation is only 1
2 . In theother two dynamic formats bidders indeed contribute a net amount of at least 1.
12

The live auction is the only winner-pay format. Payoffs in the live auction are given by
L : ΠLi (si, s−i) =
V − 1 + α for si ∈ {1, 2} and s−i = 0
V − 2 + 2α for si = 2 and s−i = 1
V2− 1 + 2α for si = s−i = 2
V2− 1
2+ α for si = s−i = 1
2α for si = 1 and s−i = 2
α for si = 0 and s−i ∈ {1, 2}
0 for si = s−i = 0
Results on equilibrium bidding in the dynamic formats are presented in the next three
propositions.
Proposition 3 (Bucket auction). The equilibrium entry probability eB, expected bid con-
ditional on participation bB, and expected revenue per player rB in the bucket auction are
given, respectively, as follows.
eB(Va, α) =
0 for Va < 1
2(Va−1)Va
for 1 ≤ Va < 2
2(Va−1)
Va+2− 2α1−a
for 2 ≤ Va < 4− 2α1−α
1 for 4− 2α1−α ≤ Va
bB(Va, α) =
1 for 1 ≤ Va < 2
2 for 2 ≤ Va
and
rB(Va, α) =
0 for Va < 1
2(Va−1)Va
for 1 ≤ Va < 2
4(Va−1)
Va+2− 2α1−a
for 2 ≤ Va < 4− 2α1−α
2 for 4− 2α1−α ≤ Va
Proof. See Appendix.
The bucket auction is similar to the all-pay auction in that entry is not monotonically
increasing in Va for some parameter values. As the adjusted value for the object increases,
so does competition for the item, which for some parameter values negatively impacts entry.
13

Further, the bucket auction entails a “penalty” for non-contributors as it allocates the item
to the participating donor for a price that is, on average, lower than the price paid in the
all-pay auction (in the bucket auction the winner, who ordinarily pays 2, pays just 1 if the
other player does not enter). In contrast, in the all-pay auction, if a bidder submits a sealed
bid of 2, which occurs with positive probability in equilibrium, this bidder will contribute 2.
This feature serves to encourage entry in the bucket auction.
The format that we consider next is the Lottery-auction hybrid.
Proposition 4 (Hybrid auction). The hybrid auction has a unique symmetric equilibrium
for Va <1
1−α and for Va > 2. For 11−α < Va < 2 this auction has three equilibria. In
these equilibria, in the competition stage both bidders either bid 1, or bid 2, or play a mixed
strategy. The entry probability eH , expected bid conditional on participation bH , and expected
revenue rH in the equilibrium with the highest level of competition (both bidders bid 2) and in
the equilibrium with the lowest level of competition (both bidders bid 1) are given as follows
eH(Va, α) =
0 for Va <12
2Va−1Va
for 12≤ Va < 1
1 for 1 ≤ Va <1
1−α
{1; 2Va−1Va+1− α
1−α} for 1
1−α ≤ Va < 2− α1−α
1 for 2− α1−α ≤ Va
bH(Va, α) =
1 for 1
2≤ Va <
11−α
{1, 2} for 11−α ≤ Va < 2
2 for 2 ≤ Va
and
rH(Va, α) =
0 for Va <12
2Va−12Va
for 12≤ Va < 1
12
for 1 ≤ Va <1
1−α
{12; 2Va−1
Va+1− α1−α} for 1
1−α ≤ Va < 2− α1−α
{12; 1} for 2− α
1−α ≤ Va < 2
1 2 ≤ Va
Proof. See Appendix.
14

The hybrid format is designed to encourage entry due to its lottery component. We
complete the analysis by characterizing the equilibrium of the live auction.
Proposition 5 (Live auction). The equilibrium entry probability eL, the expected bid con-
ditional on participation bL,and expected revenue per player rL in the live auction are given,
respectively, as follows
eL(Va, α) =
0 for Va < 1
1 for 1 ≤ Va
bL(Va, α) =
1 for 1 ≤ Va < 2
2 for 2 ≤ Va
and
rL(Va, α) =
0 for Va < 1
12
for 1 ≤ Va < 2
1 for 2 ≤ Va
The proof is straightforward and is therefore omitted. The live auction is the only winner-pay
format. That is, bidders who participate but do not win are not required to pay. Therefore,
optimal bidding in the live auction involves competing for the item as long as the price is
below the adjusted valuation for the item.
3.4 Entry, expected bid, and revenue rankings
The purpose of our theoretical analysis is to produce performance predictions using a frame-
work amenable to all five formats. Thankfully, when values are sufficiently high our structure
replicates the revenue rankings found in the existing literature (i.e., the structure preserves
the important underlying intuition) and the resulting closed form solutions for both the tra-
ditional and the new formats allow us to make relatively crisp predictions on both margins.
Corollary 6 (Participation). For Va ≥ 2 the hybrid auction (H), the live auction (L) and
the raffle (R) generate the same level of participation and weakly greater participation than
the bucket (B) and all-pay (A) auctions (i.e., H = L = R ≥ B ∼ A). The ranking of the
bucket and all-pay auctions depends on the parameters. Specifically, the bucket generates a
15

higher level of entry than the all-pay when
Va > 1 +
√3− 2α
1− α
and a lower level when the opposite inequality holds.
When Va ≥ 2 bidders enter the hybrid auction, the live auction, and the raffle with a
probability of one. Hence, H = L = R. In the bucket and the all-pay auction bidders enter
with a probability of less than one for some parameter values. When 2 ≤ Va < 3 entry in
the all-pay auction is 2Va
and entry in the bucket auction is 2(Va−1)
Va+2− 2α1−α
. Entry in the bucket
auction exceeds entry in the all-pay auction when
2
Va<
2(Va − 1)
Va + 2− 2α1−α⇔ Va > 1 +
√3− 2α
1− α
When 3 ≤ Va < 4 it can easily be established that entry in the bucket auction, 2(Va−1)
Va+2− 2α1−α
exceeds the entry in the all-pay auction 2(Va−2)Va
. Indeed
2(Va − 1)
Va + 2− 2α1−α
>2(Va − 1)
Va + 2
and for Va < 4 it is straightforward to verify that
2(Va − 1)
Va + 2>
2(Va − 2)
Va.
Corollary 7 (Expected bids). The ranking of mechanisms with respect to expected bids
conditional on participation is as follows.
H ≥ B = L ≥ A ≥ R
The stated ranking is directly established by comparing the derived expected bids con-
ditional on participation in the five formats. The hybrid format generates higher bids than
the bucket auction because, once the participation fee is paid, in the hybrid format bidders
compete in a winner-pay auction. The bucket auction, in contrast, is an all-pay auction in
which losing participants are required to pay their bids. Although the hybrid format weakly
dominates the other formats with respect to participation and expected bids, its lotto feature
and its winner-only payment rule make it inferior in terms of revenue as we demonstrate in
the next corollary.
16

Corollary 8 (Revenue). For Va ≥ 2 the revenue ranking of mechanisms is as follows.
B ≥ A ≥ R ≥ H = L
The stated ranking results can be easily established by direct inspection of the payoffs.
To prove that the bucket auction raises more revenue than the all-pay auction (B ≥ A), for
example, observe that for Va ≥ 2 the following inequalities hold.
4(Va − 1)
Va + 2− 2α1−a
>4(Va − 1)
Va + 2>
4(Va − 2)
Va.
Corollary 9 (Replication). Recognizing the implied isomorphisms with sealed bid formats
(Live ≈ Second-price winner-pay; Bucket ≈ Second-price all-pay) our revenue analysis repli-
cates that of Goeree et al. (2005) for Va ≥ 2 and sufficiently small bid increments.
SPAP ≥ FPAP ≥ Raffle ≥ SPWP
4 Results Overview
In total, our research auctioneers conducted 96 events in 11 states with 1706 Rotary club
members. The geographic distribution of our auctions is depicted in Figure 1. Starting in
the Northeast, 4 sessions were conducted in rural Maine (52 participants), 8 sessions were
conducted in Vermont (162 participants), 2 were conducted in upstate New York (20 par-
ticipants) and 30 sessions were conducted near Pittsburgh and Philadelphia in Pennsylvania
(490 participants). Among the mid-Atlantic and southern states we conducted 4 sessions in
Virginia (48 participants), 15 sessions in the Knoxville area of Tennessee (280 participants),
1 session in Georgia (18 participants) and 2 in Tallahassee, Florida (40 participants). In the
Midwest, we visited 5 Rotary chapters in Indiana (94 participants) and 21 chapters in Texas
(418 participants). Lastly, on the west coast, 4 sessions were conducted in California (85
participants).
17

Figure 1: Auction sessions and participation by state.
We were able to collect auction data from 95 of our 96 sessions (in one case the meeting
dissolved earlier than planned), which yielded almost 20 observations per mechanism. At
the session level, we gathered participation, bid and revenue data from 20 all-pay auctions,
19 bucket auctions, 19 hybrid auctions, 19 live auctions, and 18 raffles. Overall, attendance
at our events averaged 17.92 Rotary members (the minimum was 5 and the maximum was
29) and 11.79 of these members, on average, participated. This corresponds to a mean
participation rate of close to 70%. The mean bid, excluding those people who chose to not
participate but including those participants who opted in but then bid zero, was $24.41. In
terms of revenue, our events raised a total of $18,081 for Rotary International. Perhaps more
salient is the fact that, on average, we raised $190.32 with just $35 of wine.
Table 1: Treatment Balance
All-pay Bucket Hybrid Live Raffle
Age 57.93 58.12 56.80 56.00 56.79
Female 0.26 0.22 0.23 0.25 0.23
White 0.82 0.84 0.87 0.90 0.89
College or More 0.70 0.68 0.69 0.76 0.76
High Income 0.54 0.56 0.50 0.51 0.53
Notes: Participant characteristic means by treatment.
Given the membership of Rotary, our participants were representative. The average age
of session attendees was 57.11, 24% were female, and 86% had at least a college education.
The median income of the group (measured in intervals) was $100k-$124k. For the purposes
of our analysis we create an indicator (“High Income”) for at least this level of earnings.10
10Specifically, there were ten household income ranges participants could choose from (starting with “lessthan $25k” and ending with “more than $225k”) and High Income is coded as 1 when a participant choseone of the top five choices (and is coded as 0 otherwise).
18
Considering randomization to auction format based on observables, Table 1 indicates balance
was achieved, for the most part.11
5 Mechanism Differences
In many cases charities that conduct fundraisers such as ours are as interested in participation
as they are in revenue. An event that draws in potential donors because it is interesting, fun
or stimulating may raise as much or more money in the long run through the development
of a “warm list” (Landry et al. 2010) as one that initially generates a lot of revenue but
leaves donors feeling “tapped out”. In addition, final auction revenue is determined both by
bidding behavior and participation. With this in mind, we analyze our auction data in three
steps. We start by testing for differences in participation rates across the five mechanisms,
we then repeat the tests to explore any differences in bidding behavior and we conclude the
analysis by comparing the revenues generated by each mechanism.
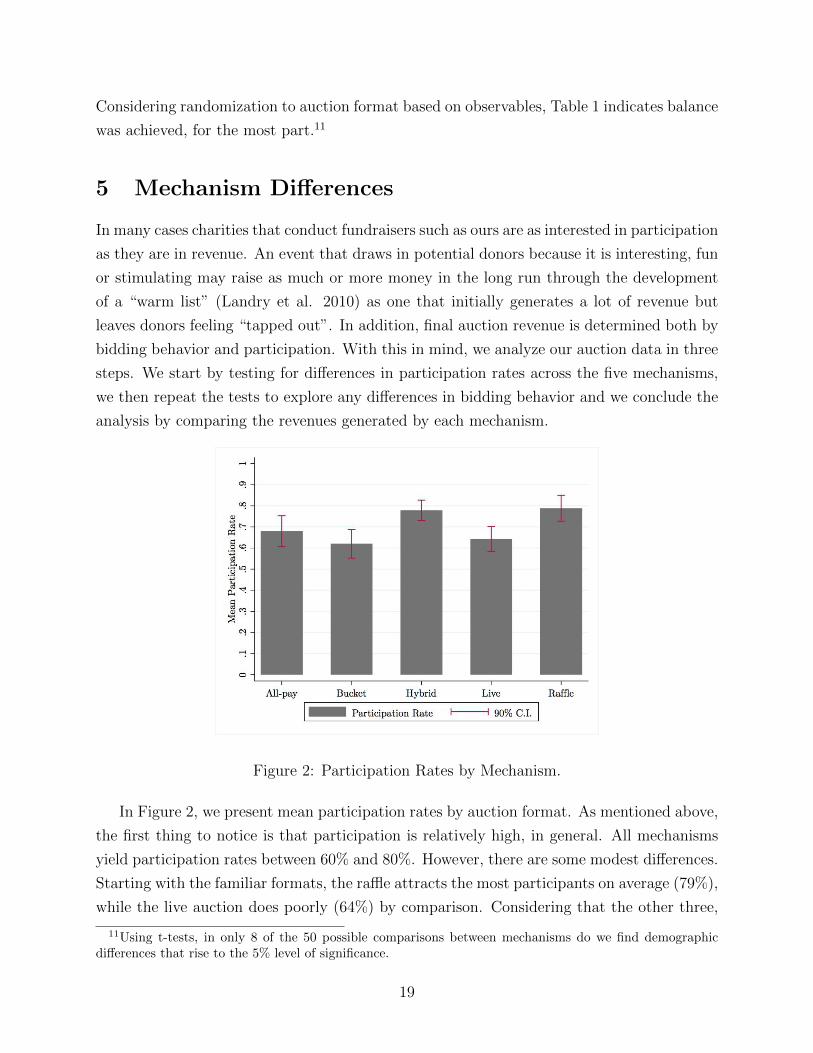
Figure 2: Participation Rates by Mechanism.
In Figure 2, we present mean participation rates by auction format. As mentioned above,
the first thing to notice is that participation is relatively high, in general. All mechanisms
yield participation rates between 60% and 80%. However, there are some modest differences.
Starting with the familiar formats, the raffle attracts the most participants on average (79%),
while the live auction does poorly (64%) by comparison. Considering that the other three,
11Using t-tests, in only 8 of the 50 possible comparisons between mechanisms do we find demographicdifferences that rise to the 5% level of significance.
19

less common formats, perform (more or less) somewhere in between the raffle and the live,
it is unlikely that mechanism familiarity drives our participation differences.
There are a few other things to note in Figure 2. First, in line with our theoretical
prediction (see Corollary 6), the hybrid format does well on participation, a finding that
is consistent with previous laboratory experiments (Carpenter et al. 2010). Second, the
all-pay attracted more participation than it has in previous field trials (e.g., Carpenter et
al. 2008 and Onderstal et al. 2013). One interpretation of this difference with the previous
empirical literature is that the all-pay seems to do well among people inclined to give but
not particularly well among those who might be less motivated by the cause. Also, and in
contrast to our theoretical predictions, the all-pay auction was more attractive to participants
than the live auction despite requiring entrants to forfeit their bids regardless of winning or
losing. Third, despite being a war-of-attrition, the bucket auction attracts a fair number
of participants, nearly as many as a number of the other formats. This is less surprising,
however, because Carpenter et al. (2014) show that bucket participation rates are similar to
those of other mechanisms in the lab.
To generate conservative estimates of the differences in participation, in Table 2 we begin
by regressing event/session level participation rates on auction format indicators in the first
two columns. The live auction is the omitted, baseline, mechanism. The first column mostly
replicates the findings presented in Figure 2 – there are two groups of mechanisms separated
by a participation differential of slightly more than 10%. In one group, the raffle and the
hybrid attract almost 80% of bidders and in the other group the all-pay, the bucket and
the live attract closer to 65%. Comparing all combinations of the point estimates, confirms
this grouping. In the second column we add experimenter (i.e., auctioneer) fixed effects to
make sure that we aren’t attributing differences to the mechanisms when they are being
driven by the differential “charm” of our auctioneers. We also add the average age of the
event attendees, the number of female attendees, the number of attendees who earned a
college degree or more education and the number of attendees who have incomes larger than
the median of our entire sample. Using IRS and Census data from 2010 we also created
controls at the zip code level for household-level averages of adjusted gross income, reported
unemployment insurance received, charitable contributions, homeownership, and travel times
to work. Although some of the auctioneers were more charming than others (resulting in
the large jump in the adjusted R2), the differences are largely orthogonal to our mechanism
treatments (as stratification should ensure). The addition of the other variables (to control
to some extent for willingness to pay, philanthropic environment, population density, and,
perhaps sprawl/stress) contributes little to the explanatory power of the model and has no
effect on our participation estimates.
20

In columns (3) and (4) of Table 2 we redo the analysis using the individual-level partici-
pation data. Here the point estimates are nearly identical but measured a bit more precisely
because of the increase in the number of observations. In the end, we conclude that the fa-
miliar raffle and the not so familiar hybrid (with its lottery component) attract more bidders
than the other three mechanisms, however, while significant, the participation differences
are modest.
Table 2: Participation Differences
(1) (2) (3) (4)
All-pay (I) 0.037 0.036 0.024 0.031
(0.055) (0.057) (0.044) (0.046)
Bucket (I) -0.022 -0.007 -0.031 -0.013
(0.053) (0.059) (0.044) (0.053)
Hybrid (I) 0.136*** 0.128** 0.139*** 0.132***
(0.044) (0.054) (0.035) (0.045)
Raffle (I) 0.146*** 0.156*** 0.148*** 0.152***
(0.049) (0.054) (0.045) (0.043)
Intercept 0.643*** 0.766*** 0.616*** 0.566***
(0.034) (0.244) (0.028) (0.072)
Level of Analysis Ses. Ses. Ind. Ind.
Experimenter Fixed Effects No Yes No Yes
Participant Demographics Included No Yes No Yes
Zip Code Level Controls Included No Yes No No
Observations 95 95 1690 1583
Adjusted R2 0.13 0.40 0.02 0.03
Notes: Dependent variable is event participation rate for session-level analysis and a participation indicator
for individual analysis; omitted mechanism is the Live auction; OLS; (robust standard errors); * p<0.10,
** p<0.05, *** p<0.01; demographics include mean age, number of female attendees, number of
attendees with high income, number of attendees with a college degree or more education; other zip code
level controls include averages of adjusted gross income, unemployment insurance, charitable contributions,
homeownership rates and travel times to work.
21

Figure 3: Bids by Mechanism (participants only).
Average bids, including those from people who participated but ended up bidding zero
(18% of the sample), are summarized by format in Figure 3. The first thing to notice is that
the mean bids in the live auction and the hybrid are only slightly lower than the retail value
of the wine. On average, participants bid $28.22 in the live auction and $28.42 in the hybrid
(excluding the $5 participation fee for the hybrid) which are statistically indistinguishable in
the individual-level data (t = 0.07, p = 0.95). Another thing to notice is that participants in
the all-pay and the raffle react as expected to the fact that their bids are forfeited regardless
of winning or losing - they bid less than participants in the winner-pay formats. Again using
the individual-level data, the all-pay mean bid is significantly lower than all formats except
the raffle (p < 0.01 for all comparisons). Bidders in the third all-pay format, the bucket, do
not reduce their bids, however. The mean bid in the bucket is $35.58, an amount significantly
greater than all the other formats (p ≤ 0.05 or lower) and indistinguishable from the retail
values of the prize (t = 0.20, p = 0.84).
As with the participation data, in Table 3 we first offer guarded bid point estimates by
collapsing the data to session averages in columns (1) and (2). Compared to the live auction,
participants in the all-pay and raffle bid considerably less. Conditional on participating, all-
pay donors bid approximately $9 less than live auction bidders and raffle donors give even
less, approximately $14. Both of these differences are highly significant and do not depend
much on whether demographic or experimenter controls are included. As is apparent in Table
3, the hybrid point estimate is never significantly different from zero suggesting there are
no synergies between the component lottery and auction of the hybrid mechanism. Again,
auctioneer fixed effects and participant demographics have little effect on these estimates.
22

Lastly, the point estimate on the bucket differential hovers around $6 which is a significant
sum, but there is not enough power in the auction-level data to identify it precisely.
Table 3: Bid Differences
(1) (2) (3) (4)
All-pay (I) -9.315*** -8.607** -8.835*** -9.155***
(3.066) (3.848) (1.975) (2.283)
Bucket (I) 7.145 6.690 8.103** 6.198*
(4.710) (5.360) (3.540) (3.674)
Hybrid (I) 1.021 1.723 1.225 -0.665
(4.936) (5.126) (3.107) (2.884)
Raffle (I) -13.828*** -13.780*** -14.276*** -14.990***
(3.182) (4.593) (1.810) (12.541)
Intercept 27.862*** 10.165 18.729* 20.421*
(2.461) (26.971) (9.969) (10.687)
Lambda 18.004 8.517
(18.697) (20.090)
Level of Analysis Ses. Ses. Ind. Ind.
Experimenter Fixed Effects No Yes No Yes
Participant Demographics Included No Yes No Yes
Zip Code Level Controls Included No Yes No No
Observations 95 95 1554 1535
Adjusted R2 or Rho 0.21 0.27 0.56 0.29
Notes: Dependent variable is mean bid for session-level and bid for individual-level analyses; the omitted
mechanism is the Live auction; OLS or Heckman with instruments of having cash on hand and a willingness
to participate in a follow-up survey; (robust or bootstrap standard errors); * p<0.10, ** p<0.05, *** p<0.01;
demographics include mean age, number of female bidders, bidders with high income and bidders with a
college degree or more education; zip code level controls include averages of adjusted gross income,
unemployment insurance, charitable contributions, homeownership rates and work travel times.
In the second two columns of Table 3, we re-examine bids by taking advantage of the
23

individual level data. Doing so increases the power of the analysis considerably and has
the additional benefit of allowing us to instrument for selection. We utilize a standard two-
stage Heckman selection model in which the first stage instrument comes from our survey.
Although all methods of payment were possible on the day of an event, we expected people
to be more likely to participate if they had cash on hand (and that this would be equally
true for all the mechanisms). Indeed, having access to cash at the time of the event is a
strong predictor in the first-stage regressions: it increases the probability of participating by
8.5 percentage points (and has no significant effect on bids conditional on participation). In
addition, the estimated effect of selection (Lambda × the average mills value) is economically
significant: those who choose to participate submit bids that are between $4.41 and $9.24
higher. But, despite all this, a Hausman test indicates that the estimated selection effect
does not bias the collection of mechanism coefficients significantly. Most importantly, the
only noticeable change we see from using the individual-level data is that our estimate of
the bucket differential increases and is now significant. While all-pay bidders in the sealed
bid auction and raffle reduce bids as expected compared to the live and hybrid auctions, we
find that bucket auction bidders donate more than all others.
At this point the careful reader should have a good sense of what the revenue comparisons
will look like. Given participation is roughly the same across mechanisms but participants
tend to reduce their bids in only two of the three all-pay mechanisms, the one in which they
do not reduce their bids must do well. Indeed, in Figure 4 we report average revenues by
mechanism and find that the most familiar auction mechanism (the live) tends to double the
retail value of our prize while the least familiar (the bucket) increases it by more than an order
of magnitude. Compared to the other formats, the live auction appears to underperform,
but it actually did rather well for Rotary. On average, the live auction garnered $63, which
is close to double the wine’s retail value. The hybrid, with its two components, did a bit
better, $103, on average.12 And, consistent with theory, the all-pay ($211 on average) did
slightly better than the raffle ($179) but both do considerably better than either the hybrid
or live auctions. All the revenue differences are dwarfed, however, when we consider the
bucket, which raised an average of $393. Not only does the bucket come close to doubling
the revenues generated in either the all-pay or the raffle, it yields more than six times the
revenue raised in the live auction.
12However, if we just consider the live auction proceeds (i.e., in the absence of the lottery revenue), thehybrid generates an average of $71 which is indistinguishable from the live (p=0.50).
24

Figure 4: Revenue Raised by Mechanism.
In Table 4 we examine the revenue differences more closely. Again, the live auction is used
as the baseline mechanism. Column (1) suggests that all the mechanisms yield significantly
more revenue than the live auction. Comparing the point estimates we also confirm that
the hybrid raises significantly less money than any mechanism except for the live auction,
the all-pay and the raffle raise equal amounts of revenue, and the bucket earns significantly
more revenue than any other mechanism. In column (2) we add experimenter fixed effects,
bidder characteristics and the zip code level controls to little effect.13 In column (3) we
include the number of active bidders (instrumented using the start time of the event - more
active bidders turn out at breakfast meetings) to make sure that the revenue differences are
not being driven by differences in participation. Although it is the case that, on average,
another bidder increases revenue by slightly less than $12 across mechanisms, controlling
for this affects our estimates of mechanism performance only slightly. Like the rest of the
analysis, our revenue results are very robust: the hybrid and live auctions perform relatively
poorly, the all-pay auction and raffle do relatively well, but the bucket auction raises the
most revenue for charity in this field setting.
13Judging by the small bump in adjusted R2 between the first two columns of Table 2, the differencesamong our auctioneers effect participation primarily and not revenue.
25

Table 4: Revenue Differences
(1) (2) (3)
All-pay (I) 147.965*** 164.519*** 168.854***
(25.497) (32.027) (33.594)
Bucket (I) 329.474*** 333.863*** 345.748***
(59.345) (76.732) (82.726)
Hybrid (I) 39.895*** 57.518** 55.608*
(11.622) (26.787) (30.928)
Raffle (I) 115.468*** 130.436*** 104.415***
(19.757) (34.481) (38.610)
Active Bidders (#)α 11.943
(14.385)
Intercept 63.421*** 4.902 -90.018
(5.676) (329.920) (382.508)
Experimenter Fixed Effects No Yes Yes
Participant Demographics Included No Yes Yes
Zip Code Level Controls Included No Yes Yes
Observations 95 95 95
Adjusted R2 0.41 0.45 0.48
Notes: Dependent variable is auction revenue; the omitted mechanism is the Live auction; OLS;
(robust standard errors); αevent start time is used as an instrument for the number of active
bidders; * p<0.10, ** p<0.05, *** p<0.01; demographics include mean age, number of female
bidders, number of bidders with high income, number of bidders with a college degree or more
education; other zip code level controls include averages of adjusted gross income, unemployment
insurance, charitable contributions, homeownership rates and travel times to work.
6 Discussion
Casual observation suggests that the set of mechanisms that charities use to raise money
from contributed goods and services is small. When an auction is chosen, it is typically a
“live” (aka English) auction and when an auction is not used, the alternative is almost always
26

a raffle. It is hard to tell exactly how beneficial these choices are for charities because other
mechanisms (e.g., the all-pay auction) are considered so rarely, there are selection issues (live
auctions tend to be used when an event is possible and raffles are used when one is not) and
there is very little field data on which to base an assessment. In other words, it is hard to
know whether charities choose prudently or fall victim to the “curse of the familiar”.
We conducted an experiment with Rotary clubs to examine the relative performance of
the small set of common formats and to test whether charities might do better by considering
new, more novel, formats. Our results are unique because we are able to organize a large
number of identical events, the events took place across the United States and, crucially, we
were able to randomly assign auction formats to fundraisers.
To summarize our findings, we circle back to Section 3 and ask how well our results
“jibe” with theory. Considering participation, Corollary 6 predicted that the hybrid, live
and raffle formats would be indistinguishable but that all three would do better than both
the bucket and all-pay. We find exactly this, with one small exception. Our data suggests
that the live auction does not elicit as many participants as expected. Significantly fewer
bidders participate in the live than in both the raffle and the hybrid. Corollary 7 predicted
that bids would be highest in the hybrid, bucket and live formats and that these three would
do better than the all-pay and raffle formats, with the raffle doing poorest, in expectation.
Again, theory is almost exactly “spot on.” The only difference in the observed bid ordering
is that the bucket doesn’t equal the hybrid; it does significantly better in summary tests
and in some regression specifications. Given our data are consistent with theory on both the
extensive and intensive margins, it is no surprise that our revenue hypotheses (summarized
in Corollary 8) match the data almost exactly. As predicted, the bucket does best followed
by the all-pay, the raffle, the hybrid and the live comes in last.
Turning to the pragmatic lessons from our study, our data suggest that charities fair well
when considering the broader “transformation problem”. On average, our field auctioneers,
were able to raise an average of $190 using donated wine with a retail value of $35. Con-
sidering the choice of a mechanism, three practical lessons arise from our experiment for
charities. First, if we limit attention to the two mechanisms that are used with any regular-
ity, we find that the raffle does much better than the live auction. Not only does the raffle
generate almost three times as much revenue as the live auction, one can also expect more
donors to participate in the raffle than in the live auction, a result that might be important
for the development of a donor “warm list”. Second, in reference to the theory of charity
auctions, we confirm that choosing from the broad category of all-pay mechanisms, including
the first-priced auction, the bucket auction and the raffle, does improve revenue (three-fold,
on average) compared to the two winner-pay mechanisms we considered - the live and hybrid
27

auctions. Further, considering only the all-pay mechanisms, the efficient first-price all-pay
does raise slightly more money than the raffle, though the differential is small and not always
significant. Third, and most important, our results suggest that charities are probably sacri-
ficing a considerable amount of money by not considering other formats. Not only is perhaps
the most common option, the live auction, an inferior choice, both in terms of revenue and
participation, in this case the curse of the familiar is at its strongest - the most common
format did not just perform poorly, it performed worse than every other mechanism tested.
7 References
Carpenter, Jeffrey; Jessica Holmes and Peter Matthews. 2014. “Bucket Auctions for
Charity.” Games and Economic Behavior, 88(November), 260-76.
. 2008. “Charity Auctions: A Field Experiment.” The Economic Journal, 118(1),
92-113.
. 2009. “Endogenous Particpation in Charity Auctions.” Journal of Public Eco-
nomics, 94(11-12), 921-35.
. 2010. “Charity Auctions in the Experimental Lab,” D. Norton and R. M. Isaac,
Research in Experimental Economics. Bingley: Emerald Group Publishing Limited, 201-49.
Carpenter, Jeffrey and Peter Hans Matthews. 2015. “Using Raffles to Fund Public
Goods: Lessons from a Field Experiment,” IZA Discussion Paper No. 8952.
Corazzini, Luca; Marco Faravelli and Luca Stanca. 2010. “A Prize to Give For: An
Experiment on Public Good Funding Mechanisms.” The Economic Journal, 120(547), 944-
67.
Dale, Donald. 2004. “Charitable Lottery Structure and Fund Raising: Theory and
Evidence.” Experimental Economics, 7(3), 217-34.
Davis, Douglas; Laura Razzolini; Robert Reilly and Bart Wilson. 2006. “Raising Rev-
enues for Charity: Auctions Versus Lotteries,” D. Davis and R. M. Isaac, Research in Ex-
perimental Economics. New York: JAI Press, 49-95.
Duffy, John and Alexander Matros. 2016. “All-Pay Auctions Versus Lotteries as Pro-
visional Fixed-Prize Fundraising Mechanisms: Theory and Evidence.,” University of South
Carolina Working Paper.
Engers, Maxim and Brian McManus. 2007. “Charity Auctions.” International Economic
Review, 48(3), 953-94.
Ewerhart, Christian. 2014. “Unique Equilibrium in Rent-Seeking Contests With a Con-
tinuum of Types.” Economics Letters, 125(1), 115-118.
28

Fey, Mark. 2008. “Rent-Seeking Contests With Incomplete Information.” Public Choice.
135(3), 225-236.
Gneezy, Uri and Rann Smorodinsky. 2006. “All-Pay Auctions - an Experimental Study.”
Journal of Economic Behavior & Organization, 61(2), 255-75.
Goeree, Jacob K.; E. Maasland; S. Onderstal and J. Turner. 2005. “How (Not) to Raise
Money.” Journal of Political Economy, 113(4), 897-918.
Goerg, Sebastian; John Lightle and Dmitry Ryvkin. 2015. “Priming the Charitable
Pump: An Experimental Investigation of Two-Stage Raffles.” Economic Inquiry, 54(1),
508-19.
Internal Revenue Service. 2015. “Individual Income Tax Returns 2012,” Department of
the Treasury, IRS Publication 1304.
Landry, Craig; Andreas Lange; John List; Michael Price and Nicholas Rupp. 2010. “Is a
Donor in Hand Better That Two in the Bush? Evidence from a Natural Field Experiment.”
American Economic Review, 100(3), 958-83.
Lange, Andreas; John List and Michael Price. 2007. “Using Lotteries to Finance Public
Goods: Theory and Experimental Evidence.” International Economic Review, 48(3), 901-27.
Morgan, John. 2000. “Financing Public Goods by Means of Lotteries.” Review of
Economic Studies, 67(4), 761-84.
Morgan, John and Martin Sefton. 2000. “Funding Public Goods with Lotteries: Exper-
imental Evidence.” Review of Economic Studies, 67(4), 785-810.
Onderstal, Sander; Arthur Schram and Adriaan Soetevent. 2013. “Bidding to Give in
the Field.” Journal of Public Economics, 105(1), 72-85.
Orzen, Henrik. 2008. “Fundraising through Competition: Evidence from the Lab,”
CeDEx Discussion Paper No. 2008-11.
Schram, Arthur and Sander Onderstal. 2009. “Bidding to Give: An Experimental Com-
parison of Auctions for Charity.” International Economic Review, 50(2), 431-57.
29

8 Appendix 1 - Theoretical Derivations
In Propositions 1 and 2 we explore the symmetric mixed strategy equilibria in the raffle and
the all-pay auction, respectively, whereby we denote by x the probability with which bidders
submit a bid of 2, with y the probability for a donation of 1, and with z the probability
for non-participation, i.e. a donation of 0. Entry in each mechanism is determined by the
probability of participation e = x+ y; expected bid conditional on participation is given by
b = 2xe
+ ye; and expected revenue per bidder is given by r = 2x+ y.
In Propositions 3, 4 & 5 we study the dynamic formats which are modeled as two-stage
games. In the first stage, bidders simultaneously decide whether to enter the mechanism or
not, whereby an entry decision is associated with a commitment to donate at least 1. In
the second stage, upon observing the outcome of the entry decisions, in the case that both
bidders have entered, bidders decide whether to further compete for the object by raising
their contribution levels.
Proof of Proposition 1 (Raffle)
It is straightforward that for Va < 1 it is not optimal to purchase even a single raffle ticket.
For 1 ≤ Va < 2 it might be optimal to purchase 1 but not 2 tickets. In this case we denote
the probability of zero raffle tickets purchased (or non-entry) by z and the probability of one
ticket purchased by y. The equilibrium is given by the solution of the system of equations
Va(z +y
2)− 1 = 0
y + z = 0
for which we obtain zR = 2−VaVa
; yR = 2(Va−1)Va
. The equilibrium entry probability and
expected revenue in this case are equal to yR and the expected revenue per bidder conditional
on participation is 1. For 2 ≤ Va we check whether a mixed strategy equilibrium exists in
which bidders randomize between purchasing 0, 1 and 2 tickets, or whether an equilibrium
exists in which bidders are randomizing between purchasing 1 and 2 raffle tickets. If an
equilibrium exists according to which bidders randomize among the three strategies, it is
given by the solution to the system of equations
30

Va(z +2y
3+x
2)− 2 = 0
Va(z +y
2+x
3)− 1 = 0
x+ y + z = 1
The solution of this system of equations is given by xR = 6(Va−4)Va
; yR = 6(5−Va)Va
; zR = (Va−6)Va
and hence randomizing across the three contribution levels is not an equilibrium for Va < 6.
An equilibrium in which bidders randomize between purchasing 1 and 2 raffle tickets would
be given by the system of equations
Va(2y
3+x
2)− 2 = 0
Va(y
2+x
3)− 1 = 0
x+ y = 1
It is easy to see that the system of equations has no solution for Va 6= 6. Hence, for
Va < 4 both players purchase 1 raffle ticket and for Va ≥ 4 both players purchase 2 tickets
in equilibrium. Entry probability eR, expected bid conditional on participation bR, and
expected revenue rR are, therefore, as stated in the proposition.
Proof of Proposition 2 (All-pay auction)
As this is an own-bid all-pay format, it is not optimal to bid above one’s valuation. That is
for Va < 1 bidders do not enter. For 1 ≤ Va < 2 bidders randomize between non-entry and
a bid of 1 whereby the mixed strategy is determined by the solution to the equations
Va(z +y
2)− 1 = 0
y + z = 0
which is given by zA = 2−VaVa
; yA = 2(Va−1)Va
. In these cases the expected equilibrium bid
conditional on participation is 1. For 2 ≤ Va, a bid of 2 can be submitted with a positive
probability. The conditions for a mixed strategy according to which bidders randomize across
all three bids are given as follows
31
Va(z + y +x
2)− 2 = 0
Va(z +y
2)− 1 = 0
x+ y + z = 1
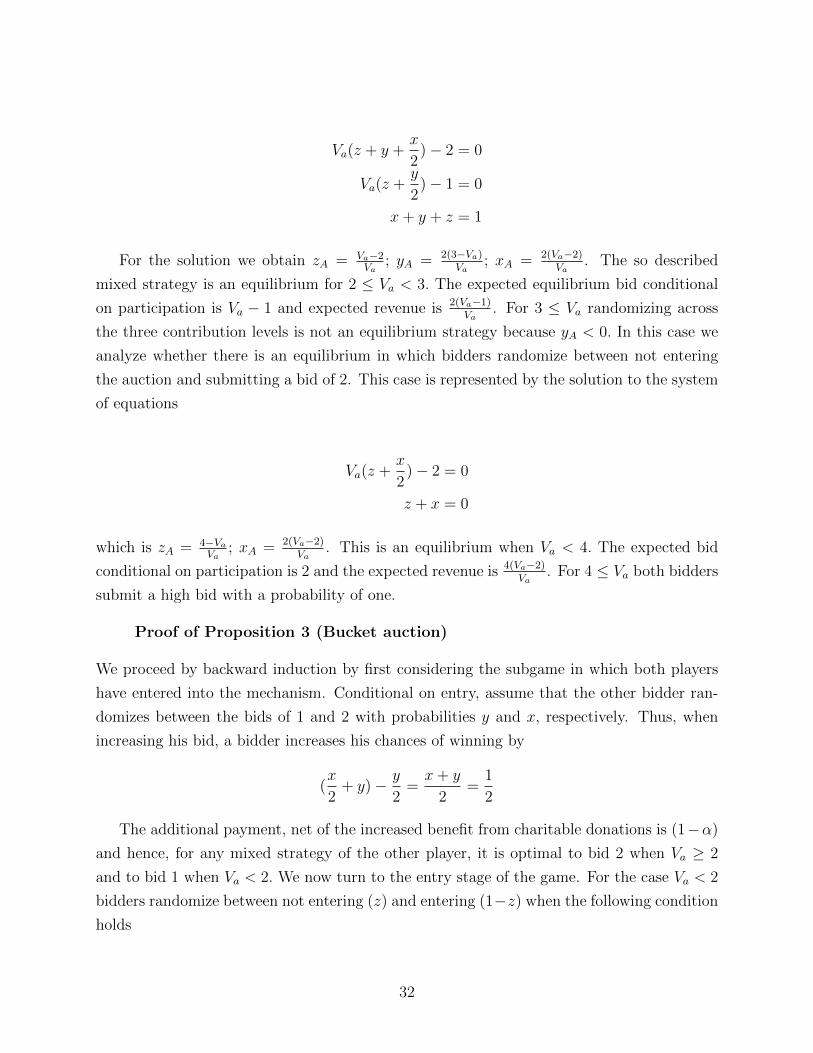
For the solution we obtain zA = Va−2Va
; yA = 2(3−Va)Va
; xA = 2(Va−2)Va
. The so described
mixed strategy is an equilibrium for 2 ≤ Va < 3. The expected equilibrium bid conditional
on participation is Va − 1 and expected revenue is 2(Va−1)Va
. For 3 ≤ Va randomizing across
the three contribution levels is not an equilibrium strategy because yA < 0. In this case we
analyze whether there is an equilibrium in which bidders randomize between not entering
the auction and submitting a bid of 2. This case is represented by the solution to the system
of equations
Va(z +x
2)− 2 = 0
z + x = 0
which is zA = 4−VaVa
; xA = 2(Va−2)Va
. This is an equilibrium when Va < 4. The expected bid
conditional on participation is 2 and the expected revenue is 4(Va−2)Va
. For 4 ≤ Va both bidders
submit a high bid with a probability of one.
Proof of Proposition 3 (Bucket auction)
We proceed by backward induction by first considering the subgame in which both players
have entered into the mechanism. Conditional on entry, assume that the other bidder ran-
domizes between the bids of 1 and 2 with probabilities y and x, respectively. Thus, when
increasing his bid, a bidder increases his chances of winning by
(x
2+ y)− y
2=x+ y
2=
1
2
The additional payment, net of the increased benefit from charitable donations is (1−α)
and hence, for any mixed strategy of the other player, it is optimal to bid 2 when Va ≥ 2
and to bid 1 when Va < 2. We now turn to the entry stage of the game. For the case Va < 2
bidders randomize between not entering (z) and entering (1−z) when the following condition
holds
32

(V
2− 1 + 2α)(1− z) + (V − 1 + α)z = α(1− z)
The solution to this equation is given by zB = 2−2α−VV
= 2−VaVa
which is positive for Va < 2.
The entry probability is 1− zB = 2(Va−1)Va
and conditional on entry bidders submit a bid of 1.
For the case Va ≥ 2 bidders randomize between not entering (z) and entering (1− z) when
the following conditions hold
(V
2− 2 + 4α)(1− z) + (V − 1 + α)z = α(1− z)
The solution to this equation is given by zB = V+6α−44α−V−2
. For the entry probability we
obtain 1 − zB = 2V+2α−2V+2−4α
= 2(Va−1)
Va+2− 2α1−α
and conditional on entry bidders submit a bid of 2.
This fraction is the actual entry probability when 2(Va− 1) ≤ Va + 2− 2α1−α ⇔ Va ≤ 4− 2α
1−α .
The expected revenue per bidder is obtain by multiplying the entry probability with the
respective bid submitted in equilibrium.
Proof Proposition 4 (Hybrid auction)
We proceed again by backward induction considering the subgame in which both players
have entered. If the other player bids 2, it is optimal for a player to best respond with 2
under the condition
−1
2+ 2α ≤ V
2− 1 + 2α
which holds for Va ≥ 11−α . The player’s expected payoff in this subgame is
GH,2(Va, α) :=V
2− 1 + 2α =
(1− α)
2(Va − 2 +
2α
1− α)
If the other bidder bids 1, it is optimal for a player to best respond with 1 under the
condition
V
2− 1
2+ α ≥ V − 3
2+ 2α
which holds for Va ≤ 2. The player’s expected payoff in this subgame is
GH,1(Va, α) :=V
2− 1
2+ α =
(1− α)
2(Va − 1 +
α
1− α)
We now study mixed strategy equilibria, whereby we denote by x the probability for a
bid of 2 and by y the probability for a bid of 1. The equilibrium mixed strategy is determined
by the equation
33

Vy
2− 1
2+ α(y + 2x) = V (y +
x
2)− [(y +
x
2)× 3
2+x
2× 1
2] + 2α
where
x+ y = 1.
The solution to these equations is
y =V − 1
1− 2α=
(1− α)(Va − 11−α)
1− 2α;
x =2− V − 2α
1− 2α=
(1− α)(2− Va)1− 2α
.
Thus, a mixed strategy is an equilibrium in the entry subgame when 11−α < Va < 2.
Under these conditions we have in the competition subgame two pure strategy equilibria in
which both bidders bid either 2 or 1 and one mixed strategy equilibrium. The payoff in the
mixed strategy equilibrium is given as follows
GH,M(Va, α) : = Vy
2− 1
2+ α(y + 2x)
=Va(1− α)2(Va − 1
1−α)
2(1− 2α)− 1
2+ α(1 +
(1− α)(2− Va)1− 2α
)
The payoffs conditional on entry in all equilibria of the competition subgame are thus as
follows GH,1(Va, α) for Va ≤ 1
1−α
{GH,1(Va, α); GH,M(Va, α); GH,2(Va, α)} for 11−α < Va < 2
GH,2(Va, α) for 2 ≤ Va
We now analyze the entry stage of the game. For the parameter values for which
GH,1(Va, α) is an equilibrium payoff i.e., bidders enter, bid 1 and the entry probability,
e = 1− z, is determined by the equation
V (z +y
2)− 1
2+
1
2α(1 + y) =
1
2αy
where
z + y = 1.
34

The solution is given by z = 1−VaVa
. The entry probability is thus e = 1 − z = 2Va−1Va
for
Va >12
and zero otherwise. For the parameter values for which GH,2(Va, α) is an equilibrium
payoff i.e., bidders enter and bid 2; the entry probability e = 1 − z is determined by the
equation
V (z +x
2)− (
z
2+ x) + α(
z
2+ 2x) = α
1
2x
where
z + x = 1.
The solution is given by z = 2−3α−VV−2α+1
. The entry probability is thus e = 2V+α−1V−2α+1
=2Va−1
Va+1− a1−α
.
9 Appendix 2 - instructions from the field experiment
You are about to participate in a charity fundraiser. The bottles of wine have been provided
by a research grant from the National Science Foundation. All the proceeds from this event
will be donated directly to this local Rotary chapter.
[All-pay] Here are the rules:
• Bidders make one bid in a sealed envelope.
• The auction is “all-pay” – regardless of winning or losing, all bidders will be asked to
pay the amount of their bids. Please enclose payment with your bid.
• All the bid envelopes will be collected and the highest bid will be identified (ties will
be broken randomly).
• The highest bidder wins the two bottles of wine.
[Bucket] Here are the rules:
• To start, all bidders will be given 30 chips worth $5 each (more chips are available if
necessary).
• Bidders will form a circle and a bucket will be passed from bidder to bidder.
• To stay in the auction, each bidder must place one chip in the bucket each time it
comes to him or her. Bidders who decide to pass the bucket without adding a chip drop out
of the auction.
• You must pay $5 for each chip that you add to the bucket, regardless of whether you
win or lose.
• The auction winner is the person who puts the last chip in the bucket. This will be the
only person who has added a chip every time the bucket has come around.
35

[Hybrid] Here are the rules:
• All participants interested in placing a bid on the two bottles of wine must first pay a
$5 entry fee, which also buys you a 50-50 lottery ticket.
1. 50-50 Lottery:
• Participants pay $5 to bid in the auction and are given one lottery ticket.
• At the end of the auction, one lottery winner will be selected at random.
• The lottery winner’s cash prize is 50% of the lottery proceeds (and the rest goes to this
Rotary chapter).
2. Wine Auction:
• All bidders will be given bidder numbers.
• The auctioneer will start the auction by announcing an opening bid; he will then ask
for bids to increase.
• Raise your bidder number to indicate your willingness to bid on the two bottles of wine
prize at the price called by the auctioneer.
• The highest bidder wins the two bottles of wine and pays his or her bid. Following the
auction, the lottery cash prize and the wine will be awarded separately.
[Live] Here are the rules:
• All bidders will be given bidder numbers.
• The auctioneer will start the auction by announcing an opening bid; he will then ask
for bids to increase.
• Raise your bidder number to indicate your willingness to bid on the two bottles of wine
at the price called by the auctioneer.
• The highest bidder wins the two bottles of wine and pays his or her bid.
[Raffle] Here are the rules:
• Each participant will be allowed to privately purchase as many raffle tickets as he or
she wants.
• Each raffle ticket costs $5.
• After each participant has had a chance to buy as many tickets as he or she wants, the
winning ticket for the two bottles of wine will be selected randomly.
We accept cash, check or credit card. Thank you for supporting this chapter of Rotary!
36