Auburn University Image Survey 2001 University Image Survey 2001 ... Auburn University Image Survey...
326
Auburn University Image Survey 2001 Full Version Survey Research Laboratory November 2001
Transcript of Auburn University Image Survey 2001 University Image Survey 2001 ... Auburn University Image Survey...

Auburn University Image Survey 2001 Full Version
Survey Research Laboratory November 2001

Auburn University Image Survey November 2001 Center for Governmental Services
Table of Contents (Full Version)
Executive Summary I. Project Overview 1 II. Methodology 2 III. Findings 5
A. Summary 5 B. Importance of Auburn University to the State 5 C. Educational Contribution of Auburn University 7 D. Public Sources of Information Alabama Universities 10 E. Awareness and Support for AU Research Activities 11 F. Awareness and Support for AU Outreach Activities 11 G. Issues Important to Alabamians 13
IV. Appendices
APPENDIX A: Auburn University Image Survey Questionnaire APPENDIX B: Frequency Distributions of Survey Results APPENDIX C: Verbatim Responses of Open-Ended Questions APPENDIX D: Survey Responses Controlled by Education Level APPENDIX E: Survey Responses Controlled by Income Level APPENDIX F: Survey Responses Controlled by Gender APPENDIX G: Survey Responses Controlled by Alumni Status APPENDIX H: Survey Responses Controlled by Race
AU Image Survey 2001 Page 1 Center for Governmental Services, Auburn University
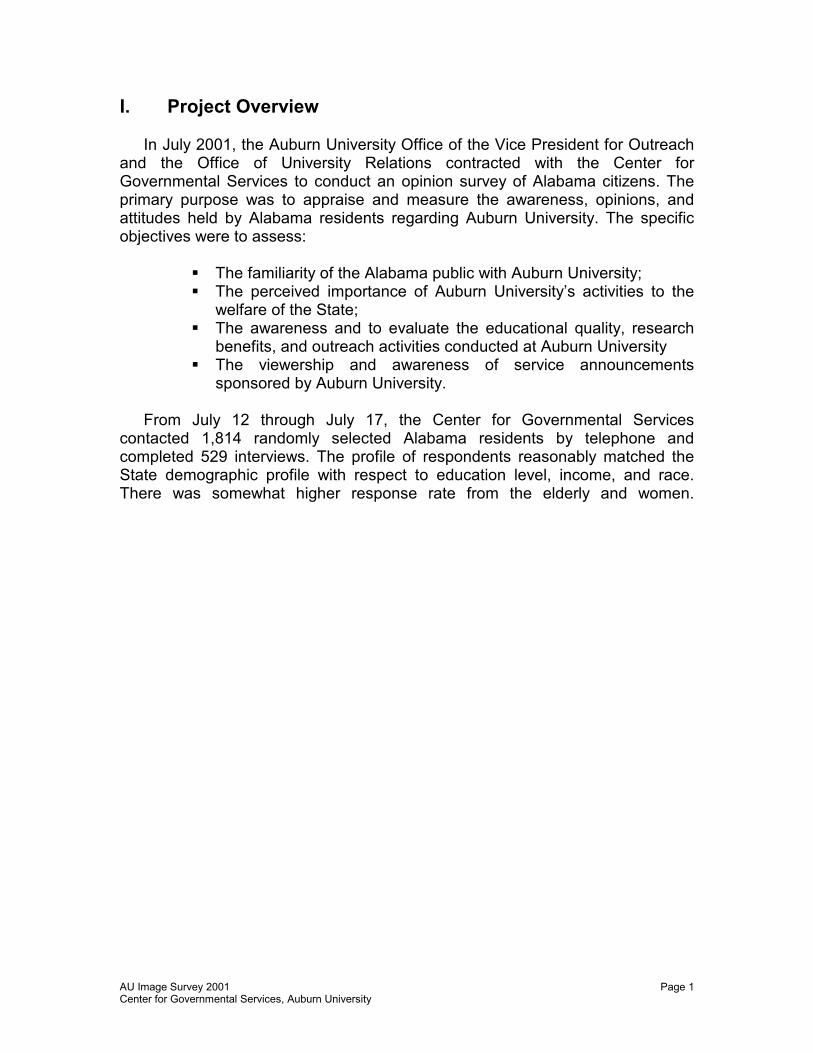
I. Project Overview
In July 2001, the Auburn University Office of the Vice President for Outreach and the Office of University Relations contracted with the Center for Governmental Services to conduct an opinion survey of Alabama citizens. The primary purpose was to appraise and measure the awareness, opinions, and attitudes held by Alabama residents regarding Auburn University. The specific objectives were to assess:
The familiarity of the Alabama public with Auburn University; The perceived importance of Auburn University’s activities to the
welfare of the State; The awareness and to evaluate the educational quality, research
benefits, and outreach activities conducted at Auburn University The viewership and awareness of service announcements
sponsored by Auburn University.
From July 12 through July 17, the Center for Governmental Services contacted 1,814 randomly selected Alabama residents by telephone and completed 529 interviews. The profile of respondents reasonably matched the State demographic profile with respect to education level, income, and race. There was somewhat higher response rate from the elderly and women.

AU Image Survey 2001 Page 2 Center for Governmental Services, Auburn University
II. Methodology
A. Questionnaire Development
The Center for Governmental Services (CGS) met with senior leadership from the Auburn University Office of University Relations and the Office of the Vice President for Outreach to determine modifications to be made to the survey conducted by CGS in 1999. Each of the offices reviewed the format and approved the survey instrument protocol prior to distribution. Appendix A contains the codebook used in this survey. Prior to the survey, CGS staff reviewed and tested the survey instrument, corrections were made to clarify vague or misleading questions, and the survey was pre-tested.
B. Sample Selection and Survey Procedures
The proper selection of a survey sample is vital to ensure that the survey
results can be generalized to the total population from which the sample is selected. The goal is to produce results from the sample that would be the same as if the entire population was interviewed, within a reasonable margin of error. Consequently, using a random number generator, CGS selected a random sample of approximately 3,600 telephone numbers in Alabama. During July 12 – 17 2001, CGS placed calls to all numbers in the sample. This resulted in 529 completed interviews with adult Alabama residents. Of the 1,814 telephone numbers completed, 900 Alabamians responded, with 549 (61%) agreeing to participate in the survey.
C. Interviewing and Data Analysis Procedures
Prior to the initiation of data collection, all interviewers were trained on
proper interviewing techniques; including, building rapport with respondents, avoiding biases, administering questions properly, and probing for complete answers. Each interviewer was required to complete the training session successfully before participating in this study. During the interviewing sessions, all of the interviewers were supervised, monitored, and evaluated to maintain interviewing standards.
The Center used a Computer Assisted Telephone Interviewing (CATI)
system to assure data accuracy and to facilitate the transference of data to the SPSS statistical analysis program. The data are reliable within a 96% confidence interval, indicating that the results of this survey are accurate within plus or minus 4%. This confidence level is standard for survey research and provides a balance between accuracy and efficiency.

AU Image Survey 2001 Page 3 Center for Governmental Services, Auburn University
D. Sample Demographic Profile
The sample profile is a reasonable approximation of the population of the State. With respect to age, approximately 37% of those interviewed are under 40 years of age. The very elderly, however, are slightly more represented in the sample than in the general population. About 9% of the sample is over 71 years of age, reflecting the fact that the elderly tend to be more place-bound than those who are younger, and tend to be more willing to participate in a telephone survey (See Table 1).
Table 1: Age Profile of the AU Image Survey Sample
96 18.1 19.2 19.290 17.0 18.0 37.3
126 23.8 25.3 62.586 16.3 17.2 79.854 10.2 10.8 90.647 8.9 9.4 100.0
499 94.3 100.07 1.3
23 4.330 5.7
529 100.0
Under 3031 - 4041 - 5051 - 6061 - 7071+Total
Valid
No answerSystemTotal
Missing
Total
Frequency Percent Valid PercentCumulative
Percent
The income, education, and race profiles of the sample are all reasonably close to the social demographic profile in Alabama. Forty-eight percent of the sample earns less than $40,000 per year (See Table 2). Approximately 40% of the sample have a high school education or less (See Table 3), and about 77% of the reporting sample respondents are Caucasian, and 21% African-American (See Table 4).

AU Image Survey 2001 Page 4 Center for Governmental Services, Auburn University
Table 2: Income Profile of the AU Image Survey Sample
84 15.9 19.0 19.0129 24.4 29.3 48.3155 29.3 35.1 83.446 8.7 10.4 93.927 5.1 6.1 100.0
441 83.4 100.065 12.323 4.388 16.6
529 100.0
Less than $20,000$20 - 39,000$40 - 74,000$75 - 99,000$100,000 and overTotal
Valid
No answerSystemTotal
Missing
Total
Frequency Percent Valid PercentCumulative
Percent
Table 3: AU Image Survey Sample by Education
47 8.9 9.4 9.4
151 28.5 30.1 39.4
158 29.9 31.5 70.988 16.6 17.5 88.458 11.0 11.6 100.0
502 94.9 100.04 .8
23 4.327 5.1
529 100.0
Less that High SchoolHigh Schooldiploma/GEDSome collegeBachelor's degreeGraduate/ProfessionalTotal
Valid
No answerSystemTotal
Missing
Total
Frequency Percent Valid PercentCumulative
Percent
Table 4: AU Image Survey Sample by Race
104 19.7 20.8 20.82 .4 .4 21.27 1.3 1.4 22.6
384 72.6 76.8 99.43 .6 .6 100.0
500 94.5 100.06 1.1
23 4.329 5.5
529 100.0
African-AmericanAsian-AmericanNative-AmericanWhiteOtherTotal
Valid
No answerSystemTotal
Missing
Total
Frequency Percent Valid PercentCumulative
Percent

AU Image Survey 2001 Page 5 Center for Governmental Services, Auburn University
III. Findings
A. Summary
Overall, the public values highly, the contributions made by Auburn University. An overwhelming majority of Alabama residents believe that Auburn University has an important effect on the quality of life in the State as well as in their individual communities. Alabamians are aware of and appreciate the role that Auburn University plays in attracting and supporting jobs in their community. Many Alabama residents agree that Auburn University and its quality of higher education have a direct and positive impact on their families. Many Alabamians also believe that Auburn University is among the best universities in the South and in the Nation. Over 90% agree that the State of Alabama receives a good return on its investment in Auburn University.
Many of the respondents are familiar with Auburn Outreach and the Alabama
Cooperative Extension System. Although less than half of respondents report having used the Cooperative Extension’s or Outreach’s services in recent months, nearly all of the respondents agree that these programs are beneficial to their families. Education, community and economic development, family and youth, environment, and agriculture are the service areas covered by Auburn University Outreach and Extension, which were considered to be the most important to the quality of life in Alabama. Almost three fourths of respondents are aware of Auburn’s continuing education programs. Ninety-nine percent agreed that Auburn University’s partnerships with local schools are important and should be continued. Most Alabama residents believe that Auburn University needs to expand continuing education and local school partnerships while offering more classes and degree programs via distance learning.
Nearly all Alabama residents strongly support and approve of the research conducted at Auburn University and believe that it is significant and should be continued. Relatively few are aware of the specific research activities, and less than half of the respondents have seen the Auburn University television announcements on these initiatives. However, nearly all of the respondents who have seen the commercials believe that the information is valuable and should continue to be presented to the public.
B. Importance of Auburn University
A large majority of Alabama residents agree that Auburn University plays an important role in Alabama as well as in their community. Almost 93% of respondents recognize that Auburn University positively and significantly affects the quality of life in the State (Table 5), and over three fourths assert that Auburn University is important to the quality of life in their local community (Table 6).

AU Image Survey 2001 Page 6 Center for Governmental Services, Auburn University
Table 5: Importance of Auburn University to the Quality of Life in Alabama
9 1.7 1.7 1.727 5.1 5.2 6.92 .4 .4 7.3
207 39.1 40.0 47.3273 51.6 52.7 100.0518 97.9 100.0
11 2.1529 100.0
UnimportantNot very importantNeutralImportantVery importantTotal
Valid
Don't knowMissingTotal
Frequency Percent Valid PercentCumulative
Percent
Table 6: Importance of Auburn University to the Quality of Life in Your Local Community
17 3.2 3.4 3.492 17.4 18.3 21.77 1.3 1.4 23.1
218 41.2 43.3 66.4169 31.9 33.6 100.0503 95.1 100.0
26 4.9529 100.0
UnimportantNot very importantNeutralImportantVery importantTotal
Valid
Don't knowMissingTotal
Frequency Percent Valid PercentCumulative
Percent
Auburn University is also acknowledged to provide strong positive economic and labor force contributions to the State. Nearly 94% of respondents believe that Auburn University is important in creating jobs within the State (Table 7).
Table 7: Does Auburn University Help Create Jobs in the Alabama
10 1.9 2.0 2.021 4.0 4.1 6.11 .2 .2 6.3
240 45.4 47.0 53.2239 45.2 46.8 100.0511 96.6 100.018 3.4
529 100.0
Strongly disagreeSomewhat disagreeNeutralSomewhat agreeStrongly agreeTotal
Valid
Don't knowMissingTotal
Frequency Percent Valid PercentCumulative
Percent

AU Image Survey 2001 Page 7 Center for Governmental Services, Auburn University
Auburn University’s contributions to the economy are also recognized on the local level. Eighty-four percent of Alabamians polled believe that Auburn University’s research efforts are important in attracting and keeping jobs in the local community (Table 8).
Table 8: How Important is Auburn University’s Research for Jobs in Your Local
Community?
9 1.7 1.9 1.960 11.3 12.7 14.66 1.1 1.3 15.9
191 36.1 40.6 56.5205 38.8 43.5 100.0471 89.0 100.058 11.0
529 100.0
UnimportantNot very importantNeutralImportantVery importantTotal
Valid
Don't knowMissingTotal
Frequency Percent Valid PercentCumulative
Percent
C. Auburn University’s Educational Contribution
The majority of respondents (59%) have some degree of familiarity with Auburn University. This level of familiarity with Auburn University is higher for respondents with a higher education (79%), income over $40,000 (75%), white respondents (64%), male respondents (68%), and respondents who are alumnus or have family that are alumnus (92%). The educational contribution of Auburn University is also significant and recognized by most Alabamians. Eighty-eight percent of the respondents agree that Auburn graduates perform important roles in their community with 45% strongly agreeing with this sentiment (Table 9).
Table 9: Auburn Graduates Play an Important Role in Your Local Community
17 3.2 3.4 3.436 6.8 7.2 10.68 1.5 1.6 12.2
217 41.0 43.2 55.4224 42.3 44.6 100.0502 94.9 100.027 5.1
529 100.0
Strongly disagreeSomewhat disagreeNeutralSomewhat agreeStrongly agreeTotal
Valid
Don't knowMissingTotal
Frequency Percent Valid PercentCumulative
Percent

AU Image Survey 2001 Page 8 Center for Governmental Services, Auburn University
When exploring the role of Auburn graduates, race has a statistically significant impact on the level of agreement. Nearly 92% of white respondents agree that AU graduates possess important community roles, but less than 78% of African-American respondents share this perception (Table 10).
Table 10: Auburn University Graduates Play an Important Role in Your Local Community Controlled by Race Category
% within Race by Category
5.9% 1.9% 2.8%15.7% 4.4% 6.9%1.0% 1.9% 1.7%
43.1% 43.5% 43.4%34.3% 48.2% 45.2%
100.0% 100.0% 100.0%
Strongly disagreeSomewhat disagreeNeutralSomewhat agreeStrongly agree
Auburn graduatesplay importantroles in localcommunity
Total
AfricianAmerican White
Race by Category
Total
Among Alabamians, the perception regarding the quality of Auburn University is overwhelmingly positive. More than 8 out of 10 respondents (85%) believe Auburn is one of the best universities in the South (Table 11), while 73% of respondents believe Auburn to be one of the best universities in the Nation. Higher rates of approval are given by white respondents (95% South; 76% Nation) and respondents with connections to Auburn alumni (95% South; 84% Nation).
Table 11: Auburn University is One of the Best Universities in the South
18 3.4 3.5 3.544 8.3 8.7 12.216 3.0 3.1 15.4
225 42.5 44.3 59.6205 38.8 40.4 100.0508 96.0 100.021 4.0
529 100.0
Strongly disagreeSomewhat disagreeNeutralSomewhat agreeStrongly agreeTotal
Valid
Don't knowMissingTotal
Frequency Percent Valid PercentCumulative
Percent
Relatively few respondents (20%) perceive that Auburn University is under-funded compared to other universities in the Southeast (Table 12), and almost an equal percentage (19%) perceive that Auburn University receives more support than other Southeastern universities. Twenty-six percent of respondents with a Bachelor’s degree education agree that Auburn University’s

AU Image Survey 2001 Page 9 Center for Governmental Services, Auburn University
funding compares poorly to other universities in the South, and even among those closely connected to Auburn University alumni, only 27% perceive that the University is poorly funded in comparison to other universities in the South.
Table 12: How Does Auburn University Funding Compare to Other Universities in the Southeast?
74 14.0 20.0 20.0227 42.9 61.4 81.4
69 13.0 18.6 100.0370 69.9 100.0159 30.1529 100.0
LessAbout the sameMoreTotal
Valid
Don't knowMissingTotal
Frequency Percent Valid PercentCumulative
Percent
Despite the lack of groundswell support for additional funding for the University, nearly all Alabamians (94%) believe that funds currently spent on Auburn University are a good investment for Alabama. Significantly, almost 90% of Alabamians believe that the quality of higher education personally affects them, and 60% of respondents strongly believe that they are impacted by the quality of higher education within Alabama (Table 13).
Table 13: The Quality of Higher Education in Alabama Affects Me
21 4.0 4.1 4.128 5.3 5.4 9.58 1.5 1.6 11.1
154 29.1 29.9 41.0304 57.5 59.0 100.0515 97.4 100.011 2.13 .6
14 2.6529 100.0
Strongly disagreeSomewhat disagreeNeutralSomewhat agreeStrongly agreeTotal
Valid
Don't knowSystemTotal
Missing
Total
Frequency Percent Valid PercentCumulative
Percent
One of the more controversial aspects of funding and support for higher education at Auburn University concerns the priority placed on athletics in comparison to educational programs. Alabamians are evenly split on whether Auburn focuses more on athletics than on education. Less than 6% of respondents do not have an opinion regarding the balance between athletics and academics. Forty-seven percent of Alabamians perceive that Auburn University

AU Image Survey 2001 Page 10 Center for Governmental Services, Auburn University
concentrates on athletics to the detriment of academic programs, while 47% disagree (Table 14).
Table 14: Auburn University Concentrates on Athletics Rather Than Academic Programs
83 15.7 16.8 16.8151 28.5 30.5 47.327 5.1 5.5 52.7
136 25.7 27.5 80.298 18.5 19.8 100.0
495 93.6 100.034 6.4
529 100.0
Strongly disagreeSomewhat disagreeNeutralSomewhat agreeStrongly agreeTotal
Valid
Don't knowMissingTotal
Frequency Percent Valid PercentCumulative
Percent
Higher income respondents (i.e. over $40,000 annually) and those with Bachelor degrees or higher are more likely to disagree with the statement, “AU concentrates on athletics rather than academic programs” (56% and 61% disagreement respectively). Among those with a family connection to Auburn University alumni, the level of disagreement is 52%. Among all demographic categories, however, there are significant proportions that believe that the University’s priorities are more heavily place on athletics than on its educational programs.
D. Public’s Sources of Information About Universities in
Alabama
Alabamians receive information about universities in Alabama from a variety of sources; including newspapers, radio, television, students, alumni, co-workers and the Internet. Newspapers and television, however, are the primary sources of information regarding universities in Alabama. Sixty-four percent of respondents identify newspapers as their primary source for information about Alabama universities, while 57% are informed by television and 36% by current students. Less than a third of the respondents identify any other media or contacts as a source of information regarding universities in Alabama (See Appendix B, Questions 14-22).
Despite television being one of the three primary sources of information, less
than half of respondents (48.2%) report seeing any of Auburn University’s television service announcements about AU’s research activities. Regarding specific television spots, 11% remember viewing the AU spot on bulletproof vest research, 9% recall viewing the spot on airbag research, and 26% saw one of the television announcements on Auburn University’s economic impact.

AU Image Survey 2001 Page 11 Center for Governmental Services, Auburn University
Despite a relatively low audience, those respondents that report viewing the
commercials overwhelmingly approve of the commercials and believe they should continue to be produced and shown. Over 90% of those who remember seeing one or more of the television spots on Auburn University during the past year agree that the messages on Auburn University’s impact are valuable and should continue to be broadcast (See Appendix B, Questions 23, 26, 30, and 33).
E. Awareness and Support for Auburn University’s Research Activities
Public awareness about Auburn University’s public oriented research
initiatives varies by the research activity. Over 60% of Alabamians are aware of the University’s involvement in fisheries research. Thirty-six percent and thirty-two percent, respectively, are aware of the engagement of Auburn University with highway construction and West Alabama low-income housing construction. Twenty-six percent are aware that the University is involved in conducting research on improving the bulletproof vest, and 21% know that the University is helping to improve the airbag systems in motor vehicles.
Nearly all Alabamians strongly support Auburn University’s research
activities, particularly those with immediate applied applications. Every Auburn University research initiative receives over ninety percent approval ratings by the respondents. For example, over 98% of Alabamians believe that the University’s research on fisheries is significant. Ninety-seven percent of respondents consider the University’s research on highway construction and on West Alabama low income housing to be significant; and 96% agree that research on airbags and bulletproof vests are significant activities (See Appendix B, Questions 24 – 40).
F. Awareness and Support for Auburn University’s Outreach Activities
Auburn University Outreach and the Cooperative Extension System are
important sources of assistance for many Alabamians. Eight-three percent of respondents, for example, agree that it is significant for their community to have access to outreach programs (Table 15).

AU Image Survey 2001 Page 12 Center for Governmental Services, Auburn University
Table 15: How Significant is the Availability of Outreach Programs to Your Local Community
22 4.2 4.3 4.325 4.7 4.9 9.231 5.9 6.1 15.310 1.9 2.0 17.2
172 32.5 33.7 50.9251 47.4 49.1 100.0511 96.6 100.018 3.4
529 100.0
No opinionVery insignificantInsignificantNeutralSignificantVery significantTotal
Valid
SystemMissingTotal
Frequency Percent Valid PercentCumulative
Percent
Usage of outreach and extension service services by Alabamians varies by the type of service offered. For example, 53% of the respondents are aware of the Cooperative Extension System, 24% use the Extension System services, and nearly all those who use the services (98%) believe that the programs are beneficial (See Appendix B, Questions 46 - 48). Familiarity with the System varies by population group. For example, 46% of those with less than a high school education are familiar with Extension services, compared to over 71% of those with a bachelor’s degree or more.
Public awareness regarding the University’s involvement with Continuing Education is very high, but participation in the continuing education program is more limited and varies by population group. Over 70% of Alabamians are aware that Auburn University is involved in providing continuing education, but only 14% of those aware of the offerings have availed themselves of these services (See Appendix B, Questions 41 - 42).
The usage rate of AU continuing education services also varies among the different population control groups. Nineteen percent of respondents that are aware of AU continuing education programs with household incomes in excess of $40,000 have availed themselves of these programs. This compares to 11% with lower household incomes. Twenty-six percent of those with an alumnus connection to AU and who are also aware of AU’s continuing education have attended a class offered by Auburn University. This figure compares to 11% with no alumnus connection to the University. Finally, the participation rate in continuing education programs at Auburn University nearly doubles between those with less than a bachelor’s degree education (12%) to those with a graduate or professional degree (21%) (Table 16).

AU Image Survey 2001 Page 13 Center for Governmental Services, Auburn University
Table 16: Participation in a Continuing Education Program at Auburn University Controlled by Education Category
% within Education by Category
88.3% 11.7% 100.0%
79.5% 20.5% 100.0%
85.4% 14.6% 100.0%
Less thanBachelor's DegreeBachelor's degreeor Higher
Educationby Category
Total
No Yes
Have taken anycontinuing education
programsTotal
Two of Outreach’s current major endeavors, namely, the University’s partnerships with local schools and distance learning classes, are heavily supported by Alabamians. Respondents are virtually unanimous (99.4%) in their support of the AU School Partnership program, and 86% believe that their local school district would benefit from such a partnership (See Appendix B, Questions 43 - 45). With respect to distance learning, nearly 88% of respondents state a preference that Auburn University should offer more programs through this medium (See Appendix B, Question 49).
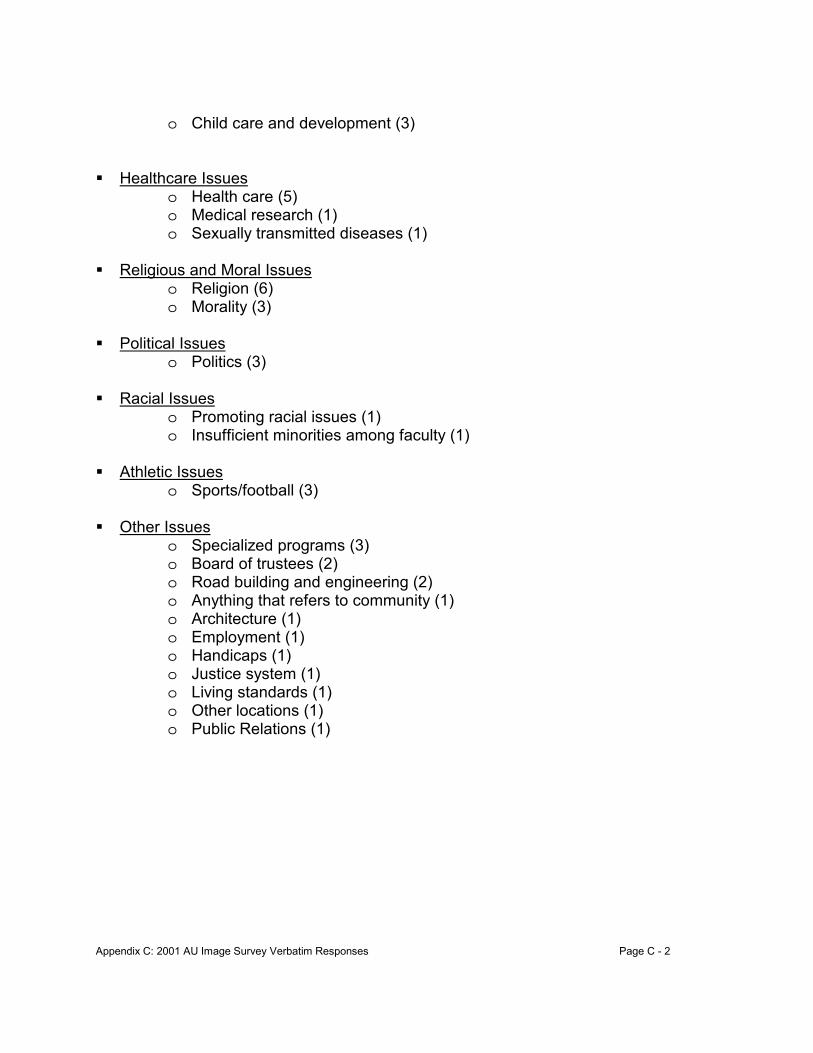
G. Issues Important to Alabamians The survey queried Alabamians about issues that they perceive to be
important. Issue areas included: Education, Community and Economic Development, Agriculture, Family and Youth, and the Environment. In each case, more than eight out of ten Alabamians report that the issue is important. Ninety-seven percent state that education is an important issue; 95% view community and economic development as important; and 94% report that family and youth are important issues. Finally, the environment is important for 92% of respondents, while agriculture garners 90% support (See Appendix B, Questions 50 – 55).

Appendix A: 2001 AU Image Survey Questionnaire Page A - 1
Appendix A: 2001 Auburn University Image Survey Questionnaire
1. How familiar are you with Auburn University? Would you say that you are
very familiar, familiar, not very familiar, or not at all familiar? Very familiar Familiar Neutral Not very familiar Not at all familiar Don’t know
2. How important is Auburn University to the overall quality of life in
Alabama? Very important Important Neutral Not very important Unimportant Don’t know
3. How important is Auburn University to the overall quality of life in your
local community? Very important Important Neutral Not very important Unimportant Don’t know
4. How important is the research conducted at Auburn University to attracting
and keeping jobs in your local community? Very important Important Neutral Not very important Unimportant Don’t know
5. During the past year, have you or your family directly benefited from
Auburn University? Yes No

Appendix A: 2001 AU Image Survey Questionnaire Page A - 2
6. Do you think Auburn University receives more, less, or about the same dollar amount of State support as compared to other universities in the Southeast?
More About the same Less Don’t know
7. Auburn University helps to create jobs in Alabama.
Strongly agree Somewhat agree Neutral Somewhat disagree Strongly disagree Don’t know
8. Auburn graduates play an important role in my community.
Strongly agree Somewhat agree Neutral Somewhat disagree Strongly disagree Don’t know
9. Auburn University concentrates on developing strong athletic programs
rather than quality educational programs. Strongly agree Somewhat agree Neutral Somewhat disagree Strongly disagree Don’t know
10. Auburn is one of the best public universities in the South.
Strongly agree Somewhat agree Neutral Somewhat disagree Strongly disagree Don’t know

Appendix A: 2001 AU Image Survey Questionnaire Page A - 3
11. Auburn is one of the best public universities in the nation. Strongly agree Somewhat agree Neutral Somewhat disagree Strongly disagree Don’t know
12. The State of Alabama receives a good return for its investment in Auburn
University. Strongly agree Somewhat agree Neutral Somewhat disagree Strongly disagree Don’t know
13. The quality of higher education in Alabama affects my family and me.
Strongly agree Somewhat agree Neutral Somewhat disagree Strongly disagree Don’t know
14. – 22. Where do you get information regarding State universities and
colleges? (check all that apply) Newspapers Radio Magazines T.V. Internet/ websites Alumni Students Co-workers Other No response
23. During the past year, did you see any TV or other media about Auburn
University research? Yes No

Appendix A: 2001 AU Image Survey Questionnaire Page A - 4
24. Are you aware of Auburn University’s research contributions to the development of a lighter, less bulky bulletproof vest for police officers?
Yes No
25. If yes, do you think this research is significant and should be continued?
Yes No
26. If yes, have you seen the TV announcement about this research?
Yes No
27. If yes, do you think Auburn University should continue to provide this
announcement? Yes No
28. Are you aware Auburn University’s research contributed to the next
generation of automobile airbags? Yes No
29. If yes, do you think this research is significant and should be continued?
Yes No
30. If yes, have you seen the TV announcement about this research?
Yes No
31. If yes, do you think Auburn University should continue to provide this
announcement? Yes No
32. Are you aware of the positive impact Auburn University has on Alabama’s
economy? Yes No
33. If yes, have you seen TV announcement about these positive impacts?
Yes No

Appendix A: 2001 AU Image Survey Questionnaire Page A - 5
34. If yes, do you think Auburn University should continue to provide this announcement?
Yes No
35. Are you aware Auburn University’s research contributed to highway safety
by developing new road surface materials and construction techniques? Yes No
36. If yes, do you think this research is significant and should be continued?
Yes No
37. Are you aware that Auburn University’s research in fisheries and
aquacultures sustains one of the world’s leading food sources? Yes No
38. If yes, do you think this research is significant and should be continued?
Yes No
39. Are you aware that Auburn University architecture students design low
cost housing in West Alabama? Yes No
40. If yes, should Auburn continue to invest in this kind of program?
Yes No
41. Are you aware of Auburn’s continuing education programs available for
professionals such as teachers, architects, engineers, pharmacist, veterinarians, and others?
Yes No
42. If yes, have you taken any continuing education programs offered by
Auburn University? Yes No

Appendix A: 2001 AU Image Survey Questionnaire Page A - 6
43. Did you know that Auburn University partners with local school districts by
providing professional training and development services to teachers? Yes No
44. If yes, should Auburn continue to invest in these partnerships?
Yes No
45. Would your local school district benefit from a university partnership?
Yes No
46. Are you familiar with the Alabama Cooperative Extension System?
Yes No
47. If yes, have you used any services available through your local county
agent of the Extension system? Yes No
48. If yes, are these programs beneficial to you and your family?
Yes No
49. Distance learning allows students to take college classes at any time or
any location off campus by using computers, videotapes, and other methods. Should Auburn offer more of its classes and degree programs through distance learning?
Yes No
50.- 55. Auburn University’s outreach services help people and communities
address significant local and statewide issues. Please respond “yes” to the issues that are important to you. Education Community and Economic Development Agriculture Family and Youth Environment Any other issue that is important to you ________ No response

Appendix A: 2001 AU Image Survey Questionnaire Page A - 7
56. How significant is it to you to have Auburn University outreach programs in your community?
Very significant Significant Neutral Insignificant Very insignificant No opinion
57. How significant is it to you to have access to Auburn University information
through the Internet? Very significant Significant Neutral Insignificant Very insignificant No opinion
58. Have you, your spouse, or your children ever attended Auburn University?
Yes No
59. Are you currently employed…..?
Full-time Part-time Retired Unemployed Other No answer
60. How many people live in your house?
61. How many children under 18 years of age currently live in your
household?
62. – 63. In which age group would you include yourself? Under 30 31-40 41-50 51-60 61-70 71+ No answer
64. What is your highest educational level?
Less than High School

Appendix A: 2001 AU Image Survey Questionnaire Page A - 8
High School diploma/GED Some college Bachelor’s degree Graduate/Professional No answer
65. – 66. Which category best describes your annual household income?
Less than $20,000 $20- 39,000 $40- 74,000 $75- 99,000 $100,000 and over No answer
67. – 68. What race do you identify with?
African-American Asian-American Hispanic Native-American White Other No answer
69. What is your gender?
Male Female No answer
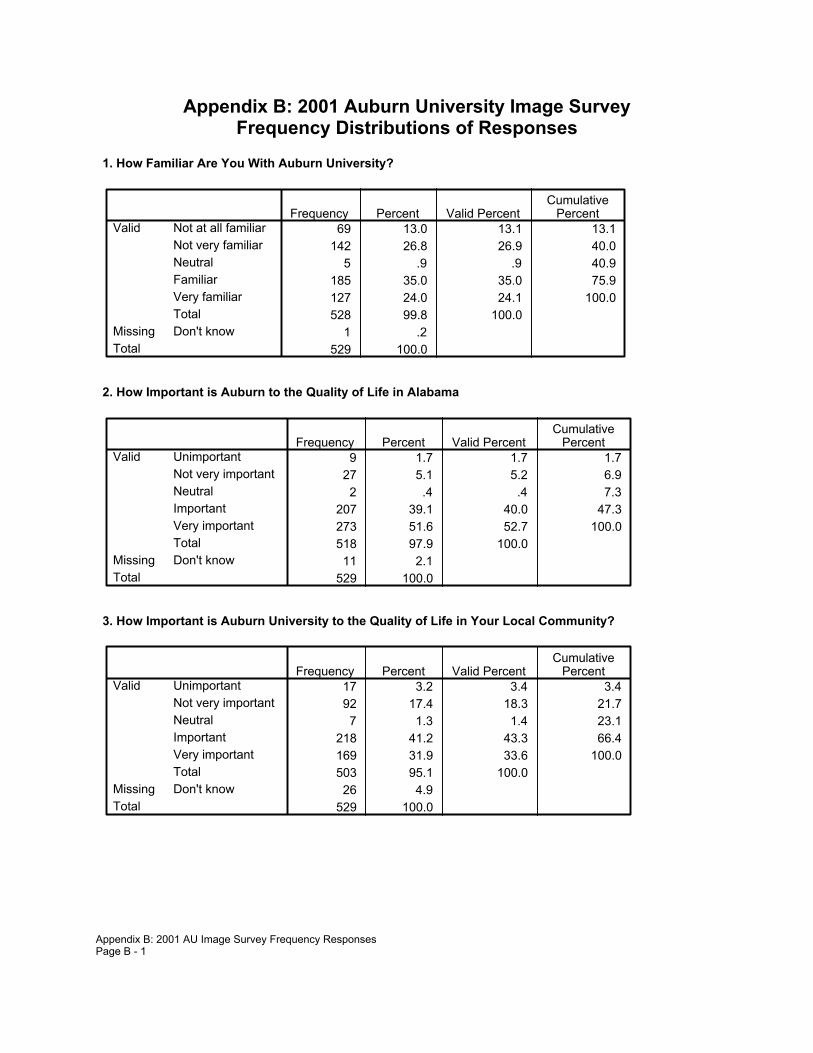
Appendix B: 2001 Auburn University Image SurveyFrequency Distributions of Responses
1. How Familiar Are You With Auburn University?
69 13.0 13.1 13.1142 26.8 26.9 40.0
5 .9 .9 40.9185 35.0 35.0 75.9127 24.0 24.1 100.0528 99.8 100.0
1 .2529 100.0
Not at all familiarNot very familiarNeutralFamiliarVery familiarTotal
Valid
Don't knowMissingTotal
Frequency Percent Valid PercentCumulative
Percent
2. How Important is Auburn to the Quality of Life in Alabama
9 1.7 1.7 1.727 5.1 5.2 6.92 .4 .4 7.3
207 39.1 40.0 47.3273 51.6 52.7 100.0518 97.9 100.011 2.1
529 100.0
UnimportantNot very importantNeutralImportantVery importantTotal
Valid
Don't knowMissingTotal
Frequency Percent Valid PercentCumulative
Percent
3. How Important is Auburn University to the Quality of Life in Your Local Community?
17 3.2 3.4 3.492 17.4 18.3 21.77 1.3 1.4 23.1
218 41.2 43.3 66.4169 31.9 33.6 100.0503 95.1 100.026 4.9
529 100.0
UnimportantNot very importantNeutralImportantVery importantTotal
Valid
Don't knowMissingTotal
Frequency Percent Valid PercentCumulative
Percent
Appendix B: 2001 AU Image Survey Frequency ResponsesPage B - 1

4. How Important is Auburn University Rresearch to Jobs in Your Local Community?
9 1.7 1.9 1.960 11.3 12.7 14.66 1.1 1.3 15.9
191 36.1 40.6 56.5205 38.8 43.5 100.0471 89.0 100.058 11.0
529 100.0
UnimportantNot very importantNeutralImportantVery importantTotal
Valid
Don't knowMissingTotal
Frequency Percent Valid PercentCumulative
Percent
5. Have You or Your Family Benefited From Auburn University?
373 70.5 70.5 70.5156 29.5 29.5 100.0529 100.0 100.0
NoYesTotal
ValidFrequency Percent Valid Percent
CumulativePercent
6. How does Auburn University Funding Compare to Other Universities in the Southeas?
74 14.0 20.0 20.0227 42.9 61.4 81.469 13.0 18.6 100.0
370 69.9 100.0159 30.1529 100.0
LessAbout the sameMoreTotal
Valid
Don't knowMissingTotal
Frequency Percent Valid PercentCumulative
Percent
7. Auburn University Helps to Create Jobs in Alabama
10 1.9 2.0 2.021 4.0 4.1 6.11 .2 .2 6.3
240 45.4 47.0 53.2239 45.2 46.8 100.0511 96.6 100.018 3.4
529 100.0
Strongly disagreeSomewhat disagreeNeutralSomewhat agreeStrongly agreeTotal
Valid
Don't knowMissingTotal
Frequency Percent Valid PercentCumulative
Percent
Appendix B: 2001 AU Image Survey Frequency ResponsesPage B - 2

8. Auburn University Graduates Play an Important Role in Your Local Community
17 3.2 3.4 3.436 6.8 7.2 10.68 1.5 1.6 12.2
217 41.0 43.2 55.4224 42.3 44.6 100.0502 94.9 100.027 5.1
529 100.0
Strongly disagreeSomewhat disagreeNeutralSomewhat agreeStrongly agreeTotal
Valid
Don't knowMissingTotal
Frequency Percent Valid PercentCumulative
Percent
9. Auburn University Concentrates on Athletics Rather Than Academic Programs
83 15.7 16.8 16.8151 28.5 30.5 47.327 5.1 5.5 52.7
136 25.7 27.5 80.298 18.5 19.8 100.0
495 93.6 100.034 6.4
529 100.0
Strongly disagreeSomewhat disagreeNeutralSomewhat agreeStrongly agreeTotal
Valid
Don't knowMissingTotal
Frequency Percent Valid PercentCumulative
Percent
10. Auburn University is One of the Best Universities in the South
18 3.4 3.5 3.544 8.3 8.7 12.216 3.0 3.1 15.4
225 42.5 44.3 59.6205 38.8 40.4 100.0508 96.0 100.021 4.0
529 100.0
Strongly disagreeSomewhat disagreeNeutralSomewhat agreeStrongly agreeTotal
Valid
Don't knowMissingTotal
Frequency Percent Valid PercentCumulative
Percent
Appendix B: 2001 AU Image Survey Frequency ResponsesPage B - 3
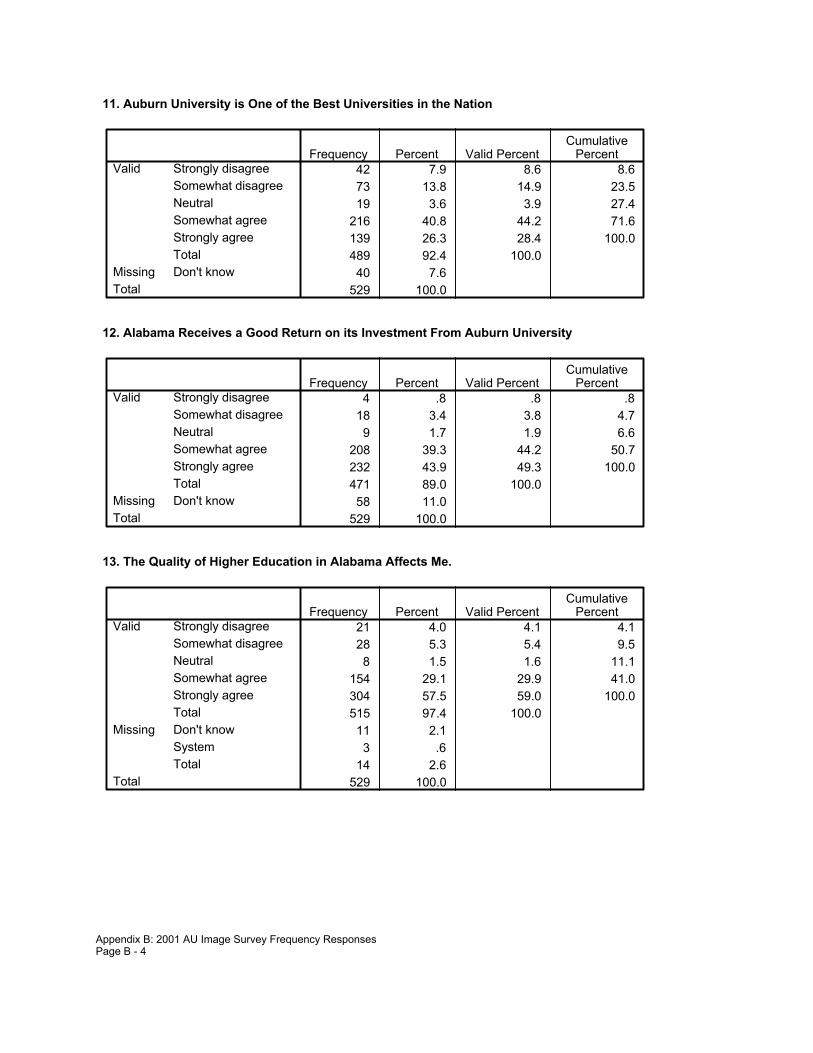
11. Auburn University is One of the Best Universities in the Nation
42 7.9 8.6 8.673 13.8 14.9 23.519 3.6 3.9 27.4
216 40.8 44.2 71.6139 26.3 28.4 100.0489 92.4 100.040 7.6
529 100.0
Strongly disagreeSomewhat disagreeNeutralSomewhat agreeStrongly agreeTotal
Valid
Don't knowMissingTotal
Frequency Percent Valid PercentCumulative
Percent
12. Alabama Receives a Good Return on its Investment From Auburn University
4 .8 .8 .818 3.4 3.8 4.79 1.7 1.9 6.6
208 39.3 44.2 50.7232 43.9 49.3 100.0471 89.0 100.058 11.0
529 100.0
Strongly disagreeSomewhat disagreeNeutralSomewhat agreeStrongly agreeTotal
Valid
Don't knowMissingTotal
Frequency Percent Valid PercentCumulative
Percent
13. The Quality of Higher Education in Alabama Affects Me.
21 4.0 4.1 4.128 5.3 5.4 9.58 1.5 1.6 11.1
154 29.1 29.9 41.0304 57.5 59.0 100.0515 97.4 100.011 2.13 .6
14 2.6529 100.0
Strongly disagreeSomewhat disagreeNeutralSomewhat agreeStrongly agreeTotal
Valid
Don't knowSystemTotal
Missing
Total
Frequency Percent Valid PercentCumulative
Percent
Appendix B: 2001 AU Image Survey Frequency ResponsesPage B - 4

14. I Learn About Alabama Universities From Newspapers.
186 35.2 35.6 35.6336 63.5 64.4 100.0522 98.7 100.0
7 1.3529 100.0
NoYesTotal
Valid
SystemMissingTotal
Frequency Percent Valid PercentCumulative
Percent
15. I Learn About Alabama Universities From the Radio.
371 70.1 71.1 71.1151 28.5 28.9 100.0522 98.7 100.0
7 1.3529 100.0
NoYesTotal
Valid
SystemMissingTotal
Frequency Percent Valid PercentCumulative
Percent
16. I Learn About Alabama Universities From Magazines.
361 68.2 69.2 69.2161 30.4 30.8 100.0522 98.7 100.0
7 1.3529 100.0
NoYesTotal
Valid
SystemMissingTotal
Frequency Percent Valid PercentCumulative
Percent
17. I Learn About Alabama Universities From Television.
223 42.2 42.7 42.7299 56.5 57.3 100.0522 98.7 100.0
7 1.3529 100.0
NoYesTotal
Valid
SystemMissingTotal
Frequency Percent Valid PercentCumulative
Percent
Appendix B: 2001 AU Image Survey Frequency ResponsesPage B - 5

18. I Learn About Alabama Universities From the Internet.
345 65.2 66.1 66.1177 33.5 33.9 100.0522 98.7 100.0
7 1.3529 100.0
NoYesTotal
Valid
SystemMissingTotal
Frequency Percent Valid PercentCumulative
Percent
19. I Learn About Alabama Universities From Alumni.
355 67.1 68.0 68.0167 31.6 32.0 100.0522 98.7 100.0
7 1.3529 100.0
NoYesTotal
Valid
SystemMissingTotal
Frequency Percent Valid PercentCumulative
Percent
20. I Learn About Alabama Universities From Students.
333 62.9 63.8 63.8189 35.7 36.2 100.0522 98.7 100.0
7 1.3529 100.0
NoYesTotal
Valid
SystemMissingTotal
Frequency Percent Valid PercentCumulative
Percent
21. I Learn About Alabama Universities From My Co-workers.
368 69.6 70.5 70.5154 29.1 29.5 100.0522 98.7 100.0
7 1.3529 100.0
NoYesTotal
Valid
SystemMissingTotal
Frequency Percent Valid PercentCumulative
Percent
Appendix B: 2001 AU Image Survey Frequency ResponsesPage B - 6

22. I Learn About Alabama Universities From Other Sources.
439 83.0 84.1 84.183 15.7 15.9 100.0
522 98.7 100.07 1.3
529 100.0
NoYesTotal
Valid
SystemMissingTotal
Frequency Percent Valid PercentCumulative
Percent
23. I Saw a Television Announcement About Auburn University's Research.
267 50.5 51.1 51.1255 48.2 48.9 100.0522 98.7 100.0
7 1.3529 100.0
NoYesTotal
Valid
SystemMissingTotal
Frequency Percent Valid PercentCumulative
Percent
24. I Am Aware That Auburn University Developed a New Bulletproof Vest.
389 73.5 74.5 74.5133 25.1 25.5 100.0522 98.7 100.0
7 1.3529 100.0
NoYesTotal
Valid
SystemMissingTotal
Frequency Percent Valid PercentCumulative
Percent
25. The Bulletproof Vest Research is Significant.
6 1.1 4.5 4.5127 24.0 95.5 100.0133 25.1 100.0396 74.9529 100.0
NoYesTotal
Valid
SystemMissingTotal
Frequency Percent Valid PercentCumulative
Percent
Appendix B: 2001 AU Image Survey Frequency ResponsesPage B - 7

26. I Saw a Television Announcement About the Bulletproof Vest.
73 13.8 54.9 54.960 11.3 45.1 100.0
133 25.1 100.0396 74.9529 100.0
NoYesTotal
Valid
SystemMissingTotal
Frequency Percent Valid PercentCumulative
Percent
27. The Bulletproof Vest Announcement Should be Continued.
4 .8 6.7 6.756 10.6 93.3 100.060 11.3 100.0
469 88.7529 100.0
NoYesTotal
Valid
SystemMissingTotal
Frequency Percent Valid PercentCumulative
Percent
28. I Am Aware That Auburn University Developed New Airbags.
410 77.5 78.7 78.7111 21.0 21.3 100.0521 98.5 100.0
8 1.5529 100.0
NoYesTotal
Valid
SystemMissingTotal
Frequency Percent Valid PercentCumulative
Percent
29. The Airbag Research is Significant.
4 .8 3.6 3.6107 20.2 96.4 100.0111 21.0 100.0418 79.0529 100.0
NoYesTotal
Valid
SystemMissingTotal
Frequency Percent Valid PercentCumulative
Percent
Appendix B: 2001 AU Image Survey Frequency ResponsesPage B - 8

30. I Saw the Television Announcement About Auburn University's Airbags.
63 11.9 56.8 56.848 9.1 43.2 100.0
111 21.0 100.0418 79.0529 100.0
NoYesTotal
Valid
SystemMissingTotal
Frequency Percent Valid PercentCumulative
Percent
31. The Airbag Announcement Should Be Continued.
4 .8 8.3 8.344 8.3 91.7 100.048 9.1 100.0
481 90.9529 100.0
NoYesTotal
Valid
SystemMissingTotal
Frequency Percent Valid PercentCumulative
Percent
32. I Am Aware That Auburn University Impacts the Economy.
188 35.5 36.2 36.2331 62.6 63.8 100.0519 98.1 100.010 1.9
529 100.0
NoYesTotal
Valid
SystemMissingTotal
Frequency Percent Valid PercentCumulative
Percent
33. I Saw the Television Announcement About Auburn University's Impact on the Economy.
191 36.1 57.9 57.9139 26.3 42.1 100.0330 62.4 100.0199 37.6529 100.0
NoYesTotal
Valid
SystemMissingTotal
Frequency Percent Valid PercentCumulative
Percent
Appendix B: 2001 AU Image Survey Frequency ResponsesPage B - 9

34. The Impact Announcements Should Be Continued.
3 .6 2.2 2.2136 25.7 97.8 100.0139 26.3 100.0390 73.7529 100.0
NoYesTotal
Valid
SystemMissingTotal
Frequency Percent Valid PercentCumulative
Percent
35. I Am Aware That Auburn University Improves Highway Construction.
330 62.4 63.8 63.8187 35.3 36.2 100.0517 97.7 100.012 2.3
529 100.0
NoYesTotal
Valid
SystemMissingTotal
Frequency Percent Valid PercentCumulative
Percent
36. The Highway Construction Research is Significant.
5 .9 2.7 2.7182 34.4 97.3 100.0187 35.3 100.0342 64.7529 100.0
NoYesTotal
Valid
SystemMissingTotal
Frequency Percent Valid PercentCumulative
Percent
37. I Am Aware That Auburn University Fisheries Sustains One of the World's Leading Food Sources.
205 38.8 39.9 39.9309 58.4 60.1 100.0514 97.2 100.015 2.8
529 100.0
NoYesTotal
Valid
SystemMissingTotal
Frequency Percent Valid PercentCumulative
Percent
Appendix B: 2001 AU Image Survey Frequency ResponsesPage B - 10

38. The Fisheries Research is Significant.
5 .9 1.6 1.6304 57.5 98.4 100.0309 58.4 100.0220 41.6529 100.0
NoYesTotal
Valid
SystemMissingTotal
Frequency Percent Valid PercentCumulative
Percent
39. I Am Aware That Auburn University Architecture Students Build Housing in West Alabama.
349 66.0 67.9 67.9165 31.2 32.1 100.0514 97.2 100.015 2.8
529 100.0
NoYesTotal
Valid
SystemMissingTotal
Frequency Percent Valid PercentCumulative
Percent
40. The Housing Program Should Be Continued.
5 .9 3.0 3.0160 30.2 97.0 100.0165 31.2 100.0364 68.8529 100.0
NoYesTotal
Valid
SystemMissingTotal
Frequency Percent Valid PercentCumulative
Percent
41. I Am Aware of Auburn University's Continuing Education Programs.
152 28.7 29.6 29.6362 68.4 70.4 100.0514 97.2 100.015 2.8
529 100.0
NoYesTotal
Valid
SystemMissingTotal
Frequency Percent Valid PercentCumulative
Percent
Appendix B: 2001 AU Image Survey Frequency ResponsesPage B - 11

42. I Have Participated in a Continuing Education Program at Auburn University.
310 58.6 85.6 85.652 9.8 14.4 100.0
362 68.4 100.0167 31.6529 100.0
NoYesTotal
Valid
SystemMissingTotal
Frequency Percent Valid PercentCumulative
Percent
43 I Am Aware of Auburn University's Partnerships With Local Schools.
343 64.8 66.7 66.7171 32.3 33.3 100.0514 97.2 100.015 2.8
529 100.0
NoYesTotal
Valid
SystemMissingTotal
Frequency Percent Valid PercentCumulative
Percent
44. The Partnerships Should Be Continued.
1 .2 .6 .6170 32.1 99.4 100.0171 32.3 100.0358 67.7529 100.0
NoYesTotal
Valid
SystemMissingTotal
Frequency Percent Valid PercentCumulative
Percent
45. My Local School District Would Benefit From a Partnership.
72 13.6 14.0 14.0442 83.6 86.0 100.0514 97.2 100.015 2.8
529 100.0
NoYesTotal
Valid
SystemMissingTotal
Frequency Percent Valid PercentCumulative
Percent
Appendix B: 2001 AU Image Survey Frequency ResponsesPage B - 12

46. I Am Familiar With the Cooperative Extension System.
243 45.9 47.3 47.3271 51.2 52.7 100.0514 97.2 100.015 2.8
529 100.0
NoYesTotal
Valid
SystemMissingTotal
Frequency Percent Valid PercentCumulative
Percent
47. I Have Used Services From the Extension System.
143 27.0 52.8 52.8128 24.2 47.2 100.0271 51.2 100.0258 48.8529 100.0
NoYesTotal
Valid
SystemMissingTotal
Frequency Percent Valid PercentCumulative
Percent
48. The Cooperative Extension Programs Are Beneficial.
2 .4 1.6 1.6126 23.8 98.4 100.0128 24.2 100.0401 75.8529 100.0
NoYesTotal
Valid
SystemMissingTotal
Frequency Percent Valid PercentCumulative
Percent
49. Auburn University Should Offer More Distance Learning Programs.
62 11.7 12.1 12.1452 85.4 87.9 100.0514 97.2 100.015 2.8
529 100.0
NoYesTotal
Valid
SystemMissingTotal
Frequency Percent Valid PercentCumulative
Percent
Appendix B: 2001 AU Image Survey Frequency ResponsesPage B - 13

50. Is Education an Important Issue for You?
14 2.6 2.7 2.7498 94.1 97.3 100.0512 96.8 100.017 3.2
529 100.0
NoYesTotal
Valid
SystemMissingTotal
Frequency Percent Valid PercentCumulative
Percent
51. Is Community and Economic Development an Important Issue for You?
27 5.1 5.3 5.3485 91.7 94.7 100.0512 96.8 100.017 3.2
529 100.0
NoYesTotal
Valid
SystemMissingTotal
Frequency Percent Valid PercentCumulative
Percent
52. Is Agriculture an Important Issue for You?
53 10.0 10.4 10.4459 86.8 89.6 100.0512 96.8 100.017 3.2
529 100.0
NoYesTotal
Valid
SystemMissingTotal
Frequency Percent Valid PercentCumulative
Percent
53. Are Family and Youth Important Issues for You?
32 6.0 6.3 6.3480 90.7 93.8 100.0512 96.8 100.017 3.2
529 100.0
NoYesTotal
Valid
SystemMissingTotal
Frequency Percent Valid PercentCumulative
Percent
Appendix B: 2001 AU Image Survey Frequency ResponsesPage B - 14

54. Is the Environment an Important Issue for You?
39 7.4 7.6 7.6473 89.4 92.4 100.0512 96.8 100.017 3.2
529 100.0
NoYesTotal
Valid
SystemMissingTotal
Frequency Percent Valid PercentCumulative
Percent
55. Are There Any Other Important Issues for You?
445 84.1 86.9 86.967 12.7 13.1 100.0
512 96.8 100.017 3.2
529 100.0
NoYesTotal
Valid
SystemMissingTotal
Frequency Percent Valid PercentCumulative
Percent
56. How Significant is it to Have Outreach Programs in Your Community?
22 4.2 4.3 4.325 4.7 4.9 9.231 5.9 6.1 15.310 1.9 2.0 17.2
172 32.5 33.7 50.9251 47.4 49.1 100.0511 96.6 100.018 3.4
529 100.0
No opinionVery insignificantInsignificantNeutralSignificantVery significantTotal
Valid
SystemMissingTotal
Frequency Percent Valid PercentCumulative
Percent
Appendix B: 2001 AU Image Survey Frequency ResponsesPage B - 15

57. How Significant is it to Have Access to Information Over the Internet?
33 6.2 6.5 6.554 10.2 10.6 17.078 14.7 15.3 32.38 1.5 1.6 33.9
111 21.0 21.7 55.6227 42.9 44.4 100.0511 96.6 100.018 3.4
529 100.0
No opinionVery insignificantInsignificantNeutralSignificantVery significantTotal
Valid
SystemMissingTotal
Frequency Percent Valid PercentCumulative
Percent
58. Have You, Your Spouse, or Your Children Attended Auburn University?
405 76.6 80.0 80.0101 19.1 20.0 100.0506 95.7 100.023 4.3
529 100.0
NoYesTotal
Valid
SystemMissingTotal
Frequency Percent Valid PercentCumulative
Percent
59. Are You Currently Employed?
67 12.7 13.4 13.492 17.4 18.4 31.834 6.4 6.8 38.6
285 53.9 57.0 95.622 4.2 4.4 100.0
500 94.5 100.06 1.1
23 4.329 5.5
529 100.0
UnemployedRetiredPart-timeFull-timeOtherTotal
Valid
No answerSystemTotal
Missing
Total
Frequency Percent Valid PercentCumulative
Percent
Appendix B: 2001 AU Image Survey Frequency ResponsesPage B - 16

60. Number of People in Your Household?
27 5.1 5.1 5.11 .2 .2 5.3
84 15.9 15.9 21.2172 32.5 32.5 53.9108 20.4 20.4 74.385 16.1 16.1 90.433 6.2 6.2 96.615 2.8 2.8 99.43 .6 .6 100.0
529 100.0 100.0
01234567Total
ValidFrequency Percent Valid Percent
CumulativePercent
61. What is the Number of Children (Under 18) in Your Household?
33 6.2 6.2 6.2302 57.1 57.1 63.384 15.9 15.9 79.270 13.2 13.2 92.428 5.3 5.3 97.710 1.9 1.9 99.61 .2 .2 99.81 .2 .2 100.0
529 100.0 100.0
0123458Total
ValidFrequency Percent Valid Percent
CumulativePercent
62. Age of the Respondent.
96 18.1 19.2 19.290 17.0 18.0 37.3
126 23.8 25.3 62.586 16.3 17.2 79.854 10.2 10.8 90.647 8.9 9.4 100.0
499 94.3 100.07 1.3
23 4.330 5.7
529 100.0
Under 3031 - 4041 - 5051 - 6061 - 7071+Total
Valid
No answerSystemTotal
Missing
Total
Frequency Percent Valid PercentCumulative
Percent
Appendix B: 2001 AU Image Survey Frequency ResponsesPage B - 17
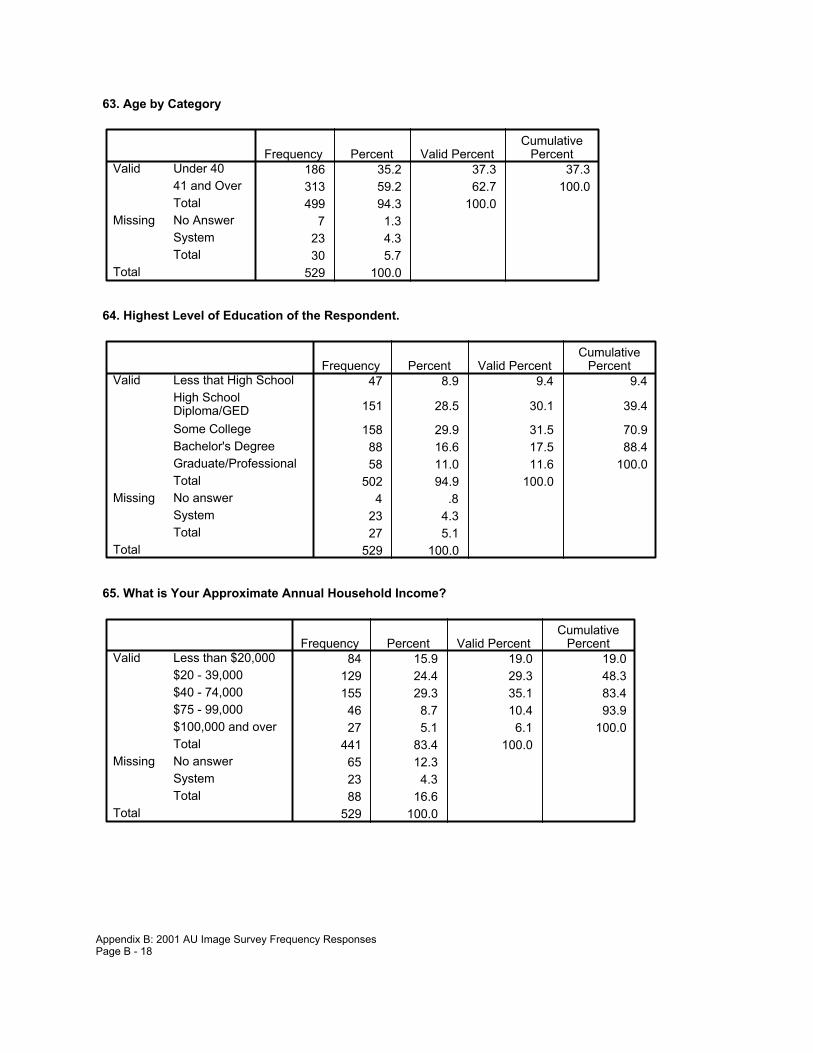
63. Age by Category
186 35.2 37.3 37.3313 59.2 62.7 100.0499 94.3 100.0
7 1.323 4.330 5.7
529 100.0
Under 4041 and OverTotal
Valid
No AnswerSystemTotal
Missing
Total
Frequency Percent Valid PercentCumulative
Percent
64. Highest Level of Education of the Respondent.
47 8.9 9.4 9.4
151 28.5 30.1 39.4
158 29.9 31.5 70.988 16.6 17.5 88.458 11.0 11.6 100.0
502 94.9 100.04 .8
23 4.327 5.1
529 100.0
Less that High SchoolHigh SchoolDiploma/GEDSome CollegeBachelor's DegreeGraduate/ProfessionalTotal
Valid
No answerSystemTotal
Missing
Total
Frequency Percent Valid PercentCumulative
Percent
65. What is Your Approximate Annual Household Income?
84 15.9 19.0 19.0129 24.4 29.3 48.3155 29.3 35.1 83.446 8.7 10.4 93.927 5.1 6.1 100.0
441 83.4 100.065 12.323 4.388 16.6
529 100.0
Less than $20,000$20 - 39,000$40 - 74,000$75 - 99,000$100,000 and overTotal
Valid
No answerSystemTotal
Missing
Total
Frequency Percent Valid PercentCumulative
Percent
Appendix B: 2001 AU Image Survey Frequency ResponsesPage B - 18

66. Income by Category
213 40.3 48.3 48.3228 43.1 51.7 100.0441 83.4 100.065 12.323 4.388 16.6
529 100.0
Under $40,000Over $40,000Total
Valid
No AnswerSystemTotal
Missing
Total
Frequency Percent Valid PercentCumulative
Percent
67. Race
104 19.7 20.8 20.82 .4 .4 21.27 1.3 1.4 22.6
384 72.6 76.8 99.43 .6 .6 100.0
500 94.5 100.06 1.1
23 4.329 5.5
529 100.0
African-AmericanAsian-AmericanNative-AmericanWhiteOtherTotal
Valid
No answerSystemTotal
Missing
Total
Frequency Percent Valid PercentCumulative
Percent
68. Race by Category
104 19.7 21.3 21.3384 72.6 78.7 100.0488 92.2 100.018 3.423 4.341 7.8
529 100.0
Africian-AmericanWhiteTotal
Valid
All othersSystemTotal
Missing
Total
Frequency Percent Valid PercentCumulative
Percent
Appendix B: 2001 AU Image Survey Frequency ResponsesPage B - 19

69. Gender
313 59.2 61.9 61.9193 36.5 38.1 100.0506 95.7 100.023 4.3
529 100.0
FemaleMaleTotal
Valid
SystemMissingTotal
Frequency Percent Valid PercentCumulative
Percent
Appendix B: 2001 AU Image Survey Frequency ResponsesPage B - 20

Appendix C: 2001 AU Image Survey Verbatim Responses Page C - 1
Appendix C: 2001 AU Image Survey Verbatim Responses
Open-Ended / Responses Q22: Where do you get information regarding State universities and colleges? Friends and Family
o Family members (17) o Friends (7) o Other people (5)
Ads, Brochures, Flyers, and Mailers o Ads, flyers, and mailers (5) o College materials (3) o Public information/news (2)
Schools and Teachers o Universities (11) o High Schools (8) o Schoolteachers (2)
Word of Mouth and Experience o Word of mouth (10) o Personal experience (3)
Other o Affiliation with the school (3) o Sport affiliations (2) o Community meetings (2) o Visiting campus (2) o Agriculture (1)
Q55: Auburn University's Outreach services help people and communities
address significant local and statewide issues. What issues are important to you?
Wildlife and Nature Issues
o Wildlife (7) o Pest control (1) o Water conservation (2)
Youth Issues
Appendix C: 2001 AU Image Survey Verbatim Responses Page C - 2
o Child care and development (3)
Healthcare Issues
o Health care (5) o Medical research (1) o Sexually transmitted diseases (1)
Religious and Moral Issues o Religion (6) o Morality (3)
Political Issues o Politics (3)
Racial Issues
o Promoting racial issues (1) o Insufficient minorities among faculty (1)
Athletic Issues o Sports/football (3)
Other Issues o Specialized programs (3) o Board of trustees (2) o Road building and engineering (2) o Anything that refers to community (1) o Architecture (1) o Employment (1) o Handicaps (1) o Justice system (1) o Living standards (1) o Other locations (1) o Public Relations (1)

Appendix D: 2001 AU Image Survey ResponsesControlled by Education Level Category
1. How Familiar Are You With Auburn University? (by Education Category)
Crosstab
% within Education by Category
16.3% 3.4% 12.6%30.1% 15.1% 25.7%
1.1% .7% 1.0%32.7% 43.2% 35.7%19.7% 37.7% 25.0%
100.0% 100.0% 100.0%
Not at all familiarNot very familiarNeutralFamiliarVery familiar
How familiarare you withAuburn
Total
Less thanBachelor's
Degree
Bachelor'sdegree or
Higher
Education by Category
Total
Chi-Square Tests
39.590a 4 .00043.150 4 .000
39.421 1 .000
501
Pearson Chi-SquareLikelihood RatioLinear-by-LinearAssociationN of Valid Cases
Value dfAsymp. Sig.
(2-sided)
2 cells (20.0%) have expected count less than 5. The minimum expected count is 1.46.a.
Symmetric Measures
.281 .038 6.535 .000c
.277 .040 6.443 .000c
501
Pearson's RInterval by IntervalSpearman CorrelationOrdinal by Ordinal
N of Valid Cases
ValueAsymp.
Std. Errora Approx. Tb Approx. Sig.
Not assuming the null hypothesis.a.
Using the asymptotic standard error assuming the null hypothesis.b.
Based on normal approximation.c.
Appendix D: 2001 AU Image Survey Results by Education CategoryPage D - 1

2. How Important is Auburn University to the Quality of Life in Alabama?(by Education Category)
Crosstab
% within Education by Category
.9% 2.1% 1.2%4.9% 4.1% 4.7%.3% .7% .4%
39.4% 41.8% 40.1%54.5% 51.4% 53.6%
100.0% 100.0% 100.0%
UnimportantNot very importantNeutralImportantVery important
How importantis Auburn tothe quality oflife in Alabama
Total
Less thanBachelor's
Degree
Bachelor'sdegree or
Higher
Education by Category
Total
Chi-Square Tests
2.048a 4 .7271.915 4 .751
.448 1 .503
491
Pearson Chi-SquareLikelihood RatioLinear-by-LinearAssociationN of Valid Cases
Value dfAsymp. Sig.
(2-sided)
4 cells (40.0%) have expected count less than 5. The minimum expected count is .59.a.
Symmetric Measures
-.030 .046 -.669 .504c
-.030 .045 -.658 .511c
491
Pearson's RInterval by IntervalSpearman CorrelationOrdinal by Ordinal
N of Valid Cases
ValueAsymp.
Std. Errora Approx. Tb Approx. Sig.
Not assuming the null hypothesis.a.
Using the asymptotic standard error assuming the null hypothesis.b.
Based on normal approximation.c.
Appendix D: 2001 AU Image Survey Results by Education CategoryPage D - 2

3. How Important is Auburn University to the Quality of Life in Your LocalCommunity? (by Education Category)
Crosstab
% within Education by Category
2.4% 4.2% 2.9%18.6% 16.8% 18.0%
1.5% 1.4% 1.5%41.6% 46.2% 43.0%35.9% 31.5% 34.6%
100.0% 100.0% 100.0%
UnimportantNot very importantNeutralImportantVery important
How important isAuburn to thequality of life inlocal community
Total
Less thanBachelor's
Degree
Bachelor'sdegree or
Higher
Education by Category
Total
Chi-Square Tests
2.344a 4 .6732.281 4 .684
.289 1 .591
477
Pearson Chi-SquareLikelihood RatioLinear-by-LinearAssociationN of Valid Cases
Value dfAsymp. Sig.
(2-sided)
3 cells (30.0%) have expected count less than 5. The minimum expected count is 2.10.a.
Symmetric Measures
-.025 .046 -.537 .592c
-.032 .045 -.705 .481c
477
Pearson's RInterval by IntervalSpearman CorrelationOrdinal by Ordinal
N of Valid Cases
ValueAsymp.
Std. Errora Approx. Tb Approx. Sig.
Not assuming the null hypothesis.a.
Using the asymptotic standard error assuming the null hypothesis.b.
Based on normal approximation.c.
Appendix D: 2001 AU Image Survey Results by Education CategoryPage D - 3

4. How Important is Auburn University Research for Jobs in Your LocalCommunity? (by Education Category)
Crosstab
% within Education by Category
1.9% 2.2% 2.0%8.9% 18.7% 11.9%1.9% 1.3%
39.9% 41.0% 40.3%47.3% 38.1% 44.5%
100.0% 100.0% 100.0%
UnimportantNot very importantNeutralImportantVery important
How important isAuburn researchfor jobs in localcommunity
Total
Less thanBachelor's
Degree
Bachelor'sdegree or
Higher
Education by Category
Total
Chi-Square Tests
11.902a 4 .01813.089 4 .011
6.552 1 .010
447
Pearson Chi-SquareLikelihood RatioLinear-by-LinearAssociationN of Valid Cases
Value dfAsymp. Sig.
(2-sided)
3 cells (30.0%) have expected count less than 5. The minimum expected count is 1.80.a.
Symmetric Measures
-.121 .049 -2.576 .010c
-.109 .048 -2.302 .022c
447
Pearson's RInterval by IntervalSpearman CorrelationOrdinal by Ordinal
N of Valid Cases
ValueAsymp.
Std. Errora Approx. Tb Approx. Sig.
Not assuming the null hypothesis.a.
Using the asymptotic standard error assuming the null hypothesis.b.
Based on normal approximation.c.
Appendix D: 2001 AU Image Survey Results by Education CategoryPage D - 4

5. Have You or Your Family Benefited from Auburn University?(by Education Category)
Crosstab
% within Education by Category
73.3% 58.9% 69.1%26.7% 41.1% 30.9%
100.0% 100.0% 100.0%
NoYes
Have you or your familybenefited from AuburnTotal
Less thanBachelor's
Degree
Bachelor'sdegree or
Higher
Education by Category
Total
Chi-Square Tests
10.074b 1 .0029.410 1 .0029.803 1 .002
.002 .001
10.054 1 .002
502
Pearson Chi-SquareContinuity Correctiona
Likelihood RatioFisher's Exact TestLinear-by-LinearAssociationN of Valid Cases
Value dfAsymp. Sig.
(2-sided)Exact Sig.(2-sided)
Exact Sig.(1-sided)
Computed only for a 2x2 tablea.
0 cells (.0%) have expected count less than 5. The minimum expected count is 45.08.b.
Symmetric Measures
.142 .046 3.200 .001c
.142 .046 3.200 .001c
502
Pearson's RInterval by IntervalSpearman CorrelationOrdinal by Ordinal
N of Valid Cases
ValueAsymp.
Std. Errora Approx. Tb Approx. Sig.
Not assuming the null hypothesis.a.
Using the asymptotic standard error assuming the null hypothesis.b.
Based on normal approximation.c.
Appendix D: 2001 AU Image Survey Results by Education CategoryPage D - 5

6. How Does Auburn University Funding Compare to Other Universitiesin the Southeast? (by Education Category)
Crosstab
% within Education by Category
17.7% 26.9% 20.5%63.4% 54.6% 60.7%18.9% 18.5% 18.8%
100.0% 100.0% 100.0%
LessAbout the sameMore
How does Auburnfunding compare toother universities inthe Southeast
Total
Less thanBachelor's
Degree
Bachelor'sdegree or
Higher
Education by Category
Total
Chi-Square Tests
4.005a 2 .1353.880 2 .144
1.737 1 .187
351
Pearson Chi-SquareLikelihood RatioLinear-by-LinearAssociationN of Valid Cases
Value dfAsymp. Sig.
(2-sided)
0 cells (.0%) have expected count less than 5. The minimum expected count is 20.31.a.
Symmetric Measures
-.070 .055 -1.319 .188c
-.071 .055 -1.332 .184c
351
Pearson's RInterval by IntervalSpearman CorrelationOrdinal by Ordinal
N of Valid Cases
ValueAsymp.
Std. Errora Approx. Tb Approx. Sig.
Not assuming the null hypothesis.a.
Using the asymptotic standard error assuming the null hypothesis.b.
Based on normal approximation.c.
Appendix D: 2001 AU Image Survey Results by Education CategoryPage D - 6

7. Auburn University Helps to Create Jobs in Alabama.(by Education Category)
Crosstab
% within Education by Category
1.5% 1.4% 1.4%4.1% 4.2% 4.1%.3% .2%
48.7% 40.3% 46.2%45.5% 54.2% 48.0%
100.0% 100.0% 100.0%
Strongly disagreeSomewhat disagreeNeutralSomewhat agreeStrongly agree
Auburn helpscreate jobs inAlabama
Total
Less thanBachelor's
Degree
Bachelor'sdegree or
Higher
Education by Category
Total
Chi-Square Tests
3.570a 4 .4673.857 4 .426
1.262 1 .261
487
Pearson Chi-SquareLikelihood RatioLinear-by-LinearAssociationN of Valid Cases
Value dfAsymp. Sig.
(2-sided)
4 cells (40.0%) have expected count less than 5. The minimum expected count is .30.a.
Symmetric Measures
.051 .046 1.124 .262c
.074 .045 1.633 .103c
487
Pearson's RInterval by IntervalSpearman CorrelationOrdinal by Ordinal
N of Valid Cases
ValueAsymp.
Std. Errora Approx. Tb Approx. Sig.
Not assuming the null hypothesis.a.
Using the asymptotic standard error assuming the null hypothesis.b.
Based on normal approximation.c.
Appendix D: 2001 AU Image Survey Results by Education CategoryPage D - 7

8. Auburn University Graduates Play an Important Role in Your LocalCommunity. (by Education Category)
Crosstab
% within Education by Category
2.4% 5.0% 3.1%7.4% 6.4% 7.1%2.1% 1.5%
41.1% 46.4% 42.7%47.0% 42.1% 45.6%
100.0% 100.0% 100.0%
Strongly disagreeSomewhat disagreeNeutralSomewhat agreeStrongly agree
Auburn graduatesplay importantroles in localcommunity
Total
Less thanBachelor's
Degree
Bachelor'sdegree or
Higher
Education by Category
Total
Chi-Square Tests
6.391a 4 .1728.165 4 .086
.767 1 .381
478
Pearson Chi-SquareLikelihood RatioLinear-by-LinearAssociationN of Valid Cases
Value dfAsymp. Sig.
(2-sided)
3 cells (30.0%) have expected count less than 5. The minimum expected count is 2.05.a.
Symmetric Measures
-.040 .047 -.875 .382c
-.040 .046 -.863 .389c
478
Pearson's RInterval by IntervalSpearman CorrelationOrdinal by Ordinal
N of Valid Cases
ValueAsymp.
Std. Errora Approx. Tb Approx. Sig.
Not assuming the null hypothesis.a.
Using the asymptotic standard error assuming the null hypothesis.b.
Based on normal approximation.c.
Appendix D: 2001 AU Image Survey Results by Education CategoryPage D - 8

9. Auburn University Concentrates on Athletics Instead of AcademicPrograms (by Education Category)
Crosstab
% within Education by Category
15.0% 20.4% 16.6%26.7% 40.1% 30.6%
5.7% 5.1% 5.5%28.8% 24.1% 27.4%23.7% 10.2% 19.8%
100.0% 100.0% 100.0%
Strongly disagreeSomewhat disagreeNeutralSomewhat agreeStrongly agree
Auburn concentrateson athletic instead ofacademic programs
Total
Less thanBachelor's
Degree
Bachelor'sdegree or
Higher
Education by Category
Total
Chi-Square Tests
17.229a 4 .00218.114 4 .001
14.934 1 .000
470
Pearson Chi-SquareLikelihood RatioLinear-by-LinearAssociationN of Valid Cases
Value dfAsymp. Sig.
(2-sided)
0 cells (.0%) have expected count less than 5. The minimum expected count is 7.58.a.
Symmetric Measures
-.178 .044 -3.923 .000c
-.177 .043 -3.889 .000c
470
Pearson's RInterval by IntervalSpearman CorrelationOrdinal by Ordinal
N of Valid Cases
ValueAsymp.
Std. Errora Approx. Tb Approx. Sig.
Not assuming the null hypothesis.a.
Using the asymptotic standard error assuming the null hypothesis.b.
Based on normal approximation.c.
Appendix D: 2001 AU Image Survey Results by Education CategoryPage D - 9

10. Auburn University is One of the Best Universities in the South.(by Education Category)
Crosstab
% within Education by Category
4.1% 2.1% 3.5%7.4% 9.2% 7.9%4.1% .7% 3.1%
42.9% 45.8% 43.8%41.5% 42.3% 41.7%
100.0% 100.0% 100.0%
Strongly disagreeSomewhat disagreeNeutralSomewhat agreeStrongly agree
Auburn is one ofthe bestuniversities inthe South
Total
Less thanBachelor's
Degree
Bachelor'sdegree or
Higher
Education by Category
Total
Chi-Square Tests
5.503a 4 .2396.727 4 .151
.409 1 .522
482
Pearson Chi-SquareLikelihood RatioLinear-by-LinearAssociationN of Valid Cases
Value dfAsymp. Sig.
(2-sided)
1 cells (10.0%) have expected count less than 5. The minimum expected count is 4.42.a.
Symmetric Measures
.029 .044 .639 .523c
.022 .045 .493 .622c
482
Pearson's RInterval by IntervalSpearman CorrelationOrdinal by Ordinal
N of Valid Cases
ValueAsymp.
Std. Errora Approx. Tb Approx. Sig.
Not assuming the null hypothesis.a.
Using the asymptotic standard error assuming the null hypothesis.b.
Based on normal approximation.c.
Appendix D: 2001 AU Image Survey Results by Education CategoryPage D - 10

11. Auburn University is One of the Best Universities in the Nation.(by Education Category)
Crosstab
% within Education by Category
8.0% 7.9% 8.0%12.9% 15.0% 13.5%
4.3% 2.1% 3.7%44.6% 46.4% 45.2%30.2% 28.6% 29.7%
100.0% 100.0% 100.0%
Strongly disagreeSomewhat disagreeNeutralSomewhat agreeStrongly agree
Auburn is oneof the bestuniversities inthe nation
Total
Less thanBachelor's
Degree
Bachelor'sdegree or
Higher
Education by Category
Total
Chi-Square Tests
1.722a 4 .7871.851 4 .763
.063 1 .802
465
Pearson Chi-SquareLikelihood RatioLinear-by-LinearAssociationN of Valid Cases
Value dfAsymp. Sig.
(2-sided)
0 cells (.0%) have expected count less than 5. The minimum expected count is 5.12.a.
Symmetric Measures
-.012 .046 -.251 .802c
-.012 .046 -.251 .802c
465
Pearson's RInterval by IntervalSpearman CorrelationOrdinal by Ordinal
N of Valid Cases
ValueAsymp.
Std. Errora Approx. Tb Approx. Sig.
Not assuming the null hypothesis.a.
Using the asymptotic standard error assuming the null hypothesis.b.
Based on normal approximation.c.
Appendix D: 2001 AU Image Survey Results by Education CategoryPage D - 11
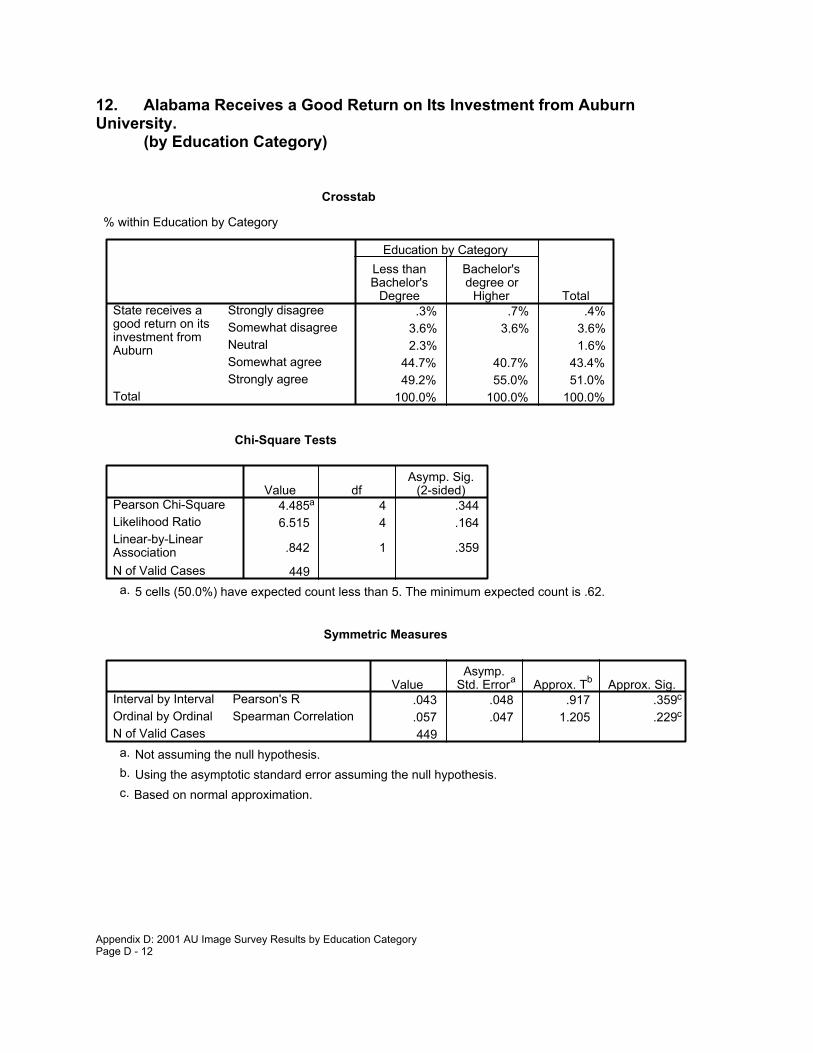
12. Alabama Receives a Good Return on Its Investment from AuburnUniversity.
(by Education Category)
Crosstab
% within Education by Category
.3% .7% .4%3.6% 3.6% 3.6%2.3% 1.6%
44.7% 40.7% 43.4%49.2% 55.0% 51.0%
100.0% 100.0% 100.0%
Strongly disagreeSomewhat disagreeNeutralSomewhat agreeStrongly agree
State receives agood return on itsinvestment fromAuburn
Total
Less thanBachelor's
Degree
Bachelor'sdegree or
Higher
Education by Category
Total
Chi-Square Tests
4.485a 4 .3446.515 4 .164
.842 1 .359
449
Pearson Chi-SquareLikelihood RatioLinear-by-LinearAssociationN of Valid Cases
Value dfAsymp. Sig.
(2-sided)
5 cells (50.0%) have expected count less than 5. The minimum expected count is .62.a.
Symmetric Measures
.043 .048 .917 .359c
.057 .047 1.205 .229c
449
Pearson's RInterval by IntervalSpearman CorrelationOrdinal by Ordinal
N of Valid Cases
ValueAsymp.
Std. Errora Approx. Tb Approx. Sig.
Not assuming the null hypothesis.a.
Using the asymptotic standard error assuming the null hypothesis.b.
Based on normal approximation.c.
Appendix D: 2001 AU Image Survey Results by Education CategoryPage D - 12

13. The Quality of Higher Education in Alabama Affects Me.(by Education Category)
Crosstab
% within Education by Category
3.2% 4.9% 3.7%5.7% 4.2% 5.3%1.7% 1.2%
32.5% 23.8% 29.9%56.9% 67.1% 59.9%
100.0% 100.0% 100.0%
Strongly disagreeSomewhat disagreeNeutralSomewhat agreeStrongly agree
Quality of highereducation inAlabama affectsme
Total
Less thanBachelor's
Degree
Bachelor'sdegree or
Higher
Education by Category
Total
Chi-Square Tests
8.091a 4 .0889.813 4 .044
.969 1 .325
491
Pearson Chi-SquareLikelihood RatioLinear-by-LinearAssociationN of Valid Cases
Value dfAsymp. Sig.
(2-sided)
2 cells (20.0%) have expected count less than 5. The minimum expected count is 1.75.a.
Symmetric Measures
.044 .046 .984 .326c
.086 .044 1.907 .057c
491
Pearson's RInterval by IntervalSpearman CorrelationOrdinal by Ordinal
N of Valid Cases
ValueAsymp.
Std. Errora Approx. Tb Approx. Sig.
Not assuming the null hypothesis.a.
Using the asymptotic standard error assuming the null hypothesis.b.
Based on normal approximation.c.
Appendix D: 2001 AU Image Survey Results by Education CategoryPage D - 13

14. I Learn About Alabama Universities from Newspapers.(by Education Category)
Crosstab
% within Education by Category
36.5% 31.5% 35.1%
63.5% 68.5% 64.9%100.0% 100.0% 100.0%
No
Yes
Learn about Stateuniversities fromnewspapersTotal
Less thanBachelor's
Degree
Bachelor'sdegree or
Higher
Education by Category
Total
Chi-Square Tests
1.141b 1 .285.932 1 .334
1.153 1 .283.304 .167
1.139 1 .286
502
Pearson Chi-SquareContinuity Correctiona
Likelihood RatioFisher's Exact TestLinear-by-LinearAssociationN of Valid Cases
Value dfAsymp. Sig.
(2-sided)Exact Sig.(2-sided)
Exact Sig.(1-sided)
Computed only for a 2x2 tablea.
0 cells (.0%) have expected count less than 5. The minimum expected count is 51.19.b.
Symmetric Measures
.048 .044 1.067 .286c
.048 .044 1.067 .286c
502
Pearson's RInterval by IntervalSpearman CorrelationOrdinal by Ordinal
N of Valid Cases
ValueAsymp.
Std. Errora Approx. Tb Approx. Sig.
Not assuming the null hypothesis.a.
Using the asymptotic standard error assuming the null hypothesis.b.
Based on normal approximation.c.
Appendix D: 2001 AU Image Survey Results by Education CategoryPage D - 14

15. I Learn About Alabama Universities From the Radio.(by Education Category)
Crosstab
% within Education by Category
72.5% 67.1% 70.9%27.5% 32.9% 29.1%
100.0% 100.0% 100.0%
NoYes
Learn about Stateuniversities from radioTotal
Less thanBachelor's
Degree
Bachelor'sdegree or
Higher
Education by Category
Total
Chi-Square Tests
1.436b 1 .2311.188 1 .2761.417 1 .234
.236 .138
1.433 1 .231
502
Pearson Chi-SquareContinuity Correctiona
Likelihood RatioFisher's Exact TestLinear-by-LinearAssociationN of Valid Cases
Value dfAsymp. Sig.
(2-sided)Exact Sig.(2-sided)
Exact Sig.(1-sided)
Computed only for a 2x2 tablea.
0 cells (.0%) have expected count less than 5. The minimum expected count is 42.46.b.
Symmetric Measures
.053 .045 1.198 .232c
.053 .045 1.198 .232c
502
Pearson's RInterval by IntervalSpearman CorrelationOrdinal by Ordinal
N of Valid Cases
ValueAsymp.
Std. Errora Approx. Tb Approx. Sig.
Not assuming the null hypothesis.a.
Using the asymptotic standard error assuming the null hypothesis.b.
Based on normal approximation.c.
Appendix D: 2001 AU Image Survey Results by Education CategoryPage D - 15

16. I Learn About Alabama Universities From Magazines.(by Education Category)
Crosstab
% within Education by Category
71.1% 61.6% 68.3%
28.9% 38.4% 31.7%100.0% 100.0% 100.0%
No
Yes
Learn about Stateuniversities frommagazinesTotal
Less thanBachelor's
Degree
Bachelor'sdegree or
Higher
Education by Category
Total
Chi-Square Tests
4.249b 1 .0393.824 1 .0514.170 1 .041
.045 .026
4.240 1 .039
502
Pearson Chi-SquareContinuity Correctiona
Likelihood RatioFisher's Exact TestLinear-by-LinearAssociationN of Valid Cases
Value dfAsymp. Sig.
(2-sided)Exact Sig.(2-sided)
Exact Sig.(1-sided)
Computed only for a 2x2 tablea.
0 cells (.0%) have expected count less than 5. The minimum expected count is 46.24.b.
Symmetric Measures
.092 .046 2.066 .039c
.092 .046 2.066 .039c
502
Pearson's RInterval by IntervalSpearman CorrelationOrdinal by Ordinal
N of Valid Cases
ValueAsymp.
Std. Errora Approx. Tb Approx. Sig.
Not assuming the null hypothesis.a.
Using the asymptotic standard error assuming the null hypothesis.b.
Based on normal approximation.c.
Appendix D: 2001 AU Image Survey Results by Education CategoryPage D - 16

17. I Learn About Alabama Universities From Television.(by Education Category)
Crosstab
% within Education by Category
43.5% 41.8% 43.0%56.5% 58.2% 57.0%
100.0% 100.0% 100.0%
NoYes
Learn about Stateuniversities from T.V.Total
Less thanBachelor's
Degree
Bachelor'sdegree or
Higher
Education by Category
Total
Chi-Square Tests
.131b 1 .718
.069 1 .793
.131 1 .718.766 .397
.130 1 .718
502
Pearson Chi-SquareContinuity Correctiona
Likelihood RatioFisher's Exact TestLinear-by-LinearAssociationN of Valid Cases
Value dfAsymp. Sig.
(2-sided)Exact Sig.(2-sided)
Exact Sig.(1-sided)
Computed only for a 2x2 tablea.
0 cells (.0%) have expected count less than 5. The minimum expected count is 62.82.b.
Symmetric Measures
.016 .045 .361 .718c
.016 .045 .361 .718c
502
Pearson's RInterval by IntervalSpearman CorrelationOrdinal by Ordinal
N of Valid Cases
ValueAsymp.
Std. Errora Approx. Tb Approx. Sig.
Not assuming the null hypothesis.a.
Using the asymptotic standard error assuming the null hypothesis.b.
Based on normal approximation.c.
Appendix D: 2001 AU Image Survey Results by Education CategoryPage D - 17

18. I Learn About Alabama Universities From the Internet. (by EducationCategory)
Crosstab
% within Education by Category
69.4% 56.2% 65.5%
30.6% 43.8% 34.5%100.0% 100.0% 100.0%
No
Yes
Learn about Stateuniversities fromthe InternetTotal
Less thanBachelor's
Degree
Bachelor'sdegree or
Higher
Education by Category
Total
Chi-Square Tests
8.009b 1 .0057.434 1 .0067.856 1 .005
.005 .003
7.993 1 .005
502
Pearson Chi-SquareContinuity Correctiona
Likelihood RatioFisher's Exact TestLinear-by-LinearAssociationN of Valid Cases
Value dfAsymp. Sig.
(2-sided)Exact Sig.(2-sided)
Exact Sig.(1-sided)
Computed only for a 2x2 tablea.
0 cells (.0%) have expected count less than 5. The minimum expected count is 50.31.b.
Symmetric Measures
.126 .046 2.847 .005c
.126 .046 2.847 .005c
502
Pearson's RInterval by IntervalSpearman CorrelationOrdinal by Ordinal
N of Valid Cases
ValueAsymp.
Std. Errora Approx. Tb Approx. Sig.
Not assuming the null hypothesis.a.
Using the asymptotic standard error assuming the null hypothesis.b.
Based on normal approximation.c.
Appendix D: 2001 AU Image Survey Results by Education CategoryPage D - 18
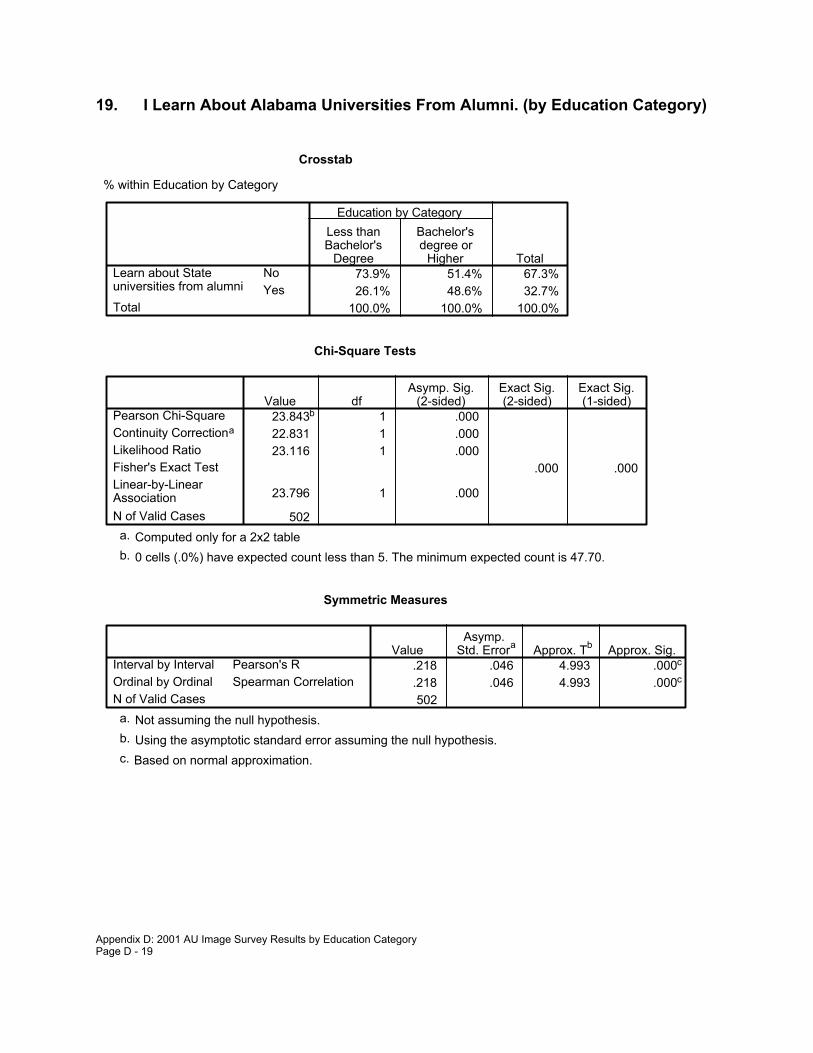
19. I Learn About Alabama Universities From Alumni. (by Education Category)
Crosstab
% within Education by Category
73.9% 51.4% 67.3%26.1% 48.6% 32.7%
100.0% 100.0% 100.0%
NoYes
Learn about Stateuniversities from alumniTotal
Less thanBachelor's
Degree
Bachelor'sdegree or
Higher
Education by Category
Total
Chi-Square Tests
23.843b 1 .00022.831 1 .00023.116 1 .000
.000 .000
23.796 1 .000
502
Pearson Chi-SquareContinuity Correctiona
Likelihood RatioFisher's Exact TestLinear-by-LinearAssociationN of Valid Cases
Value dfAsymp. Sig.
(2-sided)Exact Sig.(2-sided)
Exact Sig.(1-sided)
Computed only for a 2x2 tablea.
0 cells (.0%) have expected count less than 5. The minimum expected count is 47.70.b.
Symmetric Measures
.218 .046 4.993 .000c
.218 .046 4.993 .000c
502
Pearson's RInterval by IntervalSpearman CorrelationOrdinal by Ordinal
N of Valid Cases
ValueAsymp.
Std. Errora Approx. Tb Approx. Sig.
Not assuming the null hypothesis.a.
Using the asymptotic standard error assuming the null hypothesis.b.
Based on normal approximation.c.
Appendix D: 2001 AU Image Survey Results by Education CategoryPage D - 19
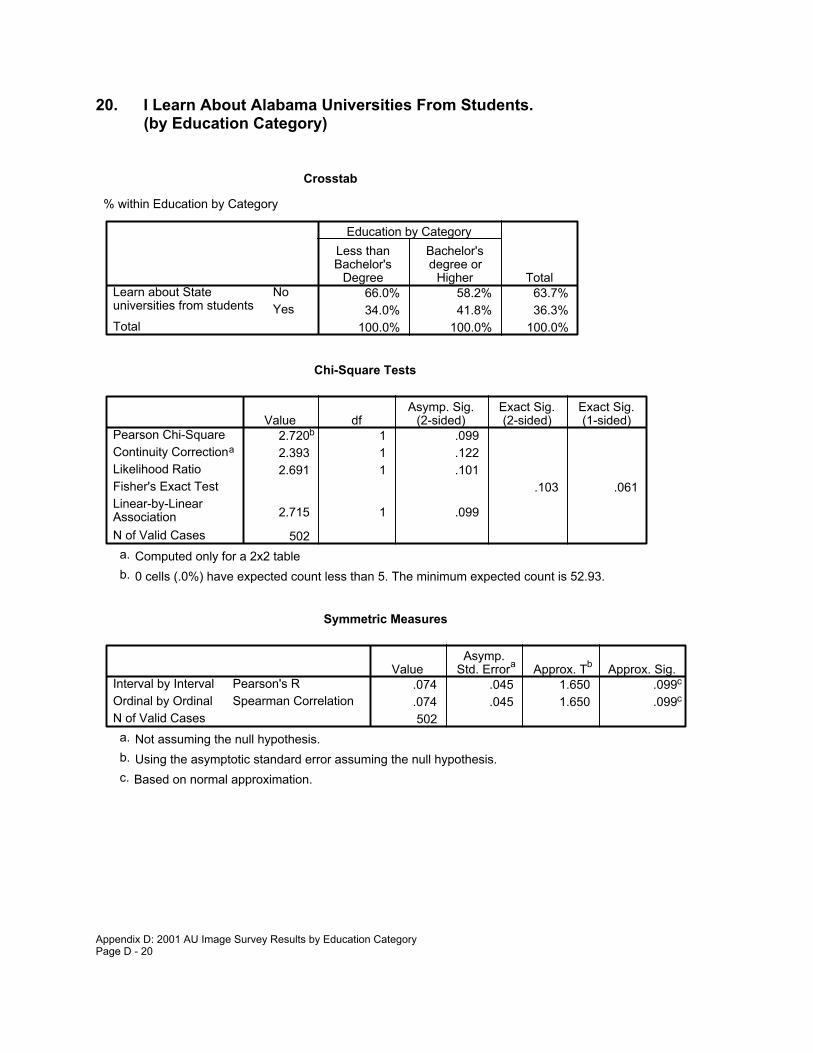
20. I Learn About Alabama Universities From Students.(by Education Category)
Crosstab
% within Education by Category
66.0% 58.2% 63.7%34.0% 41.8% 36.3%
100.0% 100.0% 100.0%
NoYes
Learn about Stateuniversities from studentsTotal
Less thanBachelor's
Degree
Bachelor'sdegree or
Higher
Education by Category
Total
Chi-Square Tests
2.720b 1 .0992.393 1 .1222.691 1 .101
.103 .061
2.715 1 .099
502
Pearson Chi-SquareContinuity Correctiona
Likelihood RatioFisher's Exact TestLinear-by-LinearAssociationN of Valid Cases
Value dfAsymp. Sig.
(2-sided)Exact Sig.(2-sided)
Exact Sig.(1-sided)
Computed only for a 2x2 tablea.
0 cells (.0%) have expected count less than 5. The minimum expected count is 52.93.b.
Symmetric Measures
.074 .045 1.650 .099c
.074 .045 1.650 .099c
502
Pearson's RInterval by IntervalSpearman CorrelationOrdinal by Ordinal
N of Valid Cases
ValueAsymp.
Std. Errora Approx. Tb Approx. Sig.
Not assuming the null hypothesis.a.
Using the asymptotic standard error assuming the null hypothesis.b.
Based on normal approximation.c.
Appendix D: 2001 AU Image Survey Results by Education CategoryPage D - 20

21. I Learn About Alabama Universities From My Co-workers.(by Education Category)
Crosstab
% within Education by Category
73.9% 62.3% 70.5%
26.1% 37.7% 29.5%100.0% 100.0% 100.0%
No
Yes
Learn about Stateuniversities fromco-workersTotal
Less thanBachelor's
Degree
Bachelor'sdegree or
Higher
Education by Category
Total
Chi-Square Tests
6.641b 1 .0106.097 1 .0146.473 1 .011
.013 .007
6.628 1 .010
502
Pearson Chi-SquareContinuity Correctiona
Likelihood RatioFisher's Exact TestLinear-by-LinearAssociationN of Valid Cases
Value dfAsymp. Sig.
(2-sided)Exact Sig.(2-sided)
Exact Sig.(1-sided)
Computed only for a 2x2 tablea.
0 cells (.0%) have expected count less than 5. The minimum expected count is 43.04.b.
Symmetric Measures
.115 .046 2.589 .010c
.115 .046 2.589 .010c
502
Pearson's RInterval by IntervalSpearman CorrelationOrdinal by Ordinal
N of Valid Cases
ValueAsymp.
Std. Errora Approx. Tb Approx. Sig.
Not assuming the null hypothesis.a.
Using the asymptotic standard error assuming the null hypothesis.b.
Based on normal approximation.c.
Appendix D: 2001 AU Image Survey Results by Education CategoryPage D - 21

22. I Learn About Alabama Universities From Other Sources.(by Education Category)
Crosstab
% within Education by Category
83.7% 85.6% 84.3%16.3% 14.4% 15.7%
100.0% 100.0% 100.0%
NoYes
Learn about Stateuniversities from otherTotal
Less thanBachelor's
Degree
Bachelor'sdegree or
Higher
Education by Category
Total
Chi-Square Tests
.284b 1 .594
.159 1 .690
.289 1 .591.686 .349
.284 1 .594
502
Pearson Chi-SquareContinuity Correctiona
Likelihood RatioFisher's Exact TestLinear-by-LinearAssociationN of Valid Cases
Value dfAsymp. Sig.
(2-sided)Exact Sig.(2-sided)
Exact Sig.(1-sided)
Computed only for a 2x2 tablea.
0 cells (.0%) have expected count less than 5. The minimum expected count is 22.98.b.
Symmetric Measures
-.024 .044 -.532 .595c
-.024 .044 -.532 .595c
502
Pearson's RInterval by IntervalSpearman CorrelationOrdinal by Ordinal
N of Valid Cases
ValueAsymp.
Std. Errora Approx. Tb Approx. Sig.
Not assuming the null hypothesis.a.
Using the asymptotic standard error assuming the null hypothesis.b.
Based on normal approximation.c.
Appendix D: 2001 AU Image Survey Results by Education CategoryPage D - 22
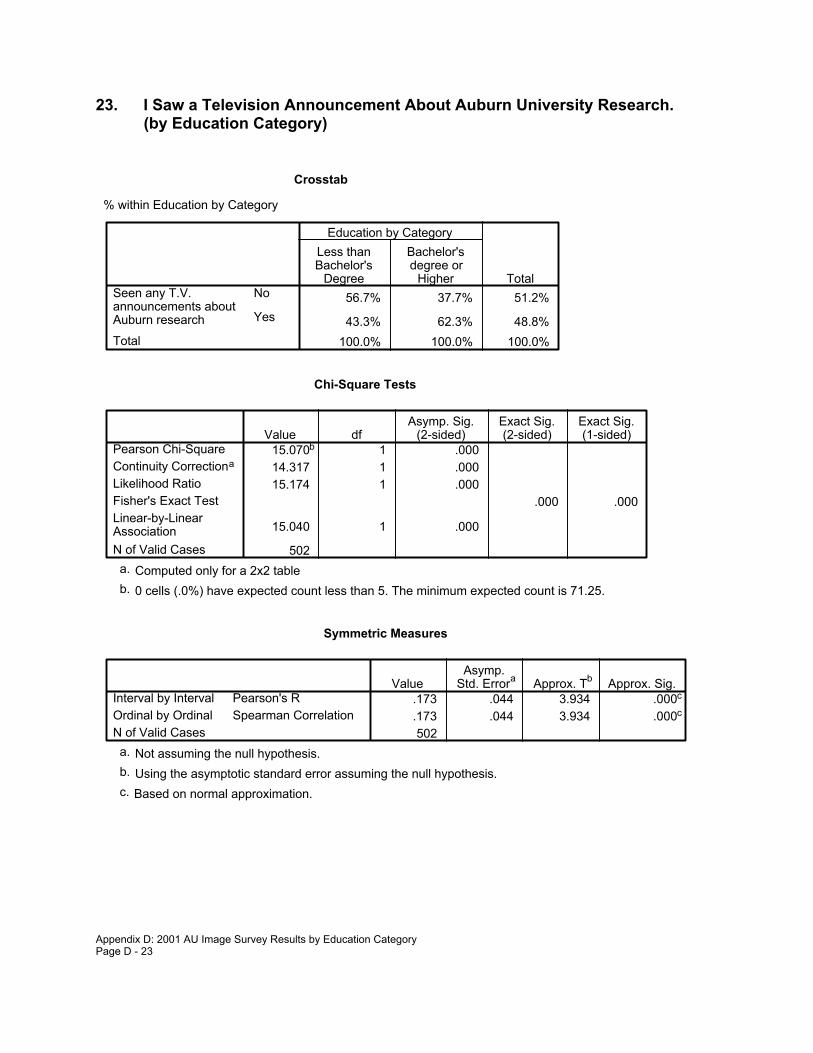
23. I Saw a Television Announcement About Auburn University Research.(by Education Category)
Crosstab
% within Education by Category
56.7% 37.7% 51.2%
43.3% 62.3% 48.8%100.0% 100.0% 100.0%
No
Yes
Seen any T.V.announcements aboutAuburn researchTotal
Less thanBachelor's
Degree
Bachelor'sdegree or
Higher
Education by Category
Total
Chi-Square Tests
15.070b 1 .00014.317 1 .00015.174 1 .000
.000 .000
15.040 1 .000
502
Pearson Chi-SquareContinuity Correctiona
Likelihood RatioFisher's Exact TestLinear-by-LinearAssociationN of Valid Cases
Value dfAsymp. Sig.
(2-sided)Exact Sig.(2-sided)
Exact Sig.(1-sided)
Computed only for a 2x2 tablea.
0 cells (.0%) have expected count less than 5. The minimum expected count is 71.25.b.
Symmetric Measures
.173 .044 3.934 .000c
.173 .044 3.934 .000c
502
Pearson's RInterval by IntervalSpearman CorrelationOrdinal by Ordinal
N of Valid Cases
ValueAsymp.
Std. Errora Approx. Tb Approx. Sig.
Not assuming the null hypothesis.a.
Using the asymptotic standard error assuming the null hypothesis.b.
Based on normal approximation.c.
Appendix D: 2001 AU Image Survey Results by Education CategoryPage D - 23

24. I Am Aware That Auburn University Developed A New Bulletproof Vest.(by Education Category)
Crosstab
% within Education by Category
77.5% 67.8% 74.7%22.5% 32.2% 25.3%
100.0% 100.0% 100.0%
NoYes
Aware Auburn developednew bulletproof vestTotal
Less thanBachelor's
Degree
Bachelor'sdegree or
Higher
Education by Category
Total
Chi-Square Tests
5.176b 1 .0234.674 1 .0315.026 1 .025
.031 .016
5.166 1 .023
502
Pearson Chi-SquareContinuity Correctiona
Likelihood RatioFisher's Exact TestLinear-by-LinearAssociationN of Valid Cases
Value dfAsymp. Sig.
(2-sided)Exact Sig.(2-sided)
Exact Sig.(1-sided)
Computed only for a 2x2 tablea.
0 cells (.0%) have expected count less than 5. The minimum expected count is 36.94.b.
Symmetric Measures
.102 .046 2.282 .023c
.102 .046 2.282 .023c
502
Pearson's RInterval by IntervalSpearman CorrelationOrdinal by Ordinal
N of Valid Cases
ValueAsymp.
Std. Errora Approx. Tb Approx. Sig.
Not assuming the null hypothesis.a.
Using the asymptotic standard error assuming the null hypothesis.b.
Based on normal approximation.c.
Appendix D: 2001 AU Image Survey Results by Education CategoryPage D - 24

25. The Bulletproof Vest Research is Significant. (by Education Category)
Crosstab
% within Education by Category
2.5% 4.3% 3.1%97.5% 95.7% 96.9%
100.0% 100.0% 100.0%
NoYes
Is the bulletproof vestresearch significantTotal
Less thanBachelor's
Degree
Bachelor'sdegree or
Higher
Education by Category
Total
Chi-Square Tests
.299b 1 .584
.000 1 .983
.289 1 .591.626 .473
.297 1 .586
127
Pearson Chi-SquareContinuity Correctiona
Likelihood RatioFisher's Exact TestLinear-by-LinearAssociationN of Valid Cases
Value dfAsymp. Sig.
(2-sided)Exact Sig.(2-sided)
Exact Sig.(1-sided)
Computed only for a 2x2 tablea.
2 cells (50.0%) have expected count less than 5. The minimum expected count is 1.48.b.
Symmetric Measures
-.049 .092 -.543 .588c
-.049 .092 -.543 .588c
127
Pearson's RInterval by IntervalSpearman CorrelationOrdinal by Ordinal
N of Valid Cases
ValueAsymp.
Std. Errora Approx. Tb Approx. Sig.
Not assuming the null hypothesis.a.
Using the asymptotic standard error assuming the null hypothesis.b.
Based on normal approximation.c.
Appendix D: 2001 AU Image Survey Results by Education CategoryPage D - 25

26. I Saw a Television Announcement About the Bulletproof Vest.(by Education Category)
Crosstab
% within Education by Category
53.8% 57.4% 55.1%46.3% 42.6% 44.9%
100.0% 100.0% 100.0%
NoYes
Seen T.V. announcementabout bulletproof vestTotal
Less thanBachelor's
Degree
Bachelor'sdegree or
Higher
Education by Category
Total
Chi-Square Tests
.164b 1 .686
.048 1 .826
.164 1 .686.715 .414
.162 1 .687
127
Pearson Chi-SquareContinuity Correctiona
Likelihood RatioFisher's Exact TestLinear-by-LinearAssociationN of Valid Cases
Value dfAsymp. Sig.
(2-sided)Exact Sig.(2-sided)
Exact Sig.(1-sided)
Computed only for a 2x2 tablea.
0 cells (.0%) have expected count less than 5. The minimum expected count is 21.09.b.
Symmetric Measures
-.036 .088 -.401 .689c
-.036 .088 -.401 .689c
127
Pearson's RInterval by IntervalSpearman CorrelationOrdinal by Ordinal
N of Valid Cases
ValueAsymp.
Std. Errora Approx. Tb Approx. Sig.
Not assuming the null hypothesis.a.
Using the asymptotic standard error assuming the null hypothesis.b.
Based on normal approximation.c.
Appendix D: 2001 AU Image Survey Results by Education CategoryPage D - 26

27. The Bulletproof Vest Announcement Should Be Continued.(by Education Category)
Crosstab
% within Education by Category
5.4% 10.0% 7.0%
94.6% 90.0% 93.0%100.0% 100.0% 100.0%
No
Yes
Should bulletproofvest announcementbe continuedTotal
Less thanBachelor's
Degree
Bachelor'sdegree or
Higher
Education by Category
Total
Chi-Square Tests
.420b 1 .517
.011 1 .917
.402 1 .526.607 .439
.413 1 .521
57
Pearson Chi-SquareContinuity Correctiona
Likelihood RatioFisher's Exact TestLinear-by-LinearAssociationN of Valid Cases
Value dfAsymp. Sig.
(2-sided)Exact Sig.(2-sided)
Exact Sig.(1-sided)
Computed only for a 2x2 tablea.
2 cells (50.0%) have expected count less than 5. The minimum expected count is 1.40.b.
Symmetric Measures
-.086 .139 -.639 .525c
-.086 .139 -.639 .525c
57
Pearson's RInterval by IntervalSpearman CorrelationOrdinal by Ordinal
N of Valid Cases
ValueAsymp.
Std. Errora Approx. Tb Approx. Sig.
Not assuming the null hypothesis.a.
Using the asymptotic standard error assuming the null hypothesis.b.
Based on normal approximation.c.
Appendix D: 2001 AU Image Survey Results by Education CategoryPage D - 27

28. I Am Aware That Auburn University Developed New Airbags.(by Education Category)
Crosstab
% within Education by Category
78.4% 77.4% 78.1%21.6% 22.6% 21.9%
100.0% 100.0% 100.0%
NoYes
Aware Auburndeveloped new airbagsTotal
Less thanBachelor's
Degree
Bachelor'sdegree or
Higher
Education by Category
Total
Chi-Square Tests
.057b 1 .811
.015 1 .904
.057 1 .811.813 .448
.057 1 .811
502
Pearson Chi-SquareContinuity Correctiona
Likelihood RatioFisher's Exact TestLinear-by-LinearAssociationN of Valid Cases
Value dfAsymp. Sig.
(2-sided)Exact Sig.(2-sided)
Exact Sig.(1-sided)
Computed only for a 2x2 tablea.
0 cells (.0%) have expected count less than 5. The minimum expected count is 31.99.b.
Symmetric Measures
.011 .045 .239 .811c
.011 .045 .239 .811c
502
Pearson's RInterval by IntervalSpearman CorrelationOrdinal by Ordinal
N of Valid Cases
ValueAsymp.
Std. Errora Approx. Tb Approx. Sig.
Not assuming the null hypothesis.a.
Using the asymptotic standard error assuming the null hypothesis.b.
Based on normal approximation.c.
Appendix D: 2001 AU Image Survey Results by Education CategoryPage D - 28

29. The Airbag Research is Significant. (by Education Category)
Crosstab
% within Education by Category
3.9% 3.0% 3.6%96.1% 97.0% 96.4%
100.0% 100.0% 100.0%
NoYes
Is the airbag researchsignificantTotal
Less thanBachelor's
Degree
Bachelor'sdegree or
Higher
Education by Category
Total
Chi-Square Tests
.049b 1 .824
.000 1 1.000
.051 1 .8211.000 .653
.049 1 .825
110
Pearson Chi-SquareContinuity Correctiona
Likelihood RatioFisher's Exact TestLinear-by-LinearAssociationN of Valid Cases
Value dfAsymp. Sig.
(2-sided)Exact Sig.(2-sided)
Exact Sig.(1-sided)
Computed only for a 2x2 tablea.
2 cells (50.0%) have expected count less than 5. The minimum expected count is 1.20.b.
Symmetric Measures
.021 .090 .220 .826c
.021 .090 .220 .826c
110
Pearson's RInterval by IntervalSpearman CorrelationOrdinal by Ordinal
N of Valid Cases
ValueAsymp.
Std. Errora Approx. Tb Approx. Sig.
Not assuming the null hypothesis.a.
Using the asymptotic standard error assuming the null hypothesis.b.
Based on normal approximation.c.
Appendix D: 2001 AU Image Survey Results by Education CategoryPage D - 29

30. I Saw the Television Announcement About Auburn University's AirbagResearch.
(by Education Category)
Crosstab
% within Education by Category
59.7% 51.5% 57.3%40.3% 48.5% 42.7%
100.0% 100.0% 100.0%
NoYes
Seen T.V. announcementabout airbagsTotal
Less thanBachelor's
Degree
Bachelor'sdegree or
Higher
Education by Category
Total
Chi-Square Tests
.639b 1 .424
.347 1 .556
.636 1 .425.529 .277
.633 1 .426
110
Pearson Chi-SquareContinuity Correctiona
Likelihood RatioFisher's Exact TestLinear-by-LinearAssociationN of Valid Cases
Value dfAsymp. Sig.
(2-sided)Exact Sig.(2-sided)
Exact Sig.(1-sided)
Computed only for a 2x2 tablea.
0 cells (.0%) have expected count less than 5. The minimum expected count is 14.10.b.
Symmetric Measures
.076 .096 .794 .429c
.076 .096 .794 .429c
110
Pearson's RInterval by IntervalSpearman CorrelationOrdinal by Ordinal
N of Valid Cases
ValueAsymp.
Std. Errora Approx. Tb Approx. Sig.
Not assuming the null hypothesis.a.
Using the asymptotic standard error assuming the null hypothesis.b.
Based on normal approximation.c.
Appendix D: 2001 AU Image Survey Results by Education CategoryPage D - 30

31. The Airbag Announcement Should Be Continued.(by Education Category)
Crosstab
% within Education by Category
6.5% 12.5% 8.5%
93.5% 87.5% 91.5%100.0% 100.0% 100.0%
No
Yes
Should airbagannouncementbe continuedTotal
Less thanBachelor's
Degree
Bachelor'sdegree or
Higher
Education by Category
Total
Chi-Square Tests
.496b 1 .481
.023 1 .879
.472 1 .492.597 .420
.485 1 .486
47
Pearson Chi-SquareContinuity Correctiona
Likelihood RatioFisher's Exact TestLinear-by-LinearAssociationN of Valid Cases
Value dfAsymp. Sig.
(2-sided)Exact Sig.(2-sided)
Exact Sig.(1-sided)
Computed only for a 2x2 tablea.
2 cells (50.0%) have expected count less than 5. The minimum expected count is 1.36.b.
Symmetric Measures
-.103 .155 -.693 .492c
-.103 .155 -.693 .492c
47
Pearson's RInterval by IntervalSpearman CorrelationOrdinal by Ordinal
N of Valid Cases
ValueAsymp.
Std. Errora Approx. Tb Approx. Sig.
Not assuming the null hypothesis.a.
Using the asymptotic standard error assuming the null hypothesis.b.
Based on normal approximation.c.
Appendix D: 2001 AU Image Survey Results by Education CategoryPage D - 31

32. I Am Aware That Auburn University Impacts the Economy.(by Education Category)
Crosstab
% within Education by Category
39.0% 26.7% 35.5%61.0% 73.3% 64.5%
100.0% 100.0% 100.0%
NoYes
Aware Auburn impactsthe economyTotal
Less thanBachelor's
Degree
Bachelor'sdegree or
Higher
Education by Category
Total
Chi-Square Tests
6.881b 1 .0096.353 1 .0127.076 1 .008
.010 .005
6.867 1 .009
502
Pearson Chi-SquareContinuity Correctiona
Likelihood RatioFisher's Exact TestLinear-by-LinearAssociationN of Valid Cases
Value dfAsymp. Sig.
(2-sided)Exact Sig.(2-sided)
Exact Sig.(1-sided)
Computed only for a 2x2 tablea.
0 cells (.0%) have expected count less than 5. The minimum expected count is 51.77.b.
Symmetric Measures
.117 .043 2.636 .009c
.117 .043 2.636 .009c
502
Pearson's RInterval by IntervalSpearman CorrelationOrdinal by Ordinal
N of Valid Cases
ValueAsymp.
Std. Errora Approx. Tb Approx. Sig.
Not assuming the null hypothesis.a.
Using the asymptotic standard error assuming the null hypothesis.b.
Based on normal approximation.c.
Appendix D: 2001 AU Image Survey Results by Education CategoryPage D - 32
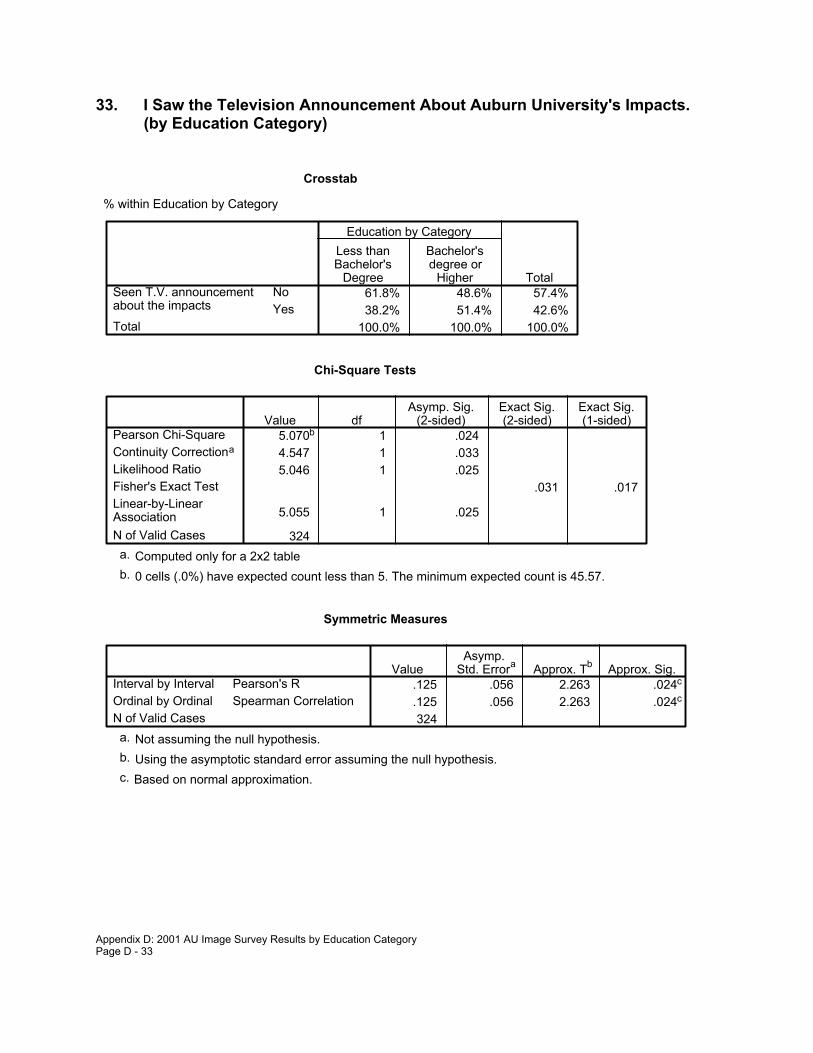
33. I Saw the Television Announcement About Auburn University's Impacts.(by Education Category)
Crosstab
% within Education by Category
61.8% 48.6% 57.4%38.2% 51.4% 42.6%
100.0% 100.0% 100.0%
NoYes
Seen T.V. announcementabout the impactsTotal
Less thanBachelor's
Degree
Bachelor'sdegree or
Higher
Education by Category
Total
Chi-Square Tests
5.070b 1 .0244.547 1 .0335.046 1 .025
.031 .017
5.055 1 .025
324
Pearson Chi-SquareContinuity Correctiona
Likelihood RatioFisher's Exact TestLinear-by-LinearAssociationN of Valid Cases
Value dfAsymp. Sig.
(2-sided)Exact Sig.(2-sided)
Exact Sig.(1-sided)
Computed only for a 2x2 tablea.
0 cells (.0%) have expected count less than 5. The minimum expected count is 45.57.b.
Symmetric Measures
.125 .056 2.263 .024c
.125 .056 2.263 .024c
324
Pearson's RInterval by IntervalSpearman CorrelationOrdinal by Ordinal
N of Valid Cases
ValueAsymp.
Std. Errora Approx. Tb Approx. Sig.
Not assuming the null hypothesis.a.
Using the asymptotic standard error assuming the null hypothesis.b.
Based on normal approximation.c.
Appendix D: 2001 AU Image Survey Results by Education CategoryPage D - 33

34. The Impact Announcement Should Be Continued.(by Education Category)
Crosstab
% within Education by Category
1.2% 3.6% 2.2%
98.8% 96.4% 97.8%100.0% 100.0% 100.0%
No
Yes
Should impactannouncementbe continuedTotal
Less thanBachelor's
Degree
Bachelor'sdegree or
Higher
Education by Category
Total
Chi-Square Tests
.920b 1 .338
.132 1 .717
.897 1 .343.563 .349
.913 1 .339
138
Pearson Chi-SquareContinuity Correctiona
Likelihood RatioFisher's Exact TestLinear-by-LinearAssociationN of Valid Cases
Value dfAsymp. Sig.
(2-sided)Exact Sig.(2-sided)
Exact Sig.(1-sided)
Computed only for a 2x2 tablea.
2 cells (50.0%) have expected count less than 5. The minimum expected count is 1.20.b.
Symmetric Measures
-.082 .085 -.955 .341c
-.082 .085 -.955 .341c
138
Pearson's RInterval by IntervalSpearman CorrelationOrdinal by Ordinal
N of Valid Cases
ValueAsymp.
Std. Errora Approx. Tb Approx. Sig.
Not assuming the null hypothesis.a.
Using the asymptotic standard error assuming the null hypothesis.b.
Based on normal approximation.c.
Appendix D: 2001 AU Image Survey Results by Education CategoryPage D - 34

35. I Am Aware That Auburn University Improves Highway Construction.(by Education Category)
Crosstab
% within Education by Category
64.3% 60.3% 63.1%35.7% 39.7% 36.9%
100.0% 100.0% 100.0%
NoYes
Aware Auburn improvedhighway constructionTotal
Less thanBachelor's
Degree
Bachelor'sdegree or
Higher
Education by Category
Total
Chi-Square Tests
.730b 1 .393
.567 1 .452
.726 1 .394.416 .225
.729 1 .393
502
Pearson Chi-SquareContinuity Correctiona
Likelihood RatioFisher's Exact TestLinear-by-LinearAssociationN of Valid Cases
Value dfAsymp. Sig.
(2-sided)Exact Sig.(2-sided)
Exact Sig.(1-sided)
Computed only for a 2x2 tablea.
0 cells (.0%) have expected count less than 5. The minimum expected count is 53.80.b.
Symmetric Measures
.038 .045 .854 .394c
.038 .045 .854 .394c
502
Pearson's RInterval by IntervalSpearman CorrelationOrdinal by Ordinal
N of Valid Cases
ValueAsymp.
Std. Errora Approx. Tb Approx. Sig.
Not assuming the null hypothesis.a.
Using the asymptotic standard error assuming the null hypothesis.b.
Based on normal approximation.c.
Appendix D: 2001 AU Image Survey Results by Education CategoryPage D - 35

36. The Highway Construction Research is Significant.(by Education Category)
Crosstab
% within Education by Category
3.1% 2.2%
96.9% 100.0% 97.8%100.0% 100.0% 100.0%
No
Yes
Is the highwayconstructionresearch significantTotal
Less thanBachelor's
Degree
Bachelor'sdegree or
Higher
Education by Category
Total
Chi-Square Tests
1.867b 1 .172.675 1 .411
3.050 1 .081.311 .219
1.857 1 .173
185
Pearson Chi-SquareContinuity Correctiona
Likelihood RatioFisher's Exact TestLinear-by-LinearAssociationN of Valid Cases
Value dfAsymp. Sig.
(2-sided)Exact Sig.(2-sided)
Exact Sig.(1-sided)
Computed only for a 2x2 tablea.
2 cells (50.0%) have expected count less than 5. The minimum expected count is 1.25.b.
Symmetric Measures
.100 .026 1.366 .174c
.100 .026 1.366 .174c
185
Pearson's RInterval by IntervalSpearman CorrelationOrdinal by Ordinal
N of Valid Cases
ValueAsymp.
Std. Errora Approx. Tb Approx. Sig.
Not assuming the null hypothesis.a.
Using the asymptotic standard error assuming the null hypothesis.b.
Based on normal approximation.c.
Appendix D: 2001 AU Image Survey Results by Education CategoryPage D - 36

37. I Am Aware That Auburn University Fisheries Sustains One of the World's Leading Food Sources. (by Education Category)
Crosstab
% within Education by Category
42.7% 32.2% 39.6%57.3% 67.8% 60.4%
100.0% 100.0% 100.0%
NoYes
Aware Auburn fisheriessustains food sourcesTotal
Less thanBachelor's
Degree
Bachelor'sdegree or
Higher
Education by Category
Total
Chi-Square Tests
4.775b 1 .0294.346 1 .0374.854 1 .028
.035 .018
4.766 1 .029
502
Pearson Chi-SquareContinuity Correctiona
Likelihood RatioFisher's Exact TestLinear-by-LinearAssociationN of Valid Cases
Value dfAsymp. Sig.
(2-sided)Exact Sig.(2-sided)
Exact Sig.(1-sided)
Computed only for a 2x2 tablea.
0 cells (.0%) have expected count less than 5. The minimum expected count is 57.88.b.
Symmetric Measures
.098 .043 2.191 .029c
.098 .043 2.191 .029c
502
Pearson's RInterval by IntervalSpearman CorrelationOrdinal by Ordinal
N of Valid Cases
ValueAsymp.
Std. Errora Approx. Tb Approx. Sig.
Not assuming the null hypothesis.a.
Using the asymptotic standard error assuming the null hypothesis.b.
Based on normal approximation.c.
Appendix D: 2001 AU Image Survey Results by Education CategoryPage D - 37

38. The Fisheries Research is Significant. (by Education Category)
Crosstab
% within Education by Category
2.0% 1.0% 1.7%98.0% 99.0% 98.3%
100.0% 100.0% 100.0%
NoYes
Is the fisheries researchsignificantTotal
Less thanBachelor's
Degree
Bachelor'sdegree or
Higher
Education by Category
Total
Chi-Square Tests
.371b 1 .542
.017 1 .898
.404 1 .5251.000 .473
.370 1 .543
303
Pearson Chi-SquareContinuity Correctiona
Likelihood RatioFisher's Exact TestLinear-by-LinearAssociationN of Valid Cases
Value dfAsymp. Sig.
(2-sided)Exact Sig.(2-sided)
Exact Sig.(1-sided)
Computed only for a 2x2 tablea.
2 cells (50.0%) have expected count less than 5. The minimum expected count is 1.63.b.
Symmetric Measures
.035 .050 .608 .544c
.035 .050 .608 .544c
303
Pearson's RInterval by IntervalSpearman CorrelationOrdinal by Ordinal
N of Valid Cases
ValueAsymp.
Std. Errora Approx. Tb Approx. Sig.
Not assuming the null hypothesis.a.
Using the asymptotic standard error assuming the null hypothesis.b.
Based on normal approximation.c.
Appendix D: 2001 AU Image Survey Results by Education CategoryPage D - 38

39. I Am Aware That Auburn University Architecture Students BuildLow-Income Housing in West Alabama. (by Education Category)
Crosstab
% within Education by Category
69.7% 62.3% 67.5%
30.3% 37.7% 32.5%100.0% 100.0% 100.0%
No
Yes
Aware architecturestudents build housingin West AlabamaTotal
Less thanBachelor's
Degree
Bachelor'sdegree or
Higher
Education by Category
Total
Chi-Square Tests
2.540b 1 .1112.216 1 .1372.504 1 .114
.116 .069
2.535 1 .111
502
Pearson Chi-SquareContinuity Correctiona
Likelihood RatioFisher's Exact TestLinear-by-LinearAssociationN of Valid Cases
Value dfAsymp. Sig.
(2-sided)Exact Sig.(2-sided)
Exact Sig.(1-sided)
Computed only for a 2x2 tablea.
0 cells (.0%) have expected count less than 5. The minimum expected count is 47.41.b.
Symmetric Measures
.071 .045 1.595 .111c
.071 .045 1.595 .111c
502
Pearson's RInterval by IntervalSpearman CorrelationOrdinal by Ordinal
N of Valid Cases
ValueAsymp.
Std. Errora Approx. Tb Approx. Sig.
Not assuming the null hypothesis.a.
Using the asymptotic standard error assuming the null hypothesis.b.
Based on normal approximation.c.
Appendix D: 2001 AU Image Survey Results by Education CategoryPage D - 39

40. The Low-Income Housing Program in West Alabama Should Be Continued. (by Education Category)
Crosstab
% within Education by Category
9.1% 3.1%100.0% 90.9% 96.9%100.0% 100.0% 100.0%
NoYes
Should housing programbe continuedTotal
Less thanBachelor's
Degree
Bachelor'sdegree or
Higher
Education by Category
Total
Chi-Square Tests
10.129b 1 .0017.302 1 .007
11.178 1 .001.004 .004
10.067 1 .002
163
Pearson Chi-SquareContinuity Correctiona
Likelihood RatioFisher's Exact TestLinear-by-LinearAssociationN of Valid Cases
Value dfAsymp. Sig.
(2-sided)Exact Sig.(2-sided)
Exact Sig.(1-sided)
Computed only for a 2x2 tablea.
2 cells (50.0%) have expected count less than 5. The minimum expected count is 1.69.b.
Symmetric Measures
-.249 .055 -3.266 .001c
-.249 .055 -3.266 .001c
163
Pearson's RInterval by IntervalSpearman CorrelationOrdinal by Ordinal
N of Valid Cases
ValueAsymp.
Std. Errora Approx. Tb Approx. Sig.
Not assuming the null hypothesis.a.
Using the asymptotic standard error assuming the null hypothesis.b.
Based on normal approximation.c.
Appendix D: 2001 AU Image Survey Results by Education CategoryPage D - 40

41. I Am Aware of Auburn University's Continuing Education Programs.(by Education Category)
Crosstab
% within Education by Category
32.6% 19.9% 28.9%
67.4% 80.1% 71.1%100.0% 100.0% 100.0%
No
Yes
Aware of Auburncontinuingeducation programsTotal
Less thanBachelor's
Degree
Bachelor'sdegree or
Higher
Education by Category
Total
Chi-Square Tests
8.157b 1 .0047.549 1 .0068.546 1 .003
.005 .003
8.141 1 .004
502
Pearson Chi-SquareContinuity Correctiona
Likelihood RatioFisher's Exact TestLinear-by-LinearAssociationN of Valid Cases
Value dfAsymp. Sig.
(2-sided)Exact Sig.(2-sided)
Exact Sig.(1-sided)
Computed only for a 2x2 tablea.
0 cells (.0%) have expected count less than 5. The minimum expected count is 42.17.b.
Symmetric Measures
.127 .041 2.874 .004c
.127 .041 2.874 .004c
502
Pearson's RInterval by IntervalSpearman CorrelationOrdinal by Ordinal
N of Valid Cases
ValueAsymp.
Std. Errora Approx. Tb Approx. Sig.
Not assuming the null hypothesis.a.
Using the asymptotic standard error assuming the null hypothesis.b.
Based on normal approximation.c.
Appendix D: 2001 AU Image Survey Results by Education CategoryPage D - 41

42. I Have Participated in a Continuing Education Program Offered byAuburn University. (by Education Category)
Crosstab
% within Education by Category
88.3% 79.5% 85.4%
11.7% 20.5% 14.6%100.0% 100.0% 100.0%
No
Yes
Have taken anycontinuingeducation programsTotal
Less thanBachelor's
Degree
Bachelor'sdegree or
Higher
Education by Category
Total
Chi-Square Tests
4.946b 1 .0264.261 1 .0394.735 1 .030
.037 .021
4.932 1 .026
357
Pearson Chi-SquareContinuity Correctiona
Likelihood RatioFisher's Exact TestLinear-by-LinearAssociationN of Valid Cases
Value dfAsymp. Sig.
(2-sided)Exact Sig.(2-sided)
Exact Sig.(1-sided)
Computed only for a 2x2 tablea.
0 cells (.0%) have expected count less than 5. The minimum expected count is 17.04.b.
Symmetric Measures
.118 .056 2.233 .026c
.118 .056 2.233 .026c
357
Pearson's RInterval by IntervalSpearman CorrelationOrdinal by Ordinal
N of Valid Cases
ValueAsymp.
Std. Errora Approx. Tb Approx. Sig.
Not assuming the null hypothesis.a.
Using the asymptotic standard error assuming the null hypothesis.b.
Based on normal approximation.c.
Appendix D: 2001 AU Image Survey Results by Education CategoryPage D - 42

43. I Am Aware of Auburn University's Partnerships With Local Schools.(by Education Category)
Crosstab
% within Education by Category
71.9% 53.4% 66.5%
28.1% 46.6% 33.5%100.0% 100.0% 100.0%
No
Yes
Aware of Auburnpartnerships withlocal schoolsTotal
Less thanBachelor's
Degree
Bachelor'sdegree or
Higher
Education by Category
Total
Chi-Square Tests
15.890b 1 .00015.070 1 .00015.481 1 .000
.000 .000
15.858 1 .000
502
Pearson Chi-SquareContinuity Correctiona
Likelihood RatioFisher's Exact TestLinear-by-LinearAssociationN of Valid Cases
Value dfAsymp. Sig.
(2-sided)Exact Sig.(2-sided)
Exact Sig.(1-sided)
Computed only for a 2x2 tablea.
0 cells (.0%) have expected count less than 5. The minimum expected count is 48.86.b.
Symmetric Measures
.178 .046 4.043 .000c
.178 .046 4.043 .000c
502
Pearson's RInterval by IntervalSpearman CorrelationOrdinal by Ordinal
N of Valid Cases
ValueAsymp.
Std. Errora Approx. Tb Approx. Sig.
Not assuming the null hypothesis.a.
Using the asymptotic standard error assuming the null hypothesis.b.
Based on normal approximation.c.
Appendix D: 2001 AU Image Survey Results by Education CategoryPage D - 43

44. The School Partnerships Should Be Continued. (by Education Category)
Crosstab
% within Education by Category
1.5% .6%100.0% 98.5% 99.4%100.0% 100.0% 100.0%
NoYes
Should partnershipsbe continuedTotal
Less thanBachelor's
Degree
Bachelor'sdegree or
Higher
Education by Category
Total
Chi-Square Tests
1.479b 1 .224.038 1 .846
1.818 1 .178.405 .405
1.471 1 .225
168
Pearson Chi-SquareContinuity Correctiona
Likelihood RatioFisher's Exact TestLinear-by-LinearAssociationN of Valid Cases
Value dfAsymp. Sig.
(2-sided)Exact Sig.(2-sided)
Exact Sig.(1-sided)
Computed only for a 2x2 tablea.
2 cells (50.0%) have expected count less than 5. The minimum expected count is .40.b.
Symmetric Measures
-.094 .047 -1.214 .226c
-.094 .047 -1.214 .226c
168
Pearson's RInterval by IntervalSpearman CorrelationOrdinal by Ordinal
N of Valid Cases
ValueAsymp.
Std. Errora Approx. Tb Approx. Sig.
Not assuming the null hypothesis.a.
Using the asymptotic standard error assuming the null hypothesis.b.
Based on normal approximation.c.
Appendix D: 2001 AU Image Survey Results by Education CategoryPage D - 44

45. My Local School District Would Benefit From a Partnership.(by Education Category)
Crosstab
% within Education by Category
15.2% 8.2% 13.1%
84.8% 91.8% 86.9%100.0% 100.0% 100.0%
No
Yes
Would local schooldistrict benefit frompartnershipTotal
Less thanBachelor's
Degree
Bachelor'sdegree or
Higher
Education by Category
Total
Chi-Square Tests
4.379b 1 .0363.791 1 .0524.739 1 .029
.041 .023
4.370 1 .037
502
Pearson Chi-SquareContinuity Correctiona
Likelihood RatioFisher's Exact TestLinear-by-LinearAssociationN of Valid Cases
Value dfAsymp. Sig.
(2-sided)Exact Sig.(2-sided)
Exact Sig.(1-sided)
Computed only for a 2x2 tablea.
0 cells (.0%) have expected count less than 5. The minimum expected count is 19.20.b.
Symmetric Measures
.093 .039 2.098 .036c
.093 .039 2.098 .036c
502
Pearson's RInterval by IntervalSpearman CorrelationOrdinal by Ordinal
N of Valid Cases
ValueAsymp.
Std. Errora Approx. Tb Approx. Sig.
Not assuming the null hypothesis.a.
Using the asymptotic standard error assuming the null hypothesis.b.
Based on normal approximation.c.
Appendix D: 2001 AU Image Survey Results by Education CategoryPage D - 45

46. I Am Familiar With Auburn University's Cooperative Extension System.(by Education Category)
Crosstab
% within Education by Category
53.7% 28.8% 46.4%46.3% 71.2% 53.6%
100.0% 100.0% 100.0%
NoYes
Familiar with CooperativeExtension SystemTotal
Less thanBachelor's
Degree
Bachelor'sdegree or
Higher
Education by Category
Total
Chi-Square Tests
25.779b 1 .00024.788 1 .00026.500 1 .000
.000 .000
25.727 1 .000
502
Pearson Chi-SquareContinuity Correctiona
Likelihood RatioFisher's Exact TestLinear-by-LinearAssociationN of Valid Cases
Value dfAsymp. Sig.
(2-sided)Exact Sig.(2-sided)
Exact Sig.(1-sided)
Computed only for a 2x2 tablea.
0 cells (.0%) have expected count less than 5. The minimum expected count is 67.76.b.
Symmetric Measures
.227 .042 5.202 .000c
.227 .042 5.202 .000c
502
Pearson's RInterval by IntervalSpearman CorrelationOrdinal by Ordinal
N of Valid Cases
ValueAsymp.
Std. Errora Approx. Tb Approx. Sig.
Not assuming the null hypothesis.a.
Using the asymptotic standard error assuming the null hypothesis.b.
Based on normal approximation.c.
Appendix D: 2001 AU Image Survey Results by Education CategoryPage D - 46

47. I Have Used Services Provided by the Auburn University ExtensionSystem. (by Education Category)
Crosstab
% within Education by Category
57.0% 46.2% 52.8%43.0% 53.8% 47.2%
100.0% 100.0% 100.0%
NoYes
Used any services fromExtension SystemTotal
Less thanBachelor's
Degree
Bachelor'sdegree or
Higher
Education by Category
Total
Chi-Square Tests
2.994b 1 .0842.576 1 .1082.996 1 .083
.103 .054
2.983 1 .084
269
Pearson Chi-SquareContinuity Correctiona
Likelihood RatioFisher's Exact TestLinear-by-LinearAssociationN of Valid Cases
Value dfAsymp. Sig.
(2-sided)Exact Sig.(2-sided)
Exact Sig.(1-sided)
Computed only for a 2x2 tablea.
0 cells (.0%) have expected count less than 5. The minimum expected count is 49.10.b.
Symmetric Measures
.106 .061 1.734 .084c
.106 .061 1.734 .084c
269
Pearson's RInterval by IntervalSpearman CorrelationOrdinal by Ordinal
N of Valid Cases
ValueAsymp.
Std. Errora Approx. Tb Approx. Sig.
Not assuming the null hypothesis.a.
Using the asymptotic standard error assuming the null hypothesis.b.
Based on normal approximation.c.
Appendix D: 2001 AU Image Survey Results by Education CategoryPage D - 47

48. The Cooperative Extension Programs Are Beneficial.(by Education Category)
Crosstab
% within Education by Category
2.8% 1.6%97.2% 100.0% 98.4%
100.0% 100.0% 100.0%
NoYes
Are Extension programsbeneficialTotal
Less thanBachelor's
Degree
Bachelor'sdegree or
Higher
Education by Category
Total
Chi-Square Tests
1.603b 1 .206.301 1 .584
2.351 1 .125.503 .311
1.590 1 .207
127
Pearson Chi-SquareContinuity Correctiona
Likelihood RatioFisher's Exact TestLinear-by-LinearAssociationN of Valid Cases
Value dfAsymp. Sig.
(2-sided)Exact Sig.(2-sided)
Exact Sig.(1-sided)
Computed only for a 2x2 tablea.
2 cells (50.0%) have expected count less than 5. The minimum expected count is .88.b.
Symmetric Measures
.112 .040 1.264 .209c
.112 .040 1.264 .209c
127
Pearson's RInterval by IntervalSpearman CorrelationOrdinal by Ordinal
N of Valid Cases
ValueAsymp.
Std. Errora Approx. Tb Approx. Sig.
Not assuming the null hypothesis.a.
Using the asymptotic standard error assuming the null hypothesis.b.
Based on normal approximation.c.
Appendix D: 2001 AU Image Survey Results by Education CategoryPage D - 48

49. Auburn University Should Offer More Distance Learning Programs.(by Education Category)
Crosstab
% within Education by Category
11.5% 11.6% 11.6%88.5% 88.4% 88.4%
100.0% 100.0% 100.0%
NoYes
Should Auburn offermore distance learningTotal
Less thanBachelor's
Degree
Bachelor'sdegree or
Higher
Education by Category
Total
Chi-Square Tests
.002b 1 .968
.000 1 1.000
.002 1 .9681.000 .539
.002 1 .968
502
Pearson Chi-SquareContinuity Correctiona
Likelihood RatioFisher's Exact TestLinear-by-LinearAssociationN of Valid Cases
Value dfAsymp. Sig.
(2-sided)Exact Sig.(2-sided)
Exact Sig.(1-sided)
Computed only for a 2x2 tablea.
0 cells (.0%) have expected count less than 5. The minimum expected count is 16.87.b.
Symmetric Measures
-.002 .045 -.040 .968c
-.002 .045 -.040 .968c
502
Pearson's RInterval by IntervalSpearman CorrelationOrdinal by Ordinal
N of Valid Cases
ValueAsymp.
Std. Errora Approx. Tb Approx. Sig.
Not assuming the null hypothesis.a.
Using the asymptotic standard error assuming the null hypothesis.b.
Based on normal approximation.c.
Appendix D: 2001 AU Image Survey Results by Education CategoryPage D - 49
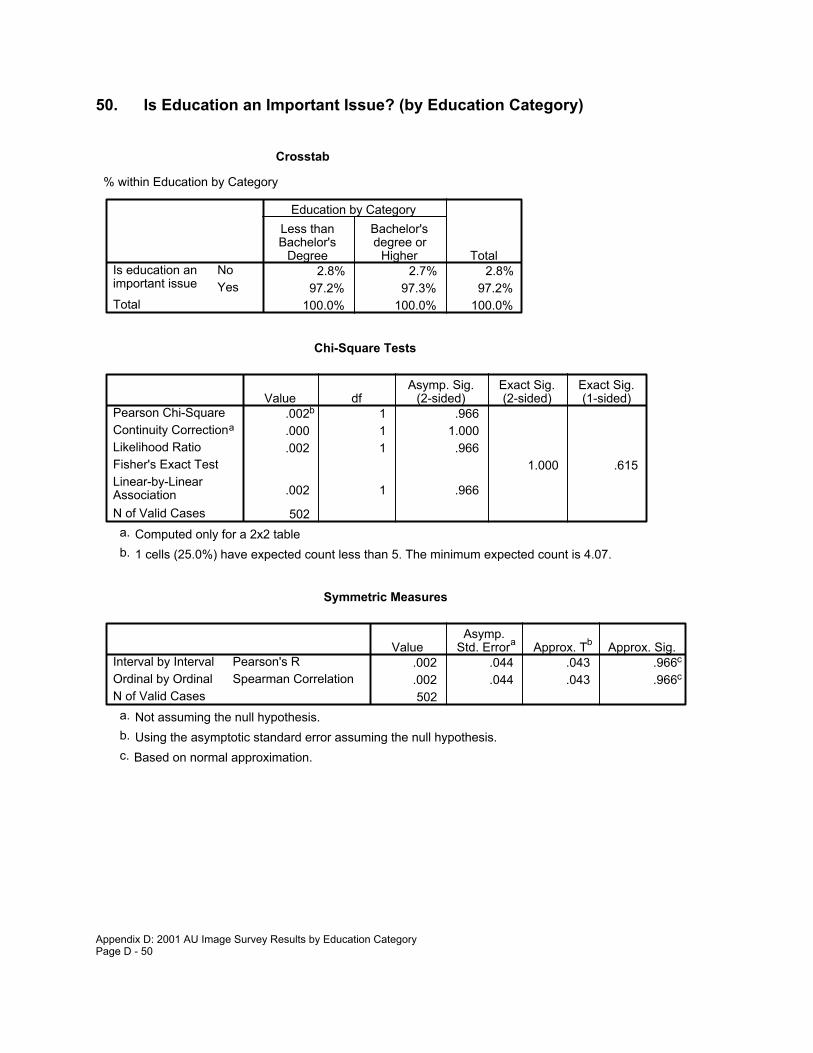
50. Is Education an Important Issue? (by Education Category)
Crosstab
% within Education by Category
2.8% 2.7% 2.8%97.2% 97.3% 97.2%
100.0% 100.0% 100.0%
NoYes
Is education animportant issueTotal
Less thanBachelor's
Degree
Bachelor'sdegree or
Higher
Education by Category
Total
Chi-Square Tests
.002b 1 .966
.000 1 1.000
.002 1 .9661.000 .615
.002 1 .966
502
Pearson Chi-SquareContinuity Correctiona
Likelihood RatioFisher's Exact TestLinear-by-LinearAssociationN of Valid Cases
Value dfAsymp. Sig.
(2-sided)Exact Sig.(2-sided)
Exact Sig.(1-sided)
Computed only for a 2x2 tablea.
1 cells (25.0%) have expected count less than 5. The minimum expected count is 4.07.b.
Symmetric Measures
.002 .044 .043 .966c
.002 .044 .043 .966c
502
Pearson's RInterval by IntervalSpearman CorrelationOrdinal by Ordinal
N of Valid Cases
ValueAsymp.
Std. Errora Approx. Tb Approx. Sig.
Not assuming the null hypothesis.a.
Using the asymptotic standard error assuming the null hypothesis.b.
Based on normal approximation.c.
Appendix D: 2001 AU Image Survey Results by Education CategoryPage D - 50

51. Is Community and Economic Development an Important Issue?(by Education Category)
Crosstab
% within Education by Category
4.8% 6.2% 5.2%
95.2% 93.8% 94.8%100.0% 100.0% 100.0%
No
Yes
Is community andeconomic developmentan important issueTotal
Less thanBachelor's
Degree
Bachelor'sdegree or
Higher
Education by Category
Total
Chi-Square Tests
.407b 1 .524
.173 1 .677
.394 1 .530.512 .331
.406 1 .524
502
Pearson Chi-SquareContinuity Correctiona
Likelihood RatioFisher's Exact TestLinear-by-LinearAssociationN of Valid Cases
Value dfAsymp. Sig.
(2-sided)Exact Sig.(2-sided)
Exact Sig.(1-sided)
Computed only for a 2x2 tablea.
0 cells (.0%) have expected count less than 5. The minimum expected count is 7.56.b.
Symmetric Measures
-.028 .047 -.637 .525c
-.028 .047 -.637 .525c
502
Pearson's RInterval by IntervalSpearman CorrelationOrdinal by Ordinal
N of Valid Cases
ValueAsymp.
Std. Errora Approx. Tb Approx. Sig.
Not assuming the null hypothesis.a.
Using the asymptotic standard error assuming the null hypothesis.b.
Based on normal approximation.c.
Appendix D: 2001 AU Image Survey Results by Education CategoryPage D - 51

52. Is Agriculture an Important Issue? (by Education Category)
Crosstab
% within Education by Category
9.6% 11.6% 10.2%90.4% 88.4% 89.8%
100.0% 100.0% 100.0%
NoYes
Is agriculture animportant issueTotal
Less thanBachelor's
Degree
Bachelor'sdegree or
Higher
Education by Category
Total
Chi-Square Tests
.497b 1 .481
.294 1 .588
.486 1 .486.516 .290
.496 1 .481
502
Pearson Chi-SquareContinuity Correctiona
Likelihood RatioFisher's Exact TestLinear-by-LinearAssociationN of Valid Cases
Value dfAsymp. Sig.
(2-sided)Exact Sig.(2-sided)
Exact Sig.(1-sided)
Computed only for a 2x2 tablea.
0 cells (.0%) have expected count less than 5. The minimum expected count is 14.83.b.
Symmetric Measures
-.031 .046 -.704 .482c
-.031 .046 -.704 .482c
502
Pearson's RInterval by IntervalSpearman CorrelationOrdinal by Ordinal
N of Valid Cases
ValueAsymp.
Std. Errora Approx. Tb Approx. Sig.
Not assuming the null hypothesis.a.
Using the asymptotic standard error assuming the null hypothesis.b.
Based on normal approximation.c.
Appendix D: 2001 AU Image Survey Results by Education CategoryPage D - 52

53. Are Family and Youth Important Issues? (by Education Category)
Crosstab
% within Education by Category
5.9% 6.8% 6.2%94.1% 93.2% 93.8%
100.0% 100.0% 100.0%
NoYes
Is family and youth andimportant issueTotal
Less thanBachelor's
Degree
Bachelor'sdegree or
Higher
Education by Category
Total
Chi-Square Tests
.161b 1 .688
.039 1 .843
.158 1 .691.686 .412
.161 1 .688
502
Pearson Chi-SquareContinuity Correctiona
Likelihood RatioFisher's Exact TestLinear-by-LinearAssociationN of Valid Cases
Value dfAsymp. Sig.
(2-sided)Exact Sig.(2-sided)
Exact Sig.(1-sided)
Computed only for a 2x2 tablea.
0 cells (.0%) have expected count less than 5. The minimum expected count is 9.02.b.
Symmetric Measures
-.018 .046 -.401 .689c
-.018 .046 -.401 .689c
502
Pearson's RInterval by IntervalSpearman CorrelationOrdinal by Ordinal
N of Valid Cases
ValueAsymp.
Std. Errora Approx. Tb Approx. Sig.
Not assuming the null hypothesis.a.
Using the asymptotic standard error assuming the null hypothesis.b.
Based on normal approximation.c.
Appendix D: 2001 AU Image Survey Results by Education CategoryPage D - 53

54. Is the Environment an Important Issue? (by Education Category)
Crosstab
% within Education by Category
7.3% 8.2% 7.6%92.7% 91.8% 92.4%
100.0% 100.0% 100.0%
NoYes
Is the environmentan important issueTotal
Less thanBachelor's
Degree
Bachelor'sdegree or
Higher
Education by Category
Total
Chi-Square Tests
.124b 1 .725
.028 1 .868
.122 1 .727.713 .426
.124 1 .725
502
Pearson Chi-SquareContinuity Correctiona
Likelihood RatioFisher's Exact TestLinear-by-LinearAssociationN of Valid Cases
Value dfAsymp. Sig.
(2-sided)Exact Sig.(2-sided)
Exact Sig.(1-sided)
Computed only for a 2x2 tablea.
0 cells (.0%) have expected count less than 5. The minimum expected count is 11.05.b.
Symmetric Measures
-.016 .046 -.352 .725c
-.016 .046 -.352 .725c
502
Pearson's RInterval by IntervalSpearman CorrelationOrdinal by Ordinal
N of Valid Cases
ValueAsymp.
Std. Errora Approx. Tb Approx. Sig.
Not assuming the null hypothesis.a.
Using the asymptotic standard error assuming the null hypothesis.b.
Based on normal approximation.c.
Appendix D: 2001 AU Image Survey Results by Education CategoryPage D - 54

55. How Significant is It to Have Outreach Programs in Your Community?(by Education Category)
Crosstab
% within Education by Category
5.1% 2.1% 4.2%4.8% 4.8% 4.8%6.2% 4.8% 5.8%2.2% 1.4% 2.0%
30.9% 39.0% 33.3%50.8% 47.9% 50.0%
100.0% 100.0% 100.0%
No opinionVery insignificantInsignificantNeutralSignificantVery significant
How significantis it to haveoutreachprograms incommunity
Total
Less thanBachelor's
Degree
Bachelor'sdegree or
Higher
Education by Category
Total
Chi-Square Tests
5.211a 5 .3915.520 5 .356
.902 1 .342
502
Pearson Chi-SquareLikelihood RatioLinear-by-LinearAssociationN of Valid Cases
Value dfAsymp. Sig.
(2-sided)
1 cells (8.3%) have expected count less than 5. The minimum expected count is 2.91.a.
Symmetric Measures
.042 .041 .950 .343c
.003 .043 .069 .945c
502
Pearson's RInterval by IntervalSpearman CorrelationOrdinal by Ordinal
N of Valid Cases
ValueAsymp.
Std. Errora Approx. Tb Approx. Sig.
Not assuming the null hypothesis.a.
Using the asymptotic standard error assuming the null hypothesis.b.
Based on normal approximation.c.
Appendix D: 2001 AU Image Survey Results by Education CategoryPage D - 55

56. How Significant is it to Have Access to Information Over the Internet?(by Education Category)
* E
Crosstab
% within Education by Category
7.9% 2.1% 6.2%10.7% 9.6% 10.4%16.0% 11.6% 14.7%
1.4% 2.1% 1.6%20.8% 24.7% 21.9%43.3% 50.0% 45.2%
100.0% 100.0% 100.0%
No opinionVery insignificantInsignificantNeutralSignificantVery significant
How Significantis it to accessinformation overthe Internet
Total
Less thanBachelor's
Degree
Bachelor'sdegree or
Higher
Education by Category
Total
Chi-Square Tests
9.141a 5 .10410.440 5 .064
6.291 1 .012
502
Pearson Chi-SquareLikelihood RatioLinear-by-LinearAssociationN of Valid Cases
Value dfAsymp. Sig.
(2-sided)
1 cells (8.3%) have expected count less than 5. The minimum expected count is 2.33.a.
Symmetric Measures
.112 .041 2.522 .012c
.096 .043 2.161 .031c
502
Pearson's RInterval by IntervalSpearman CorrelationOrdinal by Ordinal
N of Valid Cases
ValueAsymp.
Std. Errora Approx. Tb Approx. Sig.
Not assuming the null hypothesis.a.
Using the asymptotic standard error assuming the null hypothesis.b.
Based on normal approximation.c.
Appendix D: 2001 AU Image Survey Results by Education CategoryPage D - 56

Appendix E: 2001 AU Image Survey ResponsesControlled by Income Level Category
1. How Familiar Are You With Auburn University? (by Income Category)
Crosstab
% within Income by Category
17.0% 7.5% 12.0%34.9% 16.7% 25.5%
1.9% .4% 1.1%29.2% 42.1% 35.9%17.0% 33.3% 25.5%
100.0% 100.0% 100.0%
Not at all familiarNot very familiarNeutralFamiliarVery familiar
How familiarare you withAuburn
Total
Under$40,000 Over $40,000
Income by Category
Total
Chi-Square Tests
41.258a 4 .00042.070 4 .000
38.102 1 .000
440
Pearson Chi-SquareLikelihood RatioLinear-by-LinearAssociationN of Valid Cases
Value dfAsymp. Sig.
(2-sided)
2 cells (20.0%) have expected count less than 5. The minimum expected count is 2.41.a.
Symmetric Measures
.295 .045 6.452 .000c
.287 .045 6.275 .000c
440
Pearson's RInterval by IntervalSpearman CorrelationOrdinal by Ordinal
N of Valid Cases
ValueAsymp.
Std. Errora Approx. Tb Approx. Sig.
Not assuming the null hypothesis.a.
Using the asymptotic standard error assuming the null hypothesis.b.
Based on normal approximation.c.
Appendix E: 2001 AU Image Survey Results by Income CategoryPage E - 1
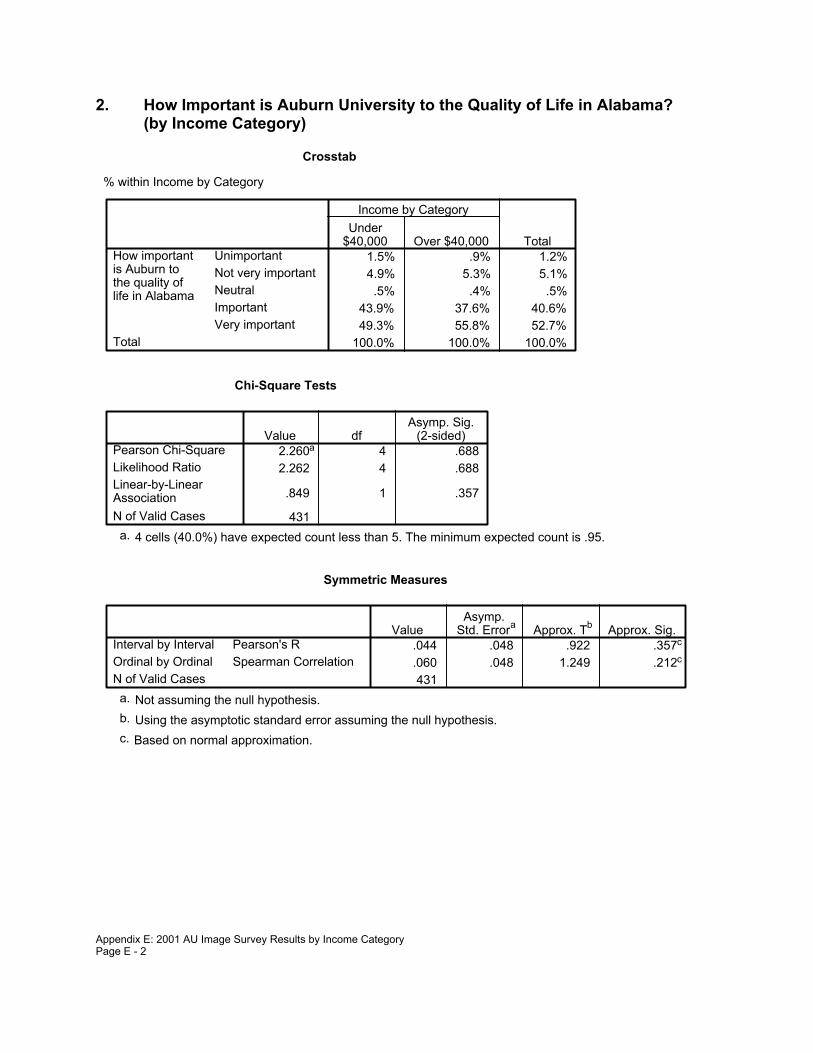
2. How Important is Auburn University to the Quality of Life in Alabama?(by Income Category)
Crosstab
% within Income by Category
1.5% .9% 1.2%4.9% 5.3% 5.1%.5% .4% .5%
43.9% 37.6% 40.6%49.3% 55.8% 52.7%
100.0% 100.0% 100.0%
UnimportantNot very importantNeutralImportantVery important
How importantis Auburn tothe quality oflife in Alabama
Total
Under$40,000 Over $40,000
Income by Category
Total
Chi-Square Tests
2.260a 4 .6882.262 4 .688
.849 1 .357
431
Pearson Chi-SquareLikelihood RatioLinear-by-LinearAssociationN of Valid Cases
Value dfAsymp. Sig.
(2-sided)
4 cells (40.0%) have expected count less than 5. The minimum expected count is .95.a.
Symmetric Measures
.044 .048 .922 .357c
.060 .048 1.249 .212c
431
Pearson's RInterval by IntervalSpearman CorrelationOrdinal by Ordinal
N of Valid Cases
ValueAsymp.
Std. Errora Approx. Tb Approx. Sig.
Not assuming the null hypothesis.a.
Using the asymptotic standard error assuming the null hypothesis.b.
Based on normal approximation.c.
Appendix E: 2001 AU Image Survey Results by Income CategoryPage E - 2

3. How Important is Auburn University to the Quality of Life in Your LocalCommunity (by Income Category)
Crosstab
% within Income by Category
3.5% 2.2% 2.8%22.6% 15.2% 18.7%
3.5% 1.7%38.2% 45.3% 41.9%32.2% 37.2% 34.8%
100.0% 100.0% 100.0%
UnimportantNot very importantNeutralImportantVery important
How important isAuburn to thequality of life inlocal community
Total
Under$40,000 Over $40,000
Income by Category
Total
Chi-Square Tests
13.531a 4 .00916.215 4 .003
5.708 1 .017
422
Pearson Chi-SquareLikelihood RatioLinear-by-LinearAssociationN of Valid Cases
Value dfAsymp. Sig.
(2-sided)
2 cells (20.0%) have expected count less than 5. The minimum expected count is 3.30.a.
Symmetric Measures
.116 .048 2.403 .017c
.104 .049 2.134 .033c
422
Pearson's RInterval by IntervalSpearman CorrelationOrdinal by Ordinal
N of Valid Cases
ValueAsymp.
Std. Errora Approx. Tb Approx. Sig.
Not assuming the null hypothesis.a.
Using the asymptotic standard error assuming the null hypothesis.b.
Based on normal approximation.c.
Appendix E: 2001 AU Image Survey Results by Income CategoryPage E - 3

4. How Important is Auburn University Research for Jobs in Your LocalCommunity? (by Income Category)
Crosstab
% within Income by Category
2.6% 1.0% 1.8%10.1% 13.0% 11.6%
2.6% 1.3%37.0% 43.3% 40.3%47.6% 42.8% 45.1%
100.0% 100.0% 100.0%
UnimportantNot very importantNeutralImportantVery important
How important isAuburn researchfor jobs in localcommunity
Total
Under$40,000 Over $40,000
Income by Category
Total
Chi-Square Tests
9.295a 4 .05411.261 4 .024
.083 1 .773
397
Pearson Chi-SquareLikelihood RatioLinear-by-LinearAssociationN of Valid Cases
Value dfAsymp. Sig.
(2-sided)
4 cells (40.0%) have expected count less than 5. The minimum expected count is 2.38.a.
Symmetric Measures
-.014 .050 -.288 .774c
-.033 .050 -.652 .515c
397
Pearson's RInterval by IntervalSpearman CorrelationOrdinal by Ordinal
N of Valid Cases
ValueAsymp.
Std. Errora Approx. Tb Approx. Sig.
Not assuming the null hypothesis.a.
Using the asymptotic standard error assuming the null hypothesis.b.
Based on normal approximation.c.
Appendix E: 2001 AU Image Survey Results by Income CategoryPage E - 4

5. Have You or Your Family Benefited from Auburn University?(by Income Category)
Crosstab
% within Income by Category
75.6% 62.7% 68.9%24.4% 37.3% 31.1%
100.0% 100.0% 100.0%
NoYes
Have you or your familybenefited from AuburnTotal
Under$40,000 Over $40,000
Income by Category
Total
Chi-Square Tests
8.514b 1 .0047.924 1 .0058.584 1 .003
.004 .002
8.495 1 .004
441
Pearson Chi-SquareContinuity Correctiona
Likelihood RatioFisher's Exact TestLinear-by-LinearAssociationN of Valid Cases
Value dfAsymp. Sig.
(2-sided)Exact Sig.(2-sided)
Exact Sig.(1-sided)
Computed only for a 2x2 tablea.
0 cells (.0%) have expected count less than 5. The minimum expected count is 66.17.b.
Symmetric Measures
.139 .047 2.940 .003c
.139 .047 2.940 .003c
441
Pearson's RInterval by IntervalSpearman CorrelationOrdinal by Ordinal
N of Valid Cases
ValueAsymp.
Std. Errora Approx. Tb Approx. Sig.
Not assuming the null hypothesis.a.
Using the asymptotic standard error assuming the null hypothesis.b.
Based on normal approximation.c.
Appendix E: 2001 AU Image Survey Results by Income CategoryPage E - 5
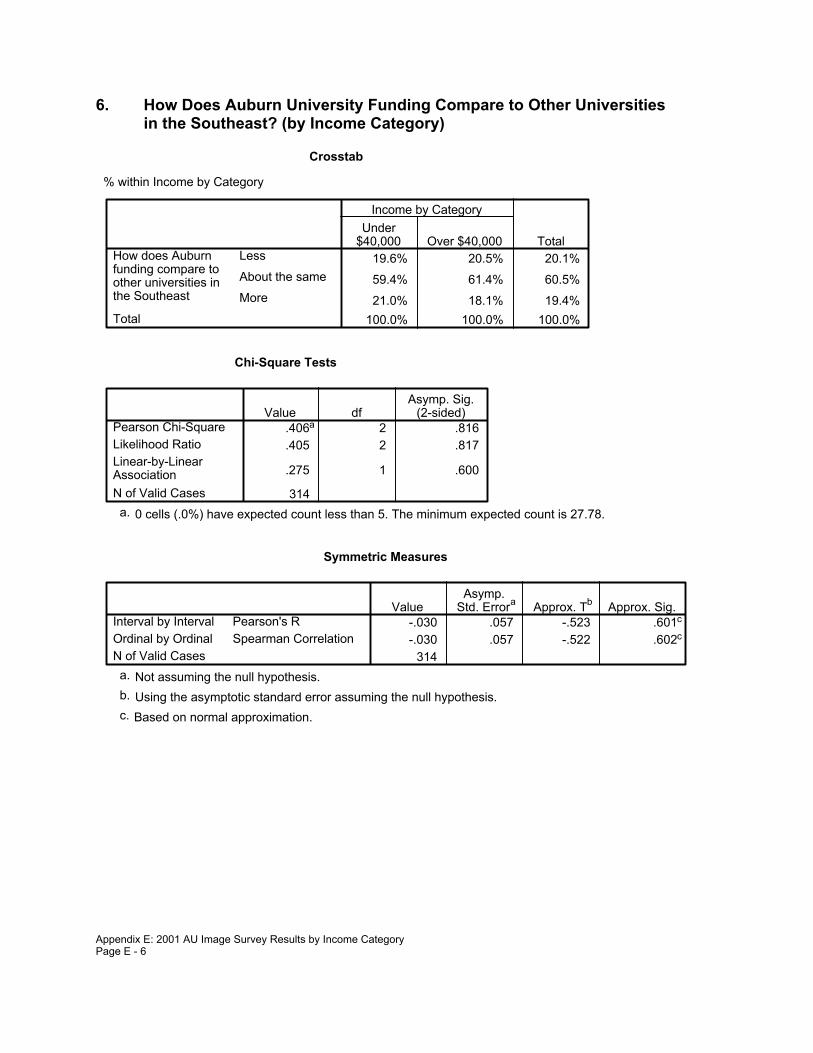
6. How Does Auburn University Funding Compare to Other Universitiesin the Southeast? (by Income Category)
Crosstab
% within Income by Category
19.6% 20.5% 20.1%59.4% 61.4% 60.5%21.0% 18.1% 19.4%
100.0% 100.0% 100.0%
LessAbout the sameMore
How does Auburnfunding compare toother universities inthe Southeast
Total
Under$40,000 Over $40,000
Income by Category
Total
Chi-Square Tests
.406a 2 .816
.405 2 .817
.275 1 .600
314
Pearson Chi-SquareLikelihood RatioLinear-by-LinearAssociationN of Valid Cases
Value dfAsymp. Sig.
(2-sided)
0 cells (.0%) have expected count less than 5. The minimum expected count is 27.78.a.
Symmetric Measures
-.030 .057 -.523 .601c
-.030 .057 -.522 .602c
314
Pearson's RInterval by IntervalSpearman CorrelationOrdinal by Ordinal
N of Valid Cases
ValueAsymp.
Std. Errora Approx. Tb Approx. Sig.
Not assuming the null hypothesis.a.
Using the asymptotic standard error assuming the null hypothesis.b.
Based on normal approximation.c.
Appendix E: 2001 AU Image Survey Results by Income CategoryPage E - 6
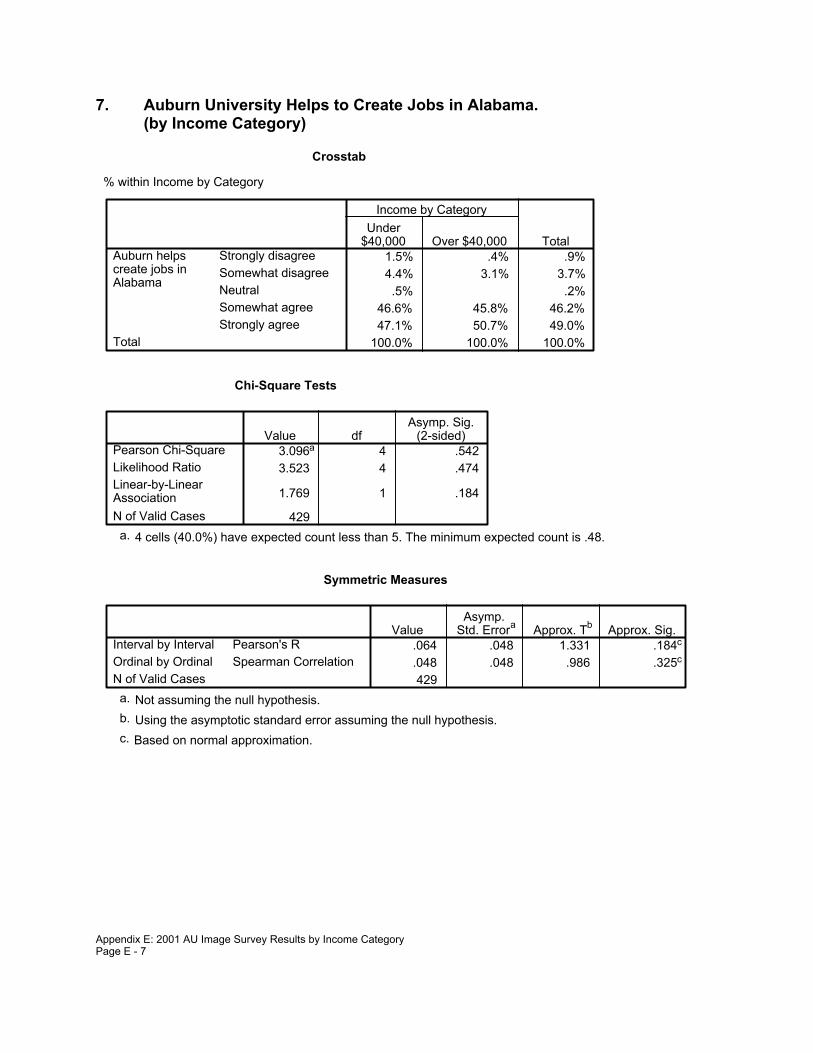
7. Auburn University Helps to Create Jobs in Alabama.(by Income Category)
Crosstab
% within Income by Category
1.5% .4% .9%4.4% 3.1% 3.7%.5% .2%
46.6% 45.8% 46.2%47.1% 50.7% 49.0%
100.0% 100.0% 100.0%
Strongly disagreeSomewhat disagreeNeutralSomewhat agreeStrongly agree
Auburn helpscreate jobs inAlabama
Total
Under$40,000 Over $40,000
Income by Category
Total
Chi-Square Tests
3.096a 4 .5423.523 4 .474
1.769 1 .184
429
Pearson Chi-SquareLikelihood RatioLinear-by-LinearAssociationN of Valid Cases
Value dfAsymp. Sig.
(2-sided)
4 cells (40.0%) have expected count less than 5. The minimum expected count is .48.a.
Symmetric Measures
.064 .048 1.331 .184c
.048 .048 .986 .325c
429
Pearson's RInterval by IntervalSpearman CorrelationOrdinal by Ordinal
N of Valid Cases
ValueAsymp.
Std. Errora Approx. Tb Approx. Sig.
Not assuming the null hypothesis.a.
Using the asymptotic standard error assuming the null hypothesis.b.
Based on normal approximation.c.
Appendix E: 2001 AU Image Survey Results by Income CategoryPage E - 7

8. Auburn University Graduates Play an Important Role in Your LocalCommunity. (by Income Category)
Crosstab
% within Income by Category
3.0% 2.7% 2.8%8.5% 6.8% 7.6%2.5% .5% 1.4%
43.8% 41.6% 42.7%42.3% 48.4% 45.5%
100.0% 100.0% 100.0%
Strongly disagreeSomewhat disagreeNeutralSomewhat agreeStrongly agree
Auburn graduatesplay importantroles in localcommunity
Total
Under$40,000 Over $40,000
Income by Category
Total
Chi-Square Tests
4.464a 4 .3474.703 4 .319
1.613 1 .204
422
Pearson Chi-SquareLikelihood RatioLinear-by-LinearAssociationN of Valid Cases
Value dfAsymp. Sig.
(2-sided)
2 cells (20.0%) have expected count less than 5. The minimum expected count is 2.86.a.
Symmetric Measures
.062 .049 1.271 .204c
.070 .049 1.437 .151c
422
Pearson's RInterval by IntervalSpearman CorrelationOrdinal by Ordinal
N of Valid Cases
ValueAsymp.
Std. Errora Approx. Tb Approx. Sig.
Not assuming the null hypothesis.a.
Using the asymptotic standard error assuming the null hypothesis.b.
Based on normal approximation.c.
Appendix E: 2001 AU Image Survey Results by Income CategoryPage E - 8

9. Auburn University Concentrates on Athletics Rather Than AcademicPrograms (by Income Category)
Crosstab
% within Income by Category
12.4% 22.4% 17.7%28.9% 33.3% 31.2%
6.7% 4.6% 5.6%29.9% 22.8% 26.2%22.2% 16.9% 19.4%
100.0% 100.0% 100.0%
Strongly disagreeSomewhat disagreeNeutralSomewhat agreeStrongly agree
Auburn concentrateson athletic instead ofacademic programs
Total
Under$40,000 Over $40,000
Income by Category
Total
Chi-Square Tests
10.762a 4 .02910.906 4 .028
8.841 1 .003
413
Pearson Chi-SquareLikelihood RatioLinear-by-LinearAssociationN of Valid Cases
Value dfAsymp. Sig.
(2-sided)
0 cells (.0%) have expected count less than 5. The minimum expected count is 10.80.a.
Symmetric Measures
-.146 .048 -3.002 .003c
-.147 .048 -3.023 .003c
413
Pearson's RInterval by IntervalSpearman CorrelationOrdinal by Ordinal
N of Valid Cases
ValueAsymp.
Std. Errora Approx. Tb Approx. Sig.
Not assuming the null hypothesis.a.
Using the asymptotic standard error assuming the null hypothesis.b.
Based on normal approximation.c.
Appendix E: 2001 AU Image Survey Results by Income CategoryPage E - 9

10. Auburn University is One of the Best Universities in the South.(by Income Category)
Crosstab
% within Income by Category
3.0% 3.6% 3.3%7.1% 8.5% 7.8%3.0% 2.7% 2.8%
46.0% 40.2% 42.9%40.9% 45.1% 43.1%
100.0% 100.0% 100.0%
Strongly disagreeSomewhat disagreeNeutralSomewhat agreeStrongly agree
Auburn is one ofthe bestuniversities inthe South
Total
Under$40,000 Over $40,000
Income by Category
Total
Chi-Square Tests
1.651a 4 .8001.652 4 .799
.000 1 .993
422
Pearson Chi-SquareLikelihood RatioLinear-by-LinearAssociationN of Valid Cases
Value dfAsymp. Sig.
(2-sided)
0 cells (.0%) have expected count less than 5. The minimum expected count is 5.63.a.
Symmetric Measures
.000 .048 .009 .993c
.024 .049 .502 .616c
422
Pearson's RInterval by IntervalSpearman CorrelationOrdinal by Ordinal
N of Valid Cases
ValueAsymp.
Std. Errora Approx. Tb Approx. Sig.
Not assuming the null hypothesis.a.
Using the asymptotic standard error assuming the null hypothesis.b.
Based on normal approximation.c.
Appendix E: 2001 AU Image Survey Results by Income CategoryPage E - 10

11. Auburn University is One of the Best Universities in the Nation.(by Income Category)
Crosstab
% within Income by Category
4.7% 9.1% 7.1%13.1% 13.7% 13.4%
4.2% 2.7% 3.4%48.7% 43.8% 46.1%29.3% 30.6% 30.0%
100.0% 100.0% 100.0%
Strongly disagreeSomewhat disagreeNeutralSomewhat agreeStrongly agree
Auburn is oneof the bestuniversities inthe nation
Total
Under$40,000 Over $40,000
Income by Category
Total
Chi-Square Tests
4.051a 4 .3994.140 4 .387
.963 1 .326
410
Pearson Chi-SquareLikelihood RatioLinear-by-LinearAssociationN of Valid Cases
Value dfAsymp. Sig.
(2-sided)
0 cells (.0%) have expected count less than 5. The minimum expected count is 6.52.a.
Symmetric Measures
-.049 .049 -.981 .327c
-.024 .049 -.478 .633c
410
Pearson's RInterval by IntervalSpearman CorrelationOrdinal by Ordinal
N of Valid Cases
ValueAsymp.
Std. Errora Approx. Tb Approx. Sig.
Not assuming the null hypothesis.a.
Using the asymptotic standard error assuming the null hypothesis.b.
Based on normal approximation.c.
Appendix E: 2001 AU Image Survey Results by Income CategoryPage E - 11

12. Alabama Receives a Good Return on Its Investment from AuburnUniversity. (by Income Category)
Crosstab
% within Income by Category
.9% .5%3.4% 4.2% 3.8%1.1% .9% 1.0%
48.6% 38.0% 42.8%46.9% 56.0% 51.9%
100.0% 100.0% 100.0%
Strongly disagreeSomewhat disagreeNeutralSomewhat agreeStrongly agree
State receives agood return on itsinvestment fromAuburn
Total
Under$40,000 Over $40,000
Income by Category
Total
Chi-Square Tests
6.013a 4 .1986.768 4 .149
.420 1 .517
395
Pearson Chi-SquareLikelihood RatioLinear-by-LinearAssociationN of Valid Cases
Value dfAsymp. Sig.
(2-sided)
4 cells (40.0%) have expected count less than 5. The minimum expected count is .91.a.
Symmetric Measures
.033 .050 .648 .517c
.076 .050 1.513 .131c
395
Pearson's RInterval by IntervalSpearman CorrelationOrdinal by Ordinal
N of Valid Cases
ValueAsymp.
Std. Errora Approx. Tb Approx. Sig.
Not assuming the null hypothesis.a.
Using the asymptotic standard error assuming the null hypothesis.b.
Based on normal approximation.c.
Appendix E: 2001 AU Image Survey Results by Income CategoryPage E - 12

13. The Quality of Higher Education in Alabama Affects Me.(by Income Category)
Crosstab
% within Income by Category
2.9% 3.5% 3.2%7.3% 4.4% 5.8%1.9% .4% 1.2%
32.0% 26.5% 29.2%55.8% 65.0% 60.6%
100.0% 100.0% 100.0%
Strongly disagreeSomewhat disagreeNeutralSomewhat agreeStrongly agree
Quality of highereducation inAlabama affectsme
Total
Under$40,000 Over $40,000
Income by Category
Total
Chi-Square Tests
6.368a 4 .1736.499 4 .165
2.287 1 .130
432
Pearson Chi-SquareLikelihood RatioLinear-by-LinearAssociationN of Valid Cases
Value dfAsymp. Sig.
(2-sided)
2 cells (20.0%) have expected count less than 5. The minimum expected count is 2.38.a.
Symmetric Measures
.073 .048 1.515 .131c
.095 .048 1.976 .049c
432
Pearson's RInterval by IntervalSpearman CorrelationOrdinal by Ordinal
N of Valid Cases
ValueAsymp.
Std. Errora Approx. Tb Approx. Sig.
Not assuming the null hypothesis.a.
Using the asymptotic standard error assuming the null hypothesis.b.
Based on normal approximation.c.
Appendix E: 2001 AU Image Survey Results by Income CategoryPage E - 13

14. I Learn About Alabama Universities from Newspapers.(by Income Category)
Crosstab
% within Income by Category
36.2% 32.0% 34.0%
63.8% 68.0% 66.0%100.0% 100.0% 100.0%
No
Yes
Learn about Stateuniversities fromnewspapersTotal
Under$40,000 Over $40,000
Income by Category
Total
Chi-Square Tests
.838b 1 .360
.664 1 .415
.838 1 .360.367 .208
.836 1 .361
441
Pearson Chi-SquareContinuity Correctiona
Likelihood RatioFisher's Exact TestLinear-by-LinearAssociationN of Valid Cases
Value dfAsymp. Sig.
(2-sided)Exact Sig.(2-sided)
Exact Sig.(1-sided)
Computed only for a 2x2 tablea.
0 cells (.0%) have expected count less than 5. The minimum expected count is 72.45.b.
Symmetric Measures
.044 .048 .914 .361c
.044 .048 .914 .361c
441
Pearson's RInterval by IntervalSpearman CorrelationOrdinal by Ordinal
N of Valid Cases
ValueAsymp.
Std. Errora Approx. Tb Approx. Sig.
Not assuming the null hypothesis.a.
Using the asymptotic standard error assuming the null hypothesis.b.
Based on normal approximation.c.
Appendix E: 2001 AU Image Survey Results by Income CategoryPage E - 14
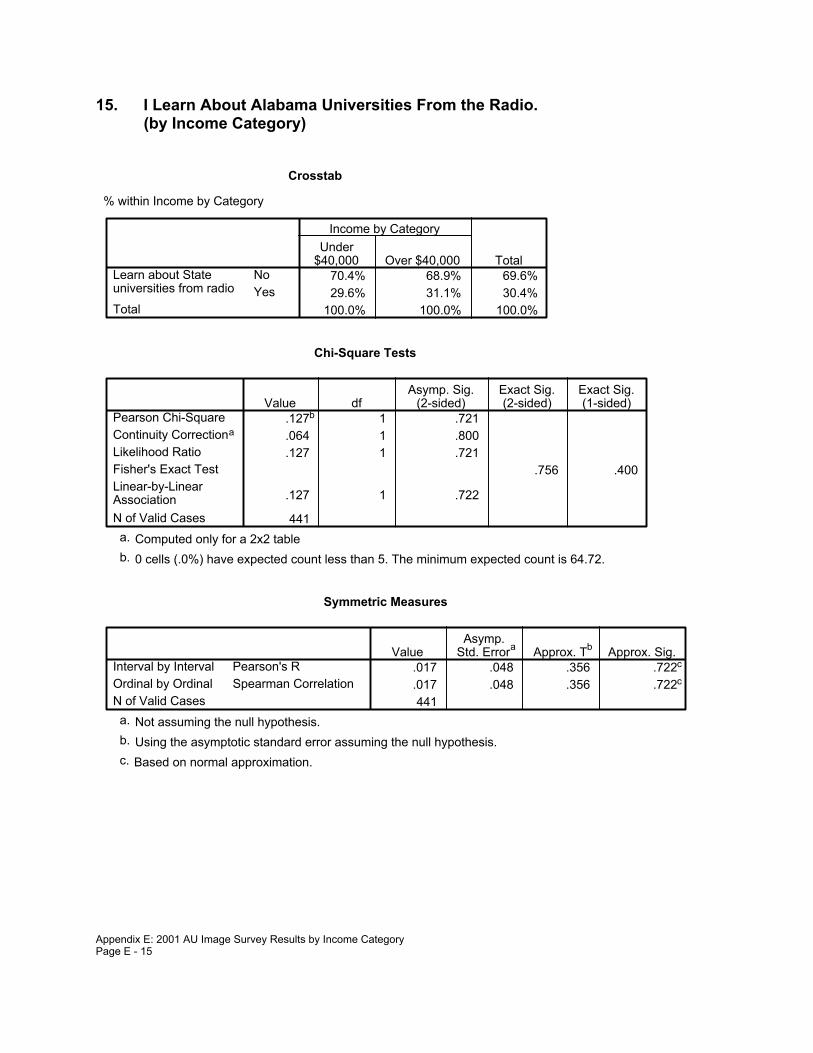
15. I Learn About Alabama Universities From the Radio.(by Income Category)
Crosstab
% within Income by Category
70.4% 68.9% 69.6%29.6% 31.1% 30.4%
100.0% 100.0% 100.0%
NoYes
Learn about Stateuniversities from radioTotal
Under$40,000 Over $40,000
Income by Category
Total
Chi-Square Tests
.127b 1 .721
.064 1 .800
.127 1 .721.756 .400
.127 1 .722
441
Pearson Chi-SquareContinuity Correctiona
Likelihood RatioFisher's Exact TestLinear-by-LinearAssociationN of Valid Cases
Value dfAsymp. Sig.
(2-sided)Exact Sig.(2-sided)
Exact Sig.(1-sided)
Computed only for a 2x2 tablea.
0 cells (.0%) have expected count less than 5. The minimum expected count is 64.72.b.
Symmetric Measures
.017 .048 .356 .722c
.017 .048 .356 .722c
441
Pearson's RInterval by IntervalSpearman CorrelationOrdinal by Ordinal
N of Valid Cases
ValueAsymp.
Std. Errora Approx. Tb Approx. Sig.
Not assuming the null hypothesis.a.
Using the asymptotic standard error assuming the null hypothesis.b.
Based on normal approximation.c.
Appendix E: 2001 AU Image Survey Results by Income CategoryPage E - 15

16. I Learn About Alabama Universities From Magazines.(by Income Category)
Crosstab
% within Income by Category
72.8% 62.3% 67.3%
27.2% 37.7% 32.7%100.0% 100.0% 100.0%
No
Yes
Learn about Stateuniversities frommagazinesTotal
Under$40,000 Over $40,000
Income by Category
Total
Chi-Square Tests
5.510b 1 .0195.043 1 .0255.538 1 .019
.020 .012
5.497 1 .019
441
Pearson Chi-SquareContinuity Correctiona
Likelihood RatioFisher's Exact TestLinear-by-LinearAssociationN of Valid Cases
Value dfAsymp. Sig.
(2-sided)Exact Sig.(2-sided)
Exact Sig.(1-sided)
Computed only for a 2x2 tablea.
0 cells (.0%) have expected count less than 5. The minimum expected count is 69.55.b.
Symmetric Measures
.112 .047 2.357 .019c
.112 .047 2.357 .019c
441
Pearson's RInterval by IntervalSpearman CorrelationOrdinal by Ordinal
N of Valid Cases
ValueAsymp.
Std. Errora Approx. Tb Approx. Sig.
Not assuming the null hypothesis.a.
Using the asymptotic standard error assuming the null hypothesis.b.
Based on normal approximation.c.
Appendix E: 2001 AU Image Survey Results by Income CategoryPage E - 16

17. I Learn About Alabama Universities From Television.(by Income Category)
Crosstab
% within Income by Category
46.0% 39.9% 42.9%54.0% 60.1% 57.1%
100.0% 100.0% 100.0%
NoYes
Learn about Stateuniversities from T.V.Total
Under$40,000 Over $40,000
Income by Category
Total
Chi-Square Tests
1.672b 1 .1961.432 1 .2311.672 1 .196
.211 .116
1.668 1 .197
441
Pearson Chi-SquareContinuity Correctiona
Likelihood RatioFisher's Exact TestLinear-by-LinearAssociationN of Valid Cases
Value dfAsymp. Sig.
(2-sided)Exact Sig.(2-sided)
Exact Sig.(1-sided)
Computed only for a 2x2 tablea.
0 cells (.0%) have expected count less than 5. The minimum expected count is 91.29.b.
Symmetric Measures
.062 .048 1.292 .197c
.062 .048 1.292 .197c
441
Pearson's RInterval by IntervalSpearman CorrelationOrdinal by Ordinal
N of Valid Cases
ValueAsymp.
Std. Errora Approx. Tb Approx. Sig.
Not assuming the null hypothesis.a.
Using the asymptotic standard error assuming the null hypothesis.b.
Based on normal approximation.c.
Appendix E: 2001 AU Image Survey Results by Income CategoryPage E - 17

18. I Learn About Alabama Universities From the Internet. (by IncomeCategory)
Crosstab
% within Income by Category
74.2% 55.7% 64.6%
25.8% 44.3% 35.4%100.0% 100.0% 100.0%
No
Yes
Learn about Stateuniversities fromthe InternetTotal
Under$40,000 Over $40,000
Income by Category
Total
Chi-Square Tests
16.445b 1 .00015.647 1 .00016.636 1 .000
.000 .000
16.408 1 .000
441
Pearson Chi-SquareContinuity Correctiona
Likelihood RatioFisher's Exact TestLinear-by-LinearAssociationN of Valid Cases
Value dfAsymp. Sig.
(2-sided)Exact Sig.(2-sided)
Exact Sig.(1-sided)
Computed only for a 2x2 tablea.
0 cells (.0%) have expected count less than 5. The minimum expected count is 75.35.b.
Symmetric Measures
.193 .046 4.124 .000c
.193 .046 4.124 .000c
441
Pearson's RInterval by IntervalSpearman CorrelationOrdinal by Ordinal
N of Valid Cases
ValueAsymp.
Std. Errora Approx. Tb Approx. Sig.
Not assuming the null hypothesis.a.
Using the asymptotic standard error assuming the null hypothesis.b.
Based on normal approximation.c.
Appendix E: 2001 AU Image Survey Results by Income CategoryPage E - 18

19. I Learn About Alabama Universities From Alumni. (by Income Category)
Crosstab
% within Income by Category
77.0% 57.0% 66.7%23.0% 43.0% 33.3%
100.0% 100.0% 100.0%
NoYes
Learn about Stateuniversities from alumniTotal
Under$40,000 Over $40,000
Income by Category
Total
Chi-Square Tests
19.778b 1 .00018.889 1 .00020.081 1 .000
.000 .000
19.733 1 .000
441
Pearson Chi-SquareContinuity Correctiona
Likelihood RatioFisher's Exact TestLinear-by-LinearAssociationN of Valid Cases
Value dfAsymp. Sig.
(2-sided)Exact Sig.(2-sided)
Exact Sig.(1-sided)
Computed only for a 2x2 tablea.
0 cells (.0%) have expected count less than 5. The minimum expected count is 71.00.b.
Symmetric Measures
.212 .046 4.540 .000c
.212 .046 4.540 .000c
441
Pearson's RInterval by IntervalSpearman CorrelationOrdinal by Ordinal
N of Valid Cases
ValueAsymp.
Std. Errora Approx. Tb Approx. Sig.
Not assuming the null hypothesis.a.
Using the asymptotic standard error assuming the null hypothesis.b.
Based on normal approximation.c.
Appendix E: 2001 AU Image Survey Results by Income CategoryPage E - 19

20. I Learn About Alabama Universities From Students.(by Income Category)
Crosstab
% within Income by Category
64.3% 61.8% 63.0%35.7% 38.2% 37.0%
100.0% 100.0% 100.0%
NoYes
Learn about Stateuniversities from studentsTotal
Under$40,000 Over $40,000
Income by Category
Total
Chi-Square Tests
.290b 1 .590
.193 1 .660
.290 1 .590.622 .330
.289 1 .591
441
Pearson Chi-SquareContinuity Correctiona
Likelihood RatioFisher's Exact TestLinear-by-LinearAssociationN of Valid Cases
Value dfAsymp. Sig.
(2-sided)Exact Sig.(2-sided)
Exact Sig.(1-sided)
Computed only for a 2x2 tablea.
0 cells (.0%) have expected count less than 5. The minimum expected count is 78.73.b.
Symmetric Measures
.026 .048 .537 .591c
.026 .048 .537 .591c
441
Pearson's RInterval by IntervalSpearman CorrelationOrdinal by Ordinal
N of Valid Cases
ValueAsymp.
Std. Errora Approx. Tb Approx. Sig.
Not assuming the null hypothesis.a.
Using the asymptotic standard error assuming the null hypothesis.b.
Based on normal approximation.c.
Appendix E: 2001 AU Image Survey Results by Income CategoryPage E - 20

21. I Learn About Alabama Universities From My Co-workers.(by Income Category)
Crosstab
% within Income by Category
75.6% 64.0% 69.6%
24.4% 36.0% 30.4%100.0% 100.0% 100.0%
No
Yes
Learn about Stateuniversities fromco-workersTotal
Under$40,000 Over $40,000
Income by Category
Total
Chi-Square Tests
6.947b 1 .0086.412 1 .0116.997 1 .008
.010 .006
6.931 1 .008
441
Pearson Chi-SquareContinuity Correctiona
Likelihood RatioFisher's Exact TestLinear-by-LinearAssociationN of Valid Cases
Value dfAsymp. Sig.
(2-sided)Exact Sig.(2-sided)
Exact Sig.(1-sided)
Computed only for a 2x2 tablea.
0 cells (.0%) have expected count less than 5. The minimum expected count is 64.72.b.
Symmetric Measures
.126 .047 2.651 .008c
.126 .047 2.651 .008c
441
Pearson's RInterval by IntervalSpearman CorrelationOrdinal by Ordinal
N of Valid Cases
ValueAsymp.
Std. Errora Approx. Tb Approx. Sig.
Not assuming the null hypothesis.a.
Using the asymptotic standard error assuming the null hypothesis.b.
Based on normal approximation.c.
Appendix E: 2001 AU Image Survey Results by Income CategoryPage E - 21

22. I Learn About Alabama Universities From Other Sources.(by Income Category)
Crosstab
% within Income by Category
85.9% 82.9% 84.4%14.1% 17.1% 15.6%
100.0% 100.0% 100.0%
NoYes
Learn about Stateuniversities from otherTotal
Under$40,000 Over $40,000
Income by Category
Total
Chi-Square Tests
.761b 1 .383
.550 1 .458
.764 1 .382.432 .229
.760 1 .383
441
Pearson Chi-SquareContinuity Correctiona
Likelihood RatioFisher's Exact TestLinear-by-LinearAssociationN of Valid Cases
Value dfAsymp. Sig.
(2-sided)Exact Sig.(2-sided)
Exact Sig.(1-sided)
Computed only for a 2x2 tablea.
0 cells (.0%) have expected count less than 5. The minimum expected count is 33.33.b.
Symmetric Measures
.042 .047 .871 .384c
.042 .047 .871 .384c
441
Pearson's RInterval by IntervalSpearman CorrelationOrdinal by Ordinal
N of Valid Cases
ValueAsymp.
Std. Errora Approx. Tb Approx. Sig.
Not assuming the null hypothesis.a.
Using the asymptotic standard error assuming the null hypothesis.b.
Based on normal approximation.c.
Appendix E: 2001 AU Image Survey Results by Income CategoryPage E - 22

23. I Saw a Television Announcement About Auburn University Research.(by Income Category)
Crosstab
% within Income by Category
59.2% 43.9% 51.2%
40.8% 56.1% 48.8%100.0% 100.0% 100.0%
No
Yes
Seen any T.V.announcements aboutAuburn researchTotal
Under$40,000 Over $40,000
Income by Category
Total
Chi-Square Tests
10.311b 1 .0019.708 1 .002
10.354 1 .001.002 .001
10.288 1 .001
441
Pearson Chi-SquareContinuity Correctiona
Likelihood RatioFisher's Exact TestLinear-by-LinearAssociationN of Valid Cases
Value dfAsymp. Sig.
(2-sided)Exact Sig.(2-sided)
Exact Sig.(1-sided)
Computed only for a 2x2 tablea.
0 cells (.0%) have expected count less than 5. The minimum expected count is 103.84.b.
Symmetric Measures
.153 .047 3.242 .001c
.153 .047 3.242 .001c
441
Pearson's RInterval by IntervalSpearman CorrelationOrdinal by Ordinal
N of Valid Cases
ValueAsymp.
Std. Errora Approx. Tb Approx. Sig.
Not assuming the null hypothesis.a.
Using the asymptotic standard error assuming the null hypothesis.b.
Based on normal approximation.c.
Appendix E: 2001 AU Image Survey Results by Income CategoryPage E - 23

24. I Am Aware That Auburn University Developed A New Bulletproof Vest.(by Income Category)
Crosstab
% within Income by Category
77.5% 69.7% 73.5%22.5% 30.3% 26.5%
100.0% 100.0% 100.0%
NoYes
Aware Auburn developednew bulletproof vestTotal
Under$40,000 Over $40,000
Income by Category
Total
Chi-Square Tests
3.374b 1 .0662.989 1 .0843.391 1 .066
.068 .042
3.366 1 .067
441
Pearson Chi-SquareContinuity Correctiona
Likelihood RatioFisher's Exact TestLinear-by-LinearAssociationN of Valid Cases
Value dfAsymp. Sig.
(2-sided)Exact Sig.(2-sided)
Exact Sig.(1-sided)
Computed only for a 2x2 tablea.
0 cells (.0%) have expected count less than 5. The minimum expected count is 56.51.b.
Symmetric Measures
.087 .047 1.840 .066c
.087 .047 1.840 .066c
441
Pearson's RInterval by IntervalSpearman CorrelationOrdinal by Ordinal
N of Valid Cases
ValueAsymp.
Std. Errora Approx. Tb Approx. Sig.
Not assuming the null hypothesis.a.
Using the asymptotic standard error assuming the null hypothesis.b.
Based on normal approximation.c.
Appendix E: 2001 AU Image Survey Results by Income CategoryPage E - 24

25. The Bulletproof Vest Research is Significant. (by Income Category)
Crosstab
% within Income by Category
2.1% 2.9% 2.6%97.9% 97.1% 97.4%
100.0% 100.0% 100.0%
NoYes
Is the bulletproof vestresearch significantTotal
Under$40,000 Over $40,000
Income by Category
Total
Chi-Square Tests
.075b 1 .784
.000 1 1.000
.077 1 .7811.000 .634
.075 1 .785
117
Pearson Chi-SquareContinuity Correctiona
Likelihood RatioFisher's Exact TestLinear-by-LinearAssociationN of Valid Cases
Value dfAsymp. Sig.
(2-sided)Exact Sig.(2-sided)
Exact Sig.(1-sided)
Computed only for a 2x2 tablea.
2 cells (50.0%) have expected count less than 5. The minimum expected count is 1.23.b.
Symmetric Measures
-.025 .089 -.272 .786c
-.025 .089 -.272 .786c
117
Pearson's RInterval by IntervalSpearman CorrelationOrdinal by Ordinal
N of Valid Cases
ValueAsymp.
Std. Errora Approx. Tb Approx. Sig.
Not assuming the null hypothesis.a.
Using the asymptotic standard error assuming the null hypothesis.b.
Based on normal approximation.c.
Appendix E: 2001 AU Image Survey Results by Income CategoryPage E - 25

26. I Saw a Television Announcement About the Bulletproof Vest.(by Income Category)
Crosstab
% within Income by Category
62.5% 52.2% 56.4%37.5% 47.8% 43.6%
100.0% 100.0% 100.0%
NoYes
Seen T.V. announcementabout bulletproof vestTotal
Under$40,000 Over $40,000
Income by Category
Total
Chi-Square Tests
1.228b 1 .268.844 1 .358
1.234 1 .267.344 .179
1.217 1 .270
117
Pearson Chi-SquareContinuity Correctiona
Likelihood RatioFisher's Exact TestLinear-by-LinearAssociationN of Valid Cases
Value dfAsymp. Sig.
(2-sided)Exact Sig.(2-sided)
Exact Sig.(1-sided)
Computed only for a 2x2 tablea.
0 cells (.0%) have expected count less than 5. The minimum expected count is 20.92.b.
Symmetric Measures
.102 .091 1.104 .272c
.102 .091 1.104 .272c
117
Pearson's RInterval by IntervalSpearman CorrelationOrdinal by Ordinal
N of Valid Cases
ValueAsymp.
Std. Errora Approx. Tb Approx. Sig.
Not assuming the null hypothesis.a.
Using the asymptotic standard error assuming the null hypothesis.b.
Based on normal approximation.c.
Appendix E: 2001 AU Image Survey Results by Income CategoryPage E - 26

27. The Bulletproof Vest Announcement Should Be Continued.(by Income Category)
Crosstab
% within Income by Category
9.1% 5.9%
100.0% 90.9% 94.1%100.0% 100.0% 100.0%
No
Yes
Should bulletproofvest announcementbe continuedTotal
Under$40,000 Over $40,000
Income by Category
Total
Chi-Square Tests
1.739b 1 .187.484 1 .486
2.713 1 .100.544 .262
1.705 1 .192
51
Pearson Chi-SquareContinuity Correctiona
Likelihood RatioFisher's Exact TestLinear-by-LinearAssociationN of Valid Cases
Value dfAsymp. Sig.
(2-sided)Exact Sig.(2-sided)
Exact Sig.(1-sided)
Computed only for a 2x2 tablea.
2 cells (50.0%) have expected count less than 5. The minimum expected count is 1.06.b.
Symmetric Measures
-.185 .057 -1.315 .195c
-.185 .057 -1.315 .195c
51
Pearson's RInterval by IntervalSpearman CorrelationOrdinal by Ordinal
N of Valid Cases
ValueAsymp.
Std. Errora Approx. Tb Approx. Sig.
Not assuming the null hypothesis.a.
Using the asymptotic standard error assuming the null hypothesis.b.
Based on normal approximation.c.
Appendix E: 2001 AU Image Survey Results by Income CategoryPage E - 27

28. I Am Aware That Auburn University Developed New Airbags.(by Income Category)
Crosstab
% within Income by Category
75.1% 79.4% 77.3%24.9% 20.6% 22.7%
100.0% 100.0% 100.0%
NoYes
Aware Auburndeveloped new airbagsTotal
Under$40,000 Over $40,000
Income by Category
Total
Chi-Square Tests
1.144b 1 .285.914 1 .339
1.144 1 .285.307 .170
1.142 1 .285
441
Pearson Chi-SquareContinuity Correctiona
Likelihood RatioFisher's Exact TestLinear-by-LinearAssociationN of Valid Cases
Value dfAsymp. Sig.
(2-sided)Exact Sig.(2-sided)
Exact Sig.(1-sided)
Computed only for a 2x2 tablea.
0 cells (.0%) have expected count less than 5. The minimum expected count is 48.30.b.
Symmetric Measures
-.051 .048 -1.069 .286c
-.051 .048 -1.069 .286c
441
Pearson's RInterval by IntervalSpearman CorrelationOrdinal by Ordinal
N of Valid Cases
ValueAsymp.
Std. Errora Approx. Tb Approx. Sig.
Not assuming the null hypothesis.a.
Using the asymptotic standard error assuming the null hypothesis.b.
Based on normal approximation.c.
Appendix E: 2001 AU Image Survey Results by Income CategoryPage E - 28

29. The Airbag Research is Significant. (by Income Category)
Crosstab
% within Income by Category
5.7% 2.1% 4.0%94.3% 97.9% 96.0%
100.0% 100.0% 100.0%
NoYes
Is the airbag researchsignificantTotal
Under$40,000 Over $40,000
Income by Category
Total
Chi-Square Tests
.810b 1 .368
.151 1 .698
.853 1 .356.620 .355
.801 1 .371
100
Pearson Chi-SquareContinuity Correctiona
Likelihood RatioFisher's Exact TestLinear-by-LinearAssociationN of Valid Cases
Value dfAsymp. Sig.
(2-sided)Exact Sig.(2-sided)
Exact Sig.(1-sided)
Computed only for a 2x2 tablea.
2 cells (50.0%) have expected count less than 5. The minimum expected count is 1.88.b.
Symmetric Measures
.090 .090 .894 .373c
.090 .090 .894 .373c
100
Pearson's RInterval by IntervalSpearman CorrelationOrdinal by Ordinal
N of Valid Cases
ValueAsymp.
Std. Errora Approx. Tb Approx. Sig.
Not assuming the null hypothesis.a.
Using the asymptotic standard error assuming the null hypothesis.b.
Based on normal approximation.c.
Appendix E: 2001 AU Image Survey Results by Income CategoryPage E - 29

30. I Saw the Television Announcement About Auburn University's AirbagResearch.
(by Income Category)
Crosstab
% within Income by Category
56.6% 59.6% 58.0%43.4% 40.4% 42.0%
100.0% 100.0% 100.0%
NoYes
Seen T.V. announcementabout airbagsTotal
Under$40,000 Over $40,000
Income by Category
Total
Chi-Square Tests
.090b 1 .764
.009 1 .922
.090 1 .764.840 .461
.089 1 .765
100
Pearson Chi-SquareContinuity Correctiona
Likelihood RatioFisher's Exact TestLinear-by-LinearAssociationN of Valid Cases
Value dfAsymp. Sig.
(2-sided)Exact Sig.(2-sided)
Exact Sig.(1-sided)
Computed only for a 2x2 tablea.
0 cells (.0%) have expected count less than 5. The minimum expected count is 19.74.b.
Symmetric Measures
-.030 .100 -.298 .767c
-.030 .100 -.298 .767c
100
Pearson's RInterval by IntervalSpearman CorrelationOrdinal by Ordinal
N of Valid Cases
ValueAsymp.
Std. Errora Approx. Tb Approx. Sig.
Not assuming the null hypothesis.a.
Using the asymptotic standard error assuming the null hypothesis.b.
Based on normal approximation.c.
Appendix E: 2001 AU Image Survey Results by Income CategoryPage E - 30

31. The Airbag Announcement Should Be Continued.(by Income Category)
Crosstab
% within Income by Category
8.7% 5.3% 7.1%
91.3% 94.7% 92.9%100.0% 100.0% 100.0%
No
Yes
Should airbagannouncementbe continuedTotal
Under$40,000 Over $40,000
Income by Category
Total
Chi-Square Tests
.185b 1 .667
.000 1 1.000
.189 1 .6641.000 .573
.180 1 .671
42
Pearson Chi-SquareContinuity Correctiona
Likelihood RatioFisher's Exact TestLinear-by-LinearAssociationN of Valid Cases
Value dfAsymp. Sig.
(2-sided)Exact Sig.(2-sided)
Exact Sig.(1-sided)
Computed only for a 2x2 tablea.
2 cells (50.0%) have expected count less than 5. The minimum expected count is 1.36.b.
Symmetric Measures
.066 .148 .420 .676c
.066 .148 .420 .676c
42
Pearson's RInterval by IntervalSpearman CorrelationOrdinal by Ordinal
N of Valid Cases
ValueAsymp.
Std. Errora Approx. Tb Approx. Sig.
Not assuming the null hypothesis.a.
Using the asymptotic standard error assuming the null hypothesis.b.
Based on normal approximation.c.
Appendix E: 2001 AU Image Survey Results by Income CategoryPage E - 31

32. I Am Aware That Auburn University Impacts the Economy.(by Income Category)
Crosstab
% within Income by Category
39.9% 29.8% 34.7%60.1% 70.2% 65.3%
100.0% 100.0% 100.0%
NoYes
Aware Auburn impactsthe economyTotal
Under$40,000 Over $40,000
Income by Category
Total
Chi-Square Tests
4.940b 1 .0264.505 1 .0344.945 1 .026
.028 .017
4.929 1 .026
441
Pearson Chi-SquareContinuity Correctiona
Likelihood RatioFisher's Exact TestLinear-by-LinearAssociationN of Valid Cases
Value dfAsymp. Sig.
(2-sided)Exact Sig.(2-sided)
Exact Sig.(1-sided)
Computed only for a 2x2 tablea.
0 cells (.0%) have expected count less than 5. The minimum expected count is 73.90.b.
Symmetric Measures
.106 .047 2.230 .026c
.106 .047 2.230 .026c
441
Pearson's RInterval by IntervalSpearman CorrelationOrdinal by Ordinal
N of Valid Cases
ValueAsymp.
Std. Errora Approx. Tb Approx. Sig.
Not assuming the null hypothesis.a.
Using the asymptotic standard error assuming the null hypothesis.b.
Based on normal approximation.c.
Appendix E: 2001 AU Image Survey Results by Income CategoryPage E - 32

33. I Saw the Television Announcement About Auburn University's Impacts.(by Income Category)
Crosstab
% within Income by Category
60.2% 56.3% 58.0%39.8% 43.8% 42.0%
100.0% 100.0% 100.0%
NoYes
Seen T.V. announcementabout the impactsTotal
Under$40,000 Over $40,000
Income by Category
Total
Chi-Square Tests
.445b 1 .505
.299 1 .584
.446 1 .504.549 .292
.444 1 .505
288
Pearson Chi-SquareContinuity Correctiona
Likelihood RatioFisher's Exact TestLinear-by-LinearAssociationN of Valid Cases
Value dfAsymp. Sig.
(2-sided)Exact Sig.(2-sided)
Exact Sig.(1-sided)
Computed only for a 2x2 tablea.
0 cells (.0%) have expected count less than 5. The minimum expected count is 53.78.b.
Symmetric Measures
.039 .059 .666 .506c
.039 .059 .666 .506c
288
Pearson's RInterval by IntervalSpearman CorrelationOrdinal by Ordinal
N of Valid Cases
ValueAsymp.
Std. Errora Approx. Tb Approx. Sig.
Not assuming the null hypothesis.a.
Using the asymptotic standard error assuming the null hypothesis.b.
Based on normal approximation.c.
Appendix E: 2001 AU Image Survey Results by Income CategoryPage E - 33

34. The Impact Announcement Should Be Continued.(by Income Category)
Crosstab
% within Income by Category
2.9% 1.7%
100.0% 97.1% 98.3%100.0% 100.0% 100.0%
No
Yes
Should impactannouncementbe continuedTotal
Under$40,000 Over $40,000
Income by Category
Total
Chi-Square Tests
1.482b 1 .224.245 1 .620
2.214 1 .137.508 .333
1.469 1 .225
121
Pearson Chi-SquareContinuity Correctiona
Likelihood RatioFisher's Exact TestLinear-by-LinearAssociationN of Valid Cases
Value dfAsymp. Sig.
(2-sided)Exact Sig.(2-sided)
Exact Sig.(1-sided)
Computed only for a 2x2 tablea.
2 cells (50.0%) have expected count less than 5. The minimum expected count is .84.b.
Symmetric Measures
-.111 .040 -1.215 .227c
-.111 .040 -1.215 .227c
121
Pearson's RInterval by IntervalSpearman CorrelationOrdinal by Ordinal
N of Valid Cases
ValueAsymp.
Std. Errora Approx. Tb Approx. Sig.
Not assuming the null hypothesis.a.
Using the asymptotic standard error assuming the null hypothesis.b.
Based on normal approximation.c.
Appendix E: 2001 AU Image Survey Results by Income CategoryPage E - 34

35. I Am Aware That Auburn University Improves Highway Construction.(by Income Category)
Crosstab
% within Income by Category
64.3% 61.4% 62.8%35.7% 38.6% 37.2%
100.0% 100.0% 100.0%
NoYes
Aware Auburn improvedhighway constructionTotal
Under$40,000 Over $40,000
Income by Category
Total
Chi-Square Tests
.401b 1 .527
.286 1 .593
.401 1 .527.555 .297
.400 1 .527
441
Pearson Chi-SquareContinuity Correctiona
Likelihood RatioFisher's Exact TestLinear-by-LinearAssociationN of Valid Cases
Value dfAsymp. Sig.
(2-sided)Exact Sig.(2-sided)
Exact Sig.(1-sided)
Computed only for a 2x2 tablea.
0 cells (.0%) have expected count less than 5. The minimum expected count is 79.21.b.
Symmetric Measures
.030 .048 .632 .528c
.030 .048 .632 .528c
441
Pearson's RInterval by IntervalSpearman CorrelationOrdinal by Ordinal
N of Valid Cases
ValueAsymp.
Std. Errora Approx. Tb Approx. Sig.
Not assuming the null hypothesis.a.
Using the asymptotic standard error assuming the null hypothesis.b.
Based on normal approximation.c.
Appendix E: 2001 AU Image Survey Results by Income CategoryPage E - 35

36. The Highway Construction Research is Significant.(by Income Category)
Crosstab
% within Income by Category
3.9% 1.8%
96.1% 100.0% 98.2%100.0% 100.0% 100.0%
No
Yes
Is the highwayconstructionresearch significantTotal
Under$40,000 Over $40,000
Income by Category
Total
Chi-Square Tests
3.538b 1 .0601.682 1 .1954.680 1 .031
.097 .097
3.517 1 .061
164
Pearson Chi-SquareContinuity Correctiona
Likelihood RatioFisher's Exact TestLinear-by-LinearAssociationN of Valid Cases
Value dfAsymp. Sig.
(2-sided)Exact Sig.(2-sided)
Exact Sig.(1-sided)
Computed only for a 2x2 tablea.
2 cells (50.0%) have expected count less than 5. The minimum expected count is 1.39.b.
Symmetric Measures
.147 .043 1.890 .061c
.147 .043 1.890 .061c
164
Pearson's RInterval by IntervalSpearman CorrelationOrdinal by Ordinal
N of Valid Cases
ValueAsymp.
Std. Errora Approx. Tb Approx. Sig.
Not assuming the null hypothesis.a.
Using the asymptotic standard error assuming the null hypothesis.b.
Based on normal approximation.c.
Appendix E: 2001 AU Image Survey Results by Income CategoryPage E - 36

37. I Am Aware That Auburn University Fisheries Sustains One of the World's Leading Food Sources. (by Income Category)
Crosstab
% within Income by Category
43.7% 33.8% 38.5%56.3% 66.2% 61.5%
100.0% 100.0% 100.0%
NoYes
Aware Auburn fisheriessustains food sourcesTotal
Under$40,000 Over $40,000
Income by Category
Total
Chi-Square Tests
4.547b 1 .0334.139 1 .0424.552 1 .033
.040 .021
4.537 1 .033
441
Pearson Chi-SquareContinuity Correctiona
Likelihood RatioFisher's Exact TestLinear-by-LinearAssociationN of Valid Cases
Value dfAsymp. Sig.
(2-sided)Exact Sig.(2-sided)
Exact Sig.(1-sided)
Computed only for a 2x2 tablea.
0 cells (.0%) have expected count less than 5. The minimum expected count is 82.11.b.
Symmetric Measures
.102 .047 2.139 .033c
.102 .047 2.139 .033c
441
Pearson's RInterval by IntervalSpearman CorrelationOrdinal by Ordinal
N of Valid Cases
ValueAsymp.
Std. Errora Approx. Tb Approx. Sig.
Not assuming the null hypothesis.a.
Using the asymptotic standard error assuming the null hypothesis.b.
Based on normal approximation.c.
Appendix E: 2001 AU Image Survey Results by Income CategoryPage E - 37

38. The Fisheries Research is Significant. (by Income Category)
Crosstab
% within Income by Category
1.7% 1.3% 1.5%98.3% 98.7% 98.5%
100.0% 100.0% 100.0%
NoYes
Is the fisheries researchsignificantTotal
Under$40,000 Over $40,000
Income by Category
Total
Chi-Square Tests
.054b 1 .817
.000 1 1.000
.053 1 .8171.000 .598
.054 1 .817
271
Pearson Chi-SquareContinuity Correctiona
Likelihood RatioFisher's Exact TestLinear-by-LinearAssociationN of Valid Cases
Value dfAsymp. Sig.
(2-sided)Exact Sig.(2-sided)
Exact Sig.(1-sided)
Computed only for a 2x2 tablea.
2 cells (50.0%) have expected count less than 5. The minimum expected count is 1.77.b.
Symmetric Measures
.014 .061 .231 .817c
.014 .061 .231 .817c
271
Pearson's RInterval by IntervalSpearman CorrelationOrdinal by Ordinal
N of Valid Cases
ValueAsymp.
Std. Errora Approx. Tb Approx. Sig.
Not assuming the null hypothesis.a.
Using the asymptotic standard error assuming the null hypothesis.b.
Based on normal approximation.c.
Appendix E: 2001 AU Image Survey Results by Income CategoryPage E - 38

39. I Am Aware That Auburn University Architecture Students BuildLow-Income Housing in West Alabama. (by Income Category)
Crosstab
% within Income by Category
70.0% 64.5% 67.1%
30.0% 35.5% 32.9%100.0% 100.0% 100.0%
No
Yes
Aware architecturestudents build housingin West AlabamaTotal
Under$40,000 Over $40,000
Income by Category
Total
Chi-Square Tests
1.498b 1 .2211.260 1 .2621.501 1 .221
.226 .131
1.495 1 .221
441
Pearson Chi-SquareContinuity Correctiona
Likelihood RatioFisher's Exact TestLinear-by-LinearAssociationN of Valid Cases
Value dfAsymp. Sig.
(2-sided)Exact Sig.(2-sided)
Exact Sig.(1-sided)
Computed only for a 2x2 tablea.
0 cells (.0%) have expected count less than 5. The minimum expected count is 70.03.b.
Symmetric Measures
.058 .047 1.223 .222c
.058 .047 1.223 .222c
441
Pearson's RInterval by IntervalSpearman CorrelationOrdinal by Ordinal
N of Valid Cases
ValueAsymp.
Std. Errora Approx. Tb Approx. Sig.
Not assuming the null hypothesis.a.
Using the asymptotic standard error assuming the null hypothesis.b.
Based on normal approximation.c.
Appendix E: 2001 AU Image Survey Results by Income CategoryPage E - 39

40. The Low-Income Housing Program in West Alabama Should Be Continued. (by Income Category)
Crosstab
% within Income by Category
1.6% 3.7% 2.8%98.4% 96.3% 97.2%
100.0% 100.0% 100.0%
NoYes
Should housing programbe continuedTotal
Under$40,000 Over $40,000
Income by Category
Total
Chi-Square Tests
.611b 1 .434
.074 1 .786
.648 1 .421.630 .403
.607 1 .436
145
Pearson Chi-SquareContinuity Correctiona
Likelihood RatioFisher's Exact TestLinear-by-LinearAssociationN of Valid Cases
Value dfAsymp. Sig.
(2-sided)Exact Sig.(2-sided)
Exact Sig.(1-sided)
Computed only for a 2x2 tablea.
2 cells (50.0%) have expected count less than 5. The minimum expected count is 1.77.b.
Symmetric Measures
-.065 .074 -.778 .438c
-.065 .074 -.778 .438c
145
Pearson's RInterval by IntervalSpearman CorrelationOrdinal by Ordinal
N of Valid Cases
ValueAsymp.
Std. Errora Approx. Tb Approx. Sig.
Not assuming the null hypothesis.a.
Using the asymptotic standard error assuming the null hypothesis.b.
Based on normal approximation.c.
Appendix E: 2001 AU Image Survey Results by Income CategoryPage E - 40

41. I Am Aware of Auburn University's Continuing Education Programs.(by Income Category)
Crosstab
% within Income by Category
32.9% 25.9% 29.3%
67.1% 74.1% 70.7%100.0% 100.0% 100.0%
No
Yes
Aware of Auburncontinuingeducation programsTotal
Under$40,000 Over $40,000
Income by Category
Total
Chi-Square Tests
2.597b 1 .1072.271 1 .1322.598 1 .107
.117 .066
2.592 1 .107
441
Pearson Chi-SquareContinuity Correctiona
Likelihood RatioFisher's Exact TestLinear-by-LinearAssociationN of Valid Cases
Value dfAsymp. Sig.
(2-sided)Exact Sig.(2-sided)
Exact Sig.(1-sided)
Computed only for a 2x2 tablea.
0 cells (.0%) have expected count less than 5. The minimum expected count is 62.31.b.
Symmetric Measures
.077 .048 1.613 .108c
.077 .048 1.613 .108c
441
Pearson's RInterval by IntervalSpearman CorrelationOrdinal by Ordinal
N of Valid Cases
ValueAsymp.
Std. Errora Approx. Tb Approx. Sig.
Not assuming the null hypothesis.a.
Using the asymptotic standard error assuming the null hypothesis.b.
Based on normal approximation.c.
Appendix E: 2001 AU Image Survey Results by Income CategoryPage E - 41

42. I Have Participated in a Continuing Education Program Offered byAuburn University. (by Income Category)
Crosstab
% within Income by Category
89.5% 81.1% 84.9%
10.5% 18.9% 15.1%100.0% 100.0% 100.0%
No
Yes
Have taken anycontinuingeducation programsTotal
Under$40,000 Over $40,000
Income by Category
Total
Chi-Square Tests
4.318b 1 .0383.683 1 .0554.427 1 .035
.040 .027
4.304 1 .038
312
Pearson Chi-SquareContinuity Correctiona
Likelihood RatioFisher's Exact TestLinear-by-LinearAssociationN of Valid Cases
Value dfAsymp. Sig.
(2-sided)Exact Sig.(2-sided)
Exact Sig.(1-sided)
Computed only for a 2x2 tablea.
0 cells (.0%) have expected count less than 5. The minimum expected count is 21.54.b.
Symmetric Measures
.118 .054 2.086 .038c
.118 .054 2.086 .038c
312
Pearson's RInterval by IntervalSpearman CorrelationOrdinal by Ordinal
N of Valid Cases
ValueAsymp.
Std. Errora Approx. Tb Approx. Sig.
Not assuming the null hypothesis.a.
Using the asymptotic standard error assuming the null hypothesis.b.
Based on normal approximation.c.
Appendix E: 2001 AU Image Survey Results by Income CategoryPage E - 42

43. I Am Aware of Auburn University's Partnerships With Local Schools.(by Income Category)
Crosstab
% within Income by Category
72.8% 59.2% 65.8%
27.2% 40.8% 34.2%100.0% 100.0% 100.0%
No
Yes
Aware of Auburnpartnerships withlocal schoolsTotal
Under$40,000 Over $40,000
Income by Category
Total
Chi-Square Tests
8.992b 1 .0038.400 1 .0049.057 1 .003
.004 .002
8.972 1 .003
441
Pearson Chi-SquareContinuity Correctiona
Likelihood RatioFisher's Exact TestLinear-by-LinearAssociationN of Valid Cases
Value dfAsymp. Sig.
(2-sided)Exact Sig.(2-sided)
Exact Sig.(1-sided)
Computed only for a 2x2 tablea.
0 cells (.0%) have expected count less than 5. The minimum expected count is 72.93.b.
Symmetric Measures
.143 .047 3.023 .003c
.143 .047 3.023 .003c
441
Pearson's RInterval by IntervalSpearman CorrelationOrdinal by Ordinal
N of Valid Cases
ValueAsymp.
Std. Errora Approx. Tb Approx. Sig.
Not assuming the null hypothesis.a.
Using the asymptotic standard error assuming the null hypothesis.b.
Based on normal approximation.c.
Appendix E: 2001 AU Image Survey Results by Income CategoryPage E - 43

44. The School Partnerships Should Be Continued. (by Income Category)
Crosstab
% within Income by Category
1.1% .7%100.0% 98.9% 99.3%100.0% 100.0% 100.0%
NoYes
Should partnershipsbe continuedTotal
Under$40,000 Over $40,000
Income by Category
Total
Chi-Square Tests
.628b 1 .428
.000 1 1.000
.974 1 .3241.000 .616
.624 1 .430
151
Pearson Chi-SquareContinuity Correctiona
Likelihood RatioFisher's Exact TestLinear-by-LinearAssociationN of Valid Cases
Value dfAsymp. Sig.
(2-sided)Exact Sig.(2-sided)
Exact Sig.(1-sided)
Computed only for a 2x2 tablea.
2 cells (50.0%) have expected count less than 5. The minimum expected count is .38.b.
Symmetric Measures
-.064 .032 -.789 .432c
-.064 .032 -.789 .432c
151
Pearson's RInterval by IntervalSpearman CorrelationOrdinal by Ordinal
N of Valid Cases
ValueAsymp.
Std. Errora Approx. Tb Approx. Sig.
Not assuming the null hypothesis.a.
Using the asymptotic standard error assuming the null hypothesis.b.
Based on normal approximation.c.
Appendix E: 2001 AU Image Survey Results by Income CategoryPage E - 44

45. My Local School District Would Benefit From a Partnership.(by Income Category)
Crosstab
% within Income by Category
14.6% 11.4% 12.9%
85.4% 88.6% 87.1%100.0% 100.0% 100.0%
No
Yes
Would local schooldistrict benefit frompartnershipTotal
Under$40,000 Over $40,000
Income by Category
Total
Chi-Square Tests
.971b 1 .324
.711 1 .399
.971 1 .324.394 .199
.969 1 .325
441
Pearson Chi-SquareContinuity Correctiona
Likelihood RatioFisher's Exact TestLinear-by-LinearAssociationN of Valid Cases
Value dfAsymp. Sig.
(2-sided)Exact Sig.(2-sided)
Exact Sig.(1-sided)
Computed only for a 2x2 tablea.
0 cells (.0%) have expected count less than 5. The minimum expected count is 27.53.b.
Symmetric Measures
.047 .048 .984 .325c
.047 .048 .984 .325c
441
Pearson's RInterval by IntervalSpearman CorrelationOrdinal by Ordinal
N of Valid Cases
ValueAsymp.
Std. Errora Approx. Tb Approx. Sig.
Not assuming the null hypothesis.a.
Using the asymptotic standard error assuming the null hypothesis.b.
Based on normal approximation.c.
Appendix E: 2001 AU Image Survey Results by Income CategoryPage E - 45

46. I Am Familiar With Auburn University's Cooperative Extension System.(by Income Category)
Crosstab
% within Income by Category
56.3% 36.4% 46.0%43.7% 63.6% 54.0%
100.0% 100.0% 100.0%
NoYes
Familiar with CooperativeExtension SystemTotal
Under$40,000 Over $40,000
Income by Category
Total
Chi-Square Tests
17.615b 1 .00016.822 1 .00017.725 1 .000
.000 .000
17.575 1 .000
441
Pearson Chi-SquareContinuity Correctiona
Likelihood RatioFisher's Exact TestLinear-by-LinearAssociationN of Valid Cases
Value dfAsymp. Sig.
(2-sided)Exact Sig.(2-sided)
Exact Sig.(1-sided)
Computed only for a 2x2 tablea.
0 cells (.0%) have expected count less than 5. The minimum expected count is 98.05.b.
Symmetric Measures
.200 .047 4.274 .000c
.200 .047 4.274 .000c
441
Pearson's RInterval by IntervalSpearman CorrelationOrdinal by Ordinal
N of Valid Cases
ValueAsymp.
Std. Errora Approx. Tb Approx. Sig.
Not assuming the null hypothesis.a.
Using the asymptotic standard error assuming the null hypothesis.b.
Based on normal approximation.c.
Appendix E: 2001 AU Image Survey Results by Income CategoryPage E - 46

47. I Have Used Services Provided by the Auburn University ExtensionSystem. (by Income Category)
Crosstab
% within Income by Category
61.3% 45.5% 51.7%38.7% 54.5% 48.3%
100.0% 100.0% 100.0%
NoYes
Used any services fromExtension SystemTotal
Under$40,000 Over $40,000
Income by Category
Total
Chi-Square Tests
5.645b 1 .0185.031 1 .0255.681 1 .017
.024 .012
5.621 1 .018
238
Pearson Chi-SquareContinuity Correctiona
Likelihood RatioFisher's Exact TestLinear-by-LinearAssociationN of Valid Cases
Value dfAsymp. Sig.
(2-sided)Exact Sig.(2-sided)
Exact Sig.(1-sided)
Computed only for a 2x2 tablea.
0 cells (.0%) have expected count less than 5. The minimum expected count is 44.94.b.
Symmetric Measures
.154 .064 2.394 .017c
.154 .064 2.394 .017c
238
Pearson's RInterval by IntervalSpearman CorrelationOrdinal by Ordinal
N of Valid Cases
ValueAsymp.
Std. Errora Approx. Tb Approx. Sig.
Not assuming the null hypothesis.a.
Using the asymptotic standard error assuming the null hypothesis.b.
Based on normal approximation.c.
Appendix E: 2001 AU Image Survey Results by Income CategoryPage E - 47

48. The Cooperative Extension Programs Are Beneficial.(by Income Category)
Crosstab
% within Income by Category
2.8% 1.3% 1.7%97.2% 98.7% 98.3%
100.0% 100.0% 100.0%
NoYes
Are Extension programsbeneficialTotal
Under$40,000 Over $40,000
Income by Category
Total
Chi-Square Tests
.331b 1 .565
.000 1 1.000
.307 1 .580.530 .530
.328 1 .567
115
Pearson Chi-SquareContinuity Correctiona
Likelihood RatioFisher's Exact TestLinear-by-LinearAssociationN of Valid Cases
Value dfAsymp. Sig.
(2-sided)Exact Sig.(2-sided)
Exact Sig.(1-sided)
Computed only for a 2x2 tablea.
2 cells (50.0%) have expected count less than 5. The minimum expected count is .63.b.
Symmetric Measures
.054 .102 .571 .569c
.054 .102 .571 .569c
115
Pearson's RInterval by IntervalSpearman CorrelationOrdinal by Ordinal
N of Valid Cases
ValueAsymp.
Std. Errora Approx. Tb Approx. Sig.
Not assuming the null hypothesis.a.
Using the asymptotic standard error assuming the null hypothesis.b.
Based on normal approximation.c.
Appendix E: 2001 AU Image Survey Results by Income CategoryPage E - 48

49. Auburn University Should Offer More Distance Learning Programs.(by Income Category)
Crosstab
% within Income by Category
10.8% 10.5% 10.7%89.2% 89.5% 89.3%
100.0% 100.0% 100.0%
NoYes
Should Auburn offermore distance learningTotal
Under$40,000 Over $40,000
Income by Category
Total
Chi-Square Tests
.009b 1 .926
.000 1 1.000
.009 1 .9261.000 .524
.009 1 .926
441
Pearson Chi-SquareContinuity Correctiona
Likelihood RatioFisher's Exact TestLinear-by-LinearAssociationN of Valid Cases
Value dfAsymp. Sig.
(2-sided)Exact Sig.(2-sided)
Exact Sig.(1-sided)
Computed only for a 2x2 tablea.
0 cells (.0%) have expected count less than 5. The minimum expected count is 22.70.b.
Symmetric Measures
.004 .048 .092 .927c
.004 .048 .092 .927c
441
Pearson's RInterval by IntervalSpearman CorrelationOrdinal by Ordinal
N of Valid Cases
ValueAsymp.
Std. Errora Approx. Tb Approx. Sig.
Not assuming the null hypothesis.a.
Using the asymptotic standard error assuming the null hypothesis.b.
Based on normal approximation.c.
Appendix E: 2001 AU Image Survey Results by Income CategoryPage E - 49

50. Is Education an Important Issue? (by Income Category)
Crosstab
% within Income by Category
3.8% 1.8% 2.7%96.2% 98.2% 97.3%
100.0% 100.0% 100.0%
NoYes
Is education animportant issueTotal
Under$40,000 Over $40,000
Income by Category
Total
Chi-Square Tests
1.667b 1 .197.996 1 .318
1.691 1 .194.247 .159
1.663 1 .197
441
Pearson Chi-SquareContinuity Correctiona
Likelihood RatioFisher's Exact TestLinear-by-LinearAssociationN of Valid Cases
Value dfAsymp. Sig.
(2-sided)Exact Sig.(2-sided)
Exact Sig.(1-sided)
Computed only for a 2x2 tablea.
0 cells (.0%) have expected count less than 5. The minimum expected count is 5.80.b.
Symmetric Measures
.061 .046 1.290 .198c
.061 .046 1.290 .198c
441
Pearson's RInterval by IntervalSpearman CorrelationOrdinal by Ordinal
N of Valid Cases
ValueAsymp.
Std. Errora Approx. Tb Approx. Sig.
Not assuming the null hypothesis.a.
Using the asymptotic standard error assuming the null hypothesis.b.
Based on normal approximation.c.
Appendix E: 2001 AU Image Survey Results by Income CategoryPage E - 50

51. Is Community and Economic Development an Important Issue?(by Income Category)
Crosstab
% within Income by Category
7.0% 3.9% 5.4%
93.0% 96.1% 94.6%100.0% 100.0% 100.0%
No
Yes
Is community andeconomic developmentan important issueTotal
Under$40,000 Over $40,000
Income by Category
Total
Chi-Square Tests
2.050b 1 .1521.492 1 .2222.064 1 .151
.207 .111
2.045 1 .153
441
Pearson Chi-SquareContinuity Correctiona
Likelihood RatioFisher's Exact TestLinear-by-LinearAssociationN of Valid Cases
Value dfAsymp. Sig.
(2-sided)Exact Sig.(2-sided)
Exact Sig.(1-sided)
Computed only for a 2x2 tablea.
0 cells (.0%) have expected count less than 5. The minimum expected count is 11.59.b.
Symmetric Measures
.068 .047 1.432 .153c
.068 .047 1.432 .153c
441
Pearson's RInterval by IntervalSpearman CorrelationOrdinal by Ordinal
N of Valid Cases
ValueAsymp.
Std. Errora Approx. Tb Approx. Sig.
Not assuming the null hypothesis.a.
Using the asymptotic standard error assuming the null hypothesis.b.
Based on normal approximation.c.
Appendix E: 2001 AU Image Survey Results by Income CategoryPage E - 51

52. Is Agriculture an Important Issue? (by Income Category)
Crosstab
% within Income by Category
11.3% 7.0% 9.1%88.7% 93.0% 90.9%
100.0% 100.0% 100.0%
NoYes
Is agriculture animportant issueTotal
Under$40,000 Over $40,000
Income by Category
Total
Chi-Square Tests
2.412b 1 .1201.924 1 .1652.420 1 .120
.137 .083
2.406 1 .121
441
Pearson Chi-SquareContinuity Correctiona
Likelihood RatioFisher's Exact TestLinear-by-LinearAssociationN of Valid Cases
Value dfAsymp. Sig.
(2-sided)Exact Sig.(2-sided)
Exact Sig.(1-sided)
Computed only for a 2x2 tablea.
0 cells (.0%) have expected count less than 5. The minimum expected count is 19.32.b.
Symmetric Measures
.074 .047 1.554 .121c
.074 .047 1.554 .121c
441
Pearson's RInterval by IntervalSpearman CorrelationOrdinal by Ordinal
N of Valid Cases
ValueAsymp.
Std. Errora Approx. Tb Approx. Sig.
Not assuming the null hypothesis.a.
Using the asymptotic standard error assuming the null hypothesis.b.
Based on normal approximation.c.
Appendix E: 2001 AU Image Survey Results by Income CategoryPage E - 52

53. Are Family and Youth Important Issues? (by Income Category)
Crosstab
% within Income by Category
6.6% 4.8% 5.7%93.4% 95.2% 94.3%
100.0% 100.0% 100.0%
NoYes
Is family and youth andimportant issueTotal
Under$40,000 Over $40,000
Income by Category
Total
Chi-Square Tests
.629b 1 .428
.345 1 .557
.630 1 .427.537 .278
.628 1 .428
441
Pearson Chi-SquareContinuity Correctiona
Likelihood RatioFisher's Exact TestLinear-by-LinearAssociationN of Valid Cases
Value dfAsymp. Sig.
(2-sided)Exact Sig.(2-sided)
Exact Sig.(1-sided)
Computed only for a 2x2 tablea.
0 cells (.0%) have expected count less than 5. The minimum expected count is 12.07.b.
Symmetric Measures
.038 .047 .792 .429c
.038 .047 .792 .429c
441
Pearson's RInterval by IntervalSpearman CorrelationOrdinal by Ordinal
N of Valid Cases
ValueAsymp.
Std. Errora Approx. Tb Approx. Sig.
Not assuming the null hypothesis.a.
Using the asymptotic standard error assuming the null hypothesis.b.
Based on normal approximation.c.
Appendix E: 2001 AU Image Survey Results by Income CategoryPage E - 53

54. Is the Environment an Important Issue? (by Income Category)
Crosstab
% within Income by Category
8.9% 5.7% 7.3%91.1% 94.3% 92.7%
100.0% 100.0% 100.0%
NoYes
Is the environmentan important issueTotal
Under$40,000 Over $40,000
Income by Category
Total
Chi-Square Tests
1.695b 1 .1931.250 1 .2631.700 1 .192
.204 .132
1.691 1 .193
441
Pearson Chi-SquareContinuity Correctiona
Likelihood RatioFisher's Exact TestLinear-by-LinearAssociationN of Valid Cases
Value dfAsymp. Sig.
(2-sided)Exact Sig.(2-sided)
Exact Sig.(1-sided)
Computed only for a 2x2 tablea.
0 cells (.0%) have expected count less than 5. The minimum expected count is 15.46.b.
Symmetric Measures
.062 .047 1.301 .194c
.062 .047 1.301 .194c
441
Pearson's RInterval by IntervalSpearman CorrelationOrdinal by Ordinal
N of Valid Cases
ValueAsymp.
Std. Errora Approx. Tb Approx. Sig.
Not assuming the null hypothesis.a.
Using the asymptotic standard error assuming the null hypothesis.b.
Based on normal approximation.c.
Appendix E: 2001 AU Image Survey Results by Income CategoryPage E - 54

55. How Significant is It to Have Outreach Programs in Your Community?(by Income Category)
Crosstab
% within Income by Category
5.6% 3.5% 4.5%4.7% 4.4% 4.5%5.2% 6.1% 5.7%2.8% .4% 1.6%
29.6% 34.6% 32.2%52.1% 50.9% 51.5%
100.0% 100.0% 100.0%
No opinionVery insignificantInsignificantNeutralSignificantVery significant
How significantis it to haveoutreachprograms incommunity
Total
Under$40,000 Over $40,000
Income by Category
Total
Chi-Square Tests
6.141a 5 .2936.535 5 .258
.433 1 .511
441
Pearson Chi-SquareLikelihood RatioLinear-by-LinearAssociationN of Valid Cases
Value dfAsymp. Sig.
(2-sided)
2 cells (16.7%) have expected count less than 5. The minimum expected count is 3.38.a.
Symmetric Measures
.031 .048 .657 .511c
.008 .048 .161 .872c
441
Pearson's RInterval by IntervalSpearman CorrelationOrdinal by Ordinal
N of Valid Cases
ValueAsymp.
Std. Errora Approx. Tb Approx. Sig.
Not assuming the null hypothesis.a.
Using the asymptotic standard error assuming the null hypothesis.b.
Based on normal approximation.c.
Appendix E: 2001 AU Image Survey Results by Income CategoryPage E - 55

56. How Significant is it to Have Access to Information Over the Internet?(by Income Category)
* E
Crosstab
% within Income by Category
9.4% 3.5% 6.3%11.7% 6.6% 9.1%16.4% 13.6% 15.0%
1.4% 1.3% 1.4%18.3% 25.0% 21.8%42.7% 50.0% 46.5%
100.0% 100.0% 100.0%
No opinionVery insignificantInsignificantNeutralSignificantVery significant
How Significantis it to accessinformation overthe Internet
Total
Under$40,000 Over $40,000
Income by Category
Total
Chi-Square Tests
13.346a 5 .02013.553 5 .019
10.744 1 .001
441
Pearson Chi-SquareLikelihood RatioLinear-by-LinearAssociationN of Valid Cases
Value dfAsymp. Sig.
(2-sided)
2 cells (16.7%) have expected count less than 5. The minimum expected count is 2.90.a.
Symmetric Measures
.156 .046 3.315 .001c
.129 .047 2.726 .007c
441
Pearson's RInterval by IntervalSpearman CorrelationOrdinal by Ordinal
N of Valid Cases
ValueAsymp.
Std. Errora Approx. Tb Approx. Sig.
Not assuming the null hypothesis.a.
Using the asymptotic standard error assuming the null hypothesis.b.
Based on normal approximation.c.
Appendix E: 2001 AU Image Survey Results by Income CategoryPage E - 56

Appendix F: 2001 AU Image Survey ResponsesControlled by Gender
1. How Familiar Are You With Auburn University? (by Gender)
Crosstab
% within Gender
15.3% 8.3% 12.7%28.1% 22.4% 25.9%
1.0% 1.0% 1.0%35.1% 36.5% 35.6%20.4% 31.8% 24.8%
100.0% 100.0% 100.0%
Not at all familiarNot very familiarNeutralFamiliarVery familiar
How familiarare you withAuburn
Total
Female MaleGender
Total
Chi-Square Tests
12.335a 4 .01512.482 4 .014
11.343 1 .001
505
Pearson Chi-SquareLikelihood RatioLinear-by-LinearAssociationN of Valid Cases
Value dfAsymp. Sig.
(2-sided)
2 cells (20.0%) have expected count less than 5. The minimum expected count is 1.90.a.
Symmetric Measures
.150 .043 3.403 .001c
.154 .043 3.502 .001c
505
Pearson's RInterval by IntervalSpearman CorrelationOrdinal by Ordinal
N of Valid Cases
ValueAsymp.
Std. Errora Approx. Tb Approx. Sig.
Not assuming the null hypothesis.a.
Using the asymptotic standard error assuming the null hypothesis.b.
Based on normal approximation.c.
Appendix F: 2001 AU Image Survey Results by GenderPage F - 1

2. How Important is Auburn University to the Quality of Life in Alabama?(by Gender)
Crosstab
% within Gender
1.0% 1.6% 1.2%3.9% 6.4% 4.8%.7% .4%
41.0% 38.3% 40.0%53.4% 53.7% 53.5%
100.0% 100.0% 100.0%
UnimportantNot very importantNeutralImportantVery important
How importantis Auburn tothe quality oflife in Alabama
Total
Female MaleGender
Total
Chi-Square Tests
3.286a 4 .5113.920 4 .417
.582 1 .446
495
Pearson Chi-SquareLikelihood RatioLinear-by-LinearAssociationN of Valid Cases
Value dfAsymp. Sig.
(2-sided)
4 cells (40.0%) have expected count less than 5. The minimum expected count is .76.a.
Symmetric Measures
-.034 .046 -.763 .446c
-.009 .045 -.190 .849c
495
Pearson's RInterval by IntervalSpearman CorrelationOrdinal by Ordinal
N of Valid Cases
ValueAsymp.
Std. Errora Approx. Tb Approx. Sig.
Not assuming the null hypothesis.a.
Using the asymptotic standard error assuming the null hypothesis.b.
Based on normal approximation.c.
Appendix F: 2001 AU Image Survey Results by GenderPage F - 2

3. How Important is Auburn University to the Quality of Life in Your LocalCommunity? (by Gender)
Crosstab
% within Gender
2.3% 4.4% 3.1%18.0% 19.3% 18.5%
1.3% 1.7% 1.5%41.3% 44.8% 42.6%37.0% 29.8% 34.3%
100.0% 100.0% 100.0%
UnimportantNot very importantNeutralImportantVery important
How important isAuburn to thequality of life inlocal community
Total
Female MaleGender
Total
Chi-Square Tests
3.766a 4 .4393.738 4 .443
2.234 1 .135
481
Pearson Chi-SquareLikelihood RatioLinear-by-LinearAssociationN of Valid Cases
Value dfAsymp. Sig.
(2-sided)
2 cells (20.0%) have expected count less than 5. The minimum expected count is 2.63.a.
Symmetric Measures
-.068 .046 -1.497 .135c
-.074 .045 -1.633 .103c
481
Pearson's RInterval by IntervalSpearman CorrelationOrdinal by Ordinal
N of Valid Cases
ValueAsymp.
Std. Errora Approx. Tb Approx. Sig.
Not assuming the null hypothesis.a.
Using the asymptotic standard error assuming the null hypothesis.b.
Based on normal approximation.c.
Appendix F: 2001 AU Image Survey Results by GenderPage F - 3

4. How Important is Auburn University Research for Jobs in Your LocalCommunity? (by Gender)
Crosstab
% within Gender
2.9% .6% 2.0%10.5% 13.9% 11.8%
1.1% 1.7% 1.3%40.9% 39.3% 40.3%44.6% 44.5% 44.5%
100.0% 100.0% 100.0%
UnimportantNot very importantNeutralImportantVery important
How important isAuburn researchfor jobs in localcommunity
Total
Female MaleGender
Total
Chi-Square Tests
4.281a 4 .3694.812 4 .307
.002 1 .963
449
Pearson Chi-SquareLikelihood RatioLinear-by-LinearAssociationN of Valid Cases
Value dfAsymp. Sig.
(2-sided)
3 cells (30.0%) have expected count less than 5. The minimum expected count is 2.31.a.
Symmetric Measures
-.002 .047 -.047 .963c
-.005 .047 -.110 .912c
449
Pearson's RInterval by IntervalSpearman CorrelationOrdinal by Ordinal
N of Valid Cases
ValueAsymp.
Std. Errora Approx. Tb Approx. Sig.
Not assuming the null hypothesis.a.
Using the asymptotic standard error assuming the null hypothesis.b.
Based on normal approximation.c.
Appendix F: 2001 AU Image Survey Results by GenderPage F - 4

5. Have You or Your Family Benefited from Auburn University?(by Gender)
Crosstab
% within Gender
69.6% 68.9% 69.4%30.4% 31.1% 30.6%
100.0% 100.0% 100.0%
NoYes
Have you or your familybenefited from AuburnTotal
Female MaleGender
Total
Chi-Square Tests
.030b 1 .861
.006 1 .940
.030 1 .861.921 .469
.030 1 .862
506
Pearson Chi-SquareContinuity Correctiona
Likelihood RatioFisher's Exact TestLinear-by-LinearAssociationN of Valid Cases
Value dfAsymp. Sig.
(2-sided)Exact Sig.(2-sided)
Exact Sig.(1-sided)
Computed only for a 2x2 tablea.
0 cells (.0%) have expected count less than 5. The minimum expected count is 59.12.b.
Symmetric Measures
.008 .045 .174 .862c
.008 .045 .174 .862c
506
Pearson's RInterval by IntervalSpearman CorrelationOrdinal by Ordinal
N of Valid Cases
ValueAsymp.
Std. Errora Approx. Tb Approx. Sig.
Not assuming the null hypothesis.a.
Using the asymptotic standard error assuming the null hypothesis.b.
Based on normal approximation.c.
Appendix F: 2001 AU Image Survey Results by GenderPage F - 5

6. How Does Auburn University Funding Compare to Other Universitiesin the Southeast? (by Gender)
Crosstab
% within Gender
18.7% 22.9% 20.4%60.8% 60.4% 60.6%20.6% 16.7% 19.0%
100.0% 100.0% 100.0%
LessAbout the sameMore
How does Auburnfunding compare toother universities inthe Southeast
Total
Female MaleGender
Total
Chi-Square Tests
1.445a 2 .4861.447 2 .485
1.440 1 .230
353
Pearson Chi-SquareLikelihood RatioLinear-by-LinearAssociationN of Valid Cases
Value dfAsymp. Sig.
(2-sided)
0 cells (.0%) have expected count less than 5. The minimum expected count is 27.33.a.
Symmetric Measures
-.064 .053 -1.201 .231c
-.064 .053 -1.201 .231c
353
Pearson's RInterval by IntervalSpearman CorrelationOrdinal by Ordinal
N of Valid Cases
ValueAsymp.
Std. Errora Approx. Tb Approx. Sig.
Not assuming the null hypothesis.a.
Using the asymptotic standard error assuming the null hypothesis.b.
Based on normal approximation.c.
Appendix F: 2001 AU Image Survey Results by GenderPage F - 6

7. Auburn University Helps to Create Jobs in Alabama.(by Gender)
Crosstab
% within Gender
1.3% 1.6% 1.4%4.7% 3.6% 4.3%.3% .2%
46.8% 45.8% 46.4%46.8% 49.0% 47.7%
100.0% 100.0% 100.0%
Strongly disagreeSomewhat disagreeNeutralSomewhat agreeStrongly agree
Auburn helpscreate jobs inAlabama
Total
Female MaleGender
Total
Chi-Square Tests
1.114a 4 .8921.469 4 .832
.265 1 .606
491
Pearson Chi-SquareLikelihood RatioLinear-by-LinearAssociationN of Valid Cases
Value dfAsymp. Sig.
(2-sided)
4 cells (40.0%) have expected count less than 5. The minimum expected count is .39.a.
Symmetric Measures
.023 .045 .515 .607c
.024 .045 .540 .590c
491
Pearson's RInterval by IntervalSpearman CorrelationOrdinal by Ordinal
N of Valid Cases
ValueAsymp.
Std. Errora Approx. Tb Approx. Sig.
Not assuming the null hypothesis.a.
Using the asymptotic standard error assuming the null hypothesis.b.
Based on normal approximation.c.
Appendix F: 2001 AU Image Survey Results by GenderPage F - 7

8. Auburn University Graduates Play an Important Role in Your LocalCommunity. (by Gender)
Crosstab
% within Gender
2.7% 3.8% 3.1%7.7% 6.5% 7.3%2.0% 1.1% 1.7%
40.4% 46.5% 42.7%47.1% 42.2% 45.2%
100.0% 100.0% 100.0%
Strongly disagreeSomewhat disagreeNeutralSomewhat agreeStrongly agree
Auburn graduatesplay importantroles in localcommunity
Total
Female MaleGender
Total
Chi-Square Tests
2.900a 4 .5752.928 4 .570
.261 1 .609
482
Pearson Chi-SquareLikelihood RatioLinear-by-LinearAssociationN of Valid Cases
Value dfAsymp. Sig.
(2-sided)
2 cells (20.0%) have expected count less than 5. The minimum expected count is 3.07.a.
Symmetric Measures
-.023 .046 -.511 .610c
-.037 .045 -.808 .419c
482
Pearson's RInterval by IntervalSpearman CorrelationOrdinal by Ordinal
N of Valid Cases
ValueAsymp.
Std. Errora Approx. Tb Approx. Sig.
Not assuming the null hypothesis.a.
Using the asymptotic standard error assuming the null hypothesis.b.
Based on normal approximation.c.
Appendix F: 2001 AU Image Survey Results by GenderPage F - 8

9. Auburn University Concentrates on Athletics Instead of AcademicPrograms (by Gender)
Crosstab
% within Gender
16.4% 16.5% 16.5%28.0% 34.6% 30.6%
5.6% 5.9% 5.7%30.8% 22.9% 27.6%19.2% 20.2% 19.6%
100.0% 100.0% 100.0%
Strongly disagreeSomewhat disagreeNeutralSomewhat agreeStrongly agree
Auburn concentrateson athletic instead ofacademic programs
Total
Female MaleGender
Total
Chi-Square Tests
4.245a 4 .3744.285 4 .369
.894 1 .344
474
Pearson Chi-SquareLikelihood RatioLinear-by-LinearAssociationN of Valid Cases
Value dfAsymp. Sig.
(2-sided)
0 cells (.0%) have expected count less than 5. The minimum expected count is 10.71.a.
Symmetric Measures
-.043 .046 -.946 .345c
-.037 .046 -.815 .416c
474
Pearson's RInterval by IntervalSpearman CorrelationOrdinal by Ordinal
N of Valid Cases
ValueAsymp.
Std. Errora Approx. Tb Approx. Sig.
Not assuming the null hypothesis.a.
Using the asymptotic standard error assuming the null hypothesis.b.
Based on normal approximation.c.
Appendix F: 2001 AU Image Survey Results by GenderPage F - 9

10. Auburn University is One of the Best Universities in the South.(by Gender)
Crosstab
% within Gender
2.7% 4.8% 3.5%8.0% 8.0% 8.0%3.0% 3.7% 3.3%
43.5% 44.4% 43.8%42.8% 39.0% 41.4%
100.0% 100.0% 100.0%
Strongly disagreeSomewhat disagreeNeutralSomewhat agreeStrongly agree
Auburn is one ofthe bestuniversities inthe South
Total
Female MaleGender
Total
Chi-Square Tests
2.108a 4 .7162.061 4 .724
1.277 1 .258
486
Pearson Chi-SquareLikelihood RatioLinear-by-LinearAssociationN of Valid Cases
Value dfAsymp. Sig.
(2-sided)
0 cells (.0%) have expected count less than 5. The minimum expected count is 6.16.a.
Symmetric Measures
-.051 .046 -1.131 .259c
-.046 .045 -1.020 .308c
486
Pearson's RInterval by IntervalSpearman CorrelationOrdinal by Ordinal
N of Valid Cases
ValueAsymp.
Std. Errora Approx. Tb Approx. Sig.
Not assuming the null hypothesis.a.
Using the asymptotic standard error assuming the null hypothesis.b.
Based on normal approximation.c.
Appendix F: 2001 AU Image Survey Results by GenderPage F - 10

11. Auburn University is One of the Best Universities in the Nation.(by Gender)
Crosstab
% within Gender
7.0% 9.3% 7.9%13.3% 14.8% 13.9%
3.2% 4.9% 3.8%46.3% 42.6% 44.9%30.2% 28.4% 29.5%
100.0% 100.0% 100.0%
Strongly disagreeSomewhat disagreeNeutralSomewhat agreeStrongly agree
Auburn is oneof the bestuniversities inthe nation
Total
Female MaleGender
Total
Chi-Square Tests
2.243a 4 .6912.210 4 .697
1.259 1 .262
468
Pearson Chi-SquareLikelihood RatioLinear-by-LinearAssociationN of Valid Cases
Value dfAsymp. Sig.
(2-sided)
0 cells (.0%) have expected count less than 5. The minimum expected count is 7.04.a.
Symmetric Measures
-.052 .047 -1.122 .262c
-.046 .047 -.996 .320c
468
Pearson's RInterval by IntervalSpearman CorrelationOrdinal by Ordinal
N of Valid Cases
ValueAsymp.
Std. Errora Approx. Tb Approx. Sig.
Not assuming the null hypothesis.a.
Using the asymptotic standard error assuming the null hypothesis.b.
Based on normal approximation.c.
Appendix F: 2001 AU Image Survey Results by GenderPage F - 11

12. Alabama Receives a Good Return on Its Investment from Auburn University. (by Gender)
Crosstab
% within Gender
.4% .6% .4%4.0% 3.4% 3.8%1.8% 1.1% 1.5%
45.8% 40.1% 43.6%48.0% 54.8% 50.7%
100.0% 100.0% 100.0%
Strongly disagreeSomewhat disagreeNeutralSomewhat agreeStrongly agree
State receives agood return on itsinvestment fromAuburn
Total
Female MaleGender
Total
Chi-Square Tests
2.322a 4 .6772.335 4 .674
1.283 1 .257
452
Pearson Chi-SquareLikelihood RatioLinear-by-LinearAssociationN of Valid Cases
Value dfAsymp. Sig.
(2-sided)
4 cells (40.0%) have expected count less than 5. The minimum expected count is .78.a.
Symmetric Measures
.053 .047 1.133 .258c
.066 .047 1.402 .162c
452
Pearson's RInterval by IntervalSpearman CorrelationOrdinal by Ordinal
N of Valid Cases
ValueAsymp.
Std. Errora Approx. Tb Approx. Sig.
Not assuming the null hypothesis.a.
Using the asymptotic standard error assuming the null hypothesis.b.
Based on normal approximation.c.
Appendix F: 2001 AU Image Survey Results by GenderPage F - 12

13. The Quality of Higher Education in Alabama Affects Me.(by Gender)
Crosstab
% within Gender
4.6% 2.1% 3.6%4.9% 5.8% 5.3%.7% 2.6% 1.4%
28.9% 32.6% 30.3%61.0% 56.8% 59.4%
100.0% 100.0% 100.0%
Strongly disagreeSomewhat disagreeNeutralSomewhat agreeStrongly agree
Quality of highereducation inAlabama affectsme
Total
Female MaleGender
Total
Chi-Square Tests
6.279a 4 .1796.340 4 .175
.002 1 .965
495
Pearson Chi-SquareLikelihood RatioLinear-by-LinearAssociationN of Valid Cases
Value dfAsymp. Sig.
(2-sided)
2 cells (20.0%) have expected count less than 5. The minimum expected count is 2.69.a.
Symmetric Measures
-.002 .044 -.044 .965c
-.034 .045 -.750 .453c
495
Pearson's RInterval by IntervalSpearman CorrelationOrdinal by Ordinal
N of Valid Cases
ValueAsymp.
Std. Errora Approx. Tb Approx. Sig.
Not assuming the null hypothesis.a.
Using the asymptotic standard error assuming the null hypothesis.b.
Based on normal approximation.c.
Appendix F: 2001 AU Image Survey Results by GenderPage F - 13

14. I Learn About Alabama Universities from Newspapers.(by Gender)
Crosstab
% within Gender
36.7% 32.6% 35.2%
63.3% 67.4% 64.8%100.0% 100.0% 100.0%
No
Yes
Learn about Stateuniversities fromnewspapersTotal
Female MaleGender
Total
Chi-Square Tests
.880b 1 .348
.709 1 .400
.884 1 .347.389 .200
.878 1 .349
506
Pearson Chi-SquareContinuity Correctiona
Likelihood RatioFisher's Exact TestLinear-by-LinearAssociationN of Valid Cases
Value dfAsymp. Sig.
(2-sided)Exact Sig.(2-sided)
Exact Sig.(1-sided)
Computed only for a 2x2 tablea.
0 cells (.0%) have expected count less than 5. The minimum expected count is 67.89.b.
Symmetric Measures
.042 .044 .937 .349c
.042 .044 .937 .349c
506
Pearson's RInterval by IntervalSpearman CorrelationOrdinal by Ordinal
N of Valid Cases
ValueAsymp.
Std. Errora Approx. Tb Approx. Sig.
Not assuming the null hypothesis.a.
Using the asymptotic standard error assuming the null hypothesis.b.
Based on normal approximation.c.
Appendix F: 2001 AU Image Survey Results by GenderPage F - 14

15. I Learn About Alabama Universities From the Radio.(by Gender)
Crosstab
% within Gender
73.5% 67.4% 71.1%26.5% 32.6% 28.9%
100.0% 100.0% 100.0%
NoYes
Learn about Stateuniversities from radioTotal
Female MaleGender
Total
Chi-Square Tests
2.182b 1 .1401.894 1 .1692.163 1 .141
.157 .085
2.177 1 .140
506
Pearson Chi-SquareContinuity Correctiona
Likelihood RatioFisher's Exact TestLinear-by-LinearAssociationN of Valid Cases
Value dfAsymp. Sig.
(2-sided)Exact Sig.(2-sided)
Exact Sig.(1-sided)
Computed only for a 2x2 tablea.
0 cells (.0%) have expected count less than 5. The minimum expected count is 55.69.b.
Symmetric Measures
.066 .045 1.477 .140c
.066 .045 1.477 .140c
506
Pearson's RInterval by IntervalSpearman CorrelationOrdinal by Ordinal
N of Valid Cases
ValueAsymp.
Std. Errora Approx. Tb Approx. Sig.
Not assuming the null hypothesis.a.
Using the asymptotic standard error assuming the null hypothesis.b.
Based on normal approximation.c.
Appendix F: 2001 AU Image Survey Results by GenderPage F - 15

16. I Learn About Alabama Universities From Magazines.(by Gender)
Crosstab
% within Gender
69.6% 66.8% 68.6%
30.4% 33.2% 31.4%100.0% 100.0% 100.0%
No
Yes
Learn about Stateuniversities frommagazinesTotal
Female MaleGender
Total
Chi-Square Tests
.437b 1 .508
.317 1 .574
.436 1 .509.554 .286
.436 1 .509
506
Pearson Chi-SquareContinuity Correctiona
Likelihood RatioFisher's Exact TestLinear-by-LinearAssociationN of Valid Cases
Value dfAsymp. Sig.
(2-sided)Exact Sig.(2-sided)
Exact Sig.(1-sided)
Computed only for a 2x2 tablea.
0 cells (.0%) have expected count less than 5. The minimum expected count is 60.65.b.
Symmetric Measures
.029 .045 .660 .509c
.029 .045 .660 .509c
506
Pearson's RInterval by IntervalSpearman CorrelationOrdinal by Ordinal
N of Valid Cases
ValueAsymp.
Std. Errora Approx. Tb Approx. Sig.
Not assuming the null hypothesis.a.
Using the asymptotic standard error assuming the null hypothesis.b.
Based on normal approximation.c.
Appendix F: 2001 AU Image Survey Results by GenderPage F - 16

17. I Learn About Alabama Universities From Television.(by Gender)
Crosstab
% within Gender
43.1% 43.5% 43.3%56.9% 56.5% 56.7%
100.0% 100.0% 100.0%
NoYes
Learn about Stateuniversities from T.V.Total
Female MaleGender
Total
Chi-Square Tests
.007b 1 .931
.000 1 1.000
.007 1 .9311.000 .502
.007 1 .931
506
Pearson Chi-SquareContinuity Correctiona
Likelihood RatioFisher's Exact TestLinear-by-LinearAssociationN of Valid Cases
Value dfAsymp. Sig.
(2-sided)Exact Sig.(2-sided)
Exact Sig.(1-sided)
Computed only for a 2x2 tablea.
0 cells (.0%) have expected count less than 5. The minimum expected count is 83.53.b.
Symmetric Measures
-.004 .044 -.086 .931c
-.004 .044 -.086 .931c
506
Pearson's RInterval by IntervalSpearman CorrelationOrdinal by Ordinal
N of Valid Cases
ValueAsymp.
Std. Errora Approx. Tb Approx. Sig.
Not assuming the null hypothesis.a.
Using the asymptotic standard error assuming the null hypothesis.b.
Based on normal approximation.c.
Appendix F: 2001 AU Image Survey Results by GenderPage F - 17

18. I Learn About Alabama Universities From the Internet. (by Gender)
Crosstab
% within Gender
66.8% 64.2% 65.8%
33.2% 35.8% 34.2%100.0% 100.0% 100.0%
No
Yes
Learn about Stateuniversities fromthe InternetTotal
Female MaleGender
Total
Chi-Square Tests
.338b 1 .561
.235 1 .628
.337 1 .561.564 .313
.337 1 .561
506
Pearson Chi-SquareContinuity Correctiona
Likelihood RatioFisher's Exact TestLinear-by-LinearAssociationN of Valid Cases
Value dfAsymp. Sig.
(2-sided)Exact Sig.(2-sided)
Exact Sig.(1-sided)
Computed only for a 2x2 tablea.
0 cells (.0%) have expected count less than 5. The minimum expected count is 65.99.b.
Symmetric Measures
.026 .045 .581 .562c
.026 .045 .581 .562c
506
Pearson's RInterval by IntervalSpearman CorrelationOrdinal by Ordinal
N of Valid Cases
ValueAsymp.
Std. Errora Approx. Tb Approx. Sig.
Not assuming the null hypothesis.a.
Using the asymptotic standard error assuming the null hypothesis.b.
Based on normal approximation.c.
Appendix F: 2001 AU Image Survey Results by GenderPage F - 18

19. I Learn About Alabama Universities From Alumni. (by Gender)
Crosstab
% within Gender
67.4% 67.4% 67.4%32.6% 32.6% 32.6%
100.0% 100.0% 100.0%
NoYes
Learn about Stateuniversities from alumniTotal
Female MaleGender
Total
Chi-Square Tests
.000b 1 .990
.000 1 1.000
.000 1 .9901.000 .533
.000 1 .990
506
Pearson Chi-SquareContinuity Correctiona
Likelihood RatioFisher's Exact TestLinear-by-LinearAssociationN of Valid Cases
Value dfAsymp. Sig.
(2-sided)Exact Sig.(2-sided)
Exact Sig.(1-sided)
Computed only for a 2x2 tablea.
0 cells (.0%) have expected count less than 5. The minimum expected count is 62.93.b.
Symmetric Measures
.001 .044 .013 .990c
.001 .044 .013 .990c
506
Pearson's RInterval by IntervalSpearman CorrelationOrdinal by Ordinal
N of Valid Cases
ValueAsymp.
Std. Errora Approx. Tb Approx. Sig.
Not assuming the null hypothesis.a.
Using the asymptotic standard error assuming the null hypothesis.b.
Based on normal approximation.c.
Appendix F: 2001 AU Image Survey Results by GenderPage F - 19

20. I Learn About Alabama Universities From Students.(by Gender)
Crosstab
% within Gender
63.9% 64.2% 64.0%36.1% 35.8% 36.0%
100.0% 100.0% 100.0%
NoYes
Learn about Stateuniversities from studentsTotal
Female MaleGender
Total
Chi-Square Tests
.006b 1 .936
.000 1 1.000
.006 1 .9361.000 .507
.006 1 .936
506
Pearson Chi-SquareContinuity Correctiona
Likelihood RatioFisher's Exact TestLinear-by-LinearAssociationN of Valid Cases
Value dfAsymp. Sig.
(2-sided)Exact Sig.(2-sided)
Exact Sig.(1-sided)
Computed only for a 2x2 tablea.
0 cells (.0%) have expected count less than 5. The minimum expected count is 69.42.b.
Symmetric Measures
-.004 .044 -.080 .936c
-.004 .044 -.080 .936c
506
Pearson's RInterval by IntervalSpearman CorrelationOrdinal by Ordinal
N of Valid Cases
ValueAsymp.
Std. Errora Approx. Tb Approx. Sig.
Not assuming the null hypothesis.a.
Using the asymptotic standard error assuming the null hypothesis.b.
Based on normal approximation.c.
Appendix F: 2001 AU Image Survey Results by GenderPage F - 20

21. I Learn About Alabama Universities From My Co-workers.(by Gender)
Crosstab
% within Gender
70.0% 71.5% 70.6%
30.0% 28.5% 29.4%100.0% 100.0% 100.0%
No
Yes
Learn about Stateuniversities fromco-workersTotal
Female MaleGender
Total
Chi-Square Tests
.135b 1 .713
.072 1 .789
.136 1 .713.764 .396
.135 1 .713
506
Pearson Chi-SquareContinuity Correctiona
Likelihood RatioFisher's Exact TestLinear-by-LinearAssociationN of Valid Cases
Value dfAsymp. Sig.
(2-sided)Exact Sig.(2-sided)
Exact Sig.(1-sided)
Computed only for a 2x2 tablea.
0 cells (.0%) have expected count less than 5. The minimum expected count is 56.83.b.
Symmetric Measures
-.016 .044 -.367 .714c
-.016 .044 -.367 .714c
506
Pearson's RInterval by IntervalSpearman CorrelationOrdinal by Ordinal
N of Valid Cases
ValueAsymp.
Std. Errora Approx. Tb Approx. Sig.
Not assuming the null hypothesis.a.
Using the asymptotic standard error assuming the null hypothesis.b.
Based on normal approximation.c.
Appendix F: 2001 AU Image Survey Results by GenderPage F - 21

22. I Learn About Alabama Universities From Other Sources.(by Gender)
Crosstab
% within Gender
83.1% 86.0% 84.2%16.9% 14.0% 15.8%
100.0% 100.0% 100.0%
NoYes
Learn about Stateuniversities from otherTotal
Female MaleGender
Total
Chi-Square Tests
.777b 1 .378
.572 1 .450
.787 1 .375.452 .226
.775 1 .379
506
Pearson Chi-SquareContinuity Correctiona
Likelihood RatioFisher's Exact TestLinear-by-LinearAssociationN of Valid Cases
Value dfAsymp. Sig.
(2-sided)Exact Sig.(2-sided)
Exact Sig.(1-sided)
Computed only for a 2x2 tablea.
0 cells (.0%) have expected count less than 5. The minimum expected count is 30.51.b.
Symmetric Measures
-.039 .044 -.880 .379c
-.039 .044 -.880 .379c
506
Pearson's RInterval by IntervalSpearman CorrelationOrdinal by Ordinal
N of Valid Cases
ValueAsymp.
Std. Errora Approx. Tb Approx. Sig.
Not assuming the null hypothesis.a.
Using the asymptotic standard error assuming the null hypothesis.b.
Based on normal approximation.c.
Appendix F: 2001 AU Image Survey Results by GenderPage F - 22

23. I Saw a Television Announcement About Auburn University Research.(by Gender)
Crosstab
% within Gender
54.0% 47.2% 51.4%
46.0% 52.8% 48.6%100.0% 100.0% 100.0%
No
Yes
Seen any T.V.announcements aboutAuburn researchTotal
Female MaleGender
Total
Chi-Square Tests
2.238b 1 .1351.973 1 .1602.239 1 .135
.144 .080
2.234 1 .135
506
Pearson Chi-SquareContinuity Correctiona
Likelihood RatioFisher's Exact TestLinear-by-LinearAssociationN of Valid Cases
Value dfAsymp. Sig.
(2-sided)Exact Sig.(2-sided)
Exact Sig.(1-sided)
Computed only for a 2x2 tablea.
0 cells (.0%) have expected count less than 5. The minimum expected count is 93.83.b.
Symmetric Measures
.067 .044 1.496 .135c
.067 .044 1.496 .135c
506
Pearson's RInterval by IntervalSpearman CorrelationOrdinal by Ordinal
N of Valid Cases
ValueAsymp.
Std. Errora Approx. Tb Approx. Sig.
Not assuming the null hypothesis.a.
Using the asymptotic standard error assuming the null hypothesis.b.
Based on normal approximation.c.
Appendix F: 2001 AU Image Survey Results by GenderPage F - 23

24. I Am Aware That Auburn University Developed A New Bulletproof Vest.(by Gender)
Crosstab
% within Gender
78.0% 69.9% 74.9%22.0% 30.1% 25.1%
100.0% 100.0% 100.0%
NoYes
Aware Auburn developednew bulletproof vestTotal
Female MaleGender
Total
Chi-Square Tests
4.072b 1 .0443.657 1 .0564.018 1 .045
.046 .028
4.063 1 .044
506
Pearson Chi-SquareContinuity Correctiona
Likelihood RatioFisher's Exact TestLinear-by-LinearAssociationN of Valid Cases
Value dfAsymp. Sig.
(2-sided)Exact Sig.(2-sided)
Exact Sig.(1-sided)
Computed only for a 2x2 tablea.
0 cells (.0%) have expected count less than 5. The minimum expected count is 48.44.b.
Symmetric Measures
.090 .045 2.022 .044c
.090 .045 2.022 .044c
506
Pearson's RInterval by IntervalSpearman CorrelationOrdinal by Ordinal
N of Valid Cases
ValueAsymp.
Std. Errora Approx. Tb Approx. Sig.
Not assuming the null hypothesis.a.
Using the asymptotic standard error assuming the null hypothesis.b.
Based on normal approximation.c.
Appendix F: 2001 AU Image Survey Results by GenderPage F - 24

25. The Bulletproof Vest Research is Significant. (by Gender)
Crosstab
% within Gender
2.9% 3.4% 3.1%97.1% 96.6% 96.9%
100.0% 100.0% 100.0%
NoYes
Is the bulletproof vestresearch significantTotal
Female MaleGender
Total
Chi-Square Tests
.031b 1 .860
.000 1 1.000
.031 1 .8601.000 .622
.031 1 .860
127
Pearson Chi-SquareContinuity Correctiona
Likelihood RatioFisher's Exact TestLinear-by-LinearAssociationN of Valid Cases
Value dfAsymp. Sig.
(2-sided)Exact Sig.(2-sided)
Exact Sig.(1-sided)
Computed only for a 2x2 tablea.
2 cells (50.0%) have expected count less than 5. The minimum expected count is 1.83.b.
Symmetric Measures
-.016 .089 -.175 .861c
-.016 .089 -.175 .861c
127
Pearson's RInterval by IntervalSpearman CorrelationOrdinal by Ordinal
N of Valid Cases
ValueAsymp.
Std. Errora Approx. Tb Approx. Sig.
Not assuming the null hypothesis.a.
Using the asymptotic standard error assuming the null hypothesis.b.
Based on normal approximation.c.
Appendix F: 2001 AU Image Survey Results by GenderPage F - 25

26. I Saw a Television Announcement About the Bulletproof Vest.(by Gender)
Crosstab
% within Gender
60.9% 48.3% 55.1%39.1% 51.7% 44.9%
100.0% 100.0% 100.0%
NoYes
Seen T.V. announcementabout bulletproof vestTotal
Female MaleGender
Total
Chi-Square Tests
2.020b 1 .1551.543 1 .2142.023 1 .155
.210 .107
2.004 1 .157
127
Pearson Chi-SquareContinuity Correctiona
Likelihood RatioFisher's Exact TestLinear-by-LinearAssociationN of Valid Cases
Value dfAsymp. Sig.
(2-sided)Exact Sig.(2-sided)
Exact Sig.(1-sided)
Computed only for a 2x2 tablea.
0 cells (.0%) have expected count less than 5. The minimum expected count is 26.03.b.
Symmetric Measures
.126 .088 1.421 .158c
.126 .088 1.421 .158c
127
Pearson's RInterval by IntervalSpearman CorrelationOrdinal by Ordinal
N of Valid Cases
ValueAsymp.
Std. Errora Approx. Tb Approx. Sig.
Not assuming the null hypothesis.a.
Using the asymptotic standard error assuming the null hypothesis.b.
Based on normal approximation.c.
Appendix F: 2001 AU Image Survey Results by GenderPage F - 26

27. The Bulletproof Vest Announcement Should Be Continued.(by Gender)
Crosstab
% within Gender
7.4% 6.7% 7.0%
92.6% 93.3% 93.0%100.0% 100.0% 100.0%
No
Yes
Should bulletproofvest announcementbe continuedTotal
Female MaleGender
Total
Chi-Square Tests
.012b 1 .913
.000 1 1.000
.012 1 .9131.000 .653
.012 1 .914
57
Pearson Chi-SquareContinuity Correctiona
Likelihood RatioFisher's Exact TestLinear-by-LinearAssociationN of Valid Cases
Value dfAsymp. Sig.
(2-sided)Exact Sig.(2-sided)
Exact Sig.(1-sided)
Computed only for a 2x2 tablea.
2 cells (50.0%) have expected count less than 5. The minimum expected count is 1.89.b.
Symmetric Measures
.014 .133 .107 .915c
.014 .133 .107 .915c
57
Pearson's RInterval by IntervalSpearman CorrelationOrdinal by Ordinal
N of Valid Cases
ValueAsymp.
Std. Errora Approx. Tb Approx. Sig.
Not assuming the null hypothesis.a.
Using the asymptotic standard error assuming the null hypothesis.b.
Based on normal approximation.c.
Appendix F: 2001 AU Image Survey Results by GenderPage F - 27

28. I Am Aware That Auburn University Developed New Airbags.(by Gender)
Crosstab
% within Gender
79.9% 75.6% 78.3%20.1% 24.4% 21.7%
100.0% 100.0% 100.0%
NoYes
Aware Auburndeveloped new airbagsTotal
Female MaleGender
Total
Chi-Square Tests
1.252b 1 .2631.016 1 .3131.240 1 .265
.269 .157
1.250 1 .264
506
Pearson Chi-SquareContinuity Correctiona
Likelihood RatioFisher's Exact TestLinear-by-LinearAssociationN of Valid Cases
Value dfAsymp. Sig.
(2-sided)Exact Sig.(2-sided)
Exact Sig.(1-sided)
Computed only for a 2x2 tablea.
0 cells (.0%) have expected count less than 5. The minimum expected count is 41.96.b.
Symmetric Measures
.050 .045 1.118 .264c
.050 .045 1.118 .264c
506
Pearson's RInterval by IntervalSpearman CorrelationOrdinal by Ordinal
N of Valid Cases
ValueAsymp.
Std. Errora Approx. Tb Approx. Sig.
Not assuming the null hypothesis.a.
Using the asymptotic standard error assuming the null hypothesis.b.
Based on normal approximation.c.
Appendix F: 2001 AU Image Survey Results by GenderPage F - 28

29. The Airbag Research is Significant. (by Gender)
Crosstab
% within Gender
4.8% 2.1% 3.6%95.2% 97.9% 96.4%
100.0% 100.0% 100.0%
NoYes
Is the airbag researchsignificantTotal
Female MaleGender
Total
Chi-Square Tests
.533b 1 .465
.046 1 .830
.565 1 .452.634 .426
.528 1 .467
110
Pearson Chi-SquareContinuity Correctiona
Likelihood RatioFisher's Exact TestLinear-by-LinearAssociationN of Valid Cases
Value dfAsymp. Sig.
(2-sided)Exact Sig.(2-sided)
Exact Sig.(1-sided)
Computed only for a 2x2 tablea.
2 cells (50.0%) have expected count less than 5. The minimum expected count is 1.71.b.
Symmetric Measures
.070 .085 .725 .470c
.070 .085 .725 .470c
110
Pearson's RInterval by IntervalSpearman CorrelationOrdinal by Ordinal
N of Valid Cases
ValueAsymp.
Std. Errora Approx. Tb Approx. Sig.
Not assuming the null hypothesis.a.
Using the asymptotic standard error assuming the null hypothesis.b.
Based on normal approximation.c.
Appendix F: 2001 AU Image Survey Results by GenderPage F - 29

Crosstab
% within Gender
58.7% 55.3% 57.3%41.3% 44.7% 42.7%
100.0% 100.0% 100.0%
NoYes
Seen T.V. announcementabout airbagsTotal
Female MaleGender
Total
Appendix F: 2001 AU Image Survey Results by GenderPage F - 30

30. I Saw the Television Announcement About Auburn University's AirbagResearch.
(by Gender)
Chi-Square Tests
.128b 1 .721
.027 1 .871
.128 1 .721.846 .435
.127 1 .722
110
Pearson Chi-SquareContinuity Correctiona
Likelihood RatioFisher's Exact TestLinear-by-LinearAssociationN of Valid Cases
Value dfAsymp. Sig.
(2-sided)Exact Sig.(2-sided)
Exact Sig.(1-sided)
Computed only for a 2x2 tablea.
0 cells (.0%) have expected count less than 5. The minimum expected count is 20.08.b.
Symmetric Measures
.034 .095 .355 .724c
.034 .095 .355 .724c
110
Pearson's RInterval by IntervalSpearman CorrelationOrdinal by Ordinal
N of Valid Cases
ValueAsymp.
Std. Errora Approx. Tb Approx. Sig.
Not assuming the null hypothesis.a.
Using the asymptotic standard error assuming the null hypothesis.b.
Based on normal approximation.c.
Appendix F: 2001 AU Image Survey Results by GenderPage F - 31

31. The Airbag Announcement Should Be Continued.(by Gender)
Crosstab
% within Gender
7.7% 9.5% 8.5%
92.3% 90.5% 91.5%100.0% 100.0% 100.0%
No
Yes
Should airbagannouncementbe continuedTotal
Female MaleGender
Total
Chi-Square Tests
.050b 1 .823
.000 1 1.000
.050 1 .8231.000 .610
.049 1 .825
47
Pearson Chi-SquareContinuity Correctiona
Likelihood RatioFisher's Exact TestLinear-by-LinearAssociationN of Valid Cases
Value dfAsymp. Sig.
(2-sided)Exact Sig.(2-sided)
Exact Sig.(1-sided)
Computed only for a 2x2 tablea.
2 cells (50.0%) have expected count less than 5. The minimum expected count is 1.79.b.
Symmetric Measures
-.033 .147 -.219 .828c
-.033 .147 -.219 .828c
47
Pearson's RInterval by IntervalSpearman CorrelationOrdinal by Ordinal
N of Valid Cases
ValueAsymp.
Std. Errora Approx. Tb Approx. Sig.
Not assuming the null hypothesis.a.
Using the asymptotic standard error assuming the null hypothesis.b.
Based on normal approximation.c.
Appendix F: 2001 AU Image Survey Results by GenderPage F - 32

32. I Am Aware That Auburn University Impacts the Economy.(by Gender)
Crosstab
% within Gender
38.0% 32.1% 35.8%62.0% 67.9% 64.2%
100.0% 100.0% 100.0%
NoYes
Aware Auburn impactsthe economyTotal
Female MaleGender
Total
Chi-Square Tests
1.806b 1 .1791.558 1 .2121.818 1 .178
.183 .106
1.802 1 .179
506
Pearson Chi-SquareContinuity Correctiona
Likelihood RatioFisher's Exact TestLinear-by-LinearAssociationN of Valid Cases
Value dfAsymp. Sig.
(2-sided)Exact Sig.(2-sided)
Exact Sig.(1-sided)
Computed only for a 2x2 tablea.
0 cells (.0%) have expected count less than 5. The minimum expected count is 69.04.b.
Symmetric Measures
.060 .044 1.343 .180c
.060 .044 1.343 .180c
506
Pearson's RInterval by IntervalSpearman CorrelationOrdinal by Ordinal
N of Valid Cases
ValueAsymp.
Std. Errora Approx. Tb Approx. Sig.
Not assuming the null hypothesis.a.
Using the asymptotic standard error assuming the null hypothesis.b.
Based on normal approximation.c.
Appendix F: 2001 AU Image Survey Results by GenderPage F - 33
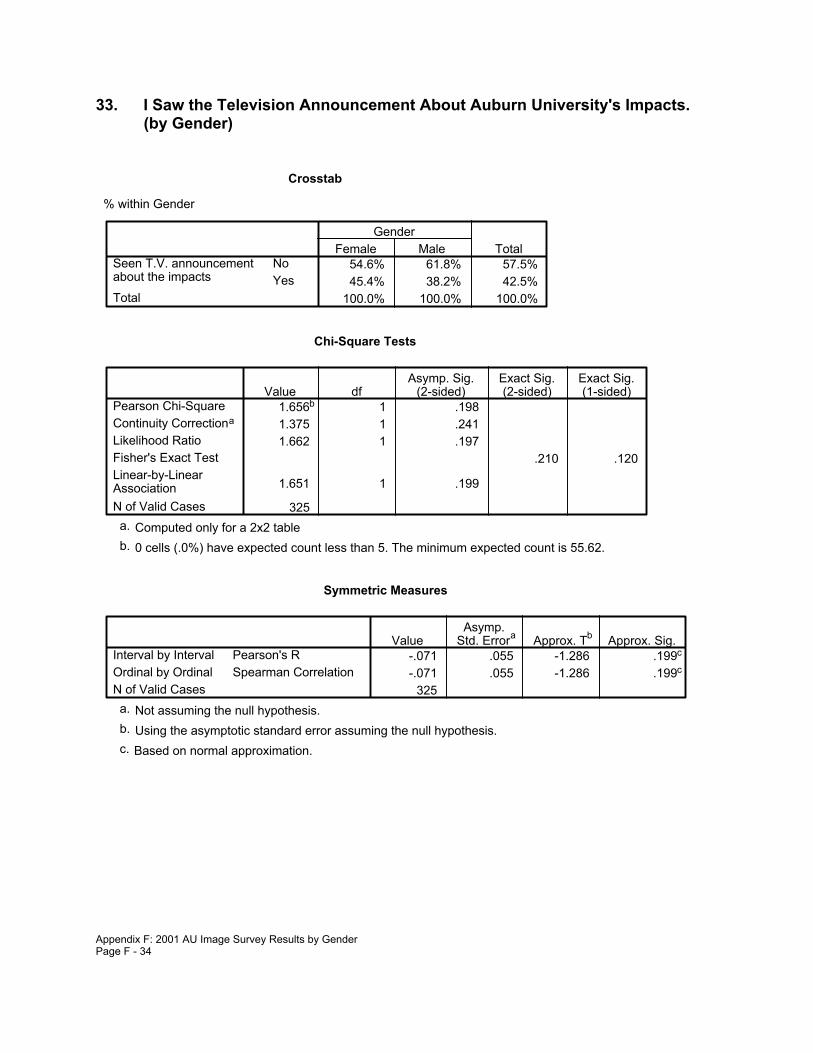
33. I Saw the Television Announcement About Auburn University's Impacts.(by Gender)
Crosstab
% within Gender
54.6% 61.8% 57.5%45.4% 38.2% 42.5%
100.0% 100.0% 100.0%
NoYes
Seen T.V. announcementabout the impactsTotal
Female MaleGender
Total
Chi-Square Tests
1.656b 1 .1981.375 1 .2411.662 1 .197
.210 .120
1.651 1 .199
325
Pearson Chi-SquareContinuity Correctiona
Likelihood RatioFisher's Exact TestLinear-by-LinearAssociationN of Valid Cases
Value dfAsymp. Sig.
(2-sided)Exact Sig.(2-sided)
Exact Sig.(1-sided)
Computed only for a 2x2 tablea.
0 cells (.0%) have expected count less than 5. The minimum expected count is 55.62.b.
Symmetric Measures
-.071 .055 -1.286 .199c
-.071 .055 -1.286 .199c
325
Pearson's RInterval by IntervalSpearman CorrelationOrdinal by Ordinal
N of Valid Cases
ValueAsymp.
Std. Errora Approx. Tb Approx. Sig.
Not assuming the null hypothesis.a.
Using the asymptotic standard error assuming the null hypothesis.b.
Based on normal approximation.c.
Appendix F: 2001 AU Image Survey Results by GenderPage F - 34
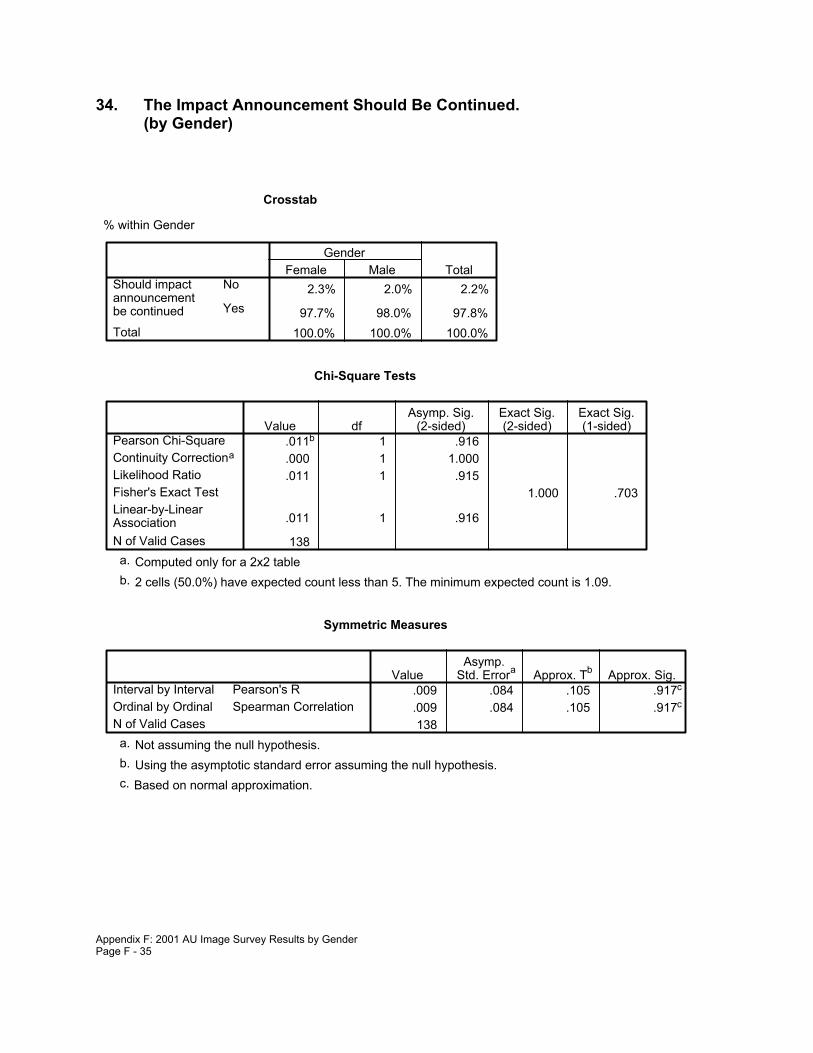
34. The Impact Announcement Should Be Continued.(by Gender)
Crosstab
% within Gender
2.3% 2.0% 2.2%
97.7% 98.0% 97.8%100.0% 100.0% 100.0%
No
Yes
Should impactannouncementbe continuedTotal
Female MaleGender
Total
Chi-Square Tests
.011b 1 .916
.000 1 1.000
.011 1 .9151.000 .703
.011 1 .916
138
Pearson Chi-SquareContinuity Correctiona
Likelihood RatioFisher's Exact TestLinear-by-LinearAssociationN of Valid Cases
Value dfAsymp. Sig.
(2-sided)Exact Sig.(2-sided)
Exact Sig.(1-sided)
Computed only for a 2x2 tablea.
2 cells (50.0%) have expected count less than 5. The minimum expected count is 1.09.b.
Symmetric Measures
.009 .084 .105 .917c
.009 .084 .105 .917c
138
Pearson's RInterval by IntervalSpearman CorrelationOrdinal by Ordinal
N of Valid Cases
ValueAsymp.
Std. Errora Approx. Tb Approx. Sig.
Not assuming the null hypothesis.a.
Using the asymptotic standard error assuming the null hypothesis.b.
Based on normal approximation.c.
Appendix F: 2001 AU Image Survey Results by GenderPage F - 35

35. I Am Aware That Auburn University Improves Highway Construction.(by Gender)
Crosstab
% within Gender
67.1% 57.5% 63.4%32.9% 42.5% 36.6%
100.0% 100.0% 100.0%
NoYes
Aware Auburn improvedhighway constructionTotal
Female MaleGender
Total
Chi-Square Tests
4.724b 1 .0304.320 1 .0384.694 1 .030
.036 .019
4.714 1 .030
506
Pearson Chi-SquareContinuity Correctiona
Likelihood RatioFisher's Exact TestLinear-by-LinearAssociationN of Valid Cases
Value dfAsymp. Sig.
(2-sided)Exact Sig.(2-sided)
Exact Sig.(1-sided)
Computed only for a 2x2 tablea.
0 cells (.0%) have expected count less than 5. The minimum expected count is 70.56.b.
Symmetric Measures
.097 .045 2.179 .030c
.097 .045 2.179 .030c
506
Pearson's RInterval by IntervalSpearman CorrelationOrdinal by Ordinal
N of Valid Cases
ValueAsymp.
Std. Errora Approx. Tb Approx. Sig.
Not assuming the null hypothesis.a.
Using the asymptotic standard error assuming the null hypothesis.b.
Based on normal approximation.c.
Appendix F: 2001 AU Image Survey Results by GenderPage F - 36

36. The Highway Construction Research is Significant.(by Gender)
Crosstab
% within Gender
2.9% 1.2% 2.2%
97.1% 98.8% 97.8%100.0% 100.0% 100.0%
No
Yes
Is the highwayconstructionresearch significantTotal
Female MaleGender
Total
Chi-Square Tests
.619b 1 .432
.077 1 .781
.656 1 .418.631 .401
.615 1 .433
185
Pearson Chi-SquareContinuity Correctiona
Likelihood RatioFisher's Exact TestLinear-by-LinearAssociationN of Valid Cases
Value dfAsymp. Sig.
(2-sided)Exact Sig.(2-sided)
Exact Sig.(1-sided)
Computed only for a 2x2 tablea.
2 cells (50.0%) have expected count less than 5. The minimum expected count is 1.77.b.
Symmetric Measures
.058 .066 .784 .434c
.058 .066 .784 .434c
185
Pearson's RInterval by IntervalSpearman CorrelationOrdinal by Ordinal
N of Valid Cases
ValueAsymp.
Std. Errora Approx. Tb Approx. Sig.
Not assuming the null hypothesis.a.
Using the asymptotic standard error assuming the null hypothesis.b.
Based on normal approximation.c.
Appendix F: 2001 AU Image Survey Results by GenderPage F - 37

37. I Am Aware That Auburn University Fisheries Sustains One of the World's Leading Food Sources. (by Gender)
Crosstab
% within Gender
45.7% 30.1% 39.7%54.3% 69.9% 60.3%
100.0% 100.0% 100.0%
NoYes
Aware Auburn fisheriessustains food sourcesTotal
Female MaleGender
Total
Chi-Square Tests
12.189b 1 .00011.544 1 .00112.395 1 .000
.001 .000
12.165 1 .000
506
Pearson Chi-SquareContinuity Correctiona
Likelihood RatioFisher's Exact TestLinear-by-LinearAssociationN of Valid Cases
Value dfAsymp. Sig.
(2-sided)Exact Sig.(2-sided)
Exact Sig.(1-sided)
Computed only for a 2x2 tablea.
0 cells (.0%) have expected count less than 5. The minimum expected count is 76.67.b.
Symmetric Measures
.155 .043 3.527 .000c
.155 .043 3.527 .000c
506
Pearson's RInterval by IntervalSpearman CorrelationOrdinal by Ordinal
N of Valid Cases
ValueAsymp.
Std. Errora Approx. Tb Approx. Sig.
Not assuming the null hypothesis.a.
Using the asymptotic standard error assuming the null hypothesis.b.
Based on normal approximation.c.
Appendix F: 2001 AU Image Survey Results by GenderPage F - 38

38. The Fisheries Research is Significant. (by Gender)
Crosstab
% within Gender
1.2% 2.2% 1.6%98.8% 97.8% 98.4%
100.0% 100.0% 100.0%
NoYes
Is the fisheries researchsignificantTotal
Female MaleGender
Total
Chi-Square Tests
.510b 1 .475
.068 1 .795
.507 1 .477.658 .393
.509 1 .476
305
Pearson Chi-SquareContinuity Correctiona
Likelihood RatioFisher's Exact TestLinear-by-LinearAssociationN of Valid Cases
Value dfAsymp. Sig.
(2-sided)Exact Sig.(2-sided)
Exact Sig.(1-sided)
Computed only for a 2x2 tablea.
2 cells (50.0%) have expected count less than 5. The minimum expected count is 2.21.b.
Symmetric Measures
-.041 .057 -.713 .477c
-.041 .057 -.713 .477c
305
Pearson's RInterval by IntervalSpearman CorrelationOrdinal by Ordinal
N of Valid Cases
ValueAsymp.
Std. Errora Approx. Tb Approx. Sig.
Not assuming the null hypothesis.a.
Using the asymptotic standard error assuming the null hypothesis.b.
Based on normal approximation.c.
Appendix F: 2001 AU Image Survey Results by GenderPage F - 39

39. I Am Aware That Auburn University Architecture Students BuildLow-Income Housing in West Alabama. (by Gender)
Crosstab
% within Gender
65.5% 71.0% 67.6%
34.5% 29.0% 32.4%100.0% 100.0% 100.0%
No
Yes
Aware architecturestudents build housingin West AlabamaTotal
Female MaleGender
Total
Chi-Square Tests
1.642b 1 .2001.401 1 .2371.655 1 .198
.206 .118
1.639 1 .200
506
Pearson Chi-SquareContinuity Correctiona
Likelihood RatioFisher's Exact TestLinear-by-LinearAssociationN of Valid Cases
Value dfAsymp. Sig.
(2-sided)Exact Sig.(2-sided)
Exact Sig.(1-sided)
Computed only for a 2x2 tablea.
0 cells (.0%) have expected count less than 5. The minimum expected count is 62.55.b.
Symmetric Measures
-.057 .044 -1.281 .201c
-.057 .044 -1.281 .201c
506
Pearson's RInterval by IntervalSpearman CorrelationOrdinal by Ordinal
N of Valid Cases
ValueAsymp.
Std. Errora Approx. Tb Approx. Sig.
Not assuming the null hypothesis.a.
Using the asymptotic standard error assuming the null hypothesis.b.
Based on normal approximation.c.
Appendix F: 2001 AU Image Survey Results by GenderPage F - 40

40. The Low-Income Housing Program in West Alabama Should Be Continued.(by Gender)
Crosstab
% within Gender
2.8% 3.6% 3.0%97.2% 96.4% 97.0%
100.0% 100.0% 100.0%
NoYes
Should housing programbe continuedTotal
Female MaleGender
Total
Chi-Square Tests
.079b 1 .779
.000 1 1.000
.077 1 .7821.000 .557
.078 1 .780
164
Pearson Chi-SquareContinuity Correctiona
Likelihood RatioFisher's Exact TestLinear-by-LinearAssociationN of Valid Cases
Value dfAsymp. Sig.
(2-sided)Exact Sig.(2-sided)
Exact Sig.(1-sided)
Computed only for a 2x2 tablea.
2 cells (50.0%) have expected count less than 5. The minimum expected count is 1.71.b.
Symmetric Measures
-.022 .081 -.279 .781c
-.022 .081 -.279 .781c
164
Pearson's RInterval by IntervalSpearman CorrelationOrdinal by Ordinal
N of Valid Cases
ValueAsymp.
Std. Errora Approx. Tb Approx. Sig.
Not assuming the null hypothesis.a.
Using the asymptotic standard error assuming the null hypothesis.b.
Based on normal approximation.c.
Appendix F: 2001 AU Image Survey Results by GenderPage F - 41

41. I Am Aware of Auburn University's Continuing Education Programs.(by Gender)
Crosstab
% within Gender
28.4% 30.1% 29.1%
71.6% 69.9% 70.9%100.0% 100.0% 100.0%
No
Yes
Aware of Auburncontinuingeducation programsTotal
Female MaleGender
Total
Chi-Square Tests
.152b 1 .697
.083 1 .773
.151 1 .697.762 .385
.151 1 .697
506
Pearson Chi-SquareContinuity Correctiona
Likelihood RatioFisher's Exact TestLinear-by-LinearAssociationN of Valid Cases
Value dfAsymp. Sig.
(2-sided)Exact Sig.(2-sided)
Exact Sig.(1-sided)
Computed only for a 2x2 tablea.
0 cells (.0%) have expected count less than 5. The minimum expected count is 56.07.b.
Symmetric Measures
-.017 .045 -.389 .698c
-.017 .045 -.389 .698c
506
Pearson's RInterval by IntervalSpearman CorrelationOrdinal by Ordinal
N of Valid Cases
ValueAsymp.
Std. Errora Approx. Tb Approx. Sig.
Not assuming the null hypothesis.a.
Using the asymptotic standard error assuming the null hypothesis.b.
Based on normal approximation.c.
Appendix F: 2001 AU Image Survey Results by GenderPage F - 42

42. I Have Participated in a Continuing Education Program Offered byAuburn University. (by Gender)
Crosstab
% within Gender
85.7% 85.2% 85.5%
14.3% 14.8% 14.5%100.0% 100.0% 100.0%
No
Yes
Have taken anycontinuingeducation programsTotal
Female MaleGender
Total
Chi-Square Tests
.019b 1 .890
.000 1 1.000
.019 1 .890.878 .503
.019 1 .890
359
Pearson Chi-SquareContinuity Correctiona
Likelihood RatioFisher's Exact TestLinear-by-LinearAssociationN of Valid Cases
Value dfAsymp. Sig.
(2-sided)Exact Sig.(2-sided)
Exact Sig.(1-sided)
Computed only for a 2x2 tablea.
0 cells (.0%) have expected count less than 5. The minimum expected count is 19.55.b.
Symmetric Measures
.007 .053 .138 .891c
.007 .053 .138 .891c
359
Pearson's RInterval by IntervalSpearman CorrelationOrdinal by Ordinal
N of Valid Cases
ValueAsymp.
Std. Errora Approx. Tb Approx. Sig.
Not assuming the null hypothesis.a.
Using the asymptotic standard error assuming the null hypothesis.b.
Based on normal approximation.c.
Appendix F: 2001 AU Image Survey Results by GenderPage F - 43

43. I Am Aware of Auburn University's Partnerships With Local Schools.(by Gender)
Crosstab
% within Gender
65.5% 68.9% 66.8%
34.5% 31.1% 33.2%100.0% 100.0% 100.0%
No
Yes
Aware of Auburnpartnerships withlocal schoolsTotal
Female MaleGender
Total
Chi-Square Tests
.628b 1 .428
.484 1 .487
.631 1 .427.439 .244
.627 1 .428
506
Pearson Chi-SquareContinuity Correctiona
Likelihood RatioFisher's Exact TestLinear-by-LinearAssociationN of Valid Cases
Value dfAsymp. Sig.
(2-sided)Exact Sig.(2-sided)
Exact Sig.(1-sided)
Computed only for a 2x2 tablea.
0 cells (.0%) have expected count less than 5. The minimum expected count is 64.08.b.
Symmetric Measures
-.035 .044 -.792 .429c
-.035 .044 -.792 .429c
506
Pearson's RInterval by IntervalSpearman CorrelationOrdinal by Ordinal
N of Valid Cases
ValueAsymp.
Std. Errora Approx. Tb Approx. Sig.
Not assuming the null hypothesis.a.
Using the asymptotic standard error assuming the null hypothesis.b.
Based on normal approximation.c.
Appendix F: 2001 AU Image Survey Results by GenderPage F - 44

44. The School Partnerships Should Be Continued. (by Gender)
Crosstab
% within Gender
1.7% .6%100.0% 98.3% 99.4%100.0% 100.0% 100.0%
NoYes
Should partnershipsbe continuedTotal
Female MaleGender
Total
Chi-Square Tests
1.811b 1 .178.089 1 .765
2.070 1 .150.357 .357
1.800 1 .180
168
Pearson Chi-SquareContinuity Correctiona
Likelihood RatioFisher's Exact TestLinear-by-LinearAssociationN of Valid Cases
Value dfAsymp. Sig.
(2-sided)Exact Sig.(2-sided)
Exact Sig.(1-sided)
Computed only for a 2x2 tablea.
2 cells (50.0%) have expected count less than 5. The minimum expected count is .36.b.
Symmetric Measures
-.104 .052 -1.345 .180c
-.104 .052 -1.345 .180c
168
Pearson's RInterval by IntervalSpearman CorrelationOrdinal by Ordinal
N of Valid Cases
ValueAsymp.
Std. Errora Approx. Tb Approx. Sig.
Not assuming the null hypothesis.a.
Using the asymptotic standard error assuming the null hypothesis.b.
Based on normal approximation.c.
Appendix F: 2001 AU Image Survey Results by GenderPage F - 45

45. My Local School District Would Benefit From a Partnership.(by Gender)
Crosstab
% within Gender
14.4% 12.4% 13.6%
85.6% 87.6% 86.4%100.0% 100.0% 100.0%
No
Yes
Would local schooldistrict benefit frompartnershipTotal
Female MaleGender
Total
Chi-Square Tests
.382b 1 .536
.235 1 .628
.386 1 .534.595 .316
.381 1 .537
506
Pearson Chi-SquareContinuity Correctiona
Likelihood RatioFisher's Exact TestLinear-by-LinearAssociationN of Valid Cases
Value dfAsymp. Sig.
(2-sided)Exact Sig.(2-sided)
Exact Sig.(1-sided)
Computed only for a 2x2 tablea.
0 cells (.0%) have expected count less than 5. The minimum expected count is 26.32.b.
Symmetric Measures
.027 .044 .617 .537c
.027 .044 .617 .537c
506
Pearson's RInterval by IntervalSpearman CorrelationOrdinal by Ordinal
N of Valid Cases
ValueAsymp.
Std. Errora Approx. Tb Approx. Sig.
Not assuming the null hypothesis.a.
Using the asymptotic standard error assuming the null hypothesis.b.
Based on normal approximation.c.
Appendix F: 2001 AU Image Survey Results by GenderPage F - 46

46. I Am Familiar With Auburn University's Cooperative Extension System.(by Gender)
Crosstab
% within Gender
47.9% 44.0% 46.4%52.1% 56.0% 53.6%
100.0% 100.0% 100.0%
NoYes
Familiar with CooperativeExtension SystemTotal
Female MaleGender
Total
Chi-Square Tests
.723b 1 .395
.576 1 .448
.724 1 .395.410 .224
.722 1 .396
506
Pearson Chi-SquareContinuity Correctiona
Likelihood RatioFisher's Exact TestLinear-by-LinearAssociationN of Valid Cases
Value dfAsymp. Sig.
(2-sided)Exact Sig.(2-sided)
Exact Sig.(1-sided)
Computed only for a 2x2 tablea.
0 cells (.0%) have expected count less than 5. The minimum expected count is 89.63.b.
Symmetric Measures
.038 .044 .849 .396c
.038 .044 .849 .396c
506
Pearson's RInterval by IntervalSpearman CorrelationOrdinal by Ordinal
N of Valid Cases
ValueAsymp.
Std. Errora Approx. Tb Approx. Sig.
Not assuming the null hypothesis.a.
Using the asymptotic standard error assuming the null hypothesis.b.
Based on normal approximation.c.
Appendix F: 2001 AU Image Survey Results by GenderPage F - 47
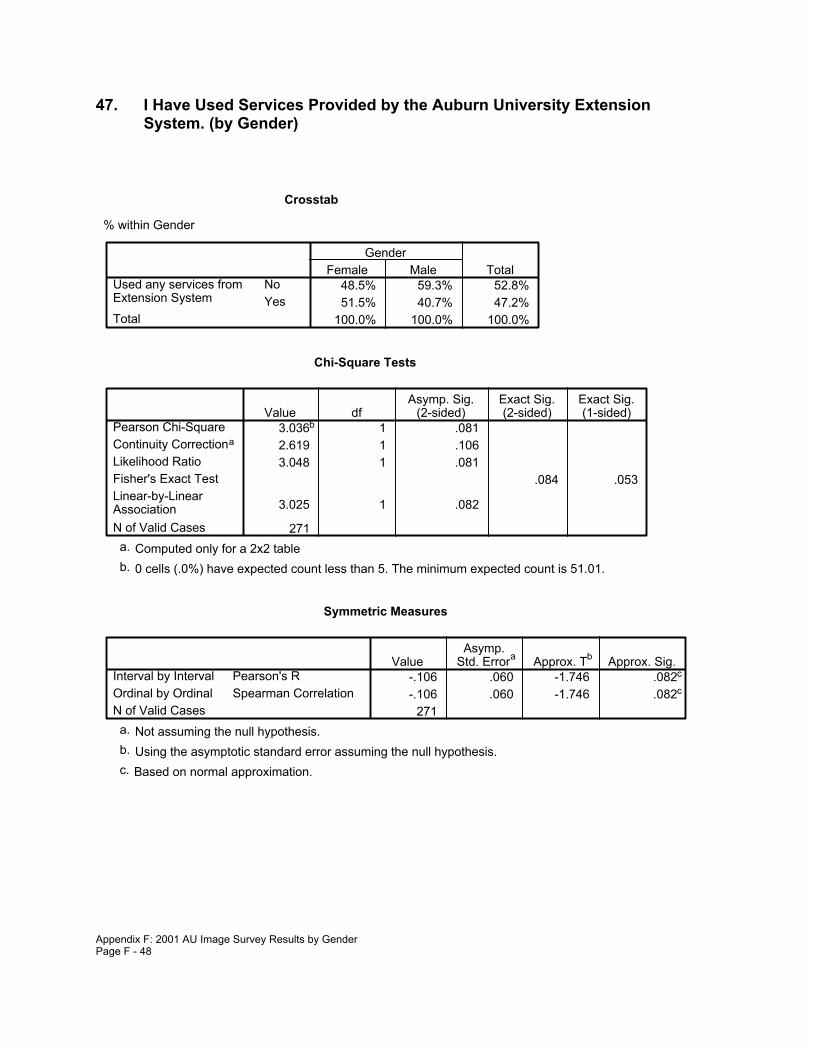
47. I Have Used Services Provided by the Auburn University ExtensionSystem. (by Gender)
Crosstab
% within Gender
48.5% 59.3% 52.8%51.5% 40.7% 47.2%
100.0% 100.0% 100.0%
NoYes
Used any services fromExtension SystemTotal
Female MaleGender
Total
Chi-Square Tests
3.036b 1 .0812.619 1 .1063.048 1 .081
.084 .053
3.025 1 .082
271
Pearson Chi-SquareContinuity Correctiona
Likelihood RatioFisher's Exact TestLinear-by-LinearAssociationN of Valid Cases
Value dfAsymp. Sig.
(2-sided)Exact Sig.(2-sided)
Exact Sig.(1-sided)
Computed only for a 2x2 tablea.
0 cells (.0%) have expected count less than 5. The minimum expected count is 51.01.b.
Symmetric Measures
-.106 .060 -1.746 .082c
-.106 .060 -1.746 .082c
271
Pearson's RInterval by IntervalSpearman CorrelationOrdinal by Ordinal
N of Valid Cases
ValueAsymp.
Std. Errora Approx. Tb Approx. Sig.
Not assuming the null hypothesis.a.
Using the asymptotic standard error assuming the null hypothesis.b.
Based on normal approximation.c.
Appendix F: 2001 AU Image Survey Results by GenderPage F - 48

48. The Cooperative Extension Programs Are Beneficial.(by Gender)
Crosstab
% within Gender
1.2% 2.3% 1.6%98.8% 97.7% 98.4%
100.0% 100.0% 100.0%
NoYes
Are Extension programsbeneficialTotal
Female MaleGender
Total
Chi-Square Tests
.220b 1 .639
.000 1 1.000
.209 1 .6481.000 .571
.218 1 .640
128
Pearson Chi-SquareContinuity Correctiona
Likelihood RatioFisher's Exact TestLinear-by-LinearAssociationN of Valid Cases
Value dfAsymp. Sig.
(2-sided)Exact Sig.(2-sided)
Exact Sig.(1-sided)
Computed only for a 2x2 tablea.
2 cells (50.0%) have expected count less than 5. The minimum expected count is .69.b.
Symmetric Measures
-.041 .094 -.466 .642c
-.041 .094 -.466 .642c
128
Pearson's RInterval by IntervalSpearman CorrelationOrdinal by Ordinal
N of Valid Cases
ValueAsymp.
Std. Errora Approx. Tb Approx. Sig.
Not assuming the null hypothesis.a.
Using the asymptotic standard error assuming the null hypothesis.b.
Based on normal approximation.c.
Appendix F: 2001 AU Image Survey Results by GenderPage F - 49

49. Auburn University Should Offer More Distance Learning Programs.(by Gender)
Crosstab
% within Gender
9.6% 15.0% 11.7%90.4% 85.0% 88.3%
100.0% 100.0% 100.0%
NoYes
Should Auburn offermore distance learningTotal
Female MaleGender
Total
Chi-Square Tests
3.432b 1 .0642.924 1 .0873.351 1 .067
.086 .045
3.425 1 .064
506
Pearson Chi-SquareContinuity Correctiona
Likelihood RatioFisher's Exact TestLinear-by-LinearAssociationN of Valid Cases
Value dfAsymp. Sig.
(2-sided)Exact Sig.(2-sided)
Exact Sig.(1-sided)
Computed only for a 2x2 tablea.
0 cells (.0%) have expected count less than 5. The minimum expected count is 22.50.b.
Symmetric Measures
-.082 .046 -1.855 .064c
-.082 .046 -1.855 .064c
506
Pearson's RInterval by IntervalSpearman CorrelationOrdinal by Ordinal
N of Valid Cases
ValueAsymp.
Std. Errora Approx. Tb Approx. Sig.
Not assuming the null hypothesis.a.
Using the asymptotic standard error assuming the null hypothesis.b.
Based on normal approximation.c.
Appendix F: 2001 AU Image Survey Results by GenderPage F - 50

50. Is Education an Important Issue? (by Gender)
Crosstab
% within Gender
2.6% 3.1% 2.8%97.4% 96.9% 97.2%
100.0% 100.0% 100.0%
NoYes
Is education animportant issueTotal
Female MaleGender
Total
Chi-Square Tests
.136b 1 .713
.008 1 .929
.134 1 .715.783 .456
.135 1 .713
506
Pearson Chi-SquareContinuity Correctiona
Likelihood RatioFisher's Exact TestLinear-by-LinearAssociationN of Valid Cases
Value dfAsymp. Sig.
(2-sided)Exact Sig.(2-sided)
Exact Sig.(1-sided)
Computed only for a 2x2 tablea.
0 cells (.0%) have expected count less than 5. The minimum expected count is 5.34.b.
Symmetric Measures
-.016 .045 -.368 .713c
-.016 .045 -.368 .713c
506
Pearson's RInterval by IntervalSpearman CorrelationOrdinal by Ordinal
N of Valid Cases
ValueAsymp.
Std. Errora Approx. Tb Approx. Sig.
Not assuming the null hypothesis.a.
Using the asymptotic standard error assuming the null hypothesis.b.
Based on normal approximation.c.
Appendix F: 2001 AU Image Survey Results by GenderPage F - 51

51. Is Community and Economic Development an Important Issue?(by Gender)
Crosstab
% within Gender
5.1% 5.2% 5.1%
94.9% 94.8% 94.9%100.0% 100.0% 100.0%
No
Yes
Is community andeconomic developmentan important issueTotal
Female MaleGender
Total
Chi-Square Tests
.001b 1 .973
.000 1 1.000
.001 1 .9731.000 .563
.001 1 .973
506
Pearson Chi-SquareContinuity Correctiona
Likelihood RatioFisher's Exact TestLinear-by-LinearAssociationN of Valid Cases
Value dfAsymp. Sig.
(2-sided)Exact Sig.(2-sided)
Exact Sig.(1-sided)
Computed only for a 2x2 tablea.
0 cells (.0%) have expected count less than 5. The minimum expected count is 9.92.b.
Symmetric Measures
-.002 .045 -.034 .973c
-.002 .045 -.034 .973c
506
Pearson's RInterval by IntervalSpearman CorrelationOrdinal by Ordinal
N of Valid Cases
ValueAsymp.
Std. Errora Approx. Tb Approx. Sig.
Not assuming the null hypothesis.a.
Using the asymptotic standard error assuming the null hypothesis.b.
Based on normal approximation.c.
Appendix F: 2001 AU Image Survey Results by GenderPage F - 52
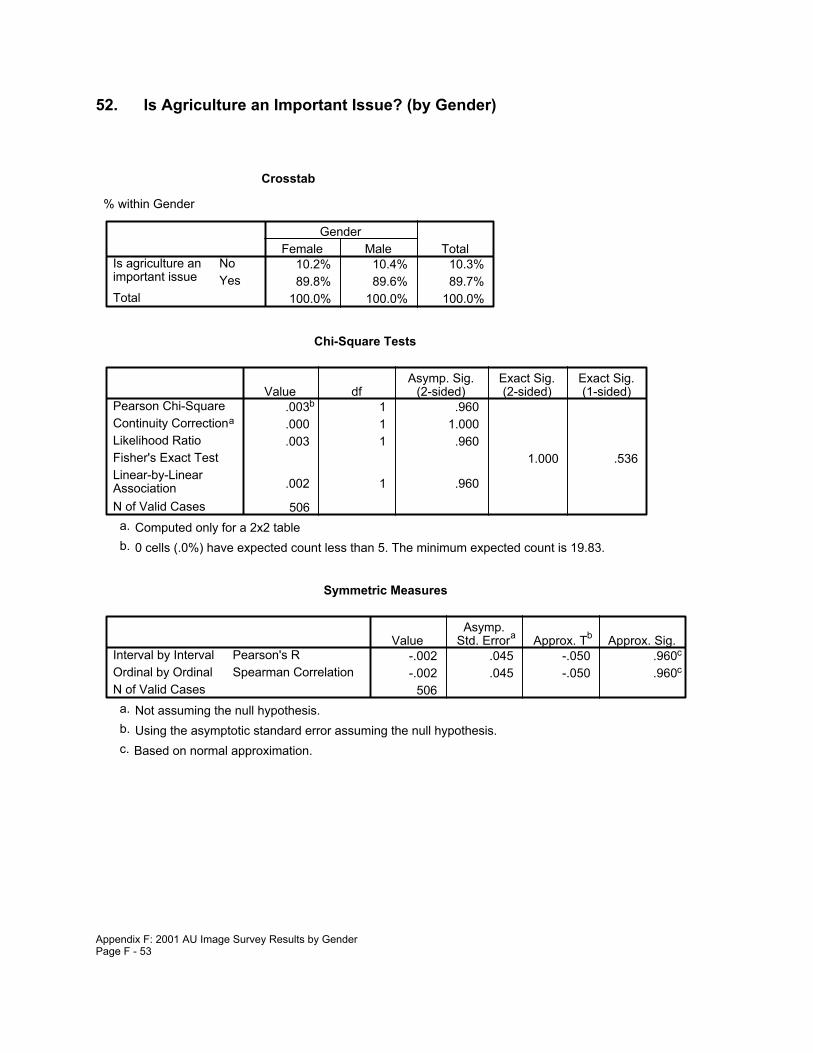
52. Is Agriculture an Important Issue? (by Gender)
Crosstab
% within Gender
10.2% 10.4% 10.3%89.8% 89.6% 89.7%
100.0% 100.0% 100.0%
NoYes
Is agriculture animportant issueTotal
Female MaleGender
Total
Chi-Square Tests
.003b 1 .960
.000 1 1.000
.003 1 .9601.000 .536
.002 1 .960
506
Pearson Chi-SquareContinuity Correctiona
Likelihood RatioFisher's Exact TestLinear-by-LinearAssociationN of Valid Cases
Value dfAsymp. Sig.
(2-sided)Exact Sig.(2-sided)
Exact Sig.(1-sided)
Computed only for a 2x2 tablea.
0 cells (.0%) have expected count less than 5. The minimum expected count is 19.83.b.
Symmetric Measures
-.002 .045 -.050 .960c
-.002 .045 -.050 .960c
506
Pearson's RInterval by IntervalSpearman CorrelationOrdinal by Ordinal
N of Valid Cases
ValueAsymp.
Std. Errora Approx. Tb Approx. Sig.
Not assuming the null hypothesis.a.
Using the asymptotic standard error assuming the null hypothesis.b.
Based on normal approximation.c.
Appendix F: 2001 AU Image Survey Results by GenderPage F - 53

53. Are Family and Youth Important Issues? (by Gender)
Crosstab
% within Gender
3.8% 10.4% 6.3%96.2% 89.6% 93.7%
100.0% 100.0% 100.0%
NoYes
Is family and youth andimportant issueTotal
Female MaleGender
Total
Chi-Square Tests
8.590b 1 .0037.523 1 .0068.288 1 .004
.004 .003
8.573 1 .003
506
Pearson Chi-SquareContinuity Correctiona
Likelihood RatioFisher's Exact TestLinear-by-LinearAssociationN of Valid Cases
Value dfAsymp. Sig.
(2-sided)Exact Sig.(2-sided)
Exact Sig.(1-sided)
Computed only for a 2x2 tablea.
0 cells (.0%) have expected count less than 5. The minimum expected count is 12.21.b.
Symmetric Measures
-.130 .045 -2.950 .003c
-.130 .045 -2.950 .003c
506
Pearson's RInterval by IntervalSpearman CorrelationOrdinal by Ordinal
N of Valid Cases
ValueAsymp.
Std. Errora Approx. Tb Approx. Sig.
Not assuming the null hypothesis.a.
Using the asymptotic standard error assuming the null hypothesis.b.
Based on normal approximation.c.
Appendix F: 2001 AU Image Survey Results by GenderPage F - 54

54. Is the Environment an Important Issue? (by Gender)
Crosstab
% within Gender
6.7% 8.8% 7.5%93.3% 91.2% 92.5%
100.0% 100.0% 100.0%
NoYes
Is the environmentan important issueTotal
Female MaleGender
Total
Chi-Square Tests
.757b 1 .384
.485 1 .486
.744 1 .388.390 .241
.756 1 .385
506
Pearson Chi-SquareContinuity Correctiona
Likelihood RatioFisher's Exact TestLinear-by-LinearAssociationN of Valid Cases
Value dfAsymp. Sig.
(2-sided)Exact Sig.(2-sided)
Exact Sig.(1-sided)
Computed only for a 2x2 tablea.
0 cells (.0%) have expected count less than 5. The minimum expected count is 14.49.b.
Symmetric Measures
-.039 .045 -.869 .385c
-.039 .045 -.869 .385c
506
Pearson's RInterval by IntervalSpearman CorrelationOrdinal by Ordinal
N of Valid Cases
ValueAsymp.
Std. Errora Approx. Tb Approx. Sig.
Not assuming the null hypothesis.a.
Using the asymptotic standard error assuming the null hypothesis.b.
Based on normal approximation.c.
Appendix F: 2001 AU Image Survey Results by GenderPage F - 55

55. How Significant is It to Have Outreach Programs in Your Community?(by Gender)
Crosstab
% within Gender
3.8% 5.2% 4.3%4.5% 5.2% 4.7%4.8% 8.3% 6.1%1.0% 3.6% 2.0%
33.9% 32.1% 33.2%52.1% 45.6% 49.6%
100.0% 100.0% 100.0%
No opinionVery insignificantInsignificantNeutralSignificantVery significant
How significantis it to haveoutreachprograms incommunity
Total
Female MaleGender
Total
Chi-Square Tests
8.431a 5 .1348.214 5 .145
3.544 1 .060
506
Pearson Chi-SquareLikelihood RatioLinear-by-LinearAssociationN of Valid Cases
Value dfAsymp. Sig.
(2-sided)
1 cells (8.3%) have expected count less than 5. The minimum expected count is 3.81.a.
Symmetric Measures
-.084 .045 -1.887 .060c
-.083 .045 -1.871 .062c
506
Pearson's RInterval by IntervalSpearman CorrelationOrdinal by Ordinal
N of Valid Cases
ValueAsymp.
Std. Errora Approx. Tb Approx. Sig.
Not assuming the null hypothesis.a.
Using the asymptotic standard error assuming the null hypothesis.b.
Based on normal approximation.c.
Appendix F: 2001 AU Image Survey Results by GenderPage F - 56

56. How Significant is it to Have Access to Information Over the Internet?(by Gender)
Crosstab
% within Gender
6.4% 6.7% 6.5%10.2% 10.4% 10.3%17.6% 10.9% 15.0%
1.0% 2.6% 1.6%19.5% 25.4% 21.7%45.4% 44.0% 44.9%
100.0% 100.0% 100.0%
No opinionVery insignificantInsignificantNeutralSignificantVery significant
How Significantis it to accessinformation overthe Internet
Total
Female MaleGender
Total
Chi-Square Tests
7.553a 5 .1837.607 5 .179
.312 1 .577
506
Pearson Chi-SquareLikelihood RatioLinear-by-LinearAssociationN of Valid Cases
Value dfAsymp. Sig.
(2-sided)
2 cells (16.7%) have expected count less than 5. The minimum expected count is 3.05.a.
Symmetric Measures
.025 .044 .558 .577c
.009 .044 .206 .837c
506
Pearson's RInterval by IntervalSpearman CorrelationOrdinal by Ordinal
N of Valid Cases
ValueAsymp.
Std. Errora Approx. Tb Approx. Sig.
Not assuming the null hypothesis.a.
Using the asymptotic standard error assuming the null hypothesis.b.
Based on normal approximation.c.
Appendix F: 2001 AU Image Survey Results by GenderPage F - 57

Appendix G: 2001 AU Image Survey ResponsesControlled by Alumni Status
1. How Familiar Are You With Auburn University? (by Alumni Status)
Crosstab
% within Have you, spouse, or kids attended Auburn
14.6% 5.0% 12.7%31.4% 4.0% 25.9%
1.2% 1.0%37.6% 27.7% 35.6%15.1% 63.4% 24.8%
100.0% 100.0% 100.0%
Not at all familiarNot very familiarNeutralFamiliarVery familiar
How familiarare you withAuburn
Total
No Yes
Have you, spouse, orkids attended Auburn
Total
Chi-Square Tests
108.977a 4 .000105.709 4 .000
71.833 1 .000
505
Pearson Chi-SquareLikelihood RatioLinear-by-LinearAssociationN of Valid Cases
Value dfAsymp. Sig.
(2-sided)
2 cells (20.0%) have expected count less than 5. The minimum expected count is 1.00.a.
Symmetric Measures
.378 .036 9.144 .000c
.411 .038 10.118 .000c
505
Pearson's RInterval by IntervalSpearman CorrelationOrdinal by Ordinal
N of Valid Cases
ValueAsymp.
Std. Errora Approx. Tb Approx. Sig.
Not assuming the null hypothesis.a.
Using the asymptotic standard error assuming the null hypothesis.b.
Based on normal approximation.c.
Appendix G: 2001 AU Image Survey Results by Alumni StatusPage G - 1

2. How Important is Auburn University to the Quality of Life in Alabama?(by Alumni Status)
Crosstab
% within Have you, spouse, or kids attended Auburn
1.3% 1.0% 1.2%5.8% 1.0% 4.8%.3% 1.0% .4%
41.9% 32.7% 40.0%50.8% 64.4% 53.5%
100.0% 100.0% 100.0%
UnimportantNot very importantNeutralImportantVery important
How importantis Auburn tothe quality oflife in Alabama
Total
No Yes
Have you, spouse, orkids attended Auburn
Total
Chi-Square Tests
9.505a 4 .05010.718 4 .030
6.417 1 .011
495
Pearson Chi-SquareLikelihood RatioLinear-by-LinearAssociationN of Valid Cases
Value dfAsymp. Sig.
(2-sided)
5 cells (50.0%) have expected count less than 5. The minimum expected count is .41.a.
Symmetric Measures
.114 .038 2.547 .011c
.117 .042 2.607 .009c
495
Pearson's RInterval by IntervalSpearman CorrelationOrdinal by Ordinal
N of Valid Cases
ValueAsymp.
Std. Errora Approx. Tb Approx. Sig.
Not assuming the null hypothesis.a.
Using the asymptotic standard error assuming the null hypothesis.b.
Based on normal approximation.c.
Appendix G: 2001 AU Image Survey Results by Alumni StatusPage G - 2

3. How Important is Auburn University to the Quality of Life in Your LocalCommunity? (by Alumni Status)
Crosstab
% within Have you, spouse, or kids attended Auburn
3.4% 2.0% 3.1%20.7% 10.1% 18.5%
1.6% 1.0% 1.5%43.5% 39.4% 42.6%30.9% 47.5% 34.3%
100.0% 100.0% 100.0%
UnimportantNot very importantNeutralImportantVery important
How important isAuburn to thequality of life inlocal community
Total
No Yes
Have you, spouse, orkids attended Auburn
Total
Chi-Square Tests
12.017a 4 .01712.312 4 .015
10.397 1 .001
481
Pearson Chi-SquareLikelihood RatioLinear-by-LinearAssociationN of Valid Cases
Value dfAsymp. Sig.
(2-sided)
2 cells (20.0%) have expected count less than 5. The minimum expected count is 1.44.a.
Symmetric Measures
.147 .041 3.256 .001c
.157 .044 3.476 .001c
481
Pearson's RInterval by IntervalSpearman CorrelationOrdinal by Ordinal
N of Valid Cases
ValueAsymp.
Std. Errora Approx. Tb Approx. Sig.
Not assuming the null hypothesis.a.
Using the asymptotic standard error assuming the null hypothesis.b.
Based on normal approximation.c.
Appendix G: 2001 AU Image Survey Results by Alumni StatusPage G - 3

4. How Important is Auburn University Research for Jobs in Your LocalCommunity? (by Alumni Status)
Crosstab
% within Have you, spouse, or kids attended Auburn
2.0% 2.2% 2.0%12.6% 8.6% 11.8%
1.1% 2.2% 1.3%40.2% 40.9% 40.3%44.1% 46.2% 44.5%
100.0% 100.0% 100.0%
UnimportantNot very importantNeutralImportantVery important
How important isAuburn researchfor jobs in localcommunity
Total
No Yes
Have you, spouse, orkids attended Auburn
Total
Chi-Square Tests
1.697a 4 .7911.711 4 .789
.502 1 .479
449
Pearson Chi-SquareLikelihood RatioLinear-by-LinearAssociationN of Valid Cases
Value dfAsymp. Sig.
(2-sided)
3 cells (30.0%) have expected count less than 5. The minimum expected count is 1.24.a.
Symmetric Measures
.033 .045 .708 .479c
.027 .046 .561 .575c
449
Pearson's RInterval by IntervalSpearman CorrelationOrdinal by Ordinal
N of Valid Cases
ValueAsymp.
Std. Errora Approx. Tb Approx. Sig.
Not assuming the null hypothesis.a.
Using the asymptotic standard error assuming the null hypothesis.b.
Based on normal approximation.c.
Appendix G: 2001 AU Image Survey Results by Alumni StatusPage G - 4

5. Have You or Your Family Benefited from Auburn University?(by Alumni Status)
Crosstab
% within Have you, spouse, or kids attended Auburn
77.5% 36.6% 69.4%22.5% 63.4% 30.6%
100.0% 100.0% 100.0%
NoYes
Have you or your familybenefited from AuburnTotal
No Yes
Have you, spouse, orkids attended Auburn
Total
Chi-Square Tests
63.632b 1 .00061.722 1 .00059.259 1 .000
.000 .000
63.506 1 .000
506
Pearson Chi-SquareContinuity Correctiona
Likelihood RatioFisher's Exact TestLinear-by-LinearAssociationN of Valid Cases
Value dfAsymp. Sig.
(2-sided)Exact Sig.(2-sided)
Exact Sig.(1-sided)
Computed only for a 2x2 tablea.
0 cells (.0%) have expected count less than 5. The minimum expected count is 30.94.b.
Symmetric Measures
.355 .046 8.515 .000c
.355 .046 8.515 .000c
506
Pearson's RInterval by IntervalSpearman CorrelationOrdinal by Ordinal
N of Valid Cases
ValueAsymp.
Std. Errora Approx. Tb Approx. Sig.
Not assuming the null hypothesis.a.
Using the asymptotic standard error assuming the null hypothesis.b.
Based on normal approximation.c.
Appendix G: 2001 AU Image Survey Results by Alumni StatusPage G - 5

6. How Does Auburn University Funding Compare to Other Universitiesin the Southeast? (by Alumni Status)
Crosstab
% within Have you, spouse, or kids attended Auburn
18.8% 26.8% 20.4%62.4% 53.5% 60.6%18.8% 19.7% 19.0%
100.0% 100.0% 100.0%
LessAbout the sameMore
How does Auburnfunding compare toother universities inthe Southeast
Total
No Yes
Have you, spouse, orkids attended Auburn
Total
Chi-Square Tests
2.530a 2 .2822.435 2 .296
.713 1 .399
353
Pearson Chi-SquareLikelihood RatioLinear-by-LinearAssociationN of Valid Cases
Value dfAsymp. Sig.
(2-sided)
0 cells (.0%) have expected count less than 5. The minimum expected count is 13.48.a.
Symmetric Measures
-.045 .056 -.844 .399c
-.045 .057 -.853 .394c
353
Pearson's RInterval by IntervalSpearman CorrelationOrdinal by Ordinal
N of Valid Cases
ValueAsymp.
Std. Errora Approx. Tb Approx. Sig.
Not assuming the null hypothesis.a.
Using the asymptotic standard error assuming the null hypothesis.b.
Based on normal approximation.c.
Appendix G: 2001 AU Image Survey Results by Alumni StatusPage G - 6

7. Auburn University Helps to Create Jobs in Alabama.(by Alumni Status)
Crosstab
% within Have you, spouse, or kids attended Auburn
1.5% 1.0% 1.4%4.3% 4.1% 4.3%.3% .2%
50.4% 30.6% 46.4%43.5% 64.3% 47.7%
100.0% 100.0% 100.0%
Strongly disagreeSomewhat disagreeNeutralSomewhat agreeStrongly agree
Auburn helpscreate jobs inAlabama
Total
No Yes
Have you, spouse, orkids attended Auburn
Total
Chi-Square Tests
14.106a 4 .00714.486 4 .006
6.312 1 .012
491
Pearson Chi-SquareLikelihood RatioLinear-by-LinearAssociationN of Valid Cases
Value dfAsymp. Sig.
(2-sided)
4 cells (40.0%) have expected count less than 5. The minimum expected count is .20.a.
Symmetric Measures
.113 .044 2.526 .012c
.156 .044 3.498 .001c
491
Pearson's RInterval by IntervalSpearman CorrelationOrdinal by Ordinal
N of Valid Cases
ValueAsymp.
Std. Errora Approx. Tb Approx. Sig.
Not assuming the null hypothesis.a.
Using the asymptotic standard error assuming the null hypothesis.b.
Based on normal approximation.c.
Appendix G: 2001 AU Image Survey Results by Alumni StatusPage G - 7

8. Auburn University Graduates Play an Important Role in Your LocalCommunity. (by Alumni Status)
Crosstab
% within Have you, spouse, or kids attended Auburn
3.4% 2.0% 3.1%7.3% 7.1% 7.3%2.1% 1.7%
45.3% 32.7% 42.7%41.9% 58.2% 45.2%
100.0% 100.0% 100.0%
Strongly disagreeSomewhat disagreeNeutralSomewhat agreeStrongly agree
Auburn graduatesplay importantroles in localcommunity
Total
No Yes
Have you, spouse, orkids attended Auburn
Total
Chi-Square Tests
9.976a 4 .04111.536 4 .021
3.995 1 .046
482
Pearson Chi-SquareLikelihood RatioLinear-by-LinearAssociationN of Valid Cases
Value dfAsymp. Sig.
(2-sided)
2 cells (20.0%) have expected count less than 5. The minimum expected count is 1.63.a.
Symmetric Measures
.091 .044 2.005 .046c
.124 .045 2.729 .007c
482
Pearson's RInterval by IntervalSpearman CorrelationOrdinal by Ordinal
N of Valid Cases
ValueAsymp.
Std. Errora Approx. Tb Approx. Sig.
Not assuming the null hypothesis.a.
Using the asymptotic standard error assuming the null hypothesis.b.
Based on normal approximation.c.
Appendix G: 2001 AU Image Survey Results by Alumni StatusPage G - 8

9. Auburn University Concentrates on Athletics Rather Than AcademicPrograms (by Alumni Status)
Crosstab
% within Have you, spouse, or kids attended Auburn
16.0% 18.2% 16.5%29.6% 34.3% 30.6%
6.1% 4.0% 5.7%28.0% 26.3% 27.6%20.3% 17.2% 19.6%
100.0% 100.0% 100.0%
Strongly disagreeSomewhat disagreeNeutralSomewhat agreeStrongly agree
Auburn concentrateson athletic instead ofacademic programs
Total
No Yes
Have you, spouse, orkids attended Auburn
Total
Chi-Square Tests
1.873a 4 .7591.916 4 .751
1.120 1 .290
474
Pearson Chi-SquareLikelihood RatioLinear-by-LinearAssociationN of Valid Cases
Value dfAsymp. Sig.
(2-sided)
0 cells (.0%) have expected count less than 5. The minimum expected count is 5.64.a.
Symmetric Measures
-.049 .046 -1.059 .290c
-.048 .046 -1.046 .296c
474
Pearson's RInterval by IntervalSpearman CorrelationOrdinal by Ordinal
N of Valid Cases
ValueAsymp.
Std. Errora Approx. Tb Approx. Sig.
Not assuming the null hypothesis.a.
Using the asymptotic standard error assuming the null hypothesis.b.
Based on normal approximation.c.
Appendix G: 2001 AU Image Survey Results by Alumni StatusPage G - 9

10. Auburn University is One of the Best Universities in the South.(by Alumni Status)
Crosstab
% within Have you, spouse, or kids attended Auburn
4.4% 3.5%9.3% 3.0% 8.0%3.9% 1.0% 3.3%
46.3% 34.3% 43.8%36.2% 61.6% 41.4%
100.0% 100.0% 100.0%
Strongly disagreeSomewhat disagreeNeutralSomewhat agreeStrongly agree
Auburn is one ofthe bestuniversities inthe South
Total
No Yes
Have you, spouse, orkids attended Auburn
Total
Chi-Square Tests
25.068a 4 .00028.930 4 .000
21.482 1 .000
486
Pearson Chi-SquareLikelihood RatioLinear-by-LinearAssociationN of Valid Cases
Value dfAsymp. Sig.
(2-sided)
2 cells (20.0%) have expected count less than 5. The minimum expected count is 3.26.a.
Symmetric Measures
.210 .032 4.736 .000c
.226 .040 5.102 .000c
486
Pearson's RInterval by IntervalSpearman CorrelationOrdinal by Ordinal
N of Valid Cases
ValueAsymp.
Std. Errora Approx. Tb Approx. Sig.
Not assuming the null hypothesis.a.
Using the asymptotic standard error assuming the null hypothesis.b.
Based on normal approximation.c.
Appendix G: 2001 AU Image Survey Results by Alumni StatusPage G - 10

11. Auburn University is One of the Best Universities in the Nation.(by Alumni Status)
Crosstab
% within Have you, spouse, or kids attended Auburn
9.4% 2.1% 7.9%14.8% 10.4% 13.9%
4.0% 3.1% 3.8%45.4% 42.7% 44.9%26.3% 41.7% 29.5%
100.0% 100.0% 100.0%
Strongly disagreeSomewhat disagreeNeutralSomewhat agreeStrongly agree
Auburn is oneof the bestuniversities inthe nation
Total
No Yes
Have you, spouse, orkids attended Auburn
Total
Chi-Square Tests
12.593a 4 .01313.837 4 .008
10.941 1 .001
468
Pearson Chi-SquareLikelihood RatioLinear-by-LinearAssociationN of Valid Cases
Value dfAsymp. Sig.
(2-sided)
1 cells (10.0%) have expected count less than 5. The minimum expected count is 3.69.a.
Symmetric Measures
.153 .040 3.344 .001c
.158 .044 3.454 .001c
468
Pearson's RInterval by IntervalSpearman CorrelationOrdinal by Ordinal
N of Valid Cases
ValueAsymp.
Std. Errora Approx. Tb Approx. Sig.
Not assuming the null hypothesis.a.
Using the asymptotic standard error assuming the null hypothesis.b.
Based on normal approximation.c.
Appendix G: 2001 AU Image Survey Results by Alumni StatusPage G - 11
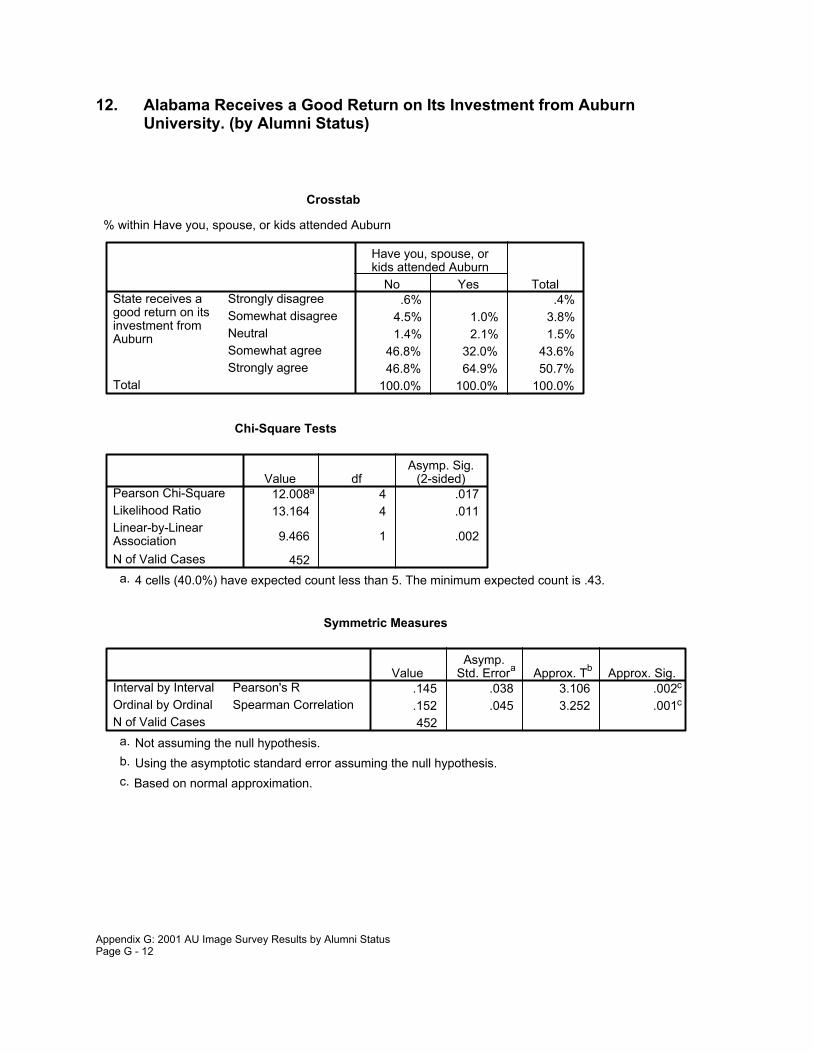
12. Alabama Receives a Good Return on Its Investment from AuburnUniversity. (by Alumni Status)
Crosstab
% within Have you, spouse, or kids attended Auburn
.6% .4%4.5% 1.0% 3.8%1.4% 2.1% 1.5%
46.8% 32.0% 43.6%46.8% 64.9% 50.7%
100.0% 100.0% 100.0%
Strongly disagreeSomewhat disagreeNeutralSomewhat agreeStrongly agree
State receives agood return on itsinvestment fromAuburn
Total
No Yes
Have you, spouse, orkids attended Auburn
Total
Chi-Square Tests
12.008a 4 .01713.164 4 .011
9.466 1 .002
452
Pearson Chi-SquareLikelihood RatioLinear-by-LinearAssociationN of Valid Cases
Value dfAsymp. Sig.
(2-sided)
4 cells (40.0%) have expected count less than 5. The minimum expected count is .43.a.
Symmetric Measures
.145 .038 3.106 .002c
.152 .045 3.252 .001c
452
Pearson's RInterval by IntervalSpearman CorrelationOrdinal by Ordinal
N of Valid Cases
ValueAsymp.
Std. Errora Approx. Tb Approx. Sig.
Not assuming the null hypothesis.a.
Using the asymptotic standard error assuming the null hypothesis.b.
Based on normal approximation.c.
Appendix G: 2001 AU Image Survey Results by Alumni StatusPage G - 12

13. The Quality of Higher Education in Alabama Affects Me.(by Alumni Status)
Crosstab
% within Have you, spouse, or kids attended Auburn
4.3% 1.0% 3.6%6.1% 2.0% 5.3%1.3% 2.0% 1.4%
32.2% 22.8% 30.3%56.1% 72.3% 59.4%
100.0% 100.0% 100.0%
Strongly disagreeSomewhat disagreeNeutralSomewhat agreeStrongly agree
Quality of highereducation inAlabama affectsme
Total
No Yes
Have you, spouse, orkids attended Auburn
Total
Chi-Square Tests
11.239a 4 .02412.607 4 .013
8.990 1 .003
495
Pearson Chi-SquareLikelihood RatioLinear-by-LinearAssociationN of Valid Cases
Value dfAsymp. Sig.
(2-sided)
2 cells (20.0%) have expected count less than 5. The minimum expected count is 1.43.a.
Symmetric Measures
.135 .034 3.023 .003c
.139 .041 3.126 .002c
495
Pearson's RInterval by IntervalSpearman CorrelationOrdinal by Ordinal
N of Valid Cases
ValueAsymp.
Std. Errora Approx. Tb Approx. Sig.
Not assuming the null hypothesis.a.
Using the asymptotic standard error assuming the null hypothesis.b.
Based on normal approximation.c.
Appendix G: 2001 AU Image Survey Results by Alumni StatusPage G - 13

14. I Learn About Alabama Universities from Newspapers.(by Alumni Status)
Crosstab
% within Have you, spouse, or kids attended Auburn
37.0% 27.7% 35.2%
63.0% 72.3% 64.8%100.0% 100.0% 100.0%
No
Yes
Learn about Stateuniversities fromnewspapersTotal
No Yes
Have you, spouse, orkids attended Auburn
Total
Chi-Square Tests
3.076b 1 .0792.681 1 .1023.166 1 .075
.082 .049
3.070 1 .080
506
Pearson Chi-SquareContinuity Correctiona
Likelihood RatioFisher's Exact TestLinear-by-LinearAssociationN of Valid Cases
Value dfAsymp. Sig.
(2-sided)Exact Sig.(2-sided)
Exact Sig.(1-sided)
Computed only for a 2x2 tablea.
0 cells (.0%) have expected count less than 5. The minimum expected count is 35.53.b.
Symmetric Measures
.078 .042 1.756 .080c
.078 .042 1.756 .080c
506
Pearson's RInterval by IntervalSpearman CorrelationOrdinal by Ordinal
N of Valid Cases
ValueAsymp.
Std. Errora Approx. Tb Approx. Sig.
Not assuming the null hypothesis.a.
Using the asymptotic standard error assuming the null hypothesis.b.
Based on normal approximation.c.
Appendix G: 2001 AU Image Survey Results by Alumni StatusPage G - 14

15. I Learn About Alabama Universities From the Radio.(by Alumni Status)
Crosstab
% within Have you, spouse, or kids attended Auburn
72.8% 64.4% 71.1%27.2% 35.6% 28.9%
100.0% 100.0% 100.0%
NoYes
Learn about Stateuniversities from radioTotal
No Yes
Have you, spouse, orkids attended Auburn
Total
Chi-Square Tests
2.834b 1 .0922.436 1 .1192.749 1 .097
.110 .061
2.828 1 .093
506
Pearson Chi-SquareContinuity Correctiona
Likelihood RatioFisher's Exact TestLinear-by-LinearAssociationN of Valid Cases
Value dfAsymp. Sig.
(2-sided)Exact Sig.(2-sided)
Exact Sig.(1-sided)
Computed only for a 2x2 tablea.
0 cells (.0%) have expected count less than 5. The minimum expected count is 29.14.b.
Symmetric Measures
.075 .046 1.685 .093c
.075 .046 1.685 .093c
506
Pearson's RInterval by IntervalSpearman CorrelationOrdinal by Ordinal
N of Valid Cases
ValueAsymp.
Std. Errora Approx. Tb Approx. Sig.
Not assuming the null hypothesis.a.
Using the asymptotic standard error assuming the null hypothesis.b.
Based on normal approximation.c.
Appendix G: 2001 AU Image Survey Results by Alumni StatusPage G - 15

16. I Learn About Alabama Universities From Magazines.(by Alumni Status)
Crosstab
% within Have you, spouse, or kids attended Auburn
70.6% 60.4% 68.6%
29.4% 39.6% 31.4%100.0% 100.0% 100.0%
No
Yes
Learn about Stateuniversities frommagazinesTotal
No Yes
Have you, spouse, orkids attended Auburn
Total
Chi-Square Tests
3.919b 1 .0483.459 1 .0633.805 1 .051
.055 .033
3.912 1 .048
506
Pearson Chi-SquareContinuity Correctiona
Likelihood RatioFisher's Exact TestLinear-by-LinearAssociationN of Valid Cases
Value dfAsymp. Sig.
(2-sided)Exact Sig.(2-sided)
Exact Sig.(1-sided)
Computed only for a 2x2 tablea.
0 cells (.0%) have expected count less than 5. The minimum expected count is 31.74.b.
Symmetric Measures
.088 .046 1.984 .048c
.088 .046 1.984 .048c
506
Pearson's RInterval by IntervalSpearman CorrelationOrdinal by Ordinal
N of Valid Cases
ValueAsymp.
Std. Errora Approx. Tb Approx. Sig.
Not assuming the null hypothesis.a.
Using the asymptotic standard error assuming the null hypothesis.b.
Based on normal approximation.c.
Appendix G: 2001 AU Image Survey Results by Alumni StatusPage G - 16

17. I Learn About Alabama Universities From Television.(by Alumni Status)
Crosstab
% within Have you, spouse, or kids attended Auburn
42.5% 46.5% 43.3%57.5% 53.5% 56.7%
100.0% 100.0% 100.0%
NoYes
Learn about Stateuniversities from T.V.Total
No Yes
Have you, spouse, orkids attended Auburn
Total
Chi-Square Tests
.544b 1 .461
.391 1 .532
.542 1 .462.501 .265
.543 1 .461
506
Pearson Chi-SquareContinuity Correctiona
Likelihood RatioFisher's Exact TestLinear-by-LinearAssociationN of Valid Cases
Value dfAsymp. Sig.
(2-sided)Exact Sig.(2-sided)
Exact Sig.(1-sided)
Computed only for a 2x2 tablea.
0 cells (.0%) have expected count less than 5. The minimum expected count is 43.71.b.
Symmetric Measures
-.033 .045 -.737 .462c
-.033 .045 -.737 .462c
506
Pearson's RInterval by IntervalSpearman CorrelationOrdinal by Ordinal
N of Valid Cases
ValueAsymp.
Std. Errora Approx. Tb Approx. Sig.
Not assuming the null hypothesis.a.
Using the asymptotic standard error assuming the null hypothesis.b.
Based on normal approximation.c.
Appendix G: 2001 AU Image Survey Results by Alumni StatusPage G - 17

18. I Learn About Alabama Universities From the Internet. (by Alumni Status)
Crosstab
% within Have you, spouse, or kids attended Auburn
66.7% 62.4% 65.8%
33.3% 37.6% 34.2%100.0% 100.0% 100.0%
No
Yes
Learn about Stateuniversities fromthe InternetTotal
No Yes
Have you, spouse, orkids attended Auburn
Total
Chi-Square Tests
.661b 1 .416
.484 1 .486
.654 1 .419.415 .242
.660 1 .417
506
Pearson Chi-SquareContinuity Correctiona
Likelihood RatioFisher's Exact TestLinear-by-LinearAssociationN of Valid Cases
Value dfAsymp. Sig.
(2-sided)Exact Sig.(2-sided)
Exact Sig.(1-sided)
Computed only for a 2x2 tablea.
0 cells (.0%) have expected count less than 5. The minimum expected count is 34.53.b.
Symmetric Measures
.036 .045 .812 .417c
.036 .045 .812 .417c
506
Pearson's RInterval by IntervalSpearman CorrelationOrdinal by Ordinal
N of Valid Cases
ValueAsymp.
Std. Errora Approx. Tb Approx. Sig.
Not assuming the null hypothesis.a.
Using the asymptotic standard error assuming the null hypothesis.b.
Based on normal approximation.c.
Appendix G: 2001 AU Image Survey Results by Alumni StatusPage G - 18

19. I Learn About Alabama Universities From Alumni. (by Alumni Status)
Crosstab
% within Have you, spouse, or kids attended Auburn
71.9% 49.5% 67.4%28.1% 50.5% 32.6%
100.0% 100.0% 100.0%
NoYes
Learn about Stateuniversities from alumniTotal
No Yes
Have you, spouse, orkids attended Auburn
Total
Chi-Square Tests
18.371b 1 .00017.368 1 .00017.522 1 .000
.000 .000
18.334 1 .000
506
Pearson Chi-SquareContinuity Correctiona
Likelihood RatioFisher's Exact TestLinear-by-LinearAssociationN of Valid Cases
Value dfAsymp. Sig.
(2-sided)Exact Sig.(2-sided)
Exact Sig.(1-sided)
Computed only for a 2x2 tablea.
0 cells (.0%) have expected count less than 5. The minimum expected count is 32.93.b.
Symmetric Measures
.191 .047 4.357 .000c
.191 .047 4.357 .000c
506
Pearson's RInterval by IntervalSpearman CorrelationOrdinal by Ordinal
N of Valid Cases
ValueAsymp.
Std. Errora Approx. Tb Approx. Sig.
Not assuming the null hypothesis.a.
Using the asymptotic standard error assuming the null hypothesis.b.
Based on normal approximation.c.
Appendix G: 2001 AU Image Survey Results by Alumni StatusPage G - 19

20. I Learn About Alabama Universities From Students.(by Alumni Status)
Crosstab
% within Have you, spouse, or kids attended Auburn
66.4% 54.5% 64.0%33.6% 45.5% 36.0%
100.0% 100.0% 100.0%
NoYes
Learn about Stateuniversities from studentsTotal
No Yes
Have you, spouse, orkids attended Auburn
Total
Chi-Square Tests
5.024b 1 .0254.518 1 .0344.911 1 .027
.028 .018
5.014 1 .025
506
Pearson Chi-SquareContinuity Correctiona
Likelihood RatioFisher's Exact TestLinear-by-LinearAssociationN of Valid Cases
Value dfAsymp. Sig.
(2-sided)Exact Sig.(2-sided)
Exact Sig.(1-sided)
Computed only for a 2x2 tablea.
0 cells (.0%) have expected count less than 5. The minimum expected count is 36.33.b.
Symmetric Measures
.100 .046 2.248 .025c
.100 .046 2.248 .025c
506
Pearson's RInterval by IntervalSpearman CorrelationOrdinal by Ordinal
N of Valid Cases
ValueAsymp.
Std. Errora Approx. Tb Approx. Sig.
Not assuming the null hypothesis.a.
Using the asymptotic standard error assuming the null hypothesis.b.
Based on normal approximation.c.
Appendix G: 2001 AU Image Survey Results by Alumni StatusPage G - 20
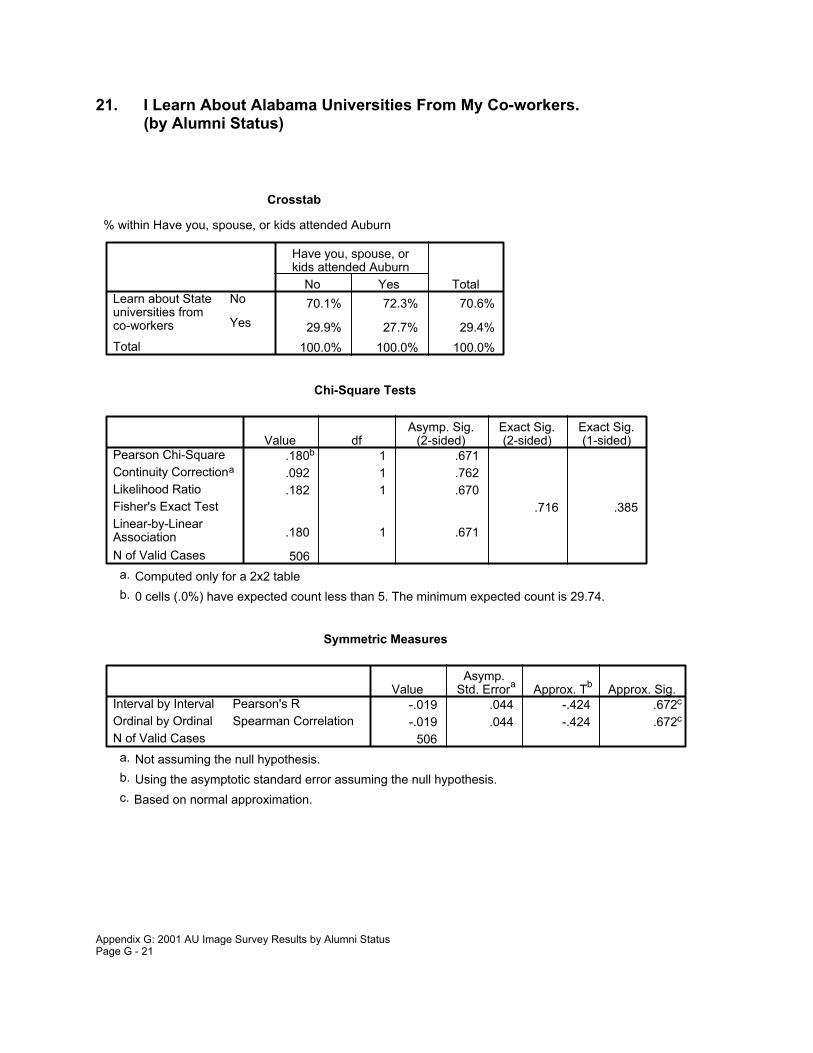
21. I Learn About Alabama Universities From My Co-workers.(by Alumni Status)
Crosstab
% within Have you, spouse, or kids attended Auburn
70.1% 72.3% 70.6%
29.9% 27.7% 29.4%100.0% 100.0% 100.0%
No
Yes
Learn about Stateuniversities fromco-workersTotal
No Yes
Have you, spouse, orkids attended Auburn
Total
Chi-Square Tests
.180b 1 .671
.092 1 .762
.182 1 .670.716 .385
.180 1 .671
506
Pearson Chi-SquareContinuity Correctiona
Likelihood RatioFisher's Exact TestLinear-by-LinearAssociationN of Valid Cases
Value dfAsymp. Sig.
(2-sided)Exact Sig.(2-sided)
Exact Sig.(1-sided)
Computed only for a 2x2 tablea.
0 cells (.0%) have expected count less than 5. The minimum expected count is 29.74.b.
Symmetric Measures
-.019 .044 -.424 .672c
-.019 .044 -.424 .672c
506
Pearson's RInterval by IntervalSpearman CorrelationOrdinal by Ordinal
N of Valid Cases
ValueAsymp.
Std. Errora Approx. Tb Approx. Sig.
Not assuming the null hypothesis.a.
Using the asymptotic standard error assuming the null hypothesis.b.
Based on normal approximation.c.
Appendix G: 2001 AU Image Survey Results by Alumni StatusPage G - 21

22. I Learn About Alabama Universities From Other Sources.(by Alumni Status)
Crosstab
% within Have you, spouse, or kids attended Auburn
84.7% 82.2% 84.2%15.3% 17.8% 15.8%
100.0% 100.0% 100.0%
NoYes
Learn about Stateuniversities from otherTotal
No Yes
Have you, spouse, orkids attended Auburn
Total
Chi-Square Tests
.384b 1 .536
.218 1 .641
.374 1 .541.543 .315
.383 1 .536
506
Pearson Chi-SquareContinuity Correctiona
Likelihood RatioFisher's Exact TestLinear-by-LinearAssociationN of Valid Cases
Value dfAsymp. Sig.
(2-sided)Exact Sig.(2-sided)
Exact Sig.(1-sided)
Computed only for a 2x2 tablea.
0 cells (.0%) have expected count less than 5. The minimum expected count is 15.97.b.
Symmetric Measures
.028 .046 .618 .537c
.028 .046 .618 .537c
506
Pearson's RInterval by IntervalSpearman CorrelationOrdinal by Ordinal
N of Valid Cases
ValueAsymp.
Std. Errora Approx. Tb Approx. Sig.
Not assuming the null hypothesis.a.
Using the asymptotic standard error assuming the null hypothesis.b.
Based on normal approximation.c.
Appendix G: 2001 AU Image Survey Results by Alumni StatusPage G - 22
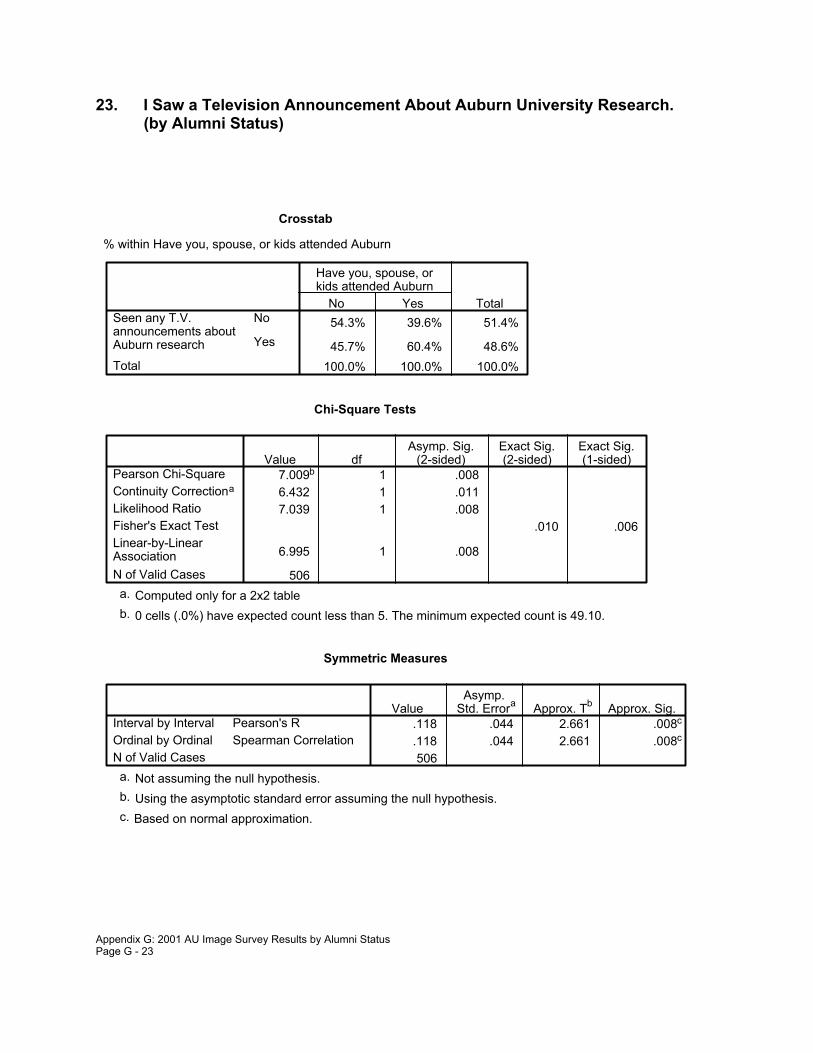
23. I Saw a Television Announcement About Auburn University Research.(by Alumni Status)
Crosstab
% within Have you, spouse, or kids attended Auburn
54.3% 39.6% 51.4%
45.7% 60.4% 48.6%100.0% 100.0% 100.0%
No
Yes
Seen any T.V.announcements aboutAuburn researchTotal
No Yes
Have you, spouse, orkids attended Auburn
Total
Chi-Square Tests
7.009b 1 .0086.432 1 .0117.039 1 .008
.010 .006
6.995 1 .008
506
Pearson Chi-SquareContinuity Correctiona
Likelihood RatioFisher's Exact TestLinear-by-LinearAssociationN of Valid Cases
Value dfAsymp. Sig.
(2-sided)Exact Sig.(2-sided)
Exact Sig.(1-sided)
Computed only for a 2x2 tablea.
0 cells (.0%) have expected count less than 5. The minimum expected count is 49.10.b.
Symmetric Measures
.118 .044 2.661 .008c
.118 .044 2.661 .008c
506
Pearson's RInterval by IntervalSpearman CorrelationOrdinal by Ordinal
N of Valid Cases
ValueAsymp.
Std. Errora Approx. Tb Approx. Sig.
Not assuming the null hypothesis.a.
Using the asymptotic standard error assuming the null hypothesis.b.
Based on normal approximation.c.
Appendix G: 2001 AU Image Survey Results by Alumni StatusPage G - 23

24. I Am Aware That Auburn University Developed A New Bulletproof Vest.(by Alumni Status)
Crosstab
% within Have you, spouse, or kids attended Auburn
77.5% 64.4% 74.9%22.5% 35.6% 25.1%
100.0% 100.0% 100.0%
NoYes
Aware Auburn developednew bulletproof vestTotal
No Yes
Have you, spouse, orkids attended Auburn
Total
Chi-Square Tests
7.464b 1 .0066.779 1 .0097.055 1 .008
.010 .005
7.449 1 .006
506
Pearson Chi-SquareContinuity Correctiona
Likelihood RatioFisher's Exact TestLinear-by-LinearAssociationN of Valid Cases
Value dfAsymp. Sig.
(2-sided)Exact Sig.(2-sided)
Exact Sig.(1-sided)
Computed only for a 2x2 tablea.
0 cells (.0%) have expected count less than 5. The minimum expected count is 25.35.b.
Symmetric Measures
.121 .048 2.747 .006c
.121 .048 2.747 .006c
506
Pearson's RInterval by IntervalSpearman CorrelationOrdinal by Ordinal
N of Valid Cases
ValueAsymp.
Std. Errora Approx. Tb Approx. Sig.
Not assuming the null hypothesis.a.
Using the asymptotic standard error assuming the null hypothesis.b.
Based on normal approximation.c.
Appendix G: 2001 AU Image Survey Results by Alumni StatusPage G - 24

25. The Bulletproof Vest Research is Significant. (by Alumni Status)
Crosstab
% within Have you, spouse, or kids attended Auburn
3.3% 2.8% 3.1%96.7% 97.2% 96.9%
100.0% 100.0% 100.0%
NoYes
Is the bulletproof vestresearch significantTotal
No Yes
Have you, spouse, orkids attended Auburn
Total
Chi-Square Tests
.023b 1 .880
.000 1 1.000
.023 1 .8791.000 .682
.023 1 .881
127
Pearson Chi-SquareContinuity Correctiona
Likelihood RatioFisher's Exact TestLinear-by-LinearAssociationN of Valid Cases
Value dfAsymp. Sig.
(2-sided)Exact Sig.(2-sided)
Exact Sig.(1-sided)
Computed only for a 2x2 tablea.
2 cells (50.0%) have expected count less than 5. The minimum expected count is 1.13.b.
Symmetric Measures
.013 .085 .150 .881c
.013 .085 .150 .881c
127
Pearson's RInterval by IntervalSpearman CorrelationOrdinal by Ordinal
N of Valid Cases
ValueAsymp.
Std. Errora Approx. Tb Approx. Sig.
Not assuming the null hypothesis.a.
Using the asymptotic standard error assuming the null hypothesis.b.
Based on normal approximation.c.
Appendix G: 2001 AU Image Survey Results by Alumni StatusPage G - 25

26. I Saw a Television Announcement About the Bulletproof Vest.(by Alumni Status)
Crosstab
% within Have you, spouse, or kids attended Auburn
54.9% 55.6% 55.1%45.1% 44.4% 44.9%
100.0% 100.0% 100.0%
NoYes
Seen T.V. announcementabout bulletproof vestTotal
No Yes
Have you, spouse, orkids attended Auburn
Total
Chi-Square Tests
.004b 1 .950
.000 1 1.000
.004 1 .9501.000 .555
.004 1 .950
127
Pearson Chi-SquareContinuity Correctiona
Likelihood RatioFisher's Exact TestLinear-by-LinearAssociationN of Valid Cases
Value dfAsymp. Sig.
(2-sided)Exact Sig.(2-sided)
Exact Sig.(1-sided)
Computed only for a 2x2 tablea.
0 cells (.0%) have expected count less than 5. The minimum expected count is 16.16.b.
Symmetric Measures
-.006 .089 -.062 .951c
-.006 .089 -.062 .951c
127
Pearson's RInterval by IntervalSpearman CorrelationOrdinal by Ordinal
N of Valid Cases
ValueAsymp.
Std. Errora Approx. Tb Approx. Sig.
Not assuming the null hypothesis.a.
Using the asymptotic standard error assuming the null hypothesis.b.
Based on normal approximation.c.
Appendix G: 2001 AU Image Survey Results by Alumni StatusPage G - 26

27. The Bulletproof Vest Announcement Should Be Continued.(by Alumni Status)
Crosstab
% within Have you, spouse, or kids attended Auburn
7.3% 6.3% 7.0%
92.7% 93.8% 93.0%100.0% 100.0% 100.0%
No
Yes
Should bulletproofvest announcementbe continuedTotal
No Yes
Have you, spouse, orkids attended Auburn
Total
Chi-Square Tests
.020b 1 .887
.000 1 1.000
.021 1 .8861.000 .688
.020 1 .888
57
Pearson Chi-SquareContinuity Correctiona
Likelihood RatioFisher's Exact TestLinear-by-LinearAssociationN of Valid Cases
Value dfAsymp. Sig.
(2-sided)Exact Sig.(2-sided)
Exact Sig.(1-sided)
Computed only for a 2x2 tablea.
2 cells (50.0%) have expected count less than 5. The minimum expected count is 1.12.b.
Symmetric Measures
.019 .128 .139 .890c
.019 .128 .139 .890c
57
Pearson's RInterval by IntervalSpearman CorrelationOrdinal by Ordinal
N of Valid Cases
ValueAsymp.
Std. Errora Approx. Tb Approx. Sig.
Not assuming the null hypothesis.a.
Using the asymptotic standard error assuming the null hypothesis.b.
Based on normal approximation.c.
Appendix G: 2001 AU Image Survey Results by Alumni StatusPage G - 27

28. I Am Aware That Auburn University Developed New Airbags.(by Alumni Status)
Crosstab
% within Have you, spouse, or kids attended Auburn
78.8% 76.2% 78.3%21.2% 23.8% 21.7%
100.0% 100.0% 100.0%
NoYes
Aware Auburndeveloped new airbagsTotal
No Yes
Have you, spouse, orkids attended Auburn
Total
Chi-Square Tests
.304b 1 .582
.173 1 .677
.299 1 .585.591 .334
.303 1 .582
506
Pearson Chi-SquareContinuity Correctiona
Likelihood RatioFisher's Exact TestLinear-by-LinearAssociationN of Valid Cases
Value dfAsymp. Sig.
(2-sided)Exact Sig.(2-sided)
Exact Sig.(1-sided)
Computed only for a 2x2 tablea.
0 cells (.0%) have expected count less than 5. The minimum expected count is 21.96.b.
Symmetric Measures
.024 .046 .550 .583c
.024 .046 .550 .583c
506
Pearson's RInterval by IntervalSpearman CorrelationOrdinal by Ordinal
N of Valid Cases
ValueAsymp.
Std. Errora Approx. Tb Approx. Sig.
Not assuming the null hypothesis.a.
Using the asymptotic standard error assuming the null hypothesis.b.
Based on normal approximation.c.
Appendix G: 2001 AU Image Survey Results by Alumni StatusPage G - 28

29. The Airbag Research is Significant. (by Alumni Status)
Crosstab
% within Have you, spouse, or kids attended Auburn
2.3% 8.3% 3.6%97.7% 91.7% 96.4%
100.0% 100.0% 100.0%
NoYes
Is the airbag researchsignificantTotal
No Yes
Have you, spouse, orkids attended Auburn
Total
Chi-Square Tests
1.933b 1 .164.598 1 .439
1.600 1 .206.207 .207
1.915 1 .166
110
Pearson Chi-SquareContinuity Correctiona
Likelihood RatioFisher's Exact TestLinear-by-LinearAssociationN of Valid Cases
Value dfAsymp. Sig.
(2-sided)Exact Sig.(2-sided)
Exact Sig.(1-sided)
Computed only for a 2x2 tablea.
2 cells (50.0%) have expected count less than 5. The minimum expected count is .87.b.
Symmetric Measures
-.133 .118 -1.390 .167c
-.133 .118 -1.390 .167c
110
Pearson's RInterval by IntervalSpearman CorrelationOrdinal by Ordinal
N of Valid Cases
ValueAsymp.
Std. Errora Approx. Tb Approx. Sig.
Not assuming the null hypothesis.a.
Using the asymptotic standard error assuming the null hypothesis.b.
Based on normal approximation.c.
Appendix G: 2001 AU Image Survey Results by Alumni StatusPage G - 29

30. I Saw the Television Announcement About Auburn University's AirbagResearch.
(by Alumni Status)
Crosstab
% within Have you, spouse, or kids attended Auburn
60.5% 45.8% 57.3%39.5% 54.2% 42.7%
100.0% 100.0% 100.0%
NoYes
Seen T.V. announcementabout airbagsTotal
No Yes
Have you, spouse, orkids attended Auburn
Total
Chi-Square Tests
1.642b 1 .2001.098 1 .2951.627 1 .202
.246 .147
1.627 1 .202
110
Pearson Chi-SquareContinuity Correctiona
Likelihood RatioFisher's Exact TestLinear-by-LinearAssociationN of Valid Cases
Value dfAsymp. Sig.
(2-sided)Exact Sig.(2-sided)
Exact Sig.(1-sided)
Computed only for a 2x2 tablea.
0 cells (.0%) have expected count less than 5. The minimum expected count is 10.25.b.
Symmetric Measures
.122 .096 1.279 .204c
.122 .096 1.279 .204c
110
Pearson's RInterval by IntervalSpearman CorrelationOrdinal by Ordinal
N of Valid Cases
ValueAsymp.
Std. Errora Approx. Tb Approx. Sig.
Not assuming the null hypothesis.a.
Using the asymptotic standard error assuming the null hypothesis.b.
Based on normal approximation.c.
Appendix G: 2001 AU Image Survey Results by Alumni StatusPage G - 30

31. The Airbag Announcement Should Be Continued.(by Alumni Status)
Crosstab
% within Have you, spouse, or kids attended Auburn
8.8% 7.7% 8.5%
91.2% 92.3% 91.5%100.0% 100.0% 100.0%
No
Yes
Should airbagannouncementbe continuedTotal
No Yes
Have you, spouse, orkids attended Auburn
Total
Chi-Square Tests
.015b 1 .901
.000 1 1.000
.016 1 .9001.000 .696
.015 1 .902
47
Pearson Chi-SquareContinuity Correctiona
Likelihood RatioFisher's Exact TestLinear-by-LinearAssociationN of Valid Cases
Value dfAsymp. Sig.
(2-sided)Exact Sig.(2-sided)
Exact Sig.(1-sided)
Computed only for a 2x2 tablea.
2 cells (50.0%) have expected count less than 5. The minimum expected count is 1.11.b.
Symmetric Measures
.018 .142 .122 .904c
.018 .142 .122 .904c
47
Pearson's RInterval by IntervalSpearman CorrelationOrdinal by Ordinal
N of Valid Cases
ValueAsymp.
Std. Errora Approx. Tb Approx. Sig.
Not assuming the null hypothesis.a.
Using the asymptotic standard error assuming the null hypothesis.b.
Based on normal approximation.c.
Appendix G: 2001 AU Image Survey Results by Alumni StatusPage G - 31

32. I Am Aware That Auburn University Impacts the Economy.(by Alumni Status)
Crosstab
% within Have you, spouse, or kids attended Auburn
40.2% 17.8% 35.8%59.8% 82.2% 64.2%
100.0% 100.0% 100.0%
NoYes
Aware Auburn impactsthe economyTotal
No Yes
Have you, spouse, orkids attended Auburn
Total
Chi-Square Tests
17.694b 1 .00016.732 1 .00019.299 1 .000
.000 .000
17.659 1 .000
506
Pearson Chi-SquareContinuity Correctiona
Likelihood RatioFisher's Exact TestLinear-by-LinearAssociationN of Valid Cases
Value dfAsymp. Sig.
(2-sided)Exact Sig.(2-sided)
Exact Sig.(1-sided)
Computed only for a 2x2 tablea.
0 cells (.0%) have expected count less than 5. The minimum expected count is 36.13.b.
Symmetric Measures
.187 .038 4.274 .000c
.187 .038 4.274 .000c
506
Pearson's RInterval by IntervalSpearman CorrelationOrdinal by Ordinal
N of Valid Cases
ValueAsymp.
Std. Errora Approx. Tb Approx. Sig.
Not assuming the null hypothesis.a.
Using the asymptotic standard error assuming the null hypothesis.b.
Based on normal approximation.c.
Appendix G: 2001 AU Image Survey Results by Alumni StatusPage G - 32

33. I Saw the Television Announcement About Auburn University's Impacts.(by Alumni Status)
Crosstab
% within Have you, spouse, or kids attended Auburn
59.5% 51.8% 57.5%40.5% 48.2% 42.5%
100.0% 100.0% 100.0%
NoYes
Seen T.V. announcementabout the impactsTotal
No Yes
Have you, spouse, orkids attended Auburn
Total
Chi-Square Tests
1.499b 1 .2211.200 1 .2731.490 1 .222
.248 .137
1.494 1 .222
325
Pearson Chi-SquareContinuity Correctiona
Likelihood RatioFisher's Exact TestLinear-by-LinearAssociationN of Valid Cases
Value dfAsymp. Sig.
(2-sided)Exact Sig.(2-sided)
Exact Sig.(1-sided)
Computed only for a 2x2 tablea.
0 cells (.0%) have expected count less than 5. The minimum expected count is 35.24.b.
Symmetric Measures
.068 .056 1.223 .222c
.068 .056 1.223 .222c
325
Pearson's RInterval by IntervalSpearman CorrelationOrdinal by Ordinal
N of Valid Cases
ValueAsymp.
Std. Errora Approx. Tb Approx. Sig.
Not assuming the null hypothesis.a.
Using the asymptotic standard error assuming the null hypothesis.b.
Based on normal approximation.c.
Appendix G: 2001 AU Image Survey Results by Alumni StatusPage G - 33

34. The Impact Announcement Should Be Continued.(by Alumni Status)
Crosstab
% within Have you, spouse, or kids attended Auburn
2.0% 2.5% 2.2%
98.0% 97.5% 97.8%100.0% 100.0% 100.0%
No
Yes
Should impactannouncementbe continuedTotal
No Yes
Have you, spouse, orkids attended Auburn
Total
Chi-Square Tests
.028b 1 .867
.000 1 1.000
.027 1 .8681.000 .645
.028 1 .867
138
Pearson Chi-SquareContinuity Correctiona
Likelihood RatioFisher's Exact TestLinear-by-LinearAssociationN of Valid Cases
Value dfAsymp. Sig.
(2-sided)Exact Sig.(2-sided)
Exact Sig.(1-sided)
Computed only for a 2x2 tablea.
2 cells (50.0%) have expected count less than 5. The minimum expected count is .87.b.
Symmetric Measures
-.014 .088 -.167 .868c
-.014 .088 -.167 .868c
138
Pearson's RInterval by IntervalSpearman CorrelationOrdinal by Ordinal
N of Valid Cases
ValueAsymp.
Std. Errora Approx. Tb Approx. Sig.
Not assuming the null hypothesis.a.
Using the asymptotic standard error assuming the null hypothesis.b.
Based on normal approximation.c.
Appendix G: 2001 AU Image Survey Results by Alumni StatusPage G - 34

35. I Am Aware That Auburn University Improves Highway Construction.(by Alumni Status)
Crosstab
% within Have you, spouse, or kids attended Auburn
66.4% 51.5% 63.4%33.6% 48.5% 36.6%
100.0% 100.0% 100.0%
NoYes
Aware Auburn improvedhighway constructionTotal
No Yes
Have you, spouse, orkids attended Auburn
Total
Chi-Square Tests
7.774b 1 .0057.143 1 .0087.580 1 .006
.008 .004
7.759 1 .005
506
Pearson Chi-SquareContinuity Correctiona
Likelihood RatioFisher's Exact TestLinear-by-LinearAssociationN of Valid Cases
Value dfAsymp. Sig.
(2-sided)Exact Sig.(2-sided)
Exact Sig.(1-sided)
Computed only for a 2x2 tablea.
0 cells (.0%) have expected count less than 5. The minimum expected count is 36.93.b.
Symmetric Measures
.124 .046 2.804 .005c
.124 .046 2.804 .005c
506
Pearson's RInterval by IntervalSpearman CorrelationOrdinal by Ordinal
N of Valid Cases
ValueAsymp.
Std. Errora Approx. Tb Approx. Sig.
Not assuming the null hypothesis.a.
Using the asymptotic standard error assuming the null hypothesis.b.
Based on normal approximation.c.
Appendix G: 2001 AU Image Survey Results by Alumni StatusPage G - 35

36. The Highway Construction Research is Significant.(by Alumni Status)
Crosstab
% within Have you, spouse, or kids attended Auburn
2.2% 2.0% 2.2%
97.8% 98.0% 97.8%100.0% 100.0% 100.0%
No
Yes
Is the highwayconstructionresearch significantTotal
No Yes
Have you, spouse, orkids attended Auburn
Total
Chi-Square Tests
.005b 1 .946
.000 1 1.000
.005 1 .9451.000 .714
.005 1 .946
185
Pearson Chi-SquareContinuity Correctiona
Likelihood RatioFisher's Exact TestLinear-by-LinearAssociationN of Valid Cases
Value dfAsymp. Sig.
(2-sided)Exact Sig.(2-sided)
Exact Sig.(1-sided)
Computed only for a 2x2 tablea.
2 cells (50.0%) have expected count less than 5. The minimum expected count is 1.06.b.
Symmetric Measures
.005 .072 .068 .946c
.005 .072 .068 .946c
185
Pearson's RInterval by IntervalSpearman CorrelationOrdinal by Ordinal
N of Valid Cases
ValueAsymp.
Std. Errora Approx. Tb Approx. Sig.
Not assuming the null hypothesis.a.
Using the asymptotic standard error assuming the null hypothesis.b.
Based on normal approximation.c.
Appendix G: 2001 AU Image Survey Results by Alumni StatusPage G - 36

37. I Am Aware That Auburn University Fisheries Sustains One of the World's Leading Food Sources. (by Alumni Status)
Crosstab
% within Have you, spouse, or kids attended Auburn
42.5% 28.7% 39.7%57.5% 71.3% 60.3%
100.0% 100.0% 100.0%
NoYes
Aware Auburn fisheriessustains food sourcesTotal
No Yes
Have you, spouse, orkids attended Auburn
Total
Chi-Square Tests
6.389b 1 .0115.827 1 .0166.599 1 .010
.012 .007
6.376 1 .012
506
Pearson Chi-SquareContinuity Correctiona
Likelihood RatioFisher's Exact TestLinear-by-LinearAssociationN of Valid Cases
Value dfAsymp. Sig.
(2-sided)Exact Sig.(2-sided)
Exact Sig.(1-sided)
Computed only for a 2x2 tablea.
0 cells (.0%) have expected count less than 5. The minimum expected count is 40.12.b.
Symmetric Measures
.112 .042 2.539 .011c
.112 .042 2.539 .011c
506
Pearson's RInterval by IntervalSpearman CorrelationOrdinal by Ordinal
N of Valid Cases
ValueAsymp.
Std. Errora Approx. Tb Approx. Sig.
Not assuming the null hypothesis.a.
Using the asymptotic standard error assuming the null hypothesis.b.
Based on normal approximation.c.
Appendix G: 2001 AU Image Survey Results by Alumni StatusPage G - 37

38. The Fisheries Research is Significant. (by Alumni Status)
Crosstab
% within Have you, spouse, or kids attended Auburn
1.7% 1.4% 1.6%98.3% 98.6% 98.4%
100.0% 100.0% 100.0%
NoYes
Is the fisheries researchsignificantTotal
No Yes
Have you, spouse, orkids attended Auburn
Total
Chi-Square Tests
.037b 1 .848
.000 1 1.000
.038 1 .8451.000 .662
.037 1 .848
305
Pearson Chi-SquareContinuity Correctiona
Likelihood RatioFisher's Exact TestLinear-by-LinearAssociationN of Valid Cases
Value dfAsymp. Sig.
(2-sided)Exact Sig.(2-sided)
Exact Sig.(1-sided)
Computed only for a 2x2 tablea.
2 cells (50.0%) have expected count less than 5. The minimum expected count is 1.18.b.
Symmetric Measures
.011 .054 .191 .849c
.011 .054 .191 .849c
305
Pearson's RInterval by IntervalSpearman CorrelationOrdinal by Ordinal
N of Valid Cases
ValueAsymp.
Std. Errora Approx. Tb Approx. Sig.
Not assuming the null hypothesis.a.
Using the asymptotic standard error assuming the null hypothesis.b.
Based on normal approximation.c.
Appendix G: 2001 AU Image Survey Results by Alumni StatusPage G - 38

39. I Am Aware That Auburn University Architecture Students BuildLow-Income Housing in West Alabama. (by Alumni Status)
Crosstab
% within Have you, spouse, or kids attended Auburn
68.6% 63.4% 67.6%
31.4% 36.6% 32.4%100.0% 100.0% 100.0%
No
Yes
Aware architecturestudents build housingin West AlabamaTotal
No Yes
Have you, spouse, orkids attended Auburn
Total
Chi-Square Tests
1.027b 1 .311.800 1 .371
1.011 1 .315.342 .185
1.025 1 .311
506
Pearson Chi-SquareContinuity Correctiona
Likelihood RatioFisher's Exact TestLinear-by-LinearAssociationN of Valid Cases
Value dfAsymp. Sig.
(2-sided)Exact Sig.(2-sided)
Exact Sig.(1-sided)
Computed only for a 2x2 tablea.
0 cells (.0%) have expected count less than 5. The minimum expected count is 32.74.b.
Symmetric Measures
.045 .045 1.012 .312c
.045 .045 1.012 .312c
506
Pearson's RInterval by IntervalSpearman CorrelationOrdinal by Ordinal
N of Valid Cases
ValueAsymp.
Std. Errora Approx. Tb Approx. Sig.
Not assuming the null hypothesis.a.
Using the asymptotic standard error assuming the null hypothesis.b.
Based on normal approximation.c.
Appendix G: 2001 AU Image Survey Results by Alumni StatusPage G - 39

40. The Low-Income Housing Program in West Alabama Should Be Continued.(by Alumni Status)
Crosstab
% within Have you, spouse, or kids attended Auburn
1.6% 8.1% 3.0%98.4% 91.9% 97.0%
100.0% 100.0% 100.0%
NoYes
Should housing programbe continuedTotal
No Yes
Have you, spouse, orkids attended Auburn
Total
Chi-Square Tests
4.138b 1 .0422.222 1 .1363.354 1 .067
.076 .076
4.112 1 .043
164
Pearson Chi-SquareContinuity Correctiona
Likelihood RatioFisher's Exact TestLinear-by-LinearAssociationN of Valid Cases
Value dfAsymp. Sig.
(2-sided)Exact Sig.(2-sided)
Exact Sig.(1-sided)
Computed only for a 2x2 tablea.
2 cells (50.0%) have expected count less than 5. The minimum expected count is 1.13.b.
Symmetric Measures
-.159 .097 -2.048 .042c
-.159 .097 -2.048 .042c
164
Pearson's RInterval by IntervalSpearman CorrelationOrdinal by Ordinal
N of Valid Cases
ValueAsymp.
Std. Errora Approx. Tb Approx. Sig.
Not assuming the null hypothesis.a.
Using the asymptotic standard error assuming the null hypothesis.b.
Based on normal approximation.c.
Appendix G: 2001 AU Image Survey Results by Alumni StatusPage G - 40

41. I Am Aware of Auburn University's Continuing Education Programs.(by Alumni Status)
Crosstab
% within Have you, spouse, or kids attended Auburn
32.6% 14.9% 29.1%
67.4% 85.1% 70.9%100.0% 100.0% 100.0%
No
Yes
Aware of Auburncontinuingeducation programsTotal
No Yes
Have you, spouse, orkids attended Auburn
Total
Chi-Square Tests
12.345b 1 .00011.499 1 .00113.660 1 .000
.000 .000
12.320 1 .000
506
Pearson Chi-SquareContinuity Correctiona
Likelihood RatioFisher's Exact TestLinear-by-LinearAssociationN of Valid Cases
Value dfAsymp. Sig.
(2-sided)Exact Sig.(2-sided)
Exact Sig.(1-sided)
Computed only for a 2x2 tablea.
0 cells (.0%) have expected count less than 5. The minimum expected count is 29.34.b.
Symmetric Measures
.156 .037 3.550 .000c
.156 .037 3.550 .000c
506
Pearson's RInterval by IntervalSpearman CorrelationOrdinal by Ordinal
N of Valid Cases
ValueAsymp.
Std. Errora Approx. Tb Approx. Sig.
Not assuming the null hypothesis.a.
Using the asymptotic standard error assuming the null hypothesis.b.
Based on normal approximation.c.
Appendix G: 2001 AU Image Survey Results by Alumni StatusPage G - 41

42. I Have Participated in a Continuing Education Program Offered byAuburn University. (by Alumni Status)
Crosstab
% within Have you, spouse, or kids attended Auburn
89.0% 74.4% 85.5%
11.0% 25.6% 14.5%100.0% 100.0% 100.0%
No
Yes
Have taken anycontinuingeducation programsTotal
No Yes
Have you, spouse, orkids attended Auburn
Total
Chi-Square Tests
11.243b 1 .00110.095 1 .00110.135 1 .001
.001 .001
11.211 1 .001
359
Pearson Chi-SquareContinuity Correctiona
Likelihood RatioFisher's Exact TestLinear-by-LinearAssociationN of Valid Cases
Value dfAsymp. Sig.
(2-sided)Exact Sig.(2-sided)
Exact Sig.(1-sided)
Computed only for a 2x2 tablea.
0 cells (.0%) have expected count less than 5. The minimum expected count is 12.46.b.
Symmetric Measures
.177 .060 3.397 .001c
.177 .060 3.397 .001c
359
Pearson's RInterval by IntervalSpearman CorrelationOrdinal by Ordinal
N of Valid Cases
ValueAsymp.
Std. Errora Approx. Tb Approx. Sig.
Not assuming the null hypothesis.a.
Using the asymptotic standard error assuming the null hypothesis.b.
Based on normal approximation.c.
Appendix G: 2001 AU Image Survey Results by Alumni StatusPage G - 42

43. I Am Aware of Auburn University's Partnerships With Local Schools.(by Alumni Status)
Crosstab
% within Have you, spouse, or kids attended Auburn
67.9% 62.4% 66.8%
32.1% 37.6% 33.2%100.0% 100.0% 100.0%
No
Yes
Aware of Auburnpartnerships withlocal schoolsTotal
No Yes
Have you, spouse, orkids attended Auburn
Total
Chi-Square Tests
1.113b 1 .292.877 1 .349
1.096 1 .295.291 .174
1.110 1 .292
506
Pearson Chi-SquareContinuity Correctiona
Likelihood RatioFisher's Exact TestLinear-by-LinearAssociationN of Valid Cases
Value dfAsymp. Sig.
(2-sided)Exact Sig.(2-sided)
Exact Sig.(1-sided)
Computed only for a 2x2 tablea.
0 cells (.0%) have expected count less than 5. The minimum expected count is 33.53.b.
Symmetric Measures
.047 .045 1.054 .292c
.047 .045 1.054 .292c
506
Pearson's RInterval by IntervalSpearman CorrelationOrdinal by Ordinal
N of Valid Cases
ValueAsymp.
Std. Errora Approx. Tb Approx. Sig.
Not assuming the null hypothesis.a.
Using the asymptotic standard error assuming the null hypothesis.b.
Based on normal approximation.c.
Appendix G: 2001 AU Image Survey Results by Alumni StatusPage G - 43

44. The School Partnerships Should Be Continued. (by Alumni Status)
Crosstab
% within Have you, spouse, or kids attended Auburn
.8% .6%99.2% 100.0% 99.4%
100.0% 100.0% 100.0%
NoYes
Should partnershipsbe continuedTotal
No Yes
Have you, spouse, orkids attended Auburn
Total
Chi-Square Tests
.294b 1 .588
.000 1 1.000
.515 1 .4731.000 .774
.292 1 .589
168
Pearson Chi-SquareContinuity Correctiona
Likelihood RatioFisher's Exact TestLinear-by-LinearAssociationN of Valid Cases
Value dfAsymp. Sig.
(2-sided)Exact Sig.(2-sided)
Exact Sig.(1-sided)
Computed only for a 2x2 tablea.
2 cells (50.0%) have expected count less than 5. The minimum expected count is .23.b.
Symmetric Measures
.042 .021 .540 .590c
.042 .021 .540 .590c
168
Pearson's RInterval by IntervalSpearman CorrelationOrdinal by Ordinal
N of Valid Cases
ValueAsymp.
Std. Errora Approx. Tb Approx. Sig.
Not assuming the null hypothesis.a.
Using the asymptotic standard error assuming the null hypothesis.b.
Based on normal approximation.c.
Appendix G: 2001 AU Image Survey Results by Alumni StatusPage G - 44

45. My Local School District Would Benefit From a Partnership.(by Alumni Status)
Crosstab
% within Have you, spouse, or kids attended Auburn
14.8% 8.9% 13.6%
85.2% 91.1% 86.4%100.0% 100.0% 100.0%
No
Yes
Would local schooldistrict benefit frompartnershipTotal
No Yes
Have you, spouse, orkids attended Auburn
Total
Chi-Square Tests
2.393b 1 .1221.918 1 .1662.610 1 .106
.145 .079
2.388 1 .122
506
Pearson Chi-SquareContinuity Correctiona
Likelihood RatioFisher's Exact TestLinear-by-LinearAssociationN of Valid Cases
Value dfAsymp. Sig.
(2-sided)Exact Sig.(2-sided)
Exact Sig.(1-sided)
Computed only for a 2x2 tablea.
0 cells (.0%) have expected count less than 5. The minimum expected count is 13.77.b.
Symmetric Measures
.069 .039 1.547 .122c
.069 .039 1.547 .122c
506
Pearson's RInterval by IntervalSpearman CorrelationOrdinal by Ordinal
N of Valid Cases
ValueAsymp.
Std. Errora Approx. Tb Approx. Sig.
Not assuming the null hypothesis.a.
Using the asymptotic standard error assuming the null hypothesis.b.
Based on normal approximation.c.
Appendix G: 2001 AU Image Survey Results by Alumni StatusPage G - 45

46. I Am Familiar With Auburn University's Cooperative Extension System.(by Alumni Status)
Crosstab
% within Have you, spouse, or kids attended Auburn
52.1% 23.8% 46.4%47.9% 76.2% 53.6%
100.0% 100.0% 100.0%
NoYes
Familiar with CooperativeExtension SystemTotal
No Yes
Have you, spouse, orkids attended Auburn
Total
Chi-Square Tests
26.096b 1 .00024.970 1 .00027.404 1 .000
.000 .000
26.045 1 .000
506
Pearson Chi-SquareContinuity Correctiona
Likelihood RatioFisher's Exact TestLinear-by-LinearAssociationN of Valid Cases
Value dfAsymp. Sig.
(2-sided)Exact Sig.(2-sided)
Exact Sig.(1-sided)
Computed only for a 2x2 tablea.
0 cells (.0%) have expected count less than 5. The minimum expected count is 46.91.b.
Symmetric Measures
.227 .040 5.235 .000c
.227 .040 5.235 .000c
506
Pearson's RInterval by IntervalSpearman CorrelationOrdinal by Ordinal
N of Valid Cases
ValueAsymp.
Std. Errora Approx. Tb Approx. Sig.
Not assuming the null hypothesis.a.
Using the asymptotic standard error assuming the null hypothesis.b.
Based on normal approximation.c.
Appendix G: 2001 AU Image Survey Results by Alumni StatusPage G - 46
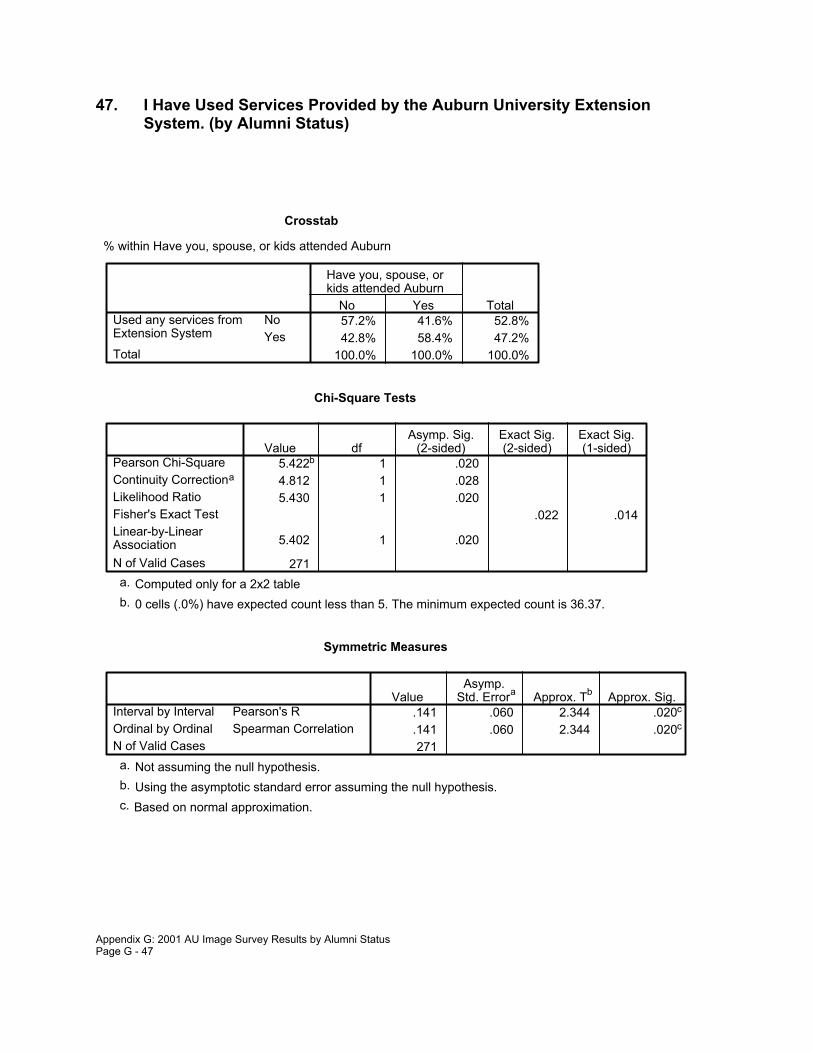
47. I Have Used Services Provided by the Auburn University ExtensionSystem. (by Alumni Status)
Crosstab
% within Have you, spouse, or kids attended Auburn
57.2% 41.6% 52.8%42.8% 58.4% 47.2%
100.0% 100.0% 100.0%
NoYes
Used any services fromExtension SystemTotal
No Yes
Have you, spouse, orkids attended Auburn
Total
Chi-Square Tests
5.422b 1 .0204.812 1 .0285.430 1 .020
.022 .014
5.402 1 .020
271
Pearson Chi-SquareContinuity Correctiona
Likelihood RatioFisher's Exact TestLinear-by-LinearAssociationN of Valid Cases
Value dfAsymp. Sig.
(2-sided)Exact Sig.(2-sided)
Exact Sig.(1-sided)
Computed only for a 2x2 tablea.
0 cells (.0%) have expected count less than 5. The minimum expected count is 36.37.b.
Symmetric Measures
.141 .060 2.344 .020c
.141 .060 2.344 .020c
271
Pearson's RInterval by IntervalSpearman CorrelationOrdinal by Ordinal
N of Valid Cases
ValueAsymp.
Std. Errora Approx. Tb Approx. Sig.
Not assuming the null hypothesis.a.
Using the asymptotic standard error assuming the null hypothesis.b.
Based on normal approximation.c.
Appendix G: 2001 AU Image Survey Results by Alumni StatusPage G - 47

48. The Cooperative Extension Programs Are Beneficial.(by Alumni Status)
Crosstab
% within Have you, spouse, or kids attended Auburn
2.4% 1.6%97.6% 100.0% 98.4%
100.0% 100.0% 100.0%
NoYes
Are Extension programsbeneficialTotal
No Yes
Have you, spouse, orkids attended Auburn
Total
Chi-Square Tests
1.102b 1 .294.092 1 .762
1.750 1 .186.540 .419
1.093 1 .296
128
Pearson Chi-SquareContinuity Correctiona
Likelihood RatioFisher's Exact TestLinear-by-LinearAssociationN of Valid Cases
Value dfAsymp. Sig.
(2-sided)Exact Sig.(2-sided)
Exact Sig.(1-sided)
Computed only for a 2x2 tablea.
2 cells (50.0%) have expected count less than 5. The minimum expected count is .70.b.
Symmetric Measures
.093 .033 1.046 .298c
.093 .033 1.046 .298c
128
Pearson's RInterval by IntervalSpearman CorrelationOrdinal by Ordinal
N of Valid Cases
ValueAsymp.
Std. Errora Approx. Tb Approx. Sig.
Not assuming the null hypothesis.a.
Using the asymptotic standard error assuming the null hypothesis.b.
Based on normal approximation.c.
Appendix G: 2001 AU Image Survey Results by Alumni StatusPage G - 48

49. Auburn University Should Offer More Distance Learning Programs.(by Alumni Status)
Crosstab
% within Have you, spouse, or kids attended Auburn
11.6% 11.9% 11.7%88.4% 88.1% 88.3%
100.0% 100.0% 100.0%
NoYes
Should Auburn offermore distance learningTotal
No Yes
Have you, spouse, orkids attended Auburn
Total
Chi-Square Tests
.006b 1 .938
.000 1 1.000
.006 1 .9381.000 .527
.006 1 .938
506
Pearson Chi-SquareContinuity Correctiona
Likelihood RatioFisher's Exact TestLinear-by-LinearAssociationN of Valid Cases
Value dfAsymp. Sig.
(2-sided)Exact Sig.(2-sided)
Exact Sig.(1-sided)
Computed only for a 2x2 tablea.
0 cells (.0%) have expected count less than 5. The minimum expected count is 11.78.b.
Symmetric Measures
-.003 .045 -.077 .938c
-.003 .045 -.077 .938c
506
Pearson's RInterval by IntervalSpearman CorrelationOrdinal by Ordinal
N of Valid Cases
ValueAsymp.
Std. Errora Approx. Tb Approx. Sig.
Not assuming the null hypothesis.a.
Using the asymptotic standard error assuming the null hypothesis.b.
Based on normal approximation.c.
Appendix G: 2001 AU Image Survey Results by Alumni StatusPage G - 49

50. Is Education an Important Issue? (by Alumni Status)
Crosstab
% within Have you, spouse, or kids attended Auburn
2.7% 3.0% 2.8%97.3% 97.0% 97.2%
100.0% 100.0% 100.0%
NoYes
Is education animportant issueTotal
No Yes
Have you, spouse, orkids attended Auburn
Total
Chi-Square Tests
.019b 1 .889
.000 1 1.000
.019 1 .8901.000 .553
.019 1 .889
506
Pearson Chi-SquareContinuity Correctiona
Likelihood RatioFisher's Exact TestLinear-by-LinearAssociationN of Valid Cases
Value dfAsymp. Sig.
(2-sided)Exact Sig.(2-sided)
Exact Sig.(1-sided)
Computed only for a 2x2 tablea.
1 cells (25.0%) have expected count less than 5. The minimum expected count is 2.79.b.
Symmetric Measures
-.006 .046 -.139 .889c
-.006 .046 -.139 .889c
506
Pearson's RInterval by IntervalSpearman CorrelationOrdinal by Ordinal
N of Valid Cases
ValueAsymp.
Std. Errora Approx. Tb Approx. Sig.
Not assuming the null hypothesis.a.
Using the asymptotic standard error assuming the null hypothesis.b.
Based on normal approximation.c.
Appendix G: 2001 AU Image Survey Results by Alumni StatusPage G - 50

51. Is Community and Economic Development an Important Issue?(by Alumni Status)
Crosstab
% within Have you, spouse, or kids attended Auburn
4.9% 5.9% 5.1%
95.1% 94.1% 94.9%100.0% 100.0% 100.0%
No
Yes
Is community andeconomic developmentan important issueTotal
No Yes
Have you, spouse, orkids attended Auburn
Total
Chi-Square Tests
.167b 1 .683
.024 1 .876
.161 1 .688.622 .420
.166 1 .683
506
Pearson Chi-SquareContinuity Correctiona
Likelihood RatioFisher's Exact TestLinear-by-LinearAssociationN of Valid Cases
Value dfAsymp. Sig.
(2-sided)Exact Sig.(2-sided)
Exact Sig.(1-sided)
Computed only for a 2x2 tablea.
0 cells (.0%) have expected count less than 5. The minimum expected count is 5.19.b.
Symmetric Measures
-.018 .047 -.407 .684c
-.018 .047 -.407 .684c
506
Pearson's RInterval by IntervalSpearman CorrelationOrdinal by Ordinal
N of Valid Cases
ValueAsymp.
Std. Errora Approx. Tb Approx. Sig.
Not assuming the null hypothesis.a.
Using the asymptotic standard error assuming the null hypothesis.b.
Based on normal approximation.c.
Appendix G: 2001 AU Image Survey Results by Alumni StatusPage G - 51

52. Is Agriculture an Important Issue? (by Alumni Status)
Crosstab
% within Have you, spouse, or kids attended Auburn
10.9% 7.9% 10.3%89.1% 92.1% 89.7%
100.0% 100.0% 100.0%
NoYes
Is agriculture animportant issueTotal
No Yes
Have you, spouse, orkids attended Auburn
Total
Chi-Square Tests
.760b 1 .383
.474 1 .491
.804 1 .370.466 .251
.758 1 .384
506
Pearson Chi-SquareContinuity Correctiona
Likelihood RatioFisher's Exact TestLinear-by-LinearAssociationN of Valid Cases
Value dfAsymp. Sig.
(2-sided)Exact Sig.(2-sided)
Exact Sig.(1-sided)
Computed only for a 2x2 tablea.
0 cells (.0%) have expected count less than 5. The minimum expected count is 10.38.b.
Symmetric Measures
.039 .041 .870 .384c
.039 .041 .870 .384c
506
Pearson's RInterval by IntervalSpearman CorrelationOrdinal by Ordinal
N of Valid Cases
ValueAsymp.
Std. Errora Approx. Tb Approx. Sig.
Not assuming the null hypothesis.a.
Using the asymptotic standard error assuming the null hypothesis.b.
Based on normal approximation.c.
Appendix G: 2001 AU Image Survey Results by Alumni StatusPage G - 52

53. Are Family and Youth Important Issues? (by Alumni Status)
Crosstab
% within Have you, spouse, or kids attended Auburn
6.2% 6.9% 6.3%93.8% 93.1% 93.7%
100.0% 100.0% 100.0%
NoYes
Is family and youth andimportant issueTotal
No Yes
Have you, spouse, orkids attended Auburn
Total
Chi-Square Tests
.078b 1 .780
.003 1 .959
.077 1 .782.819 .463
.078 1 .780
506
Pearson Chi-SquareContinuity Correctiona
Likelihood RatioFisher's Exact TestLinear-by-LinearAssociationN of Valid Cases
Value dfAsymp. Sig.
(2-sided)Exact Sig.(2-sided)
Exact Sig.(1-sided)
Computed only for a 2x2 tablea.
0 cells (.0%) have expected count less than 5. The minimum expected count is 6.39.b.
Symmetric Measures
-.012 .046 -.279 .780c
-.012 .046 -.279 .780c
506
Pearson's RInterval by IntervalSpearman CorrelationOrdinal by Ordinal
N of Valid Cases
ValueAsymp.
Std. Errora Approx. Tb Approx. Sig.
Not assuming the null hypothesis.a.
Using the asymptotic standard error assuming the null hypothesis.b.
Based on normal approximation.c.
Appendix G: 2001 AU Image Survey Results by Alumni StatusPage G - 53

54. Is the Environment an Important Issue? (by Alumni Status)
Crosstab
% within Have you, spouse, or kids attended Auburn
7.7% 6.9% 7.5%92.3% 93.1% 92.5%
100.0% 100.0% 100.0%
NoYes
Is the environmentan important issueTotal
No Yes
Have you, spouse, orkids attended Auburn
Total
Chi-Square Tests
.061b 1 .805
.001 1 .971
.062 1 .8031.000 .500
.061 1 .805
506
Pearson Chi-SquareContinuity Correctiona
Likelihood RatioFisher's Exact TestLinear-by-LinearAssociationN of Valid Cases
Value dfAsymp. Sig.
(2-sided)Exact Sig.(2-sided)
Exact Sig.(1-sided)
Computed only for a 2x2 tablea.
0 cells (.0%) have expected count less than 5. The minimum expected count is 7.58.b.
Symmetric Measures
.011 .043 .246 .805c
.011 .043 .246 .805c
506
Pearson's RInterval by IntervalSpearman CorrelationOrdinal by Ordinal
N of Valid Cases
ValueAsymp.
Std. Errora Approx. Tb Approx. Sig.
Not assuming the null hypothesis.a.
Using the asymptotic standard error assuming the null hypothesis.b.
Based on normal approximation.c.
Appendix G: 2001 AU Image Survey Results by Alumni StatusPage G - 54

55. How Significant is It to Have Outreach Programs in Your Community?(by Alumni Status)
Crosstab
% within Have you, spouse, or kids attended Auburn
4.9% 2.0% 4.3%4.9% 4.0% 4.7%6.7% 4.0% 6.1%2.2% 1.0% 2.0%
32.3% 36.6% 33.2%48.9% 52.5% 49.6%
100.0% 100.0% 100.0%
No opinionVery insignificantInsignificantNeutralSignificantVery significant
How significantis it to haveoutreachprograms incommunity
Total
No Yes
Have you, spouse, orkids attended Auburn
Total
Chi-Square Tests
4.035a 5 .5444.563 5 .471
2.679 1 .102
506
Pearson Chi-SquareLikelihood RatioLinear-by-LinearAssociationN of Valid Cases
Value dfAsymp. Sig.
(2-sided)
3 cells (25.0%) have expected count less than 5. The minimum expected count is 2.00.a.
Symmetric Measures
.073 .039 1.639 .102c
.053 .042 1.184 .237c
506
Pearson's RInterval by IntervalSpearman CorrelationOrdinal by Ordinal
N of Valid Cases
ValueAsymp.
Std. Errora Approx. Tb Approx. Sig.
Not assuming the null hypothesis.a.
Using the asymptotic standard error assuming the null hypothesis.b.
Based on normal approximation.c.
Appendix G: 2001 AU Image Survey Results by Alumni StatusPage G - 55
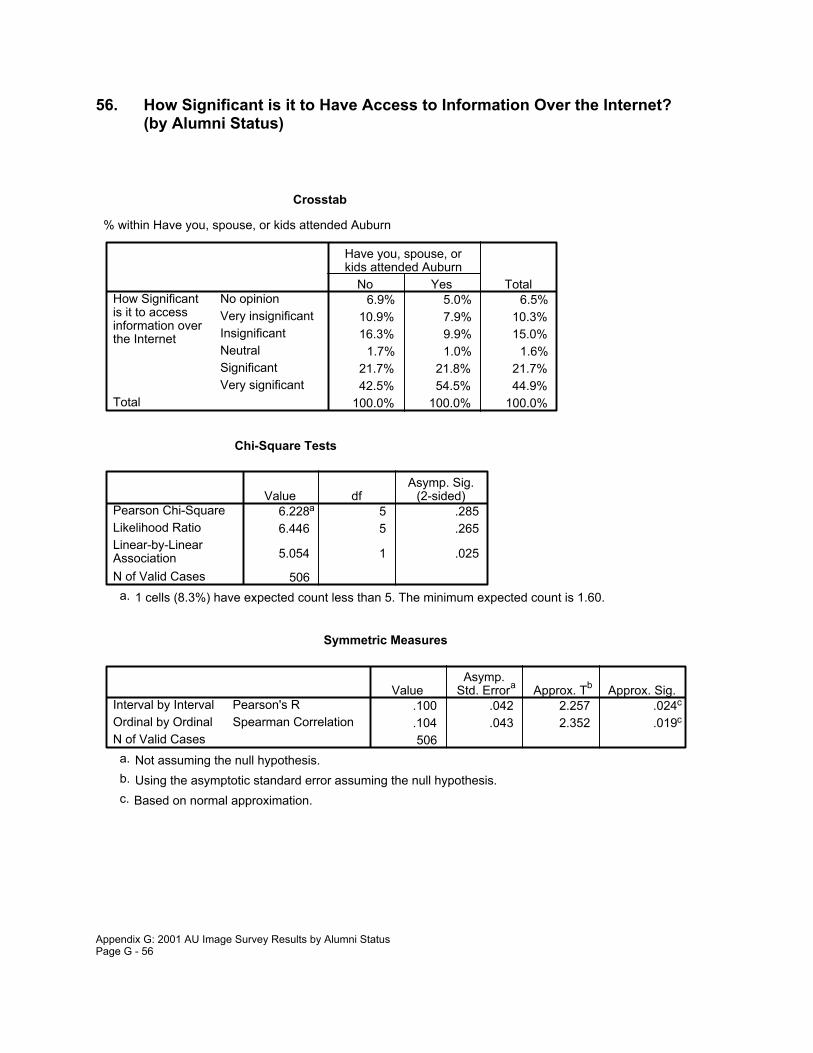
56. How Significant is it to Have Access to Information Over the Internet?(by Alumni Status)
Crosstab
% within Have you, spouse, or kids attended Auburn
6.9% 5.0% 6.5%10.9% 7.9% 10.3%16.3% 9.9% 15.0%
1.7% 1.0% 1.6%21.7% 21.8% 21.7%42.5% 54.5% 44.9%
100.0% 100.0% 100.0%
No opinionVery insignificantInsignificantNeutralSignificantVery significant
How Significantis it to accessinformation overthe Internet
Total
No Yes
Have you, spouse, orkids attended Auburn
Total
Chi-Square Tests
6.228a 5 .2856.446 5 .265
5.054 1 .025
506
Pearson Chi-SquareLikelihood RatioLinear-by-LinearAssociationN of Valid Cases
Value dfAsymp. Sig.
(2-sided)
1 cells (8.3%) have expected count less than 5. The minimum expected count is 1.60.a.
Symmetric Measures
.100 .042 2.257 .024c
.104 .043 2.352 .019c
506
Pearson's RInterval by IntervalSpearman CorrelationOrdinal by Ordinal
N of Valid Cases
ValueAsymp.
Std. Errora Approx. Tb Approx. Sig.
Not assuming the null hypothesis.a.
Using the asymptotic standard error assuming the null hypothesis.b.
Based on normal approximation.c.
Appendix G: 2001 AU Image Survey Results by Alumni StatusPage G - 56

Appendix H: 2001 AU Image Survey ResponsesControlled by Race
1. How Familiar Are You With Auburn University? (by Race)
Crosstab
% within Race by Category
19.2% 10.4% 12.3%33.7% 24.3% 26.3%
1.3% 1.0%31.7% 36.6% 35.5%15.4% 27.4% 24.8%
100.0% 100.0% 100.0%
Not at all familiarNot very familiarNeutralFamiliarVery familiar
How familiarare you withAuburn
Total
AfricianAmerican White
Race by Category
Total
Chi-Square Tests
14.517a 4 .00615.441 4 .004
12.803 1 .000
487
Pearson Chi-SquareLikelihood RatioLinear-by-LinearAssociationN of Valid Cases
Value dfAsymp. Sig.
(2-sided)
2 cells (20.0%) have expected count less than 5. The minimum expected count is 1.07.a.
Symmetric Measures
.162 .045 3.622 .000c
.161 .044 3.596 .000c
487
Pearson's RInterval by IntervalSpearman CorrelationOrdinal by Ordinal
N of Valid Cases
ValueAsymp.
Std. Errora Approx. Tb Approx. Sig.
Not assuming the null hypothesis.a.
Using the asymptotic standard error assuming the null hypothesis.b.
Based on normal approximation.c.
Appendix H: 2001 AU Image Survey Results by Race CategoryPage H - 1

2. How Important is Auburn University to the Quality of Life in Alabama?(by Race)
Crosstab
% within Race by Category
.8% .6%6.8% 4.0% 4.6%1.9% .4%
48.5% 38.5% 40.7%42.7% 56.7% 53.7%
100.0% 100.0% 100.0%
UnimportantNot very importantNeutralImportantVery important
How importantis Auburn tothe quality oflife in Alabama
Total
AfricianAmerican White
Race by Category
Total
Chi-Square Tests
14.384a 4 .00613.842 4 .008
4.850 1 .028
477
Pearson Chi-SquareLikelihood RatioLinear-by-LinearAssociationN of Valid Cases
Value dfAsymp. Sig.
(2-sided)
5 cells (50.0%) have expected count less than 5. The minimum expected count is .43.a.
Symmetric Measures
.101 .047 2.211 .027c
.120 .046 2.633 .009c
477
Pearson's RInterval by IntervalSpearman CorrelationOrdinal by Ordinal
N of Valid Cases
ValueAsymp.
Std. Errora Approx. Tb Approx. Sig.
Not assuming the null hypothesis.a.
Using the asymptotic standard error assuming the null hypothesis.b.
Based on normal approximation.c.
Appendix H: 2001 AU Image Survey Results by Race CategoryPage H - 2

3. How Important is Auburn University to the Quality of Life in Your LocalCommunity? (by Race)
Crosstab
% within Race by Category
3.3% 2.6%26.3% 16.1% 18.3%
1.0% 1.6% 1.5%45.5% 41.8% 42.6%27.3% 37.2% 35.1%
100.0% 100.0% 100.0%
UnimportantNot very importantNeutralImportantVery important
How important isAuburn to thequality of life inlocal community
Total
AfricianAmerican White
Race by Category
Total
Chi-Square Tests
10.252a 4 .03612.526 4 .014
2.292 1 .130
465
Pearson Chi-SquareLikelihood RatioLinear-by-LinearAssociationN of Valid Cases
Value dfAsymp. Sig.
(2-sided)
2 cells (20.0%) have expected count less than 5. The minimum expected count is 1.49.a.
Symmetric Measures
.070 .046 1.516 .130c
.084 .045 1.818 .070c
465
Pearson's RInterval by IntervalSpearman CorrelationOrdinal by Ordinal
N of Valid Cases
ValueAsymp.
Std. Errora Approx. Tb Approx. Sig.
Not assuming the null hypothesis.a.
Using the asymptotic standard error assuming the null hypothesis.b.
Based on normal approximation.c.
Appendix H: 2001 AU Image Survey Results by Race CategoryPage H - 3

4. How Important is Auburn University Research for Jobs in Your LocalCommunity? (by Race)
Crosstab
% within Race by Category
2.1% 1.6%18.5% 9.7% 11.5%
1.8% 1.4%30.4% 43.1% 40.4%51.1% 43.4% 45.0%
100.0% 100.0% 100.0%
UnimportantNot very importantNeutralImportantVery important
How important isAuburn researchfor jobs in localcommunity
Total
AfricianAmerican White
Race by Category
Total
Chi-Square Tests
12.197a 4 .01614.537 4 .006
.028 1 .868
433
Pearson Chi-SquareLikelihood RatioLinear-by-LinearAssociationN of Valid Cases
Value dfAsymp. Sig.
(2-sided)
3 cells (30.0%) have expected count less than 5. The minimum expected count is 1.27.a.
Symmetric Measures
.008 .051 .166 .868c
-.030 .050 -.622 .534c
433
Pearson's RInterval by IntervalSpearman CorrelationOrdinal by Ordinal
N of Valid Cases
ValueAsymp.
Std. Errora Approx. Tb Approx. Sig.
Not assuming the null hypothesis.a.
Using the asymptotic standard error assuming the null hypothesis.b.
Based on normal approximation.c.
Appendix H: 2001 AU Image Survey Results by Race CategoryPage H - 4

5. Have You or Your Family Benefited from Auburn University?(by Race)
Crosstab
% within Race by Category
76.0% 66.9% 68.9%24.0% 33.1% 31.1%
100.0% 100.0% 100.0%
NoYes
Have you or your familybenefited from AuburnTotal
AfricianAmerican White
Race by Category
Total
Chi-Square Tests
3.115b 1 .0782.708 1 .1003.228 1 .072
.094 .048
3.108 1 .078
488
Pearson Chi-SquareContinuity Correctiona
Likelihood RatioFisher's Exact TestLinear-by-LinearAssociationN of Valid Cases
Value dfAsymp. Sig.
(2-sided)Exact Sig.(2-sided)
Exact Sig.(1-sided)
Computed only for a 2x2 tablea.
0 cells (.0%) have expected count less than 5. The minimum expected count is 32.39.b.
Symmetric Measures
.080 .043 1.767 .078c
.080 .043 1.767 .078c
488
Pearson's RInterval by IntervalSpearman CorrelationOrdinal by Ordinal
N of Valid Cases
ValueAsymp.
Std. Errora Approx. Tb Approx. Sig.
Not assuming the null hypothesis.a.
Using the asymptotic standard error assuming the null hypothesis.b.
Based on normal approximation.c.
Appendix H: 2001 AU Image Survey Results by Race CategoryPage H - 5

6. How Does Auburn University Funding Compare to Other Universitiesin the Southeast? (by Race)
Crosstab
% within Race by Category
15.0% 23.3% 21.3%48.8% 64.7% 60.9%36.3% 12.0% 17.8%
100.0% 100.0% 100.0%
LessAbout the sameMore
How does Auburnfunding compare toother universities inthe Southeast
Total
AfricianAmerican White
Race by Category
Total
Chi-Square Tests
24.716a 2 .00022.019 2 .000
16.511 1 .000
338
Pearson Chi-SquareLikelihood RatioLinear-by-LinearAssociationN of Valid Cases
Value dfAsymp. Sig.
(2-sided)
0 cells (.0%) have expected count less than 5. The minimum expected count is 14.20.a.
Symmetric Measures
-.221 .057 -4.160 .000c
-.219 .057 -4.107 .000c
338
Pearson's RInterval by IntervalSpearman CorrelationOrdinal by Ordinal
N of Valid Cases
ValueAsymp.
Std. Errora Approx. Tb Approx. Sig.
Not assuming the null hypothesis.a.
Using the asymptotic standard error assuming the null hypothesis.b.
Based on normal approximation.c.
Appendix H: 2001 AU Image Survey Results by Race CategoryPage H - 6

7. Auburn University Helps to Create Jobs in Alabama.(by Race)
Crosstab
% within Race by Category
1.0% 1.1% 1.1%13.1% 1.9% 4.2%
.3% .2%49.5% 46.5% 47.2%36.4% 50.3% 47.4%
100.0% 100.0% 100.0%
Strongly disagreeSomewhat disagreeNeutralSomewhat agreeStrongly agree
Auburn helpscreate jobs inAlabama
Total
AfricianAmerican White
Race by Category
Total
Chi-Square Tests
27.246a 4 .00022.167 4 .000
16.564 1 .000
475
Pearson Chi-SquareLikelihood RatioLinear-by-LinearAssociationN of Valid Cases
Value dfAsymp. Sig.
(2-sided)
5 cells (50.0%) have expected count less than 5. The minimum expected count is .21.a.
Symmetric Measures
.187 .052 4.139 .000c
.149 .047 3.279 .001c
475
Pearson's RInterval by IntervalSpearman CorrelationOrdinal by Ordinal
N of Valid Cases
ValueAsymp.
Std. Errora Approx. Tb Approx. Sig.
Not assuming the null hypothesis.a.
Using the asymptotic standard error assuming the null hypothesis.b.
Based on normal approximation.c.
Appendix H: 2001 AU Image Survey Results by Race CategoryPage H - 7

8. Auburn University Graduates Play an Important Role in Your LocalCommunity. (by Race)
Crosstab
% within Race by Category
5.9% 1.9% 2.8%15.7% 4.4% 6.9%
1.0% 1.9% 1.7%43.1% 43.5% 43.4%34.3% 48.2% 45.2%
100.0% 100.0% 100.0%
Strongly disagreeSomewhat disagreeNeutralSomewhat agreeStrongly agree
Auburn graduatesplay importantroles in localcommunity
Total
AfricianAmerican White
Race by Category
Total
Chi-Square Tests
22.994a 4 .00019.942 4 .001
18.757 1 .000
465
Pearson Chi-SquareLikelihood RatioLinear-by-LinearAssociationN of Valid Cases
Value dfAsymp. Sig.
(2-sided)
2 cells (20.0%) have expected count less than 5. The minimum expected count is 1.75.a.
Symmetric Measures
.201 .052 4.416 .000c
.161 .048 3.518 .000c
465
Pearson's RInterval by IntervalSpearman CorrelationOrdinal by Ordinal
N of Valid Cases
ValueAsymp.
Std. Errora Approx. Tb Approx. Sig.
Not assuming the null hypothesis.a.
Using the asymptotic standard error assuming the null hypothesis.b.
Based on normal approximation.c.
Appendix H: 2001 AU Image Survey Results by Race CategoryPage H - 8

9. Auburn University Concentrates on Athletics Rather Than AcademicPrograms (by Race)
Crosstab
% within Race by Category
12.0% 17.6% 16.4%21.0% 33.1% 30.4%
4.0% 6.4% 5.9%35.0% 26.1% 28.0%28.0% 16.8% 19.3%
100.0% 100.0% 100.0%
Strongly disagreeSomewhat disagreeNeutralSomewhat agreeStrongly agree
Auburn concentrateson athletic instead ofacademic programs
Total
AfricianAmerican White
Race by Category
Total
Chi-Square Tests
13.355a 4 .01013.320 4 .010
11.597 1 .001
457
Pearson Chi-SquareLikelihood RatioLinear-by-LinearAssociationN of Valid Cases
Value dfAsymp. Sig.
(2-sided)
0 cells (.0%) have expected count less than 5. The minimum expected count is 5.91.a.
Symmetric Measures
-.159 .046 -3.446 .001c
-.157 .046 -3.385 .001c
457
Pearson's RInterval by IntervalSpearman CorrelationOrdinal by Ordinal
N of Valid Cases
ValueAsymp.
Std. Errora Approx. Tb Approx. Sig.
Not assuming the null hypothesis.a.
Using the asymptotic standard error assuming the null hypothesis.b.
Based on normal approximation.c.
Appendix H: 2001 AU Image Survey Results by Race CategoryPage H - 9
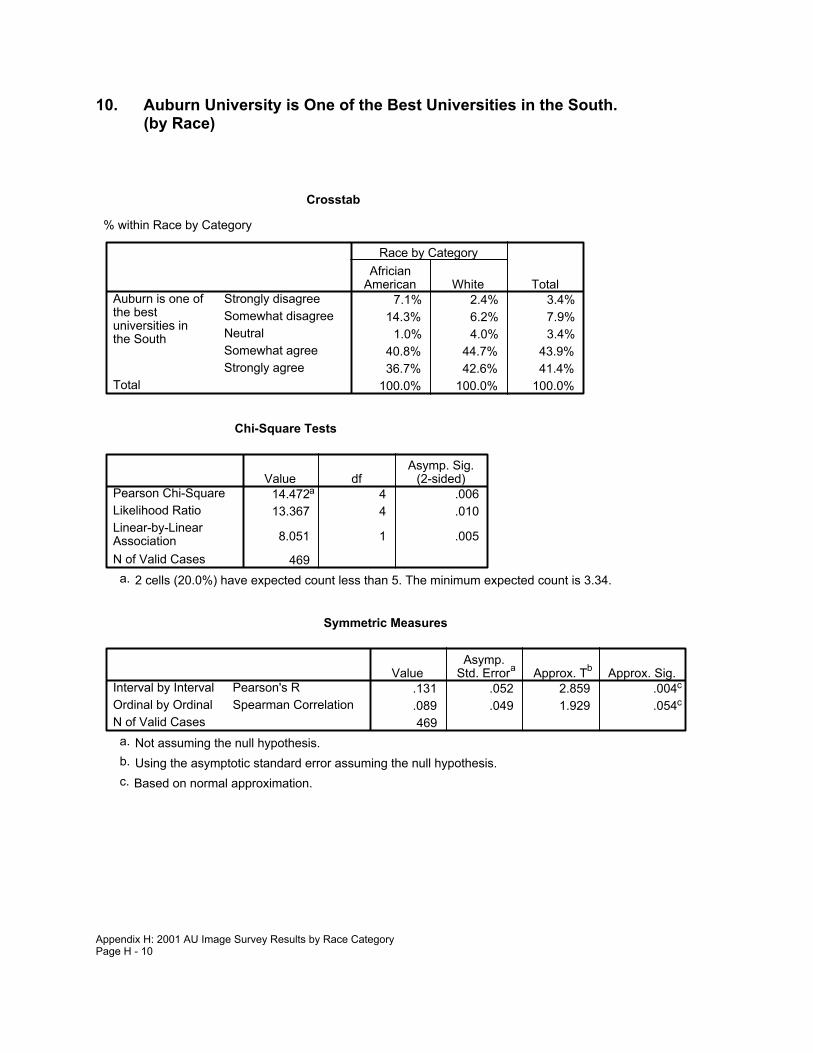
10. Auburn University is One of the Best Universities in the South.(by Race)
Crosstab
% within Race by Category
7.1% 2.4% 3.4%14.3% 6.2% 7.9%
1.0% 4.0% 3.4%40.8% 44.7% 43.9%36.7% 42.6% 41.4%
100.0% 100.0% 100.0%
Strongly disagreeSomewhat disagreeNeutralSomewhat agreeStrongly agree
Auburn is one ofthe bestuniversities inthe South
Total
AfricianAmerican White
Race by Category
Total
Chi-Square Tests
14.472a 4 .00613.367 4 .010
8.051 1 .005
469
Pearson Chi-SquareLikelihood RatioLinear-by-LinearAssociationN of Valid Cases
Value dfAsymp. Sig.
(2-sided)
2 cells (20.0%) have expected count less than 5. The minimum expected count is 3.34.a.
Symmetric Measures
.131 .052 2.859 .004c
.089 .049 1.929 .054c
469
Pearson's RInterval by IntervalSpearman CorrelationOrdinal by Ordinal
N of Valid Cases
ValueAsymp.
Std. Errora Approx. Tb Approx. Sig.
Not assuming the null hypothesis.a.
Using the asymptotic standard error assuming the null hypothesis.b.
Based on normal approximation.c.
Appendix H: 2001 AU Image Survey Results by Race CategoryPage H - 10

11. Auburn University is One of the Best Universities in the Nation.(by Race)
Crosstab
% within Race by Category
10.5% 7.3% 8.0%21.1% 11.8% 13.8%
1.1% 4.5% 3.8%34.7% 47.3% 44.7%32.6% 29.0% 29.8%
100.0% 100.0% 100.0%
Strongly disagreeSomewhat disagreeNeutralSomewhat agreeStrongly agree
Auburn is oneof the bestuniversities inthe nation
Total
AfricianAmerican White
Race by Category
Total
Chi-Square Tests
10.941a 4 .02711.298 4 .023
2.135 1 .144
450
Pearson Chi-SquareLikelihood RatioLinear-by-LinearAssociationN of Valid Cases
Value dfAsymp. Sig.
(2-sided)
1 cells (10.0%) have expected count less than 5. The minimum expected count is 3.59.a.
Symmetric Measures
.069 .051 1.463 .144c
.034 .051 .722 .470c
450
Pearson's RInterval by IntervalSpearman CorrelationOrdinal by Ordinal
N of Valid Cases
ValueAsymp.
Std. Errora Approx. Tb Approx. Sig.
Not assuming the null hypothesis.a.
Using the asymptotic standard error assuming the null hypothesis.b.
Based on normal approximation.c.
Appendix H: 2001 AU Image Survey Results by Race CategoryPage H - 11

12. Alabama Receives a Good Return on Its Investment from AuburnUniversity. (by Race)
Crosstab
% within Race by Category
1.1% .2%6.7% 3.2% 3.9%1.1% 1.7% 1.6%
51.1% 41.5% 43.5%40.0% 53.6% 50.8%
100.0% 100.0% 100.0%
Strongly disagreeSomewhat disagreeNeutralSomewhat agreeStrongly agree
State receives agood return on itsinvestment fromAuburn
Total
AfricianAmerican White
Race by Category
Total
Chi-Square Tests
10.394a 4 .0349.523 4 .049
7.251 1 .007
437
Pearson Chi-SquareLikelihood RatioLinear-by-LinearAssociationN of Valid Cases
Value dfAsymp. Sig.
(2-sided)
4 cells (40.0%) have expected count less than 5. The minimum expected count is .21.a.
Symmetric Measures
.129 .052 2.712 .007c
.118 .048 2.475 .014c
437
Pearson's RInterval by IntervalSpearman CorrelationOrdinal by Ordinal
N of Valid Cases
ValueAsymp.
Std. Errora Approx. Tb Approx. Sig.
Not assuming the null hypothesis.a.
Using the asymptotic standard error assuming the null hypothesis.b.
Based on normal approximation.c.
Appendix H: 2001 AU Image Survey Results by Race CategoryPage H - 12
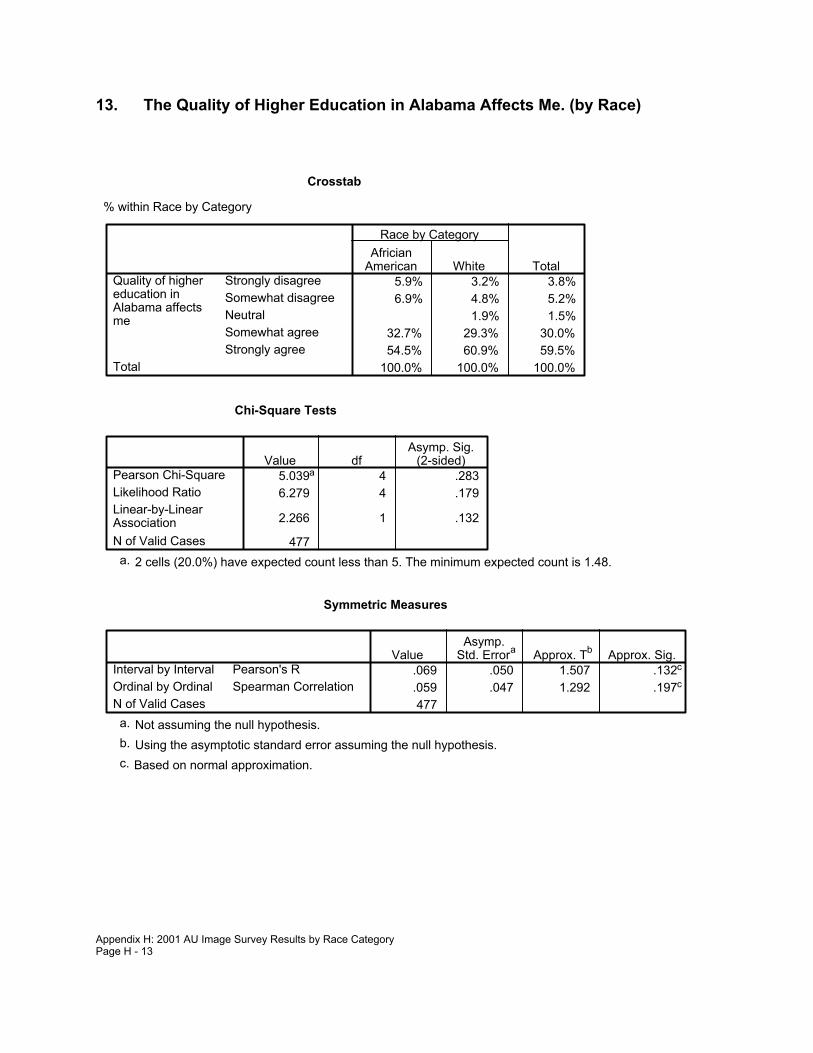
13. The Quality of Higher Education in Alabama Affects Me. (by Race)
Crosstab
% within Race by Category
5.9% 3.2% 3.8%6.9% 4.8% 5.2%
1.9% 1.5%32.7% 29.3% 30.0%54.5% 60.9% 59.5%
100.0% 100.0% 100.0%
Strongly disagreeSomewhat disagreeNeutralSomewhat agreeStrongly agree
Quality of highereducation inAlabama affectsme
Total
AfricianAmerican White
Race by Category
Total
Chi-Square Tests
5.039a 4 .2836.279 4 .179
2.266 1 .132
477
Pearson Chi-SquareLikelihood RatioLinear-by-LinearAssociationN of Valid Cases
Value dfAsymp. Sig.
(2-sided)
2 cells (20.0%) have expected count less than 5. The minimum expected count is 1.48.a.
Symmetric Measures
.069 .050 1.507 .132c
.059 .047 1.292 .197c
477
Pearson's RInterval by IntervalSpearman CorrelationOrdinal by Ordinal
N of Valid Cases
ValueAsymp.
Std. Errora Approx. Tb Approx. Sig.
Not assuming the null hypothesis.a.
Using the asymptotic standard error assuming the null hypothesis.b.
Based on normal approximation.c.
Appendix H: 2001 AU Image Survey Results by Race CategoryPage H - 13

14. I Learn About Alabama Universities from Newspapers. (by Race)
Crosstab
% within Race by Category
44.2% 33.1% 35.5%
55.8% 66.9% 64.5%100.0% 100.0% 100.0%
No
Yes
Learn about Stateuniversities fromnewspapersTotal
AfricianAmerican White
Race by Category
Total
Chi-Square Tests
4.452b 1 .0353.978 1 .0464.356 1 .037
.038 .024
4.443 1 .035
488
Pearson Chi-SquareContinuity Correctiona
Likelihood RatioFisher's Exact TestLinear-by-LinearAssociationN of Valid Cases
Value dfAsymp. Sig.
(2-sided)Exact Sig.(2-sided)
Exact Sig.(1-sided)
Computed only for a 2x2 tablea.
0 cells (.0%) have expected count less than 5. The minimum expected count is 36.87.b.
Symmetric Measures
.096 .047 2.115 .035c
.096 .047 2.115 .035c
488
Pearson's RInterval by IntervalSpearman CorrelationOrdinal by Ordinal
N of Valid Cases
ValueAsymp.
Std. Errora Approx. Tb Approx. Sig.
Not assuming the null hypothesis.a.
Using the asymptotic standard error assuming the null hypothesis.b.
Based on normal approximation.c.
Appendix H: 2001 AU Image Survey Results by Race CategoryPage H - 14

15. I Learn About Alabama Universities From the Radio. (by Race)
Crosstab
% within Race by Category
72.1% 71.1% 71.3%27.9% 28.9% 28.7%
100.0% 100.0% 100.0%
NoYes
Learn about Stateuniversities from radioTotal
AfricianAmerican White
Race by Category
Total
Chi-Square Tests
.042b 1 .838
.007 1 .935
.042 1 .838.903 .471
.042 1 .838
488
Pearson Chi-SquareContinuity Correctiona
Likelihood RatioFisher's Exact TestLinear-by-LinearAssociationN of Valid Cases
Value dfAsymp. Sig.
(2-sided)Exact Sig.(2-sided)
Exact Sig.(1-sided)
Computed only for a 2x2 tablea.
0 cells (.0%) have expected count less than 5. The minimum expected count is 29.84.b.
Symmetric Measures
.009 .045 .204 .839c
.009 .045 .204 .839c
488
Pearson's RInterval by IntervalSpearman CorrelationOrdinal by Ordinal
N of Valid Cases
ValueAsymp.
Std. Errora Approx. Tb Approx. Sig.
Not assuming the null hypothesis.a.
Using the asymptotic standard error assuming the null hypothesis.b.
Based on normal approximation.c.
Appendix H: 2001 AU Image Survey Results by Race CategoryPage H - 15

16. I Learn About Alabama Universities From Magazines. (by Race)
Crosstab
% within Race by Category
61.5% 70.6% 68.6%
38.5% 29.4% 31.4%100.0% 100.0% 100.0%
No
Yes
Learn about Stateuniversities frommagazinesTotal
AfricianAmerican White
Race by Category
Total
Chi-Square Tests
3.104b 1 .0782.698 1 .1003.025 1 .082
.095 .052
3.097 1 .078
488
Pearson Chi-SquareContinuity Correctiona
Likelihood RatioFisher's Exact TestLinear-by-LinearAssociationN of Valid Cases
Value dfAsymp. Sig.
(2-sided)Exact Sig.(2-sided)
Exact Sig.(1-sided)
Computed only for a 2x2 tablea.
0 cells (.0%) have expected count less than 5. The minimum expected count is 32.61.b.
Symmetric Measures
-.080 .047 -1.764 .078c
-.080 .047 -1.764 .078c
488
Pearson's RInterval by IntervalSpearman CorrelationOrdinal by Ordinal
N of Valid Cases
ValueAsymp.
Std. Errora Approx. Tb Approx. Sig.
Not assuming the null hypothesis.a.
Using the asymptotic standard error assuming the null hypothesis.b.
Based on normal approximation.c.
Appendix H: 2001 AU Image Survey Results by Race CategoryPage H - 16

17. I Learn About Alabama Universities From Television. (by Race)
Crosstab
% within Race by Category
49.0% 41.7% 43.2%51.0% 58.3% 56.8%
100.0% 100.0% 100.0%
NoYes
Learn about Stateuniversities from T.V.Total
AfricianAmerican White
Race by Category
Total
Chi-Square Tests
1.812b 1 .1781.524 1 .2171.801 1 .180
.183 .109
1.808 1 .179
488
Pearson Chi-SquareContinuity Correctiona
Likelihood RatioFisher's Exact TestLinear-by-LinearAssociationN of Valid Cases
Value dfAsymp. Sig.
(2-sided)Exact Sig.(2-sided)
Exact Sig.(1-sided)
Computed only for a 2x2 tablea.
0 cells (.0%) have expected count less than 5. The minimum expected count is 44.97.b.
Symmetric Measures
.061 .046 1.346 .179c
.061 .046 1.346 .179c
488
Pearson's RInterval by IntervalSpearman CorrelationOrdinal by Ordinal
N of Valid Cases
ValueAsymp.
Std. Errora Approx. Tb Approx. Sig.
Not assuming the null hypothesis.a.
Using the asymptotic standard error assuming the null hypothesis.b.
Based on normal approximation.c.
Appendix H: 2001 AU Image Survey Results by Race CategoryPage H - 17

18. I Learn About Alabama Universities From the Internet. (by Race)
Crosstab
% within Race by Category
67.3% 65.9% 66.2%
32.7% 34.1% 33.8%100.0% 100.0% 100.0%
No
Yes
Learn about Stateuniversities fromthe InternetTotal
AfricianAmerican White
Race by Category
Total
Chi-Square Tests
.074b 1 .786
.024 1 .877
.074 1 .785.816 .441
.074 1 .786
488
Pearson Chi-SquareContinuity Correctiona
Likelihood RatioFisher's Exact TestLinear-by-LinearAssociationN of Valid Cases
Value dfAsymp. Sig.
(2-sided)Exact Sig.(2-sided)
Exact Sig.(1-sided)
Computed only for a 2x2 tablea.
0 cells (.0%) have expected count less than 5. The minimum expected count is 35.16.b.
Symmetric Measures
.012 .045 .271 .786c
.012 .045 .271 .786c
488
Pearson's RInterval by IntervalSpearman CorrelationOrdinal by Ordinal
N of Valid Cases
ValueAsymp.
Std. Errora Approx. Tb Approx. Sig.
Not assuming the null hypothesis.a.
Using the asymptotic standard error assuming the null hypothesis.b.
Based on normal approximation.c.
Appendix H: 2001 AU Image Survey Results by Race CategoryPage H - 18

19. I Learn About Alabama Universities From Alumni. (by Race)
Crosstab
% within Race by Category
76.0% 64.3% 66.8%24.0% 35.7% 33.2%
100.0% 100.0% 100.0%
NoYes
Learn about Stateuniversities from alumniTotal
AfricianAmerican White
Race by Category
Total
Chi-Square Tests
4.999b 1 .0254.488 1 .0345.212 1 .022
.026 .016
4.988 1 .026
488
Pearson Chi-SquareContinuity Correctiona
Likelihood RatioFisher's Exact TestLinear-by-LinearAssociationN of Valid Cases
Value dfAsymp. Sig.
(2-sided)Exact Sig.(2-sided)
Exact Sig.(1-sided)
Computed only for a 2x2 tablea.
0 cells (.0%) have expected count less than 5. The minimum expected count is 34.52.b.
Symmetric Measures
.101 .042 2.243 .025c
.101 .042 2.243 .025c
488
Pearson's RInterval by IntervalSpearman CorrelationOrdinal by Ordinal
N of Valid Cases
ValueAsymp.
Std. Errora Approx. Tb Approx. Sig.
Not assuming the null hypothesis.a.
Using the asymptotic standard error assuming the null hypothesis.b.
Based on normal approximation.c.
Appendix H: 2001 AU Image Survey Results by Race CategoryPage H - 19

20. I Learn About Alabama Universities From Students. (by Race)
Crosstab
% within Race by Category
63.5% 63.3% 63.3%36.5% 36.7% 36.7%
100.0% 100.0% 100.0%
NoYes
Learn about Stateuniversities from studentsTotal
AfricianAmerican White
Race by Category
Total
Chi-Square Tests
.001b 1 .973
.000 1 1.000
.001 1 .9731.000 .535
.001 1 .973
488
Pearson Chi-SquareContinuity Correctiona
Likelihood RatioFisher's Exact TestLinear-by-LinearAssociationN of Valid Cases
Value dfAsymp. Sig.
(2-sided)Exact Sig.(2-sided)
Exact Sig.(1-sided)
Computed only for a 2x2 tablea.
0 cells (.0%) have expected count less than 5. The minimum expected count is 38.15.b.
Symmetric Measures
.002 .045 .034 .973c
.002 .045 .034 .973c
488
Pearson's RInterval by IntervalSpearman CorrelationOrdinal by Ordinal
N of Valid Cases
ValueAsymp.
Std. Errora Approx. Tb Approx. Sig.
Not assuming the null hypothesis.a.
Using the asymptotic standard error assuming the null hypothesis.b.
Based on normal approximation.c.
Appendix H: 2001 AU Image Survey Results by Race CategoryPage H - 20

21. I Learn About Alabama Universities From My Co-workers. (by Race)
Crosstab
% within Race by Category
71.2% 69.5% 69.9%
28.8% 30.5% 30.1%100.0% 100.0% 100.0%
No
Yes
Learn about Stateuniversities fromco-workersTotal
AfricianAmerican White
Race by Category
Total
Chi-Square Tests
.102b 1 .749
.040 1 .842
.103 1 .748.810 .424
.102 1 .749
488
Pearson Chi-SquareContinuity Correctiona
Likelihood RatioFisher's Exact TestLinear-by-LinearAssociationN of Valid Cases
Value dfAsymp. Sig.
(2-sided)Exact Sig.(2-sided)
Exact Sig.(1-sided)
Computed only for a 2x2 tablea.
0 cells (.0%) have expected count less than 5. The minimum expected count is 31.33.b.
Symmetric Measures
.014 .045 .319 .750c
.014 .045 .319 .750c
488
Pearson's RInterval by IntervalSpearman CorrelationOrdinal by Ordinal
N of Valid Cases
ValueAsymp.
Std. Errora Approx. Tb Approx. Sig.
Not assuming the null hypothesis.a.
Using the asymptotic standard error assuming the null hypothesis.b.
Based on normal approximation.c.
Appendix H: 2001 AU Image Survey Results by Race CategoryPage H - 21

22. I Learn About Alabama Universities From Other Sources. (by Race)
Crosstab
% within Race by Category
86.5% 83.3% 84.0%13.5% 16.7% 16.0%
100.0% 100.0% 100.0%
NoYes
Learn about Stateuniversities from otherTotal
AfricianAmerican White
Race by Category
Total
Chi-Square Tests
.626b 1 .429
.410 1 .522
.647 1 .421.546 .265
.625 1 .429
488
Pearson Chi-SquareContinuity Correctiona
Likelihood RatioFisher's Exact TestLinear-by-LinearAssociationN of Valid Cases
Value dfAsymp. Sig.
(2-sided)Exact Sig.(2-sided)
Exact Sig.(1-sided)
Computed only for a 2x2 tablea.
0 cells (.0%) have expected count less than 5. The minimum expected count is 16.62.b.
Symmetric Measures
.036 .043 .790 .430c
.036 .043 .790 .430c
488
Pearson's RInterval by IntervalSpearman CorrelationOrdinal by Ordinal
N of Valid Cases
ValueAsymp.
Std. Errora Approx. Tb Approx. Sig.
Not assuming the null hypothesis.a.
Using the asymptotic standard error assuming the null hypothesis.b.
Based on normal approximation.c.
Appendix H: 2001 AU Image Survey Results by Race CategoryPage H - 22

23. I Saw a Television Announcement About Auburn University Research.(by Race)
Crosstab
% within Race by Category
63.5% 47.9% 51.2%
36.5% 52.1% 48.8%100.0% 100.0% 100.0%
No
Yes
Seen any T.V.announcements aboutAuburn researchTotal
AfricianAmerican White
Race by Category
Total
Chi-Square Tests
7.915b 1 .0057.305 1 .0078.004 1 .005
.006 .003
7.899 1 .005
488
Pearson Chi-SquareContinuity Correctiona
Likelihood RatioFisher's Exact TestLinear-by-LinearAssociationN of Valid Cases
Value dfAsymp. Sig.
(2-sided)Exact Sig.(2-sided)
Exact Sig.(1-sided)
Computed only for a 2x2 tablea.
0 cells (.0%) have expected count less than 5. The minimum expected count is 50.72.b.
Symmetric Measures
.127 .044 2.831 .005c
.127 .044 2.831 .005c
488
Pearson's RInterval by IntervalSpearman CorrelationOrdinal by Ordinal
N of Valid Cases
ValueAsymp.
Std. Errora Approx. Tb Approx. Sig.
Not assuming the null hypothesis.a.
Using the asymptotic standard error assuming the null hypothesis.b.
Based on normal approximation.c.
Appendix H: 2001 AU Image Survey Results by Race CategoryPage H - 23

24. I Am Aware That Auburn University Developed A New Bulletproof Vest.(by Race)
Crosstab
% within Race by Category
82.7% 73.4% 75.4%17.3% 26.6% 24.6%
100.0% 100.0% 100.0%
NoYes
Aware Auburn developednew bulletproof vestTotal
AfricianAmerican White
Race by Category
Total
Chi-Square Tests
3.780b 1 .0523.297 1 .0694.005 1 .045
.055 .032
3.772 1 .052
488
Pearson Chi-SquareContinuity Correctiona
Likelihood RatioFisher's Exact TestLinear-by-LinearAssociationN of Valid Cases
Value dfAsymp. Sig.
(2-sided)Exact Sig.(2-sided)
Exact Sig.(1-sided)
Computed only for a 2x2 tablea.
0 cells (.0%) have expected count less than 5. The minimum expected count is 25.57.b.
Symmetric Measures
.088 .041 1.948 .052c
.088 .041 1.948 .052c
488
Pearson's RInterval by IntervalSpearman CorrelationOrdinal by Ordinal
N of Valid Cases
ValueAsymp.
Std. Errora Approx. Tb Approx. Sig.
Not assuming the null hypothesis.a.
Using the asymptotic standard error assuming the null hypothesis.b.
Based on normal approximation.c.
Appendix H: 2001 AU Image Survey Results by Race CategoryPage H - 24

25. The Bulletproof Vest Research is Significant. (by Race)
Crosstab
% within Race by Category
2.0% 1.7%100.0% 98.0% 98.3%100.0% 100.0% 100.0%
NoYes
Is the bulletproof vestresearch significantTotal
AfricianAmerican White
Race by Category
Total
Chi-Square Tests
.359b 1 .549
.000 1 1.000
.656 1 .4181.000 .721
.356 1 .551
120
Pearson Chi-SquareContinuity Correctiona
Likelihood RatioFisher's Exact TestLinear-by-LinearAssociationN of Valid Cases
Value dfAsymp. Sig.
(2-sided)Exact Sig.(2-sided)
Exact Sig.(1-sided)
Computed only for a 2x2 tablea.
2 cells (50.0%) have expected count less than 5. The minimum expected count is .30.b.
Symmetric Measures
-.055 .020 -.595 .553c
-.055 .020 -.595 .553c
120
Pearson's RInterval by IntervalSpearman CorrelationOrdinal by Ordinal
N of Valid Cases
ValueAsymp.
Std. Errora Approx. Tb Approx. Sig.
Not assuming the null hypothesis.a.
Using the asymptotic standard error assuming the null hypothesis.b.
Based on normal approximation.c.
Appendix H: 2001 AU Image Survey Results by Race CategoryPage H - 25

26. I Saw a Television Announcement About the Bulletproof Vest.(by Race)
Crosstab
% within Race by Category
55.6% 57.8% 57.5%44.4% 42.2% 42.5%
100.0% 100.0% 100.0%
NoYes
Seen T.V. announcementabout bulletproof vestTotal
AfricianAmerican White
Race by Category
Total
Chi-Square Tests
.033b 1 .856
.000 1 1.000
.033 1 .8571.000 .527
.032 1 .857
120
Pearson Chi-SquareContinuity Correctiona
Likelihood RatioFisher's Exact TestLinear-by-LinearAssociationN of Valid Cases
Value dfAsymp. Sig.
(2-sided)Exact Sig.(2-sided)
Exact Sig.(1-sided)
Computed only for a 2x2 tablea.
0 cells (.0%) have expected count less than 5. The minimum expected count is 7.65.b.
Symmetric Measures
-.017 .092 -.180 .858c
-.017 .092 -.180 .858c
120
Pearson's RInterval by IntervalSpearman CorrelationOrdinal by Ordinal
N of Valid Cases
ValueAsymp.
Std. Errora Approx. Tb Approx. Sig.
Not assuming the null hypothesis.a.
Using the asymptotic standard error assuming the null hypothesis.b.
Based on normal approximation.c.
Appendix H: 2001 AU Image Survey Results by Race CategoryPage H - 26

27. The Bulletproof Vest Announcement Should Be Continued.(by Race)
Crosstab
% within Race by Category
7.0% 5.9%
100.0% 93.0% 94.1%100.0% 100.0% 100.0%
No
Yes
Should bulletproofvest announcementbe continuedTotal
AfricianAmerican White
Race by Category
Total
Chi-Square Tests
.593b 1 .441
.000 1 1.0001.058 1 .304
1.000 .593
.581 1 .446
51
Pearson Chi-SquareContinuity Correctiona
Likelihood RatioFisher's Exact TestLinear-by-LinearAssociationN of Valid Cases
Value dfAsymp. Sig.
(2-sided)Exact Sig.(2-sided)
Exact Sig.(1-sided)
Computed only for a 2x2 tablea.
2 cells (50.0%) have expected count less than 5. The minimum expected count is .47.b.
Symmetric Measures
-.108 .036 -.759 .451c
-.108 .036 -.759 .451c
51
Pearson's RInterval by IntervalSpearman CorrelationOrdinal by Ordinal
N of Valid Cases
ValueAsymp.
Std. Errora Approx. Tb Approx. Sig.
Not assuming the null hypothesis.a.
Using the asymptotic standard error assuming the null hypothesis.b.
Based on normal approximation.c.
Appendix H: 2001 AU Image Survey Results by Race CategoryPage H - 27

28. I Am Aware That Auburn University Developed New Airbags.(by Race)
Crosstab
% within Race by Category
82.7% 78.4% 79.3%17.3% 21.6% 20.7%
100.0% 100.0% 100.0%
NoYes
Aware Auburndeveloped new airbagsTotal
AfricianAmerican White
Race by Category
Total
Chi-Square Tests
.925b 1 .336
.681 1 .409
.955 1 .328.413 .206
.923 1 .337
488
Pearson Chi-SquareContinuity Correctiona
Likelihood RatioFisher's Exact TestLinear-by-LinearAssociationN of Valid Cases
Value dfAsymp. Sig.
(2-sided)Exact Sig.(2-sided)
Exact Sig.(1-sided)
Computed only for a 2x2 tablea.
0 cells (.0%) have expected count less than 5. The minimum expected count is 21.52.b.
Symmetric Measures
.044 .043 .961 .337c
.044 .043 .961 .337c
488
Pearson's RInterval by IntervalSpearman CorrelationOrdinal by Ordinal
N of Valid Cases
ValueAsymp.
Std. Errora Approx. Tb Approx. Sig.
Not assuming the null hypothesis.a.
Using the asymptotic standard error assuming the null hypothesis.b.
Based on normal approximation.c.
Appendix H: 2001 AU Image Survey Results by Race CategoryPage H - 28

29. The Airbag Research is Significant. (by Race)
Crosstab
% within Race by Category
11.1% 2.0%88.9% 100.0% 98.0%
100.0% 100.0% 100.0%
NoYes
Is the airbag researchsignificantTotal
AfricianAmerican White
Race by Category
Total
Chi-Square Tests
9.409b 1 .0024.555 1 .0337.090 1 .008
.030 .030
9.315 1 .002
101
Pearson Chi-SquareContinuity Correctiona
Likelihood RatioFisher's Exact TestLinear-by-LinearAssociationN of Valid Cases
Value dfAsymp. Sig.
(2-sided)Exact Sig.(2-sided)
Exact Sig.(1-sided)
Computed only for a 2x2 tablea.
2 cells (50.0%) have expected count less than 5. The minimum expected count is .36.b.
Symmetric Measures
.305 .104 3.189 .002c
.305 .104 3.189 .002c
101
Pearson's RInterval by IntervalSpearman CorrelationOrdinal by Ordinal
N of Valid Cases
ValueAsymp.
Std. Errora Approx. Tb Approx. Sig.
Not assuming the null hypothesis.a.
Using the asymptotic standard error assuming the null hypothesis.b.
Based on normal approximation.c.
Appendix H: 2001 AU Image Survey Results by Race CategoryPage H - 29

30. I Saw the Television Announcement About Auburn University's AirbagResearch.
(by Race)
Crosstab
% within Race by Category
77.8% 55.4% 59.4%22.2% 44.6% 40.6%
100.0% 100.0% 100.0%
NoYes
Seen T.V. announcementabout airbagsTotal
AfricianAmerican White
Race by Category
Total
Chi-Square Tests
3.066b 1 .0802.209 1 .1373.266 1 .071
.112 .066
3.035 1 .081
101
Pearson Chi-SquareContinuity Correctiona
Likelihood RatioFisher's Exact TestLinear-by-LinearAssociationN of Valid Cases
Value dfAsymp. Sig.
(2-sided)Exact Sig.(2-sided)
Exact Sig.(1-sided)
Computed only for a 2x2 tablea.
0 cells (.0%) have expected count less than 5. The minimum expected count is 7.31.b.
Symmetric Measures
.174 .088 1.760 .081c
.174 .088 1.760 .081c
101
Pearson's RInterval by IntervalSpearman CorrelationOrdinal by Ordinal
N of Valid Cases
ValueAsymp.
Std. Errora Approx. Tb Approx. Sig.
Not assuming the null hypothesis.a.
Using the asymptotic standard error assuming the null hypothesis.b.
Based on normal approximation.c.
Appendix H: 2001 AU Image Survey Results by Race CategoryPage H - 30

31. The Airbag Announcement Should Be Continued. (by Race)
Crosstab
% within Race by Category
8.1% 7.3%
100.0% 91.9% 92.7%100.0% 100.0% 100.0%
No
Yes
Should airbagannouncementbe continuedTotal
AfricianAmerican White
Race by Category
Total
Chi-Square Tests
.350b 1 .554
.000 1 1.000
.641 1 .4231.000 .729
.341 1 .559
41
Pearson Chi-SquareContinuity Correctiona
Likelihood RatioFisher's Exact TestLinear-by-LinearAssociationN of Valid Cases
Value dfAsymp. Sig.
(2-sided)Exact Sig.(2-sided)
Exact Sig.(1-sided)
Computed only for a 2x2 tablea.
3 cells (75.0%) have expected count less than 5. The minimum expected count is .29.b.
Symmetric Measures
-.092 .035 -.579 .566c
-.092 .035 -.579 .566c
41
Pearson's RInterval by IntervalSpearman CorrelationOrdinal by Ordinal
N of Valid Cases
ValueAsymp.
Std. Errora Approx. Tb Approx. Sig.
Not assuming the null hypothesis.a.
Using the asymptotic standard error assuming the null hypothesis.b.
Based on normal approximation.c.
Appendix H: 2001 AU Image Survey Results by Race CategoryPage H - 31

32. I Am Aware That Auburn University Impacts the Economy. (by Race)
Crosstab
% within Race by Category
51.9% 31.5% 35.9%48.1% 68.5% 64.1%
100.0% 100.0% 100.0%
NoYes
Aware Auburn impactsthe economyTotal
AfricianAmerican White
Race by Category
Total
Chi-Square Tests
14.825b 1 .00013.951 1 .00014.370 1 .000
.000 .000
14.795 1 .000
488
Pearson Chi-SquareContinuity Correctiona
Likelihood RatioFisher's Exact TestLinear-by-LinearAssociationN of Valid Cases
Value dfAsymp. Sig.
(2-sided)Exact Sig.(2-sided)
Exact Sig.(1-sided)
Computed only for a 2x2 tablea.
0 cells (.0%) have expected count less than 5. The minimum expected count is 37.30.b.
Symmetric Measures
.174 .047 3.902 .000c
.174 .047 3.902 .000c
488
Pearson's RInterval by IntervalSpearman CorrelationOrdinal by Ordinal
N of Valid Cases
ValueAsymp.
Std. Errora Approx. Tb Approx. Sig.
Not assuming the null hypothesis.a.
Using the asymptotic standard error assuming the null hypothesis.b.
Based on normal approximation.c.
Appendix H: 2001 AU Image Survey Results by Race CategoryPage H - 32

33. I Saw the Television Announcement About Auburn University's Impacts.(by Race)
Crosstab
% within Race by Category
62.0% 57.4% 58.1%38.0% 42.6% 41.9%
100.0% 100.0% 100.0%
NoYes
Seen T.V. announcementabout the impactsTotal
AfricianAmerican White
Race by Category
Total
Chi-Square Tests
.363b 1 .547
.199 1 .656
.366 1 .545.640 .330
.362 1 .547
313
Pearson Chi-SquareContinuity Correctiona
Likelihood RatioFisher's Exact TestLinear-by-LinearAssociationN of Valid Cases
Value dfAsymp. Sig.
(2-sided)Exact Sig.(2-sided)
Exact Sig.(1-sided)
Computed only for a 2x2 tablea.
0 cells (.0%) have expected count less than 5. The minimum expected count is 20.93.b.
Symmetric Measures
.034 .056 .601 .548c
.034 .056 .601 .548c
313
Pearson's RInterval by IntervalSpearman CorrelationOrdinal by Ordinal
N of Valid Cases
ValueAsymp.
Std. Errora Approx. Tb Approx. Sig.
Not assuming the null hypothesis.a.
Using the asymptotic standard error assuming the null hypothesis.b.
Based on normal approximation.c.
Appendix H: 2001 AU Image Survey Results by Race CategoryPage H - 33

34. The Impact Announcement Should Be Continued. (by Race)
Crosstab
% within Race by Category
2.7% 2.3%
100.0% 97.3% 97.7%100.0% 100.0% 100.0%
No
Yes
Should impactannouncementbe continuedTotal
AfricianAmerican White
Race by Category
Total
Chi-Square Tests
.521b 1 .470
.000 1 1.000
.952 1 .3291.000 .622
.517 1 .472
131
Pearson Chi-SquareContinuity Correctiona
Likelihood RatioFisher's Exact TestLinear-by-LinearAssociationN of Valid Cases
Value dfAsymp. Sig.
(2-sided)Exact Sig.(2-sided)
Exact Sig.(1-sided)
Computed only for a 2x2 tablea.
2 cells (50.0%) have expected count less than 5. The minimum expected count is .44.b.
Symmetric Measures
-.063 .020 -.718 .474c
-.063 .020 -.718 .474c
131
Pearson's RInterval by IntervalSpearman CorrelationOrdinal by Ordinal
N of Valid Cases
ValueAsymp.
Std. Errora Approx. Tb Approx. Sig.
Not assuming the null hypothesis.a.
Using the asymptotic standard error assuming the null hypothesis.b.
Based on normal approximation.c.
Appendix H: 2001 AU Image Survey Results by Race CategoryPage H - 34

35. I Am Aware That Auburn University Improves Highway Construction.(by Race)
Crosstab
% within Race by Category
71.2% 62.0% 63.9%28.8% 38.0% 36.1%
100.0% 100.0% 100.0%
NoYes
Aware Auburn improvedhighway constructionTotal
AfricianAmerican White
Race by Category
Total
Chi-Square Tests
2.987b 1 .0842.603 1 .1073.064 1 .080
.086 .052
2.981 1 .084
488
Pearson Chi-SquareContinuity Correctiona
Likelihood RatioFisher's Exact TestLinear-by-LinearAssociationN of Valid Cases
Value dfAsymp. Sig.
(2-sided)Exact Sig.(2-sided)
Exact Sig.(1-sided)
Computed only for a 2x2 tablea.
0 cells (.0%) have expected count less than 5. The minimum expected count is 37.51.b.
Symmetric Measures
.078 .043 1.730 .084c
.078 .043 1.730 .084c
488
Pearson's RInterval by IntervalSpearman CorrelationOrdinal by Ordinal
N of Valid Cases
ValueAsymp.
Std. Errora Approx. Tb Approx. Sig.
Not assuming the null hypothesis.a.
Using the asymptotic standard error assuming the null hypothesis.b.
Based on normal approximation.c.
Appendix H: 2001 AU Image Survey Results by Race CategoryPage H - 35

36. The Highway Construction Research is Significant. (by Race)
Crosstab
% within Race by Category
3.3% 2.1% 2.3%
96.7% 97.9% 97.7%100.0% 100.0% 100.0%
No
Yes
Is the highwayconstructionresearch significantTotal
AfricianAmerican White
Race by Category
Total
Chi-Square Tests
.183b 1 .669
.000 1 1.000
.165 1 .684.530 .530
.182 1 .670
176
Pearson Chi-SquareContinuity Correctiona
Likelihood RatioFisher's Exact TestLinear-by-LinearAssociationN of Valid Cases
Value dfAsymp. Sig.
(2-sided)Exact Sig.(2-sided)
Exact Sig.(1-sided)
Computed only for a 2x2 tablea.
2 cells (50.0%) have expected count less than 5. The minimum expected count is .68.b.
Symmetric Measures
.032 .087 .426 .671c
.032 .087 .426 .671c
176
Pearson's RInterval by IntervalSpearman CorrelationOrdinal by Ordinal
N of Valid Cases
ValueAsymp.
Std. Errora Approx. Tb Approx. Sig.
Not assuming the null hypothesis.a.
Using the asymptotic standard error assuming the null hypothesis.b.
Based on normal approximation.c.
Appendix H: 2001 AU Image Survey Results by Race CategoryPage H - 36

37. I Am Aware That Auburn University Fisheries Sustains One of the World's Leading Food Sources. (by Race)
Crosstab
% within Race by Category
53.8% 35.9% 39.8%46.2% 64.1% 60.2%
100.0% 100.0% 100.0%
NoYes
Aware Auburn fisheriessustains food sourcesTotal
AfricianAmerican White
Race by Category
Total
Chi-Square Tests
10.959b 1 .00110.224 1 .00110.767 1 .001
.001 .001
10.936 1 .001
488
Pearson Chi-SquareContinuity Correctiona
Likelihood RatioFisher's Exact TestLinear-by-LinearAssociationN of Valid Cases
Value dfAsymp. Sig.
(2-sided)Exact Sig.(2-sided)
Exact Sig.(1-sided)
Computed only for a 2x2 tablea.
0 cells (.0%) have expected count less than 5. The minimum expected count is 41.34.b.
Symmetric Measures
.150 .046 3.341 .001c
.150 .046 3.341 .001c
488
Pearson's RInterval by IntervalSpearman CorrelationOrdinal by Ordinal
N of Valid Cases
ValueAsymp.
Std. Errora Approx. Tb Approx. Sig.
Not assuming the null hypothesis.a.
Using the asymptotic standard error assuming the null hypothesis.b.
Based on normal approximation.c.
Appendix H: 2001 AU Image Survey Results by Race CategoryPage H - 37

38. The Fisheries Research is Significant. (by Race)
Crosstab
% within Race by Category
2.1% 1.6% 1.7%97.9% 98.4% 98.3%
100.0% 100.0% 100.0%
NoYes
Is the fisheries researchsignificantTotal
AfricianAmerican White
Race by Category
Total
Chi-Square Tests
.050b 1 .823
.000 1 1.000
.048 1 .827.593 .593
.050 1 .823
294
Pearson Chi-SquareContinuity Correctiona
Likelihood RatioFisher's Exact TestLinear-by-LinearAssociationN of Valid Cases
Value dfAsymp. Sig.
(2-sided)Exact Sig.(2-sided)
Exact Sig.(1-sided)
Computed only for a 2x2 tablea.
2 cells (50.0%) have expected count less than 5. The minimum expected count is .82.b.
Symmetric Measures
.013 .063 .223 .823c
.013 .063 .223 .823c
294
Pearson's RInterval by IntervalSpearman CorrelationOrdinal by Ordinal
N of Valid Cases
ValueAsymp.
Std. Errora Approx. Tb Approx. Sig.
Not assuming the null hypothesis.a.
Using the asymptotic standard error assuming the null hypothesis.b.
Based on normal approximation.c.
Appendix H: 2001 AU Image Survey Results by Race CategoryPage H - 38

39. I Am Aware That Auburn University Architecture Students BuildLow-Income Housing in West Alabama. (by Race)
Crosstab
% within Race by Category
66.3% 68.8% 68.2%
33.7% 31.3% 31.8%100.0% 100.0% 100.0%
No
Yes
Aware architecturestudents build housingin West AlabamaTotal
AfricianAmerican White
Race by Category
Total
Chi-Square Tests
.218b 1 .640
.121 1 .728
.217 1 .642.637 .361
.218 1 .641
488
Pearson Chi-SquareContinuity Correctiona
Likelihood RatioFisher's Exact TestLinear-by-LinearAssociationN of Valid Cases
Value dfAsymp. Sig.
(2-sided)Exact Sig.(2-sided)
Exact Sig.(1-sided)
Computed only for a 2x2 tablea.
0 cells (.0%) have expected count less than 5. The minimum expected count is 33.03.b.
Symmetric Measures
-.021 .046 -.466 .641c
-.021 .046 -.466 .641c
488
Pearson's RInterval by IntervalSpearman CorrelationOrdinal by Ordinal
N of Valid Cases
ValueAsymp.
Std. Errora Approx. Tb Approx. Sig.
Not assuming the null hypothesis.a.
Using the asymptotic standard error assuming the null hypothesis.b.
Based on normal approximation.c.
Appendix H: 2001 AU Image Survey Results by Race CategoryPage H - 39
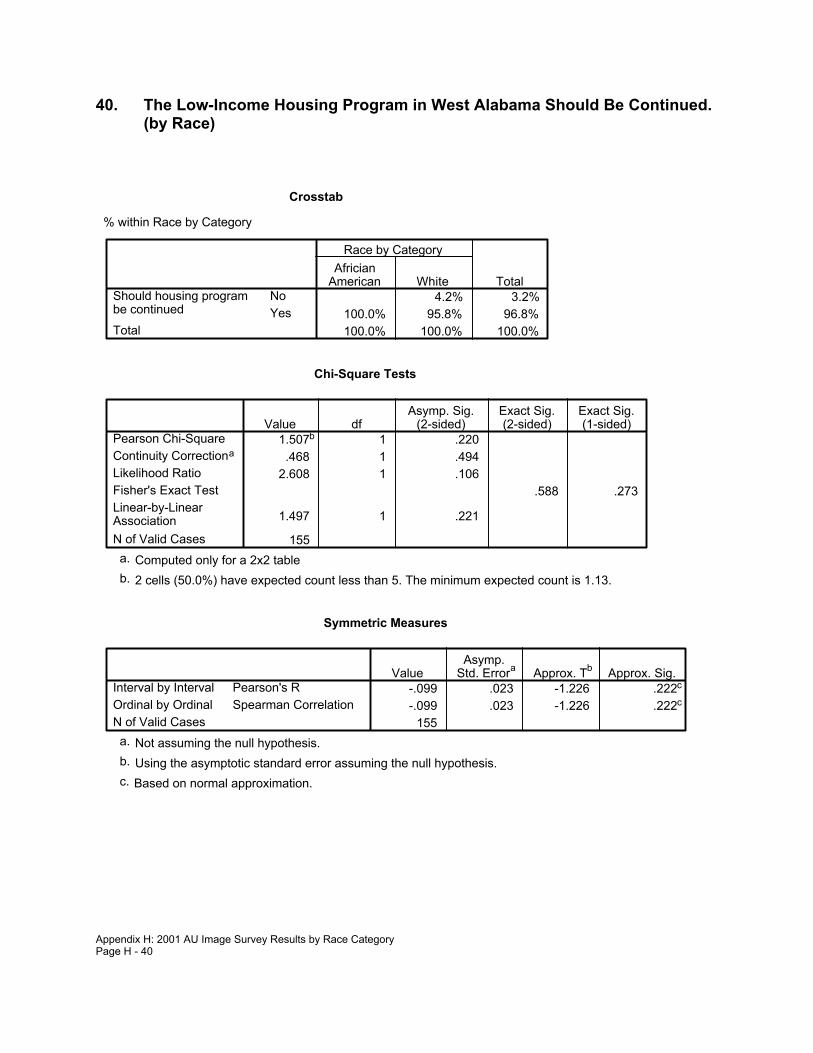
40. The Low-Income Housing Program in West Alabama Should Be Continued.(by Race)
Crosstab
% within Race by Category
4.2% 3.2%100.0% 95.8% 96.8%100.0% 100.0% 100.0%
NoYes
Should housing programbe continuedTotal
AfricianAmerican White
Race by Category
Total
Chi-Square Tests
1.507b 1 .220.468 1 .494
2.608 1 .106.588 .273
1.497 1 .221
155
Pearson Chi-SquareContinuity Correctiona
Likelihood RatioFisher's Exact TestLinear-by-LinearAssociationN of Valid Cases
Value dfAsymp. Sig.
(2-sided)Exact Sig.(2-sided)
Exact Sig.(1-sided)
Computed only for a 2x2 tablea.
2 cells (50.0%) have expected count less than 5. The minimum expected count is 1.13.b.
Symmetric Measures
-.099 .023 -1.226 .222c
-.099 .023 -1.226 .222c
155
Pearson's RInterval by IntervalSpearman CorrelationOrdinal by Ordinal
N of Valid Cases
ValueAsymp.
Std. Errora Approx. Tb Approx. Sig.
Not assuming the null hypothesis.a.
Using the asymptotic standard error assuming the null hypothesis.b.
Based on normal approximation.c.
Appendix H: 2001 AU Image Survey Results by Race CategoryPage H - 40
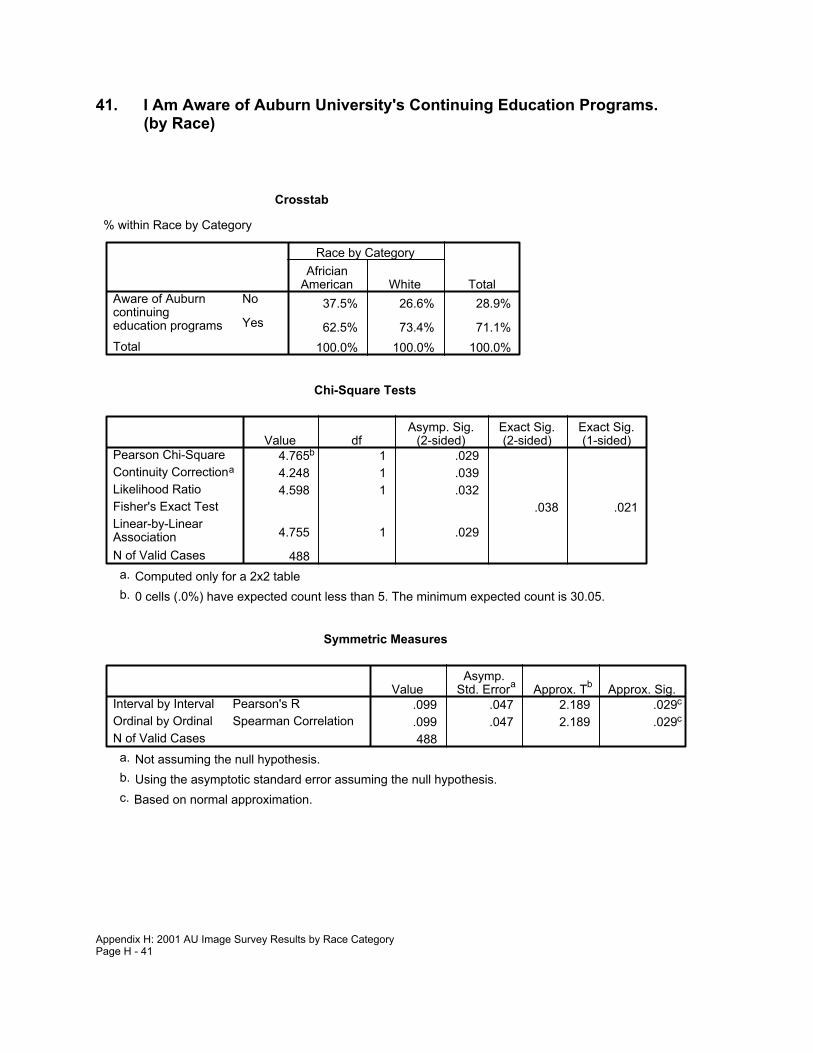
41. I Am Aware of Auburn University's Continuing Education Programs.(by Race)
Crosstab
% within Race by Category
37.5% 26.6% 28.9%
62.5% 73.4% 71.1%100.0% 100.0% 100.0%
No
Yes
Aware of Auburncontinuingeducation programsTotal
AfricianAmerican White
Race by Category
Total
Chi-Square Tests
4.765b 1 .0294.248 1 .0394.598 1 .032
.038 .021
4.755 1 .029
488
Pearson Chi-SquareContinuity Correctiona
Likelihood RatioFisher's Exact TestLinear-by-LinearAssociationN of Valid Cases
Value dfAsymp. Sig.
(2-sided)Exact Sig.(2-sided)
Exact Sig.(1-sided)
Computed only for a 2x2 tablea.
0 cells (.0%) have expected count less than 5. The minimum expected count is 30.05.b.
Symmetric Measures
.099 .047 2.189 .029c
.099 .047 2.189 .029c
488
Pearson's RInterval by IntervalSpearman CorrelationOrdinal by Ordinal
N of Valid Cases
ValueAsymp.
Std. Errora Approx. Tb Approx. Sig.
Not assuming the null hypothesis.a.
Using the asymptotic standard error assuming the null hypothesis.b.
Based on normal approximation.c.
Appendix H: 2001 AU Image Survey Results by Race CategoryPage H - 41
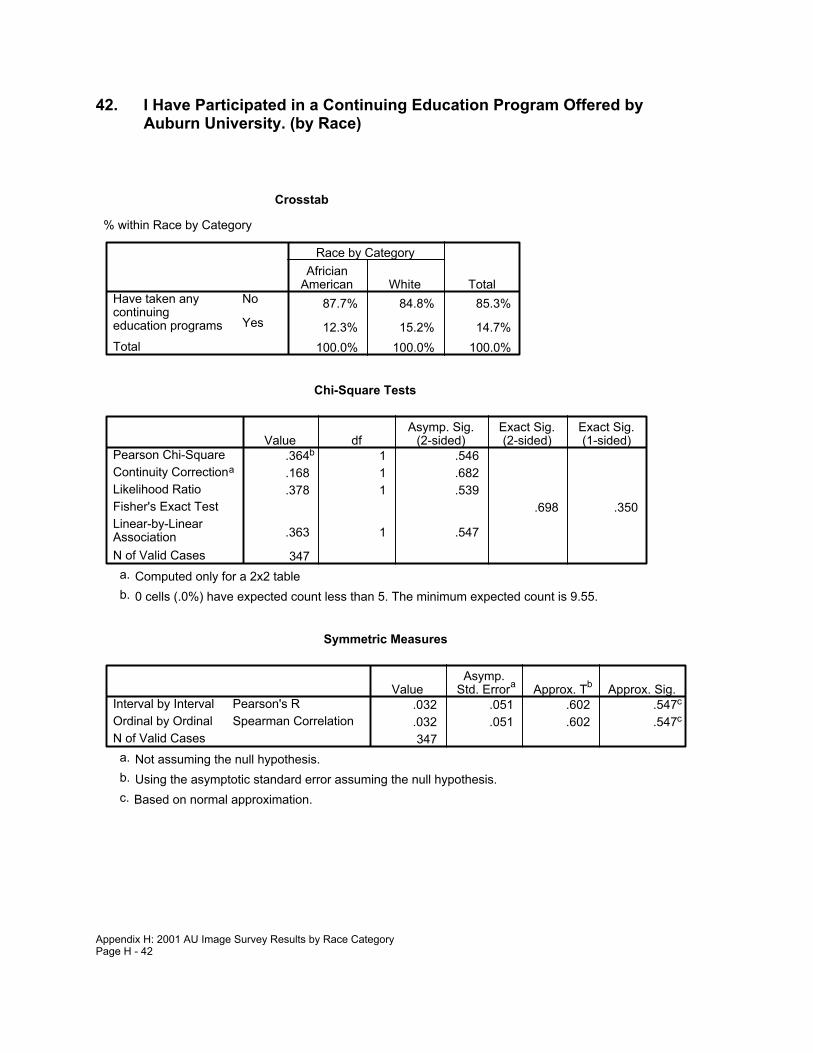
42. I Have Participated in a Continuing Education Program Offered byAuburn University. (by Race)
Crosstab
% within Race by Category
87.7% 84.8% 85.3%
12.3% 15.2% 14.7%100.0% 100.0% 100.0%
No
Yes
Have taken anycontinuingeducation programsTotal
AfricianAmerican White
Race by Category
Total
Chi-Square Tests
.364b 1 .546
.168 1 .682
.378 1 .539.698 .350
.363 1 .547
347
Pearson Chi-SquareContinuity Correctiona
Likelihood RatioFisher's Exact TestLinear-by-LinearAssociationN of Valid Cases
Value dfAsymp. Sig.
(2-sided)Exact Sig.(2-sided)
Exact Sig.(1-sided)
Computed only for a 2x2 tablea.
0 cells (.0%) have expected count less than 5. The minimum expected count is 9.55.b.
Symmetric Measures
.032 .051 .602 .547c
.032 .051 .602 .547c
347
Pearson's RInterval by IntervalSpearman CorrelationOrdinal by Ordinal
N of Valid Cases
ValueAsymp.
Std. Errora Approx. Tb Approx. Sig.
Not assuming the null hypothesis.a.
Using the asymptotic standard error assuming the null hypothesis.b.
Based on normal approximation.c.
Appendix H: 2001 AU Image Survey Results by Race CategoryPage H - 42

43. I Am Aware of Auburn University's Partnerships With Local Schools.(by Race)
Crosstab
% within Race by Category
69.2% 65.9% 66.6%
30.8% 34.1% 33.4%100.0% 100.0% 100.0%
No
Yes
Aware of Auburnpartnerships withlocal schoolsTotal
AfricianAmerican White
Race by Category
Total
Chi-Square Tests
.412b 1 .521
.275 1 .600
.416 1 .519.559 .302
.411 1 .522
488
Pearson Chi-SquareContinuity Correctiona
Likelihood RatioFisher's Exact TestLinear-by-LinearAssociationN of Valid Cases
Value dfAsymp. Sig.
(2-sided)Exact Sig.(2-sided)
Exact Sig.(1-sided)
Computed only for a 2x2 tablea.
0 cells (.0%) have expected count less than 5. The minimum expected count is 34.74.b.
Symmetric Measures
.029 .045 .641 .522c
.029 .045 .641 .522c
488
Pearson's RInterval by IntervalSpearman CorrelationOrdinal by Ordinal
N of Valid Cases
ValueAsymp.
Std. Errora Approx. Tb Approx. Sig.
Not assuming the null hypothesis.a.
Using the asymptotic standard error assuming the null hypothesis.b.
Based on normal approximation.c.
Appendix H: 2001 AU Image Survey Results by Race CategoryPage H - 43

44. The School Partnerships Should Be Continued. (by Race)
Crosstab
% within Race by Category
.8% .6%100.0% 99.2% 99.4%100.0% 100.0% 100.0%
NoYes
Should partnershipsbe continuedTotal
AfricianAmerican White
Race by Category
Total
Chi-Square Tests
.246b 1 .620
.000 1 1.000
.439 1 .5081.000 .804
.244 1 .621
163
Pearson Chi-SquareContinuity Correctiona
Likelihood RatioFisher's Exact TestLinear-by-LinearAssociationN of Valid Cases
Value dfAsymp. Sig.
(2-sided)Exact Sig.(2-sided)
Exact Sig.(1-sided)
Computed only for a 2x2 tablea.
2 cells (50.0%) have expected count less than 5. The minimum expected count is .20.b.
Symmetric Measures
-.039 .020 -.493 .623c
-.039 .020 -.493 .623c
163
Pearson's RInterval by IntervalSpearman CorrelationOrdinal by Ordinal
N of Valid Cases
ValueAsymp.
Std. Errora Approx. Tb Approx. Sig.
Not assuming the null hypothesis.a.
Using the asymptotic standard error assuming the null hypothesis.b.
Based on normal approximation.c.
Appendix H: 2001 AU Image Survey Results by Race CategoryPage H - 44

45. My Local School District Would Benefit From a Partnership.(by Race)
Crosstab
% within Race by Category
22.1% 11.7% 13.9%
77.9% 88.3% 86.1%100.0% 100.0% 100.0%
No
Yes
Would local schooldistrict benefit frompartnershipTotal
AfricianAmerican White
Race by Category
Total
Chi-Square Tests
7.376b 1 .0076.534 1 .0116.715 1 .010
.010 .007
7.361 1 .007
488
Pearson Chi-SquareContinuity Correctiona
Likelihood RatioFisher's Exact TestLinear-by-LinearAssociationN of Valid Cases
Value dfAsymp. Sig.
(2-sided)Exact Sig.(2-sided)
Exact Sig.(1-sided)
Computed only for a 2x2 tablea.
0 cells (.0%) have expected count less than 5. The minimum expected count is 14.49.b.
Symmetric Measures
.123 .051 2.731 .007c
.123 .051 2.731 .007c
488
Pearson's RInterval by IntervalSpearman CorrelationOrdinal by Ordinal
N of Valid Cases
ValueAsymp.
Std. Errora Approx. Tb Approx. Sig.
Not assuming the null hypothesis.a.
Using the asymptotic standard error assuming the null hypothesis.b.
Based on normal approximation.c.
Appendix H: 2001 AU Image Survey Results by Race CategoryPage H - 45

46. I Am Familiar With Auburn University's Cooperative Extension System.(by Race)
Crosstab
% within Race by Category
55.8% 43.5% 46.1%44.2% 56.5% 53.9%
100.0% 100.0% 100.0%
NoYes
Familiar with CooperativeExtension SystemTotal
AfricianAmerican White
Race by Category
Total
Chi-Square Tests
4.966b 1 .0264.484 1 .0344.955 1 .026
.027 .017
4.956 1 .026
488
Pearson Chi-SquareContinuity Correctiona
Likelihood RatioFisher's Exact TestLinear-by-LinearAssociationN of Valid Cases
Value dfAsymp. Sig.
(2-sided)Exact Sig.(2-sided)
Exact Sig.(1-sided)
Computed only for a 2x2 tablea.
0 cells (.0%) have expected count less than 5. The minimum expected count is 47.95.b.
Symmetric Measures
.101 .045 2.235 .026c
.101 .045 2.235 .026c
488
Pearson's RInterval by IntervalSpearman CorrelationOrdinal by Ordinal
N of Valid Cases
ValueAsymp.
Std. Errora Approx. Tb Approx. Sig.
Not assuming the null hypothesis.a.
Using the asymptotic standard error assuming the null hypothesis.b.
Based on normal approximation.c.
Appendix H: 2001 AU Image Survey Results by Race CategoryPage H - 46

47. I Have Used Services Provided by the Auburn University ExtensionSystem. (by Race)
Crosstab
% within Race by Category
58.7% 51.2% 52.5%41.3% 48.8% 47.5%
100.0% 100.0% 100.0%
NoYes
Used any services fromExtension SystemTotal
AfricianAmerican White
Race by Category
Total
Chi-Square Tests
.866b 1 .352
.590 1 .442
.871 1 .351.417 .222
.863 1 .353
263
Pearson Chi-SquareContinuity Correctiona
Likelihood RatioFisher's Exact TestLinear-by-LinearAssociationN of Valid Cases
Value dfAsymp. Sig.
(2-sided)Exact Sig.(2-sided)
Exact Sig.(1-sided)
Computed only for a 2x2 tablea.
0 cells (.0%) have expected count less than 5. The minimum expected count is 21.86.b.
Symmetric Measures
.057 .061 .929 .354c
.057 .061 .929 .354c
263
Pearson's RInterval by IntervalSpearman CorrelationOrdinal by Ordinal
N of Valid Cases
ValueAsymp.
Std. Errora Approx. Tb Approx. Sig.
Not assuming the null hypothesis.a.
Using the asymptotic standard error assuming the null hypothesis.b.
Based on normal approximation.c.
Appendix H: 2001 AU Image Survey Results by Race CategoryPage H - 47

48. The Cooperative Extension Programs Are Beneficial.(by Race)
Crosstab
% within Race by Category
5.3% .9% 1.6%94.7% 99.1% 98.4%
100.0% 100.0% 100.0%
NoYes
Are Extension programsbeneficialTotal
AfricianAmerican White
Race by Category
Total
Chi-Square Tests
1.910b 1 .167.151 1 .697
1.356 1 .244.282 .282
1.894 1 .169
125
Pearson Chi-SquareContinuity Correctiona
Likelihood RatioFisher's Exact TestLinear-by-LinearAssociationN of Valid Cases
Value dfAsymp. Sig.
(2-sided)Exact Sig.(2-sided)
Exact Sig.(1-sided)
Computed only for a 2x2 tablea.
2 cells (50.0%) have expected count less than 5. The minimum expected count is .30.b.
Symmetric Measures
.124 .130 1.381 .170c
.124 .130 1.381 .170c
125
Pearson's RInterval by IntervalSpearman CorrelationOrdinal by Ordinal
N of Valid Cases
ValueAsymp.
Std. Errora Approx. Tb Approx. Sig.
Not assuming the null hypothesis.a.
Using the asymptotic standard error assuming the null hypothesis.b.
Based on normal approximation.c.
Appendix H: 2001 AU Image Survey Results by Race CategoryPage H - 48
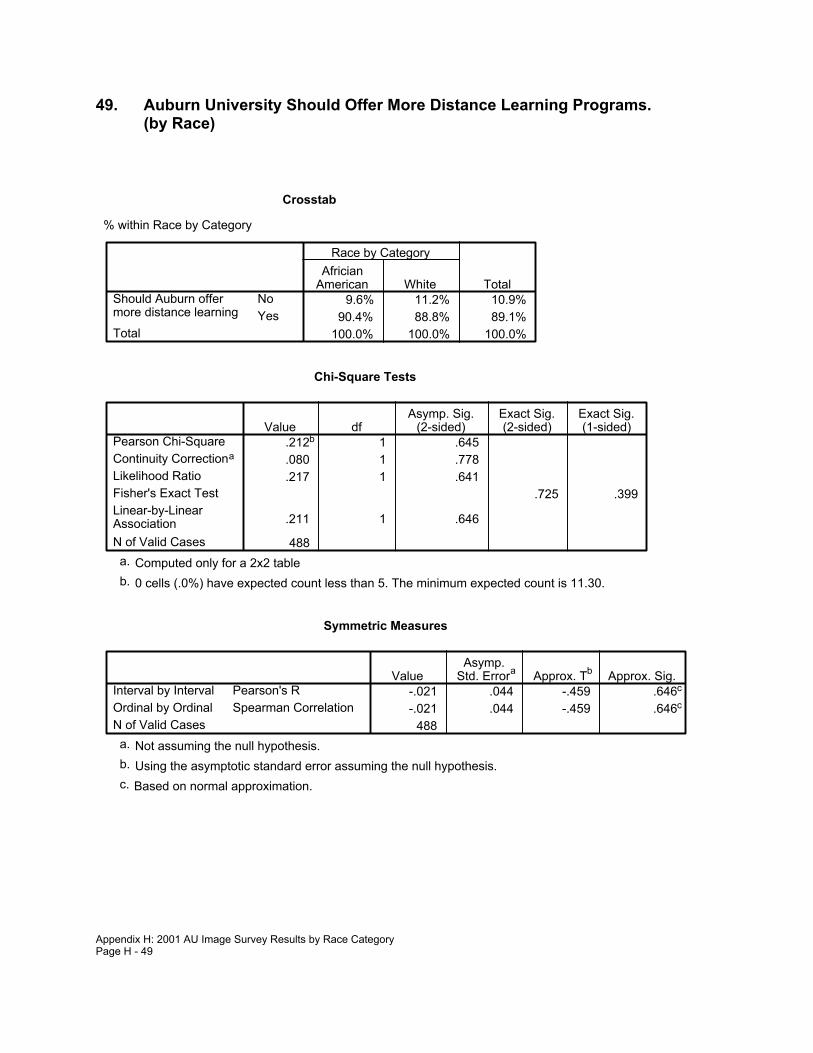
49. Auburn University Should Offer More Distance Learning Programs.(by Race)
Crosstab
% within Race by Category
9.6% 11.2% 10.9%90.4% 88.8% 89.1%
100.0% 100.0% 100.0%
NoYes
Should Auburn offermore distance learningTotal
AfricianAmerican White
Race by Category
Total
Chi-Square Tests
.212b 1 .645
.080 1 .778
.217 1 .641.725 .399
.211 1 .646
488
Pearson Chi-SquareContinuity Correctiona
Likelihood RatioFisher's Exact TestLinear-by-LinearAssociationN of Valid Cases
Value dfAsymp. Sig.
(2-sided)Exact Sig.(2-sided)
Exact Sig.(1-sided)
Computed only for a 2x2 tablea.
0 cells (.0%) have expected count less than 5. The minimum expected count is 11.30.b.
Symmetric Measures
-.021 .044 -.459 .646c
-.021 .044 -.459 .646c
488
Pearson's RInterval by IntervalSpearman CorrelationOrdinal by Ordinal
N of Valid Cases
ValueAsymp.
Std. Errora Approx. Tb Approx. Sig.
Not assuming the null hypothesis.a.
Using the asymptotic standard error assuming the null hypothesis.b.
Based on normal approximation.c.
Appendix H: 2001 AU Image Survey Results by Race CategoryPage H - 49
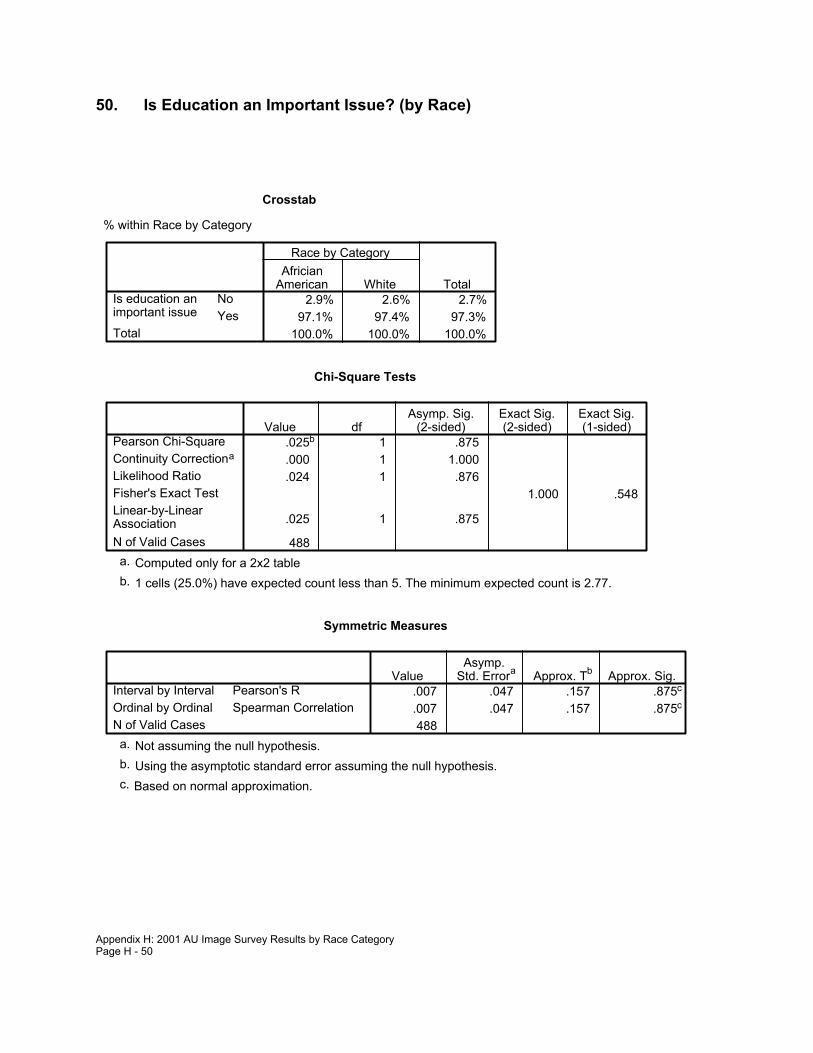
50. Is Education an Important Issue? (by Race)
Crosstab
% within Race by Category
2.9% 2.6% 2.7%97.1% 97.4% 97.3%
100.0% 100.0% 100.0%
NoYes
Is education animportant issueTotal
AfricianAmerican White
Race by Category
Total
Chi-Square Tests
.025b 1 .875
.000 1 1.000
.024 1 .8761.000 .548
.025 1 .875
488
Pearson Chi-SquareContinuity Correctiona
Likelihood RatioFisher's Exact TestLinear-by-LinearAssociationN of Valid Cases
Value dfAsymp. Sig.
(2-sided)Exact Sig.(2-sided)
Exact Sig.(1-sided)
Computed only for a 2x2 tablea.
1 cells (25.0%) have expected count less than 5. The minimum expected count is 2.77.b.
Symmetric Measures
.007 .047 .157 .875c
.007 .047 .157 .875c
488
Pearson's RInterval by IntervalSpearman CorrelationOrdinal by Ordinal
N of Valid Cases
ValueAsymp.
Std. Errora Approx. Tb Approx. Sig.
Not assuming the null hypothesis.a.
Using the asymptotic standard error assuming the null hypothesis.b.
Based on normal approximation.c.
Appendix H: 2001 AU Image Survey Results by Race CategoryPage H - 50

51. Is Community and Economic Development an Important Issue?(by Race)
Crosstab
% within Race by Category
5.8% 4.9% 5.1%
94.2% 95.1% 94.9%100.0% 100.0% 100.0%
No
Yes
Is community andeconomic developmentan important issueTotal
AfricianAmerican White
Race by Category
Total
Chi-Square Tests
.114b 1 .736
.007 1 .931
.110 1 .740.802 .448
.113 1 .736
488
Pearson Chi-SquareContinuity Correctiona
Likelihood RatioFisher's Exact TestLinear-by-LinearAssociationN of Valid Cases
Value dfAsymp. Sig.
(2-sided)Exact Sig.(2-sided)
Exact Sig.(1-sided)
Computed only for a 2x2 tablea.
0 cells (.0%) have expected count less than 5. The minimum expected count is 5.33.b.
Symmetric Measures
.015 .047 .336 .737c
.015 .047 .336 .737c
488
Pearson's RInterval by IntervalSpearman CorrelationOrdinal by Ordinal
N of Valid Cases
ValueAsymp.
Std. Errora Approx. Tb Approx. Sig.
Not assuming the null hypothesis.a.
Using the asymptotic standard error assuming the null hypothesis.b.
Based on normal approximation.c.
Appendix H: 2001 AU Image Survey Results by Race CategoryPage H - 51

52. Is Agriculture an Important Issue? (by Race)
Crosstab
% within Race by Category
11.5% 9.1% 9.6%88.5% 90.9% 90.4%
100.0% 100.0% 100.0%
NoYes
Is agriculture animportant issueTotal
AfricianAmerican White
Race by Category
Total
Chi-Square Tests
.552b 1 .457
.309 1 .578
.531 1 .466.456 .282
.551 1 .458
488
Pearson Chi-SquareContinuity Correctiona
Likelihood RatioFisher's Exact TestLinear-by-LinearAssociationN of Valid Cases
Value dfAsymp. Sig.
(2-sided)Exact Sig.(2-sided)
Exact Sig.(1-sided)
Computed only for a 2x2 tablea.
0 cells (.0%) have expected count less than 5. The minimum expected count is 10.02.b.
Symmetric Measures
.034 .048 .742 .458c
.034 .048 .742 .458c
488
Pearson's RInterval by IntervalSpearman CorrelationOrdinal by Ordinal
N of Valid Cases
ValueAsymp.
Std. Errora Approx. Tb Approx. Sig.
Not assuming the null hypothesis.a.
Using the asymptotic standard error assuming the null hypothesis.b.
Based on normal approximation.c.
Appendix H: 2001 AU Image Survey Results by Race CategoryPage H - 52

53. Are Family and Youth Important Issues? (by Race)
Crosstab
% within Race by Category
5.8% 6.0% 5.9%94.2% 94.0% 94.1%
100.0% 100.0% 100.0%
NoYes
Is family and youth andimportant issueTotal
AfricianAmerican White
Race by Category
Total
Chi-Square Tests
.007b 1 .933
.000 1 1.000
.007 1 .9331.000 .575
.007 1 .933
488
Pearson Chi-SquareContinuity Correctiona
Likelihood RatioFisher's Exact TestLinear-by-LinearAssociationN of Valid Cases
Value dfAsymp. Sig.
(2-sided)Exact Sig.(2-sided)
Exact Sig.(1-sided)
Computed only for a 2x2 tablea.
0 cells (.0%) have expected count less than 5. The minimum expected count is 6.18.b.
Symmetric Measures
-.004 .045 -.084 .933c
-.004 .045 -.084 .933c
488
Pearson's RInterval by IntervalSpearman CorrelationOrdinal by Ordinal
N of Valid Cases
ValueAsymp.
Std. Errora Approx. Tb Approx. Sig.
Not assuming the null hypothesis.a.
Using the asymptotic standard error assuming the null hypothesis.b.
Based on normal approximation.c.
Appendix H: 2001 AU Image Survey Results by Race CategoryPage H - 53

54. Is the Environment an Important Issue? (by Race)
Crosstab
% within Race by Category
9.6% 6.8% 7.4%90.4% 93.2% 92.6%
100.0% 100.0% 100.0%
NoYes
Is the environmentan important issueTotal
AfricianAmerican White
Race by Category
Total
Chi-Square Tests
.969b 1 .325
.598 1 .440
.913 1 .339.396 .216
.967 1 .325
488
Pearson Chi-SquareContinuity Correctiona
Likelihood RatioFisher's Exact TestLinear-by-LinearAssociationN of Valid Cases
Value dfAsymp. Sig.
(2-sided)Exact Sig.(2-sided)
Exact Sig.(1-sided)
Computed only for a 2x2 tablea.
0 cells (.0%) have expected count less than 5. The minimum expected count is 7.67.b.
Symmetric Measures
.045 .049 .983 .326c
.045 .049 .983 .326c
488
Pearson's RInterval by IntervalSpearman CorrelationOrdinal by Ordinal
N of Valid Cases
ValueAsymp.
Std. Errora Approx. Tb Approx. Sig.
Not assuming the null hypothesis.a.
Using the asymptotic standard error assuming the null hypothesis.b.
Based on normal approximation.c.
Appendix H: 2001 AU Image Survey Results by Race CategoryPage H - 54

55. How Significant is It to Have Outreach Programs in Your Community?(by Race)
Crosstab
% within Race by Category
7.7% 3.4% 4.3%4.8% 4.4% 4.5%4.8% 6.3% 5.9%1.9% 1.0% 1.2%
26.9% 35.7% 33.8%53.8% 49.2% 50.2%
100.0% 100.0% 100.0%
No opinionVery insignificantInsignificantNeutralSignificantVery significant
How significantis it to haveoutreachprograms incommunity
Total
AfricianAmerican White
Race by Category
Total
Chi-Square Tests
6.561a 5 .2556.148 5 .292
.611 1 .434
488
Pearson Chi-SquareLikelihood RatioLinear-by-LinearAssociationN of Valid Cases
Value dfAsymp. Sig.
(2-sided)
4 cells (33.3%) have expected count less than 5. The minimum expected count is 1.28.a.
Symmetric Measures
.035 .050 .781 .435c
-.010 .047 -.229 .819c
488
Pearson's RInterval by IntervalSpearman CorrelationOrdinal by Ordinal
N of Valid Cases
ValueAsymp.
Std. Errora Approx. Tb Approx. Sig.
Not assuming the null hypothesis.a.
Using the asymptotic standard error assuming the null hypothesis.b.
Based on normal approximation.c.
Appendix H: 2001 AU Image Survey Results by Race CategoryPage H - 55

56. How Significant is it to Have Access to Information Over the Internet?(by Race)
Crosstab
% within Race by Category
11.5% 4.9% 6.4%5.8% 10.9% 9.8%
14.4% 15.1% 15.0%1.8% 1.4%
14.4% 23.7% 21.7%53.8% 43.5% 45.7%
100.0% 100.0% 100.0%
No opinionVery insignificantInsignificantNeutralSignificantVery significant
How Significantis it to accessinformation overthe Internet
Total
AfricianAmerican White
Race by Category
Total
Chi-Square Tests
14.901a 5 .01116.136 5 .006
.021 1 .885
488
Pearson Chi-SquareLikelihood RatioLinear-by-LinearAssociationN of Valid Cases
Value dfAsymp. Sig.
(2-sided)
1 cells (8.3%) have expected count less than 5. The minimum expected count is 1.49.a.
Symmetric Measures
-.007 .048 -.145 .885c
-.043 .048 -.944 .345c
488
Pearson's RInterval by IntervalSpearman CorrelationOrdinal by Ordinal
N of Valid Cases
ValueAsymp.
Std. Errora Approx. Tb Approx. Sig.
Not assuming the null hypothesis.a.
Using the asymptotic standard error assuming the null hypothesis.b.
Based on normal approximation.c.
Appendix H: 2001 AU Image Survey Results by Race CategoryPage H - 56