Attitudes of European Citizens towards the Environment · Analysis of the 2014 and 2011...
23
Page 1 of 23 Analysis of the 2014 and 2011 Eurobarometer Surveys Attitudes of European Citizens towards the Environment This report presents a summary of comparisons between the 2014 and 2011 Special Eurobarometer surveys on public attitudes towards the environment 1234 . Answers to a selection of questions are presented for the EU as a whole, the UK and Scotland, to enable comparisons to be made between these different geographic areas and over time. These comparisons provide the background context against which the evaluation of the effectiveness of Scotland's Environment Web in engaging the public in actions to monitor and improve the environment will be made. The surveys in both 2014 and 2011 took place in April and May, with the table below showing the numbers of face to face interviews in each year. Number Interviewed 2014 2011 Scotland 1 111 111 UK 1306 1317 EU 27998 26825 1 The numbers interviewed in Scotland are too low to allow statistically reliable comparisons, so qualitative comparisons with the UK and EU responses are presented for purely illustrative purposes, and should be treated with caution. All survey data were kindly provided by TNS Opinion and Social, who conducted the surveys in most EU member states both in 2014 and 2011. Analysis of the results presented in this report is purely by Scotland’s Environment Web, and therefore does not necessarily reflect the views of TNS, the EU or individual member states. All figures are presented as percentages. 1 http://ec.europa.eu/public_opinion/archives/ebs/ebs_416_en.pdf 2 http://ec.europa.eu/public_opinion/archives/ebs/ebs_416_fact_uk_en.pdf 3 http://ec.europa.eu/public_opinion/archives/ebs/ebs_365_en.pdf 4 http://ec.europa.eu/public_opinion/archives/ebs/ebs_365_fact_uk_en.pdf
-
Upload
hoangquynh -
Category
Documents
-
view
216 -
download
0
Transcript of Attitudes of European Citizens towards the Environment · Analysis of the 2014 and 2011...

Page 1 of 23
Analysis of the 2014 and 2011 Eurobarometer Surveys
Attitudes of European Citizens towards the Environment This report presents a summary of comparisons between the 2014 and 2011 Special Eurobarometer surveys on public attitudes towards the environment1234. Answers to a selection of questions are presented for the EU as a whole, the UK and Scotland, to enable comparisons to be made between these different geographic areas and over time. These comparisons provide the background context against which the evaluation of the effectiveness of Scotland's Environment Web in engaging the public in actions to monitor and improve the environment will be made. The surveys in both 2014 and 2011 took place in April and May, with the table below showing the numbers of face to face interviews in each year.
Number Interviewed
2014 2011
Scotland1 111 111
UK 1306 1317
EU 27998 26825
1The numbers interviewed in Scotland are too low to allow statistically reliable comparisons, so qualitative comparisons with the
UK and EU responses are presented for purely illustrative purposes, and should be treated with caution.
All survey data were kindly provided by TNS Opinion and Social, who conducted the surveys in most EU member states both in 2014 and 2011. Analysis of the results presented in this report is purely by Scotland’s Environment Web, and therefore does not necessarily reflect the views of TNS, the EU or individual member states. All figures are presented as percentages.
1 http://ec.europa.eu/public_opinion/archives/ebs/ebs_416_en.pdf
2 http://ec.europa.eu/public_opinion/archives/ebs/ebs_416_fact_uk_en.pdf
3 http://ec.europa.eu/public_opinion/archives/ebs/ebs_365_en.pdf
4 http://ec.europa.eu/public_opinion/archives/ebs/ebs_365_fact_uk_en.pdf

Page 2 of 23
Europeans and their concerns about the environment Qn.1 How important is protecting the environment to you personally?
EU UK Scotland EU UK Scotland
Very important 53 54 50 57 58 48
Fairly important 42 40 40 37 36 39
Not very important 4 4 8 4 5 11
Not at all important 1 1 2 1 1 3
Don't know 0 1 0 1 0 0
2014 2011
2014 EU
2014 UK
2014 Sco
2011 EU
2011 UK
2011 Sco
Very important
Fairly important
Not very important
Not at all important
Don't know
The inner three rings show results for 2014 (EU, UK, Sco), the outer three rings for 2011
Protection of the environment is clearly important to the vast majority of those interviewed, and this perceived importance has not diminished significantly between 2011 and 2014. Combined figures for ‘very’ important and ‘fairly’ important are a little lower for Scotland than the UK and EU, but still stand at about 90%.

Page 3 of 23
Qn.2 From the following list, please pick the five main environmental issues you are worried about
Issue EU UK Scotland EU UK Scotland
Man made disasters1
- - - 41 34 36
Natural disasters1
- - - 31 26 28
Climate change1
- - - 34 36 25GMOs
1- - - 22 15 16
Impact of current transport modes1
- - - 15 19 14
Growing amount of waste 43 48 48 37 36 31
Air pollution 56 52 44 37 29 22
Impact on our health of chemicals 43 34 41 35 29 33
Water pollution 50 39 38 43 32 34
Agricultural pollution 29 19 26 26 18 11
Loss or extinction of species / habitats 26 30 25 22 22 27
Urban problems 23 31 21 17 25 16
Spread of INNS2
11 15 21 - - -
Depletion of natural resources 36 29 19 31 33 37
Shortage of drinking water2
27 18 17 - - -
Land take2
15 26 17 - - -
Noise pollution 15 20 13 8 12 10
Our consumption habits 24 16 10 20 20 14
Other 1 2 6 1 4 8
None 1 5 6 1 1 1
Soil degradation2
13 5 5 - - -
Don't know 0 1 4 - 1 0
2014 2011
1issue listed in 2011 only,
2issue listed in 2014 only
Comparisons between 2014 and 2011 are not straightforward, as the list of issues used in each year differs significantly. In 2014, air pollution, water pollution, the growing amount of waste and the impact of chemicals on health featured in the top five issues of concern in the EU, UK and Scotland. In 2011 the answers were more mixed, but water pollution and waste still featured in the top 5 in all three geographic areas, and the impact of chemicals featured in the top 5 in the EU and Scotland. The depletion of natural resources featured in the top 5 in the UK and Scotland, but only appeared in the top 5 at EU level in 2014. Air pollution only featured in the top 5 at EU level in 2011 (in fourth place), but appeared in the top 2 in all three geographic areas in 2014. This may indicate that air pollution is assuming greater prominence as an issue across the EU. Climate change only featured in the top 5 in the UK in 2011, being mentioned as a concern by between a quarter and a third of respondents. The issue was not included in the list in 2014. Man made disasters featured in the top 5 in all three geographic areas in 2011, but again the issue was not listed in 2014.

Page 4 of 23
Amongst the key messages in the 2014 report on the State of Scotland’s Environment, air pollution (particularly in urban areas), climate change, threats to species and habitats, and nutrient pollution in freshwaters are highlighted as areas of concern. There is therefore some overlap with the concerns of citizens in the EU, UK and Scotland as expressed in these surveys, but not complete agreement. For example, the impact of chemicals on health seems to be a more significant and growing concern for citizens than climate change. This may reflect the fact that climate change is considered to be a global issue, of less immediacy in people’s lives.
Behaviour regarding the environment Qn13.1 Please tell me to what extent you agree or disagree with the following statement – As an individual you can play a role in protecting the environment in (OUR COUNTRY)
EU UK Scotland EU UK Scotland
Totally agree 43 42 43 41 46 52
Tend to agree 42 45 35 44 45 36
Tend to disagree 10 7 15 11 6 8
Totally disagree 3 3 5 3 2 3
Don't know 2 3 2 1 1 1
2014 2011
Totally agree
Tend to agree
Tend to disagree
Totally disagree
Don't know
The inner three rings show results for 2014 (EU, UK, Sco), the outer three rings for 2011
A clear majority of respondents agreed that they had a role to play as an individual in protecting the environment in their country. Combined figures for ‘totally agree’ and ‘tend to agree’ were either the same or slightly down in all three geographic areas in 2014 compared to 2011. Combined figures for Scotland in 2014 were somewhat lower than for the UK and EU, but were still approaching 80%.

Page 5 of 23
Qn13.3 Please tell me to what extent you agree or disagree with the following statement – Environmental issues have a direct effect on your daily life
EU UK Scotland EU UK Scotland
Totally agree 35 32 29 35 26 23
Tend to agree 42 46 37 41 43 42
Tend to disagree 16 16 24 18 22 22
Totally disagree 4 2 8 5 7 13
Don't know 3 4 2 1 2 0
2014 2011
Totally agree
Tend to agree
Tend to disagree
Totally disagree
Don't know
The inner three rings show results for 2014 (EU, UK, Sco), the outer three rings for 2011
Again, a clear majority of respondents agreed that environmental issues had a direct effect on their daily lives. There were no major changes between 2011 and 2014. A higher proportion of respondents across the EU were in total agreement than were in the UK and Scotland. Combined figures for ‘totally agree’ and ‘tend to agree’ were lower in Scotland than they were in the UK and EU for both 2014 and 2011, but still accounted for two thirds of responses.

Page 6 of 23
Current behaviour and expected priorities regarding the environment
Qn.11 Have you done any of the following for environmental reasons in the past month?
Action EU UK Scotland EU UK Scotland
Separated most of your waste for recycling 72 79 71 62 79 83
Reduced waste e.g. by avoiding over-packaged products and
buying products with a longer life 33 40 43 35 44 37
Cut down your energy consumption 52 56 41 54 52 43
Cut down your water consumption 37 36 31 42 37 25
Chosen a more environmentally friendly way of traveling 35 38 27 32 37 28
Chosen local products 35 29 26 30 31 26
Used your car less 20 21 23 18 25 12
Bought environmentally friendly products 21 22 15 20 21 17
None 4 5 10 7 5 5
Don't know 0 1 0 1 1 0
Other 1 1 0 - 0 0
2014 2011
Separating waste for recycling was the top response across the board in both 2014 and 2011. Cutting down energy consumption was the second biggest response in every instance except for Scotland in 2014, when it was placed third. Reducing waste by avoiding over-packaged products or buying products with a longer life was also a common response, featuring in the top 3 in both the UK and Scotland in 2014 and 2011, and in the top 4 in the EU in 2011. Choosing a more environmentally friendly way of travelling featured in the top 5 responses across the board, generally being placed fourth or fifth in each geographic area. Cutting down water consumption featured in the top 3 EU responses in both 2014 and 2011, whereas this action was placed fourth or fifth in the UK and Scotland. This probably reflects the fact that water resources are more of a concern in Southern EU states.

Page 7 of 23
Qn.12 In your opinion, which of these should be the top three priorities for people in (OUR COUNTRY) in their daily life to protect the environment?
Priority EU UK Scotland EU UK Scotland
Pay a little more in taxes to help protect the environment1
- - - 3 4 5
Use public transport as much as possible instead of using your own car 39 41 45 36 41 40
Sort waste so that it can be recycled 54 44 44 60 60 65Reduce food waste through smarter purchasing, storage, preparation and
use of leftovers2
33 45 41 - - -
Reduce your home energy consumption (lighting, heating, household
appliances) 39 40 34 47 45 48
Reduce waste e.g. by avoiding over-packaged products and buying
products with a longer life 24 24 22 32 31 28
Buy more local products and avoid products that come from far away 22 20 22 28 25 24
Purchase environmentally friendly products for your daily needs 22 16 14 26 13 13
Replace your car with a more energy efficient one, even if it is smaller or
more expensive 13 15 13 15 18 19
Reduce water consumption at home2
14 10 9 - - -
Consider environmental aspects when you make large purchases 11 9 6 15 11 10
Don't know 1 3 4 1 4 1
None 1 1 0 - 1 2
Other 1 0 0 - 0 2
2014 2011
1priority listed in 2011 only,
2priority listed in 2014 only
Again, the sorting of waste for recycling featured highly, being placed top in all three geographic areas in 2011 and top or second in 2014. Reducing home energy consumption and increasing the use of public transport always featured in the top 3 priorities. Reduction of food waste featured in the top 3 in the UK and Scotland in 2014, but this was not listed as an activity in the 2011 survey.

Page 8 of 23
Information about environmental issues
Qn.3 In general, do you consider that you are very well, fairly well, fairly badly or very badly informed about environmental issues?
EU UK Scotland EU UK Scotland
Very well informed 8 11 6 8 14 11
Fairly well informed 54 59 60 52 63 61
Fairly badly informed 31 24 24 31 19 19
Very badly informed 6 5 6 7 4 9
Don't know 1 1 4 2 1 0
2014 2011
Very well informed
Fairly well informed
Fairly badly informed
Very badly informed
Don't know
The inner three rings show results for 2014 (EU, UK, Sco), the outer three rings for 2011
Most respondents (between half and two thirds) considered themselves to be fairly well informed about environmental issues. However, a significant proportion of respondents (between a quarter and a third in 2014) considered themselves to be fairly badly informed. A slightly higher proportion of respondents across the EU considered themselves to be fairly badly informed in comparison to both the UK and Scotland. This was the case in 2011 and 2014.

Page 9 of 23
The combined figures for ‘very well’ and ‘fairly well’ informed dropped slightly between 2011 and 2014 in the UK and Scotland, bringing them more into line with the combined responses for the EU as a whole.
Qn.4 From the following list, please pick the five main issues about which you feel you most particularly lack information
Issue EU UK Scotland EU UK Scotland
GMOs1
- - - 40 31 29
Man made disasters1
- - - 23 16 18
Impact of current transport modes1
- - - 14 12 13
Climate change1
- - - 21 16 11
Natural disasters1
- - - 13 10 7
Impact on our health of chemicals 39 33 33 42 38 46
Air pollution 27 25 29 22 19 14
Growing amount of waste 23 25 25 21 20 8
Agricultural pollution 28 26 23 30 26 27
Water pollution 28 24 23 29 23 25
Urban problems 15 17 22 12 12 10
Land take2
20 18 21 - - -
Depletion of natural resources 28 21 20 27 21 18
Loss or extinction of species / habitats 25 16 18 28 19 17
Spread of INNS2
28 25 17 - - -
Soil degradation2
29 24 15 - - -
Shortage of drinking water2
22 19 14 - - -
Noise pollution 17 18 14 14 15 9
Our consumption habits 15 16 14 14 15 10
Don't know 2 7 13 2 5 3
None 4 9 8 - 11 15
Other 1 1 1 - 0 0
2014 2011
1issue listed in 2011 only,
2issue listed in 2014 only
Comparisons between 2014 and 2011 are not straightforward, as the list of issues used in each year differs significantly. The impact on health of chemicals featured across the board as the top issue about which respondents felt they particularly lacked information. This was the case in 2011 and 2014, and may reflect the fact that this is one of the main issues about which EU citizens are worried (see responses to Qn. 2). Other issues that featured in the top 5 issues in all three geographic areas in both 2011 and 2014 were agricultural pollution and water pollution (the prominence of water pollution is of interest as the Water Framework Directive provides one of the most comprehensive environmental reporting mechanisms in Europe). The depletion of natural resources featured in the top 5 in the UK and Scotland in 2011, but had dropped out of the top 5 in 2014.

Page 10 of 23
Air pollution did not feature in any top 5 in 2011, but was in the top 5 in both the UK and Scotland in 2014. This may tie in with the increasing prominence of air pollution as an issue about which people are worried (see responses to Qn. 2). In 2011, Genetically Modified Organisms (GMOs) featured in second place across the three geographic areas, but this issue was not included in the list for the 2014 survey. Conversely, the spread of Invasive Non Native Species (INNS) featured in the top 5 in both the EU and UK in 2014, but this issue was not included in the list for the 2011 survey.
A strong perceived relationship between the environment and the economy
Qn.9.1 To what extent do you agree or disagree with the following statement, the protection of the environment can boost economic growth in the EU?
EU UK Scotland EU UK Scotland
Totally agree 29 21 23 29 22 30
Tend to agree 45 47 43 48 51 41
Tend to disagree 13 11 7 13 15 17
Totally disagree 3 3 3 3 4 3
Don't know 10 18 24 7 8 9
2014 2011
Totally agree
Tend to agree
Tend to disagree
Totally disagree
Don't know
The inner three rings show results for 2014 (EU, UK, Sco), the outer three rings for 2011

Page 11 of 23
A clear majority of respondents either totally agreed or tended to agree that protection of the environment could boost economic growth in the EU, which is of interest given the difficult economic conditions that have been experienced across the EU in recent years. Agreement with the statement was slightly stronger across the EU than in the UK or Scotland and slightly stronger in 2011 than in 2014. A significant number of respondents said they didn’t know whether they agreed with the statement in 2014, particularly in Scotland, although the result for Scotland should be treated with caution given the small number of respondents.
Qn.9.2 To what extent do you agree or disagree with the following statement, the efficient use of natural resources can boost economic growth in the EU?
EU UK Scotland EU UK Scotland
Totally agree 33 24 15 34 29 37
Tend to agree 46 51 51 49 55 41
Tend to disagree 9 7 6 8 7 9
Totally disagree 3 1 2 2 2 3
Don't know 9 17 26 7 7 10
2014 2011
Totally agree
Tend to agree
Tend to disagree
Totally disagree
Don't know
The inner three rings show results for 2014 (EU, UK, Sco), the outer three rings for 2011
Again, a clear majority of respondents either totally agreed or tended to agree that the efficient use of natural resources could boost economic growth in the EU.

Page 12 of 23
Responses followed a similar pattern to those for question 9.1 (see above), in that agreement with the statement was slightly stronger in 2011 than in 2014, with the number of ‘don’t know’ responses increasing in the second survey. The numbers in total agreement showed a decline across the board between 2011 and 2014, with a particularly marked decline in Scotland. This corresponds with a general weakening in agreement with the statement between the two surveys, and an increase in uncertainty.
Shared responsibility to protect the environment
Qn.7 On which of the following criteria do you think measurement of progress in (OUR COUNTRY) should be based?
EU UK Scotland EU UK Scotland
Equally on social, economic and
environmental criteria 59 62 59 57 56 46
Mostly on social and environmental criteria 20 17 26 17 18 23
Mostly on economic criteria such as GDP 14 12 8 17 16 20
Don't know 7 9 7 10 10 11
2014 2011
Equally on social, economic
and environmental criteria
Mostly on social and
environmental criteria
Mostly on economic criteria
such as GDP
Don't know
The inner three rings show results for 2014 (EU, UK, Sco), the outer three rings for 2011
A majority of respondents favoured measures of progress being based equally on social, economic and environmental criteria, there being few differences between 2011 and 2014, except in Scotland.

Page 13 of 23
The next most popular response was to base measures of progress mostly on social and environmental criteria, with only a minority favouring measures being based mainly on economic criteria such as GDP.
Qn.16 In your opinion, is each of the following doing too much, doing about the right amount, or not doing enough to protect the environment?
EU UK Scotland EU UK Scotland
Doing too much 1 1 3 2 1 0
Doing the right amount 15 14 16 14 15 14
Not doing enough 77 71 64 79 77 82
Don't know 7 14 17 5 7 4
Doing too much 2 1 2 2 2 0
Doing the right amount 29 31 33 23 27 25
Not doing enough 65 61 56 71 67 69
Don't know 4 7 9 3 5 6
Doing too much 1 1 2 2 2 1
Doing the right amount 21 24 26 20 24 18
Not doing enough 70 64 54 72 66 68
Don't know 8 11 18 6 8 13
Doing too much 3 3 4 3 4 0
Doing the right amount 23 19 24 26 19 17
Not doing enough 56 48 36 59 60 61
Don't know 18 30 36 12 18 22
Doing too much 2 1 4 - - -
Doing the right amount 43 45 43 - - -
Not doing enough 48 42 38 - - -
Don't know 7 12 15 - - -
Doing too much 1 1 0 - - -
Doing the right amount 37 40 41 - - -
Not doing enough 50 42 40 - - -
Don't know 12 17 19 - - -
The national
government
The European
Union
Your city, town
or village
Your region
2014 2011
Big companies
and industry
Citizens
themselves
0 20 40 60 80 100
EU
UK
Scotland
EU
UK
Scotland
2014
2011
Big companies and
industry Doing too
much
Big companies and
industry Doing the
right amount
Big companies and
industry Not doing
enough
Big companies and
industry Don't know

Page 14 of 23
A large majority of respondents across the board felt that big companies and industry were not doing enough to protect the environment. Typically about 15% felt that they were doing the right amount, and very few respondents felt they were doing too much. The number of ‘don’t know’ responses increased significantly in the UK and Scotland between 2011 and 2014.
0 20 40 60 80 100
EU
UK
Scotland
EU
UK
Scotland
20
14
20
11
Citizens
themselves
Doing too much
Citizens
themselves
Doing the right
amount
Citizens
themselves Not
doing enough
Citizens
themselves
Don't know
As with big companies and industry, a majority of respondents felt that citizens themselves were not doing enough to protect the environment, although more respondents felt that citizens were doing the right amount compared to big companies and industry. Again, very few respondents felt that citizens were doing too much to protect the environment.
0 20 40 60 80 100
EU
UK
Scotland
EU
UK
Scotland
20
14
20
11
The national
government
Doing too much
The national
government
Doing the right
amount
The national
government Not
doing enough
The national
government
Don't know

Page 15 of 23
Responses for the national government followed a similar pattern to those for citizens themselves, with more respondents feeling that the government was doing the right amount to protect the environment compared to big companies and industry, but a majority still feeling that their government was not doing enough.
0 20 40 60 80 100
EU
UK
Scotland
EU
UK
Scotland
20
14
20
11
The European
Union Doing too
much
The European
Union Doing the
right amount
The European
Union Not doing
enough
The European
Union Don't know
In most instances, the majority of respondents felt that the EU was not doing enough to protect the environment. Notable exceptions were in the UK and Scotland in 2014, when around a third of respondents said they didn’t know whether or not the EU was doing enough. This is one of the highest rates of ‘don’t know’ responses in both the 2011 and 2014 surveys, and may reflect a lack of awareness of the role of the EU in the UK as a whole and Scotland. As with citizens and national governments, the EU faired better than big companies and industry in the number of respondents who felt that it was doing the right amount to protect the environment.

Page 16 of 23
The most effective ways of tackling environmental problems
Qn.17 In your opinion, which of the following would be the two most effective way(s) of tackling environmental problems?
Action EU UK Scotland EU UK Scotland
Using natural resources more efficiently1
- - - 24 34 35
Providing more information on environmental issues 31 39 47 26 32 26
Introducing heavier fines for offenders 40 37 35 36 32 33
Ensuring better enforcement of existing environmental
legislation 30 27 31 25 17 13Ensuring higher financial incentives (e.g. tax breaks,
subsidies) to industry, business and citizens who protect
the environment 33 30 26 28 26 26
Introducing or increasing taxation on environmentally
damaging activities 18 16 17 15 10 5
Introducing stricter environmental legislation 25 19 14 26 18 18
Don't know 2 4 4 - 5 5
Other 1 1 0 - 1 0
None 1 1 0 - 1 1
2014 2011
1option listed in 2011 only
Introducing heavier fines for offenders featured in the top two responses across the board in 2011 and 2014. Provision of more information on environmental issues was the top answer in both the UK and Scotland in 2014. This option was placed third in these countries in 2011, when the top response was using natural resources more efficiently. This option, however, was not listed in the 2014 survey. The provision of financial incentives (e.g. tax breaks or subsidies) for measures to protect the environment was the second most popular option across the EU in 2011 and 2014. Increased use of taxation was the least popular option.

Page 17 of 23
The role of the EU in protecting the environment
Qn.15 When it comes to protecting the environment, do you think that decisions should be made by the (NATIONALITY) government or made jointly with the EU?
EU UK Scotland EU UK Scotland
National government 36 50 62 32 58 61
Jointly with the EU 60 45 35 64 39 33
Don't know 4 5 3 4 2 6
2014 2011
National government
Jointly with the EU
Don't know
The inner three rings show results for 2014 (EU, UK, Sco), the outer three rings for 2011
In the UK and Scotland, a majority of respondents thought that decisions on protecting the environment should be made by the national government. Across the EU, a majority thought that decisions on protecting the environment should be made jointly with the EU.

Page 18 of 23
Qn.18.1 Please tell me to what extent you agree or disagree with the following statement: European environmental legislation is necessary for protecting the environment in (OUR COUNTRY)
EU UK Scotland EU UK Scotland
Totally agree 36 23 15 39 23 27
Tend to agree 41 43 45 43 43 42
Tend to disagree 11 15 19 10 15 17
Totally disagree 5 7 9 4 11 9
Don't know 7 12 12 5 8 7
2014 2011
0 20 40 60 80 100
EU
UK
Scotland
EU
UK
Scotland
20
14
20
11
Totally agree
Tend to agree
Tend to
disagree
Totally disagree
Don't know
A clear majority of respondents either totally agreed or tended to agree that European legislation was necessary for protecting the environment, although total agreement was somewhat weaker in the UK and Scotland than in the EU as a whole. In general, levels of agreement in 2014 were slightly down on those in 2011.
Page 19 of 23
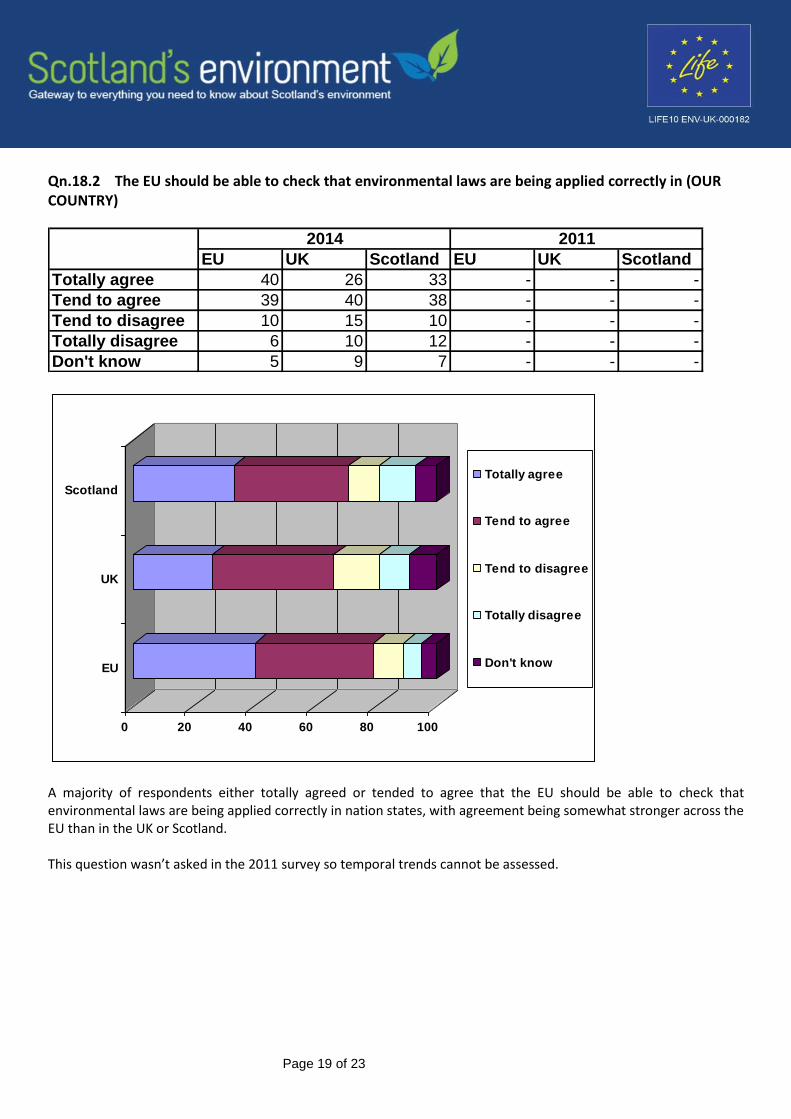
Qn.18.2 The EU should be able to check that environmental laws are being applied correctly in (OUR COUNTRY)
EU UK Scotland EU UK Scotland
Totally agree 40 26 33 - - -
Tend to agree 39 40 38 - - -
Tend to disagree 10 15 10 - - -
Totally disagree 6 10 12 - - -
Don't know 5 9 7 - - -
2014 2011
0 20 40 60 80 100
EU
UK
Scotland
Totally agree
Tend to agree
Tend to disagree
Totally disagree
Don't know
A majority of respondents either totally agreed or tended to agree that the EU should be able to check that environmental laws are being applied correctly in nation states, with agreement being somewhat stronger across the EU than in the UK or Scotland. This question wasn’t asked in the 2011 survey so temporal trends cannot be assessed.

Page 20 of 23
Qn.18.3 The EU should assist non-EU countries to improve their environmental standards
EU UK Scotland EU UK Scotland
Totally agree 34 24 22 36 30 25
Tend to agree 40 45 37 44 41 41
Tend to disagree 12 13 15 11 12 9
Totally disagree 8 7 11 4 10 22
Don't know 6 11 15 5 7 3
2014 2011
0 20 40 60 80 100
EU
UK
Scotland
EU
UK
Scotland
20
14
20
11 Totally agree
Tend to agree
Tend to
disagree
Totally disagree
Don't know
A majority of respondents agreed that the EU should assist non-EU countries in improving their environmental standards. Once more, agreement was somewhat stronger across the EU than in the UK or Scotland, and agreement weakened slightly between 2011 and 2014.

Page 21 of 23
Qn.18.4 More EU funding should be allocated to supporting environmentally friendly activities
EU UK Scotland EU UK Scotland
Totally agree 42 29 36 39 36 39
Tend to agree 42 51 44 38 50 38
Tend to disagree 7 6 6 7 5 7
Totally disagree 3 3 5 8 4 8
Don't know 6 11 9 8 5 8
2014 2011
0 20 40 60 80 100
EU
UK
Scotland
EU
UK
Scotland
20
14
20
11
Totally agree
Tend to agree
Tend to
disagree
Totally disagree
Don't know
There was strong agreement that more EU funding should be allocated to supporting environmentally friendly activities, with around 80% either totally agreeing or tending to agree with this statement, across the board in both 2011 and 2014.
Summary of key points The two surveys presented little evidence of significant shifts in the attitudes of EU, UK or Scottish citizens towards the environment between 2011 and 2014. Protection of the environment was clearly an issue of importance to the majority of survey respondents. Air pollution, water pollution, the growing amount of waste and the impact of chemicals on health featured prominently as issues of concern in the EU, UK and Scotland. There is some evidence that air pollution has increased as an issue of concern between 2011 and 2014.

Page 22 of 23
Climate change was mentioned as an issue of concern by around a quarter to a third of respondents in 2011, which made it a notable issue but by no means prominent at the top of the list. The issue was not included in the list of options for the 2014 survey. Amongst the key messages in the 2014 report on the State of Scotland’s Environment, air pollution (particularly in urban areas), climate change, threats to species and habitats, and nutrient pollution in freshwaters are highlighted as areas of concern. There is therefore some overlap with the concerns of citizens in the EU, UK and Scotland as expressed in these surveys, but not complete agreement. For example, the impact of chemicals on health seems to be a more significant and growing concern for citizens than climate change. This may reflect the fact that climate change is considered to be a global issue, of less immediacy in people’s lives. A clear majority of respondents agreed that they had a role to play in protecting the environment. Amongst activities undertaken recently for environmental reasons, recycling, reducing energy consumption, choosing more environmentally friendly modes of transport and reducing waste all featured prominently with respondents. In terms of what respondents considered should be the top priorities in daily life to protect the environment, recycling, reducing energy use, using public transport and reducing food waste all featured prominently. Most respondents considered themselves to be fairly well informed about environmental issues, but between a quarter and a third considered themselves to be fairly badly informed. The impact on health of chemicals is an issue about which survey respondents clearly feel they lack information, and this also features on the list of environmental concerns. Agricultural pollution and water pollution also featured as issues about which respondents felt they lacked information, and air pollution seemed to increase in prominence between 2011 and 2014, which may tie in with responses about environmental concerns. There was widespread agreement that protection of the environment can boost economic growth in the EU. Similarly, there was widespread agreement that the efficient use of natural resources can boost economic growth in the EU. A majority of respondents thought that measures of progress should be based equally on social, environmental and economic criteria, with only a minority favouring measures being based mainly on economic criteria such as GDP. Respondents clearly indicated that big companies and industry, individual citizens, national governments and the EU all needed to do more to protect the environment. Very few respondents felt that too much was being done by anyone to protect the environment, and big companies and industry were the ones that most respondents felt were not doing enough. Introduction of heavier fines, use of financial incentives and provision of better information were seen to be the most effective ways of tackling environmental problems. Across the EU, a majority of respondents indicated that decisions on protecting the environment should be made jointly by national governments and the EU, where as a majority in both the UK and Scotland felt that decisions should be made by the national government.

Page 23 of 23
There was general agreement that European environmental legislation is necessary to protect the environment, that the EU should be able to check that environmental laws are being applied correctly in member states, and that the EU should assist non-EU countries in improving environmental standards, but agreement was slightly weaker in the UK and Scotland than in the EU as a whole. There was strong agreement that more EU funding should be allocated to supporting environmentally friendly activities. Paul Griffiths Principal Scientist, Scotland’s Environment Web (SEPA) June 2015