Attenuated periodical oscillation characteristics in a ...
23
1 Attenuated periodical oscillation characteristics in a nanoscale particle-laden laminar flow JiafengGeng 1 , Junwang Tang 2 , Yechun Wang 1 , Zhenxiong Huang 1 , Dengwei Jing 1, *, Liejin Guo 1 1. State Key Laboratory of Multiphase Flow in Power Engineering & International Research Center for Renewable Energy, Xi’an Jiaotong University, Xi’an, Shaanxi 710049, China 2. Department of Chemical Engineering, University College London, Torrington Place, London, WC1E 7JE, UK * Corresponding author: Tel.:+86-29-82668769; Email: [email protected] ABSTRACT: Transport properties in nanoparticles-laden flow are of great importance for their practical use, such as in tubular reactor-based photocatalytic technologies. In our study, an experimental setup based on photocatalytic application was employed to investigate the nanoparticle transport characteristics in the flow reactor. An interesting periodical attenuated oscillation of the particle volume fraction and mean particle size with time was found in the nanoparticle-laden flow. We further analyzed the period of the attenuated oscillation curve by conducting a linear fitting, which shows that the period can be express as ( , ) T fQL = in which the period is proportional to the length of test section and inversely proportional to the flowrate. We found the time 5T is a very important criterion for whether the particle suspension has reached the quasi-steady state and the nanoparticle has been well suspended. Our work is believed to be valuable efficient and effective transportation of nanoparticle in laminar flow with low energy consumption. Introduction The suspensions of micro- or nanoscale particles in liquid exist widely in various fields e.g. advanced material processing, electronic technology, chemical engineering, petroleum, food processing, waste treatment etc 1-3 . It is also the important media for some emerging technologies such as the enhanced heat transfer over nanofluid and photocatalytic energy conversion and environmental remediation over various nanoscale photocatalyst suspensions 4-6 . In all of these processes, particle transportation and deposition have significant impacts on the properties and
Transcript of Attenuated periodical oscillation characteristics in a ...

1
Attenuated periodical oscillation characteristics in a nanoscale
particle-laden laminar flow
JiafengGeng1, Junwang Tang2, Yechun Wang1, Zhenxiong Huang1, Dengwei Jing1,*, Liejin Guo1
1. State Key Laboratory of Multiphase Flow in Power Engineering & International Research Center for
Renewable Energy, Xi’an Jiaotong University, Xi’an, Shaanxi 710049, China
2. Department of Chemical Engineering, University College London, Torrington Place, London, WC1E 7JE, UK
* Corresponding author: Tel.:+86-29-82668769; Email: [email protected]
ABSTRACT: Transport properties in nanoparticles-laden flow are of great importance for their
practical use, such as in tubular reactor-based photocatalytic technologies. In our study, an
experimental setup based on photocatalytic application was employed to investigate the
nanoparticle transport characteristics in the flow reactor. An interesting periodical attenuated
oscillation of the particle volume fraction and mean particle size with time was found in the
nanoparticle-laden flow. We further analyzed the period of the attenuated oscillation curve by
conducting a linear fitting, which shows that the period can be express as ( , )T f Q L= in which
the period is proportional to the length of test section and inversely proportional to the flowrate.
We found the time 5T is a very important criterion for whether the particle suspension has reached
the quasi-steady state and the nanoparticle has been well suspended. Our work is believed to be
valuable efficient and effective transportation of nanoparticle in laminar flow with low energy
consumption.
Introduction
The suspensions of micro- or nanoscale particles in liquid exist widely in various fields e.g.
advanced material processing, electronic technology, chemical engineering, petroleum, food
processing, waste treatment etc 1-3. It is also the important media for some emerging technologies
such as the enhanced heat transfer over nanofluid and photocatalytic energy conversion and
environmental remediation over various nanoscale photocatalyst suspensions4-6. In all of these
processes, particle transportation and deposition have significant impacts on the properties and

2
thus functions of such kind of suspension. For example, in photocatalytic process, sedimentation
of the photocatalyst leading to ineffective light absorption must be avoided7. In past researches,
turbulence flow in the phtotocatalytic reactor is believed to be a necessary condition for good
suspension of photocatalyst particles8. However, turbulence flow tends to consume much more
energy than the laminar flow, which is a disadvantage for the overall energy efficiency of the solar
photocatalytic water splitting process. Therefore, some researchers have tried to adopt laminar
circulation flow in photocatalytic reactor9-11, which also shows good photocatalytic performance.
Li Puma et al had indicated that the correspondence between the radiation field and fluid residence
time is very important to the photocatalytic reaction11, which means the relatively low flowrate
may be more benefit to the efficiency of photocatalytic reaction. Hence, it may suggest that the
circulating particle-laden laminar flow is a suitable flow pattern of slurry photocatalytic reactor.
However, few studies have revealed the transport phenomenon of polydisperse nanoscale
particle-laden circulating laminar flow.
For the clearer understanding of the transport phenomenon in nanoparticle flow, many studies
have been conducted by means of experimental. Sampling method as the most intuitive method
has been employed to ascertain the axial and radial profiles of the solid concentration12. It is
simple and reliable but also has the disadvantage of great dependence on sampling probe shape
and location, and it could also bring some disturbances to the whole flowing suspension. Probe
techniques have been widely used to study the particles concentration and movement in the
solid-liquid suspension, including, for instance, impedance13, optical14, acoustic techniques15. All
of these techniques are based on the different responses of electric, optical or acoustic signals
between continuous and discrete phases which inevitably disturb the flow field due to the
existence of probes. To overcome this defect, some non-intrusive methods have been developed,
such as the light technique16, radiation technique17, ultrasonic attenuation techniques18,
tomographic techniques19-21 etc. In the past decade, laser diffraction (LD) technique based on the
particles diffraction has become a popular method to measure the particle size and concentration
distribution22, 23, due to its high speed, good reliability and high reproducibility24. In general, the
LD measurement is conducted after the suspension is in stable state, that is, the concentration and
particle size distribution of the suspension hold an almost constant value.

3
It is worth noting that in many photocatalytic reactors, nanoparticle suspensions are in fact
circulated in a loop and such flowing reactors are cost-effective, easy for scale-up and for
nanoparticles recycling6, 25-27. Obviously, the transport characteristics are significant to the
performance of such kind of suspension reactor. The transport characteristics can be reflected in
variation with time of some macroscopic parameters, such as concentration and particle size
distribution. Segré G and Silberberg28 studied particles transport phenomenon in Poiseuille flow
through a tube by blocking out of two mutually perpendicular light beams and found that the flow
in tube tend to carry particles to a certain equilibrium position, irrespective of the radial position at
which the sphere first entered the tube. Tirumkudulu et al29 reported a particle segregation
phenomenon in a partially filled horizontal Couette device in which the suspension separates itself
into alternating regions of high and low particle concentration along the length of the tube by
employing a photographic method. Koh et al30 measured concentrated suspension flows by
adopting Laser-Doppler anemometry technique and found that velocity profile was blunted while
the concentration profile had a maximum near the center. Hampton et al31 studied demixing of
neutrally buoyant suspensions of spheres under pressure driven flows in circular conduits. In our
previous work, the photocatalyst itself was employed as a tracer particle for Particle Image
Velocity (PIV) measurement combined with a new laser sheet image analysis (LSIA) technology
to investigate both the particle velocity and number distribution in the tubular reactor32. In this
study, an asymmetric velocity distribution of TiO2-water slurry flow was observed and a
non-uniform particle distribution in the radial was found.
As mentioned above, photocatalytic water splitting hydrogen production is a very attractive
technology for which one of the key issues is the well suspension property of the particles in the
reactor33-35. And the circulating flowrate is a very important effect which determines the
suspending state of the slurry and then the photocatalytic reaction efficency36. In this study, an
experimental setup based on photocatalytic application was employed to investigate the
nanoparticle transport characteristics in the flow reactor. An interesting periodical attenuated
oscillation of the particle volume fraction and mean particle size with time was found in the
nanoparticle-laden flow. It was found that the periods of attenuated curve is proportional to the
length of testing section and inverse proportional to the flowrate. However, a time of 5 periods is

4
enough for the particles to reach the quasi-steady distribution in the laminar flow.
Materials and experimental setup
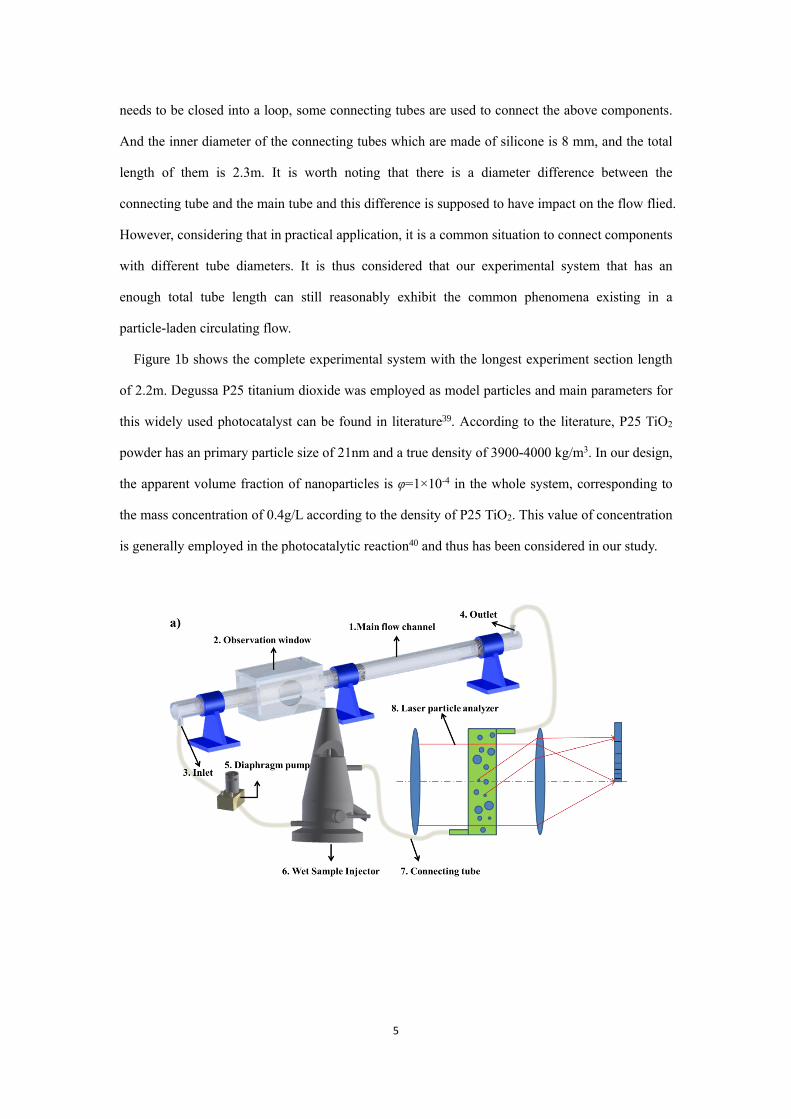
Figure 1a shows the experimental set-up designed in this study. It has eight parts: experimental
section, observation window, inlet, outlet, centrifugal pump, wet sample injector, laser particle
analyzer, connecting tube. The experimental section in this study is made of acrylic glass with an
inner diameter of 30 mm and outer diameter of 40 mm. Because the length of experimental section
is an important factor, a multi-stage detachable structure that can be adjusted according to the
required length, has been designed to investigate the effect of the tube length on the flow
characteristics. The detachable tubes are all 0.4 m long. They are transparent and can be connected
by threaded looper sealed with flat gasket. An inlet and outlet were also designed to ensure that the
experimental section forms a loop with the rest of the components, both of which are 0.1m long. It
has been proposed that assembly difficulties and strength problems could occur if the glass tube is
more than 2 meters in length for outdoor use6. Therefore, the maximum tube length in this study is
set as 2.2m, including a 2m long experimental section consisting of 5 detachable tubes and the
inlet and outlet sections mentioned above. And if only 1, 2, 3 and 4 detachable tubes are used, the
lengths of experiment section are 0.6m, 1.0m, 1.4m, and 1.8m, respectively. In fact, these lengths
of the experiment section have also been employed in other works25, 27. A cuboid observation shell
was designed and installed on the experimental section to observe the particle state. In order to
avoid aberration caused by the cylindrical tube, an acrylic jacket with cuboid shape was designed,
which is wrapped outside the pipe and filled with sodium iodide solution to compensate for the
refractive index error caused by acrylic material37. Two removable quartz glass windows are also
assembled on the cuboid shell to make sure a clear observation. The centrifugal pump is used to
control the flowrate accurately to 10 L/h, 15 L/h, 20 L/h, 25 L/h and 30 L/h, respectively. And the
Reynolds number corresponding to the 5 flowrates are 58.95, 88.42, 117.89, 147.36 and 176.84,
respectively, and all of them are less than 2020 which is considered as the lower critical point of
the transition to turbulence in pipe flow38. A wet sample injector was set to add the particles to the
circulating flow system and also as a reservoir with mixer. A Malvern Spraytec 2000 laser
particles analyzer was used to measure particle concentration and particle size distribution of the
added particles in the size range of 0.1 -2000 μm simultaneously. In addition, as the whole system
5
needs to be closed into a loop, some connecting tubes are used to connect the above components.
And the inner diameter of the connecting tubes which are made of silicone is 8 mm, and the total
length of them is 2.3m. It is worth noting that there is a diameter difference between the
connecting tube and the main tube and this difference is supposed to have impact on the flow flied.
However, considering that in practical application, it is a common situation to connect components
with different tube diameters. It is thus considered that our experimental system that has an
enough total tube length can still reasonably exhibit the common phenomena existing in a
particle-laden circulating flow.
Figure 1b shows the complete experimental system with the longest experiment section length
of 2.2m. Degussa P25 titanium dioxide was employed as model particles and main parameters for
this widely used photocatalyst can be found in literature39. According to the literature, P25 TiO2
powder has an primary particle size of 21nm and a true density of 3900-4000 kg/m3. In our design,
the apparent volume fraction of nanoparticles is φ=1×10⁻⁴ in the whole system, corresponding to
the mass concentration of 0.4g/L according to the density of P25 TiO2. This value of concentration
is generally employed in the photocatalytic reaction40 and thus has been considered in our study.

6
Figure 1. (a).Schematic of experiment set-up (b). Photo of the experiment set-up (tube length is 2.2
m)
Results and discussion
Dynamic particle size distribution characteristic in the flowing suspension. 0.4 g/L
P25-water suspension (φ=0.01%) was prepared firstly for the following study. The particle size
distribution for P25 in water was measured by laser diffraction (LD) method. As shown in Figure
2a, the particle size distribution (PSD) is in a wide range 0.1-100 μm and there are three peaks in
the particle distribution. Obviously, the nanoscale primary particle with original size of 21nm has
aggregated into large secondary particle of various sizes. It is worth mentioning that aggregation is
a very common phenomenon in nanoscale particle suspension, which is related to many factors,
such as the temperature of suspension, the pH of the suspension, particle size, shape, method of
preparation and solid concentration4. In this study, parameters that could affect the aggregation
process have been controlled strictly in the below experiment, including the suspension
composition, solid concentration, temperature, method of preparation. In addition, the suspensions
used in different conditions in our study were prepared in one batch, so that the initial particle size
distribution is the same for all cases. The left hand side small peak corresponds to the particle
diameter of below 1 μm, the middle one is between 1-20 μm, and the right hand side one is
between 20-100 μm. Accordingly, the particles size distribution in the fluid can be roughly divided
into three ranges: the small particles with a particle size range of 0.1-1 μm, the medium-sized
particles with a range of 1μm-20μm, and the large particles with a size range of 20μm-100μm. In
the following section, unless otherwise stated, the small, medium-sized and large particles

7
correspond to above size ranges, respectively.
After the prepared P25 suspension has been added in the circulating system, the laser particle
analyzer was started to measure the particles volume fraction and size distribution simultaneously.
Figure 2b shows the variation of mean particle size and particle volume fraction with time in the
circulating flow system. Here, the two curves with the arrow pointing to the left coordinate axis
are the variations of two kinds of mean particle sizes, D32 and D43 with time, respectively. And the
curve with the arrow pointing to the right coordinate axis is the variation of particles volume
fraction with time. Here, D32 is also called Sauter mean diameter and it is the mean particle size
taking into account both volume and surface area of the particles41, while the D43 is the mean
particle size based on the volume moment42. The expressions for the two average particle sizes are
as follows:
3
32 2
i i
i i
n D
n D=
D (1)
4
43 3
i i
i i
n D
n D=
D (2)
where the variable ni and Di are, respectively, the number frequency and diameter of particulate
matter in a particulate size fraction. Both mean particle sizes and particle volume fraction exhibit
an obvious periodical attenuated oscillation tendency with time as can be noted in Figure 2b. In
particular, the curve shows significant oscillation amplitude in the first 5 periods, and after that the
oscillation of the curve becomes almost invisible and it means that the volume fraction of the
particles in suspension tends to be a constant value. It indicates that the nanoparticles transport in
the flowing suspension and achieve uniform distribution gradually which can be considered as a
quasi-steady state of the circulating particle-laden flow. Here, the quasi-steady state means that
such macroscopic parameters for the slurry as the particle volume fraction and particle mean
diameter tend to be constant while it is still in a flowing state. In general, D43 represents the
existence of larger particles while D32 is associated with the smaller particles. A big difference
between D32 and D43 often means that the particle size has a bimodal distribution, while a small
different between D32 and D43 often means that the size distribution have only one peak43. From

8
Figure 2b, one can find that the curve of D43 is always higher than that of D32, indicating that
particle size distribution in the circulating flow may exhibit a bimodal distribution. Interestingly,
there is an obvious difference between the two oscillation curves of the mean particle size and the
concentration curve. The former two curves of mean particle size show an overall upward trend
with the passage of time, while the volume fraction curve oscillates repeatedly near an almost
constant value.
0.1 1 10 1000
2
4
6
8
10
12
Vo
lum
e F
req
uen
cy /
%
dp
/m
= 0.01% P25 TiO2 (a)
0 200 400 600 800 1000 1200 1400 16000
2
4
6
8
10
Mea
n p
art
icle
siz
e/
m
Time /s
D43
D32
0.00
0.02
0.04
0.06
0.08
0.10
810s
Particle Concentration
Vo
lum
e f
ra
cti
on
/%
73s
264s
450s626s
(b)
Figure 2. (a) Static particles size distribution of the P25-TiO2 powder dispersed in water, (b)
Variation of various mean particle sizes and particle volume fraction with time in circulated flow.
Variation of particle size distribution with time in the flowing suspension. Figure 3
shows the variation with time of the volume particle size distribution and number particle size
distribution in the circulating system with the experiment section length of 1.4m and the flowrate
of 20 L/h. Here, the times corresponds to the five peaks on the particle volume fraction curve in
Figure 2b and they are73 s, 264 s, 450 s, 626 s, 810 s, respectively. Time point of 1s and 1000 s
were also selected which were considered as the beginning state and quasi-steady state,
respectively. It is also worth noting that the volume particle size distribution is based on the
volume occupied by particles in suspension, while the number particle size distribution is based on
the quantity of particles, and there is a relationship between the two kinds of size distribution, as
follows:
31( ) ( )
6V D D N D= (3)
where V(D) and N(D) are, respectively, volume distribution and number distribution, and D is the

9
diameter of particle. It can be seen that the particle volume is the cubic relationship of the diameter,
thus the presence of a few large particles can have a significant impact the volume distribution.
From Figure 3a, one can note that the volume particle size distribution exhibits unimodal
distribution at the first two selected times, i.e., at 1s and 73 s, while it turns into bimodal
distribution after 73s. And the medium-sized particles occupy the most volume frequency in the
volume particle size distributions at all times, for the peaks with the range of 1-20 μm keep the
highest in the volume particle size distribution at all times. Although the volume particle size
distribution at t=1s and 73s are both unimodal, it is obvious that the particle size distribution is
wider at 73 s than that at 1s. And the volume particle size distribution at 73s covers all the range of
particles. However, there are only medium-sized particles at t=1s. According to the design of our
set-up, t=1s is the time that first group of particles can be detected by the laser particle analyzer. It
indicates that the medium-sized particles have better tracking characteristics. Particularly, tracking
characteristics is very important for selecting tracer particles in PIV technology, in which the
particle velocity lag should be smaller and the relaxation time should be shorter44. From the
perspective of photocatalytic reaction, this characteristic is also very important, because it
represents whether the particles can be effectively transported and therefore whether the particles
settle in the reactor tube.
From inset 1 of Figure 3a, one can find that the small particles occupy very little volume
frequency in the circulating flow system at any time, while it reaches maximum value at t=264s.
From inset 2 of Figure 3a, one can see that the position of the peak representing the medium-sized
particles shifts to left after t=73s and it changes relatively intense from t=73 s to t =450 s and less
obviously after t=450 s. Comparing the three volume particle size distribution at t=73 s, 264 s and
450s, it is not difficult to find that the particle size distribution at t= 73 is a unimodal distribution,
while that of t= 264 s and 450 s are bimodal distribution, but the particles at t =264 s are small
particles and medium-sized particles, the particles at t= 450 s are medium-sized particles and large
particles. From inset 3 of Figure 3a, one can note that the peak of large particles doesn’t appear
until t= 626 s, and the height of the peak increase with time. As has been mentioned above,
t=1000s is considered as the quasi-steady state for the particle volume fraction in the circulating
system becoming a constant value after this time. It can be seen that the volume particle size
distribution at this time still shows a bimodal distribution, and the two peaks correspond to

10
medium-sized and large particles respectively and the corresponding particle sizes are about
5.5μm and 60μm respectively.
0.01 0.1 1 10 100 1000 100000
2
4
6
8
10
Vo
lum
e F
req
uen
cy
/ %
Particle size / m
1s
73s
264s
450s
626s
810s
1000s
0.2 0.4 0.60.810.0
0.2
0.4
0.6
0.8
1.0
1
5 10 15 20
8
9
10
(a)2
40 80 120 1600.0
0.2
0.4
0.6
0.8
1.0
3
0.1 1 10 100 10000
5
10
15
20
25
30
Nu
mb
er F
req
uen
cy
/ %
Particle size / m
1s
73s
264s
450s
626s
810s
1000s
(b)
2 311
12
13
14
15
Figure 3. (a) Volume Frequency and (b) Number Frequency against particle size in the circulating
system recorded at various time, the experiment section is 1.4m long and the flowrate is 20 L/h.
Figure 3b shows that the peak of the number particle size distribution at t= 73 s and 264s are
about 100 nm and 250 nm, respectively. In addition, it is obvious that the number particle size
distributions at t =1s, 450s, 626s, 810s, 1000s are all unimodal distribution and the peaks are all in
range of 2-5 μm. To understand this phenomenon, particle size distribution from the perspective of
volume and quantity needs to be further discussed. For example, assuming that all the particles are
spherical, if the particle size of a larger particle is 10 times that of a small particle, its volume will
be 1000 times that of a small particle according to Equation 3. Therefore, it can be easy to
understand why there is only a small peak for the small particles in the volume particle size
distribution at t =73s and 264s, while a very high peak for the small particles in the number
particle size distribution at these two times, considering that the large amount of small particles
only occupy a very small volume. On the other hand, large particles appears only after t=450s and
shows a small peak in the volume particle size distribution, but it almost has no proportion in the
number particle size distribution. This phenomenon indicates that the large particles are in the
minority in the suspension flow while it can influence the volume particle size distribution very
significantly. Furthermore, large proportion of medium-sized particles both from the volume and
quantity point proves that this part of particles prevail in the circulating flow. Also, this part of
particles is preferred for the photocatalytic reaction for their larger surface area and better light
absorption characteristics45. In particular, we assume that the medium-sized particles can be well

11
suspended in the laminar flow. This may have certain significance to increase the overall energy
conversion efficiency of the solar photocatalytic water splitting system, for the laminar flow
consume less energy than turbulence flow.
Photo of the particle-laden laminar circulating flow in the tube. As mentioned
above, there is an observation window in the experimental device to observe the movement of
particles. Figure 4a shows the first photo that was taken when the first part of particles reached the
observation window. Again, it can be seen that the particles group presents a parabolic profile,
indicating their distribution in a laminar flow. In our previous work, the velocity field of this kind
of suspension has been measured by PIV, which shows a parabolic distribution but the axis of
symmetry is not in the center of the tube32. And it can be seen that the axis of symmetry in Figure
4a is lower than the center line as marked by the red dotted line. Figure 4b shows the concentrated
particles reaching the observation window which corresponds to the first peak in the particle
volume fraction oscillation curve in Figure 2b. Figure 4c shows the time when the concentrated
particles have just passed through the observation window which is assumed as corresponding to
the first valley value at t=185s of the particles volume fraction oscillation curve in Figure 2b. This
assumption was based on the view of the observation window which appears a very light region
compared with Figure 4b. Figure 4d shows the image time when the particles arranged in parabola
reached the observation window again, which can be seen as the beginning of the second peak of
particles volume fraction oscillation curve in Figure 2b. Figure 4e shows image when the
concentrated particles corresponding to the second peak in the particles volume fraction oscillation
curves in Figure 2b, reached the observation window. Visibly, the color in Figure 4e is lighter than
Figure 4b, which means the particle volume fraction in Figure 4e is less than that in Figure 4b
according to Lambert-Beer law46. This is consistent with the results that the particle volume
fraction curve exhibits an attenuated oscillation in Figure 2a. Figure 4f shows the state when the
particle volume fraction becomes uniform and reaches the quasi-steady state. From Figure 4a-f, it
can be further concluded that the particle concentration and particle size oscillation phenomenon
in circulating flow is closely related to the particles movement following the fluids which has a
parabolic velocity distribution.

12
Figure 4. Photos of particles transport phenomenon in the circulating flow in the experiment
section which the length is 0.6m and the flowrate is 15 L/h (a)t=1s,(b) t=22s,(c)t=39s,(d)t= 50s,
(e)59s,(f) 123s
Influence of the flowrate of suspension on particle volume and particle size Figure
5 shows the influence of flowrate on the particle volume fraction in circulating flow. It can be
found that all the oscillation curve of particles volume fraction under different flowrates are very
similar, the main difference is the time interval between peaks of oscillation. For the sake of the
following discussions, we defined the time interval as the period of the oscillation curve. And it
can be intuitively seen that the period tends to decrease with the flowrate increasing. In particular,
the particle volume fraction at quasi-steady state is very different for different flowrates, and it can
be seen that the particle volume fraction at 20 L/h, 25L/h and 30L/h is close, while the particle
volume fraction at 10L/h and 15 L/h is much lower than that at the above three flowrates.

13
Figure 5. Influence of the flowrate on the particles volume fraction oscillation curve
The mean particle size and the volume particle size distribution at the quasi-steady state versus
the various flowrates are shown in Figure 6. From the Figure 6a, it can be noted that the D43 firstly
decreases from the flowrate 10 L/h to 15 L/h and then increases obviously with increasing
flowrate, while D32 changes only a little. As has been discussed above, large particles contribute
significantly to the value of D43. Accordingly, it indicates that the large particles are easier to be
transported in the circulating system with high flowrates. It can be also found that the difference
between D43 and D32 reach the maximum at flowrate 30 L/h, which can also prove that the
particles distribution will be wider at larger flowrate. Figure 6b shows that the equilibrium
particles size distributions for all the five different flowrates exhibit a bimodal distribution. The
peak corresponding to the large particles increases with the flowrate increasing. This phenomenon
is in consistent with the result in Figure 6a, for the large particles are easier to settle than the other
two kinds of particles. As mentioned above, particle volume fraction at lower flowrate such as 10
L/h is obviously lower than that at higher flowrate, and it can be attributed to the sedimentation of
larger particles. Sedimentation of larger particles means the loss of photocatalysts, so a relative
higher flowrate is required to guarantee that most of the particles can be transported in the
circulating system. Nevertheless, it can be found that the mean particle size at flowrate 10 L/h is
even larger than at 25L/h. Compared with Figure 6b, this phenomenon can be attributed to the

14
overall right-hand side movement of the volume particle size distribution at 10 L/h. It indicates
that the medium-sized particles should occupy larger proportion in the volume particle size
distribution compared to the other cases. And this phenomenon also exhibit that, according to our
study, if the particle size can be controlled less than 20 μm, a very small flow rate such as 10 L/h
can ensure the effective suspending of particles.
10 L/h 15 L/h 20 L/h 25 L/h 30 L/h0
2
4
6
8
10
12
Aver
age
Dia
met
er/
m
D43
D32
(a)
Flowrate
0.1 1 10 100
0
2
4
6
8
10
Vo
lum
e fr
equ
an
cy /
%
Particle diameter /m
10 L/h
15 L/h
20 L/h
25 L/h
30 L/h
(b)
Figure 6. Variation of (a) mean particle size with flowrate, (b) volume distribution of particle size
with flowrate, when particle concentration reaches quasi-steady state
Influence of the tube length on particle volume fraction and particle size For the
tubular reactor, due to the requirement of light transmittance, the diameter of the reaction pipe is
generally small, so a relative longer tube length is needed to ensure sufficient light area. On the
other hand, tube length could increase the particle transport distance which will in turn influence
the particle distribution characteristics, thus study the influence of tube length is important. Figure
7 shows variation of the particle volume fraction in the circulating system with different tube
length at flowrate of 20 L/h. It can be found that all of the five particle volume fraction curves
have the periodic attenuated oscillation phenomenon, but the periods of the five curves increase
with the increasing of tube length. In addition, it can be observed that the particle volume fraction
at quasi-steady decreases as the tube length increases.

15
0 200 400 600 800 1000 1200 1400
0.00
0.02
0.04
0.06
0.08
0.10
0.12
Volu
me
fract
ion
/%
t /s
0.6m tube
1.0m tube
1.4m tube
1.8m tube
2.2m tube
flowrate= 20L/h
Figure 7. Influence of the experiment section length on the particles volume fraction oscillation
curve
Influence of the experiment section length on the particle size in the particle transport process is
shown in Figure 8. It can be found from Figure 8a that the mean particle size tends to decreases
with the length of experiment section increasing, especially for the mean particle size D43. As has
been mentioned above, D43 is very sensitive to the large particles, so it can be derived that the
proportion of large particles decreases as the length of experiment section increases. Figure 8b,
shows similar phenomenon. Not only the peak of large particles but also the peak of medium-sized
particles moves to left hand side as the length of experiment section increases.
0.6 m 1.0 m 1.4 m 1.8m 2.2 m0
2
4
6
8
10
12
Mea
n p
arti
cle
siz
e/
m
D43
D32
(a)
Length of the test section
0.1 1 10 100
0
2
4
6
8
10
Volu
me
freq
uan
cy /
%
Particle diameter /m
0.6 m
1.0 m
1.4 m
1.8 m
2.2 m
(b)
Figure 8. Influence of experiment section length on (a) variation of mean particle size, (b)
variation of volume distribution of particle size, when the particles movement reaches the
quasi-steady state

16
Experimental data fitting and analysis From the Figures 2, 5, and 7, one can find that the
attenuated oscillation exists at any flowrate and in the experiment section with any length. Also,
Figure 4 further shows that the attenuated oscillation phenomenon is likely due to the parabolic
profile flow field in laminar flow. With this kind of flow field, particles which are near the center
line of tube tend to have higher velocity, while particles which are near the wall of tube tend to
have lower velocity, and this phenomenon has also been used to measure the particle size and
separate different supramolecular species that is called field-flow fractionation47. And it can be
assumed from Figure 5 that the period of the attenuated oscillation might be inversely proportional
to the flowrate, whereas it can be deduced from Figure 7 that the period of the attenuated
oscillation might be proportional to the length of experiment section. To further confirm the above
relations, two linear fit curves which show the relationship between the reciprocal of flowrate, the
length of the experiment section and the period of the attenuated curve are given in Figure 9 a and
b, respectively. And the R2 values of the two curves are both larger than 0.99, proving the good
linear relationship.
Figure 9. Linear fit of the relationship between (a) reciprocal of flowrate, (b) length of the
experiment section and the period of the attenuated oscillation
Apart from the linear relationship of the periods, one can also find that the attenuated oscillation
curve tend to be a flat line after five periods for all the conditions. This enlightens us that a time of
five periods can be an important criterion for the quasi-steady state of the suspension flow. As
mentioned above, if the period of the attenuated oscillation, the flowrate and the length of the
experiment section are defined as T, Q and L, respectively, the relationship between them can be
0.04 0.06 0.08 0.10
180
270
360358s
237s
187s
146s
Perio
d /
s
Reciprocal of flowrate / h•L-1
Period derived from Figure 5
Linear Fit of period
(a)
R2=0.9982
120s
0.8 1.2 1.6 2.0
100
150
200
250
261s
226s
188s
147s
Perio
d /
s
Length of the test section /m
Period derived from Figure 7
Linear Fit of period
R2=0.9992
(b)
110s
17
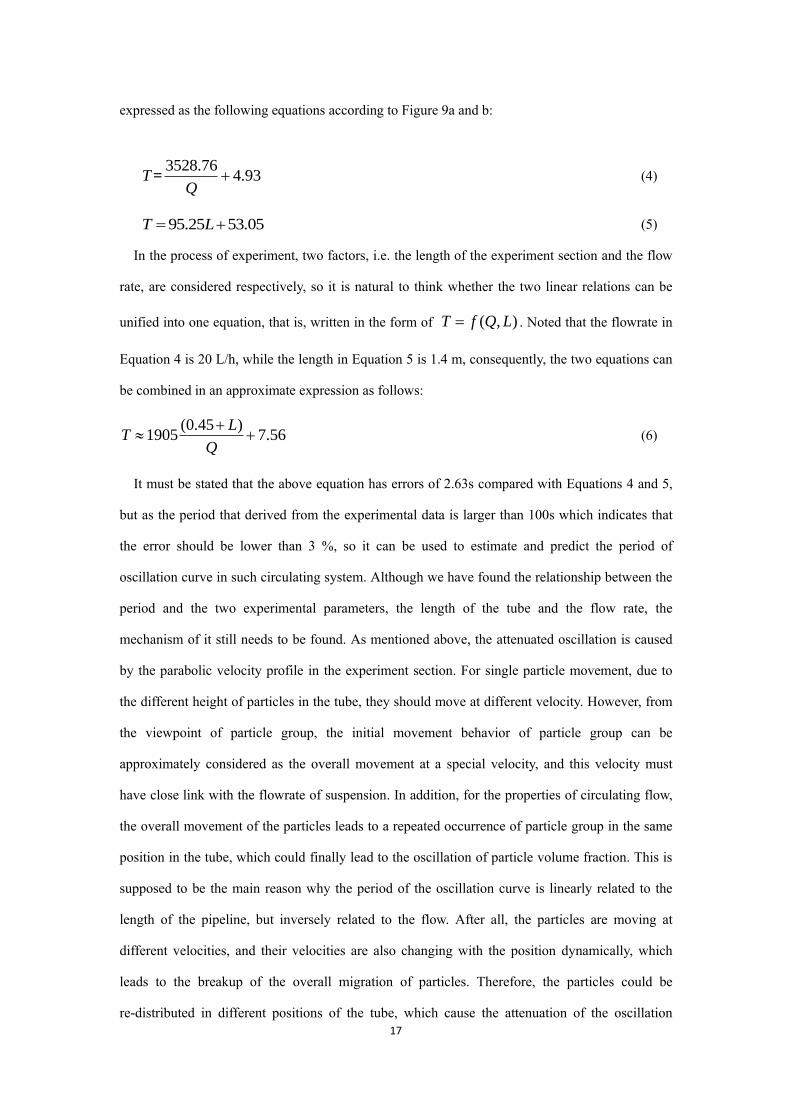
expressed as the following equations according to Figure 9a and b:
3528.764.93=T
Q+ (4)
95.25 53.05T L= + (5)
In the process of experiment, two factors, i.e. the length of the experiment section and the flow
rate, are considered respectively, so it is natural to think whether the two linear relations can be
unified into one equation, that is, written in the form of ( , )T f Q L= . Noted that the flowrate in
Equation 4 is 20 L/h, while the length in Equation 5 is 1.4 m, consequently, the two equations can
be combined in an approximate expression as follows:
(0.45 )1905 7.56
LT
Q
+ + (6)
It must be stated that the above equation has errors of 2.63s compared with Equations 4 and 5,
but as the period that derived from the experimental data is larger than 100s which indicates that
the error should be lower than 3 %, so it can be used to estimate and predict the period of
oscillation curve in such circulating system. Although we have found the relationship between the
period and the two experimental parameters, the length of the tube and the flow rate, the
mechanism of it still needs to be found. As mentioned above, the attenuated oscillation is caused
by the parabolic velocity profile in the experiment section. For single particle movement, due to
the different height of particles in the tube, they should move at different velocity. However, from
the viewpoint of particle group, the initial movement behavior of particle group can be
approximately considered as the overall movement at a special velocity, and this velocity must
have close link with the flowrate of suspension. In addition, for the properties of circulating flow,
the overall movement of the particles leads to a repeated occurrence of particle group in the same
position in the tube, which could finally lead to the oscillation of particle volume fraction. This is
supposed to be the main reason why the period of the oscillation curve is linearly related to the
length of the pipeline, but inversely related to the flow. After all, the particles are moving at
different velocities, and their velocities are also changing with the position dynamically, which
leads to the breakup of the overall migration of particles. Therefore, the particles could be
re-distributed in different positions of the tube, which cause the attenuation of the oscillation

18
curve.
As mentioned above, a time of 5T is an important criterion for the particle suspension to reach
the quasi-steady state. And we also believe that it is very valuable to the photocatalytic reaction,
because the time of circulating flow is related to the working time of pump and a consumption of
energy. In some practical photocatalytic reactor, the operation mode is intermittent and it only
need to use pump when the suspension needs to be suspended again 33. Therefore, we recommend
that the pump only need to work for a time of 5T and the particle suspension will be well
suspended. It is worth noting that, according to Equation 6, the period T should be different in
other cases having different tube diameter or length. Nevertheless, we suggest a simple method to
evaluate T based on our experiment setup. According to Figure 4a and d, the first peak and the
second peak of the particle volume fraction in the circulating flow has an obvious correlation
which could be distinguished clearly. It is therefore possible to measure the time between two
peaks to evaluate the period T. And due to the wide application of such kind of nanoscale
particle-laden flow, our method can thus be also used to predict the transport process in similar
applications.
Conclusions
In this study, an experimental study is conducted to explain the transport phenomenon of
nanoparticles in circulating flow. It can be found the particle volume fraction varies with time and
appears periodical attenuated oscillation, which is closely related to the velocity distribution in
laminar flow. And we further analyze the period of the attenuated oscillation curve by conducting
a linear fitting, which shows that the period can be express as ( , )T f Q L= in which the period is
proportional to the length of experiment section and inversely proportional to the flowrate. Also,
we found the time 5T is a very important criterion for whether the particle suspension has reached
the quasi-steady state. And it is believed to be valuable to reduce energy consumption in the
photocatalytic reaction.
In general, our obtained results are believed to be of value for the understanding of the
nanoscale particle transport phenomenon in many natural or industrial processes. In particular, our
results are helpful for the understanding and then effective control of the movement and

19
distribution of photocatalyst particles in the tubular photocatalytic reactor, which is believed to
significantly affect the energy conversion efficiency of the photocatalytic processes.
Acknowledgements
The authors gratefully acknowledge the financial support of the National Natural Science
Foundation of China (No. 51776165, 51888103) and the financial support from Royal
Society-Newton Advanced Fellowship grant (NAF\R1\191163).
Literature cited
1. Li, S.; Zhou, J.; Wang, Y.; Teng, A.; Zhang, K.; Wu, Z.; Cheng, S.; Wang, W., Physicochemical
and Antimicrobial Properties of Hydroxypropyl Methylcellulose-Cinnamon Essential Oil Emulsion:
Effects of Micro-and Nanodroplets. International Journal of Food Engineering 2019, 15, (9).
2. E, W.; Cheng, J.; Yang, C.; Mao, Z., Experimental study by online measurement of the
precipitation of nickel hydroxide: Effects of operating conditions. Chinese Journal of Chemical
Engineering 2015, 23, (5), 860-867.
3. Heath, A. R.; Fawell, P. D.; Bahri, P. A.; Swift, J. D., Estimating Average Particle Size by
Focused Beam Reflectance Measurement (FBRM). Particle & Particle Systems Characterization 2002,
19, (2), 84-95.
4. Jing, D. W.; Song, D. X., Optical properties of nanofluids considering particle size distribution:
Experimental and theoretical investigations. Renewable and Sustainable Energy Reviews 2017, 78,
452-465.
5. Song, R.; Luo, B.; Liu, M. C.; Geng, J. F.; Jing, D. W.; Liu, H., Synergetic coupling of photo and
thermal energy for efficient hydrogen production by formic acid reforming. AIChE Journal 2017, 63,
(7), 2916-2925.
6. Jing, D. W.; Liu, H.; Zhang, X. H.; Zhao, L.; Guo, L. J., Photocatalytic hydrogen production
under direct solar light in a CPC based solar reactor: Reactor design and preliminary results. Energy
Conversion and Management 2009, 50, (12), 2919-2926.
7. Hisatomi, T.; Domen, K., Reaction systems for solar hydrogen production via water splitting with
particulate semiconductor photocatalysts. Nature Catalysis 2019, 2, (5), 387-399.
8. Malato, S.; Blanco, J.; Campos, A.; Cáceres, J.; Guillard, C.; Herrmann, J. M.; Fernández-Alba, A.
R., Effect of operating parameters on the testing of new industrial titania catalysts at solar pilot plant
scale. Applied Catalysis B, Environmental 2003, 42, (4), 349-357.
9. Amiri, H.; Ayati, B.; Ganjidoust, H., Mass transfer phenomenon in photocatalytic cascade disc
reactor: Effects of artificial roughness and flow rate. Chemical Engineering and Processing: Process
Intensification 2017, 116, 48-59.
10. Banić, N. D.; Abramović, B. F.; Šojić, D. V.; Krstić, J. B.; Finčur, N. L.; Bočković, I. P.,
Efficiency of neonicotinoids photocatalytic degradation by using annular slurry reactor. Chemical
Engineering Journal 2016, 286, 184-190.
11. Li Puma, G.; Yue, P. L., Enhanced photocatalysis in a pilot laminar falling film slurry reactor.
Industrial & Engineering Chemistry Research 1999, 38, (9), 3246-3254.
12. Barresi, A.; Baldi, G., Solid dispersion in an agitated vessel effect of particle shape and density.

20
Chemical Engineering Science 1987, 12, (42), 2969-2972.
13. Huang, J. K.; Lu, Y. J.; Wang, H., A new quantitative measurement method for mixing and
segregation of binary-mixture fluidized bed by capacitance probe. Chemical Engineering Journal 2017,
326, 99-108.
14. Su, X.; Wang, C.; Pei, H.; Li, J.; Lan, X.; Gao, J., Experimental Study of Solids Motion in an 18
m Gas-Solids Circulating Fluidized Bed with High Solids Flux. Industrial & Engineering Chemistry
Research 2019, 58, (51), 23468-23480.
15. Wang, K.; Liu, G.; Liu, Z. G.; Wu, J.; Yi, L. T.; Zhang, J. L.; Du, J. C., Acoustic sensor
approaches for sand detection in sand–water two-phase flows. Powder Technology 2017, 320,
739-747.
16. Nocentini, M.; Pinelli, D.; Magelli, F., Dispersion coefficient and settling velocity of the solids in
agitated slurry reactors stirred with multiple rushton turbines. Chemical Engineering Science 2002, 57,
(11), 1877-1884.
17. Jung, S. H.; Kim, J. S.; Kim, J. B.; Kwon, T. Y., Flow-rate measurements of a dual-phase pipe
flow by cross-correlation technique of transmitted radiation signals. Applied Radiation and Isotopes
2009, 67, (7-8), 1254-8.
18. Gomes, F. P. C.; Garg, A.; Mhaskar, P.; Thompson, M. R., Data-Driven Advances in
Manufacturing for Batch Polymer Processing Using Multivariate Nondestructive Monitoring.
Industrial & Engineering Chemistry Research 2019, 58, (23), 9940-9951.
19. Bieberle, A.; Schubert, M.; Da Silva, M. J.; Hampel, U., Measurement of Liquid Distributions in
Particle Packings Using Wire-Mesh Sensor versus Transmission Tomographic Imaging. Industrial &
Engineering Chemistry Research 2010, 49, (19), 9445-9453.
20. Liu, L.; Fang, Z. Y.; Wu, Y. P.; Lai, X. P.; Wang, P.; Song, K., Experimental investigation of
solid-liquid two-phase flow in cemented rock-tailings backfill using Electrical Resistance Tomography.
Construction and Building Materials 2018, 175, 267-276.
21. Warsito, W.; Fan, L. S., ECT imaging of three-phase fluidized bed based on three-phase
capacitance model. Chemical Engineering Science 2003, 58, (3-6), 823-832.
22. Black, D. L.; McQuay, M. Q.; Bonin, M. P., Laser-based techniques for particle-size
measurement: A review of sizing methods and their industrial applications. Progress in Energy and
Combustion Science 1996, 22, (3), 267-306.
23. Lourenco, A.; Arnold, J.; Cayre, O. J.; Rasteiro, M. G., Flocculation Treatment of an Industrial
Effluent: Performance Assessment by Laser Diffraction Spectroscopy. Industrial & Engineering
Chemistry Research 2018, 57, (7), 2628-2637.
24. Ma, Z. H.; Merkus, H. G.; de Smet, J.; Heffels, C.; Scarlett, B., New developments in particle
characterization by laser diffraction: size and shape. POWDER TECHNOLOGY 2000, 111, (1-2),
66-78.
25. Ochoa-Gutiérrez, K. S.; Tabares-Aguilar, E.; Mueses, M. Á.; Machuca-Martínez, F.; Li Puma, G.,
A Novel Prototype Offset Multi Tubular Photoreactor (OMTP) for solar photocatalytic degradation of
water contaminants. Chemical Engineering Journal 2018, 341, 628-638.
26. Li, D.; Xiong, K.; Li, W.; Yang, Z. H.; Liu, C.; Feng, X.; Lu, X. H., Comparative Study in
Liquid-Phase Heterogeneous Photocatalysis: Model for Photoreactor Scale-Up. Industrial &
Engineering Chemistry Research 2010, 49, (18), 8397-8405.
27. Malato, S.; Blanco, J.; Vidal, A.; Richter, C., Photocatalysis with solar energy at a pilot-plant
scale: an overview. Applied Catalysis B-Environmental 2002, 37, (1), 1-15.

21
28. Segré, G.; Silberberg, A., Behaviour of macroscopic rigid spheres in Poiseuille flow Part 1.
Determination of local concentration by statistical analysis of particle passages through crossed light
beams. Journal of Fluid Mechanics 1962, 14, (01), 115.
29. Tirumkudulu, M.; Tripathi, A.; Acrivos, A., Particle segregation in monodisperse sheared
suspensions. Physics of Fluids 1999, 11, (3), 507-509.
30. Koh, C. J.; Hookham, P.; Leal, L. G., An experimental investigation of concentrated suspension
flows in a rectangular channel. Journal of Fluid Mechanics 1994, 266, 1-32.
31. Hampton, R. E.; Mammoli, A. A.; Graham, A. L.; Tetlow, N.; Altobelli, S. A., Migration of
particles undergoing pressure-driven flow in a circular conduit. Journal of Rheology 1997, 41, (3),
621-640.
32. Geng, J. F.; Wang, Y. C.; Hu, X. W.; Jing, D. W., Insights into the hydrodynamic properties of
slurry flow in a tubular photocatalytic reactor by PIV combined with LSIA. Chemical Engineering
Science 2016, 152, 127-139.
33. Cao, F.; Wei, Q. Y.; Liu, H.; Lu, N.; Zhao, L.; Guo, L. J., Development of the direct solar
photocatalytic water splitting system for hydrogen production in Northwest China: Design and
evaluation of photoreactor. Renewable Energy 2018, 121, 153-163.
34. Wei, Q. Y.; Yang, Y.; Hou, J. Y.; Liu, H.; Cao, F.; Zhao, L., Direct solar photocatalytic hydrogen
generation with CPC photoreactors: System development. Solar Energy 2017, 153, 215-223.
35. Jing, D. W.; Guo, L. J.; Zhao, L.; Zhang, X. M.; Liu, H.; Li, M. T.; Shen, S. H.; Liu, G. J.; Hu, X.
W.; Zhang, X. H., Efficient solar hydrogen production by photocatalytic water splitting: From
fundamental study to pilot demonstration. International Journal of Hydrogen Energy 2010, 35, (13),
7087-7097.
36. Bello Lamo, M.; Buering, M.; Bahnemann, D., Effect of flowrate, photocatalyst loading and
illumination conditions on the photocatalytic disinfection of recombinant Escherichia coli. Materials
Research Innovations 2014, 19, (1), 20-23.
37. Budwig, R., Refractive index matching methods for liquid flow investigations. Experiments in
Fluids 1994, 17, (5), 350-355.
38. Mukund, V.; Hof, B., The critical point of the transition to turbulence in pipe flow. Journal of
Fluid Mechanics 2018, 839, 76-94.
39. Kalantary, R. R.; Shahamat, Y. D.; Farzadkia, M.; Esrafili, A.; Asgharnia, H., Photocatalytic
degradation and mineralization of diazinon in aqueous solution using nano-TiO2(Degussa, P25): kinetic
and statistical analysis. Desalination and Water Treatment 2015, 55, (2), 555-563.
40. Tolosana-Moranchel, A.; Casas, J. A.; Carbajo, J.; Faraldos, M.; Bahamonde, A., Influence of
TiO2 optical parameters in a slurry photocatalytic reactor: Kinetic modelling. Applied Catalysis B:
Environmental 2017, 200, 164-173.
41. Kowalczuk, P. B.; Drzymala, J., Physical meaning of the Sauter mean diameter of spherical
particulate matter. Particulate Science and Technology 2016, 34, (6), 645-647.
42. Wang, L.; Fang, N. F.; Yue, Z. J.; Shi, Z. H.; Hua, L., Raindrop Size and Flow Depth Control
Sediment Sorting in Shallow Flows on Steep Slopes. Water Resources Research 2018, 54, (12),
9978-9995.
43. Mahdi Jafari, S.; He, Y.; Bhandari, B., Nano-Emulsion Production by Sonication and
Microfluidization-A Comparison. International Journal of Food Properties 2006, 9, (3), 475-485.
44. Melling, A., Tracer particles and seeding for particle image velocimetry. Measurement Science
and Technology 1997, 8, (12), 1406-1416.

22
45. Suarez, S.; Jansson, I.; Ohtani, B.; Sanchez, B., From titania nanoparticles to decahedral anatase
particles: Photocatalytic activity of TiO2/zeolite hybrids for VOCs oxidation. Catalysis Today 2019,
326, (1), 2-7.
46. Xingcai, L.; Kun, N., Effectively predict the solar radiation transmittance of dusty photovoltaic
panels through Lambert-Beer law. Renewable Energy 2018, 123, 634-638.
47. Kowalkowski, T.; Buszewski, B.; Cantado, C.; Dondi, F., Field-Flow Fractionation: Theory,
Techniques, Applications and the Challenges. Critical Reviews in Analytical Chemistry 2006, 36, (2),
129-135.

23
Table of Contents graphic
An experimental set-up based on photocatalytic application was developed to investigate the
nanoparticle volume fraction and size distribution in a laminar particle-laden circulating flow. A
periodical attenuated oscillation of the particle volume fraction and mean particle size with time
was found. It was also found by a fitting analysis that the period of the attenuated oscillation is
related to the flowrate and length of experiment section, and the time of five periods is found to be
an important criterion for particle control.