
How to take into account vulnerability in aid allocation criteria:
Attention Allocation Aid for Visual SearchArturo Deza∗
Dynamical NeuroscienceUC Santa Barbara
Jeffrey R. PetersMechanical Engineering
UC Santa [email protected]
Grant S. TaylorU.S. Army
Aviation DevelopmentDirectorate, USA
Amit SuranaUnited Technologies Research
Center, [email protected]
Miguel P. EcksteinPsychological and Brain
Sciences, UC Santa [email protected]
ABSTRACTThis paper outlines the development and testing of a novel,feedback-enabled attention allocation aid (AAAD), which usesreal-time physiological data to improve human performancein a realistic sequential visual search task. Indeed, by optimiz-ing over search duration, the aid improves efficiency, whilepreserving decision accuracy, as the operator identifies andclassifies targets within simulated aerial imagery. Specifically,using experimental eye-tracking data and measurements abouttarget detectability across the human visual field, we developfunctional models of detection accuracy as a function of searchtime, number of eye movements, scan path, and image clutter.These models are then used by the AAAD in conjunction withreal time eye position data to make probabilistic estimations ofattained search accuracy and to recommend that the observereither move on to the next image or continue exploring thepresent image. An experimental evaluation in a scenario moti-vated from human supervisory control in surveillance missionsconfirms the benefits of the AAAD.
ACM Classification KeywordsH.1.2 [Models and Principles]: User/Machine Systems–Human factors, Human information processing; H.4.2 [In-formation Systems Applications]: Types of Systems–DecisionSupport; H.m [Miscellaneous]; I.6.4 [Simulation and Model-ing]: Model Validation and Analysis; General Terms: Experi-mentation, Human Factors, Verification
Author KeywordsAttention; cognitive load; decision making; visual search.
0All authors of the paper are also affiliated with the Institute forCollaborative Biotechnologies.
Permission to make digital or hard copies of all or part of this work for personal orclassroom use is granted without fee provided that copies are not made or distributedfor profit or commercial advantage and that copies bear this notice and the full citationon the first page. Copyrights for components of this work owned by others than ACMmust be honored. Abstracting with credit is permitted. To copy otherwise, or republish,to post on servers or to redistribute to lists, requires prior specific permission and/or afee. Request permissions from [email protected] 2017, May 6-11, 2017, Denver, CO, USA.Copyright © 2017 ACM ISBN 978-1-4503-4655-9/17/05 ...$15.00.http://dx.doi.org/10.1145/3025453.3025834
INTRODUCTIONThe maturation of visual sensor technology has steadily in-creased the amount of real-time data that is available in modernsurveillance mission scenarios ranging across military, home-land security and commercial applications. In many cases,it is the job of a human operator to ensure that this data isprocessed quickly and accurately. For example, supervisorysystems involving collaboration between human operators andunmanned vehicles often require the sequential processing ofimagery that is generated by the autonomous vehicles’ on-board cameras for the purpose of finding targets, analyzingterrain, and making key planning decisions [39]. The incredi-ble volume of data generated by modern sensors, combinedwith the complex nature of modern mission scenarios, makesoperators susceptible to information overload and attentionallocation inefficiencies [9], which can lead to detrimental per-formance and potentially dire consequences [44]. As such, thedevelopment of tools to improve human performance in visualdata analysis tasks is crucial to ensuring mission success.
This article focuses on the development and experimental ver-ification of a novel, attention allocation aid that is designed tohelp human operators in a sequential visual search task, whichrequires the detection and classification of targets within a sim-ulated landscape. Our study is primarily motivated by surveil-lance applications that require humans to find high value tar-gets within videos generated by remote sensors, e.g., mountedon unmanned vehicles; however, the presented method is ap-plicable to a variety of application domains.
Specifically, the main contribution of this paper is the introduc-tion and experimental verification of a real-time and feedback-enabled attention allocation aid (AAAD), which optimizesthe operator’s decision speed when they are engaging in targetsearch, without sacrificing performance. The motivating ob-servation is that humans have imperfect awareness of the timerequired to acquire all task-relevant visual information duringsearch, and thus are generally inefficient at administering theirtime when scrutinizing the data sets. The proposed aid makesreal-time automated search duration recommendations basedon three key metrics: 1) visual search time, 2) number ofeye movements executed by the observer, and 3) an estimated
arX
iv:1
701.
0396
8v1
[cs
.HC
] 1
4 Ja
n 20
17

target detectability based on prior measurements of both thetarget visibility across the visual field and the observer’s fixa-tions during search. In particular, these metrics are used by theaid to estimate the time required for the operator to acquire thevisual information that is necessary to support the search deci-sions, and subsequently indicate when this time has elapsedvia a simple indicator on the user interface. We experimen-tally evaluate the AAAD in a simulated surveillance scenariomotivated by human supervisory control, and found a factorof×1.5 increase in user efficiency in detecting and classifyingtargets in realistic visual imagery from a slowly moving sensor.The AAAD pipeline is generic and can readily be extendedand applied to other sources of images, i.e., satellite images,astronomical images [6], x-rays for medical imaging [1, 13]or security scanning [5], and video surveillance [45] whichinclude a human-in-the-loop [53, 52].
Our rigorous development of the AAAD also includes a num-ber of secondary contributions, including: definition of de-tectability surfaces based on eye-tacking measurements, in-corporation of image clutter effects, creation of a compositeexploration map, and utilization of a probabilistic frameworkfor decision making when computing overall search satisfac-tion based on time, eye movements, and detectability scores.
PREVIOUS WORKResearch in human computer interaction has capitalized onbasic vision science research by including samples of the thevisual environment through eye movements (active vision)within a larger modeling framework that includes cognitive,motor, and perceptual processing involved in visual search(Tseng and Howes, 2015 [48] and Halverson and Hofson,2011 [20] which expands on the work of Kieras and Meyer,1997 [32]). Such models have been proposed for potential usefor computer interface evaluation and design.
Another line of research has focused on how to augment hu-man capabilities in coordinating multiple tasks. For example,models have been used to optimize how observers split theirattentional resources when simultaneously conducting twodifferent visuo-cognitive tasks [36].
Attention allocation aids have been studied in the context ofhuman supervisory control of large data acquired by multipleautomated agents (e.g., [46, 9]). Such scenarios present thechallenge of a human having to inspect large data sets withpossible errors due to visual limitations, attentional bottle-necks, and fatigue. The use of advanced physiological sensingthrough eye-tracking technology has become a viable optionfor both the assessment of the operator cognitive state, andthe evaluation of operator performance in a number of real-istic applications, e.g. [49]. One line of research attempts touse eye-tracking measurements to detect physiological andcognitive precursors to behavior such as perceived workload,fatigue, or situational awareness. Indeed, objective measuressuch as blink rates [51], pupil diameter [50, 31] , and fixa-tion/saccade characteristics [2], all have correlations to cog-nitive processing, although the use of such measurements asreliable indicators of operator mental states is not fully under-stood [12]. If undesirable states can be accurately anticipatedwith physiological measures, then they can be used to drive
automated aids that mediate operator resources through, e.g.,optimization of task schedules [38] or adaptive automationschemes [22, 43].
Other researchers have utilized eye tracker technology to showincreased efficiency of human search by relying on a “divideand conquer” collaborative search [57, 7]. In such schemes,multiple observers (usually two) engage in target search simul-taneously with real-time updates of their partners’ gaze andaccess to voice communication.
A novel approach investigated in the current work is the designof an attention allocation aid that uses eye-tracking data tomake real time inferences of the attained target detection ac-curacy and critically, the time to achieve asymptotic accuracy.Such estimates, which we will refer to as search satisfactiontime, are utilized by the attention allocation aid to recommendthat the user end the current search and move on to the nextdata set. In addition, if the observer completes search priorto the search satisfaction time, the eye position data can alsobe utilized to assess whether some area of the image remainsunexplored, and suggest that the observer to further explorethat area.
The success of the proposed approach requires an adequate un-derstanding of the relation between fixational eye-movementsand the accumulation of sensory evidence supporting task per-formance. A critical component to understanding the contribu-tion of eye movement to task performance is the dependence oftarget detectability with its distance from the point of fixation,commonly referred to as retinal eccentricity [11, 37, 33, 10].Indeed, this relationship can be used to build attention-basedmodels for predicting performance [24]. Often, dynamic sen-sory evidence accumulation models are also dependent uponthe nature of the stimuli. Our attention allocation aid relieson a set of experiments measuring how accuracy in detectingthe target of interest varies with distance from fixation (retinaleccentricity) and as a function of the presentation time of theimage data. These measurements are then used to implementthe AAAD and validate its utility in optimizing search. To ourknowledge the current approach for the AAAD and thoroughexperimental validation is novel to the field.
We also note that a key difference of our work in comparisonto existing literature, is that our attention allocation aid is es-sentially a back-end search optimizer, which tells the observerwhen to stop search; rather than advising the observer whereto look (it does not compute fixation cue’s or saliency-likemaps [23, 8]).
MOTIVATION AND HYPOTHESISHumans have difficulty assessing when adequate visual in-formation has been acquired during challenging search tasksand optimally allocating their fixations over different partsof the image [55]. The purpose of the AAAD is to utilizein real time the temporal dynamics of the eye-position dataand the information acquisition process to recommend to theobservers that either all information has been acquired andsearch can be terminated, or further exploration of the imageis required. The AAAD is expected to reduce both prematureimage search termination and long periods of image search
when no target is present without compromising the searchtask performance, i.e. detection and false alarm rates. Thus,the AAAD should ideally improve observer’s efficiency incompleting more sequential search tasks in a given allottedtime period with a level of detection accuracy that is as goodor better than search without the AAAD.
In what follows, we present a series of experiments in orderto develop, calibrate, and test the effectiveness of the AAADin a visual target search/classification task. Subjects wereasked to search for people within simulated aerial images, andsubsequently classify whether or not the person was holding aweapon. The stimuli and eye-tracking apparatus used in all ofour experiments are described below.
Stimuli Creation: A total of 273 videos were created, eachwith a total duration of 120 seconds, where a ‘birds eye’ point-of-view camera rotated slowly around the center. While thevideo was in a rotating motion, there was no relative motionbetween any parts of the video. From a repeated subset of theoriginal 273 videos, a total of 1440 different short clips werecreated, which were subsequently divided into the 4 groups(stimuli sets) that were used in subsequent experiments. Halfof the clips had person present, while the other half had personabsent. These short and slowly rotating clips were used insteadof still images in our experiment, to simulate imagery froma moving sensor in a surveillance scenario. All clips wereshown to participants in a random order. The stimuli usedin all our experiments present varying levels of zoom (high,medium, low) and clutter (high, medium, low).
Apparatus: An EyeLink 1000 system (SR Research) wasused to collect eye-tracking data at a frequency of 1000 Hz.Each participant sat at a distance of 76 cm from a LCD screenon gamma display, so that each pixel subtended a visual angleof 0.022deg/px. All video clips were rendered at 1024×760px (22.5 deg×16.7 deg) and a frame rate of 24 fps. Eyemovements with velocity over 22 deg/s and acceleration over4000 deg/s2 were qualified as saccades. Every trial beganwith a fixation cross, where each subject had to fixate the crosswith a tolerance of 1 deg.
DEVELOPING THE ATTENTION ALLOCATION AID (AAAD)This section presents details about the development and cali-bration of the AAAD. Here, preliminary experiments were runto estimate perceptual performance curves (PPCs) (describingthe relationship between detection accuracy and each of threemetrics: time, number of eye movements, and detectability)under various levels of image complexity (clutter and zoomlevels). These PPCs allow the identification of asymptoticdetection accuracy, which is the primary criterion used by theAAAD to estimate expected detection accuracy in real time.
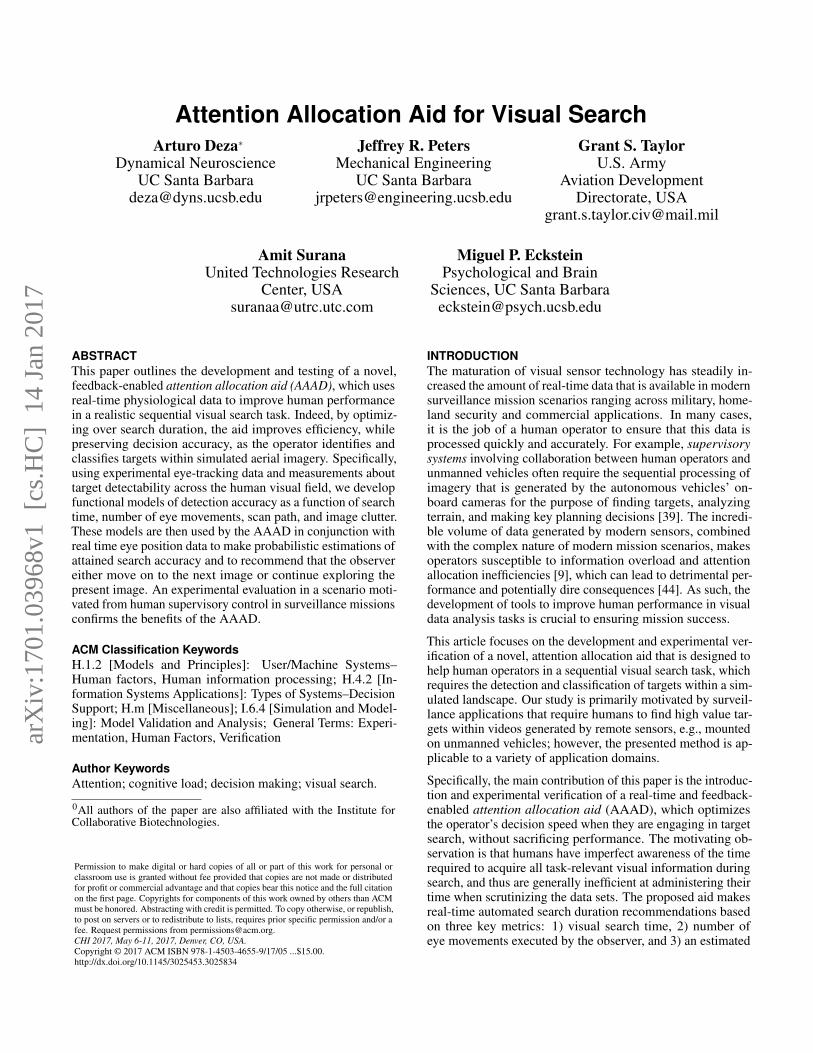
Experiment 1: Psychometric Data CollectionWe performed two preliminary studies to generate the time,eye movement, and detectability PPCs: a forced fixationsearch (no eye movements allowed) and a free search ex-periment. The free search data is directly used to computethe relevant PPCs, while the forced fixation data is used tocalculate detectability surfaces that allow for the computationof the detectability PPC. See Figure 1 for experimental flow.
Forced Fixation SearchA total of 13 subjects participated in a forced fixation searchexperiment where the goal was to search within the visualperiphery to identify if there was a person present or absent(yes/no task; 50% probability of person presence) and, inaddition, to identify if there was a weapon present or absent(yes/no task; 50% probability of weapon presence contingenton person present). Participants had variable amounts of time(100, 200, 400, 900, 1600 ms) to view each clip. Clips werepresented in a random order, with the person at a variabledegree of eccentricity (1deg, 4deg, 9deg, 15deg) from pointof fixation. Subjects were not made aware of the eccentricityvalues used in each trial. They were then prompted with aLikert scale that required them to rate from 1-10 (by clickingon a number) their confidence of person presence. A value of 1indicated strong confidence of person absent, and a value of 10indicated a strong confidence of person present – intermediatevalues represented different levels of uncertainty. Values of 1-5 were classified as person absent, and 6-10 were classified asperson present. A second rating scale (identical to the first) wasthen presented, requiring the subject to rate their confidenceregarding weapon presence. Participants had unlimited timefor making their judgments, although no subject ever tookmore than 10 seconds per judgment. There was no responsefeedback after each trial.
Each subject participated in 12 sessions that consisted of 360clips each. There were 4 stimuli sets (each set consisted ofunique images), and each participants viewed each set 3 timesin random order without being aware that the images were re-peated (4 sets× 3 times = 12 sessions). Every set also had theimages with aerial viewpoints from different vantage points(Example: set 1 had the person at 12 o’clock – as in North,while set 2 had the person at 3 o’clock – as in East). To miti-gate fixation bias, all subjects had a unique fixation point forevery trial associated with each particular eccentricity value.All clips were rendered with variable levels of clutter. Each ses-sion took approximately one hour to complete. The person,i.e.search target, was of size 0.5 deg×0.5 deg, 1 deg×1 deg,1.5 deg×1.5 deg, depending on the zoom level. If a subjectfixated outside of a 1 deg radius around the fixation crossduring the trial, then the trial was aborted.
Free SearchA total of 11 subjects participated in a free search experimentwhere the goal was to detect and classify the person. Althougheye movements were allowed, subjects were not explicitlytold to foveate at the person (although they usually choseto do so). Participants had twice the amount (200 ms, 400ms, 800 ms, 1800 ms, 3200 ms) of time than in the ForcedFixation Search. All observers began each trial with a fixationat center of the screen. They then proceeded to scan the sceneto find a person and determine if the person was holding aweapon. Once the trial time was over, they were promptedwith a “Person Detection” and “Weapon Detection” ratingscale, and had to rate from 1-10 by clicking on a numberreporting how confident they were on detecting/classifying theperson. Similar to the forced fixation experiment, participantshad unlimited time to make their judgments and did not receiveany feedback after each trial. No trials were aborted.
Fixation: 500 - 1000 ms(1 of 4 locations)
+
Stimulus: 100 - 1600 ms(Remain fixated)
+
Person response(unlimited time, no feedback)
1 2 3 4 5 6 7 8 9 10
Person DetectionPresent Absent
You will now rate from 1 - 10 how confident you were on detecting the person.
10 means you are very confident it is PRESENT.1 means you are very confident it is ABSENT.
YesNo
Weapon response(unlimited time, no feedback)
1 2 3 4 5 6 7 8 9 10
Weapon DetectionPresent Absent
You will now rate from 1 - 10 how confident you were on detecting the weapon.
10 means you are very confident it is PRESENT.1 means you are very confident it is ABSENT.
YesNo
Forc
ed F
ixati
on
Experi
men
t
Stimulus: 200 - 3200 msFree Search
Person response(unlimited time, no feedback)
1 2 3 4 5 6 7 8 9 10
Person DetectionPresent Absent
You will now rate from 1 - 10 how confident you were on detecting the person.
10 means you are very confident it is PRESENT.1 means you are very confident it is ABSENT.
YesNo
Weapon response(unlimited time, no feedback)
1 2 3 4 5 6 7 8 9 10
Weapon DetectionPresent Absent
You will now rate from 1 - 10 how confident you were on detecting the weapon.
10 means you are very confident it is PRESENT.1 means you are very confident it is ABSENT.
YesNo
Fixation: 500 - 1000 ms(Center Location)
+
Free S
earc
hExp
eri
ment
Figure 1. Experiment 1: The forced fixation (top) and free search (bottom) experiments to obtain the time, eye movements, and detectability PPCs.
1.00
0.95
0.90
0.85
0.80
0.75
0.70
0.65
0.60
0.55
0.50
PC
pers
on
Time (ms)
10
02
00
40
0
90
0
16
00
1.00
0.95
0.90
0.85
0.80
0.75
0.70
0.65
0.60
0.55
0.50
PC
weap
on
Time (ms)
10
02
00
40
0
90
0
16
00
1deg Eccentricity4deg Eccentricity9deg Eccentricity15deg Eccentricity
(a) Person and weapon detection proportion correct (PC)
d' p
ers
on
Eccentricity (deg)
100ms200ms400ms900ms1600ms
1 4 9 150
0.5
1.0
1.5
2.0
2.5
3.0
3.5
4.0
4.5
5.0
Eccentricity (deg)1 4 9 15
d' w
eap
on
0
0.5
1.0
1.5
2.0
2.5
3.0
3.5
4.0
4.5
5.0
(b) Person and weapon detectability curves (d′)
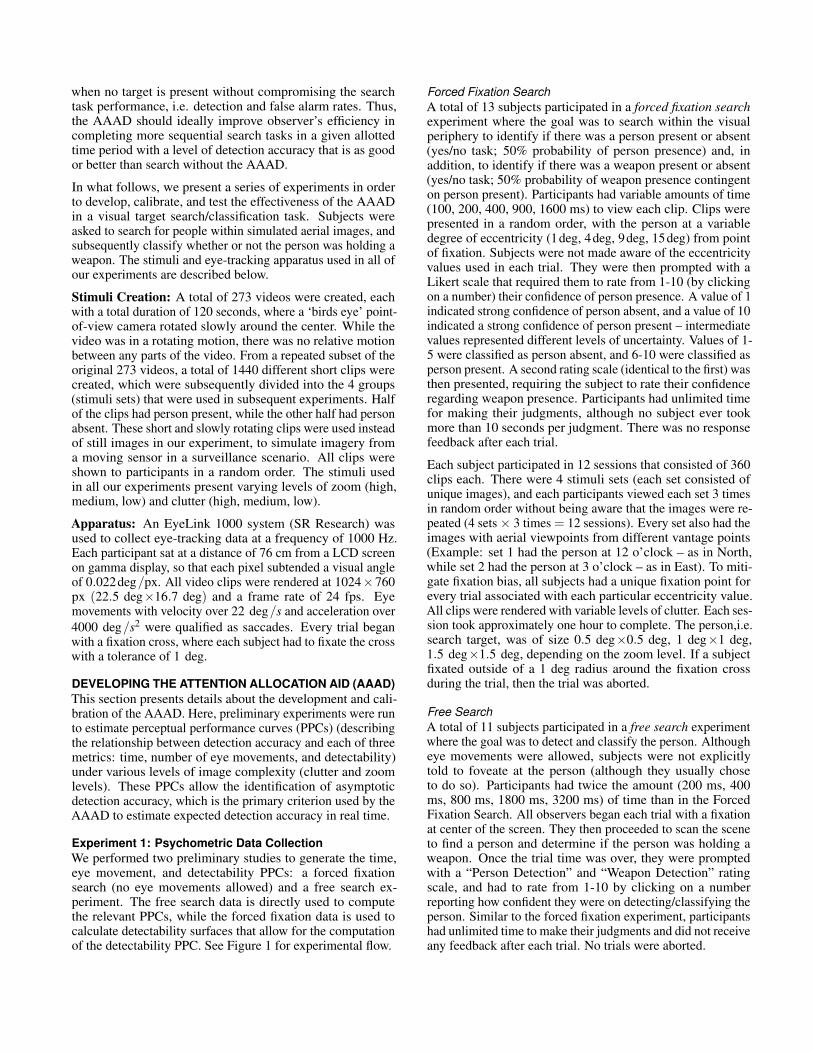
Figure 2. Person and weapon detection performance in proportion cor-rect (PC) and d′ space from the forced fixation search experiment. No-tice that (a) and (b) are dual representations of each other. The bottomcurves in d′ space will be used to generate a detectability surface.
Each subject in the free search experiment participated in 6sessions that consisted of two sets of 360 unique images. Inthese sessions, each subject viewed one of the two sets ofimages, and each set was presented 3 times leading to a totalof 6 sessions. Subjects were not made aware that the sessionswere repeated.
Fitting Perceptual Performance Curves (PPCs)
Motivation of PPCsPPCs were constructed to relate performance to each of threedifferent metrics. The first metric is visual search time, sinceit is well known that time affects visual search accuracy [15] –the main intuition being that the more time a subject spendsscanning an image, the higher the likelihood of detecting thetarget (person or weapon). The second metric is the numberof eye movements a subject performs while engaging in targetsearch. Typically, time will pass on as more eye movementsare produced, but there are some cases where scrutiny in classi-fying or detecting a target is needed by spending long periodsof fixation. As an example, one could imagine an exploitationvs exploration search scenario where a subject spends 1000ms on a single fixation, given the difficulty to classify thetarget (exploitation), as opposed to a scenario where the samesubject makes 3 sparse and exploratory fixations in the same1000 ms time window to find the target (exploration). For this
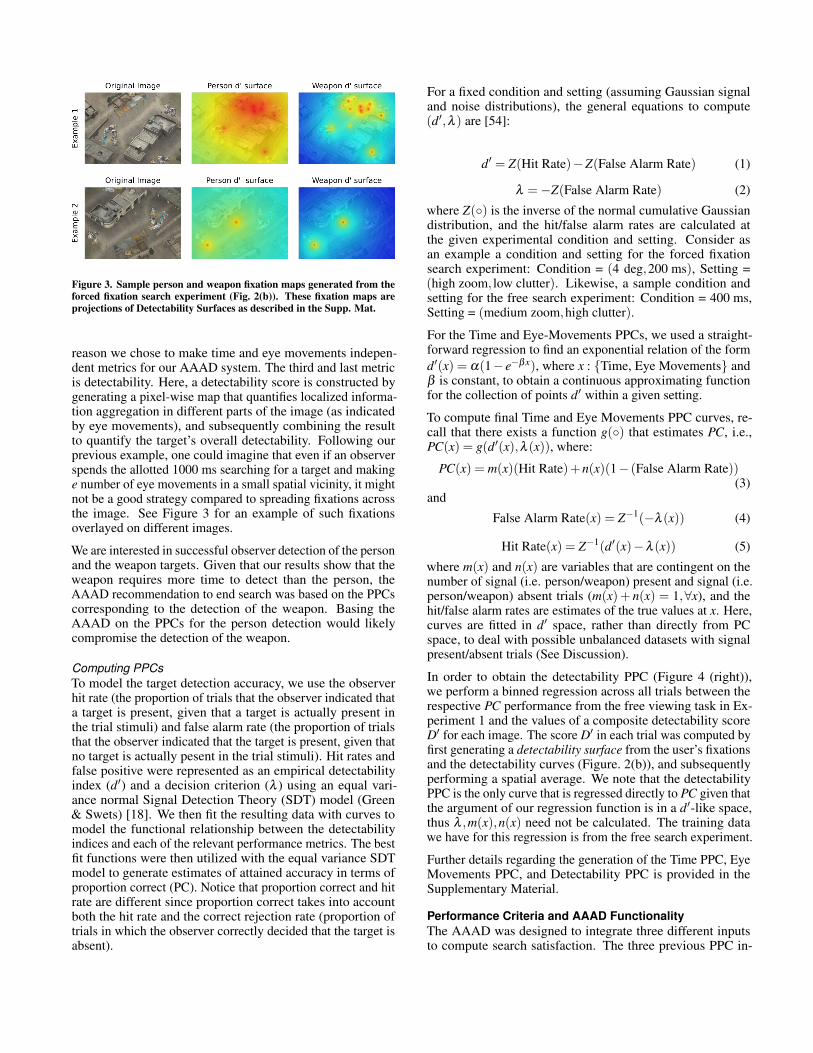
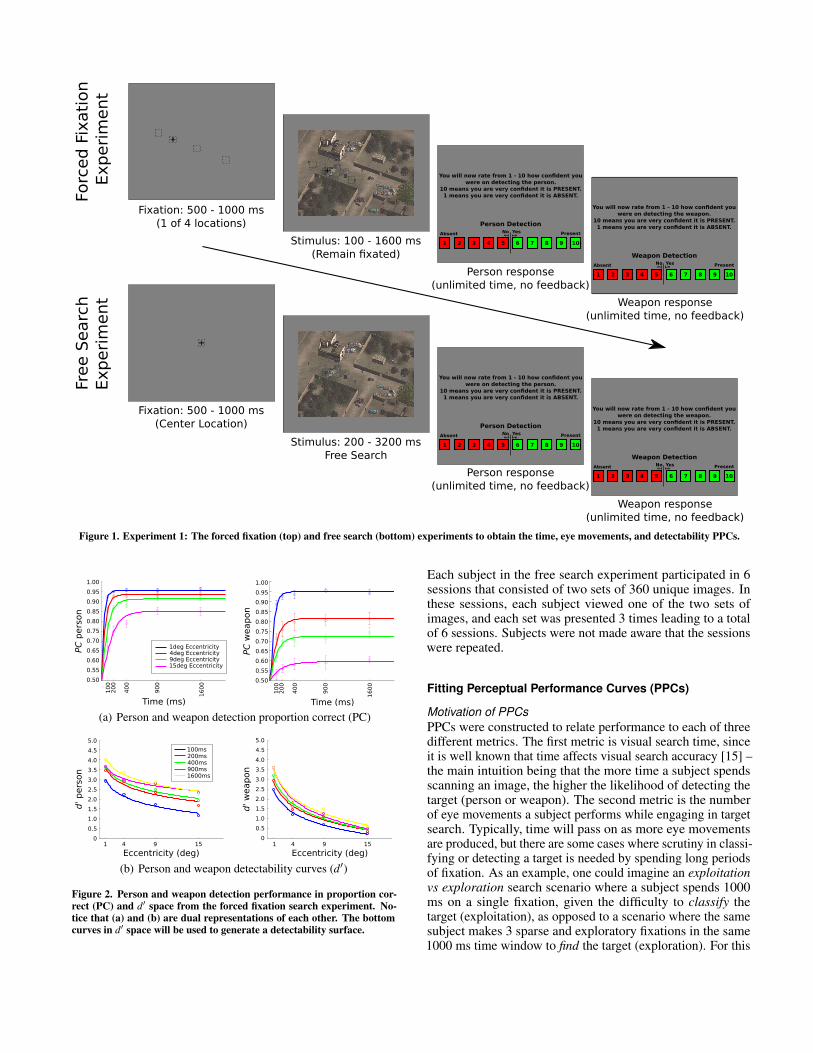
Figure 3. Sample person and weapon fixation maps generated from theforced fixation search experiment (Fig. 2(b)). These fixation maps areprojections of Detectability Surfaces as described in the Supp. Mat.
reason we chose to make time and eye movements indepen-dent metrics for our AAAD system. The third and last metricis detectability. Here, a detectability score is constructed bygenerating a pixel-wise map that quantifies localized informa-tion aggregation in different parts of the image (as indicatedby eye movements), and subsequently combining the resultto quantify the target’s overall detectability. Following ourprevious example, one could imagine that even if an observerspends the allotted 1000 ms searching for a target and makinge number of eye movements in a small spatial vicinity, it mightnot be a good strategy compared to spreading fixations acrossthe image. See Figure 3 for an example of such fixationsoverlayed on different images.
We are interested in successful observer detection of the personand the weapon targets. Given that our results show that theweapon requires more time to detect than the person, theAAAD recommendation to end search was based on the PPCscorresponding to the detection of the weapon. Basing theAAAD on the PPCs for the person detection would likelycompromise the detection of the weapon.
Computing PPCsTo model the target detection accuracy, we use the observerhit rate (the proportion of trials that the observer indicated thata target is present, given that a target is actually present inthe trial stimuli) and false alarm rate (the proportion of trialsthat the observer indicated that the target is present, given thatno target is actually pesent in the trial stimuli). Hit rates andfalse positive were represented as an empirical detectabilityindex (d′) and a decision criterion (λ ) using an equal vari-ance normal Signal Detection Theory (SDT) model (Green& Swets) [18]. We then fit the resulting data with curves tomodel the functional relationship between the detectabilityindices and each of the relevant performance metrics. The bestfit functions were then utilized with the equal variance SDTmodel to generate estimates of attained accuracy in terms ofproportion correct (PC). Notice that proportion correct and hitrate are different since proportion correct takes into accountboth the hit rate and the correct rejection rate (proportion oftrials in which the observer correctly decided that the target isabsent).
For a fixed condition and setting (assuming Gaussian signaland noise distributions), the general equations to compute(d′,λ ) are [54]:
d′ = Z(Hit Rate)−Z(False Alarm Rate) (1)
λ =−Z(False Alarm Rate) (2)
where Z(◦) is the inverse of the normal cumulative Gaussiandistribution, and the hit/false alarm rates are calculated atthe given experimental condition and setting. Consider asan example a condition and setting for the forced fixationsearch experiment: Condition = (4 deg,200 ms), Setting =(high zoom, low clutter). Likewise, a sample condition andsetting for the free search experiment: Condition = 400 ms,Setting = (medium zoom,high clutter).
For the Time and Eye-Movements PPCs, we used a straight-forward regression to find an exponential relation of the formd′(x) = α(1− e−βx), where x : {Time, Eye Movements} andβ is constant, to obtain a continuous approximating functionfor the collection of points d′ within a given setting.
To compute final Time and Eye Movements PPC curves, re-call that there exists a function g(◦) that estimates PC, i.e.,PC(x) = g(d′(x),λ (x)), where:
PC(x) = m(x)(Hit Rate)+n(x)(1− (False Alarm Rate))(3)
and
False Alarm Rate(x) = Z−1(−λ (x)) (4)
Hit Rate(x) = Z−1(d′(x)−λ (x)) (5)
where m(x) and n(x) are variables that are contingent on thenumber of signal (i.e. person/weapon) present and signal (i.e.person/weapon) absent trials (m(x)+ n(x) = 1,∀x), and thehit/false alarm rates are estimates of the true values at x. Here,curves are fitted in d′ space, rather than directly from PCspace, to deal with possible unbalanced datasets with signalpresent/absent trials (See Discussion).
In order to obtain the detectability PPC (Figure 4 (right)),we perform a binned regression across all trials between therespective PC performance from the free viewing task in Ex-periment 1 and the values of a composite detectability scoreD′ for each image. The score D′ in each trial was computed byfirst generating a detectability surface from the user’s fixationsand the detectability curves (Figure. 2(b)), and subsequentlyperforming a spatial average. We note that the detectabilityPPC is the only curve that is regressed directly to PC given thatthe argument of our regression function is in a d′-like space,thus λ ,m(x),n(x) need not be calculated. The training datawe have for this regression is from the free search experiment.
Further details regarding the generation of the Time PPC, EyeMovements PPC, and Detectability PPC is provided in theSupplementary Material.
Performance Criteria and AAAD FunctionalityThe AAAD was designed to integrate three different inputsto compute search satisfaction. The three previous PPC in-
Pro
port
ion C
orr
ect 1.00
0.90
0.80
0.70
0.60
0.50
20040
080
018
0032
00
Time(ms)
Pro
port
ion C
orr
ect 1.00
0.90
0.80
0.70
0.60
0.50
Eye Movements
0 2 4 6 8 10 12 14
Pro
port
ion C
orr
ect 1.00
0.90
0.80
0.70
0.60
0.50
Detectability
0 2 4 6 8 10 1214 16 18 20
PersonWeapon
PersonWeapon
PersonWeapon
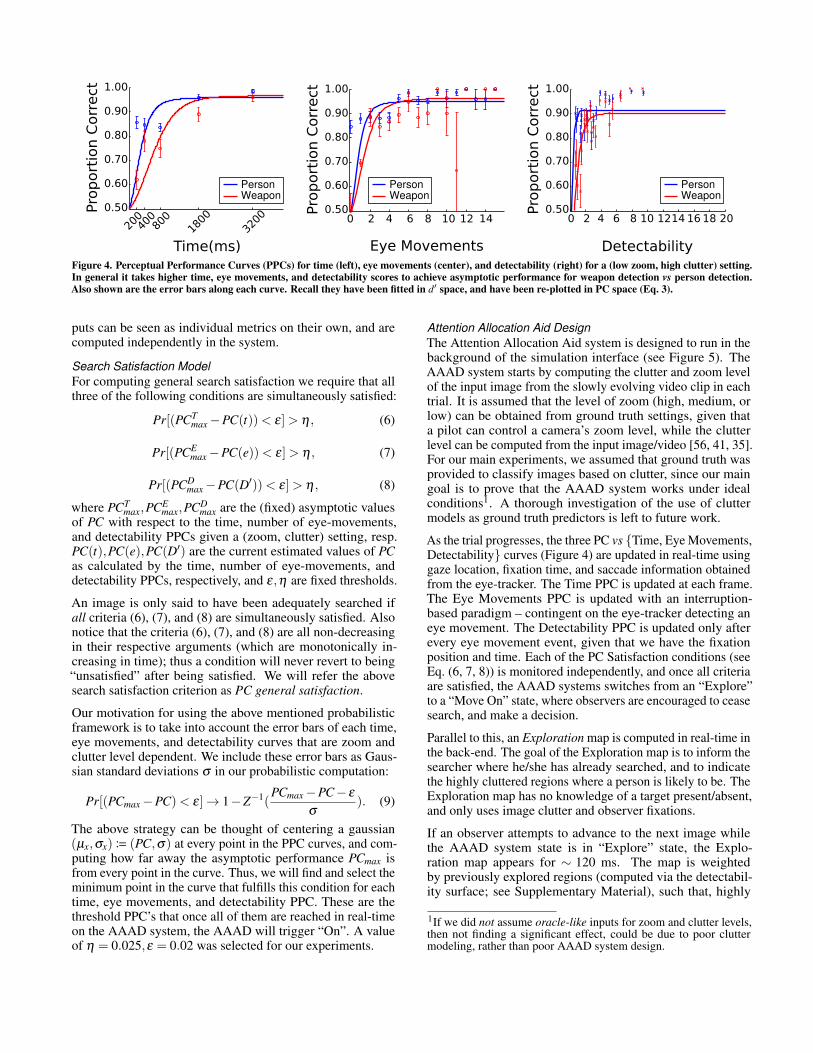
Figure 4. Perceptual Performance Curves (PPCs) for time (left), eye movements (center), and detectability (right) for a (low zoom, high clutter) setting.In general it takes higher time, eye movements, and detectability scores to achieve asymptotic performance for weapon detection vs person detection.Also shown are the error bars along each curve. Recall they have been fitted in d′ space, and have been re-plotted in PC space (Eq. 3).
puts can be seen as individual metrics on their own, and arecomputed independently in the system.
Search Satisfaction ModelFor computing general search satisfaction we require that allthree of the following conditions are simultaneously satisfied:
Pr[(PCTmax−PC(t))< ε]> η , (6)
Pr[(PCEmax−PC(e))< ε]> η , (7)
Pr[(PCDmax−PC(D′))< ε]> η , (8)
where PCTmax,PCE
max,PCDmax are the (fixed) asymptotic values
of PC with respect to the time, number of eye-movements,and detectability PPCs given a (zoom, clutter) setting, resp.PC(t),PC(e),PC(D′) are the current estimated values of PCas calculated by the time, number of eye-movements, anddetectability PPCs, respectively, and ε,η are fixed thresholds.
An image is only said to have been adequately searched ifall criteria (6), (7), and (8) are simultaneously satisfied. Alsonotice that the criteria (6), (7), and (8) are all non-decreasingin their respective arguments (which are monotonically in-creasing in time); thus a condition will never revert to being“unsatisfied” after being satisfied. We will refer the abovesearch satisfaction criterion as PC general satisfaction.
Our motivation for using the above mentioned probabilisticframework is to take into account the error bars of each time,eye movements, and detectability curves that are zoom andclutter level dependent. We include these error bars as Gaus-sian standard deviations σ in our probabilistic computation:
Pr[(PCmax−PC)< ε]→ 1−Z−1(PCmax−PC− ε
σ). (9)
The above strategy can be thought of centering a gaussian(µx,σx)B (PC,σ) at every point in the PPC curves, and com-puting how far away the asymptotic performance PCmax isfrom every point in the curve. Thus, we will find and select theminimum point in the curve that fulfills this condition for eachtime, eye movements, and detectability PPC. These are thethreshold PPC’s that once all of them are reached in real-timeon the AAAD system, the AAAD will trigger “On”. A valueof η = 0.025,ε = 0.02 was selected for our experiments.
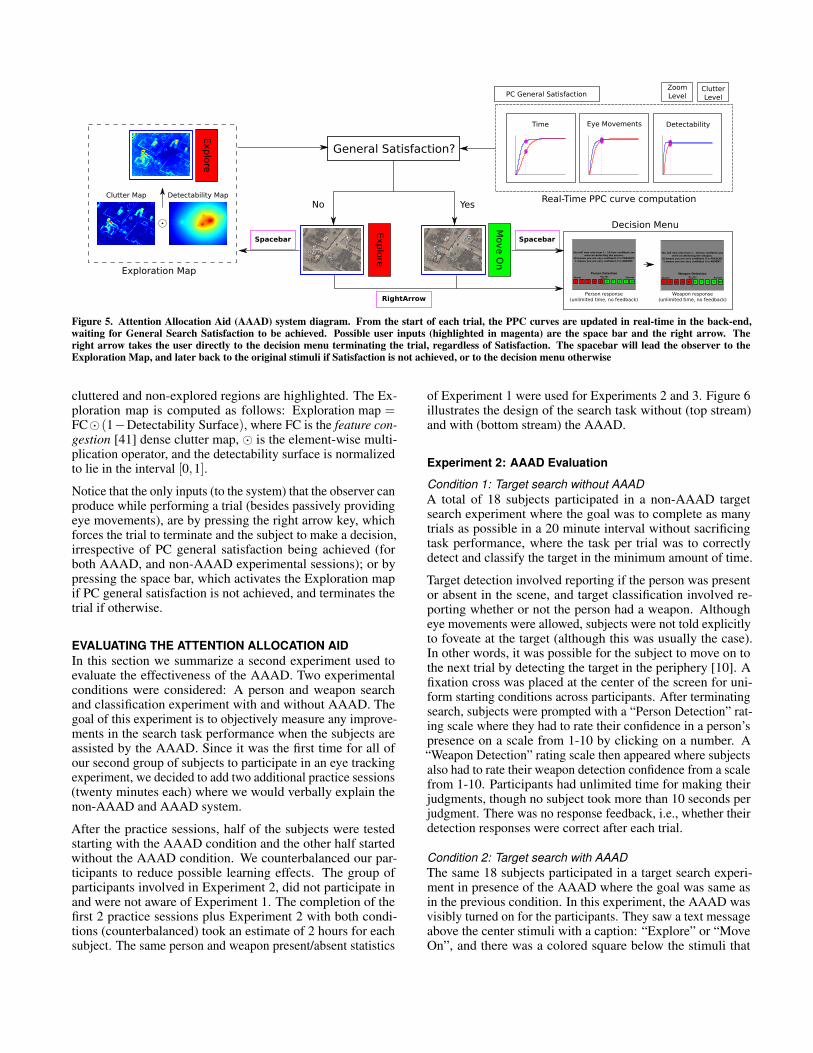
Attention Allocation Aid DesignThe Attention Allocation Aid system is designed to run in thebackground of the simulation interface (see Figure 5). TheAAAD system starts by computing the clutter and zoom levelof the input image from the slowly evolving video clip in eachtrial. It is assumed that the level of zoom (high, medium, orlow) can be obtained from ground truth settings, given thata pilot can control a camera’s zoom level, while the clutterlevel can be computed from the input image/video [56, 41, 35].For our main experiments, we assumed that ground truth wasprovided to classify images based on clutter, since our maingoal is to prove that the AAAD system works under idealconditions1. A thorough investigation of the use of cluttermodels as ground truth predictors is left to future work.
As the trial progresses, the three PC vs {Time, Eye Movements,Detectability} curves (Figure 4) are updated in real-time usinggaze location, fixation time, and saccade information obtainedfrom the eye-tracker. The Time PPC is updated at each frame.The Eye Movements PPC is updated with an interruption-based paradigm – contingent on the eye-tracker detecting aneye movement. The Detectability PPC is updated only afterevery eye movement event, given that we have the fixationposition and time. Each of the PC Satisfaction conditions (seeEq. (6, 7, 8)) is monitored independently, and once all criteriaare satisfied, the AAAD systems switches from an “Explore”to a “Move On” state, where observers are encouraged to ceasesearch, and make a decision.
Parallel to this, an Exploration map is computed in real-time inthe back-end. The goal of the Exploration map is to inform thesearcher where he/she has already searched, and to indicatethe highly cluttered regions where a person is likely to be. TheExploration map has no knowledge of a target present/absent,and only uses image clutter and observer fixations.
If an observer attempts to advance to the next image whilethe AAAD system state is in “Explore” state, the Explo-ration map appears for ∼ 120 ms. The map is weightedby previously explored regions (computed via the detectabil-ity surface; see Supplementary Material), such that, highly
1If we did not assume oracle-like inputs for zoom and clutter levels,then not finding a significant effect, could be due to poor cluttermodeling, rather than poor AAAD system design.
General Satisfaction?
Exp
lore
Clutter Map Detectability Map
Exp
lore
Move O
n
ZoomLevel
ClutterLevelPC General Satisfaction
Time Eye Movements Detectability
Real-Time PPC curve computationNo Yes
Spacebar Spacebar
Person response(unlimited time, no feedback)
1 2 3 4 5 6 7 8 9 10
Person DetectionPresent Absent
You will now rate from 1 - 10 how confident you were on detecting the person.
10 means you are very confident it is PRESENT.1 means you are very confident it is ABSENT.
YesNo
Weapon response(unlimited time, no feedback)
1 2 3 4 5 6 7 8 9 10
Weapon DetectionPresent Absent
You will now rate from 1 - 10 how confident you were on detecting the weapon.
10 means you are very confident it is PRESENT.1 means you are very confident it is ABSENT.
YesNo
RightArrow
Exploration Map
Decision Menu
Figure 5. Attention Allocation Aid (AAAD) system diagram. From the start of each trial, the PPC curves are updated in real-time in the back-end,waiting for General Search Satisfaction to be achieved. Possible user inputs (highlighted in magenta) are the space bar and the right arrow. Theright arrow takes the user directly to the decision menu terminating the trial, regardless of Satisfaction. The spacebar will lead the observer to theExploration Map, and later back to the original stimuli if Satisfaction is not achieved, or to the decision menu otherwise
cluttered and non-explored regions are highlighted. The Ex-ploration map is computed as follows: Exploration map =FC� (1−Detectability Surface), where FC is the feature con-gestion [41] dense clutter map, � is the element-wise multi-plication operator, and the detectability surface is normalizedto lie in the interval [0,1].
Notice that the only inputs (to the system) that the observer canproduce while performing a trial (besides passively providingeye movements), are by pressing the right arrow key, whichforces the trial to terminate and the subject to make a decision,irrespective of PC general satisfaction being achieved (forboth AAAD, and non-AAAD experimental sessions); or bypressing the space bar, which activates the Exploration mapif PC general satisfaction is not achieved, and terminates thetrial if otherwise.
EVALUATING THE ATTENTION ALLOCATION AIDIn this section we summarize a second experiment used toevaluate the effectiveness of the AAAD. Two experimentalconditions were considered: A person and weapon searchand classification experiment with and without AAAD. Thegoal of this experiment is to objectively measure any improve-ments in the search task performance when the subjects areassisted by the AAAD. Since it was the first time for all ofour second group of subjects to participate in an eye trackingexperiment, we decided to add two additional practice sessions(twenty minutes each) where we would verbally explain thenon-AAAD and AAAD system.
After the practice sessions, half of the subjects were testedstarting with the AAAD condition and the other half startedwithout the AAAD condition. We counterbalanced our par-ticipants to reduce possible learning effects. The group ofparticipants involved in Experiment 2, did not participate inand were not aware of Experiment 1. The completion of thefirst 2 practice sessions plus Experiment 2 with both condi-tions (counterbalanced) took an estimate of 2 hours for eachsubject. The same person and weapon present/absent statistics
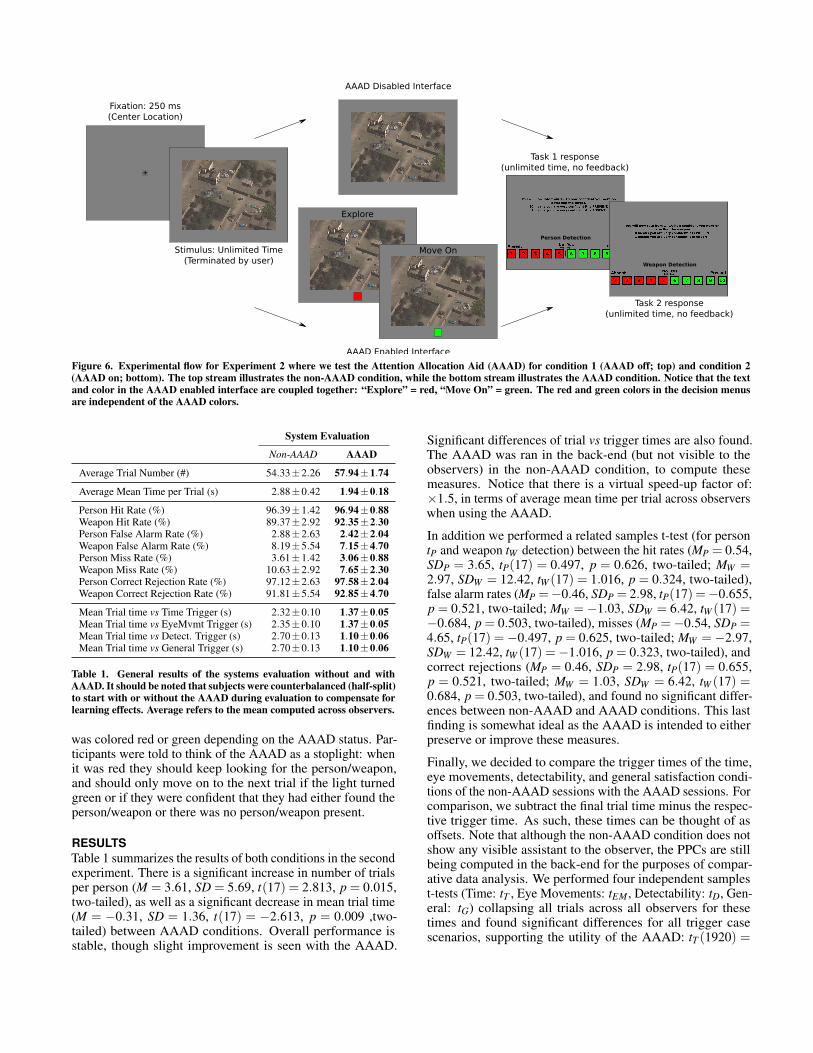
of Experiment 1 were used for Experiments 2 and 3. Figure 6illustrates the design of the search task without (top stream)and with (bottom stream) the AAAD.
Experiment 2: AAAD Evaluation
Condition 1: Target search without AAADA total of 18 subjects participated in a non-AAAD targetsearch experiment where the goal was to complete as manytrials as possible in a 20 minute interval without sacrificingtask performance, where the task per trial was to correctlydetect and classify the target in the minimum amount of time.
Target detection involved reporting if the person was presentor absent in the scene, and target classification involved re-porting whether or not the person had a weapon. Althougheye movements were allowed, subjects were not told explicitlyto foveate at the target (although this was usually the case).In other words, it was possible for the subject to move on tothe next trial by detecting the target in the periphery [10]. Afixation cross was placed at the center of the screen for uni-form starting conditions across participants. After terminatingsearch, subjects were prompted with a “Person Detection” rat-ing scale where they had to rate their confidence in a person’spresence on a scale from 1-10 by clicking on a number. A“Weapon Detection” rating scale then appeared where subjectsalso had to rate their weapon detection confidence from a scalefrom 1-10. Participants had unlimited time for making theirjudgments, though no subject took more than 10 seconds perjudgment. There was no response feedback, i.e., whether theirdetection responses were correct after each trial.
Condition 2: Target search with AAADThe same 18 subjects participated in a target search experi-ment in presence of the AAAD where the goal was same asin the previous condition. In this experiment, the AAAD wasvisibly turned on for the participants. They saw a text messageabove the center stimuli with a caption: “Explore” or “MoveOn”, and there was a colored square below the stimuli that
Fixation: 250 ms(Center Location)
Stimulus: Unlimited Time(Terminated by user)
+
Task 1 response(unlimited time, no feedback)
Task 2 response(unlimited time, no feedback)
AAAD Enabled Interface
Explore
Move On
AAAD Disabled Interface
Person Detection
Weapon Detection
Figure 6. Experimental flow for Experiment 2 where we test the Attention Allocation Aid (AAAD) for condition 1 (AAAD off; top) and condition 2(AAAD on; bottom). The top stream illustrates the non-AAAD condition, while the bottom stream illustrates the AAAD condition. Notice that the textand color in the AAAD enabled interface are coupled together: “Explore” = red, “Move On” = green. The red and green colors in the decision menusare independent of the AAAD colors.
System Evaluation
Non-AAAD AAAD
Average Trial Number (#) 54.33±2.26 57.94±1.74
Average Mean Time per Trial (s) 2.88±0.42 1.94±0.18
Person Hit Rate (%) 96.39±1.42 96.94±0.88Weapon Hit Rate (%) 89.37±2.92 92.35±2.30Person False Alarm Rate (%) 2.88±2.63 2.42±2.04Weapon False Alarm Rate (%) 8.19±5.54 7.15±4.70Person Miss Rate (%) 3.61±1.42 3.06±0.88Weapon Miss Rate (%) 10.63±2.92 7.65±2.30Person Correct Rejection Rate (%) 97.12±2.63 97.58±2.04Weapon Correct Rejection Rate (%) 91.81±5.54 92.85±4.70
Mean Trial time vs Time Trigger (s) 2.32±0.10 1.37±0.05Mean Trial time vs EyeMvmt Trigger (s) 2.35±0.10 1.37±0.05Mean Trial time vs Detect. Trigger (s) 2.70±0.13 1.10±0.06Mean Trial time vs General Trigger (s) 2.70±0.13 1.10±0.06
Table 1. General results of the systems evaluation without and withAAAD. It should be noted that subjects were counterbalanced (half-split)to start with or without the AAAD during evaluation to compensate forlearning effects. Average refers to the mean computed across observers.
was colored red or green depending on the AAAD status. Par-ticipants were told to think of the AAAD as a stoplight: whenit was red they should keep looking for the person/weapon,and should only move on to the next trial if the light turnedgreen or if they were confident that they had either found theperson/weapon or there was no person/weapon present.
RESULTSTable 1 summarizes the results of both conditions in the secondexperiment. There is a significant increase in number of trialsper person (M = 3.61, SD = 5.69, t(17) = 2.813, p = 0.015,two-tailed), as well as a significant decrease in mean trial time(M = −0.31, SD = 1.36, t(17) = −2.613, p = 0.009 ,two-tailed) between AAAD conditions. Overall performance isstable, though slight improvement is seen with the AAAD.
Significant differences of trial vs trigger times are also found.The AAAD was ran in the back-end (but not visible to theobservers) in the non-AAAD condition, to compute thesemeasures. Notice that there is a virtual speed-up factor of:×1.5, in terms of average mean time per trial across observerswhen using the AAAD.
In addition we performed a related samples t-test (for persontP and weapon tW detection) between the hit rates (MP = 0.54,SDP = 3.65, tP(17) = 0.497, p = 0.626, two-tailed; MW =2.97, SDW = 12.42, tW (17) = 1.016, p = 0.324, two-tailed),false alarm rates (MP =−0.46, SDP = 2.98, tP(17) =−0.655,p = 0.521, two-tailed; MW =−1.03, SDW = 6.42, tW (17) =−0.684, p = 0.503, two-tailed), misses (MP =−0.54, SDP =4.65, tP(17) =−0.497, p = 0.625, two-tailed; MW =−2.97,SDW = 12.42, tW (17) =−1.016, p = 0.323, two-tailed), andcorrect rejections (MP = 0.46, SDP = 2.98, tP(17) = 0.655,p = 0.521, two-tailed; MW = 1.03, SDW = 6.42, tW (17) =0.684, p = 0.503, two-tailed), and found no significant differ-ences between non-AAAD and AAAD conditions. This lastfinding is somewhat ideal as the AAAD is intended to eitherpreserve or improve these measures.
Finally, we decided to compare the trigger times of the time,eye movements, detectability, and general satisfaction condi-tions of the non-AAAD sessions with the AAAD sessions. Forcomparison, we subtract the final trial time minus the respec-tive trigger time. As such, these times can be thought of asoffsets. Note that although the non-AAAD condition does notshow any visible assistant to the observer, the PPCs are stillbeing computed in the back-end for the purposes of compar-ative data analysis. We performed four independent samplest-tests (Time: tT , Eye Movements: tEM , Detectability: tD, Gen-eral: tG) collapsing all trials across all observers for thesetimes and found significant differences for all trigger casescenarios, supporting the utility of the AAAD: tT (1920) =

−8.46, p < 0.0001, two-tailed; tEM(1900) = −9.03, p <0.0001, two-tailed; tD(1192) = −11.52, p < 0.0001, two-tailed; tG(1190) =−11.56, p < 0.0001, two-tailed.
DISCUSSIONExtensions of model validity beyond current scenarios:Our results show the potential of a new approach in atten-tion allocation aids that optimizes human search performanceby utilizing real time fixational eye movements with priormeasurements of target visibility across the visual field andas a function of time. However, there are various potentialquestions about the generalization of the model across searchscenarios.
Our development of the AAAD assumed a target that is presentin 50% of the images. A logical question arises as to whetherthe framework can generalize to real scenarios in which thetarget is present less frequently. Our model fits herein areperformed using signal detection theory metrics (Green andSwets, 1967 [18]) that partition performance into an indexof detectability, which is invariant to target prevalence, and adecision criterion, which has an optimal value (maximizingproportion correct) that varies with target prevalence. Themodel curves, which are utilized to make recommendationsto the user, specify proportion correct as a function of time,eye movements, etc. and will vary with target prevalence.However, the model can generalize such curves to varyingestimated target prevalence assuming an optimal decision cri-terion for the given prevalence. Although, we have not testedthe generalization experimentally, the theory accommodatessuch scenarios and generalizations.
For simplicity, our current work used a single target whendeveloping the AAAD. Another natural question to ask iswhether the proposed AAAD can still be used if there is thepossibility of multiple targets within a given image. Indeed,it could be the case that multiple targets could change howthe aid operates within a given application. In some multiple-target scenarios where the detection of even one target is suf-ficient to trigger a decision, our strategy may still apply. Forexample, for some medical applications, such as screeningmammography, finding at least one suspicious target triggersa follow-up diagnostic mammogram. In other applications,localization of each individual targets is important and mightrequire additional development of multiple target model curvesto use in conjunction with a prior distribution of the numberof targets within the images.
Impact of computer vision developments on proposedAAAD framework: The recent advanced in computer vi-sion might seem to diminish the contributions of the proposedscheme if one assumes that all human search will eventu-ally be replaced by machines. This is yet another reasonablequestion to ask, since vision has thrived in recent years, inpart due to significant advances of Deep Learning [27, 26].State of the art object recognition algorithms [47, 40, 21] haveachieved high performance on certain datasets (MNIST [28],CIFAR [25], ImageNet [42]). However, the images in thesedatasets typically present ideal scenes with large objects at thecenter of an image and, currently, the ability of state of theart algorithms to find small or occluded objects in cluttered
scenes (MSCOCO [29]) remains well-below that of humans.Moreover, computers often show glaring errors that humanswould not make in what have been called adversarial exam-ples [17] in the computer vision community (e.g. by riggingindividual pixel values in an image which ‘hacks’ a classifier,a computer can wrongly predict that a white noise-like imageis a school bus with 99% confidence [34]). Furthermore, thereis still a fundamental lack of understanding with regard tothe effects of computer-aided detection aids as a substitutefor human observers in many application domains. For ex-ample, computer automated detection is prevalent in somecountries to flag potential locations for radiologists scrutiniz-ing x-ray mammograms. Yet there is no consensus about itscontributions to improving radiologists’ diagnosis accuracy(e.g. Eadie, Taylor, & Gibson, 2012 [14]). As a result of thesedeficiencies, human observation is still heavily relied upon ina number of applications. As a result, there are many ongoingefforts to reduce errors and optimize human visual search inlife-critical tasks from military surveillance [3], to securitybaggage screening [19], and medical imaging [4].
What is quickly becoming prevalent across many applicationsis the use of a computer aid that assists humans in localizingpotential targets [16]. The proposed AAAD framework doesnot take into account the presence of a computer aid flaggingpotential target locations. In some cases, the presence of acomputer aid is known to guide search with the risk of lead-ing to over-shortened searches and missed targets that are notflagged by the computer aid [30]. The underlying model in theproposed AAAD allows calculation of an estimated observeraccuracy given a pattern of fixations, time and the target visi-bility across the visual field. In principle, the model could beused to predict if an observer is short-cutting their search (dueto the presence of the computer aid) and to alert the observerto further search the image/s. Thus, the developed AAADframework could be potentially integrated with a computeraid, although its main contribution would likely shift fromreducing search times to reducing missed targets.
Potential contribution beyond current application: Al-though the presented work introduces an AAAD within thecontext of a very specific task and images, our work servesas a proof of concept for a decision aid design approach thatcan potentially be applied to a variety of other applicationsincluding baggage screening and medical imaging. The modelwithin the AAAD predicts performance on any given trial asa function of time and pattern of fixations and could be po-tentially used for quantifying the probability that a target wasmissed on a given image given the observers’ search pattern.Such probabilities of error could be stored with the images andused later to identify images that require secondary inspectionby an additional 2nd human observer.
Arguably, the main limitation of the AAAD is that the modelrelies on empirically measured curves describing the de-tectability of the target across the visual field and as a functionof time. We are currently investigating how to predict targetdetectability by analyzing image properties such as clutter inreal time, which would greatly benefit the application of themodel to broader domains.

Low ClutterMedium ClutterHigh ClutterH
igh Z
oom
Med
ium
Zoo
mLo
w Z
oom
Magnified Low Zoom - High Clutter exemplar
(a) Sample Person Present and Weapon Present Stimuli.
Figure 7. Sample Stimuli of Experiments 1 and 2. Left: we show random samples of person present, and weapon present in multiple clutter and zoomconditions. Right: we show a magnified version of the (Low Zoom, High Clutter) setting. The box in green has been overlayed on each subimage toreveal the location of the person and weapon when applicable.
CONCLUSIONOur experiments show evidence that our real-time enabledsupport decision system dubbed AAAD optimizes user effi-ciency in terms of an increase in the number of trials done aswell as a decrease in time spent per each trial, while maintain-ing performance such as target hit rate and false alarm rate.Thus, the AAAD system has successfully integrated asymp-totic performance of search time, eye movements and targetdetectability. We have described how to fully implement suchsystem through an initial psychometric experiments to findperceptual performance curves for target search, as well as twoconsequent experiments that verify the benefits of the AAAD.Future computer-human interaction based systems could ben-efit from implementing AAAD-like systems where having ahuman-in-the-loop is critical to finding a target even beyondsurveillance systems, e.g., medical imaging, astronomical dataimagery and remote sensing.ACKNOWLEDGEMENTSThis work has been sponsored by the U.S. Army ResearchOffice and the Regents of the University of California, throughContract Number W911NF-09-D-0001 for the Institute forCollaborative Biotechnologies, and that the content of theinformation does not necessarily reflect the position or thepolicy of the Government or the Regents of the University ofCalifornia, and no official endorsement should be inferred.
REFERENCES1. Craig K. Abbey, Frank W. Samuelson, Adam Wunderlich,
Lucretiu M. Popescu, Miguel P. Eckstein, and John M.Boone. 2015. Approximate maximum likelihoodestimation of scanning observer templates. In SPIEMedical Imaging. International Society for Optics andPhotonics, 94160O–94160O.
2. Ulf Ahlstrom. 2005. Subjective workload ratings and eyemovement activity measures. (2005).
3. Sea Applications Center Air, Land. 2006. FM 3-04.15,Tactics, Techniques, and Procedures for the Tactical
Employment of Unmanned Aircraft Systems (UAS).(2006).
4. Kate Alexander. 2010. Reducing error in radiographicinterpretation. The Canadian Veterinary Journal 51, 5(2010), 533.
5. Adam T. Biggs and Stephen R. Mitroff. 2015. Improvingthe efficacy of security screening tasks: A review ofvisual search challenges and ways to mitigate theiradverse effects. Applied Cognitive Psychology 29, 1(2015), 142–148.
6. Katherine L. Bouman, Michael D. Johnson, Daniel Zoran,Vincent L Fish, Sheperd S Doeleman, and William TFreeman. 2015. Computational Imaging for VLBI ImageReconstruction. arXiv preprint arXiv:1512.01413 (2015).
7. Susan E Brennan, Xin Chen, Christopher A Dickinson,Mark B Neider, and Gregory J Zelinsky. 2008.Coordinating cognition: The costs and benefits of sharedgaze during collaborative search. Cognition 106, 3(2008), 1465–1477.
8. Zoya Bylinskii, Adrià Recasens, Ali Borji, Aude Oliva,Antonio Torralba, and Frédo Durand. 2016. Whereshould saliency models look next?. In EuropeanConference on Computer Vision. Springer, 809–824.
9. Mary L. Cummings, Sylvain Bruni, and Paul J. Mitchell.2010. Human supervisory control challenges innetwork-centric operations. Reviews of Human Factorsand Ergonomics 6, 1 (2010), 34–78.
10. Arturo Deza and Miguel P. Eckstein. 2016. CanPeripheral Representations Improve Clutter Metrics onComplex Scenes?. In Neural Information ProcessingSystems.
11. Ivan Diaz, Miguel P Eckstein, Anaïs Luyet, Pierre Bize,and François O Bochud. 2012. Measurements of the

detectability of hepatic hypovascular metastases as afunction of retinal eccentricity in CT images. In SPIEMedical Imaging. International Society for Optics andPhotonics, 83180J–83180J.
12. Birsen Donmez, Patricia E Pina, and ML Cummings.2009. Evaluation criteria for human-automationperformance metrics. In Performance Evaluation andBenchmarking of Intelligent Systems. Springer, 21–40.
13. Trafton Drew, Melissa Le-Hoa Vo, Alex Olwal, FrancineJacobson, Steven E Seltzer, and Jeremy M Wolfe. 2013.Scanners and drillers: Characterizing expert visual searchthrough volumetric images. Journal of vision 13, 10(2013), 3–3.
14. Leila H Eadie, Paul Taylor, and Adam P Gibson. 2012. Asystematic review of computer-assisted diagnosis indiagnostic cancer imaging. European journal ofradiology 81, 1 (2012), e70–e76.
15. Miguel P. Eckstein. 2011. Visual search: A retrospective.Journal of Vision 11, 5 (2011), 14–14.
16. Maryellen L Giger. 2014. Medical imaging andcomputers in the diagnosis of breast cancer. In SPIEOptical Engineering+ Applications. International Societyfor Optics and Photonics, 918908–918908.
17. Ian J Goodfellow, Jonathon Shlens, and ChristianSzegedy. 2014. Explaining and harnessing adversarialexamples. arXiv preprint arXiv:1412.6572 (2014).
18. DM Green and JA Swets. 1966. Signal detection theoryand psychophysics. 1966. New York 888 (1966), 889.
19. Kelly S Hale, Katie Del Giudice, Jesse Flint, Darren PWilson, Katherine Muse, and Bonnie Kudrick. 2015.Designing, developing, and validating an adaptive visualsearch training platform. In International Conference onAugmented Cognition. Springer, 735–744.
20. Tim Halverson and Anthony J Hornof. 2011. Acomputational model of âAIJactive visionâAI for visualsearch in human–computer interaction.Human–Computer Interaction 26, 4 (2011), 285–314.
21. Kaiming He, Xiangyu Zhang, Shaoqing Ren, and JianSun. 2015. Deep residual learning for image recognition.arXiv preprint arXiv:1512.03385 (2015).
22. David C. Klein. 2014. Using Adaptive Automation toIncrease Operator Performance and Decrease Stress in aSatellite Operations Environment. Ph.D. Dissertation.Colorado Technical University.
23. Kathryn Koehler, Fei Guo, Sheng Zhang, and Miguel PEckstein. 2014. What do saliency models predict?Journal of vision 14, 3 (2014), 14–14.
24. Ian Krajbich and Antonio Rangel. 2011. Multialternativedrift-diffusion model predicts the relationship betweenvisual fixations and choice in value-based decisions. 108,33 (2011), 13852–13857.
25. Alex Krizhevsky. 2009. Learning multiple layers offeatures from tiny images. (2009).
26. Alex Krizhevsky, Ilya Sutskever, and Geoffrey E Hinton.2012. Imagenet classification with deep convolutionalneural networks. In Advances in neural informationprocessing systems. 1097–1105.
27. Yann LeCun, Yoshua Bengio, and Geoffrey Hinton. 2015.Deep learning. Nature 521, 7553 (2015), 436–444.
28. Yann LeCun, Léon Bottou, Yoshua Bengio, and PatrickHaffner. 1998. Gradient-based learning applied todocument recognition. Proc. IEEE 86, 11 (1998),2278–2324.
29. Tsung-Yi Lin, Michael Maire, Serge Belongie, JamesHays, Pietro Perona, Deva Ramanan, Piotr Dollár, andC Lawrence Zitnick. 2014. Microsoft coco: Commonobjects in context. In European Conference on ComputerVision. Springer, 740–755.
30. David Lyell and Enrico Coiera. 2016. Automation biasand verification complexity: a systematic review. Journalof the American Medical Informatics Association (2016),ocw105.
31. Sandra P. Marshall. 2002. The index of cognitive activity:Measuring cognitive workload. In Human factors andpower plants, 2002. proceedings of the 2002 IEEE 7thconference on. IEEE, 7–5.
32. David E Meyer and David E Kieras. 1997. Acomputational theory of executive cognitive processesand multiple-task performance: Part I. Basic mechanisms.Psychological review 104, 1 (1997), 3.
33. Jiri Najemnik and Wilson S. Geisler. 2005. Optimal eyemovement strategies in visual search. Nature 434, 7031(2005), 387–391.
34. Anh Nguyen, Jason Yosinski, and Jeff Clune. 2015. Deepneural networks are easily fooled: High confidencepredictions for unrecognizable images. In 2015 IEEEConference on Computer Vision and Pattern Recognition(CVPR). IEEE, 427–436.
35. Aude Oliva, Michael L. Mack, Mochan Shrestha, andAngela Peeper. 2004. Identifying the perceptualdimensions of visual complexity of scenes.
36. Misha Pavel, Guoping Wang, and Kehai Li. 2003.Augmented cognition: Allocation of attention. In SystemSciences, 2003. Proceedings of the 36th Annual HawaiiInternational Conference on. IEEE, 6–pp.
37. Eli Peli. 1990. Contrast in complex images. JOSA A 7, 10(1990), 2032–2040.
38. Jeffrey R. Peters and Luca F. Bertuccelli. 2016. RobustTask Scheduling for Multi-Operator Supervisory ControlMissions. AIAA Journal on Aerospace InformationSystems (2016). To Appear.
39. Jeffrey R. Peters, Vaibhav Srivastava, Grant S. Taylor,Amit Surana, Miguel P. Eckstein, and Francesco Bullo.2015. Human supervisory control of robotic teams:integrating cognitive modeling with engineering design.IEEE Control Systems 35, 6 (2015), 57–80.

40. Shaoqing Ren, Kaiming He, Ross Girshick, and Jian Sun.2015. Faster R-CNN: Towards real-time object detectionwith region proposal networks. In Advances in neuralinformation processing systems. 91–99.
41. Ruth Rosenholtz, Yuanzhen Li, and Lisa Nakano. 2007.Measuring visual clutter. Journal of vision 7, 2 (2007),17–17.
42. Olga Russakovsky, Jia Deng, Hao Su, Jonathan Krause,Sanjeev Satheesh, Sean Ma, Zhiheng Huang, AndrejKarpathy, Aditya Khosla, Michael Bernstein, and others.2015. Imagenet large scale visual recognition challenge.International Journal of Computer Vision 115, 3 (2015),211–252.
43. Mark W. Scerbo. 2001. Adaptive Automation. InNeuroergonomics: The Brain At Work, Raja Parasuramanand Matthew Rizzo (Eds.). 239–252.
44. Thom Shanker and Matt Richtel. 2011. In New Military,Data Overload Can Be Deadly. The New York Times.(January 16, 2011).
45. Karthikeyan Shanmuga Vadivel, Thuyen Ngo, MiguelEckstein, and B.S. Manjunath. 2015. Eye trackingassisted extraction of attentionally important objects fromvideos. In Proceedings of the IEEE Conference onComputer Vision and Pattern Recognition. 3241–3250.
46. Thomas B. Sheridan. 1992. Telerobotics, Automation,and Human Supervisory Control. MIT press.
47. Karen Simonyan and Andrew Zisserman. 2014. Verydeep convolutional networks for large-scale imagerecognition. arXiv preprint arXiv:1409.1556 (2014).
48. Yuan-Chi Tseng and Andrew Howes. 2015. Theadaptation of visual search to utility, ecology and design.International Journal of Human-Computer Studies 80(2015), 45–55.
49. US Air Force. 2010. Report on technology horizons, avision for Air Force Science And Technology during
2010–2030. Technical Report. AF/ST-TR-10-01-PR,United States Air Force. Retrieved fromhttp://www.af.mil/shared/media/document/AFD-100727-053.pdf.
50. François Vachon and Sébastien Tremblay. 2014. WhatEye Tracking Can Reveal about DynamicDecision-Making. In Int. Conference on Applied HumanFactors and Ergonomics. Kraków, Poland, 3820–3828.
51. Marlies E. van Bochove, Lise Van der Haegen, WimNotebaert, and Tom Verguts. 2013. Blinking predictsenhanced cognitive control. Cognitive, Affective, &Behavioral Neuroscience 13, 2 (2013), 346–354.
52. Carl Vondrick, Donald Patterson, and Deva Ramanan.2013. Efficiently scaling up crowdsourced videoannotation. International Journal of Computer Vision101, 1 (2013), 184–204.
53. Carl Vondrick and Deva Ramanan. 2011. VideoAnnotation and Tracking with Active Learning. In NIPS.
54. Thomas D. Wickens. 2001. Elementary signal detectiontheory. Oxford university press.
55. Jeremy M. Wolfe. 2012. When do I quit? The searchtermination problem in visual search. In The influence ofattention, learning, and motivation on visual search.Springer, 183–208.
56. Chen-Ping Yu, Wen-Yu Hua, Dimitris Samaras, and GregZelinsky. 2013. Modeling clutter perception usingparametric proto-object partitioning. In Advances inNeural Information Processing Systems. 118–126.
57. Yanxia Zhang, Ken Pfeuffer, Ming Ki Chong, JasonAlexander, Andreas Bulling, and Hans Gellersen. 2016.Look together: using gaze for assisting co-locatedcollaborative search. Personal and Ubiquitous Computing(2016), 1–14.
SUPPLEMENTARY MATERIALAdditional PPC Computation DetailsTime PPC: We use the equal-variance assumption Gaussianmodel to retrieve λ , s.t. λ (x) =−Z( f ), where f is the averagenumber of false alarms across all 5 time conditions (200 ms,400 ms, 800 ms, 1800 ms, 3200 ms). We use this modelbecause there is an equal number of person present/absent, andweapon present/absent trials (contingent on person present).This implies: m(x) = n(x) = 0.5.
Eye Movements PPC: Eye movements were quantized in allour experiments as the number of saccades. We estimatedthe observer bias λ , for every x = 0,1,2,3, ...,15 saccades,and later computed a weighted average (inversely proportionalto the error bar size) obtaining a single estimate λ0 to serveover all x conditions. We approximated m(x) = m0,n(x) = n0,with the constants being proportional to the average numberof trials present and absent across eye movement conditions.
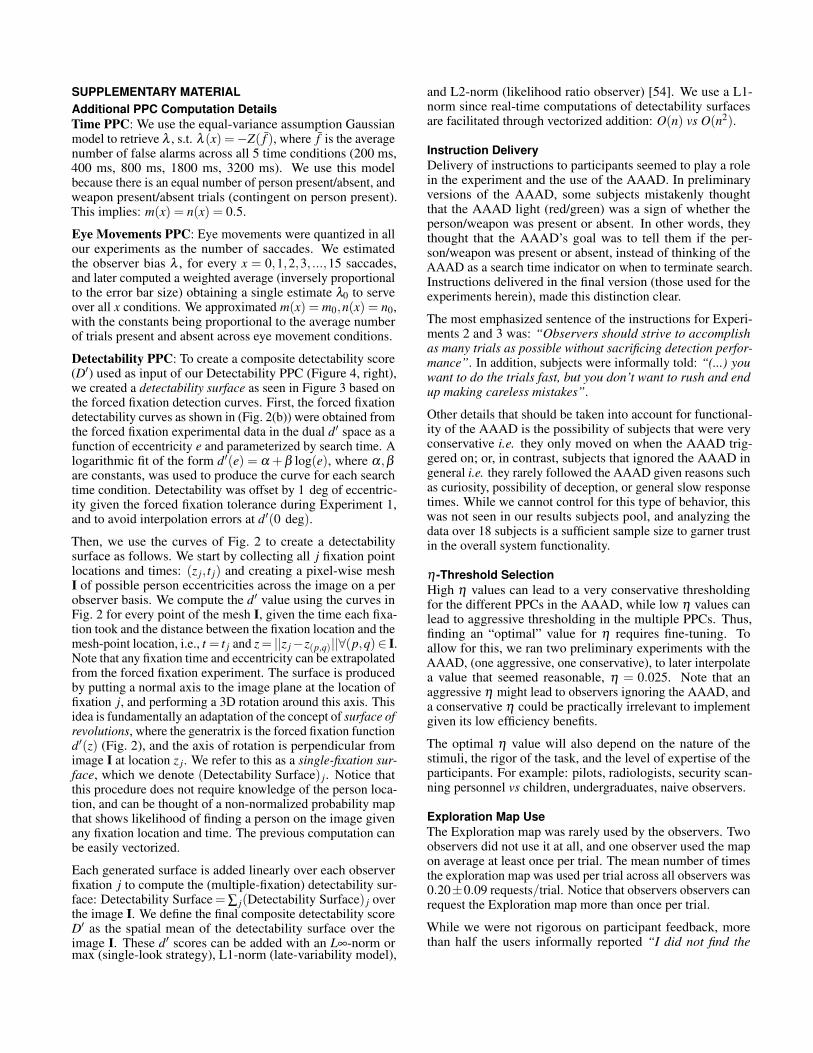
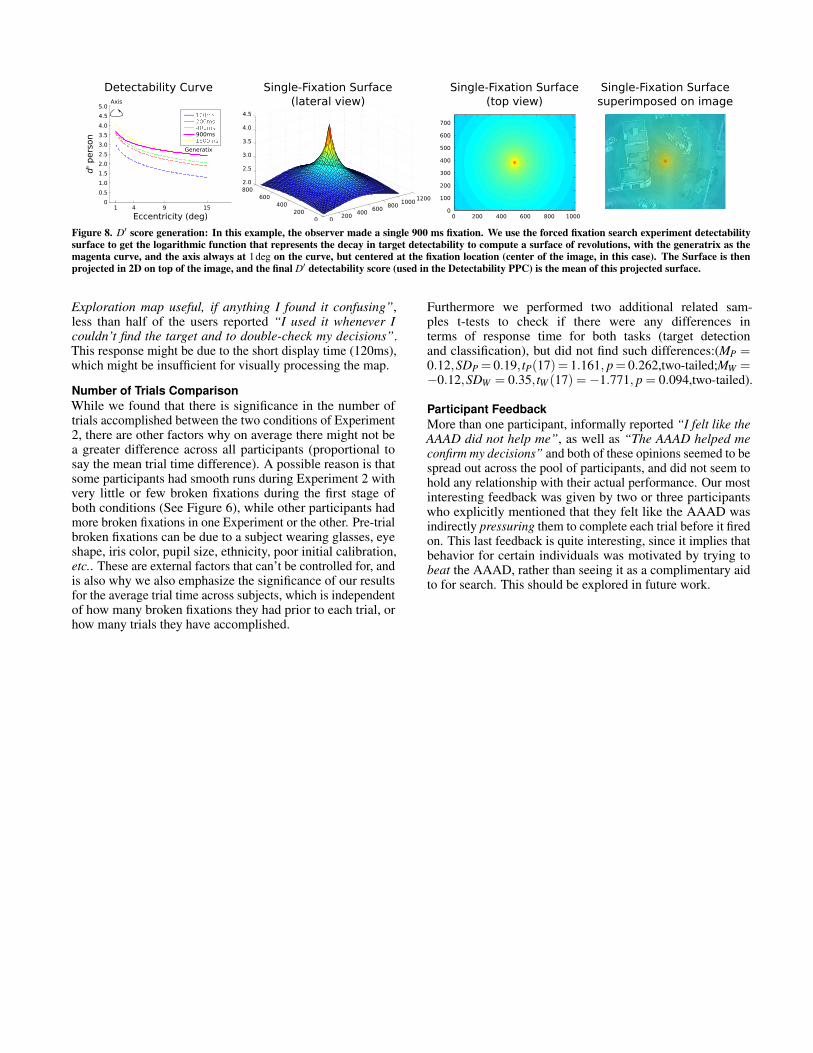
Detectability PPC: To create a composite detectability score(D′) used as input of our Detectability PPC (Figure 4, right),we created a detectability surface as seen in Figure 3 based onthe forced fixation detection curves. First, the forced fixationdetectability curves as shown in (Fig. 2(b)) were obtained fromthe forced fixation experimental data in the dual d′ space as afunction of eccentricity e and parameterized by search time. Alogarithmic fit of the form d′(e) = α +β log(e), where α,βare constants, was used to produce the curve for each searchtime condition. Detectability was offset by 1 deg of eccentric-ity given the forced fixation tolerance during Experiment 1,and to avoid interpolation errors at d′(0 deg).
Then, we use the curves of Fig. 2 to create a detectabilitysurface as follows. We start by collecting all j fixation pointlocations and times: (z j, t j) and creating a pixel-wise meshI of possible person eccentricities across the image on a perobserver basis. We compute the d′ value using the curves inFig. 2 for every point of the mesh I, given the time each fixa-tion took and the distance between the fixation location and themesh-point location, i.e., t = t j and z= ||z j−z(p,q)||∀(p,q)∈ I.Note that any fixation time and eccentricity can be extrapolatedfrom the forced fixation experiment. The surface is producedby putting a normal axis to the image plane at the location offixation j, and performing a 3D rotation around this axis. Thisidea is fundamentally an adaptation of the concept of surface ofrevolutions, where the generatrix is the forced fixation functiond′(z) (Fig. 2), and the axis of rotation is perpendicular fromimage I at location z j. We refer to this as a single-fixation sur-face, which we denote (Detectability Surface) j. Notice thatthis procedure does not require knowledge of the person loca-tion, and can be thought of a non-normalized probability mapthat shows likelihood of finding a person on the image givenany fixation location and time. The previous computation canbe easily vectorized.
Each generated surface is added linearly over each observerfixation j to compute the (multiple-fixation) detectability sur-face: Detectability Surface=∑ j(Detectability Surface) j overthe image I. We define the final composite detectability scoreD′ as the spatial mean of the detectability surface over theimage I. These d′ scores can be added with an L∞-norm ormax (single-look strategy), L1-norm (late-variability model),
and L2-norm (likelihood ratio observer) [54]. We use a L1-norm since real-time computations of detectability surfacesare facilitated through vectorized addition: O(n) vs O(n2).
Instruction DeliveryDelivery of instructions to participants seemed to play a rolein the experiment and the use of the AAAD. In preliminaryversions of the AAAD, some subjects mistakenly thoughtthat the AAAD light (red/green) was a sign of whether theperson/weapon was present or absent. In other words, theythought that the AAAD’s goal was to tell them if the per-son/weapon was present or absent, instead of thinking of theAAAD as a search time indicator on when to terminate search.Instructions delivered in the final version (those used for theexperiments herein), made this distinction clear.
The most emphasized sentence of the instructions for Experi-ments 2 and 3 was: “Observers should strive to accomplishas many trials as possible without sacrificing detection perfor-mance”. In addition, subjects were informally told: “(...) youwant to do the trials fast, but you don’t want to rush and endup making careless mistakes”.
Other details that should be taken into account for functional-ity of the AAAD is the possibility of subjects that were veryconservative i.e. they only moved on when the AAAD trig-gered on; or, in contrast, subjects that ignored the AAAD ingeneral i.e. they rarely followed the AAAD given reasons suchas curiosity, possibility of deception, or general slow responsetimes. While we cannot control for this type of behavior, thiswas not seen in our results subjects pool, and analyzing thedata over 18 subjects is a sufficient sample size to garner trustin the overall system functionality.
η-Threshold SelectionHigh η values can lead to a very conservative thresholdingfor the different PPCs in the AAAD, while low η values canlead to aggressive thresholding in the multiple PPCs. Thus,finding an “optimal” value for η requires fine-tuning. Toallow for this, we ran two preliminary experiments with theAAAD, (one aggressive, one conservative), to later interpolatea value that seemed reasonable, η = 0.025. Note that anaggressive η might lead to observers ignoring the AAAD, anda conservative η could be practically irrelevant to implementgiven its low efficiency benefits.
The optimal η value will also depend on the nature of thestimuli, the rigor of the task, and the level of expertise of theparticipants. For example: pilots, radiologists, security scan-ning personnel vs children, undergraduates, naive observers.
Exploration Map UseThe Exploration map was rarely used by the observers. Twoobservers did not use it at all, and one observer used the mapon average at least once per trial. The mean number of timesthe exploration map was used per trial across all observers was0.20±0.09 requests/trial. Notice that observers observers canrequest the Exploration map more than once per trial.
While we were not rigorous on participant feedback, morethan half the users informally reported “I did not find the
800
4.54.5
4.0
3.5
2.5
2.0800
600400
2000 0
200400
600800
10001200
3.0
100
d' p
ers
on
Eccentricity (deg)
100ms200ms400ms900ms1600ms
1 4 9 150
0.5
1.0
1.5
2.0
2.5
3.0
3.5
4.0
4.5
5.0
Generatix
Axis
200
300
400
500
600
200 400 600 800 100000
700
Detectability Curve Single-Fixation Surface(lateral view)
Single-Fixation Surface(top view)
Single-Fixation Surfacesuperimposed on image
Figure 8. D′ score generation: In this example, the observer made a single 900 ms fixation. We use the forced fixation search experiment detectabilitysurface to get the logarithmic function that represents the decay in target detectability to compute a surface of revolutions, with the generatrix as themagenta curve, and the axis always at 1deg on the curve, but centered at the fixation location (center of the image, in this case). The Surface is thenprojected in 2D on top of the image, and the final D′ detectability score (used in the Detectability PPC) is the mean of this projected surface.
Exploration map useful, if anything I found it confusing”,less than half of the users reported “I used it whenever Icouldn’t find the target and to double-check my decisions”.This response might be due to the short display time (120ms),which might be insufficient for visually processing the map.
Number of Trials ComparisonWhile we found that there is significance in the number oftrials accomplished between the two conditions of Experiment2, there are other factors why on average there might not bea greater difference across all participants (proportional tosay the mean trial time difference). A possible reason is thatsome participants had smooth runs during Experiment 2 withvery little or few broken fixations during the first stage ofboth conditions (See Figure 6), while other participants hadmore broken fixations in one Experiment or the other. Pre-trialbroken fixations can be due to a subject wearing glasses, eyeshape, iris color, pupil size, ethnicity, poor initial calibration,etc.. These are external factors that can’t be controlled for, andis also why we also emphasize the significance of our resultsfor the average trial time across subjects, which is independentof how many broken fixations they had prior to each trial, orhow many trials they have accomplished.
Furthermore we performed two additional related sam-ples t-tests to check if there were any differences interms of response time for both tasks (target detectionand classification), but did not find such differences:(MP =0.12,SDP = 0.19, tP(17)= 1.161, p= 0.262,two-tailed;MW =−0.12,SDW = 0.35, tW (17) =−1.771, p = 0.094,two-tailed).
Participant FeedbackMore than one participant, informally reported “I felt like theAAAD did not help me”, as well as “The AAAD helped meconfirm my decisions” and both of these opinions seemed to bespread out across the pool of participants, and did not seem tohold any relationship with their actual performance. Our mostinteresting feedback was given by two or three participantswho explicitly mentioned that they felt like the AAAD wasindirectly pressuring them to complete each trial before it firedon. This last feedback is quite interesting, since it implies thatbehavior for certain individuals was motivated by trying tobeat the AAAD, rather than seeing it as a complimentary aidto for search. This should be explored in future work.