
Attacking and defensive styles of play in soccer: …researchonline.ljmu.ac.uk/3791/5/Attacking and...
22
Attacking and defensive styles of play in soccer: Analysis of Spanish and English elite teams Javier Fernandez-Navarro 1,2 , Luis Fradua 2 , Asier Zubillaga 3 , Paul R. Ford 1 , Allistair P. McRobert 1 1 Research Institute for Sport and Exercise Sciences, Liverpool John Moores University, Liverpool, UK, 2 Department of Physical Education and Sport, Faculty of Sport Sciences, University of Granada, Granada, Spain, 3 Department of Physical Education and Sport, UPV/EHU University of the Basque Country, Vitoria-Gasteiz, Spain Word count: 4761 Authors contact details: Author 1 (Corresponding author): Javier Fernandez-Navarro Address: Faculty of Sport Sciences. Carretera de Alfacar s/n 18011, Granada, Spain. Telephone: +34 958244370. Email: [email protected] Author 2: Luis Fradua Address: Faculty of Sport Sciences. Carretera de Alfacar s/n 18011, Granada, Spain. Telephone: +34 958244371. Email: [email protected]
Transcript of Attacking and defensive styles of play in soccer: …researchonline.ljmu.ac.uk/3791/5/Attacking and...

Attacking and defensive styles of play in soccer: Analysis of
Spanish and English elite teams
Javier Fernandez-Navarro1,2, Luis Fradua2, Asier Zubillaga3, Paul R. Ford1,
Allistair P. McRobert1
1Research Institute for Sport and Exercise Sciences, Liverpool John Moores University,
Liverpool, UK, 2Department of Physical Education and Sport, Faculty of Sport
Sciences, University of Granada, Granada, Spain, 3Department of Physical Education
and Sport, UPV/EHU University of the Basque Country, Vitoria-Gasteiz, Spain
Word count: 4761
Authors contact details:
Author 1 (Corresponding author): Javier Fernandez-Navarro
Address: Faculty of Sport Sciences. Carretera de Alfacar s/n 18011, Granada, Spain.
Telephone: +34 958244370. Email: [email protected]
Author 2: Luis Fradua
Address: Faculty of Sport Sciences. Carretera de Alfacar s/n 18011, Granada, Spain.
Telephone: +34 958244371. Email: [email protected]

Author 3: Asier Zubillaga
Address: Faculty of Sport Sciences, Portal de Lasarte 71, 01007, Vitoria-Gasteiz,
Spain. Telephone: +34 945013566. Email: [email protected]
Author 4: Paul R. Ford
Address: Research Institute for Sport and Exercise Sciences, Liverpool John Moores
University, Tom Reilly Building, Liverpool, L3 2ET, UK. Telephone: +44 0151 904 6246.
Email: [email protected]
Author 5: Allistair P. McRobert
Address: Research Institute for Sport and Exercise Sciences, Liverpool John Moores
University, Tom Reilly Building, Liverpool, L3 2ET, UK. Telephone: +44 0151 904 6258.
Email: [email protected]
Abstract
The aim of this study was to define and categorise different styles of play in elite soccer
and associated performance indicators by using factor analysis. Furthermore, observed
teams were categorised using all factor scores. Data were collected from 97 matches
from the Spanish La Liga and the English Premier League from the seasons 2006-
2007 and 2010-2011 using the Amisco® system. A total of 19 performance indicators,
14 describing aspects of attacking play and five describing aspects of defensive play
were included in the factor analysis. Six factors, representing 12 different styles of play
(eight attacking and four defensive), had eigenvalues greater than 1 and explained

87.54% of the total variance. Direct and possession styles of play, defined by factor 1,
were the most apparent styles. Factor analysis used the performance indicators to
cluster each team’s style of play. Findings showed that a team’s style of play was
defined by specific performance indicators and consequently, teams can be classified
to create a playing style profile. For practical implications, playing styles profiling can
be used to compare different teams and prepare for opponents in competition.
Moreover, teams could use specific training drills directed to improve their styles of
play.
Keywords: association football, match analysis, tactics, factor analysis, Premier
League, La Liga

Introduction
Strategies and tactics are important factors that influence the outcome of the
game and the final result in soccer (Yiannakos & Armatas, 2006). A strategy is defined
as the overall plan that is devised and adopted to achieve an aim or specific objective,
and is normally accomplished via the application of specific tactics (Carling, Williams, &
Reilly, 2005). For example, soccer teams adopt an overall combination of attacking and
defensive styles of play that would increase their probability of success. A style of play
could be considered as the general behaviour of the whole team to achieve the
attacking and defensive objectives in the game. Performance indicators are a selection
of action variables that try to define the aspects of a performance (Hughes & Bartlett,
2002) and can be associated with attacking and defensive tactics in soccer. Previous
studies highlighted the influence of styles of play when measuring performance
indicators related to physical (Buchheit & Laursen, 2013; Reilly, 2005), technical and
tactical aspects in soccer (Bradley et al., 2011; Duarte, Araujo, Correia, & Davids,
2012; James, Mellalieu, & Hollely, 2002; Lago-Peñas, Lago-Ballesteros, & Rey, 2011;
Pollard & Reep, 1997; Pollard, Reep, & Hartley, 1988; Tenga, Holme, Ronglan, & Bahr,
2010b; Tenga & Sigmundstad, 2011). For instance, styles of play affect physical
performance indicators such as distance covered by the players or high intensity
running activities, due to players’ different movements as a result of specific behaviours
typical of a style of play. Moreover, styles of play can also affect technical and tactical
performance indicators such as individual playing area (Fradua et al., 2013),
percentage of ball possession (Lago-Peñas & Dellal, 2010; Lago & Martin, 2007),
distance of passes and passing distribution (Tenga & Larsen, 2003). These studies
showed that styles of play should be accounted for during data interpretation.
Previous studies have identified attacking and defending styles of play. High
pressure and low pressure have for example been defined as defending styles
(Bangsbo & Peitersen, 2000; Wright, Atkins, Polman, Jones, & Sargeson, 2011). These

two defending styles of play are characterised by the specific location on the pitch
where teams apply defensive pressure on the opponent in possession, considering
pressure as reducing the distance to player in possession and other near opponents in
order to regain the ball as quick as possible. For example, if defending players apply
pressure in areas closer to the opponent’s goal, they will be utilising the ‘high pressure’
style. In contrast, the ‘low pressure’ style of play involves the defensive players only
applying pressure on the opponents in the defensive half of the pitch.
Attacking styles of play have previously been defined as direct, possession,
counterattacking, total soccer, and crossing (Bangsbo & Peitersen, 2000; Pollard et al.,
1988). ‘Direct’ and ‘possession’ styles of play are the most commonly described
attacking styles (Bate, 1988; Garganta, Maia, & Basto, 1997; Hughes & Franks, 2005;
Olsen & Larsen, 1997; Redwood-Brown, 2008; Ruiz-Ruiz, Fradua, Fernandez-Garcia,
& Zubillaga, 2013; Tenga, Holme, Ronglan, & Bahr, 2010a; Tenga, Holme, et al.,
2010b; Tenga & Larsen, 2003; Tenga, Ronglan, & Bahr, 2010; Travassos, Davids,
Araujo, & Esteves, 2013). In contrast to ‘possession’ style, ‘direct’ play is characterised
by longer passes, low number of passes, short passing sequences, and a low number
of touches per ball involvement. Game control was also a performance indicator
associated with these styles of play, and was employed by a recent study that utilised
indexes calculated from different performance indicators to evaluate the use of the
possession and direct styles of play in elite teams (Kempe, Vogelbein, Memmert, &
Nopp, 2014). These indexes included several passing and ball possession parameters
to measure tactical behaviour of teams. In addition, attacking styles such as
‘counterattacking play’ (Bangsbo & Peitersen, 2000), ‘total soccer’ (Bangsbo &
Peitersen, 2000; Carling et al., 2005), and ‘crossing’ (Pollard et al., 1988) have been
defined but with no or little information on the key performance indicators for each of
these styles.

A previous study that provided information on the performance indicators for
different styles of play was a quantitative comparison between the styles of play used
by English league teams during season 1984-85, and national teams that played in the
1982 World Cup (Pollard et al., 1988). Six performance indicators were measured and
factor analysis was used to define the different styles of play for the teams observed.
The study identified three factors; factor 1 distinguished between direct and possession
(elaborate) styles. Factor 2 explained the use of crosses. Finally, factor 3 made a
distinction between a style that entails regaining the possession closer to the
opponent’s or own goal. Each team’s dependence on a style was categorised on the
basis of their factor score for the style of play.
Performance indicators associated with styles of play have been described in
parts (Bate, 1988; Hughes & Franks, 2005; Lago-Peñas & Dellal, 2010; Pollard et al.,
1988; Tenga, Holme, et al., 2010b; Tenga & Larsen, 2003), however there is no
consensus and/or missing information for some styles. For example, Tenga and
Larsen (2003) describe direct play as attacks involving direct set plays, counter-
attacks, attacks with at least one long pass, attacks with a maximum of two passes,
and attacks moving fast over and through midfield. In contrast, Hughes and Franks
(2005) consider low passing sequences as the key performance indicator for direct
play. Previous research suggests that performance indicators for the different styles of
play are unclear and that additional indicators should be examined to analyse styles of
play. Hence, direction of passes and ball possession in different areas could be, for
instance, important performance indicators when trying to identify styles of play.
Moreover, additional defensive performance indicators should be considered such as
areas where defending teams apply pressure, or time required to recover ball
possession (Vogelbein, Nopp, & Hokelmann, 2014). In addition, soccer involves an
interaction between attack and defence (Moura et al., 2013), and this interaction makes
it difficult to quantify team performance indicators and tactics without considering the

opposition’s ones. Consequently, attacking and defensive behaviours of teams should
be measured to account for this interaction. The aim of the study was to define different
styles of play in elite soccer and identify the associated performance indicators. A
secondary aim was to classify the teams observed based on the styles so that a
playing style profile can be created.
Methods
Match sample
A total sample of 97 matches from the Spanish La Liga and the English Premier
League involving 37 different teams were collected for the study. Matches were
monitored using a multiple camera match analysis system (Amisco Pro®, version 1.0.2,
Nice, France). From the total sample, 72 matches corresponded to season 2006-2007,
40 matches from the Spanish La Liga and 32 matches from the English Premier
League. These two group of matches involved 18 and 15 different teams respectively.
Furthermore, 25 matches corresponded to season 2010-2011 and were from the
Spanish La Liga. This group of matches involved 16 different teams.
Teams that participated in both seasons were considered as different teams
due to possible changes in the squad and technical staff of each team. These changes
can lead to a different style of play. Moreover, teams with only one match available
were excluded from the analysis as it was considered that one match is not enough of
a sample to define a team’s style of play. Accordingly, 37 different teams were included
in the analysis. From the overall sample, there were at least four matches available for
15 teams, three matches available for eight teams, and two matches available for 14
teams. The present study follows the research ethics guidelines set out by Liverpool
John Moores University.

Procedure
A total of 19 performance indicators (14 attacking and five defensive) were
included in the study. Previous research relating to tactics was considered when
selecting the following performance indicators for the study; possession of the ball
(Jones, James, & Mellalieu, 2004; Lago & Martin, 2007), crosses (Lago-Peñas, Lago-
Ballesteros, Dellal, & Gomez, 2010; Pollard et al., 1988), and shots (Hughes & Franks,
2005; Lago-Ballesteros & Lago-Peñas, 2010; Pollard & Reep, 1997). The remaining
performance indicators, provided by the Amisco® system, were considered to be
relevant to determine styles of play due to the importance of the spatial occurrence of
the events for measuring tactical aspects (Castellano, Alvarez, Figueira, Coutinho, &
Sampaio, 2013). The attacking and defensive performance indicators, description and
measurement methods are presented in table I. For the following performance
indicators presented in table I: 2, 3, 4, 11, 12, 15, 16, and 17; the pitch was divided into
three spaces parallel to the goal lines to collect the data (see figure 1). In addition, for
the following performance indicators presented in table I: 5, 6, 18, and 19; the pitch
was divided into three spaces parallel to the touchlines to collect the data (see figure
1). Passing direction was also considered to measure the following performance
indicators in table I: 7, 8, 9, and 10. Trajectories of passes were categorised according
to the diagram in figure 2.
****Table I near here****
****Figure 1 near here****
****Figure 2 near here****

For the analysis, a team mean score for each performance indicator was
calculated and recorded using Microsoft Excel (Microsoft Corporation, Redmond, WA,
USA).
Statistical analysis
Exploratory factor analysis using principal component analysis (PCA) was
conducted on 19 performance indicators with orthogonal rotation (varimax). Factor
analysis is a statistical method for identifying clusters of variables. This technique
allows the reduction of data sets into factors through the grouping of variables
measured (Field, 2013). For each factor, the performance indicators with the highest
factor loading (i.e., the correlation between the performance indicator and the factor)
were identified. This technique groups performance indicators into fewer factors that
represent different styles of play. In addition, a team’s specific style of play can be
categorised according to their score for each factor. Statistical analysis was carried out
using IBM SPSS Statistics v.20.0 for Windows (SPSS, Chicago, IL USA).
Orthogonal (varimax) and oblique rotations were performed in factor analysis and the
component correlation matrix of the oblique rotation showed a negligible correlation
between factors, therefore orthogonal rotation was used (Pedhazur & Schmelkin,
1991). The Kaiser-Meyer-Olkin measure (Kaiser, 1974) and communalities values after
extraction (MacCallum, Widaman, Zhang, & Hong, 1999) were employed to verify the
sampling adequacy for the analysis. Adequacy of correlations between items was done
according to Bartlett’s test of sphericity. Kaiser’s criterion of 1 (Kaiser, 1960) and
interpretation of the scree plot were considered for factor retention. Performance
indicators with factor loadings greater than |0.7| showed a strong positive or negative
correlation and indicated a substantial value for factor interpretation (Comrey & Lee,
2013).

Results
The Kaiser-Meyer-Olkin measure verified the sampling adequacy for the
analysis, KMO = 0.53, and the communalities after extraction were greater than 0.7 in
18 of 19 performance indicators, deeming sample size to be adequate for factor
analysis. Bartlett’s test of sphericity (𝜒² = 2254.53, df = 171, P < 0.001) indicated that
correlations between items were sufficiently large for PCA. Six components had
eigenvalues over Kaiser’s criterion of 1 and in combination explained 87.54% of the
total variance (Table II). The percentage of variance explained by each factor
decreased from factor 1 to 6. The scree plot was slightly ambiguous and showed
inflexion points that would justify retaining four or six factors. Therefore, six factors
were extracted following the Kaiser’s criterion as the number of performance indicators
was less than 30 and communalities after extraction were greater than 0.7 (Stevens,
2009). The rotated component matrix for the factor loadings identified the performance
indicators associated with each factor (Table III).
****Table II near here****
****Table III near here****
Descriptions of factors were interpreted based on the group of associated
performance indicators. Factor 1 (possession directness) defines how direct a team’s
possession is. A team with a positive score in this factor tends to use a direct (D) style.
In contrast, a team with a negative score adopts a more elaborate, possession (P)
style. Factor 2 (width of ball regain) defines teams that pressure and regain the ball in
wide areas (PW) or in the central areas (PC) of the pitch. A team with a positive score
regain more balls close to the touchline, whereas a team with a negative score regain
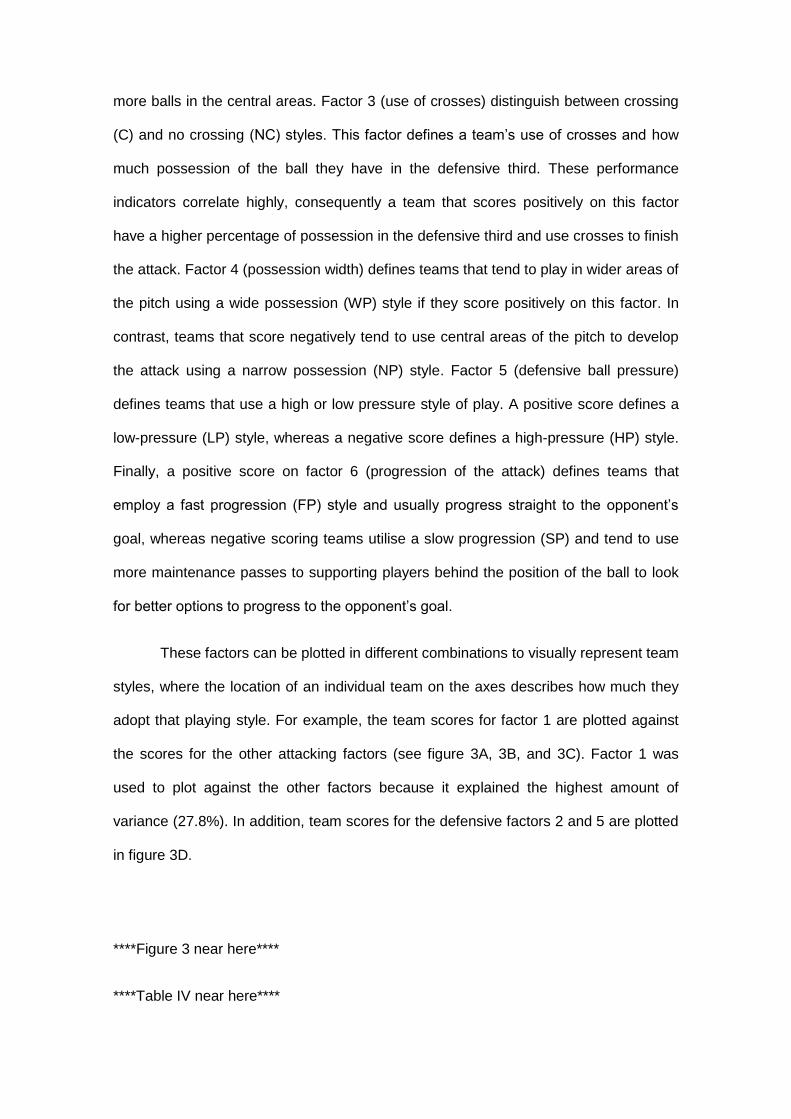
more balls in the central areas. Factor 3 (use of crosses) distinguish between crossing
(C) and no crossing (NC) styles. This factor defines a team’s use of crosses and how
much possession of the ball they have in the defensive third. These performance
indicators correlate highly, consequently a team that scores positively on this factor
have a higher percentage of possession in the defensive third and use crosses to finish
the attack. Factor 4 (possession width) defines teams that tend to play in wider areas of
the pitch using a wide possession (WP) style if they score positively on this factor. In
contrast, teams that score negatively tend to use central areas of the pitch to develop
the attack using a narrow possession (NP) style. Factor 5 (defensive ball pressure)
defines teams that use a high or low pressure style of play. A positive score defines a
low-pressure (LP) style, whereas a negative score defines a high-pressure (HP) style.
Finally, a positive score on factor 6 (progression of the attack) defines teams that
employ a fast progression (FP) style and usually progress straight to the opponent’s
goal, whereas negative scoring teams utilise a slow progression (SP) and tend to use
more maintenance passes to supporting players behind the position of the ball to look
for better options to progress to the opponent’s goal.
These factors can be plotted in different combinations to visually represent team
styles, where the location of an individual team on the axes describes how much they
adopt that playing style. For example, the team scores for factor 1 are plotted against
the scores for the other attacking factors (see figure 3A, 3B, and 3C). Factor 1 was
used to plot against the other factors because it explained the highest amount of
variance (27.8%). In addition, team scores for the defensive factors 2 and 5 are plotted
in figure 3D.
****Figure 3 near here****
****Table IV near here****

Discussion
Defining different styles of play that soccer teams can adopt during a match
may be important when analysing performance data. Therefore, the aim of the study
was to identify and define the styles of play in elite soccer. Exploratory factor analysis
extracted six factors that defined 12 different playing styles, split into eight attacking
and four defending styles. Each factor defined two different styles of play based on a
positive or negative factor score on the continuum. Furthermore, a team’s score on
each factor indicates their reliance on that specific style of play (see table IV).
Possession directness (factor 1) explained the highest percentage of variance
and differentiates the previously reported direct and possession styles (Bate, 1988;
Garganta et al., 1997; Hughes & Franks, 2005; Olsen & Larsen, 1997; Redwood-
Brown, 2008; Ruiz-Ruiz et al., 2013; Tenga, Holme, et al., 2010a, 2010b; Tenga &
Larsen, 2003; Tenga, Ronglan, et al., 2010; Travassos et al., 2013). ‘Sideways
passes’, and ‘possession of the ball’ were the performance indicators that correlated
negatively with this factor and suggested a possession style. The indicators that
correlated positively and suggested a direct style were; ‘possession of the ball’ and
‘sideways passes’. The performance indicator ‘passes from defensive to attacking third’
was also included for direct style of play interpretation as it showed a high positive
score loading for factor 1. During season 2010-2011, Barcelona showed a considerable
high score for possession style of play (see table IV). This team demonstrates a good
representation of the possession style and it may be due to their playing philosophy
and the highly skilled players in the team for passing abilities. It is suggested that the
tactical principle of playing sideways causes imbalances in the opposition’s defense,
therefore increasing the success of the attacking sequence and the opportunity to
score a goal (Tenga, Holme, et al., 2010a, 2010b; Tenga, Ronglan, et al., 2010; Tenga
& Sigmundstad, 2011). Previously, a direct style was described as being more
advantageous than the possession style (Bate, 1988; Garganta et al., 1997). However,
Hughes and Franks (2005) stated that, for successful teams, possession style
produced more goals per possession than the direct style. In comparison, Tenga,
Holme, et al. (2010a) reported no difference in goals scored between these styles.
Possibly, the long and short passing abilities and skill of players influence the
effectiveness of a direct or possession style. Moreover, opponent’s defensive style of
play can also have an impact on the team’s direct or possession style.
Factor 2 differentiates two defensive styles; a style of play that implies regaining
the ball close to the touchline, and a style where ball is regained in the central areas of
the pitch. These styles have not been reported previously. Styles of play differentiated
by factor 2 are associated with the performance indicators ‘regains in the central areas
of the pitch’ and ‘regains in the wide areas of the pitch’. Negative values for the former
and positive values for the latter determine where the team regains the ball. Wright et
al. (2011) reported that central ball regains are more likely to result in a scoring attempt
compared to wide ball regains. In addition, recent studies showed successful teams
normally regain the ball in central areas of the defensive and middle third (Barreira,
Garganta, Guimaraes, Machado, & Anguera, 2014; Barreira, Garganta, Machado, &
Anguera, 2014). This could possibly be because central areas provide different options
of passing to the sides or forwards, whereas regaining the ball in the sides limit passing
options due to the touchline. Furthermore, the utilisation of these styles could depend
on team formation (number of players per area), player defensive abilities and/or the
opponent’s attacking abilities. Attacking styles of play of the opposition can also
influence the defensive style of play employed by the team. Although the defensive
team can lead the opposition players to specific areas of the pitch for conducting an
attack (e.g. accumulating players in central areas and leaving free spaces on the sides

for doing pressure to opposition in wide areas), a prevalence of an attacking style of
play used by the opposition can affect the defensive style employed by the team.
Factor 3 defines two styles based on percentage of possession in the defensive
third (i.e., time that the team control the ball near their own goal) combined with the use
of crosses. Correlation between these indicators could suggest that teams using
crossing might have more ball possession in the defensive third so that wide players
have time to move into wide areas and execute a cross. Crossing is a tactic to create
the chance of scoring (Ensum, Pollard, & Taylor, 2005; Hughes & Churchill, 2005;
Konstadinidou & Tsigilis, 2005; Lago-Peñas et al., 2010; Lago-Peñas et al., 2011;
Oberstone, 2009; Pollard, Ensum, & Taylor, 2004), however increases in scoring
efficiency are not reported consistently (Flynn, 2001). Crossing can also be a risk due
to the possibility of losing the ball and produce a counter-attacking opportunity for
opponents. Use of crosses might be more effective for teams that adopt this style and
have wide midfielders that employ long passing, strikers that create space in the
penalty area, win aerial challenges and shot at goal with one touch (Carling et al.,
2005; Ruiz-Ruiz et al., 2013). Moreover, this style could be useful when the opposition
lacks aerial abilities, as the probability of taking advantage of their mistakes would be
increased.
Possession width (factor 4), suggest the differentiation between wide and
narrow possession styles. These styles are associated with the percentage of ball
possession teams have in central or wide areas, however it does not necessarily mean
that they play wide or narrow in their attacking sequences. ‘Possession of the ball in
the attacking third of the pitch’, ‘possession of the ball in the central areas of the pitch’,
and ‘possession of the ball in the wide areas of the pitch’ are the performance
indicators associated with this factor. The former performance indicator correlated
highly with the latter, which could be due to easier maintenance of ball possession in
attacking third wide areas compared to central areas. However, central areas could be

larger in surface, so caution should be applied when interpreting this playing style.
Moreover, due to the goal position, percentage of possession in central areas could be
influenced. Betis was the team, during season 2006-2007, that relied the most on a
wide possession style (see table IV). The position of skilled players on the sides of the
pitch and the use of playing formations that accumulated players in these areas could
explain the high score of this team for this style. Attacking third central areas are
dangerous for defensive teams and result in more attempts at goal, therefore defensive
actions will be more intense (Pollard & Reep, 1997; Ruiz-Ruiz et al., 2013; Scoulding,
James, & Taylor, 2004; Tenga, Ronglan, et al., 2010; Wright et al., 2011; Yiannakos &
Armatas, 2006). For example, British soccer teams (2001-2002) had more ball entries
into central (60.3%) compared to wide (39.7%) areas (James et al., 2002). Moreover,
Hughes, Robertson, and Nicholson (1988) suggested that successful teams have more
possession in the central compared to wide areas. The use of a wide or narrow
possession style will probably depend on the abilities of the wide and central players of
the team. For example, teams with skilled wide midfielders and/or fullbacks would
utilise the wide possession style of play due to the abilities of these players for
maintaining ball possession. Opponent’s defensive style of play could also influence
the use of narrow or wide possession style.
Factor 5 identifies teams that use high or low pressure defensive styles of play.
‘Number of regains in the attacking third’ was the performance indicator that correlated
negatively with this factor. Moreover, ‘passes from defensive to middle third’ also had a
high positive score loading for this factor, and this could suggest that teams that move
the ball from defensive to middle third to build the attack, tend to regain the ball in
these areas. In season 2006-2007, Osasuna was the team that employed the high-
pressure style in the most emphasised way (see table IV). A high pressure style could
cause a risky situation for the defensive team due to the space produced behind the
defensive players or the space between players in case that the team failed to keep

compactness. However, it can also influence scoring opportunities because the ball
can be regained closer to the opponent’s goal, while increasing the likelihood of facing
an imbalanced defense (Bell-Walker, McRobert, Ford, & Williams, 2006; Garganta et
al., 1997; Grant, Williams, Reilly, & Borrie, 1998; Pollard & Reep, 1997; Russell, 2006;
Scoulding et al., 2004; Wright et al., 2011). Successful teams from European Leagues
and World Cups tend to have higher attacking third regains (Bell-Walker et al., 2006;
Garganta et al., 1997). Moreover, Tenga, Holme, et al. (2010a) reported that the
probability of producing a score-box possession decreases when a balanced defense
is present (i.e. defenders provide defensive backup and cover). The utilisation of high
or low pressure styles could be notably influenced by the opposing team’s style of play
(Cotta, Mora, Merelo-Molina, & Merelo, 2013). For instance, using a high pressure style
of play against a team that utilises a possession style of play could be very effective for
regaining the ball due to time and space denied to attacking players, while increasing
the chances of scoring opportunities.
Factor 6 describes team progression towards the opponent’s goal, however it
accounts for the lowest percentage of variance (6.67%). The use of backward passes
moves the ball further from the opponent’s goal; therefore an increase in backwards
passes is more likely to increase the time taken to reach the opponent’s goal. For this
reason, a high quantity of backwards passes could suggest a slow progression of
possession. In contrast, fewer backward passes would suggest a fast progression of
possession. These styles are not mentioned in previous studies, and the only
performance indicator associated with factor 6 (i.e. ‘backwards passes’) makes it
complex to explain. The progression of the possession factor could be associated with
the directness, however it is different. When using backwards passes the team tries to
secure or support ball possession by passing the ball to a less advanced team-mate to
create space and new opportunities to attack. For example, a team that uses a direct
style might also use backwards passes to create a new opportunity for scoring. This

team would have a slow progression but also score high on possession directness (e.g.
Bilbao in both seasons 2006-2007 and 2010-2011).
A secondary aim was to classify the team’s styles so that playing style profiles
could be created for each team. Positive or negative scores for the six factors would
determine how much a team relies on one specific style or combination of these styles.
For example, in season 2006-2007, Everton used the direct, no crossing, narrow and
fast progression styles of play in attack. In defense they used a low pressure style
while applying pressure in central areas to regain the ball. Everton’s high score on
factor 1 defines a direct style in attack due to the team’s high percentage of forward
passes, low percentage of sideways passes and possession of the ball. In contrast,
during the 2006-2007 season, Barcelona applied pressure in central areas and used
high pressure defensive styles, combined with possession, no crossing, narrow and
fast progression attacking styles. Barcelona scored high on the percentage of regains
in the attacking third, which is one of the performance indicators that define the high
pressure style. Moreover, during the 2010-2011 season, Barcelona adopted alternative
styles and intensified the use of previously used styles. They used the crossing, wide
and slow progression attacking styles, and increased their factor scores for the
possession attacking style, pressure in central areas and high pressure defensive
styles, compared to the 2006-2007 season. These individual examples highlight how a
team uses specific attacking and defensive styles of play in a season. Moreover, in the
case of Barcelona it highlights changes that occur in the styles of play across two
separate seasons, which could be due to the tactical management of the coach and the
players.
In conclusion, 12 (eight attacking and four defensive) different playing styles
and associated performance indicators utilised in elite soccer were identified in this
dataset. Furthermore, the selected factors together explained 87.54% of the variance.
The degree to which a team relies on a specific style can be determined based on the

team’s score for each factor. Findings from this study have several practical
implications for performance analysis. First, teams can objectively determine the styles
they use and their reliance on specific styles to create playing style profiles and
normative profiles for associated performance indicators. These profiles can be used to
benchmark team’s performance during competition or alternatively adjust their styles
based on reference values they wish to adopt. Furthermore, teams could use specific
training drills to develop styles that they will employ in competition while using the
associated performances indicators to monitor change. Second, playing styles profiling
can be used on opponents to identify their dominant styles and benchmark their
performance indicators. This data could be used to prepare tactics that would perturb
the opponent’s dominant style(s) and identify strengths and weaknesses of the
opposition. Third, recruitment analysts could introduce playing styles profiling into their
analysis framework when identifying individual players that they wish to integrate into
the team. Finally, previous research provided contradictory evidence when measuring
performance indicators associated with success in isolation of factors (i.e., style of play,
home advantage, type of competition, quality of opponents, and quality of team) that
might affect the value. Therefore, differences in performance indicators might be a
factor of their playing styles. Researchers should be aware of these different styles and
were possible integrate this into their analysis. Limitations of this study should be
noted. Contextual variables (e.g. playing home/away, opposition level) were not
measured and these variables could affect styles of play used by teams. These
variables could also explain the missed percentage of the variance. Moreover,
interaction process should be considered for a more accurate analysis of styles of play
as opponent’s tactics can also influence the style of play employed by a team. This
study provides an introduction to analysing playing styles. More variables and matches
should be considered to supply conclusive definitions for playing styles and
generalisability of the data. Further research should attempt to establish the efficiency

and effectiveness of playing styles when measuring performance and outcomes (i.e.,
scoring probability).
References
Bangsbo, J., & Peitersen, B. (2000). Soccer Systems and Strategies. Champaign, IL: Human Kinetics.
Barreira, D., Garganta, J., Guimaraes, P., Machado, J., & Anguera, M. T. (2014). Ball recovery patterns as a performance indicator in elite soccer. Proceedings of the Institution of Mechanical Engineers Part P-Journal of Sports Engineering and Technology, 228(1), 61-72.
Barreira, D., Garganta, J., Machado, J., & Anguera, M. T. (2014). Effects of ball recovery on top-level soccer attacking patterns of play. [Repercussoes da recuperacao da posse de bola nos padroes de ataque de futebol de elite]. Revista Brasileira de Cineantropometria & Desempenho Humano, 16(1), 36-46.
Bate, R. (1988). Football chance: Tactics and strategy. In T. Reilly, A. Lees, K. Davids & W. J. Murphy (Eds.), Science and Football (pp. 293-301). London: E & FN Spon.
Bell-Walker, J., McRobert, A., Ford, P., & Williams, A. M. (2006). A Quantitative Analysis of Successful Teams at the 2006 World Cup Finals. Insight: The F.A. Coaches Association Journal, Autumn/Winter, 36-43.
Bradley, P. S., Carling, C., Archer, D., Roberts, J., Dodds, A., Di Mascio, M., . . . Krustrup, P. (2011). The effect of playing formation on high-intensity running and technical profiles in English FA Premier League soccer matches. Journal of Sports Sciences, 29(8), 821-830.
Buchheit, M., & Laursen, P. B. (2013). High-Intensity Interval Training, Solutions to the Programming Puzzle Part I: Cardiopulmonary Emphasis. Sports Medicine, 43(5), 313-338.
Carling, C., Williams, A. M., & Reilly, T. (2005). Handbook of Soccer Match Analysis. A Systematic Approach to Improving Performance. London: Routledge.
Castellano, J., Alvarez, D., Figueira, B., Coutinho, D., & Sampaio, J. (2013). Identifying the effects from the quality of opposition in a Football team positioning strategy. International Journal of Performance Analysis in Sport, 13(3), 822-832.
Comrey, A. L., & Lee, H. B. (2013). A First Course in Factor Analysis (2nd ed.). Hillsdale, NJ: Erlbaum.
Cotta, C., Mora, A. M., Merelo-Molina, C., & Merelo, J. J. (2013). A network analysis of the 2010 FIFA world cup champion team play. Journal of Systems Science & Complexity, 26(1), 21-42.
Duarte, R., Araujo, D., Correia, V., & Davids, K. (2012). Sports Teams as Superorganisms Implications of Sociobiological Models of Behaviour for Research and Practice in Team Sports Performance Analysis. Sports Medicine, 42(8), 633-642.
Ensum, J., Pollard, R., & Taylor, S. (2005). Applications of Logistic Regression to Shots at Goal in Association Football. In T. Reilly, J. Cabri & D. Araujo (Eds.), Science and Football V (pp. 211-218). London: Routledge.
Field, A. (2013). Discovering Statistics Using IBM SPSS Statistics (4th ed.). London: SAGE Publications.
Flynn, T. (2001). The Effects of Crosses Across Three Levels of Professional Football. Insight: The F.A. Coaches Association Journal, 4(2), 13-16.

Fradua, L., Zubillaga, A., Caro, O., Fernandez-Garcia, A. I., Ruiz-Ruiz, C., & Tenga, A. (2013). Designing small-sided games for training tactical aspects in soccer: Extrapolating pitch sizes from full-size professional matches. Journal of Sports Sciences, 31(6), 573-581.
Garganta, J., Maia, J., & Basto, F. (1997). Analysis of goal-scoring patterns in european top level soccer teams. In J. Bangsbo, T. Reilly & A. M. Williams (Eds.), Science and Football III (pp. 246-250). London: E & FN Spon.
Grant, A., Williams, A. M., Reilly, T., & Borrie, A. (1998). Analysis of the Successful and Unsuccessful Teams in the 1998 World Cup. Insight: The F.A. Coaches Association Journal, 2(1), 21-24.
Hughes, M., & Bartlett, R. (2002). The use of performance indicators in performance analysis. Journal of Sports Sciences, 20(10), 739-754.
Hughes, M., & Churchill, S. (2005). Attacking Profiles of Successful and Unsuccessful Teams in Copa America 2001. In T. Reilly, J. Cabri & D. Araujo (Eds.), Science and Football V (pp. 221-224). London: Routledge.
Hughes, M., & Franks, I. (2005). Analysis of passing sequences, shots and goals in soccer. Journal of Sports Sciences, 23(5), 509-514.
Hughes, M., Robertson, K., & Nicholson, A. (1988). Comparison of patterns of play of successful and unsuccessful teams in the 1986 World Cup for soccer. In T. Reilly, A. Lees, K. Davids & W. J. Murphy (Eds.), Science and Football (pp. 363-367). London: E & FN Spon.
James, N., Mellalieu, S. D., & Hollely, C. (2002). Analysis of strategies in soccer as a function of European and domestic competition. International Journal of Performance Analysis in Sport, 2(1), 85-103.
Jones, P. D., James, N., & Mellalieu, S. D. (2004). Possession as a performance indicator in soccer. International Journal of Performance Analysis in Sport, 4(1), 98-102.
Kaiser, H. F. (1960). The Application of Electronic Computers to Factor Analysis. Educational and Psychological Measurement, 20(1), 141-151.
Kaiser, H. F. (1974). An index of factorial simplicity. Psychometrika, 39(1), 31-36. Kempe, M., Vogelbein, M., Memmert, D., & Nopp, S. (2014). Possession vs. Direct Play:
Evaluating Tactical Behavior in Elite Soccer. International Journal of Sports Science, 4(6A), 35-41.
Konstadinidou, X., & Tsigilis, N. (2005). Offensive playing profiles of football teams from the 1999 Women's World Cup Finals. International Journal of Performance Analysis in Sport, 5(1), 61-71.
Lago-Ballesteros, J., & Lago-Peñas, C. (2010). Performance in Team Sports: Identifying the Keys to Success in Soccer. Journal of Human Kinetics, 25, 85-91.
Lago-Peñas, C., & Dellal, A. (2010). Ball Possession Strategies in Elite Soccer According to the Evolution of the Match-Score: the Influence of Situational Variables. Journal of Human Kinetics, 25, 93-100.
Lago-Peñas, C., Lago-Ballesteros, J., Dellal, A., & Gomez, M. (2010). Game-related statistics that discriminated winning, drawing and losing teams from the Spanish soccer league. Journal of Sports Science and Medicine, 9(2), 288-293.
Lago-Peñas, C., Lago-Ballesteros, J., & Rey, E. (2011). Differences in Performance Indicators between Winning and Losing Teams in the UEFA Champions League. Journal of Human Kinetics, 27, 137-148.
Lago, C., & Martin, R. (2007). Determinants of possession of the ball in soccer. Journal of Sports Sciences, 25(9), 969-974.
MacCallum, R. C., Widaman, K. F., Zhang, S. B., & Hong, S. H. (1999). Sample Size in Factor Analysis. Psychological Methods, 4(1), 84-99.
Moura, F. A., Martins, L. E. B., Anido, R. O., Ruffino, P. R. C., Barros, R. M. L., & Cunha, S. A. (2013). A spectral analysis of team dynamics and tactics in Brazilian football. Journal of Sports Sciences, 31(14), 1568-1577.

Oberstone, J. (2009). Differentiating the top English Premier League football clubs from the rest of the pack: Identifying the keys to success. Journal of Quantitative Analysis in Sports, 5(3).
Olsen, E., & Larsen, O. (1997). Use of match analysis by coaches. In J. Bangsbo, T. Reilly & A. M. Williams (Eds.), Science and Football III (pp. 209-220). London: E & FN Spon.
Pedhazur, E. J., & Schmelkin, L. P. (1991). Measurement, Design, and Analysis: An Integrated Approach. Hillsdale, NJ: Erlbaum.
Pollard, R., Ensum, J., & Taylor, S. (2004). Estimating the probability of a shot resulting in a goal: The effects of distance, angle and space. International Journal of Soccer and Science, 2(1), 50-55.
Pollard, R., & Reep, C. (1997). Measuring the Effectiveness of Playing Strategies at Soccer. Journal of the Royal Statistical Society. Series D (The Statistician), 46(4), 541-550.
Pollard, R., Reep, C., & Hartley, S. (1988). The quantitative comparison of playing styles in soccer. In T. Reilly, A. Lees, K. Davids & W. J. Murphy (Eds.), Science and Football (pp. 309-315). London: E & FN Spon.
Redwood-Brown, A. (2008). Passing patterns before and after goal scoring in FA Premier League Soccer. International Journal of Performance Analysis in Sport, 8(3), 172-182.
Reilly, T. (2005). An ergonomics model of the soccer training process. Journal of Sports Sciences, 23(6), 561-572.
Ruiz-Ruiz, C., Fradua, L., Fernandez-Garcia, A., & Zubillaga, A. (2013). Analysis of entries into the penalty area as a performance indicator in soccer. European Journal of Sport Science, 13(3), 241-248.
Russell, R. M. (2006). A Review of the 2006 FIFA World Cup Germany. Insight: The F.A. Coaches Association Journal, Autumn/Winter, 24-26.
Scoulding, A., James, N., & Taylor, J. (2004). Passing in the Soccer World Cup 2002. International Journal of Performance Analysis in Sport, 4(2), 36-41.
Stevens, J. P. (2009). Applied Multivariate Statistics for the Social Sciences (5th ed.). New York, NY: Routledge.
Tenga, A., Holme, I., Ronglan, L. T., & Bahr, R. (2010a). Effect of playing tactics on achieving score-box possessions in a random series of team possessions from Norwegian professional soccer matches. Journal of Sports Sciences, 28(3), 245-255.
Tenga, A., Holme, I., Ronglan, L. T., & Bahr, R. (2010b). Effect of playing tactics on goal scoring in Norwegian professional soccer. Journal of Sports Sciences, 28(3), 237-244.
Tenga, A., & Larsen, O. (2003). Testing the Validity of Match Analysis to describe Playing Styles in Football. International Journal of Performance Analysis in Sport, 3(2), 90-102.
Tenga, A., Ronglan, L. T., & Bahr, R. (2010). Measuring the effectiveness of offensive match-play in professional soccer. European Journal of Sport Science, 10(4), 269-277.
Tenga, A., & Sigmundstad, E. (2011). Characteristics of goal-scoring possessions in open play: Comparing the top, in-between and bottom teams from professional soccer league. International Journal of Performance Analysis in Sport, 11(3), 545-552.
Travassos, B., Davids, K., Araujo, D., & Esteves, P. T. (2013). Performance analysis in team sports: Advances from an Ecological Dynamics approach. International Journal of Performance Analysis in Sport, 13(1), 83-95.
Vogelbein, M., Nopp, S., & Hokelmann, A. (2014). Defensive transition in soccer - are prompt possession regains a measure of success? A quantitative analysis of German Fussball-Bundesliga 2010/2011. Journal of Sports Sciences, 32(11), 1076-1083.
Wright, C., Atkins, S., Polman, R., Jones, B., & Sargeson, L. (2011). Factors Associated with Goals and Goal Scoring Opportunities in Professional Soccer. International Journal of Performance Analysis in Sport, 11(3), 438-449.
Yiannakos, A., & Armatas, V. (2006). Evaluation of the goal scoring patterns in European Championship in Portugal 2004. International Journal of Performance Analysis in Sport, 6(1), 178-188.