ATTACHMENT E SUMMARY AND RESULTS OF CALC. NO. M500. …
14
-a--- s .a.< ..- a a..'M e a ,.A2 .m- -a _ ,_-,a e - ..- ., ,-m u m. L ,w-n,-. , ,,.. ._,, ,.,__-,A,- s n_, ws k u _m | ATTACHMENT E SUMMARY AND RESULTS OF CALC. NO. M500. REV. 3 RANGE OF SALT SERVICE WATER SYSTEM HEADER PRESSURES AND PUMP FLOWS _ Page 1 of R DO 3 ! _ _ -. - . .
Transcript of ATTACHMENT E SUMMARY AND RESULTS OF CALC. NO. M500. …

-a--- s .a.< ..- a a..'M e a ,.A2 .m- -a _ ,_-,a e - ..- ., ,-m u m. L ,w-n,-. , ,,.. ._,, ,.,__-,A,- s n_, ws k u_m
|
|ATTACHMENT E SUMMARY AND RESULTS
OF CALC. NO. M500. REV. 3
RANGE OF SALT SERVICE WATER SYSTEM HEADER
PRESSURES AND PUMP FLOWS
_Page 1 of
R DO 3
!_ _ -. - . . .

_ _ _ _ _ _ _ _ _ _ _ _ _ _ _ _ _ _ _ _ _ _ ___
..
CALCULATION COVER SHEET'
PILGRIM NUCLEAR POWER STATION
SHEET 1 OF M
CALC. NO. M500 FfEV. 3 FILI: NO. SR @ RTYPENSR O B4.01
Subject: Range of Salt Service Water System Preliminary OHeader Pressures and Pump Flows. Calc.
FinalizationDiscipline Division Manager (s): Due Date:
T.F. White Mech. & C/S Dept.
J.L. Rogers S&SA Dept.
Approval /sl: Date: Final Calc. @
+ 12- t4 Sp -
'
. u/4k,h . @M/f7'
.
Ak Statement AttachedSIndependent Reviewer: T'.~0. 5 -tA /s/
Page(s) By: Patrick J. Doody Date Ch'k'd p.Y s y,t( Date Agreed
I' >M I'h,an.4} | *r/*>/9'1 hk I*)3)17 hI'Io
I, % sty 4cmed eye,9Iem oh rk4 cdu lM gur.1,es % wif c,u s,go fuLx A uwfM % M% el m m ac p e % ,, ,, % n 1.tu t<d M <te tahr + lse . A L %~af a k s ( iu m n m s. h * t'"85w m g M. M -h isfnc66 A .%.p h'O'''*P'"''''AM f''I" w"
,''' "# ' Aw L; % hap Hm & nw ~ s'"' sam & . % % .u a t q s utw'
m -
This design analysis O DOES, E DOES NOT require revision to affected design documents.Affected Design Documents: l N1-55 'Setpoint Calculation for PS3828A/B and PS3829A/B'does not require revision; n.v. PA -71 '6 g y G. s.o A;p y(, c,# c 'lA pdc 0 IS, @ IS NOT Required. *
A Safety Evaluation @ IS, O IS NOT Required. See attached preliminary evaluationchecklist. Safety eval is required to change FSAR and include final design Information for openheader with single pump operation.This design analysis O DOES, @ DOES NOT affect the piping analysis index (PAI). If thepal is affected, initiate a revision to Calculation M561.
Minor revisions made on pages of this calculation. See next revision,
i
Replaces Calc. No. M500 Rev 2. and M500 Voided By Calc. No. ._- ORev 3 (Prelimir.ary)
Or Attached Memo
n- -
n
_ _ . . _ __ _ _ _ _ _ . - _ _ - . - . ._ _._ _._ _ . _ _. _ _____ _ _ _ _ _
CALCULATION SHEET " "^" " "' *SOSf0M EdlSONCALC.# M600 CHECKED BY: ?REV. 3 DATE 11/25/97
SHEET V OF l t* l
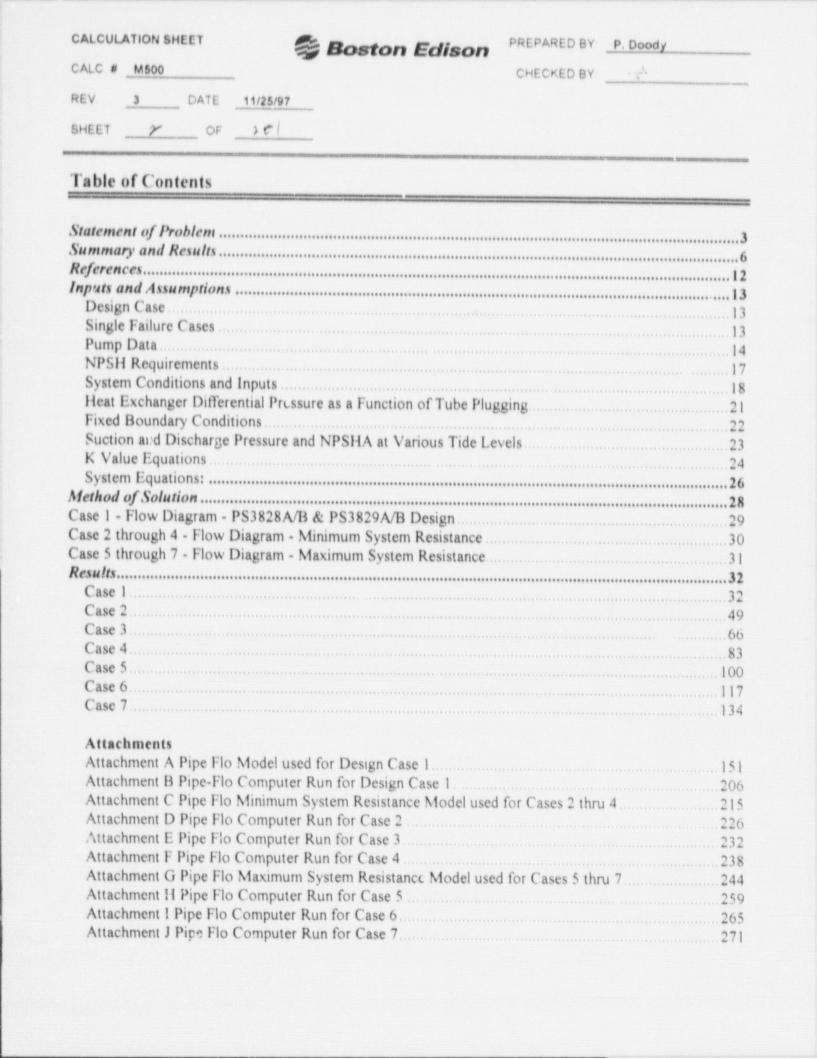
Table of Contents
sta tem en t of / Yo h Ic m . . . . . . . . . . . . . . . . . . . . . . . . . . . . . . . . . . . . . . . . . . . . . . . . . . . . . . . . . . . . . . . . . . . . . . . . . . . . . . . . . . . . . . . . . . . . . . . . . . . . . . . . . . . . . .. . . .. .. . . . .. . 3su m m ary a n d Res u Its . . . . . . . . . . . . . . . . . . . . . . . . . . . . . . . . . . . . . . . . . . . . . . . . . . . . . . . . . . . . . . . . . . . . . . . . . . . . . . . . . . . . . . . . . . . . . . . . . . . . . . . . . . . . . . . . . . . . . . . . . . . 6
NfftffnCC$............................................................................................................................................|2Inp u ts a n d A ss u mp tion s .. . .... ..... ... .. . .. . . . . . ... .... . .. . . . ... . . . .. .. . .. . .. .. ... ..... . . . . . .... .. .. . . . . .. . . . . . . . . .. . . .. . . . .. . . .. . . . ..... . .. . | 3
Design Case. . . . . . . 13.. . .. . . . . . . .. .. .. .
Single Failure Cases . .13.. .. . . . . . . . ... . .. . . . . . . . . . . . . .
Pump Data . .... . . . . . .14<
. . . . . . . . . . . . . . . . . . . . . . . . .. .. . . . .
NPSil Requirements . . . . .. . . . . . . . .. . ... .........17. . . . . . . . . . . . .. . . . .
System Conditions and Inputs . ... . 18. . . . . , . . . . . . . . . . . . . . . . . . . . . . . . . . . . . . . . . . . . . . . . . . . . . . . . .
Ileat Exchanger DifTerential Pressure as a Function of Tube Plugging... . .. 21. . . . . . . . . . . . . .
Fixed Boundary Conditions. . . . . . . 22. . . . . . , . . . . . . . . . . .. . . ..
Suction and Discharge Pressure and NPSilA at Various Tide Levels. . 23. . . . . . . . ....
K Value Equations. .24. . . . .. .. .. .. .. . .
S y s t e m E q u a t i o n s : . . . . . . . . . . . . . . . . . . . . . . . . . . . . . . . . . . . . . . . . . . . . . .. . . . . . . . . . . . . . . . . . . . . . . . . . . . . . . . . . . . . . . . . . . . . . . . . . . . . . . . . . . . . . . . . . . . . . . .. . . . . 2 6
Meth od of solu tio n . . . . . . . . . . . . . . . . . . . . . . . . . . . . . . . . . . . . . . . . . . . . . . . . . . . . . . . . . . . . . . . . . . . . . . . . . . . . . . . . . . . . . . . . . . .. . . . . . . . . . . . . . . .. . . . . . . . . . . . . . . . . . 2 8Case 1 - Flow Diagram - PS3828A/B & PS3829A/B Design.. . , . . 29. . . . . . . . . . . . . . .
Case 2 through 4 - Flow Diagram - Minimum System Resistance . ......................30. . . . . . . . . .
Case 5 through 7 - Flow Diagram - Maximum System Resistance... . . 31.. .. . . . . . . . . . .
Results.................................................................................................................................................32Case 1.. .. . . .. 32. . . . . . . . . . . . . . . . . .. . . . . . . . . . . . . . . . . . . . . . . . . . . . . . . . . . . . . . .
Case 2.. , . .49.. . . . . . . . . . . . .. . . . . . . . . . . . . . . . . . , . ...
Case 3.. . . 66. , . . . . . . . . . . .. . . . .. . . . .
Case 4. .83.. . , . . . . .. . . . . . . . . . . ..
Case 5.. . 100. . . . . . . . .. . . . . . . . . . . . . . . . . . . . . . . . . .
Case 6.. ... 117. .. .. . . . .. . . . . . . . . . . . . . . .
Casc 7... .134. . . . . . ., . . . . . . . . . . . . . .. . . . . . ..
AttachmentsAttachment A Pipe Flo Model used for Design Case 1. .151.
Attachment B Pipe Flo Computer Run for Design Case 1. .206.
Attachment C Pipe Flo Minimum System Resistance Model used for Cases 2 thru 4. .215Attachment D Pipe Flo Computer Run for Case 2. .226Attachment E Pipe Flo Computer Run for Case 3. .232. . .
Attachment F Pipe Flo Computer Run for Case 4. .238.. ., ,
Attachment G Pipe Flo Maximum System Resistance Model used for Cases 5 thru 7.... 244.
Attachment 11 Pipe Flo Computer Run for Case 5. ..259.
Attachment 1 Pipe Flo Computer Run for Case 6. .265. . .
Attachment J Pipe Flo Computer Run for Case 7. .271.
. - . -.

CAL.CULATION SHEET PREPARED BY. P.Do ygCALC.# _M6o0 CHECKED BY; ''& '
t
REV. 3 DATE 11/2$/97|
SHEET .3 OF ,
|e
Statement of ProblemRevision 3 is a complete revision of this calculation. Revision 2 provided the analyticallimit of I 1.36psig for the SSW header pressure upon which the setpoint for PS382WA and 11, and PS3829A and H is
based (Ref. !&C calculation I.NI.55) Calculation of that analyticallimit remains one purpose of thiscalculation (Ref. Case 1).
An additional purpose of this calculation is to evaluate a single failure that causes the selected headerisolation valve to fail open and AC power on one division to be unavailable, for the potential effects onthe operating SSW pump (s). This failure scenario is evaluated by a series of cases that envelope theforeseeable range of four parameters:
1. heat exchanger resistance,2. heat exchanger discharge valve position,3. tide level, and4. pump performance.
One way to visualize the interaction of these key variables is through a system "spectmm" diagram shownon the Figure 1. This diagram illustrates an operating envelope dermed by rance of tide levels from(-)7.I' to (+)l3.5' and system resistance that ranges from the minimum resistance to the maximumresistance.
I I I i i
Mammum System Resistance. . . . . . , . . . . . . . . . _ . . . . . . . . . . . . . . . . . . . , . . . . . . . . . . , , . . . . . . . . . . . . . . . . .
4 -',.h k~''' '
.b,
4
'fY Ob.- Zone of constant flow at all '
tide levels for a constant 1;ig'
's
_system resistance ,;s gg' ,
i :s'~
+ ~
@s IZone of vanable flow' '"N O s' se,
o
(increasing flow with '
increasing tide) for a % ~ .m
constant system s'$ %..
@_gpg}resistance T
| Minimum System Reststancei i i 1 7-
7Y -4 8' 00 50 100135Tide level (MSL)
Figurei
The minimum system resistance condition is dermed by 0% heat exchanger plugging in all four heatexchangers, one TBCCW heat exchanger valve 10% open, and all other heat exchanger 100% open.With these system conditions, maximum flowrate occurs depending on pump performance and tide level.

. ._. _. ._.
CALCUL ATION SHEET f) Boston Edicon PREPARED Bt P. Doo@
CALC # M500 CHECKED BY b,,
REV. 3 DATE 11/25/97
SHEET N OF
Statement of Problem cont'd
The maximum system resistance condition is defined by maximum heat exchanger plugging in all fourheat exchangers, both TBCCW heat exchanger valves 10% open, one RBCCW heat exchanger valve10% open, and one RBCCW heat exchanger valve 100% open With these system conditions, minimum
|flowrate occurs depending on pump performance and tide level.
It is noteworthy that the flow rate remains constant for a|| tide levels greater than (-)4.8 feet w. a a\
I
constant system resistance and pump performance. This is a result of the fact that the difference between |the suction pressure and the discharge pressure is constant for all tide levels higher than (-)4.8 feet. A |
graph of the relationship between suction pressure - discharge pressure as a function of tide level isprovided on Figure 2.
The SSW common header isolation valves control logic is designed to isolate a pre selected valvefollowing a loss of-ofTsite power (LOOP). Single failures have been identified that leave the headerunisolated following a LOOP (Ref. 3). The worst single failure identified is a failure of the 125VDCpower train that provides power for the pre selected valve, because that failure also causes the loss of thediesel generator associated with that DC bus. This worst case failure will cause the SSW system to beconfigured as follows:
1. Unisolated header allowing pump flow through all four heat exchangers.2. 11 cat exchanges discharge valves in same division as the DC failure remain in the same position
they were in prior to the LOOP. The RBCCW heat exchanger discharge valves are designed tofully open, and the TBCCW heat exchanger valves are designed to close to 10% open afler aLOCA + LOOP.
3. The two SSW pumps located in the same division as the DC failure are unavailable. AC power isnot available in that division because of the diesel generator failure.
This calculation ( srmines the number of operating SSW pumps, their operating state, and steady statehydraulic systeiri litions at the points along the boundary of the operating envelope illustrated inFigure 1. Based his analysic the range of operating conditicas for a single pump are established.

"- M.
CALCUt> JSHEET PREPARED BY: P.Doody
& Boston EdisanCALC.# M500 CHECKED BY: ,)
j
REV. 3 DATE 11/25/97
SHEET f OF JJ/
Variation in Salt Service Wa'er System Differential Pressure vs. Pde Level
20 - 32,
i. _ _
7
'
. . s[1-
- ( Suctum Pressure T~
.F }N15 --- 1
,
24|
(Saaf We8 D Pressure },,
|t -'
.52 M -
V. n
E -.
i & 1; . ,
~|
- |Cn~
e 16 gror tde leve s from (-)<-sW as e system ar d pump fWrate win , j-j 10 ;; ; ; ; ; ; ; g,* rM remain constant for constant system resrstances hew pressure as wen ? D= #o
.!!! f~
----[,q as ove an sys em pressures win increase with nsing t:de !- wel ' ,! hr
( Drfferentral PressureIl }'s1
;, , ,
! I-g *g , AQ 0 0 0 0 0 0 0 0 0 0 0 0 0 ^ 4-4
s 5 -- Tsystem nowrate at (-)<-9%* tde leved ts the maxu num flowrate wth mensmum NPSHA T * - - ' - ^ - O
at any partcular system resrstance This tde level corresponds eth elevahon of seal, ,
weg mtntmum sea level (-}(-9%* ),s .s
A + f9
, . . - -
0 0
-15 -: -5 0 5 10 15'
Mean Sea Level (feet)
Figure 2
. . .
.
. ..
.

. _ _ _ _ _ __ _ --
catcuenison sneer & Boston Eeil:on """ **CALC.# M500 CHECKED B . C
REV. 3 OATE 11/25/97
SHEET tv OF _, -'-
Summary and Results] The results for the design case of two SSW pumps (one pump per loop) operatingwith valves aligned in
the emergency position, header isolated, and minimum system resistance, indicates that a SSW pumpdegrade 1 to 85% ofits design performance is :apable of producing a header pressure of 27.24 psia(12.54 psig). I&C calculation I-NI-55 utilized an analytical limit of i 1.36 psig to develop the 3.3 psigsetpoint for PS3828A/B and PS3829A/B, which is conservative because it results in a lower pressurerequirement than the minimum capability of a single pump as indicated by this calculation. The above
g results indicate that the current analytical limit is conservative, therefore, the analytical limit could ben raised to a higher pressure value and the safety function that a single pump automatic start occur in eachU loop during an emergency would still be met.
Although, raising the setpoint would make smaller the operating environment (i.e., combinations of
system resistance, tide level, and pump performance) where a single pump would operate following a DCfailure (Cases 2 through 7), raising the setpoint would at the same time make larger the operatingenvironment where one pump is in runout and cavitating until the second pump starts because ofsustained low header pressure.
With regard to the analysis of single failures that result in an open header. The arrows above and belowthe shaded box on Figure 3 indicate the pump flow rates that are calculated for the single failure cases 2through 6 at the corresponding tide level and system resistance (flows at the top are based on maximum
resistance and flows at the bottom are based on minimum resistance). The results from Case 1 are also,< presented on Figure 4A, Case 2 through 4 are presented on Figure 4B, and Case 5 through 7 aree presented on Figure 4C.
As expected the flowrates at maximum system resistance are substantially less than those that occur atminimum system resistance. As expected the lowest heair pressure occurs at the lowest tide level withminimum system resist'.nce (13.33 psia). The header pressure switch setpoint requires a minimum of 18psia (14.7 + 3.3 psig), therefore, a second SSW pump will start automatically 30 seconds after the firstpump. With minimum system resistance, for all tide levels below (+) 5.6', a second SSW pump willautomatically start.
The range of flows with minimum system resistance is between 5237 gpm and 5273 gpm. At these flowrates, approximately 44 feet of NPSH is required. The astronomical low tide level of(-) 7.l' provides44.8 feet of NPSH, therefore, pump cavitation will rat occur during the 30 seconds until the second
pump starts and both pump flowrates move to a lower value because of higher backpressure fromincreased dynamic head loss.
The greatest header pressure occurs at the highest tide level with maximum system resistance(36.52 psia). A second SSW pump will not start automatically with maximum system resistance over theentire tidal range. The range of flow under these conditions is between 4659 and 4698 gpm. At theseflowrates, NPSH requirements are met.
___ _ _ _ _ _ - _ _

__ - _ _ _ _ _ - _ _ _ - - - - - - - - - - - - -
CALCULATION SHEET $ Boston Edicon PREPAREL BY. P.Doody ,CALC,# _ M500
CHECKED BY. AREV 3 DATE 11/25/97
SHEET l OF s
t
There is a range of system resistances (between the minimum and maximum) at tide levels less than] (+) 5.6' that will involve a single SSW pump operating for up to approximately 10 minutes, at which time
operators willisolate the header and start a second SSW pump to initiate containment cooling Therange of short term pump operating conditions that can occur are bounded by a flowrate of 5273 gpm(the peak system single pump flowrate) and NPSH a.vailable of 44.8 feet (corresponding to (-) 7. I' tide.It is noteworthy that this maximum pump flowrate of 5273 gpm is bounded by the pump test datacontained in Referer:e 9, and the NPSH available of 44.8 feet exceeds by a small margin the NPS11
g requirement at this flowrate of 44 feet.
C Based on the results of this calculation, continuous operation of a single SSW pump with an open headerand minimum sfaem resistance is acceptable. The expected pump flowrate is within the tested
performance of the pump and NPSH requirements are met at the low astronomical tide. No degradaiionor damage to the pump should be expected under these circumstances.
__ _. - _ _ _ .

.__. _ . _ . _ _ _ _ _ -. -.. _ _ ___-.._..... _ _ .. _ .. _. _ _ _ _ _. _ ._, _ ._ _ _ _ _. _ _ _ _ ~ _ . _
'i
CALCULATION SHEETh SOSf0D Ed/ SOD ' "^" " '' #
j CALC. # _ M500 CHECKED BY: bi
{ REV . 3 OATE 11/25/97
SHEET & OF '
Summary and Results cont'd:4
' 'iii:.:
T1 1s y a,
% 8 5L il IL4
'
$ 4 %'b e W
vv vI t i I I I I
; I Maximum System Resistance i
'de eve s or a ons ant '
5 ',;gQj$9d: hPIj'
'
system resistancs ff ~ sy"s .u , ; me s ' es sh '
s.,sy ;
Zone of variable flow );~ g h+'
; (increasing flow with ; %y- g ''[ .
*
* . @ X
increasing tide) for a k' ''
f' constant system
3(*
.
resistancef
! i J,I...A . M 1 2 m:.i..AP W #$
, Mnmum System Resistance! I I i i
7.1' 48' OO 5.0 10.0 13.5
Tide Level (MSLh# ^ ^
m
n v @ s-
c ".e n
i k k k. -~ - -
w 2, c.
,
k k h k) O V O
Figure 3
11
.
-- my w. > ..y--,z..y. 3%+ - ., _ . , , ,----.+m ae.- .- u

- -_ _ - - _ _ _ _ - _ _ _ _ _ _ _ _ _ _ _ _ _ _ _ _ _ _ _ _ _ _ _ _ _ _
CALCULA"9N SHEET PREPARED BY. P.DoodyCALC.# ;00 CHECKED BY; ''S-
'
REV. 3 DATE 11/25/97 hhSHEET q OF 3 J/
Summary and Results cont'd
Case 1 * Design Case for PS3828A/B & PS3829A/BMinimum System Resistance * (-) 7.I' Tide * 85% Pump Curve .
SSW pump performanceCase 1 - System curve 4.130 gpm @ 60 ft TDH NPSHA 44 8 feetNPSHR
160 100
.__ - . _ . 80 02 1- . - . .
___ .-..._ . ... | 60 5140 - -- - t7
~ ] 40 g__.
120 - 20_ _ . - -- -} . _ _ _ _
1
~~~ - + -- 0_ . . . ..- T_ -- . . _ . - . . . . - . . . . . .
. ,
..._ . _ .
100 --
_ _- f __ .L . 4
-'
'---" - - -
___ .. _ . .
. _ . . . _ _ _ __ . . . _ .- --,
=_ . - ._ _4 ._
. - . . -_ . . - , - - - .-. _- - . ._ .
= 80 - -- - -- ---
_ - _ . - - -- -- - -
o __-,
_ .
_ _ , . _ . .-h. + - ._. -
E - - - - ' - - - ~ - ' - - ~,
~
,f~'- - - - -
| -3 _ _- __
g 60_ _ _ __ _ _ _ .-- ___ p
. . - - ,. _ .-
---- - --
, ,
___
_ .. . _ . -
_
-. -
40 - - - ---,!
.-
_ . _ . . _ . _ _ - -- - - - . . - - - . . _ . _ - _ _ - _ ....
--- /.-.
L' - . - . . - .-
. . . . _ , .. _ _ _ _ _ _ _ .. . . _ . _ _ . _ _
-..
20 -- y ~ - -- - - -- 1 - ---|_._ _ - - - - . . . . . .
__ |p,fi' ' ~
j-.
j,
0
0 500 1000 1500 2000 2500 3000 3500 4000 4500 5000 5500 6000Pump flow (gpm)
Figure 4A
..- . . - . _ . -. . . . . _ _ . . . . , . . . . . . . . _ .
- -
- . , , . .- . . , . - - - - - - --
L _ _ , . _ . . . , . .
.. .. -- .. ..- - . . . . . - .. . . . - - - . . . . . . . . . - . i. . . . . _ - - .. .

n 08MmCALCULATION SHEET PREPARED BY: P.DoodyCALC.# '00 CHECKED BY: AREV, 3 DATE 11/25/97 hogy ggggSHEET 11 OF v3;
s
Case 2 * Minimum System Resistance * (-)7.I' Tide * Design Pump Curve |Case 3 & 4 * Minimum System Resistance * (-)4.8' to +13.5' Tide * Design Pump Curve !
____;
SSW pump performance
Cese 2. System curve 5237 gpm @ 35.7 ft TDH, NPSHA 44 8 feet- - - Case 3 & 4- System curve 5273 gpm @ 33 9 ft TDH, NPSHA 47 feet
NPSHR
180 100_. a_ __ _ _4 _ j
},
_ . _ . . .' 80 0
160 -_f__._ . . _ _ .7 . j t_
60 m:-:
fZ[' -
1_ , ,- { 40
140 -- - N-- ---
i f 4 20 7.
1|'
.T_T.~~_ ' ' _ _ | -. . .
i4 O
,__- - . _ _ .
.__. .'!120 -
. L- _
y% _. 8
- __7- ,4 . a
.
- |
t_ _ . _ _ _ __ _.._ _ _.___1e_ _ _ _ _ . . ... - ! _-
*
::: 100 _- _ _ _ ______-_-t ---- [ }_,
g , ,'
[~'
f_ _ _.i _ 4 -. .
-f~ +- - - - - * - - -g 80 -
;
:s i _4_ _ .} |'^
8- ! __ _ t
60 --- -- -- - - - -t - - - I~ - -{
. l .'
----t,
:~~L:'~ ~~~: ~:_^3._._..
- _ . - . _: .~ ~_. ' . _ _ _.! . ~ .'
_ ! 4 . _ __ __ . _ _ . _ - _ _ _ ._ _ . ,- - - - - - + -- - - --- - {- -
---_._s-___-40
!. _ .
.
_ _ _--_4
. .
' - " ' __, _ _ x :"_._.___4
. ____.--L__-__ _ _ -, 4 ..L __
.,.
_ . _ _ _ _ __ - h,-,
1__._-_-- . . . _ - --- }, , , _ _ -r _ -20 }.
-
_
~' - I j !. .1.._. i'~ -~~___
0l
0 500 1000 1500 2000 2500 3000 3500 4000 4500 5000 5500 6000
Pump flow (gpm)
Figure 4B
_ _ _ . - , .

_- - , . . . . _ . - -_ - -. _. . . -. ._ - . . . -
CALCULAMN SHEET PREPARED BY: P.DoodyCALC.# 00 CHECKED BY: ,4
hhhREV. 3 DATE 11C.5/97SHEET to OF __ -2 t- i
Case 5 * Maximum System Resistance * (-)7.I' Tide * Design Pump CurveCase 6 & 7 * Maximum System Resistance * (-)4.8' to +13.5' Tide * Design Pump Curve
,-> !
-- SSW pump performance
Case 5 - System curve 4659 gpm @ 65 04 ft TDH. NPSHA 44.8 feet t
- - - Case 6 & 7 - System curve 4698 gpm @ 63.85 ft TDH. NPSHA 47 feet'
NPSHR180
.-, , 100
, 4-.--..._t..J _ __Z'_. 80 E :i
_E100 A. --- . . . . .-!
---g
-- - 60' '
40 {1
1 -- |-- - 20 z140 - - - - .
i .N i
Z 4 -- K _ ,_ . _ .I" ' ' ' ~ 0 >
120.. _ . . .
}g_ _ _ _ _ _ . _ _ _ -. -- -
._ _- . __ _--- - -- +
_________ % .
- _ . ._ ..
::: 100-. -.N-
__ .1
.
. _%
- - - _ _ -.... . { . - - ,
a .
E- n N3
[ 80 -- N - - ( 3 ---F ; ,' ' | ,,
-
g __
____4_- _ ,_._I._. i.
'
- ;
60 - - - - - -
_ , _ _.___.4 - !/
_. _.. t- .
d ,-- . . _ _ _ . . -l :
. x. . . .
-- - - - . __ ___1._.. ._}
..
40_ _ . _ . y ..
- --
_ . . - ._.
{- _- . . . _. _ . .t -**._.
, -_. - + . _ . .
20 w- - --- 4- .- -.- .-.. .. . __
___ - , , -. _ _ - - .,
0 500 1000 1500 2000 2500 3000 3500 4000 4500 5000 5500 6000
Pump How (gpm)
Figure 4C 3
!
I
,
. . _ _ _ _ _ _ _ _ _ _ _ _ . _ _ _ _ _ _ _ _ - . _ . _ - _ _ _ _ _ _ _ _ _ - _ _ . _

__ ___-_ _ ___ __- -_ - -.
CALCULATION SHEETh SOSfOn Ed/ Son PREPARED BY: P.Doody
CALC.# M500 CHECKED BY. 4\
REV. 2 DATE 11/25/97
SHEET Ik OF
_.
References1. BECo I&C calculation i NI 55,"Setpoint Calculation for PS3828A/B and PS3829A/B"2. PR97.2040, " Single failures in DC power lead to unisolated header and SSW pump operating in
runout"
3. BECo calculation M630," Minimum Required SSW Pump Discharge . lead at 2700 gpm to Ensure| 4500 gpm Through the RBCCW lieat Exchanger During Emergency Conditions"
4. Crane Technical Paper No. 410, Flow of Fluid Through Valves, Fittings, and Pipe,1988,i
5. Pipe-Flo Users Guld - agineered Sonware Inc., Version 4.16. Streeter - Wylie, " Flu. , echanics" eighth edition, McGraw Hill, Inc., New York,1985.7. Karrassik, Igor J., "Cem., fugal Pump Clinic" 2nd edition, Marcel Dekker, Inc.,1989 (Question 1.29)8. Vendor Manual V0305,
| 9. SUDDS/RF # 97-95,"SSW Pump Performance Test", Johnston Pump Company,11/4/97
|
m ,

_ _ _ _ _ _ _ _ _ _ _ _ _ _ _ _ _ _ _
tO Boston EdisonCALCULATION SH2ET PREPARED BY; P.Doody
CALC.# M500 -~
CHECKED BY: &REV. 3 OATE 11G5m7
SHEET l) OF xy )
Inputs and AssumptionsDesign Case
1. LOCA and coincident LOOP2. A single pump in each loop starts automatically.3. Selected header isolation valve (MO3808 or MO3813) isolates. .
4. RBCCW heat exchanger discharge valves cycle to 100% open.5. TBCCW heat exchanger discharge valves cycle to 10% open.6. Pumps cont!aue to start until static pressure at header pressure switches is greater than header
pressure switch setpoint.7. Water leg in instrument sensing line is equivalent to 7.06 psig. However, the number of pumps
that start is maximized if the sensing line is assumed full of water, and the switch is assumed to
sense the header pressure at the centerline of the pipe minus the 7.06 psig water leg. Accordingly,the pressure at Node 17 in the model minus the 7.06 psig water leg in the sensing line assumed tobe the pressure that the pressure switch senses.
8. Pressure switch setpoint of 18 psia (3.3 psig) increasing (Ref. I&C Calc. I-NI-55).9. Pressure switch reset setpoint of 2.3 psig decreasing (Ref. I&C Calc. I-NI-55).10. -7.1 feet mst is the yearly astronomical mean low tide level.
i
Single Failure Cases
| 1. LOCA and coincident LOOP!
2. No operator action to start additional pumps. titrottle valves, or isolate the header for 10 minutesfollowing the start of the event.
3. Failure of the selected header isolation valve (MO3808 or MO3813) to isolate.4. RBCCW heat exchanger discharge valve on division with AC power cycles to 100% open.5. TBCCW heat exchanger discharge valve on division with AC power cycles to 10% open.6. Pennanent loss of AC power for one division, heat exchanger discharge valves remain as-is.7. AC power available from the standby AC supply (diesel generator) for pump P208C (located on
swing bus) and two other SSW pumps on one division (either P208A and B or P208D and E).8. SSW pumps start in sequence based on time delay relay settings.9. Pumps continue to start until static pressure at header pressure switches is greater than header
pressure switch setpoint.10. Water leg in instrument sensing line is equivalent to 7.06 psig. However, the number of pumps
that start is minimized if the sensing line is assumed full of air, and the switch is assumed to sense
the header pressure at the centerline of the pipe to which the sensing line is tapped. Accordingly,the pressure at Node 17 in the model is assumed to be the pressure that the pressure switchsenses.
I 1. Pree.sure smtch setpoint of 18 psia (3.3 psig) increasing.12. Pressure switch reset setpoint of 2.3 psig decreasing.13. Diesel generatcr is capable of supporting up to 3 SSW pumps without overload. (vd. Et,it 95 ~7814. -7.1 feet mst is the yearly astronomical mean low tide level15. +13.5 feet msl is the extreme design storm high tide level