Attachment C: Cost benefit analysis...
148
Standing Council on Environment and Water Attachment C: Cost benefit analysis report December 2011
Transcript of Attachment C: Cost benefit analysis...
Standing Council onEnvironment andWater
Attachment C:
Cost benefitanalysis report
December 2011

1Liability limited by a scheme approved under Professional Standards Legislation.
Disclaimer
This report has been prepared by PricewaterhouseCoopers (PwC) in association with Wright Corporate Strategy(WCS) at the request of the Standing Council on Environment and Water (SCEW) in our capacity as advisors inaccordance with the Terms of Reference and the Terms and Conditions contained in the Consultant Agreementbetween SCEW and PwC.
The information, statements, statistics and commentary (together the ‘Information’) contained in this reporthave been prepared by PwC and WCS from publicly available material and from discussions held withstakeholders. The Consultants may in their absolute discretion, but without being under any obligation to do so,update, amend or supplement this document.
PwC and WCS have based this report on information received or obtained, on the basis that such information isaccurate and, where it is represented by the client and other stakeholders as such, complete. The Informationcontained in this report has not been subject to an Audit. The Information must not be relied on by thirdparties, copied, reproduced, distributed, or used, in whole or in part, for any purpose other than detailed in ourConsultant Agreement without the written permission of the SCEW and PwC.1
Acronyms
ABS Australian Bureau of Statistics
ACCC Australian Competition and Consumer Commission
ADF Advance Disposal Fee
APC Australian Packaging Covenant (formerly NPC)
AWT Alternative Waste Technology
BCR Benefit Cost Ratio
C&I Commercial and Industrial
CAGR Compound Annual Growth Rate
CBA Cost Benefit Analysis
CDL Container Deposit Legislation
CDS Container Deposit Scheme
COAG Council of Australian Governments
CPI Consumer Price Index
CRF Container Recycling Fee
CRIS Consultation Regulatory Impact Statement
DEWHA Department of the Environment, Heritage, Water and the Arts (now DSEWPAC)
DRIS Decision Regulation Impact Statement
DRS Dansk Retursystem
DSD Duales System Deutschland
DSEWPaC Department of Sustainability, Environment, Water, Population and Communities(formerly DEWHA)
FTE Full Time Equivalent
EPHC Environment Protection and Heritage Council
EPR Extended Producer Responsibility
EU European Union
HDPE High Density Polyethylene
IVT In-Vehicle Time
KAB Keep Australian Beautiful
LGA Local Government Area
LPB Liquid paperboard
MRF Material Recovery (/Reclamation) Facility
MS2 Martin Stewardship and Management Strategies
NEPC National Environment Protection Council
NEPM National Environment Protection Measure
NPC National Packaging Covenant
NPV Net Present Value
OBPR Office of Best Practice Regulation
PET Polyethylene terephthalate
PSO Product Stewardship Organisation
PV Present Value
PwC PricewaterhouseCoopers
RIS Regulation Impact Statement
RTA Roads and Traffic Authority
RVM Reverse Vending Machine
SMEs Small and Medium Enterprises
SCEW Standing Council on Environment and Water
SOOG Senior Oversight Officers Group
TEC Total Environment Centre
VKT Vehicle Kilometres Travelled
VOC Vehicle Operating Cost
WCS Wright Corporate Strategy
WG Working Group

PwC | WCS Packaging cost benefit analysis report
Contents
Executive summary 1
1. Introduction 6
2. General assumptions 16
3. Consumption, recycling, landfill and litter projections 18
4. Cost assumptions 39
5. Benefit assumptions 75
6. Cost benefit analysis 90
Appendix A The recycling supply chain 111
Appendix B Household participation costs 114
Appendix C Collection and transport costs 117
Appendix D Landfill disposal fees 120
Appendix E Thresholds of business size in the Australian Packaging Covenant 122
Appendix F Market value of materials 124
Appendix G Landfill externalities 132
Appendix H Landfill operating costs 134
Appendix I Litter clean up costs 135
Appendix J CDS co-benefits 136

PwC | WCS 1 Packaging cost benefit analysis report
Executive summary
Used packaging in Australia has a range of impacts such as imposing costs on third parties through litter andland filling and creating opportunity costs due to the embedded resources lost under current disposal methods.These problems were identified and discussed in the Problem Statement for Packaging complied as part of thisproject.
Based on the market failures identified, a range of options to mitigate the impacts of used packaging weredeveloped. These options are:
Non-regulatory:
Option 1: National Waste Packaging Strategy
Co-regulatory:
Option 2A: Co-regulatory Packaging Stewardship
Option 2B: Industry Packaging Scheme
Option 2C Extended Packaging Stewardship Scheme
Mandatory:
Option 3: Mandatory Advance Disposal Fee (ADF)
Option 4A: Boomerang Alliance (BA) Container Deposit Scheme (CDS)
Option 4B: Hybrid CDS
Each option involves a range of initiatives or programs to address different problems within the packagingwaste stream. Details of initiatives, regulatory arrangements and funding are detailed in the Packaging OptionReport.
It is possible to combine the non-regulatory options (Option 1) with the co-regulatory (Options 2A, 2C and2C)or mandatory options (Options 3 and 4), although this is a more complicated exercise than simply adding thecosts and benefits of each option given diminishing marginal returns.
The Problem Statement also identified that recycling in Australia is already at relatively high levels, particularlyfor at home recycling. This means that further gains in increasing recycling will come at increasing cost. Inother words, linear rates of increases in both the participation and recycling effort cannot be expected.Therefore, it is necessary to make trade-offs between the cost of a given option and the benefits, particularly thereduction in litter and increase in recycling, it could achieve. A Cost Benefit Analysis (CBA) has been conductedto assess these trade-offs and compare indicative costs and benefits of each option. This report presents theassumptions and results of the CBA. The report has been prepared by PwC and Wright Corporate Strategy(WCS) based on advice provided by the Standing Council on Environment and Water (SCEW) Working Group(WG) and Packaging Waste Senior Officers Oversighting Group (SOOG).
A range of assumptions regarding the costs and benefits of each option have been made and are summarised inthis report. The CBA compares each option relative to a ‘business as usual’ scenario (the base case). Economiccosts and benefits will be measured from the perspective of society as a whole and where possible, they will bemonetised and discounted to convert them to their net present value (NPV). To do this, the following keyassumptions and estimates are required.
Executive summary
PwC | WCS 2 Packaging cost benefit analysis report
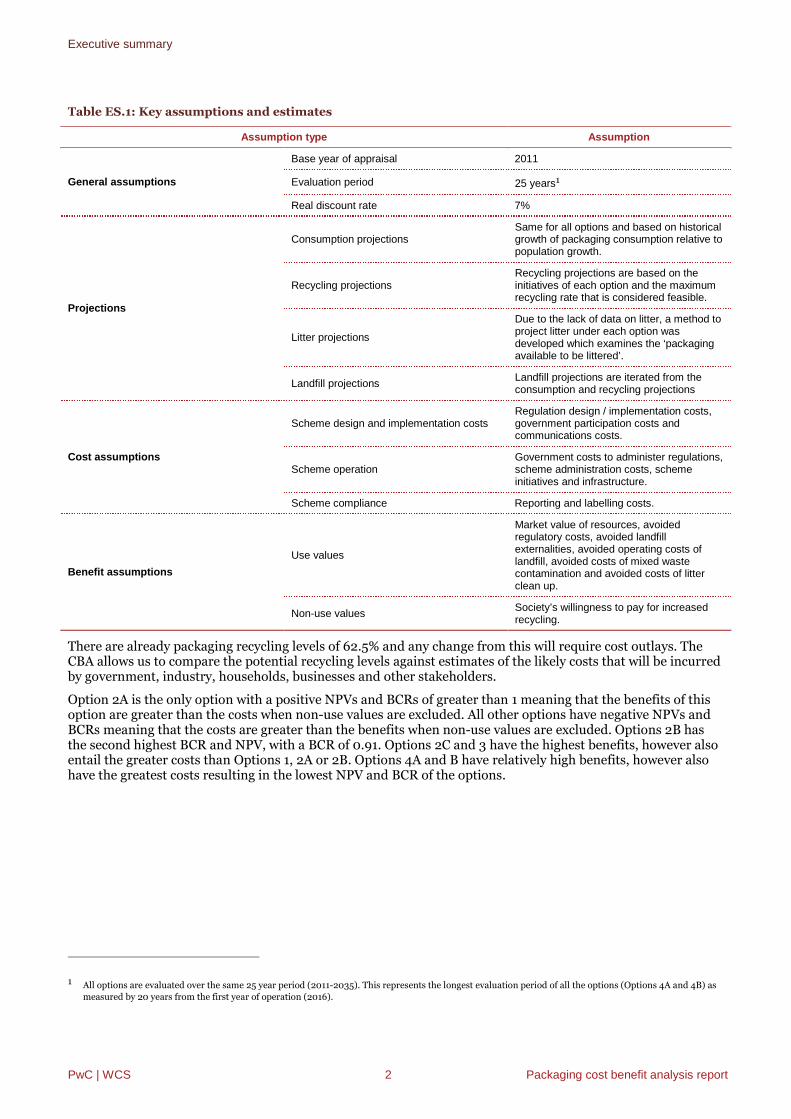
Table ES.1: Key assumptions and estimates
Assumption type Assumption
General assumptions
Base year of appraisal 2011
Evaluation period 25 years1
Real discount rate 7%
Projections
Consumption projectionsSame for all options and based on historicalgrowth of packaging consumption relative topopulation growth.
Recycling projectionsRecycling projections are based on theinitiatives of each option and the maximumrecycling rate that is considered feasible.
Litter projections
Due to the lack of data on litter, a method toproject litter under each option wasdeveloped which examines the ‘packagingavailable to be littered’.
Landfill projectionsLandfill projections are iterated from theconsumption and recycling projections
Cost assumptions
Scheme design and implementation costsRegulation design / implementation costs,government participation costs andcommunications costs.
Scheme operationGovernment costs to administer regulations,scheme administration costs, schemeinitiatives and infrastructure.
Scheme compliance Reporting and labelling costs.
Benefit assumptions
Use values
Market value of resources, avoidedregulatory costs, avoided landfillexternalities, avoided operating costs oflandfill, avoided costs of mixed wastecontamination and avoided costs of litterclean up.
Non-use valuesSociety’s willingness to pay for increasedrecycling.
There are already packaging recycling levels of 62.5% and any change from this will require cost outlays. TheCBA allows us to compare the potential recycling levels against estimates of the likely costs that will be incurredby government, industry, households, businesses and other stakeholders.
Option 2A is the only option with a positive NPVs and BCRs of greater than 1 meaning that the benefits of thisoption are greater than the costs when non-use values are excluded. All other options have negative NPVs andBCRs meaning that the costs are greater than the benefits when non-use values are excluded. Options 2B hasthe second highest BCR and NPV, with a BCR of 0.91. Options 2C and 3 have the highest benefits, however alsoentail the greater costs than Options 1, 2A or 2B. Options 4A and B have relatively high benefits, however alsohave the greatest costs resulting in the lowest NPV and BCR of the options.
1 All options are evaluated over the same 25 year period (2011-2035). This represents the longest evaluation period of all the options (Options 4A and 4B) as
measured by 20 years from the first year of operation (2016).

Executive summary
PwC | WCS 3 Packaging cost benefit analysis report
Table ES.2: Results of CBA based excluding non-use values ($2011 millions, discounted)
Option 1NationalWaste
Strategy
Option 2ACo-reg
Stewardship
Option 2BIndustryScheme
Option 2CExtended
Stewardship
Option 3Mandatory
ADF
Option 4ABoomerang
CDS
Option4B Hybrid
CDS
Costs $millions $311 $258 $554 $984 $981 $2,125 $2,471
Benefits $ millions $262 $304 $503 $786 $786 $710 $710
NPV $ millions -$49 $46 -$51 -$198 -$195 -$1,414 -$1,761
BCR Number 0.84 1.18 0.91 0.80 0.80 0.33 0.29
Note: Real discount rate of 7% and evaluation period of 25 years (see table ES.1 for summary of general assumptions.
The table below summarises the key factors driving the results of the CBA, which include:
Option 1 and 2A are relatively low-cost options, while Options 4A and 4B are relatively high cost options.This is driven by the higher household participation costs and scheme initiatives/infrastructure costs ofOptions 4A and 4B relative to other options. A CDS moves from a well understood and utilised, centralisedkerbside recycling system offering substantial coverage to a decentralised system requiring significantbehavioural change
All options involve an overall increase in recycling by 2035, with Options 2C and 3 having the highestoverall recycling rate in 2035 (4.5 million tonnes) and Options 4A and 4B having the highest beveragecontainer recycling rates in 2035 (1.1 million tonnes).
Table ES.3 Summary of key factors driving the results of the CBA
OptionCosts ($2011, PV,
millions)Benefits ($2011,
PV, millions)
2035 packagingrecycling quantity(million tonnes)
2035 litterquantity(tonnes)
2035 landfillquantity (tonnes)
Option 1 $311 $262 4,22 30,300 956,000
Option 2A $258 $304 4.20 31,000 977,000
Option 2B $554 $503 4.26 28,900 915,000
Option 2C $984 $786 4.50 21,700 689,000
Option 3 $981 $786 4.50 21,700 689,000
Option 4A $2,125 $710 4.31 28,400 867,000
Option 4B $2,471 $710 4.31 28,400 867,000
Table ES.2 presents the results of the analysis excluding non-use values. This analysis estimates a net benefit tosociety of up to $46 million (2011, PV) for Option 2A to a net cost to society of $1.7 billion (2011, PV) for Option4B.
An additional measure of the increased value of recycling as a result of the options is the willingness to pay forrecycling (incorporating non-use values), although the extent to which there is double counting of benefits ofthe use value benefits is unknown. Households place a value on increasing recycling that, to an unknown extent,includes the value of the embedded resources in recycled goods and a range of other ‘non-use’ components.These non-use components that lead households to value recycling could include the environmental benefits ora feeling of civic duty.
In 2010 PwC was commissioned by the EPHC to undertake a study of households’ willingness to pay (WTP) forrecycling. In the study it was found that households were willing to pay on average $2.77 per year for every 1%increase of packaging recycled above current levels of tonnes.2
2 PwC, 2010. Estimating consumes’ willingness to pay for improvements to packaging and beverage container waste management.

Executive summary
PwC | WCS 4 Packaging cost benefit analysis report
The table below presents the present value of the willingness to pay benefits estimated using the 95%confidence interval lower bound of $2.19 and upper bound of $3.77 (in addition to the core point estimate of$2.77). A 95% confidence interval means that there is a 95% level of confidence that the true, average value lieswithin this range.3
This analysis estimates that the present value of the willingness to pay benefits ranges from $233 million for thelower bound estimate of Option 2A to $1.2 billion for the upper bound estimate of Options 2C and 3.
Table ES.4: Summary of recycling willingness to pay benefits (incremental to base case, $millions, PV)
Option 1NationalWaste
Strategy
Option 2ACo-reg
Stewardship
Option2B
IndustryScheme
Option 2CExtended
Stewardship
Option 3Mandatory
ADF
Option 4ABoomerang
CDS
Option4B
HybridCDS
Lower confidence interval PV $234 $233 $422 $689 $689 $465 $465
Point estimate PV $296 $295 $534 $871 $871 $588 $588
Upper confidence interval PV $403 $402 $727 $1,186 $1,186 $801 $801
It is potentially misleading to include both estimates of the willingness to pay for increased recycling and theuse value benefits given the possibility of double counting (i.e. if it was true that households considered marketvalues of packaging materials when estimating their willingness to pay). It is not possible to disaggregate thisWTP value into the use (i.e. the market value of materials) and non-use values of recycling, so the extent of thispotential double counting is indeterminate. As such, it will be necessary for decision makers to make ajudgment as to whether it is reasonable to expect that the society’s willingness to pay for increased recycling(excluding any double counting) are likely to exceed the net cost estimated in Table ES.2based on the marketvalue of materials alone.
As well as placing a value on increasing recycling, society places a value on reducing litter. The 2010 PwC studyconducted analysis of the extent to which households value decreases in litter. However, it was not possible toreliably include these WTP for reductions in litter in the CBA. This is because households were asked abouttheir willingness to pay for a reduction in litter, but were not given units of measurement. It is therefore notknown whether people were thinking about the number of littered items, their volume, weight, visual impact,environmental impact or some other measure when valuing litter reduction.
There are also likely to be ‘co-benefits’ associated with increased recycling and reduced litter of non-packagingproducts as a result of the proposed packaging options. These co-benefits could arise from the use of CDScollection infrastructure, increased awareness of recycling/litter more generally and reduced contamination ofkerbside recycling. However, the complexity of quantifying these impacts in the tight timeframes associatedwith the Consultation RIS (especially given that there may also be additional costs required to realise these co-benefits which would also need to be quantified) has meant that these potential benefits have been discussedqualitatively.
3 Ibid.

Executive summary
PwC | WCS 5 Packaging cost benefit analysis report
Background andgeneral assumptions

Introduction
PwC | WCS 6 Packaging cost benefit analysis report
1. Introduction
Role of this paper
This report presents a range of assumptions and estimates that will underpin a cost benefit analysis (CBA) ofoptions relating to the end of life management of packaging (the results of which are in Chapter 6).
The CBA enables comparison relative to a ‘business as usual’ scenario (the ‘base case’) of the impacts ofproposed options for government intervention to address the problems of packaging. Economic costs andbenefits will be measured from the perspective of society as a whole, and for comparative purposes, wherepossible, they will be monetised and discounted to convert them to their net present value (NPV). To do this,the following key assumptions and estimates are required, and form the content of this report. The keyestimates and assumptions are listed below.
General assumptions – These include the base year of the appraisal (2011), the evaluation period (2011-2035) and the discount rate (7%, real).
Consumption, recycling, landfill and litter projections – Underlying projections (in tonnes) for thelevel of packaging consumption, recycling, landfill and litter nationally are required for each option and thebase case. This is because a number of the costs and benefits will be dependent on the quantity recycled,landfilled or consumed. At times, this will be a key distinguisher between two different options.
Cost assumptions – There could be incremental costs associated with the options for government,households, businesses and the packaging industry:
― Scheme design and implementation: Regulation design / implementation costs, governmentparticipation costs and communications costs
― Collection, transport and recycling: Vehicle Operating Costs (VOCs), In-Vehicle Travel Time(IVT), accumulation time, container deposit redemption time, collection and transport costs, andprocessing costs at Material Recovery Facilities (MRFs)
― Scheme operation: Government costs to administer regulations, scheme administration costs,scheme initiatives and infrastructure, and
― Scheme compliance: Reporting and labelling.
Costs for collection, transport and sorting recycled packaging at a MRF or other recycling business will belinked to recycling projections (i.e. $/tonne). Other cost assumptions are on an annual basis (i.e. $/year)and will differ between the options based on characteristics such as regulation type and responsibility forscheme administration.
Benefit assumptions – There will be benefits and avoided costs with the options which will be quantifiedbased on:
Use values: Use value of resources, avoided regulatory costs, avoided landfill externalities, avoidedoperating costs of landfill and avoided costs of litter clean up, and
Non-use values: Society’s willingness to pay for increased recycling.
A number of other costs and benefits are discussed qualitatively in this report. They are not quantified as part ofthe CBA due to difficulties quantifying them or because they would result in double counting of impacts alreadycaptured. Costs and benefits that have not been quantified include some government participation costs (ie.database set up costs, development of cost recovery statement and the cost of renegotiating contracts), co-benefits, willingness to pay for reduced litter and avoided costs of mixed waste contamination.
The assumptions and parameters, as well as the resulting cost and benefit estimates, should be interpreted withcare as the numbers are indicative not definitive. Sensitivity analysis will be undertaken to illustrate how theeconomic results respond to changes in key assumptions and variables. There is potential to include a numberof assumptions as sensitivity tests and these have been identified in this report. While the impact of changing allof these assumptions will be modelled in the CBA, only those with the largest potential impact on the CBAresults will be presented in Chapter 6.

Introduction
PwC | WCS 7 Packaging cost benefit analysis report
Options to be analysed
As detailed in the Packaging Option Report, the following options for policy change are to be evaluated using aCBA.
Non-regulatory
― Option 1: National Waste Packaging Strategy
Co-regulatory
― Option 2A: Co-regulatory Packaging Stewardship Scheme
― Option 2B: Industry Packaging Scheme
― Option 2C: Extended Packaging Stewardship Scheme
Mandatory
― Option 3: Mandatory Advanced Disposal Fee (ADF)
― Option 4A: Boomerang Alliance Container Deposit Scheme (CDS)
― Option 4B: Hybrid CDS4
It is possible to combine the non-regulatory options (Option 1) with the co-regulatory (Options 2A to 2C) ormandatory options (Options 3 and 4), although this is a more complicated exercise than simply adding the costsand benefits of each option given diminishing marginal returns.
The costs and benefits of these options are compared to a base case which represents the business as usualscenario, defined as a continuation of the Australian Packaging Covenant (APC) under the Used PackagingMaterial National Environment Protection Measure (NEPM).
This CBA Report should be read in conjunction with the Packaging Option Report. The Packaging OptionsReport presents the key features of each option, including coverage, operation and governance. For thepurposes of developing cost and benefit assumptions for the CBA, a number of additional assumptions havebeen made beyond those contained in the Packaging Options Report. These include recycling and litterinitiative years of operation and CDS infrastructure requirements.
Recycling and litter initiatives: years of operation
Table 1 summarises the assumed years for development and commencement of each of the options. Thefollowing sections present the assumed years of operation, broken down into timing for each of the schemeinitiatives. There is a high level of uncertainty relating to the specific initiatives in each option and when theymay practically be implemented. For the purposes of the CBA there is a need to make assumptions relating tothe initiatives to develop recycling, landfill and litter projections.
Common to each option is the assumption of 6-12 months for stakeholder consultation and development of theDecision Regulatory Impact Statement (DRIS). The non-regulatory option (Option 1) is assumed to commencein 2013 as it could take 1 year after the DRIS to develop the National Waste Packaging Strategy. Optionsrequiring the design and implementation of new regulations and a new product stewardship scheme (Options2A, 2B, 2C and 3) are assumed to take an additional 2 years after the DRIS. It should be noted that underSection 108 of the Product Stewardship Act, the Minister has to publish a notice of the list of products to beconsidered for accreditation and regulation in the following financial year (i.e. effectively 12 months notice). Assuch, the earliest introduction could be 30 June 2012.
Options 2A to 4B may require Australian Competition and Consumer Commission (ACCC) authorisation. Theassumed commencement date of these options incorporates the time it may take to develop regulations,establish the Product Stewardship Organisation(s) (PSO) and receive ACCC authorisation. The CDS options
4 PwC and Wright Corporate Strategy (2011) Packaging option report, Draft Version 2, 19 August, prepared for the Environment Protection Heritage
Council, pp 26-45.

Introduction
PwC | WCS 8 Packaging cost benefit analysis report
(Options 4A and 4B) are assumed to commence in 2016, a year later than other options, due to the additionaltime it could take to develop CDS infrastructure.
All options are assumed to commence in the calendar year following the completion of their development.
Table 1 – Option development and commencement timing assumptions
OptionOption development
period Commencement year Note
Option 1 2012-2013 2014 One year to develop the DRIS (2012)
One year to develop a national packaging waste strategy (2013).The strategy could coordinate jurisdictional action that increasesthe recovery of packaging waste and reduces litter with minimaladditional resources and/or funding.
Option 2A 2013-2014 2015 One year to develop the DRIS (2012)
Two years to develop the scheme regulations, establish theProduct Stewardship Organisation(s) (PSOs) approvedarrangements and receive Australian Competition andConsumer Commission (ACCC) authorisation of the PSO(s)(2013-2014)
Option 2B
Option 2C
Option 3
Option 4A 2012-2015 2016 One year to develop the DRIS (2012)
Two years to develop the scheme regulations establish thePSO(s) approved arrangements and receive ACCCauthorisation of the PSOs (2013-2014)
One year to implement the additional infrastructure (2015)
Option 4B
The following peculiarities regarding the development of the options should be acknowledged (although theywill not be directly factored into the CBA):
The Product Stewardship Act is already in existence, which may accelerate the development of the schemeregulations for Options 2A to 2C relative to past experience in similar schemes
Option 3 requires the development of a levy bill, in addition to the scheme regulations, which may defer thecommencement of this option relative to Options 2A to 2C, and
Option 3 needs to comply with World Trade Organisation (WTO) requirements regarding tariffs, which maydefer the commencement of this option.
It should be noted that Option 3 and the CDS options (Options 4A and 4B) are assumed to include a tariff.However, the definition of liable parties under these schemes are assumed to include packaging importers, sonone of the options are expected to affect imported products to a different extent than domestically producedproducts.
There is a significant degree of uncertainty in developing recycling and litter initiatives for each option due tothe relatively short timeframe of planning documents prepared by industry organisations such as the APC5 orthe National Bin Network.6 This is a reflection of the uncertainty regarding future packaging issues that willneed to be targeted by the initiatives and a desire by industry organisations to maintain flexibility to addressproblems as they arise. This is not problematic where initiatives are assumed to be ongoing for the entireappraisal period. However, a number of initiatives may experience diminishing marginal returns prior to theend of this period and new initiatives will need to be implemented.
For the purposes of the CBA, funding for additional initiatives which are yet to be determined has been includedover the period 2021-2035. These initiatives will depend on the relative recycling rates of different materialsand consumption locations, but may include:
5 For example, the current Australian Packaging Covenant Action Plan covers the period July 2010 to June 2015
6 For example, the timeframe proposed by the National Bin Network is 5 years, followed by a review, then a further 5 years.
Introduction
PwC | WCS 9 Packaging cost benefit analysis report
Widespread adoption by states and territories of energy from waste and refuse derived fuel policies. Thesemay provide a platform for initiatives aimed at the manufacture of fuel from plastic and cardboardpackaging residues
Further development of precinct based recycling concepts to capture increased materials includingpackaging from both commercial and industrial (C&I) recycling and laggard domestic recycling precincts
National extension of business recycling programs (as described in Option 2c), and
End market development (as described in Option 2c).
The funding per year assumed for each recycling and litter initiative is presented in Chapter 4 C.
Option 1: National Waste Recycling Strategy
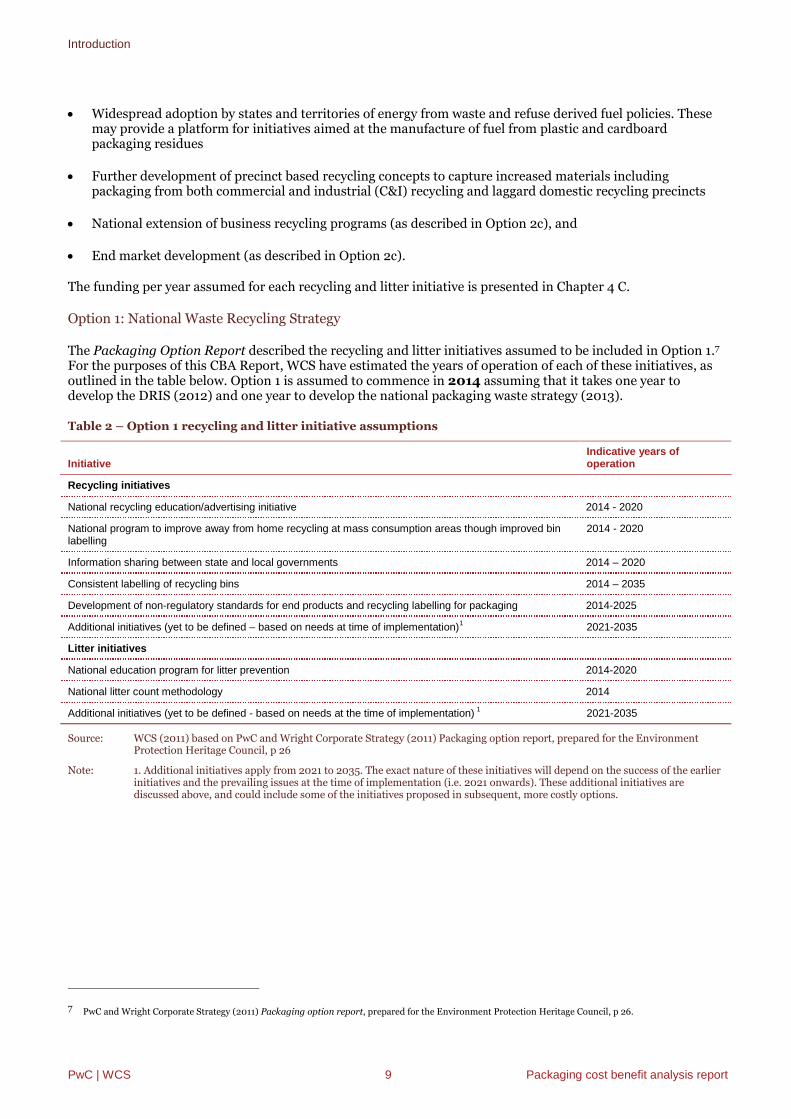
The Packaging Option Report described the recycling and litter initiatives assumed to be included in Option 1.7
For the purposes of this CBA Report, WCS have estimated the years of operation of each of these initiatives, asoutlined in the table below. Option 1 is assumed to commence in 2014 assuming that it takes one year todevelop the DRIS (2012) and one year to develop the national packaging waste strategy (2013).
Table 2 – Option 1 recycling and litter initiative assumptions
InitiativeIndicative years ofoperation
Recycling initiatives
National recycling education/advertising initiative 2014 - 2020
National program to improve away from home recycling at mass consumption areas though improved binlabelling
2014 - 2020
Information sharing between state and local governments 2014 – 2020
Consistent labelling of recycling bins 2014 – 2035
Development of non-regulatory standards for end products and recycling labelling for packaging 2014-2025
Additional initiatives (yet to be defined – based on needs at time of implementation)1 2021-2035
Litter initiatives
National education program for litter prevention 2014-2020
National litter count methodology 2014
Additional initiatives (yet to be defined - based on needs at the time of implementation) 1 2021-2035
Source: WCS (2011) based on PwC and Wright Corporate Strategy (2011) Packaging option report, prepared for the EnvironmentProtection Heritage Council, p 26
Note: 1. Additional initiatives apply from 2021 to 2035. The exact nature of these initiatives will depend on the success of the earlierinitiatives and the prevailing issues at the time of implementation (i.e. 2021 onwards). These additional initiatives arediscussed above, and could include some of the initiatives proposed in subsequent, more costly options.
7 PwC and Wright Corporate Strategy (2011) Packaging option report, prepared for the Environment Protection Heritage Council, p 26.

Introduction
PwC | WCS 10 Packaging cost benefit analysis report
Option 2A: Co-regulatory Product Stewardship
The Packaging Option Report described the recycling and litter initiatives assumed to be included in Option2A.8 For the purposes of this CBA Report, WCS have estimated the years of operation of each of theseinitiatives, as outlined in the table below. Option 2A is assumed to commence in 2015 assuming one year todevelop the DRIS (2012) and two years to develop the scheme regulations and establish the PSO(s) (2013-2014).
Option 2A is assumed to include additional recycling initiatives relative to the base case between 2021-2035.Under the Product Stewardship Act, the regulations are assumed to specify obligations on liable parties,requiring recycling targets to be met. The current APC, a co-regulatory arrangement, has been relativelysuccessful in encouraging participation of companies that market their products in packaging. However, the co-regulatory approach in Option 2A is assumed to be administered by the Commonwealth instead of multipleState and Territory jurisdiction, thereby increasing compliance and enforcement and increasing the number ofliable parties captured by the scheme. The resultant increase in funding could be used for additional initiativesrelative to the base case.
Table 3 – Option 2A recycling and litter initiative assumptions
InitiativeIndicative years ofoperation
Recycling initiatives
As per the base case 2015-2020
Additional initiatives (yet to be defined – based on needs at the time of implementation)1 2021-2035
Litter initiatives
As per the base case 2015-2035
Source: WCS (2011) based on PwC and Wright Corporate Strategy (2011) Packaging option report, prepared for the EnvironmentProtection Heritage Council, p 30
Note: 1. Additional initiatives apply from 2021 to 2035. The exact nature of these initiatives will depend on the success of the earlierinitiatives and the prevailing issues at the time of implementation (i.e. 2021 onwards). These additional initiatives arediscussed above, and could include some of the initiatives proposed in subsequent, more costly options.
Option 2B: Industry Packaging Scheme
The Packaging Option Report described the recycling and litter initiatives assumed to be included in Option2B.9 For the purposes of this CBA Report, WCS have estimated the years of operation of each of theseinitiatives, as outlined in the table below. Option 2B is assumed to commence in 2015 assuming one year todevelop the DRIS (2012) and two years to develop the scheme regulations and establish the PSO(s) (2013-2014).
Table 4 – Option 2B recycling and litter initiative assumptions
InitiativeIndicative years of
operation
Recycling initiatives
Increased public place recycling opportunities 2015-2035
Improved kerbside recycling through campaigns and education programs 2015-2025
Improved kerbside recycling through investment in appropriate bin configurations for communitycircumstances and needs1
2015-2035
Additional initiatives (yet to be defined – based on needs at the time of implementation)2 2026-2035
Improved regional and remote beverage container recovery through organised backload arrangements 2015-2035
8 PwC and Wright Corporate Strategy (2011) Packaging option report, prepared for the Environment Protection Heritage Council, p 30.
9 PwC and Wright Corporate Strategy (2011) Packaging option report, prepared for the Environment Protection Heritage Council, p 32.

Introduction
PwC | WCS 11 Packaging cost benefit analysis report
InitiativeIndicative years of
operation
Litter initiatives
Financial incentives to reduce costs for litter clean-up3 2015-2035
Litter prevention campaigns and education campaigns 2015-2035
Increased funding for litter enforcement4 2015-2035
Source: WCS (2011) based on PwC and Wright Corporate Strategy (2011) Packaging option report, prepared for the EnvironmentProtection Heritage Council, p 26
Note:
1. In the Options Report, this was described as ‘improvements to kerbside recycling to ensure that what is collected is actually useable’
2. Additional initiatives apply from 2026 to 2035. The exact nature of these initiatives will depend on the success of the earlier initiativesand the prevailing issues at the time of implementation (i.e. 2026 onwards). These additional initiatives are discussed above, andcould include some of the initiatives proposed in subsequent, more costly options.
3. This initiative involves providing community organisations with funding for clean up campaigns
4. Funding is assumed to be provided to Local Government (who are currently primarily responsible for litter enforcement at a locallevel) to fund extra resources to enforce anti-litter regulations. This could include empowering parking inspectors or employingCouncil rangers to enforce litter regulations.
It should be noted that Option 2B is essentially an industry proposed scheme. WCS has had considerablediscussion with the industry proponents:
The details of the option as proposed by industry were predominantly accepted by WCS unless otherwisespecified (e.g. start dates were based on time taken for the development of the DRIS, design andimplementation of the regulations and establishment of the PSO(s)).
The design and specification of the option was reviewed by WCS as an independent check on the feasibilityof the recycling level being attained with the scheme. This involved WCS examining, with industry, theproposed deployment of infrastructure and services. WCS formed the view that this option was capable ofmeeting the recycling targets proposed.
The cost estimates put forward by the proponent were reviewed by WCS (as far as possible) as anindependent check on estimated costs. This involved WCS examining, with the industry proponents, thedetailed cost estimates. WCS formed the view that the estimated costs associated with Option 2b werereasonable.
It is recognised that the projections and assumptions of this option, as well as a number of other options, arebased on WCS analysis with significant input from stakeholders such as industry. ABARES recommended that aBayesian network or simple Monte Carlo analysis be conducted to ensure that professional judgements ofstakeholders were robustly integrated. This was not possible within the timeframes and scope of a ConsultationRIS, however may be able to be included in the Decision RIS.
National Bin Network
The development of Option 2B has been informed by the recently proposed National Bin Network10, whichshares a number of similar initiatives, as outlined in the table below. All relevant assumptions of Option 2Bhave been benchmarked against this proposal including costs, recycling rates, period of operation and materialcoverage.
Table 5 - Comparison of Option 2B recycling and litter initiatives and the proposed National Bin Network
Option 2B National Bin Network
Increased public place recycling – 5,000 stainless steel indoorbins/year 2015-2035
Installation of 6,000 public place recycling bins per year for five toten years.
Improved kerbside recycling through campaigns and education Improved kerbside through education and market development,
10 National Bin Network (2011) National Bin Network Plan, October

Introduction
PwC | WCS 12 Packaging cost benefit analysis report
Option 2B National Bin Network
2015-2025 particularly glass. Partner with local government, recycling andwaste organisations to develop initiatives to reduce contamination,stimulate secondary use of materials, collect additional packagingmaterials reduce costs of kerbside recycling
Improved kerbside recycling through investment in appropriate binconfigurations 2015-2035
N/A
Yet to be determined initiatives 2026-2035 N/A
Improved regional and remote beverage container recovery throughback loading
Packaging design improvements – reduction of raw material usage,light weighting and re-engineering
Option 2C: Extended Packaging Stewardship Scheme
The Packaging Option Report described the recycling and litter initiatives assumed to be included in Option2C.11 For the purposes of this CBA Report, WCS have estimated the years of operation of each of theseinitiatives, as outlined in the table below. Option 2C is assumed to commence in 2015 assuming one year todevelop the DRIS (2012) and two years to develop the scheme regulations and establish the PSO(s) (2013-2014).
Table 6 – Option 2C recycling and litter initiative assumptions
Initiative Years of operation
Recycling initiatives1
As per option 2B and: See Table 4
Improved kerbside recycling through national uniformity of bin types and colours and information on materialsaccepted for recycling
2015-2035
National extension of kerbside recycling to SMEs on a commercial basis2 2015-2025
Precinct-based commercial/industrial recycling 2015-2035
National extension of business recycling programs 2015-2035
Extension of recycling opportunities in rural and remote LGAs 2015-2035
End market development support to create new markets 2015-2025
End market development through standard setting for recycled products 2015-2025
Additional initiatives (yet to be defined – based on needs at the time of implementation)3 2026-2035
Litter initiatives
As per Option 2B 2015-2035
Source: WCS (2011) based on PwC and Wright Corporate Strategy (2011) Packaging option report, prepared for the EnvironmentProtection Heritage Council, p 34
Note:
1. The Options Report included an initiative called ‘Special education and advice program’. This has been excluded for the purposes ofthe CBA Report given that Option 2B already includes a similar initiative (‘improved kerbside recycling through campaigns andeducation programs’) and Option 2C subsumes the Option 2B recycling initiatives
2. National extension of kerbside recycling to SMEs: There are currently around 170,000 services provided to businesses by localgovernment on a commercial basis. This initiative aims to fund local government to recruit new SMEs to utilise the service whereaccess is available, in order to extend the number of SMEs undertaking recycling.
3. Additional initiatives apply from 2026 to 2035. The exact nature of these initiatives will depend on the success of the earlier initiativesand the prevailing issues at the time of implementation (i.e. 2026 onwards). These additional initiatives are discussed above, andcould include some of the initiatives proposed in subsequent, more costly options.
11 PwC and Wright Corporate Strategy (2011) Packaging option report, prepared for the Environment Protection Heritage Council, p 34.

Introduction
PwC | WCS 13 Packaging cost benefit analysis report
Option 3: Mandatory Advanced Disposal Fee
The Packaging Option Report described the recycling and litter initiatives assumed to be included in Option3.12 For the purposes of this CBA Report, WCS have estimated the years of operation of each of these initiatives,as outlined in the table below. Option 3 is assumed to commence in 2015 assuming 1 year to develop the DRIS(2012) and 2 years to develop the scheme regulations and establish the PSO(s) (2013-2014).
This option is similar to Option 2C. However, Option 3 is funded by a levy at the point of sale, whereas Option2C is funded from contributions from liable parties. Additionally, the scheme is administered by theCommonwealth Government, who decide appropriate recycling and litter initiatives to meet governmenttargets. For the purposes of the CBA, it has been assumed that:
Total government expenditure on recycling and litter initiatives is the same as Option 2C
The government would decide to fund the same type of recycling and litter initiatives as in Option 2C, and
The levy is designed so that sufficient funds are raised to fund these initiatives.
It is arguable that government may not fund the same types of initiatives as a PSO(s) given that it is not privy tothe same level of industry insight, which could enable industry to efficiently target specific problems as theyarise. In addition, the public sector is not subject to the same commercial pressure to drive down costs. As such,there may be higher costs for Option 3 to reach the same level of recycling as Option 2C or the same level ofexpenditure may not achieve the same outcomes. However, the relative cost-effectiveness of Options 2c and 3will depend on the detailed institutional designs adopted. There are incentives for private manufacturing firmsto minimise packaging costs but the incentives faced by the new institutions, whether a PSO or public sectorauthority set up for this purpose, which would be designed to also account for packaging externalities and othersources of market failure, have not been detailed. A PSO may have incentives to minimally satisfy objectives toincrease recycling.
General sensitivity testing regarding the impact of increasing and decreasing costs and benefits by 30% willinform whether these assumptions are fundamental to the CBA results of this option.
Table 7 – Option 3 recycling and litter initiative assumptions
Initiative Years of operation
Recycling initiatives
As per option 2C See Table 4
Litter initiatives
As per option 2C See Table 4
Source: WCS (2011) based on PwC and Wright Corporate Strategy (2011) Packaging option report, prepared for the EnvironmentProtection Heritage Council, p 37
Options 4A and 4B: Container deposit schemes
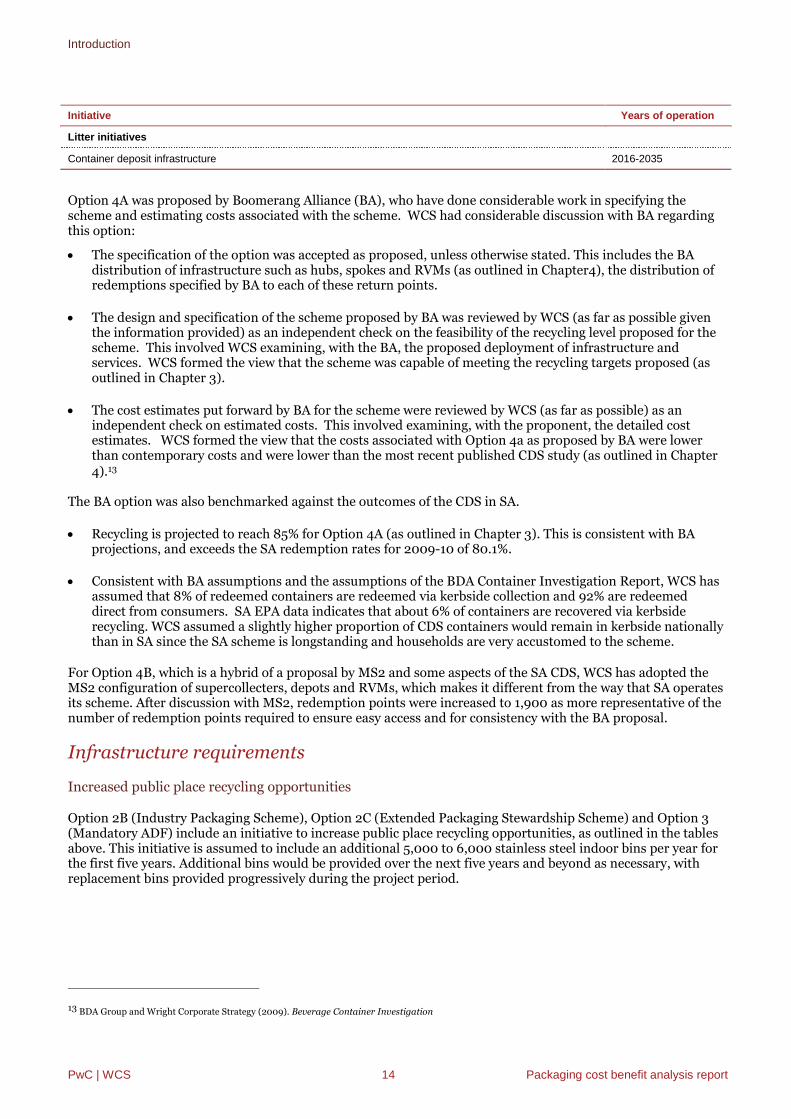
There are no recycling and litter initiatives included in Opti0ns 4A and 4B. However, CDS infrastructure isassumed to operate from 2016-2035. This is assumed to increase beverage container recycling and leave lesspackaging available to be littered.
Table 8 – Option 4A and 4B recycling and litter initiative assumptions
Initiative Years of operation
Recycling initiatives
Container deposit infrastructure 2016-2035
12 PwC and Wright Corporate Strategy (2011) Packaging option report, Draft Version 2, 19 August, prepared for the Environment Protection Heritage
Council, p 37.
Introduction
PwC | WCS 14 Packaging cost benefit analysis report
Initiative Years of operation
Litter initiatives
Container deposit infrastructure 2016-2035
Option 4A was proposed by Boomerang Alliance (BA), who have done considerable work in specifying thescheme and estimating costs associated with the scheme. WCS had considerable discussion with BA regardingthis option:
The specification of the option was accepted as proposed, unless otherwise stated. This includes the BAdistribution of infrastructure such as hubs, spokes and RVMs (as outlined in Chapter4), the distribution ofredemptions specified by BA to each of these return points.
The design and specification of the scheme proposed by BA was reviewed by WCS (as far as possible giventhe information provided) as an independent check on the feasibility of the recycling level proposed for thescheme. This involved WCS examining, with the BA, the proposed deployment of infrastructure andservices. WCS formed the view that the scheme was capable of meeting the recycling targets proposed (asoutlined in Chapter 3).
The cost estimates put forward by BA for the scheme were reviewed by WCS (as far as possible) as anindependent check on estimated costs. This involved examining, with the proponent, the detailed costestimates. WCS formed the view that the costs associated with Option 4a as proposed by BA were lowerthan contemporary costs and were lower than the most recent published CDS study (as outlined in Chapter4).13
The BA option was also benchmarked against the outcomes of the CDS in SA.
Recycling is projected to reach 85% for Option 4A (as outlined in Chapter 3). This is consistent with BAprojections, and exceeds the SA redemption rates for 2009-10 of 80.1%.
Consistent with BA assumptions and the assumptions of the BDA Container Investigation Report, WCS hasassumed that 8% of redeemed containers are redeemed via kerbside collection and 92% are redeemeddirect from consumers. SA EPA data indicates that about 6% of containers are recovered via kerbsiderecycling. WCS assumed a slightly higher proportion of CDS containers would remain in kerbside nationallythan in SA since the SA scheme is longstanding and households are very accustomed to the scheme.
For Option 4B, which is a hybrid of a proposal by MS2 and some aspects of the SA CDS, WCS has adopted theMS2 configuration of supercollecters, depots and RVMs, which makes it different from the way that SA operatesits scheme. After discussion with MS2, redemption points were increased to 1,900 as more representative of thenumber of redemption points required to ensure easy access and for consistency with the BA proposal.
Infrastructure requirements
Increased public place recycling opportunities
Option 2B (Industry Packaging Scheme), Option 2C (Extended Packaging Stewardship Scheme) and Option 3(Mandatory ADF) include an initiative to increase public place recycling opportunities, as outlined in the tablesabove. This initiative is assumed to include an additional 5,000 to 6,000 stainless steel indoor bins per year forthe first five years. Additional bins would be provided over the next five years and beyond as necessary, withreplacement bins provided progressively during the project period.
13 BDA Group and Wright Corporate Strategy (2009). Beverage Container Investigation

Introduction
PwC | WCS 15 Packaging cost benefit analysis report
Container deposit schemes
Option 4A: Boomerang Alliance CDS
The Packaging Option Report specified the number of hubs, collection centres and reverse vending machines(RVMs). For the purposes of this CBA Report, WCS have assumed that an additional 700 rural and remotecollection centres will be required based on consultation with BA.
Table 9: Option 4A infrastructure requirements
Infrastructure type Number Source
Hubs 250 Consultation with Boomerang Alliance
Collection depots (spokes) 310 Consultation with BA
RVMs (spokes) 640 Consultation with BA
Rural/remote collection centres (spokes) 700 Consultation with BA
Total 1900
Source: WCS (2011) based on PwC and Wright Corporate Strategy (2011) Packaging option report, prepared for the EnvironmentProtection Heritage Council, p 40
Option 4B: Hybrid CDS
The Packaging Option Report suggested that there could be 850 depots nationally. Based on discussions withM2S and considering the SA CDS depot configuration, it has been assumed that there will be 250 consolidationdepots, 600 collection depots, 350 RVMs and 700 rural and remote collection centres.
Table 10: Option 4B Infrastructure Requirements
Infrastructure type Number Source
Consolidation depots 250 Packaging Option Report: Approximately 850 depots are assumed to beprovided nationally.
Collection depots 600
RVMs 350
Rural/remote collection centres 700
Total 1900
Source: WCS (2011) based on discussions with M2S and the South Australian CDS depot configuration
It is recognised that having 1,900 deposit locations across Australia will lead to a higher level of depositlocations per capita than SA currently has. This number of redemption points is considered by both BA andWCS to be appropriate for a national CDS striving for a high level of beverage container returns through ease ofaccess.
The CDS proposed by BA (Option 4A) also differs from the SA model in that there is an increased focus onproviding RVMs at convenient locations such as shopping centres as opposed to collection depots. Similarly,Option 4B is assumed to include a relatively higher proportion of ‘shop front’ style collection centres. Thesedifferences will have implications for CBA assumptions based on the SA experience.

PwC | WCS 16 Packaging cost benefit analysis report
2. General assumptions
A set of general assumptions have been outlined to guide development of the CBA. These are used to ensure thecosts and benefits of each option are measured in a comparable manner. These are assumed across all theoptions.
Incremental basis – Based on the Australian Government’s Best Practice Regulation Handbook alloption costs and benefits are measured incrementally relative to the base case. This enables assessmentof the potential impact on society relative to the status quo scenario.14
Base year of the appraisal – 2011. This is a practical assumption given that information collected oncosts is from 2011, and projections have been developed on underlying consumption data to represent2011 as the base year. All monetised values are expressed in 2011 dollars unless otherwise stated. Allyears are calendar years unless otherwise stated.
Evaluation period – 2011 to 2035. The Best Practice Regulation Handbook states that ‘[t]he totalperiod [of evaluation] needs to be long enough to capture all potential costs and benefits of the proposal’and provides guidance that, ‘[in] view of the difficulty of forecasting costs and benefits over long periods,exercise caution when adopting an evaluation period longer than…20 years’.15 Accordingly, an evaluationperiod allowing for an operational period of 20 years for the latest to commence options (Option 4A and4B) is applied in the CBA.16 All options are evaluated over the period 2011-2035.
Real discount rate – 7% real. All future cost and benefit cashflows will be discounted to 2011 dollarsusing a real discount rate of 7% in line with the requirements of the Best Practice Regulation Handbook,which also recommends sensitivity testing using 3% and 10% discount rates.17
As the CBA is being prepared in line with the requirements of the Australian Government Office of BestPractice Regulation (OBPR), the general assumptions have been selected based on the Best PracticeRegulation Handbook. However, lower discount rates are often advocated in cases of very long-termprojects with impacts lasting for more than one generation, such as those addressing climate change andother environmental problems. This is because higher discount rates result in relatively less weight beinggiven to benefits accruing further into the future and lower discount rates give relatively more weight tobenefits accruing further in the future. For example:
The US Environmental Protection Agency recommends that for intergenerational discounting, a rateof 2%-3% be used, with sensitivity analysis of alternative discount rates in the range of 2%-3% as wellas at 7% (the requirement of the Office of Management and Budget).18
In 2003 the United Kingdom (UK) Treasury changed its discount rate approach from a producer rateof 6%19 to a consumer rate of 3.5% (based on a social time preference rate considering consumer’sutility of consumption over time).20 This appears to reflect a policy decision to give more weight tolonger term benefits in projects with intergenerational impacts. A hyperbolic discount rate is alsoapplied.
In the Garnaut Climate Change Review, which projected the impacts of climate change out to 2100,
14 Australian Government (2010) Best Practice Regulation Handbook, p 62.
15 Australian Government (2010) Best Practice Regulation Handbook, p 63.
16 The first full years of benefits of 2014/15 corresponds to the latest commencement date of all the options (relating to Options 4A and 4B) to ensure
comparability between the options. For further detail, see Table 1.
17 Australian Government (2010) Best Practice Regulation Handbook, p 66.
18 Zhuang, Liang, Lin and De Guzman (2007) Theory and Practice in the Choice of Social Discount Rate for Cost-Benefit Analysis: A Survey, AsianDevelopment Bank, May, p 6
19 Sources have suggested this rate was equal to the UK Government’s estimated cost of capital. See Abu Dhabi Department of Transport, STMP Discount Ratefor Economic Appraisal, available at<http://www.dot.abudhabi.ae/download.do?loc=stmp/3%20Technical%20Notes/&file=TN26%20Discount%20Rate%20for%20Economic%20Appraisal.pdf>, accessed 22 May 2011
20 Evans (2006) Social Discount Rated for the European Union, Milan European Economy Workshops, Working Paper 2006-20, p 2

General assumptions
PwC | WCS 17 Packaging cost benefit analysis report
discount rates of 1.35% and 2.65% were used.21
In addition to the Australian Government requirements to apply a core discount rate of 7%, with sensitivitytesting of 3% and 10% discount rates, a sensitivity test of a discount rate of 1.35% will be conducted. This rate of1.35% corresponds to the lower bound in the Garnaut Climate Change Review.
Table 11: Summary of general CBA assumptions
Assumption Value Source
Base year 2011
Values June 2011
Evaluation period 2011 to 2035 Operational period of 20 years for the latest to commence option.Best Practice Regulation Handbook, p 63
Discount rate Core: 7%
Sensitivity:1.35%,3%, 10%
Best Practice Regulation Handbook, p 66
Garnaut Climate Change Review
21 Garnaut (2008) The Garnaut Climate Change Review, Chapter 1: A decision-making framework, p 19

Consumption, recycling, landfill and litter projections
PwC | WCS 18 Packaging cost benefit analysis report
3. Consumption, recycling, landfill and litter projections
Introduction
Underlying projections (in tonnes) for the level of packaging consumption, recycling, landfill and litternationally are required for each option and the base case. This is because a number of the costs and benefitsthat will be dependent on the quantity of packaging that is recycled, landfilled or consumed. At times, this willbe a key distinguisher between two different options. The projections below have been prepared by WCS takinginto consideration stakeholder consultation and feedback provided by the SCEWWG and Packaging WasteSOOG.
Projected consumption trends
An estimate of the future consumption of packaging in Australia was required to understand the size of thepackaging sector over time. Estimates of packaging consumption directly relate to the quantities of packagingthat are recycled, landfilled or littered. The projections capture key trends that could affect tonnages in differentpackaging types or materials used to manufacture packaging. Packaging consumption projections arethe same for all options.
Historic packaging consumption growth (2003-2010)
The packaging consumption projections are based on population projections and historical packagingconsumption growth rates. As shown on the below table, growth in terms of packaging consumed per annumhas historically been slower than overall population growth (2003-2010).
Table 12 – A comparison of historic population and packaging consumption growth rates
AssumptionCompoundannual growth Notes
Population growth 1.66% Historic population growth (2003- 2010) was sourced from the Australian Bureau ofStatistics (ABS)22.
Packaging consumptiongrowth 0.84% Historic packaging consumption growth (2003-2010) was sourced from the NPC
Annual Report23. The APC collects consumption data from packagingmanufacturers and packaging industry organisations.24
Relative growth(packaging:population) 0.51:1 Tonnes consumed has grown at around half the rate of population growth (a ratio
of 0.51:1).
Projected packaging consumption growth (2011-2035)
It has been assumed that there will be a slight reduction in the ratio of consumption to population to reflectlight weighting of packaging material (which will decrease the tonnes of packaging produced). It should benoted that although it is not quantified, the co-regulation and ADF options would ideally be designed to providedynamic incentives for reductions in the total social costs of packaging which would likely reduce packagingintensity. This may also affect the composition of packaging with a possible shift towards more-recyclable andbiodegradable/packaging.
22 Australian Bureau of Statistics (2011) Australian Demographic Statistics, Dec 2010, Table 4: Estimated resident population, States and territories;Australian Bureau of Statistics (2011) Australian Demographic Statistics, Dec 2006, Table 3: Estimated resident population, States and territories
23 Australian Packaging Covenant (2011) The National packaging Covenant – 2010, Annual Report, p 11
24 For detail on the methods of data collection, see National Packaging Covenant Council (2009) Packaging Data Collection Methodologies

Consumption, recycling, landfill and litter projections
PwC | WCS 19 Packaging cost benefit analysis report
Table 13 – Summary of packaging consumption growth assumptions
Time periodPopulation growth (%)
Consumption tonnage growth(%)
Ratio (population growth :consumption growth)
2003-2010 1.66 0.84 0.51:1
2011-2015 1.47 0.75 0.51:1
2016-2020 1.47 0.73 0.50:0
2020-2030 1.28 0.63 0.49:1
2031-2035 1.11 0.54 0.49:1
Source: Australian Government (2010) Australia to 2050: future challenges, the 2010 intergenerational report: overview, p 5Note:
1. Percentages presented for population and consumption tonnage growth represent compound annual growth rates2. The 2010 Intergeneration Report estimates that the Australian population will grow from 22.2 million in 2010 to 30.9 million in
2035.
The figure below presents projections of the total tonnes of package consumed per annum. Total consumptionis forecast to grow from the current 4.4 million in 2010 to 5.2 million in 2035, at a CAGR of 0.65% per annum.
Figure 1 – Historical tonnes of packaging consumed (2003-2009) and projections of total tonnesconsumed (2010-2035)
Source: Table 13
Material composition
The 2010 distribution of total consumption by material, as presented in the figure below, is assumed to remainconstant over time. This is consistent with historic observations by the APC (noting a relatively small increase inglass consumption and a relatively small decrease for plastics). It should be noted that this assumption isexpected to have a minimal impact on the results of the CBA given that the cost and benefit parameterspredominantly apply to the total weight of packaging and do not distinguish between packaging materials. Theexception is the benefit of the market value of resources, for which a unique approach has been developed inChapter 5 and Appendix F.
The APC notes that there have been recent developments in plastic packaging technology, materials and design,as well as processing infrastructure and these are likely to impact on future trends for plastic consumption
CAGR(2003-2010)
0.84%
CAGR(2010-2035)
0.65%
4,000,000
4,200,000
4,400,000
4,600,000
4,800,000
5,000,000
5,200,000
5,400,000
To
tal
pa
ck
ag
ing
co
ns
um
pti
on
(to
nn
es
)

Consumption, recycling, landfill and litter projections
PwC | WCS 20 Packaging cost benefit analysis report
tonnes.25 The trends identified by the APC include:
Light weighting
Multi layer plastics (primarily films)
Gradual shift from rigid plastics to flexible pouches and sachets
An increase in single serve packs
The costs and purchase prices associated with plastic recyclates26, and
Changes in plastic processing.
Figure 2 – Proportion of total packaging consumption by material: 2003-2010 (tonnes)
Source: National Packaging Covenant Annual Reports, various years
Product composition
WCS estimates of the future distribution of total consumption (tonnes) by product type (non-beveragecontainers, beverage containers and flexible packaging) are stable and are not assumed to change over time.
Consumption location
The split of consumption by location (at-home versus away-from-home) is not assumed to change over time.
Impact of prices
The costs of the options may be passed on to consumers in the form of higher prices. This is particularly thecase for Option 3 (where an ADF is levied on all packaging) and the CDS options (Options 4A and 4B-whichimpose a deposit on beverage containers). Increased costs associated with the co-regulatory options are alsoexpected to be passed on to some extent. This may suppress consumption of packaging, although the extent towhich this occurs will depend on the elasticity of demand with respect to price. Estimating such an elasticity is
25 Australian Packaging Covenant (2011) The National packaging Covenant – 2010, Annual Report, p 13
26 Recyclate is recycled packaging material that has been collected, sorted and prepared (e.g. by removing contaminants) for incorporation into a new product
(not necessarily packaging).
59.3% 58.5%60.0%
58.6%
22.3% 23.0%25.0%
15.3% 16.0%13.3% 14.5%
12.4%
2.0% 3.0%
1.1% 1.1%0%
10%
20%
30%
40%
50%
60%
70%
2003 2004 2005 2006 2007 2008 2009 2010
%o
fto
tal
co
ns
um
pti
on
Paper/Cardboard Glass Plastics
Steel cans Aluminium cans
% change
-0.8%
+2.7%
-3.0%
+1.0%
0.0%

Consumption, recycling, landfill and litter projections
PwC | WCS 21 Packaging cost benefit analysis report
beyond the scope of the CRIS, so this impact has not been included in the consumption projections.
Some Options could have scope to target reducing consumption as well as increasing recycling. For example,Option 1 and 2 could include initiatives to reduce excess packaging, such as standards for packaging design.Such initiatives could likely lead to a reduction in tonnes of packaging consumed. As the options have beendesigned they do not include such initiatives and therefore, consumption under each option is assumed to be inline with the base case. In the design of the co-regulatory and mandatory options the incentives created by anylevies or fees would need to be carefully considered.
Although it is not quantified, the co-regulation and ADF options (Option 2 and 3) would ideally be designed toprovide dynamic incentives for reductions in the total social costs of packaging which would likely reducepackaging intensity. This may also affect the composition of packaging with a possible shift towards more-recyclable and or biodegradable/packaging.
Projected recycling trends
Recycling is a multi-step activity in which post-consumer products are recovered and sorted to material type.The recyclate is then sold to the manufacturers of feedstock for new products. The recycling supply chains forhousehold kerbside collection, C&I sector recycling and CDS are described in more detail in Appendix A.
Recycling projections were developed by WCS for each option by consumption location (at-home versus away-from-home) and for each product type (beverage containers, non-beverage containers) based on:
The initiatives identified in Chapter 1
Packaging industry plans and targets
Experience in other jurisdictions
The assumption that the maximum recycling rate by product or material is 90%27, and
The assumption of a continuing, stable level of funding for initiatives appropriate to each option.
The initiatives targeting current packaging issues are assumed to be over a period of 5 to 15 years. However, itis difficult to predict future packaging issues and initiatives beyond 2015 given the relatively short term natureof existing planning documents. Therefore it is considered inappropriate to nominate specific initiatives forcontinued funding beyond the initial 5 to 15 years. Funding has been allocated for initiatives that could beintroduced in the future, which may include:
Widespread adoption by the States and Territories of broad energy from waste and refuse derived fuelpolicies
Further development of precinct based recycling concepts to capture increased materials includingpackaging from C&I recycling
National extension of business recycling programs (as described in Option 2C), and
End market development, particularly for glass (as described in Option 2C).
Forecast recycling rates for each option were developed on a five-year basis and projections were interpolatedbetween these periods. The overall recycling rate for each option was built up from the assumed home andaway- from-home recycling rates estimated for each of the main product types. Consideration was given to thetypes of products/materials targeted by the option and the likely yield of the initiatives assumed to be includedin the option given their proposed funding allocation, to ensure that the relative recycling rates of the optionsmatched expectations based on these assumptions.
27 PwC and Wright Corporate Strategy (2011) Problem statement for packaging, prepared for the Environment Protection and Heritage Council, p 36
Consumption, recycling, landfill and litter projections
PwC | WCS 22 Packaging cost benefit analysis report
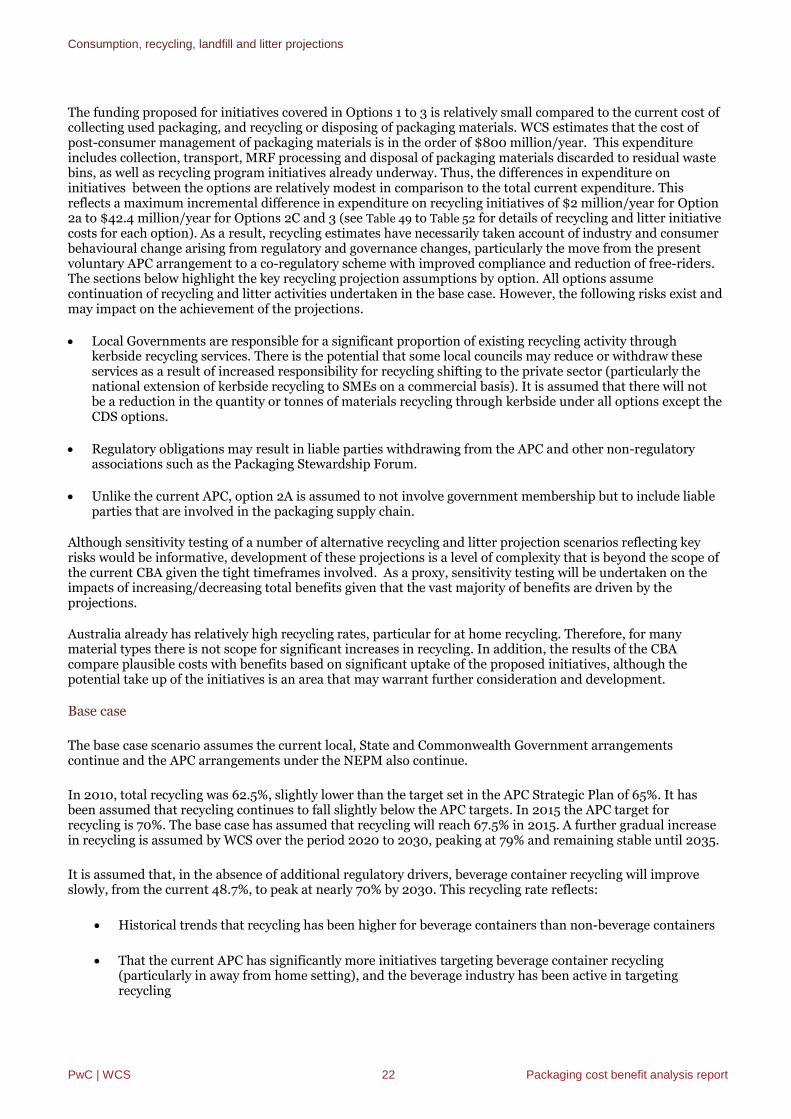
The funding proposed for initiatives covered in Options 1 to 3 is relatively small compared to the current cost ofcollecting used packaging, and recycling or disposing of packaging materials. WCS estimates that the cost ofpost-consumer management of packaging materials is in the order of $800 million/year. This expenditureincludes collection, transport, MRF processing and disposal of packaging materials discarded to residual wastebins, as well as recycling program initiatives already underway. Thus, the differences in expenditure oninitiatives between the options are relatively modest in comparison to the total current expenditure. Thisreflects a maximum incremental difference in expenditure on recycling initiatives of $2 million/year for Option2a to $42.4 million/year for Options 2C and 3 (see Table 49 to Table 52 for details of recycling and litter initiativecosts for each option). As a result, recycling estimates have necessarily taken account of industry and consumerbehavioural change arising from regulatory and governance changes, particularly the move from the presentvoluntary APC arrangement to a co-regulatory scheme with improved compliance and reduction of free-riders.The sections below highlight the key recycling projection assumptions by option. All options assumecontinuation of recycling and litter activities undertaken in the base case. However, the following risks exist andmay impact on the achievement of the projections.
Local Governments are responsible for a significant proportion of existing recycling activity throughkerbside recycling services. There is the potential that some local councils may reduce or withdraw theseservices as a result of increased responsibility for recycling shifting to the private sector (particularly thenational extension of kerbside recycling to SMEs on a commercial basis). It is assumed that there will notbe a reduction in the quantity or tonnes of materials recycling through kerbside under all options except theCDS options.
Regulatory obligations may result in liable parties withdrawing from the APC and other non-regulatoryassociations such as the Packaging Stewardship Forum.
Unlike the current APC, option 2A is assumed to not involve government membership but to include liableparties that are involved in the packaging supply chain.
Although sensitivity testing of a number of alternative recycling and litter projection scenarios reflecting keyrisks would be informative, development of these projections is a level of complexity that is beyond the scope ofthe current CBA given the tight timeframes involved. As a proxy, sensitivity testing will be undertaken on theimpacts of increasing/decreasing total benefits given that the vast majority of benefits are driven by theprojections.
Australia already has relatively high recycling rates, particular for at home recycling. Therefore, for manymaterial types there is not scope for significant increases in recycling. In addition, the results of the CBAcompare plausible costs with benefits based on significant uptake of the proposed initiatives, although thepotential take up of the initiatives is an area that may warrant further consideration and development.
Base case
The base case scenario assumes the current local, State and Commonwealth Government arrangementscontinue and the APC arrangements under the NEPM also continue.
In 2010, total recycling was 62.5%, slightly lower than the target set in the APC Strategic Plan of 65%. It hasbeen assumed that recycling continues to fall slightly below the APC targets. In 2015 the APC target forrecycling is 70%. The base case has assumed that recycling will reach 67.5% in 2015. A further gradual increasein recycling is assumed by WCS over the period 2020 to 2030, peaking at 79% and remaining stable until 2035.
It is assumed that, in the absence of additional regulatory drivers, beverage container recycling will improveslowly, from the current 48.7%, to peak at nearly 70% by 2030. This recycling rate reflects:
Historical trends that recycling has been higher for beverage containers than non-beverage containers
That the current APC has significantly more initiatives targeting beverage container recycling(particularly in away from home setting), and the beverage industry has been active in targetingrecycling

Consumption, recycling, landfill and litter projections
PwC | WCS 23 Packaging cost benefit analysis report
That SA and NT have already implemented their own CDS scheme which should increase beveragecontainer recycling.
This means that the CDS in SA and NT have been taken into account in the national projections of recycling.
It is assumed that non-beverage container recycling will increase slowly from the current estimated 40.2% to50% by 2025. This is due to improved community motivation and information on recycling of non-beveragecontainers. It is assumed that non-beverage container recycling will remain lower than beverage containerrecycling as the APC does not have any initiatives that specifically target non-beverage containers. However, itis assumed that the general recycling initiatives of the APC would lead to an improvement in non-beveragecontainer recycling.
It is assumed that the already relatively high rate of flexible packaging recycling will increase gradually from70.2% to almost 86% by 2030 based on the market demand for used cardboard as feedstock and an expectedfuture reduction of composite packaging. As mentioned above, it is assumed that recycling cannot exceed 90%.
Option 1 – National Packaging Waste Strategy
This non-regulatory option is based on the development and implementation of a national packaging wastestrategy. The strategy will coordinate jurisdictional actions relating to packaging waste. It is envisioned that thestrategy will focus on improved use of current infrastructure through increased knowledge, education andinformation sharing. It is assumed that there is no additional capital expenditure.
The National Packaging Waste Strategy is assumed to commence in 2014, taking 1 year to develop the DRIS(2012) and a further year to develop the strategy (2013).
The Option 1 scenario is based on recycling increasing at a slightly more rapid rate than the base case, withnearly 69% recycling or 3,16 million tonnes reached by 2015.
The increased rate of beverage container recycling is assumed to be slightly more rapid than in the base case.This is due to the coordinated and targeted initiatives, to reach 0.86 million tonnes or 70% by 2025 and0.95 million tonnes or 75% by 2030, with this recycling rate maintained to 2035. It is assumed that non-beverage container recycling will grow to 0.19 million tonnes or 50% or by 2020, slightly ahead of the base case,as a result of improved funding for recycling education and the development and notification of a nationalstandard for acceptable recycling materials. It is assumed that recycling of flexible packaging will increaseslightly ahead of the base case to reach 87% or 2.96 million tonnes by 2030, remaining at this level to 2035.
Option 2A – Co-regulatory Packaging Stewardship
Under 2A the current APC and National Environment Protection Measures (NEPM) arrangements wouldtransition under the co-regulatory provisions of the Product Stewardship Act. This option is designed tomaintain a similar level of industry commitment under current APC arrangements and targets packaging ‘brandowners’ as the liable parties. This would mean some change to the current arrangement and involve enforceabletargets based on overall achievement of targets identified in the APC Strategic Plan 2010-2015.
Liable parties under Option 2A would be consumer packaging brand owners (based on the NEPM definitions of‘consumer packaging’ and ‘brand owner’). As the Act only applies to constitutional corporations, state, territoryand local governments would not be able to join an approved arrangement. However, these parties wouldcontinue to contribute to the national packaging recycling and litter rates.
The scheme is assumed to commence in 2015 assuming 1 year to develop the DRIS (2012) and 2 years to designand implement the scheme regulations and establish the PSO(s) (2013-2014).
Under this option, recycling rates could increase at a slightly faster pace than in the base case, with a 75%recycling rate (3.59 million tonnes) achieved by 2020. The slightly increased recycling rate is due to thepotential for more set recycling targets under the Product Stewardship Act 2011, as well as greaterindustry/PSO responsibility, likely to result in a slight improvement in outcomes. The current APC has been

Consumption, recycling, landfill and litter projections
PwC | WCS 24 Packaging cost benefit analysis report
relatively successful in encouraging participation of companies that market their products in packaging. TheAPC has advised that the Covenant currently captures 90% of tonnage and 80% of brands.28 The co-regulatoryapproach in Option 2A is administered by the Commonwealth alone unlike the current APC which isadministered under the various State and Territory legislations. Having one national regulatory frameworkcould lead to more parties joining the covenant and liable parties preparing more robust Action Plans, as well asgreater compliance in achieving the outcomes in these Action Plans. This would result in improved recyclingoutcomes compared to the base case and Option 1 (a National Strategy not underpinned by regulation).
The industry stakeholders agreed that having one national regulatory framework could provide higher recyclingrates than in the base case. However, the difference in recycling rates may be small as the APC increases itsmembership over time.29
To capture the impact of increased participation and compliance, overall recycling was increased by 4%(=(65%-62.5%)/62.5%) relative to the base case in 2020, reflecting the difference between industry targets andactual recycling levels in 2010, as discussed above. However, over time the difference between the base caseand Option 2A is expected to reduce as the APC increases membership based on advice from State Governmentagencies regarding brands that have not become signatories to the Covenant. As such, the increase relative tothe base case is assumed to decrease to 3% by 2025 and 3% by 2030 (continuing until 2035).
The pace of increase in beverage container recycling is assumed to be more rapid than in the base case, withbeverage container recycling reaching 70% or 0.86 million tonnes by 2025, and 75% or 0.95 million tonnes by2030, with this recycling rate maintained to 2035. As described above, this is considered by WCS to be aprobable maximum beverage container recycling rate in the absence of financial incentives for beverageconsumers and/or development of alternative markets for used packaging materials.
It is assumed that non-beverage container recycling will increase to 50% or 0.19 million tonnes by 2020,slightly ahead of the base case but in line with Option 1. It is assumed that the co-regulatory approach will alsoserve to increase the rate of flexible packaging recycling slightly more rapidly than in Option 1, to reach 86% or2.84 million tonnes by 2025.
Option 2B – Industry Packaging Stewardship Scheme
Option 2B has been proposed by industry and is based on the development of a new product stewardshipscheme to tackle specific problem issues including (in the first five year period) beverage container recyclingand litter prevention. The APC suggests that this scheme could commence within 1 year of agreement.30
This Option builds on Option 2A and includes an enhanced focus on away-from-home beverage containerrecycling and packaging litter reduction. It deals with all packaging materials, but with targeted initiatives onbeverage containers and glass market development.
It is based on the National Bin Network proposal made by members of the packaging industry to expand theexisting APC to focus on key problem areas. The focus of these additional initiatives is on away from homerecycling through national bin rollout in public places and other initiatives to improve recovery and recycling ofbeverage containers, particularly of glass, PET and aluminium, consumed away-from home. In regard toreduced litter, the focus is on impacts from all types of packaging, of all material types including fast-foodpackaging, confectionary packaging, cigarette packaging and beverage packaging.
As per Option 2A, Option 2B involves transitioning the current APC and NEPM arrangements under the co-regulatory provisions of the Product Stewardship Act. However, the regulations would specify higher outcometargets for the product class of beverage packaging, consistent with this part of the industry undertakingadditional actions and in specific problem areas related to take on away-from-home beverage containerrecycling and packaging litter. In addition, the litter reduction outcomes would be strengthened.
The scheme is assumed to commence in 2015 assuming 1 year to develop the DRIS (2012) and 2 years to designand implement the scheme regulations and establish the PSO(s) (2013-2014). Given the preliminary focus of
28 Australian Packaging Covenant (2011) Personal communication, 24 October 2011.
29 Australian Packaging Covenant (2011) Personal communication, 24 October 2011.
30 Based on discussions with the proponent, Alec Wagstaff, July 2011.

Consumption, recycling, landfill and litter projections
PwC | WCS 25 Packaging cost benefit analysis report
this option and the additional funding, the pace of increase in beverage container recycling can be expected tobe more rapid than in the base case and Options 1 and 2A.
Given the focus of this option, the pace of increase in beverage container recycling can be expected to be morerapid than in the Base Case and Options 1 and 2A. WCS accepted the industry claim of 70% beverage containerrecycling after five years of operation (significantly in excess of options discussed above). In the circumstances,a 70% beverage container recycling rate by 2020 (0.83 million tonnes) is assumed, increasing to 80% (0.98million tonnes) by 2025 and stabilising at 80% to 2035.
As a result of the proposed early increase in beverage container recycling, the overall ramp-up of recycling isslightly more rapid than option 2a, with the 77% recycling (3.68 million tonnes) by 2020, 82% by 2025 and 81%maintained to 2035.
It is assumed that non-beverage container recycling will increase to 50% or 0.19 million tonnes by 2020 and theflexible packaging will increase t0 2.84 million tonnes or 86% by 2025. This is consistent with Option 2A.
These recycling rates are similar to those proposed by the industry proponents of this option (70% within 5years of introduction and 80% within 10 years). These recycling rates were considered broadly reasonable dueto the initiatives included in this option and their probable recycling yields. In order to be conservative, it hasbeen assumed that these recycling rates are achieved slightly later than the industry proponents have assumed.
Option 2C – Extended Packaging Stewardship Scheme
Option 2C is based on a co-regulatory approach, with the APC being regulated under the Product StewardshipAct. It is assumed that this option will have significantly greater industry funding than Option 2B and therefore,could involve a significant increase in recycling litter initiatives. Initiatives are assumed to cover development ofinfrastructure, end markets, practices, and education for improved recycling. The scheme focuses on improvingthe recycling performance of all packaging, with a focus on recycling and litter where there are identifiedproblems areas such as lagging recycling rates. It has more ambitious recycling outcome targets for the broaderpackaging industry than option 2b. It involves substantially increased funding and industry action to achieve astep change in packaging recovery and litter reduction.
With Option 2A and 2B, the approved arrangement(s) would have the flexibility to achieve specified outcomes.The outcomes set in the regulations would focus a broad range of barriers to increased packaging recycling andlitter reduction, determined on the basis of the analysis of key problem areas. It is likely that this option mayinvolve additional support for local government kerbside collection and litter cleanup activities.
This option has been developed to build on the outcomes identified for option 2b and hence is implicitly basedon target commitments identified in the APC Strategic Plan 2010-2015.
The scheme is assumed to commence in 2015 assuming 1 year to develop the DRIS (2012) and 2 years to designand implement the scheme regulations and establish the PSO(s) (2013-2014). Due to the co-regulatoryapproach and the substantial funding, it is assumed that this option would result in a recycling rate greater thanthe previous options and would reach 83% recycling by 2025. This recycling rate could also be achieved due toconsiderable end market development, particularly for glass and composites.
As a result of the early increase in beverage container recycling (assumed to be 0.86 million tonnes or 72% in2020), the overall increase in recycling is significantly more rapid than the base case, with an 83% recyclingrate or 4.09 million tonnes of recycling achieved by 2025.
It is assumed that non-beverage container recycling will increase to 0.24 million tonnes or 60% by 2025 andflexible packaging recycling will increase to 87.1% or 2.87 million tonnes by 2025.
This option results in significantly greater recycling outcomes than previous options for both beveragecontainers and non-beverage containers. However, the recycling rate for flexible packaging remains in line withprevious options. As flexible packaging quantities are very high compared to beverage and non-beveragecontainer quantities, even this significant increase in beverage and non-beverage container recycling outcomesonly increases the overall recycling performance by a small amount.

Consumption, recycling, landfill and litter projections
PwC | WCS 26 Packaging cost benefit analysis report
Option 3 – Mandatory Advanced Disposal Fee
This option is assumed to be funded through the application of a mandatory ADF on packaging. The funds areassumed to be collected and administered by the Commonwealth Government. These funds would be used forsimilar initiatives to Option 2c.
The scheme is assumed to commence in 2015 assuming 1 year to develop the DRIS (2012) and 2 years to designand implement the scheme regulations and establish the PSO(s) (2013-2014). Projected recycling assumptionsare the same as for Option 2c.
Option 4A – Boomerang Alliance Container Deposit Scheme
BA has proposed a national CDS that is assumed to be mandatory and to be regulated under the ProductStewardship Act. It is assumed that the co-regulatory approach is not applied to packaging other than beveragecontainers, and that outcomes for non-beverage packaging are consistent with the base case.
With start-up assumed in 2016, beverage container recycling to 2015 is assumed to be in line with the base case.Following CDS commencement, beverage container recycling is assumed to be 0.95 million tonnes or 80% by2020, climbing to 1.04 million tonnes or 85% by 2025 and steady at that level to 2035. This recycling rate isslightly higher than that achieved in SA in 2009/10. With a national CDS in place, it is reasonable to assumethere would be greater community awareness of the scheme and therefore, a recycling rate of 85% seemsachievable. This recycling rate is slightly lower than that assumed by BA.
It is recognised that in a high income country such as Australia, behaviour is less sensitive to small financialincentives. For this reason, the projected beverage container recycling rate is based primarily on the SArecycling rate. It would be useful in the Decision RIS for there to be greater analysis of the impact of CDS onconsumer behaviour.
In line with the base case, it is assumed that non-beverage container recycling will increase slowly to 0.20million tonnes or 50% by 2025, and that the rate of flexible packaging recycling will reach 2.92 million tonnesor 85% by 2030.
It should be noted that data from SA indicates that the introduction of a CDS may create a ‘culture of recycling’which leads to an increase in recycling of non-beverage items. This ‘co-benefit’ is detailed qualitatively insection 5C. However, because unlike the other options, the CDS does not involve any initiatives that directlytarget non-beverage items, it was assumed that the recycling of non-beverage items would be in line with thebase case.
Additionally, the CDS depots can be used for the recycling of non-deposit items, both packaging and non-packaging items. This creates a network of infrastructure for recycling, particularly of material that cannotpractically be recycled through kerbside. This is also discussed in section 5C.
Beverage containers in a CDS can be recycled using either kerbside recycling services (assumed to be 7.1% oftotal beverage container recycling), C&I recycling services (10.1%) or ‘drop-off’ at CDS infrastructure (82.8%).31
Option 4B – Hybrid Container Deposit Scheme
This option is assumed to be an industry managed, mandatory CDS scheme operating under the ProductStewardship Act. The scheme combines features of the British Columbia CDS and some aspects of the SA CDS,however, it differs from the SA CDS in the configuration of the CDS infrastructure. The liable parties arefiller/importer/distributors of packaging.
31 BDA and Wright Corporate Strategy (2010) Beverage Container Investigation – Revised, Table B1.2, p 87.

Consumption, recycling, landfill and litter projections
PwC | WCS 27 Packaging cost benefit analysis report
The key point of difference between the BA CDS and the Hybrid CDS is the assumed infrastructurerequirements as identified in Chapter 4. WCS have not estimated that this will have any impact on the recyclingoutcomes, which are assumed to be in line with Option 4A.
Like for Option 4A, it has been assumed that non-beverage container recycling is in line with the base case.
Summary
The following table presents the overall packaging recycling rate assumptions, and by packaging product, every5 years from 2015 to 2035. To provide an illustration of the relative recycling performance between options andproducts, the figure below illustrates the recycling projections for the year 2025.
Figure 3 – Recycling projections with the base case and options (2025)
Source: WCS (2011)
40%
45%
50%
55%
60%
65%
70%
75%
80%
85%
90%
Base Case Option 1 Option 2A Option 2B Option 2C Option 3 Option 4A Option 4B
Overall Non-beverage Beverage Flexible Packaging

PwC | WCS 28 Packaging cost benefit analysis report
Table 14 – Packaging recycling rate assumptions
2010 2015 2020 2025 2030 2035
Base Case
Overall 62.5% 67.5% 72.5% 77.1% 79.0% 79.0%
Non-bev 40.2% 44.2% 49.2% 50.0% 50.0% 50.0%
Bev 48.7% 53.8% 58.1% 66.8% 69.7% 69.7%
Flex packaging 70.2% 75.4% 80.7% 84.1% 85.9% 85.9%
Option 1
Overall 62.5% 68.8% 74.0% 79.0% 81.1% 81.1%
Non-bev 40.2% 44.9% 50.0% 50.0% 50.0% 50.0%
Bev 48.7% 58.8% 63.5% 70.0% 75.0% 75.0%
Flex packaging 70.2% 75.4% 80.7% 85.9% 87.1% 87.1%
Option 2A
Overall 62.5% 67.5% 75.4% 79.4% 80.6% 80.6%
Non-bev 40.2% 44.2% 50.0% 50.0% 50.0% 50.0%
Bev 48.7% 53.8% 62.3% 70.0% 75.0% 75.0%
Flex packaging 70.2% 75.4% 83.3% 86.4% 86.4% 86.4%
Option 2B
Overall 62.5% 67.5% 77.3% 81.9% 81.9% 81.9%
Non-bev 40.2% 44.2% 50.0% 50.0% 50.0% 50.0%
Bev 48.7% 53.8% 70.0% 80.0% 80.0% 80.0%
Flex packaging 70.2% 75.4% 83.3% 86.4% 86.4% 86.4%
Option 2C
Overall 62.5% 67.5% 80.0% 83.2% 85.7% 86.4%
Non-bev 40.2% 44.2% 55.0% 60.0% 60.0% 60.0%
Bev 48.7% 53.8% 72.5% 80.0% 82.5% 85.0%
Flex packaging 70.2% 75.4% 85.7% 87.1% 90.0% 90.0%
Option 3
Overall 62.5% 67.5% 80.0% 83.2% 85.7% 86.4%
Non-bev 40.2% 44.2% 55.0% 60.0% 60.0% 60.0%
Bev 48.7% 53.8% 72.5% 80.0% 82.5% 85.0%
Flex packaging 70.2% 75.4% 85.7% 87.1% 90.0% 90.0%
Option 4A
Overall 62.5% 67.5% 77.9% 81.6% 82.8% 82.8%
Non-bev 40.2% 44.2% 49.2% 50.0% 50.0% 50.0%
Bev 48.7% 53.8% 80.0% 85.0% 85.0% 85.0%
Flex packaging 70.2% 75.4% 80.7% 84.1% 85.9% 85.9%
Option 4B
Overall 62.5% 67.5% 77.9% 81.6% 82.8% 82.8%
Non-bev 40.2% 44.2% 49.2% 50.0% 50.0% 50.0%
Bev 48.7% 53.8% 80.0% 85.0% 85.0% 85.0%
Flex packaging 70.2% 75.4% 80.7% 84.1% 85.9% 85.9%
Source: WCS (2011)
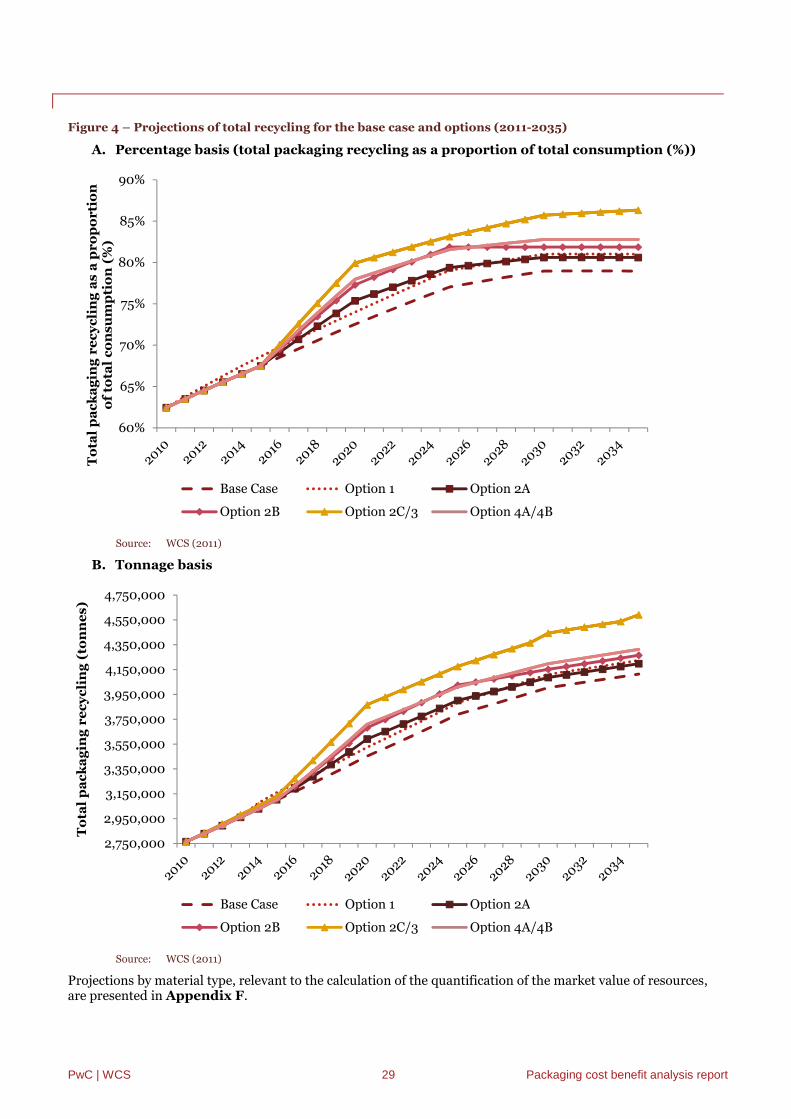
PwC | WCS 29 Packaging cost benefit analysis report
Figure 4 – Projections of total recycling for the base case and options (2011-2035)
A. Percentage basis (total packaging recycling as a proportion of total consumption (%))
Source: WCS (2011)
B. Tonnage basis
Source: WCS (2011)
Projections by material type, relevant to the calculation of the quantification of the market value of resources,are presented in Appendix F.
60%
65%
70%
75%
80%
85%
90%
To
tal
pa
ck
ag
ing
re
cy
cli
ng
as
ap
ro
po
rti
on
of
tota
lc
on
su
mp
tio
n(%
)
Base Case Option 1 Option 2A
Option 2B Option 2C/3 Option 4A/4B
2,750,000
2,950,000
3,150,000
3,350,000
3,550,000
3,750,000
3,950,000
4,150,000
4,350,000
4,550,000
4,750,000
To
tal
pa
ck
ag
ing
re
cy
cli
ng
(to
nn
es
)
Base Case Option 1 Option 2A
Option 2B Option 2C/3 Option 4A/4B

Consumption, recycling, landfill and litter projections
PwC | WCS 30 Packaging cost benefit analysis report
Projected litter trends
Litter projections were developed by WCS based on an estimate of the proportion of packaging that may beavailable to be littered, which was estimated to be around 1 million tonnes in 2010 in the Problem Report forPackaging. Total litter per annum was estimated to be between 40,000 – 160,000 tonnes, implying litter ratesof 4%-16% of total packaging available to be littered. However, as noted in the Problem Statement forPackaging, these estimates are high level and indicative only. This is because there is currently no data on theamount of litter nationally or the composition of litter by weight.32
Litter projections are presented on a per tonne basis to ensure consistency with consumption and recyclingprojections. This enables analysis of the entire supply chain to test that all packaging that is consumed is eitherrecycled, littered or landfilled, in other words, to check there is internal consistency in the modelling ofprojections.
Using Keep Australia Beautiful (KAB) data on litter on surveyed sites may appear on the surface to be morerobust. However, robust estimates based on the KAB data of the average weight per unit of packaging litter areonly available for beverage containers. Assuming an average weight of 89 grams per unit of packaging litter33
results in a total litter estimate in the range of 450 million – 1.8 billion items.
Most existing litter data is in items and volume and therefore, assumptions (such as the average weight ofpackaging litter being 89 grams) have been assumed to convert the project litter from items and volume intotonnes.
The sections below highlight the key litter projection assumptions by option. It should be noted that theseprojections are largely based on initiatives directly targeting litter. However, relatively higher recycling alsomeans less packaging available to be littered. As such, litter could be indirectly impacted by recycling initiatives.
Base case
WCS assumes that packaging litter quantities were approximately 60,000 tonnes in 2010. This is in the range ofthe 40,000-160,000 tonnes of litter estimated in the Problem Report for Packaging and is judged to representa relatively realistic estimate. The material available to be littered is based on the amount landfilled in the basecase, which is a function of consumption minus the amount recycled. In 2010, there were 1.7 million tonnes ofpackaging sent to landfill, of which around 1 million tonnes (60%) was estimated by WCS to be available to belittered. The estimate of 60,000 tonnes littered in 2010 represents 6% of the total available to be littered.
Under the base case it is assumed that litter slowly reduced by 5% by 2015 and 10% for the period 2025 to 2035.The APC Strategic Plan 2010-2015, contains three specific litter reduction strategies, and it is assumed in thebase case that these are progressively implemented.
The impact of these assumptions on litter as a proportion of packaging available to be littered is presented inthe table below.
Table 15 – Litter reduction assumptions (2011-2035) – base case
YearLitter reduction assumption by weight
(%)Litter as a proportion of packagingtonnes available to be littered (%)
2010 0% 6.0%
2015-2024 5% 5.7%
2025-2035 10% 5.4%
Source: WCS (2011)
32 PwC and Wright Corporate Strategy (2011) Problem report for packaging, prepared for the Environment Protection and Heritage Council, 19 August, p 16
33 BDA Group and WCS (2010) Beverage container investigation – revised final report, prepared for the EPHC Beverage Container Working Group, Table
A6.5, p 68

Consumption, recycling, landfill and litter projections
PwC | WCS 31 Packaging cost benefit analysis report
Option 1 – National Packaging Waste Strategy
Option 1 is assumed to result in a modest reduction in the rate of littering over the base case. The assumedoutcome is that the litter rate reduces by 5% by 2015, 10% by 2020, and 15% for the period 2025 to 2035 as aresult of the national education campaigns and enforcement. The impact of these assumptions on litter as aproportion of packaging available to be littered is presented in the table below.
Table 16 – Litter reduction assumptions (2011-2035) – Option 1
Year Litter reduction assumption (%)Litter as a proportion of packaging
available to be littered (%)
2010 0% 6.0%
2015 5% 5.7%
2020 10% 5.4%
2025-2035 15% 5.1%
Source: WCS (2011)
Option 2A – Co-regulatory Packaging Stewardship
Option 2A is assumed to target litter in a similar manner to Option 1. Therefore, the reduction in litter isassumed to be the same for Options 1 and 2A.
The impact of these assumptions on litter as a proportion of packaging available to be littered is presented inthe table below.
Table 17 – Litter reduction assumptions (2011-2035) – Option 2A
Year Litter reduction assumption (%)Litter as a proportion of packagingavailable to be littered (%)
2010 0% 6.0%
2015 5% 5.7%
2020 10% 5.4%
2025-2035 15% 5.1%
Source: WCS (2011)
Option 2B – Industry Packaging Stewardship Scheme
Option 2B targets litter through increased beverage container recovery and a range of specific litter initiatives.The overall outcome of Option 2B is that litter reduces by 5% by 2015, 11% by 2020, 15% for the period 2025 to2035.
For non-beverage containers the assumed reductions in litter rates are: 5% reduction in 2015, 10% reduction in2020, and 15% reduction in 2025 remaining steady until 2035. For beverage containers the assumed reductionsin litter rates are: 5% reduction in 2015, 15% reduction in 2020, and 20% reduction in 2025 remaining steadyuntil 2035. For flexible packaging, the assumed reductions in litter rates are: 5% reduction in 2015, 10%reduction in 2020, and 15% reduction in 2025 remaining steady until 2035.
The impact of these assumptions on litter as a proportion of packaging available to be littered is presented inthe table below.

Consumption, recycling, landfill and litter projections
PwC | WCS 32 Packaging cost benefit analysis report
Table 18 – Litter reduction assumptions (2011-2035) – Option 2B
Year Litter reduction assumption (%)Litter as a proportion of packagingavailable to be littered (%)
2010 0% 6.0%
2015 5% 5.7%
2020 11.1% 5.3%
2025-2035 15.4% 5.1%
Source: WCS (2011)
Option 2C – Extended Packaging Stewardship Scheme
As option 2C involves the same litter initiatives as Option 2B, the reduction in litter is also the same.
The impact of these assumptions on litter as a proportion of packaging available to be littered is presented inthe table below.
Table 19 – Litter reduction assumptions (2011-2035) – Option 2C
Year Litter reduction assumption (%)Litter as a proportion of packagingavailable to be littered (%)
2010 0% 6.0%
2015 5% 5.7%
2020 11.1% 5.3%
2025-2035 15.4% 5.1%
Source: WCS (2011)
Option 3 – Mandatory Advanced Disposal Fee
It is assumed that litter reduction under Option 3 is the same as under Option 2B and 2C because the initiativestargeting litter are the same. The impact of these assumptions on litter as a proportion of packaging available tobe littered is presented in the table below.
Table 20 – Litter reduction assumptions (2011-2035) – Option 3
Year Litter reduction assumption (%)Litter as a proportion of packagingavailable to be littered (%)
2010 0% 6.0%
2015 5% 5.7%
2020 11.1% 5.3%
2025-2035 15.4% 5.1%
Source: WCS (2011)
Option 4A – Boomerang Alliance Container Deposit Scheme
It is assumed that Option 4A leads to an overall reduction in the rate of littering of almost 12% by 2025, mainlyas a result of targeted beverage container recovery.
For non-beverage containers, the assumed reductions in litter rates are: 5% reduction in 2015, and 10%reduction in 2025, remaining steady until 2035. For beverage containers, the assumed reductions in litter ratesare: 5% reduction in 2015, 25% reduction in 2020, and 30% reduction in 2030 remaining steady until 2035. Forflexible packaging, the assumed reductions in litter rates are: 5% reduction in 2015, and 10% reduction in 2025remaining steady until 2035.
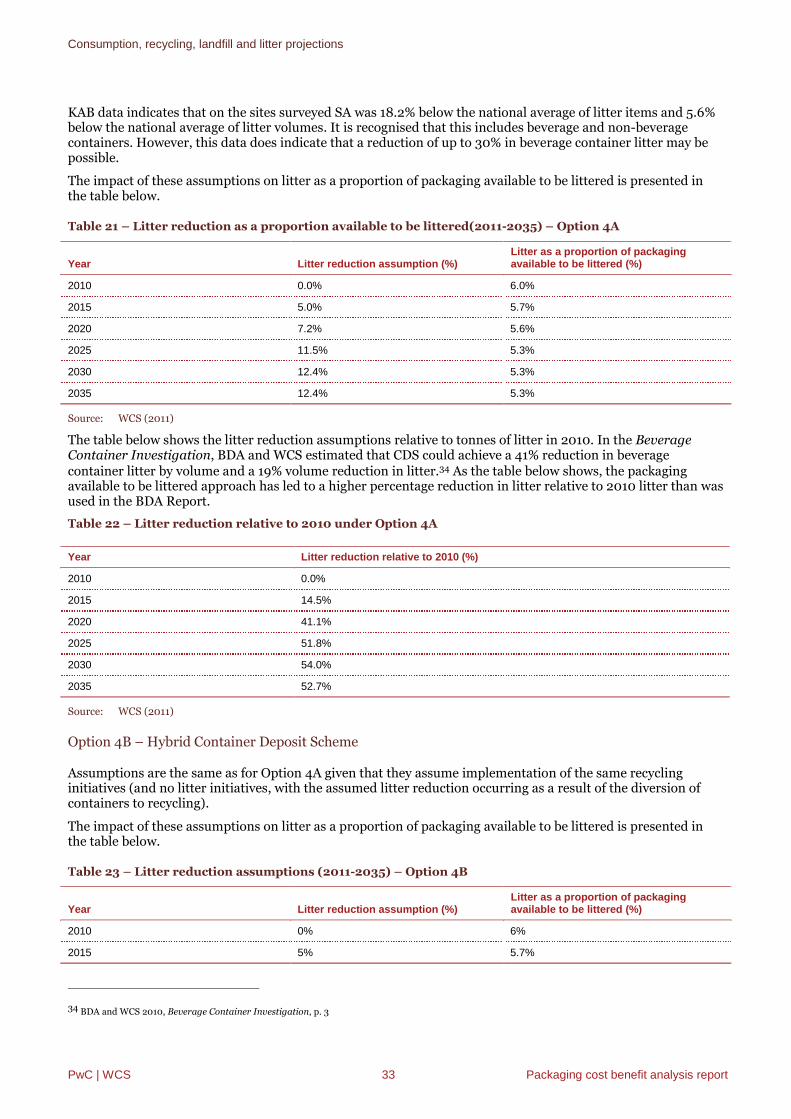
Consumption, recycling, landfill and litter projections
PwC | WCS 33 Packaging cost benefit analysis report
KAB data indicates that on the sites surveyed SA was 18.2% below the national average of litter items and 5.6%below the national average of litter volumes. It is recognised that this includes beverage and non-beveragecontainers. However, this data does indicate that a reduction of up to 30% in beverage container litter may bepossible.
The impact of these assumptions on litter as a proportion of packaging available to be littered is presented inthe table below.
Table 21 – Litter reduction as a proportion available to be littered(2011-2035) – Option 4A
Year Litter reduction assumption (%)Litter as a proportion of packagingavailable to be littered (%)
2010 0.0% 6.0%
2015 5.0% 5.7%
2020 7.2% 5.6%
2025 11.5% 5.3%
2030 12.4% 5.3%
2035 12.4% 5.3%
Source: WCS (2011)
The table below shows the litter reduction assumptions relative to tonnes of litter in 2010. In the BeverageContainer Investigation, BDA and WCS estimated that CDS could achieve a 41% reduction in beveragecontainer litter by volume and a 19% volume reduction in litter.34 As the table below shows, the packagingavailable to be littered approach has led to a higher percentage reduction in litter relative to 2010 litter than wasused in the BDA Report.
Table 22 – Litter reduction relative to 2010 under Option 4A
Year Litter reduction relative to 2010 (%)
2010 0.0%
2015 14.5%
2020 41.1%
2025 51.8%
2030 54.0%
2035 52.7%
Source: WCS (2011)
Option 4B – Hybrid Container Deposit Scheme
Assumptions are the same as for Option 4A given that they assume implementation of the same recyclinginitiatives (and no litter initiatives, with the assumed litter reduction occurring as a result of the diversion ofcontainers to recycling).
The impact of these assumptions on litter as a proportion of packaging available to be littered is presented inthe table below.
Table 23 – Litter reduction assumptions (2011-2035) – Option 4B
Year Litter reduction assumption (%)Litter as a proportion of packagingavailable to be littered (%)
2010 0% 6%
2015 5% 5.7%
34 BDA and WCS 2010, Beverage Container Investigation, p. 3

Consumption, recycling, landfill and litter projections
PwC | WCS 34 Packaging cost benefit analysis report
Year Litter reduction assumption (%)Litter as a proportion of packagingavailable to be littered (%)
2020 7.2% 5.6
2025 11.5% 5.3
2030 12.4% 5.3
2035 12.4% 5.3%
Source: WCS (2011)
Summary
The table on the following page presents the packaging litter reduction assumptions overall, and by packagingproduct, every 5 years from 2015 to 2035. To provide an illustration of the relative litter reduction performancebetween options and products, the figure below illustrates the litter reduction projections for the year 2025.
Figure 5 – Litter reduction projections by weight with the base case and options (2025)
Source: WCS (2011)
0%
5%
10%
15%
20%
25%
30%
Base Case Option 1 Option 2A Option 2B Option 2C Option 3 Option 4A Option 4B
Re
du
cti
on
inp
ro
po
rti
on
of
pa
ck
ag
ing
litt
er
ed
(%)
re
lati
ve
to2
010
Overall Non-beverage Beverage Flexible Packaging
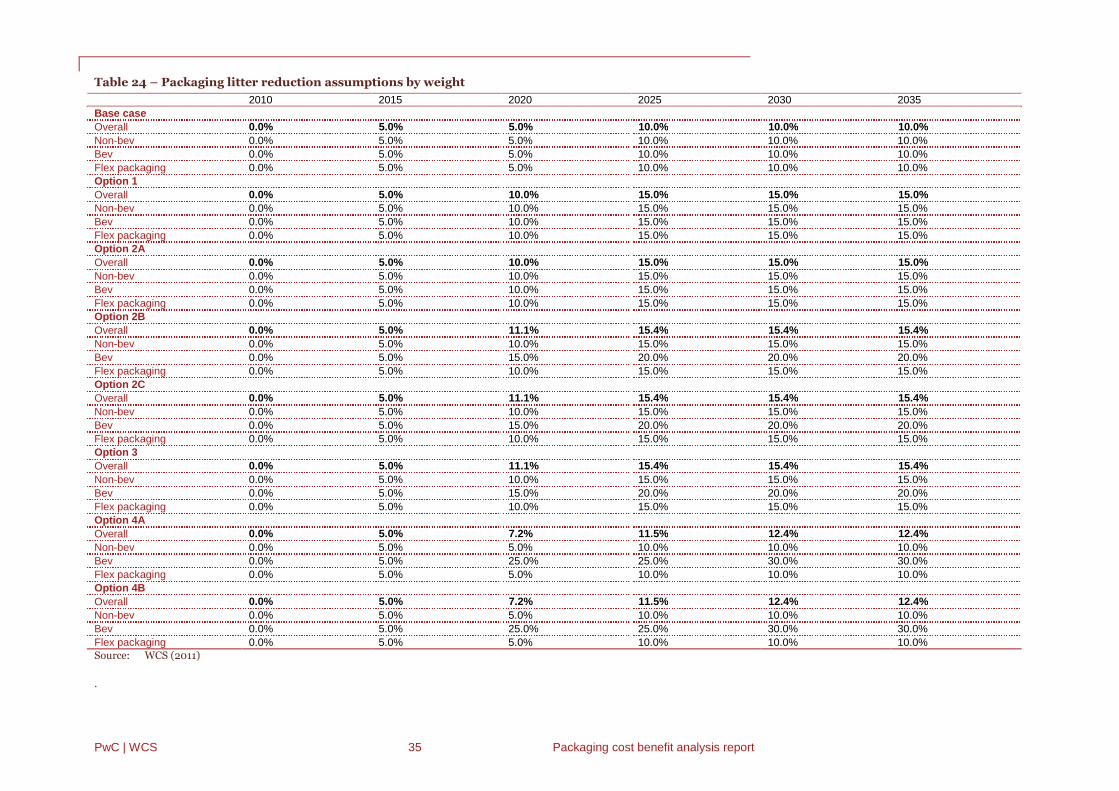
PwC | WCS 35 Packaging cost benefit analysis report
Table 24 – Packaging litter reduction assumptions by weight
2010 2015 2020 2025 2030 2035
Base case
Overall 0.0% 5.0% 5.0% 10.0% 10.0% 10.0%
Non-bev 0.0% 5.0% 5.0% 10.0% 10.0% 10.0%
Bev 0.0% 5.0% 5.0% 10.0% 10.0% 10.0%
Flex packaging 0.0% 5.0% 5.0% 10.0% 10.0% 10.0%
Option 1
Overall 0.0% 5.0% 10.0% 15.0% 15.0% 15.0%
Non-bev 0.0% 5.0% 10.0% 15.0% 15.0% 15.0%
Bev 0.0% 5.0% 10.0% 15.0% 15.0% 15.0%
Flex packaging 0.0% 5.0% 10.0% 15.0% 15.0% 15.0%
Option 2A
Overall 0.0% 5.0% 10.0% 15.0% 15.0% 15.0%
Non-bev 0.0% 5.0% 10.0% 15.0% 15.0% 15.0%
Bev 0.0% 5.0% 10.0% 15.0% 15.0% 15.0%
Flex packaging 0.0% 5.0% 10.0% 15.0% 15.0% 15.0%
Option 2B
Overall 0.0% 5.0% 11.1% 15.4% 15.4% 15.4%
Non-bev 0.0% 5.0% 10.0% 15.0% 15.0% 15.0%
Bev 0.0% 5.0% 15.0% 20.0% 20.0% 20.0%
Flex packaging 0.0% 5.0% 10.0% 15.0% 15.0% 15.0%
Option 2C
Overall 0.0% 5.0% 11.1% 15.4% 15.4% 15.4%
Non-bev 0.0% 5.0% 10.0% 15.0% 15.0% 15.0%
Bev 0.0% 5.0% 15.0% 20.0% 20.0% 20.0%
Flex packaging 0.0% 5.0% 10.0% 15.0% 15.0% 15.0%
Option 3
Overall 0.0% 5.0% 11.1% 15.4% 15.4% 15.4%
Non-bev 0.0% 5.0% 10.0% 15.0% 15.0% 15.0%
Bev 0.0% 5.0% 15.0% 20.0% 20.0% 20.0%
Flex packaging 0.0% 5.0% 10.0% 15.0% 15.0% 15.0%
Option 4A
Overall 0.0% 5.0% 7.2% 11.5% 12.4% 12.4%
Non-bev 0.0% 5.0% 5.0% 10.0% 10.0% 10.0%
Bev 0.0% 5.0% 25.0% 25.0% 30.0% 30.0%
Flex packaging 0.0% 5.0% 5.0% 10.0% 10.0% 10.0%
Option 4B
Overall 0.0% 5.0% 7.2% 11.5% 12.4% 12.4%
Non-bev 0.0% 5.0% 5.0% 10.0% 10.0% 10.0%
Bev 0.0% 5.0% 25.0% 25.0% 30.0% 30.0%
Flex packaging 0.0% 5.0% 5.0% 10.0% 10.0% 10.0%Source: WCS (2011)
.

PwC | WCS 36 Packaging cost benefit analysis report
Figure 6 – Projections of reduced litter for the base case and options (2011-2035)
A. Percentage basis
Note: Projections represent the percentage reduction in litter as a proportion of packaging available to be littered (6% in2010)Source: WCS (2011)
B. Tonnage basis
Source: WCS (2011)
0%
2%
4%
6%
8%
10%
12%
14%
16%
18%
2010 2015 2020 2025 2030 2035
Re
du
cti
on
inli
tte
ra
sa
pr
op
or
tio
no
fp
ac
ka
gin
ga
va
ila
ble
tob
eli
tte
re
d(%
)-
re
lati
ve
to2
010
Base Case Option 1/2A Options 2B/2C/3 Option 4A/4B
0
10,000
20,000
30,000
40,000
50,000
60,000
70,000
To
tal
litt
er
(to
nn
es
)
Base Case Option 1 Option 2A
Option 2B Option 2C/3 Option 4A/4B

PwC | WCS 37 Packaging cost benefit analysis report
Projected landfill trends
Landfill quantities are not calculated directly as they are assumed to be the difference between the quantity ofconsumption and the sum of recycling and litter quantities, based on the projections.
Figure 7 – Projections of landfill for the base case and options (2011-2035)
A. Percentage basis
Source: WCS (2011)
B. Tonnage basis
Source: WCS (2011)
0.0%
5.0%
10.0%
15.0%
20.0%
25.0%
30.0%
35.0%
Lit
ter
as
ap
ro
po
rti
on
of
co
ns
um
pti
on
(%)
Base Case Option 1 Option 2A
Option 2B Option 2C/3 Option 4A/4B
0
200,000
400,000
600,000
800,000
1,000,000
1,200,000
1,400,000
1,600,000
To
tal
lan
dfi
ll(t
on
ne
s)
Base Case Option 1 Option 2A
Option 2B Option 2C/3 Option 4A/4B

Consumption, recycling, landfill and litter projections
PwC | WCS 38 Packaging cost benefit analysis report
Cost assumptions
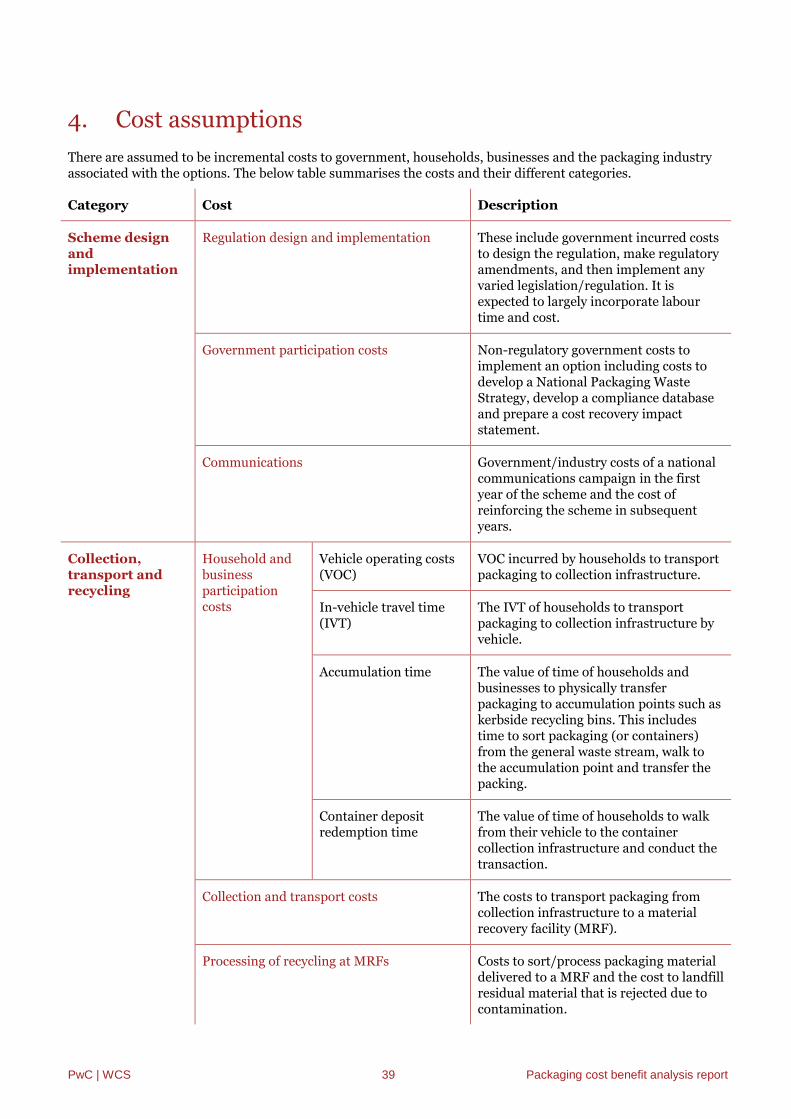
PwC | WCS 39 Packaging cost benefit analysis report
4. Cost assumptions
There are assumed to be incremental costs to government, households, businesses and the packaging industryassociated with the options. The below table summarises the costs and their different categories.
Category Cost Description
Scheme designandimplementation
Regulation design and implementation These include government incurred coststo design the regulation, make regulatoryamendments, and then implement anyvaried legislation/regulation. It isexpected to largely incorporate labourtime and cost.
Government participation costs Non-regulatory government costs toimplement an option including costs todevelop a National Packaging WasteStrategy, develop a compliance databaseand prepare a cost recovery impactstatement.
Communications Government/industry costs of a nationalcommunications campaign in the firstyear of the scheme and the cost ofreinforcing the scheme in subsequentyears.
Collection,transport andrecycling
Household andbusinessparticipationcosts
Vehicle operating costs(VOC)
VOC incurred by households to transportpackaging to collection infrastructure.
In-vehicle travel time(IVT)
The IVT of households to transportpackaging to collection infrastructure byvehicle.
Accumulation time The value of time of households andbusinesses to physically transferpackaging to accumulation points such askerbside recycling bins. This includestime to sort packaging (or containers)from the general waste stream, walk tothe accumulation point and transfer thepacking.
Container depositredemption time
The value of time of households to walkfrom their vehicle to the containercollection infrastructure and conduct thetransaction.
Collection and transport costs The costs to transport packaging fromcollection infrastructure to a materialrecovery facility (MRF).
Processing of recycling at MRFs Costs to sort/process packaging materialdelivered to a MRF and the cost to landfillresidual material that is rejected due tocontamination.

Cost assumptions
PwC | WCS 40 Packaging cost benefit analysis report
Category Cost Description
Schemeoperation
Government costs to administer regulations Costs for government to administer theregulations on an ongoing basis,including costs related to pursuingindustry participants to join the co-regulatory scheme and ensuringcompliance with the legislation.
Scheme administration costs Cost of establishing an industry-runPSO(s) that will be responsible for theestablishment and operation of approvedarrangements under the co-regulatoryoptions.
Scheme initiatives and infrastructure Costs to fund scheme initiatives andassociated infrastructure such aseducation campaigns and increasedpublic place recycling.
Schemecompliance
Reporting and labelling Costs incurred by industry to reportagainst targets and update labels in theCDS.
The core assumptions for each of these cost categories and potential data sources for sensitivity testing arediscussed below.
In 2010, PwC conducted a study for TEC on approached to conducting CBAs of CDS options.35 The studyidentified a range of economic and environmental costs of CDS and theoretical approaches to valuing these.Since this time, the willingness to pay study has been conducted, as well as a range of other studies. Therefore, anumber of costs have been included in this CBA that were not identified in the 2010 report. Additionally, the2010 report did not seek to quantify the costs, but identified potential approaches. Therefore, there are anumber of costs that were identified in the report that have not been included in this CBA as it was not possibleor practical to quantify them.
35 PwC, 2010. Synthesis and Critique of Existing Consumer Deposit Scheme- Cost Benefit Analysis. Prepared for the Total Environment Centre, February
2010.
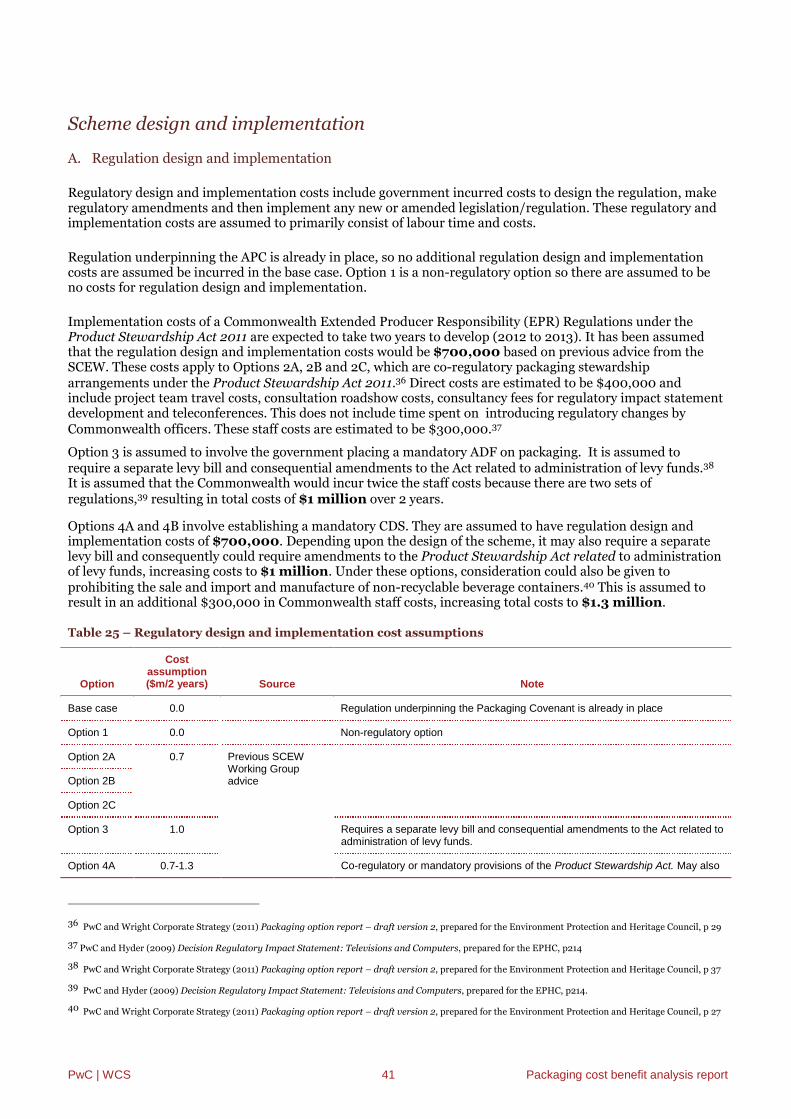
PwC | WCS 41 Packaging cost benefit analysis report
Scheme design and implementation
A. Regulation design and implementation
Regulatory design and implementation costs include government incurred costs to design the regulation, makeregulatory amendments and then implement any new or amended legislation/regulation. These regulatory andimplementation costs are assumed to primarily consist of labour time and costs.
Regulation underpinning the APC is already in place, so no additional regulation design and implementationcosts are assumed be incurred in the base case. Option 1 is a non-regulatory option so there are assumed to beno costs for regulation design and implementation.
Implementation costs of a Commonwealth Extended Producer Responsibility (EPR) Regulations under theProduct Stewardship Act 2011 are expected to take two years to develop (2012 to 2013). It has been assumedthat the regulation design and implementation costs would be $700,000 based on previous advice from theSCEW. These costs apply to Options 2A, 2B and 2C, which are co-regulatory packaging stewardshiparrangements under the Product Stewardship Act 2011.36 Direct costs are estimated to be $400,000 andinclude project team travel costs, consultation roadshow costs, consultancy fees for regulatory impact statementdevelopment and teleconferences. This does not include time spent on introducing regulatory changes byCommonwealth officers. These staff costs are estimated to be $300,000.37
Option 3 is assumed to involve the government placing a mandatory ADF on packaging. It is assumed torequire a separate levy bill and consequential amendments to the Act related to administration of levy funds.38
It is assumed that the Commonwealth would incur twice the staff costs because there are two sets ofregulations,39 resulting in total costs of $1 million over 2 years.
Options 4A and 4B involve establishing a mandatory CDS. They are assumed to have regulation design andimplementation costs of $700,000. Depending upon the design of the scheme, it may also require a separatelevy bill and consequently could require amendments to the Product Stewardship Act related to administrationof levy funds, increasing costs to $1 million. Under these options, consideration could also be given toprohibiting the sale and import and manufacture of non-recyclable beverage containers.40 This is assumed toresult in an additional $300,000 in Commonwealth staff costs, increasing total costs to $1.3 million.
Table 25 – Regulatory design and implementation cost assumptions
Option
Costassumption($m/2 years) Source Note
Base case 0.0 Regulation underpinning the Packaging Covenant is already in place
Option 1 0.0 Non-regulatory option
Option 2A 0.7 Previous SCEWWorking GroupadviceOption 2B
Option 2C
Option 3 1.0 Requires a separate levy bill and consequential amendments to the Act related toadministration of levy funds.
Option 4A 0.7-1.3 Co-regulatory or mandatory provisions of the Product Stewardship Act. May also
36 PwC and Wright Corporate Strategy (2011) Packaging option report – draft version 2, prepared for the Environment Protection and Heritage Council, p 29
37 PwC and Hyder (2009) Decision Regulatory Impact Statement: Televisions and Computers, prepared for the EPHC, p214
38 PwC and Wright Corporate Strategy (2011) Packaging option report – draft version 2, prepared for the Environment Protection and Heritage Council, p 37
39 PwC and Hyder (2009) Decision Regulatory Impact Statement: Televisions and Computers, prepared for the EPHC, p214.
40 PwC and Wright Corporate Strategy (2011) Packaging option report – draft version 2, prepared for the Environment Protection and Heritage Council, p 27

Cost assumptions
PwC | WCS 42 Packaging cost benefit analysis report
Option
Costassumption($m/2 years) Source Note
Option 4Brequire a separate levy bill and consequently could require amendments to theProduct Stewardship Act related to administration of levy funds. Considerationcould also be given to prohibiting the sale and import / manufacture of non-recyclable beverage containers
B. Government participation costs
In addition to the labour costs to design and implement scheme regulations, there are likely to be otherincremental labour costs incurred by the government to design and implement the options. These couldinclude:
Development of a National Packaging Waste Strategy (Option 1 only)
Establishing a compliance database
Development of a Cost Recovery Impact Statement, and
Cost of renegotiating municipal kerbside recycling contracts.
The ongoing cost for government to operate each option are included in the scheme operation costs. Thegovernment participation costs seek to quantify the costs to government for implementing each option.
Option 1 includes the development of a National Packaging Waste Strategy This is assumed to cost $140,000in the first year and $90,000 ongoing based on NSW Office of Environment and Heritage (NSWOEH)estimates of:
An annual salary of $92,000 for an Environmental Officer. $118,000 for a Manager and $150,000 for aDirector
Overheads of 14.5%
A time commitment in Year 1 of 20% for the Environmental Manager, 5% for the Manager and 1% for theDirector
A time commitment on an ongoing basis of 10% for the Environmental Manager, 5% for the Manager and1% for the Director, and
Equivalent costs to NSW in QLD and VIC; 50% of NSW costs in WA and SA; and 25% in TAS, NT and ACT.
Due to the challenges of monetising the other costs identified above, they have not been included in the CBA.Therefore, only the development of a National Waste Strategy has been quantified. Establishing a compliancedatabase, development of a Cost Recovery Impact Statement and the cost of renegotiating municipal kerbsiderecycling contracts were not quantified.
C. Communication costs
A national communications campaign is assumed to be required to provide consumers and stakeholders withthe knowledge to successfully participate in the CDS (Options 4A and 4B). These costs can be borne by eitherthe Government or liable parties depending on the design of the scheme. This CBA will assume that these costsare borne be Government given that industry funded education campaigns are included in the cost category‘Scheme Initiatives and Infrastructure’.
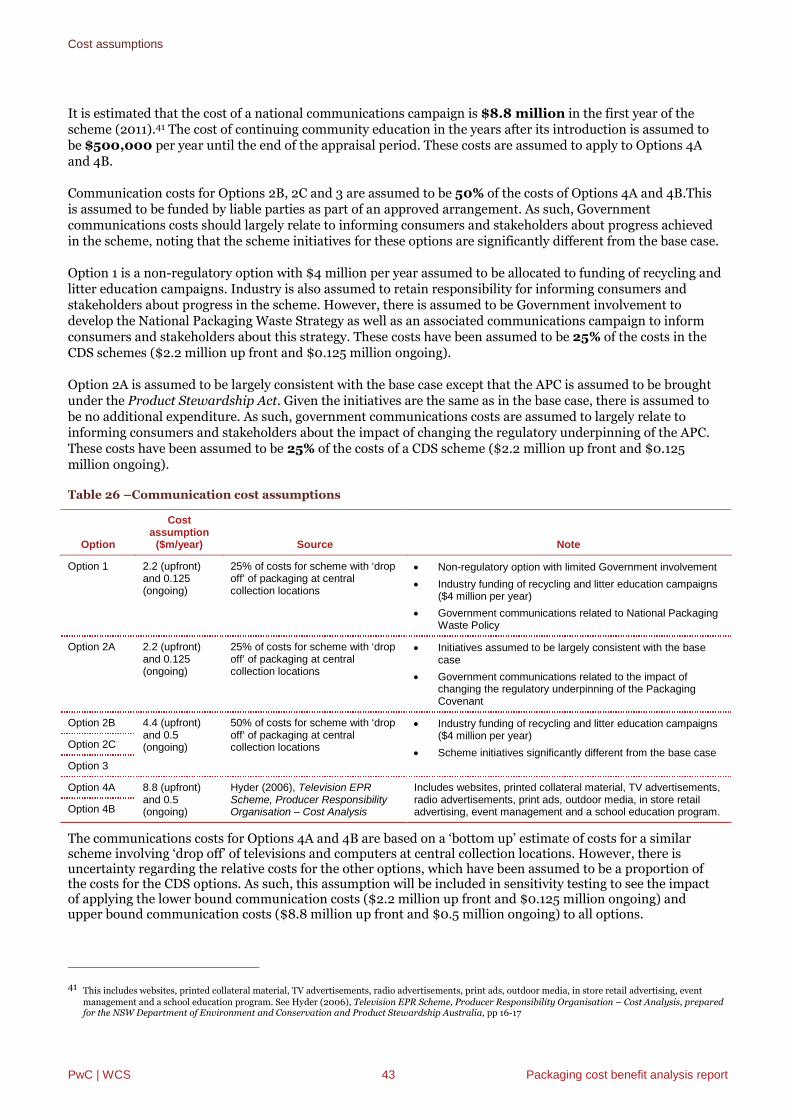
Cost assumptions
PwC | WCS 43 Packaging cost benefit analysis report
It is estimated that the cost of a national communications campaign is $8.8 million in the first year of thescheme (2011).41 The cost of continuing community education in the years after its introduction is assumed tobe $500,000 per year until the end of the appraisal period. These costs are assumed to apply to Options 4Aand 4B.
Communication costs for Options 2B, 2C and 3 are assumed to be 50% of the costs of Options 4A and 4B.Thisis assumed to be funded by liable parties as part of an approved arrangement. As such, Governmentcommunications costs should largely relate to informing consumers and stakeholders about progress achievedin the scheme, noting that the scheme initiatives for these options are significantly different from the base case.
Option 1 is a non-regulatory option with $4 million per year assumed to be allocated to funding of recycling andlitter education campaigns. Industry is also assumed to retain responsibility for informing consumers andstakeholders about progress in the scheme. However, there is assumed to be Government involvement todevelop the National Packaging Waste Strategy as well as an associated communications campaign to informconsumers and stakeholders about this strategy. These costs have been assumed to be 25% of the costs in theCDS schemes ($2.2 million up front and $0.125 million ongoing).
Option 2A is assumed to be largely consistent with the base case except that the APC is assumed to be broughtunder the Product Stewardship Act. Given the initiatives are the same as in the base case, there is assumed tobe no additional expenditure. As such, government communications costs are assumed to largely relate toinforming consumers and stakeholders about the impact of changing the regulatory underpinning of the APC.These costs have been assumed to be 25% of the costs of a CDS scheme ($2.2 million up front and $0.125million ongoing).
Table 26 –Communication cost assumptions
Option
Costassumption
($m/year) Source Note
Option 1 2.2 (upfront)and 0.125(ongoing)
25% of costs for scheme with ‘dropoff’ of packaging at centralcollection locations
Non-regulatory option with limited Government involvement
Industry funding of recycling and litter education campaigns($4 million per year)
Government communications related to National PackagingWaste Policy
Option 2A 2.2 (upfront)and 0.125(ongoing)
25% of costs for scheme with ‘dropoff’ of packaging at centralcollection locations
Initiatives assumed to be largely consistent with the basecase
Government communications related to the impact ofchanging the regulatory underpinning of the PackagingCovenant
Option 2B 4.4 (upfront)and 0.5(ongoing)
50% of costs for scheme with ‘dropoff’ of packaging at centralcollection locations
Industry funding of recycling and litter education campaigns($4 million per year)
Scheme initiatives significantly different from the base caseOption 2C
Option 3
Option 4A 8.8 (upfront)and 0.5(ongoing)
Hyder (2006), Television EPRScheme, Producer ResponsibilityOrganisation – Cost Analysis
Includes websites, printed collateral material, TV advertisements,radio advertisements, print ads, outdoor media, in store retailadvertising, event management and a school education program.Option 4B
The communications costs for Options 4A and 4B are based on a ‘bottom up’ estimate of costs for a similarscheme involving ‘drop off’ of televisions and computers at central collection locations. However, there isuncertainty regarding the relative costs for the other options, which have been assumed to be a proportion ofthe costs for the CDS options. As such, this assumption will be included in sensitivity testing to see the impactof applying the lower bound communication costs ($2.2 million up front and $0.125 million ongoing) andupper bound communication costs ($8.8 million up front and $0.5 million ongoing) to all options.
41 This includes websites, printed collateral material, TV advertisements, radio advertisements, print ads, outdoor media, in store retail advertising, eventmanagement and a school education program. See Hyder (2006), Television EPR Scheme, Producer Responsibility Organisation – Cost Analysis, preparedfor the NSW Department of Environment and Conservation and Product Stewardship Australia, pp 16-17
Cost assumptions
PwC | WCS 44 Packaging cost benefit analysis report
Collection, transport and recycling
A. Household participation costs
Households face scheme participation costs due to the time it takes to accumulate packaging and transport it byvehicle to collection infrastructure points. These are listed below.
Vehicle operating costs (VOC): VOC incurred by households to transport packaging to collectioninfrastructure.
In-vehicle travel time (IVT): The IVT of households to transport packaging to collection infrastructureby vehicle.
Accumulation time: The value of time of households to physically transfer packaging to accumulationpoints such as kerbside recycling bins. This includes time to sort packaging (or containers) from the generalwaste stream, walk to the accumulation point and transfer the packing.
Container deposit redemption time: The value of time of households to walk from their vehicle to thecontainer collection infrastructure and conduct the transaction.
Given the uncertainty that surrounds these estimates, sensitivity testing will be undertaken to determine theimpact of increasing and decreasing household participation costs by both 25% and 50% and the results ofthese tests are summarised in Chapter 5.
There are a range of components of the household participation costs, such as VOC and IVT, that could also beindividually subjected to sensitivity analysis. These potential sensitivities are identified in the followingsections. The results of these sensitivity tests on individual components have not been reported in the CBAresults. This is because the sensitivity testing of increasing and decreasing the household participation costs byboth 25% and 50% will capture changes in these individual components.
Vehicle operating costs
Options 1, 2A, 2B, 2C and 3 are not anticipated to result in additional vehicle trips given that under theseoptions household recycling is primarily conducted using kerbside recycling. Options 4A and 4B requirehouseholds to transport containers to collection infrastructure to redeem financial deposits. When this activitycannot be coordinated with existing trips (e.g. weekly grocery shopping), there are incremental costs resultingfrom the additional trips.
VOC are a function of assumptions regarding:
VOC per km
Distance to infrastructure
Trips per week
Trips by infrastructure type
Proportion of new trips.
Estimates based on these assumptions are assumed to be the maximum costs achieved in 2035, with VOC inearlier years calculated based on beverage container recycling at CDS collection points in that particular year asa proportion of the level of CDS recycling projected for 2035.
Vehicle operating cost parameter
VOCs are routinely included in CBAs of transport initiatives. The VOCs are based on parameters ($/vehicle kmtravelled (VKT)) sourced from economic appraisal guidelines in the various jurisdictions. As outlined in the
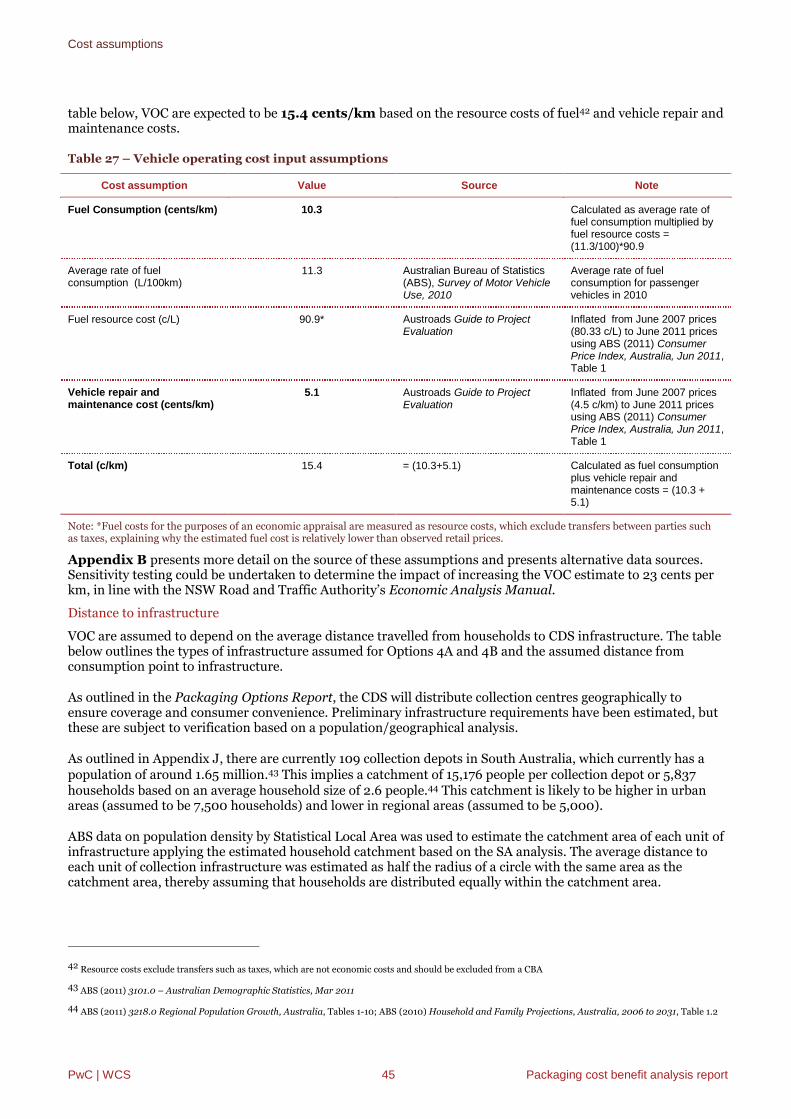
Cost assumptions
PwC | WCS 45 Packaging cost benefit analysis report
table below, VOC are expected to be 15.4 cents/km based on the resource costs of fuel42 and vehicle repair andmaintenance costs.
Table 27 – Vehicle operating cost input assumptions
Cost assumption Value Source Note
Fuel Consumption (cents/km) 10.3 Calculated as average rate offuel consumption multiplied byfuel resource costs =(11.3/100)*90.9
Average rate of fuelconsumption (L/100km)
11.3 Australian Bureau of Statistics(ABS), Survey of Motor VehicleUse, 2010
Average rate of fuelconsumption for passengervehicles in 2010
Fuel resource cost (c/L) 90.9* Austroads Guide to ProjectEvaluation
Inflated from June 2007 prices(80.33 c/L) to June 2011 pricesusing ABS (2011) ConsumerPrice Index, Australia, Jun 2011,Table 1
Vehicle repair andmaintenance cost (cents/km)
5.1 Austroads Guide to ProjectEvaluation
Inflated from June 2007 prices(4.5 c/km) to June 2011 pricesusing ABS (2011) ConsumerPrice Index, Australia, Jun 2011,Table 1
Total (c/km) 15.4 = (10.3+5.1) Calculated as fuel consumptionplus vehicle repair andmaintenance costs = (10.3 +5.1)
Note: *Fuel costs for the purposes of an economic appraisal are measured as resource costs, which exclude transfers between parties suchas taxes, explaining why the estimated fuel cost is relatively lower than observed retail prices.
Appendix B presents more detail on the source of these assumptions and presents alternative data sources.Sensitivity testing could be undertaken to determine the impact of increasing the VOC estimate to 23 cents perkm, in line with the NSW Road and Traffic Authority’s Economic Analysis Manual.
Distance to infrastructure
VOC are assumed to depend on the average distance travelled from households to CDS infrastructure. The tablebelow outlines the types of infrastructure assumed for Options 4A and 4B and the assumed distance fromconsumption point to infrastructure.
As outlined in the Packaging Options Report, the CDS will distribute collection centres geographically toensure coverage and consumer convenience. Preliminary infrastructure requirements have been estimated, butthese are subject to verification based on a population/geographical analysis.
As outlined in Appendix J, there are currently 109 collection depots in South Australia, which currently has apopulation of around 1.65 million.43 This implies a catchment of 15,176 people per collection depot or 5,837households based on an average household size of 2.6 people.44 This catchment is likely to be higher in urbanareas (assumed to be 7,500 households) and lower in regional areas (assumed to be 5,000).
ABS data on population density by Statistical Local Area was used to estimate the catchment area of each unit ofinfrastructure applying the estimated household catchment based on the SA analysis. The average distance toeach unit of collection infrastructure was estimated as half the radius of a circle with the same area as thecatchment area, thereby assuming that households are distributed equally within the catchment area.
42 Resource costs exclude transfers such as taxes, which are not economic costs and should be excluded from a CBA
43 ABS (2011) 3101.0 – Australian Demographic Statistics, Mar 2011
44 ABS (2011) 3218.0 Regional Population Growth, Australia, Tables 1-10; ABS (2010) Household and Family Projections, Australia, 2006 to 2031, Table 1.2

Cost assumptions
PwC | WCS 46 Packaging cost benefit analysis report
It should be noted that the ABS also has population data for urban centres and localities, which ideally would bepreferred to Statistical Local Area data, especially for regional areas. However, population density data is notprovided at this level of aggregation and so the CBA assumptions have been built up from data on StatisticalLocal Areas.
Geoscience Australia’s spatial database is available to map the location of waste transfer stations in Australia.However, estimates based on population density were preferred as they reflect the catchment assumptions thatare assumed to underpin the population / geographic analysis.
Table 28 - Estimates of average distance to infrastructure based on population density
Assumption Value Source Note
Population density – urban(persons/km2)
401.8 ABS (2011) 3218.0 RegionalPopulation Growth, Australia,Tables 1-10
Population density of all LGAsin capital city StatisticalDivisions
Population density – rural/remote(persons/km2)
3.85 Median population density ofLGAs outside capital cityStatistical Divisions
Catchment households– urban(households/unit of infrastructure)
7,500 Analysis of populationdistribution of SA collectioninfrastructure
Catchment is based on thenumber of households, notpopulation
Catchment households –rural/remote (households per unitof infrastructure)
2,500
Average household size(population per household)
2.6 ABS (2011) 3218.0 RegionalPopulation Growth, Australia,Tables 1-10/ABS (2010)Household and FamilyProjections, Australia, 2006 to2031, Table 1.2
=(22,328,847/8,527,072)
Catchment area – urban (km) 48.5 PwC calculation =(7,500/(401.8/2.6))
Catchment area – rural/remote(km)
1,688.3 PwC calculation =(2,500/(3.85/2.6)
Catchment radius – urban 3.9 PwC calculation (assumingcatchment area is circular)
=((48.5)/π)^(1/2)
Catchment radius – rural/remote 23.2 =((1,688.3)/π)^(1/2)
Average distance to infrastructure– urban
2.0 Population assumed to beequally distributed within thecatchment area, so radiusdivided by 2
=3.9/2
Average distance to infrastructure– rural/remote
11.6 =23.2/2
Table 29 –Average distance from point of household consumption to infrastructure: Option 4A
Cost assumption Value
Distance to hubs (km) 2.0
Distance to collection depots (km) 2.0
Distance to RVMs (km) 2.0
Rural and remote centre collection points (km) 11.6
Table 30 –Average distance from point of household consumption to infrastructure: Option 4B
Cost assumption Value
Distance to consolidation depots (km) 2.0
Distance to collection depots (km) 2.0
Distance to RVMs (km) 2.0
Rural and remote centre collection points (km) 11.6

Cost assumptions
PwC | WCS 47 Packaging cost benefit analysis report
Appendix B presents more detail on the source of these assumptions. It also presents alternative data sourcessuch as the average distance from the point of waste generation to landfill in NSW based on the mapping oflandfill locations. These alternative sources could be used to test the sensitivity of the CBA results to theseassumptions.
Trips per week
Incremental VKTs are assumed to also depend on the frequency of trips undertaken by households to collectioninfrastructure. Households are assumed to take 0.04 trips per week (i.e. 2 trips per year) based SAEnvironment Protection Authority (EPA) surveys of trips to CDS collection infrastructure. It is arguable thatparticipation in the proposed CDS would be higher than in SA given the relatively higher assumed proportion ofRVMs relative to depots. These are likely to encourage relatively higher levels of participation given that theyare considered more convenient due to their location. However, this will be somewhat offset by the fact thatother jurisdictions already have comprehensive kerbside systems in place, so it will now be relatively moredifficult to change behaviour. The overall impact in the frequency of trips is uncertain.
Table 31 – Assumed frequency of household trips to container deposit infrastructure
Frequency of trips perhousehold Proportion of households (%) Trips per household per week Source
Four or more times a year 41% 0.08 EPA (2004), noting that theaverage frequency of trips isassumed to be 4 per year giventhat the upper bound of thisrange is not provided.
One to three times a year 25% 0.04 EPA (2004), noting that theaverage frequency of trip isassumed to be 2 per year (i.e.the median of range of 1-3 tripsper year).
Other 34% 0.00 Residual proportion from EPA(2004) with an assumedfrequency of no trips per year.
Total 100% 0.04
Source: South Australia Environment Protection Agency (2004) Community awareness and acceptance of Container DepositLegislation, p 4
The upper bound of the category of households taking four or more trips per year is unclear. The analysis hasassumed that all households in this category take four trips per year. Sensitivity testing could be used tounderstand the impact of changing this upper bound on the CBA results.
Trips by infrastructure type
The distribution of household trips to different types of CDS infrastructure reflects BA estimates of beveragecontainer redemption by infrastructure type, s outlined in the table below.
Table 32 – Assumed trips by infrastructure type (Option 4A)
Infrastructure Type Number Proportion (%) Source
Hubs 250 25.5 BA estimate of redemption byinfrastructure type
Collection depots (spokes) 310 50.5
RVMs (spokes) 640 22.5
Rural/remote collection centres(spokes)
700 1.5
Total 1900 100

Cost assumptions
PwC | WCS 48 Packaging cost benefit analysis report
Assumptions regarding beverage container redemption by infrastructure type were adjusted for Option 4B toreflect relative differences in the number of collection depots and RVMs.
Table 33 – Assumed trips by infrastructure type (Option 4B)
Infrastructure Type Number Proportion (%) Source
Consolidation depots 250 25.5 Table 32, adjusted to reflectrelative differences in thenumber of collection depots andRVMs
Collection depots 600 58.5
RVMs 350 14.5
Rural/remote collection centres 700 1.5
Total 1900 100
Proportion of new trips
Incremental VKTs are assumed to depend on the proportion of trips to collection infrastructure that can becombined with existing trips. When trips to deposit locations are combined with existing trips, this means nonew trips have been made and therefore, no incremental costs will be incurred. Only new trips that were notundertaken in the base case are assumed to result in incremental costs to households.
The table below outlines the types of infrastructure assumed for Options 4A and 4B and the assumedproportion of new trips to collection infrastructure. This is assumed to be 50% for most types of infrastructure.Although they are located at existing waste facilities, it is assumed that around 90% of households have accessto kerbside recycling and would not take trips to this infrastructure in the base case. Experience from SAsuggests that people tend to incorporate a trip to a recycling depot into a trip that includes other destinations,so a more conservative estimate of 50% has been applied in the CBA.
RVMs are assumed to be located at convenient locations such as shopping centres. It is assumed that 10% oftrips to RVMs are new trips given that:
Not all shopping trips originate from the point of accumulation (typically the household). For example,people may conduct their weekly or fortnightly shop on the way home from work
People may be reluctant to store containers in their car. For example, due to limited capacity or reducedamenity
H0useholds are not likely to make a trip for the sole purpose of returning containers unless they have asignificant quantity (e.g. with a deposit of 10 cents per container, 100 containers would result in a paymentof $10). However, containers are likely to be returned to RVMs in relatively lower quantities than depotsgiven that containers need to be redeemed one at a time using an RVM.
Table 34 – Assumed proportion of new trips by households to collection infrastructure (%)
Infrastructure typeProportion ofnew trips (%) Source Note
Hubs 50 PwC assumption Assumed to be located at existing waste facilities, but around 90% ofhouseholds are estimated to have access to kerbside recyclingmeaning that there are relatively few existing trips. Experience fromSouth Australia suggests that people tend to incorporate a trip to arecycling depot into a trip that includes other destinations.
Collection centres(spokes)
50
Consolidation points 50
Depots 50
RVMs 10 Assumed to be predominantly located at shopping centres, so abilityto combine with existing shopping trip (noting that it may not always bepossible to do so. For example, many people shop on their way homefrom work and may be reluctant to store containers in their car)
Rural/remote centrecollection points
10 Co-location with existing recycling infrastructure, lower coverage ofkerbside in regional locations and incorporation into a trip that includesother destinations.

Cost assumptions
PwC | WCS 49 Packaging cost benefit analysis report
SA and the Northern Territory (NT) have both implemented CDS, so they are already assumed to take trips tocollection infrastructure in the base case (i.e. there are no incremental trips with the options). As such, totalincremental trips have been reduced by 15% corresponding to their respective populations.45
It should be noted there is a paucity of data regarding the proportion of new trips to collection infrastructure.As such, intuitive assumptions have been made for the purposes of the CBA. The impact of increasing anddecreasing these assumed proportions could be included in sensitivity in the CBA.
In vehicle travel time
The incremental VKTs generating the VOC above are assumed to also increase costs to households in the formof the IVT. This is calculated by converting the distance travelled into hours by dividing by average vehiclespeed and multiplying by the value of time ($13.01/hour) based on the Austroads Guide to ProjectEvaluation. It should be noted that the Austroads value of time for private vehicles ($11.49/hour inflated toJune 2011 dollars) is used to value all household time costs as a result of the proposed recycling schemes,including sorting time, accumulation time and time to transfer contents.
Austroads do not provide specific data on average vehicle speeds in Australia, however, some guidance isprovided by the following sources:
Austroads reports have estimated VOCs for cars based on an average speed of 100 km/hr on freeways andan average speed of 50 km/hr on other roads.46
The NSW RTA bases their VOC estimates on an all-day average vehicle speed of 40km/hr on the urban roadnetwork and 85 km/hr on regional highways47
The Sydney Transport Model estimates average network wide vehicle speeds of around 30 km/hr in themorning peak
In Melbourne, the average vehicle speed on freeways are estimated to be 43 km/hr in the morning peak and63 km/hour in the evening peak.48
For the purposes of the CBA, average vehicle speed has been assumed to be 50 km/hr in urban areas and 75km/hr in regional areas, based on Austroads assumptions to develop VOC and acknowledging that:
Regional roads include a combination of non-arterial roads, arterial roads and freeways
Average all day vehicle speeds are expected to be higher than in the morning or evening peak
The Sydney and Melbourne road networks are more congested than in other urban areas, decreasingaverage vehicle speeds in these locations.
However, the impact of increasing and decreasing these assumed speeds could be included in sensitivity testingto understand the impact of changing these assumptions on the CBA results.
45 ABS (2011) 3101.0 – Australian Demographic Statistics, Mar 2011
46 Austroads (2006) Update of RUC unit of values to June 2005; Austroads (2011) Updating Austroads RUE Unit Values and Related Methodologies
47 NSW RTA (2009) RTA Economic Analysis Manual, Version 2, Appendix B: Economic Parameters for 2009,
48 VicRoads (2011) Traffic Monitor 2009/2010, May; The Age (2011) Roadworks blamed as freeways slow to a crawl, May 31
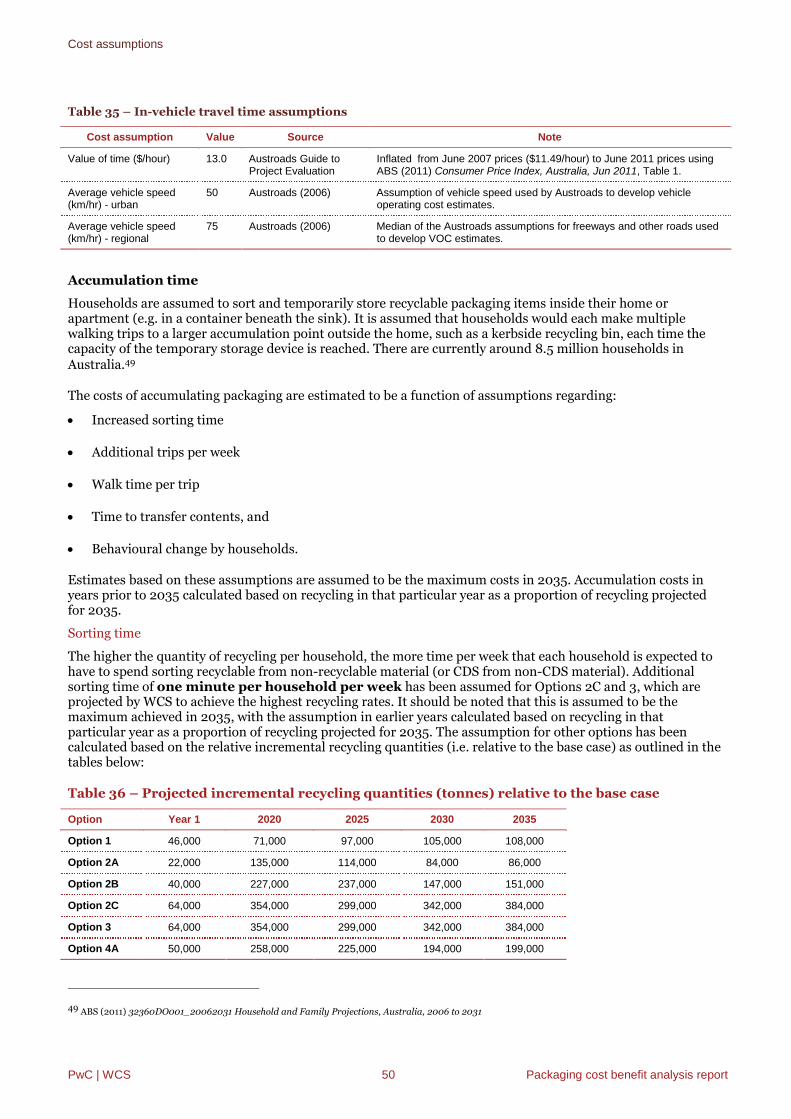
Cost assumptions
PwC | WCS 50 Packaging cost benefit analysis report
Table 35 – In-vehicle travel time assumptions
Cost assumption Value Source Note
Value of time ($/hour) 13.0 Austroads Guide toProject Evaluation
Inflated from June 2007 prices ($11.49/hour) to June 2011 prices usingABS (2011) Consumer Price Index, Australia, Jun 2011, Table 1.
Average vehicle speed(km/hr) - urban
50 Austroads (2006) Assumption of vehicle speed used by Austroads to develop vehicleoperating cost estimates.
Average vehicle speed(km/hr) - regional
75 Austroads (2006) Median of the Austroads assumptions for freeways and other roads usedto develop VOC estimates.
Accumulation time
Households are assumed to sort and temporarily store recyclable packaging items inside their home orapartment (e.g. in a container beneath the sink). It is assumed that households would each make multiplewalking trips to a larger accumulation point outside the home, such as a kerbside recycling bin, each time thecapacity of the temporary storage device is reached. There are currently around 8.5 million households inAustralia.49
The costs of accumulating packaging are estimated to be a function of assumptions regarding:
Increased sorting time
Additional trips per week
Walk time per trip
Time to transfer contents, and
Behavioural change by households.
Estimates based on these assumptions are assumed to be the maximum costs in 2035. Accumulation costs inyears prior to 2035 calculated based on recycling in that particular year as a proportion of recycling projectedfor 2035.
Sorting time
The higher the quantity of recycling per household, the more time per week that each household is expected tohave to spend sorting recyclable from non-recyclable material (or CDS from non-CDS material). Additionalsorting time of one minute per household per week has been assumed for Options 2C and 3, which areprojected by WCS to achieve the highest recycling rates. It should be noted that this is assumed to be themaximum achieved in 2035, with the assumption in earlier years calculated based on recycling in thatparticular year as a proportion of recycling projected for 2035. The assumption for other options has beencalculated based on the relative incremental recycling quantities (i.e. relative to the base case) as outlined in thetables below:
Table 36 – Projected incremental recycling quantities (tonnes) relative to the base case
Option Year 1 2020 2025 2030 2035
Option 1 46,000 71,000 97,000 105,000 108,000
Option 2A 22,000 135,000 114,000 84,000 86,000
Option 2B 40,000 227,000 237,000 147,000 151,000
Option 2C 64,000 354,000 299,000 342,000 384,000
Option 3 64,000 354,000 299,000 342,000 384,000
Option 4A 50,000 258,000 225,000 194,000 199,000
49 ABS (2011) 32360DO001_20062031 Household and Family Projections, Australia, 2006 to 2031
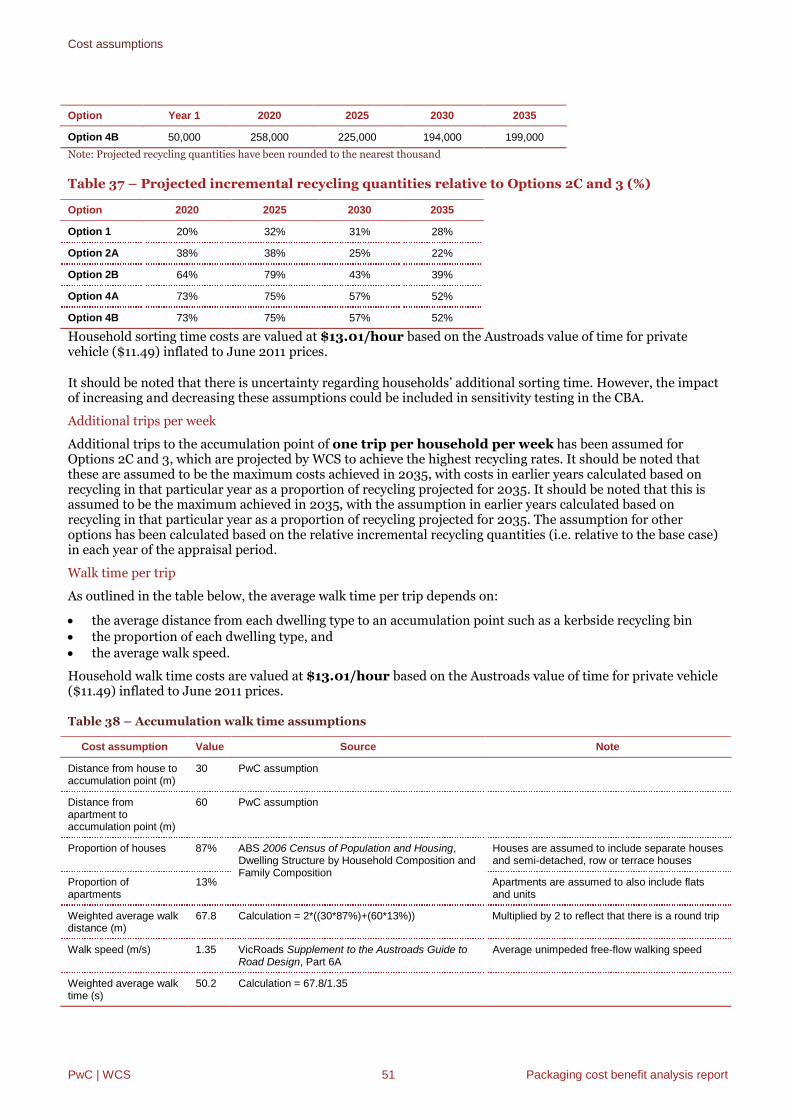
Cost assumptions
PwC | WCS 51 Packaging cost benefit analysis report
Option Year 1 2020 2025 2030 2035
Option 4B 50,000 258,000 225,000 194,000 199,000
Note: Projected recycling quantities have been rounded to the nearest thousand
Table 37 – Projected incremental recycling quantities relative to Options 2C and 3 (%)
Option 2020 2025 2030 2035
Option 1 20% 32% 31% 28%
Option 2A 38% 38% 25% 22%
Option 2B 64% 79% 43% 39%
Option 4A 73% 75% 57% 52%
Option 4B 73% 75% 57% 52%
Household sorting time costs are valued at $13.01/hour based on the Austroads value of time for privatevehicle ($11.49) inflated to June 2011 prices.
It should be noted that there is uncertainty regarding households’ additional sorting time. However, the impactof increasing and decreasing these assumptions could be included in sensitivity testing in the CBA.
Additional trips per week
Additional trips to the accumulation point of one trip per household per week has been assumed forOptions 2C and 3, which are projected by WCS to achieve the highest recycling rates. It should be noted thatthese are assumed to be the maximum costs achieved in 2035, with costs in earlier years calculated based onrecycling in that particular year as a proportion of recycling projected for 2035. It should be noted that this isassumed to be the maximum achieved in 2035, with the assumption in earlier years calculated based onrecycling in that particular year as a proportion of recycling projected for 2035. The assumption for otheroptions has been calculated based on the relative incremental recycling quantities (i.e. relative to the base case)in each year of the appraisal period.
Walk time per trip
As outlined in the table below, the average walk time per trip depends on:
the average distance from each dwelling type to an accumulation point such as a kerbside recycling bin the proportion of each dwelling type, and the average walk speed.
Household walk time costs are valued at $13.01/hour based on the Austroads value of time for private vehicle($11.49) inflated to June 2011 prices.
Table 38 – Accumulation walk time assumptions
Cost assumption Value Source Note
Distance from house toaccumulation point (m)
30 PwC assumption
Distance fromapartment toaccumulation point (m)
60 PwC assumption
Proportion of houses 87% ABS 2006 Census of Population and Housing,Dwelling Structure by Household Composition andFamily Composition
Houses are assumed to include separate housesand semi-detached, row or terrace houses
Proportion ofapartments
13% Apartments are assumed to also include flatsand units
Weighted average walkdistance (m)
67.8 Calculation = 2*((30*87%)+(60*13%)) Multiplied by 2 to reflect that there is a round trip
Walk speed (m/s) 1.35 VicRoads Supplement to the Austroads Guide toRoad Design, Part 6A
Average unimpeded free-flow walking speed
Weighted average walktime (s)
50.2 Calculation = 67.8/1.35

Cost assumptions
PwC | WCS 52 Packaging cost benefit analysis report
Cost assumption Value Source Note
Value of time ($/hour) 13.0 Austroads Guide to Project Evaluation Inflated from June 2007 prices ($11.49/hour) toJune 2011 prices using ABS (2011) ConsumerPrice Index, Australia, Jun 2011, Table 1.
It should be noted that there is uncertainty regarding the average distance from a house/apartment to anaccumulation point. Therefore, intuitive assumptions have been made for the purposes of the CBA. However,the impact of increasing and decreasing these assumptions could be included in sensitivity testing tounderstand the impact of changing these assumptions on the CBA results.
Time to transfer contents
Households are assumed to take time to transfer contents from temporary storage containers (such as a box inthe kitchen of a household) to accumulation points (such as kerbside collection bins). This is assumed to be 5seconds per trip for all options. With the CDS (Options 4A and 4B), it is necessary to transfer packaging to 2separate accumulation bins (i.e. transfer non-CDS packaging to a kerbside bin and transfer containers to aseparate storage bin). However, these options are assumed to have no incremental (i.e. relative to the base case)impact on non-beverage container or flexible packaging recycling, so doubling this assumption for CDS willresult in double counting of costs.
Household transfer time costs are valued at $13.01/hour based on the Austroads value of time for privatevehicle ($11.49) inflated to June 2011 prices.
Behavioural change
The extent to which additional participation costs are imposed on households is assumed to depend on:
the extent to which their recycling activities are already relatively high in the base case, so there is limitedscope for them to increase their recycling activities, and
the extent to which they do not change their behaviour following the implementation of the option, forexample, because they do not value recycling.
As such, these costs are likely to only apply to a proportion of households. Although the actual proportion isunclear. For the purposes of the CBA, accumulation time benefits are assumed to apply to 50% of all householdsin Australia. However, the impact of increasing and decreasing these assumed proportions could be included insensitivity testing in the CBA.
Container deposit redemption time
Following their vehicle journey to container deposit collection infrastructure, there is assumed to be additionaltime associated with walking from their vehicle to the infrastructure (a function of distance and walk speed) andtransaction time to redeem the deposit.
For the purposes of the CBA, assumptions of incremental trips to collection infrastructure will be the same asabove, which were used to estimate vehicle operating costs.
Estimates based on these assumptions are assumed to be the maximum costs achieved in 2035, withaccumulation costs in earlier years calculated based on recycling in that particular year as a proportion ofrecycling projected for 2035.
Container deposit redemption time costs are valued at $13.01/hour based on the Austroads value of time forprivate vehicle ($11.49) inflated to June 2011 prices.
Walk time
Walk time is calculated based on the assumed distance from vehicle parking to container deposit infrastructureand the average walk speed. BA estimated a distance of 50 metres to walk across a car park to redeemcontainers using an RVM.50 However, containers are likely to be returned in relatively larger quantities at
50 Boomerang Alliance (2008) Container Deposits: The Common Sense Approach – Financial Analysis of Costs & Benefits of a National Container DepositSystem, p 14

Cost assumptions
PwC | WCS 53 Packaging cost benefit analysis report
depots because they do not need to be redeemed one at a time like with RVMs. As such, people are likely to bewilling to walk shorter distances with these larger loads. In addition, evidence from the SA CDS indicates thatdepots typically offer a ‘drive-through’ style service where operators at the depots remove the containers fromthe cars. In order to be conservative, an average walk distance of 10 metres has been assumed for the coreCBA. However, it should be noted that there is uncertainty regarding the average distance from a car park tocollection infrastructure, so intuitive assumptions have been made for the purposes of the CBA. However, theimpact of increasing/decreasing these assumptions could be included in sensitivity testing to understand theimpact of changing these assumptions on the CBA results.
A 50 metre round trip to collection infrastructure is assumed to take approximately 1.2 minutes based on theseassumptions, while a 10 metre round trip takes approximately 0.25 minutes.
Table 39 – Assumed walk time from vehicle to container deposit infrastructure - Option 4A
Cost assumption Value Source Note
Distance to hubs (m) 10 Assumption of a larger load of beverage containers thanwith an RVM and the potential for ‘drive-through’ styleservicesDistance to collection
centres (spokes) (m)10
Distance to RVMs (m) 50 BA Financial Analysis of CDS
Distance to regional centrecollection points (m)
10 Assumption of a larger load of beverage containers thanwith an RVM and the potential for ‘drive-through’ styleservices
Walk speed (m/s) 1.35 VicRoads Supplement to theAustroads Guide to Road Design,Part 6A
Average unimpeded free-flow walking speed
Table 40 – Assumed walk time from vehicle to container deposit infrastructure – Option 4B
Cost assumption Value Source Note
Distance to consolidationpoints (m)
10 Assumption of a larger load of beverage containers thanwith an RVM and the potential for ‘drive-through’ styleservices
Distance to depots (m) 10
Distance to RVMs (m) 50 BA Financial Analysis of CDS Assumed to be the same as RVMs
Distance to regional centrecollection points (m)
10 Assumption of a larger load of beverage containers thanwith an RVM and the potential for ‘drive-through’ styleservices
Walk speed (m/s) 1.35 VicRoads Supplement to theAustroads Guide to Road Design,Part 6A
Average unimpeded free-flow walking speed
Container deposit transaction time
BA estimate that the time to process containers using a RVM is 103.seconds per household per week. This isbased on consumption of 12.79 containers per capita/week, 2.7 people per household and3 seconds percontainer to redeem via a RVM51 and is equivalent to 1.7 minutes. Transactions for other types ofinfrastructure are assumed to take twice as long (i.e. 3.4 minutes) given that they are not automated, with anadditional allowance for potential wait time before being served (e.g. if there is a queue of cars at the depot)resulting in an assumption of 5 minutes per transaction.
51 Boomerang Alliance (2008) Container Deposits: The Common Sense Approach – Financial Analysis of Costs & Benefits of a National Container Deposit
System, p 14
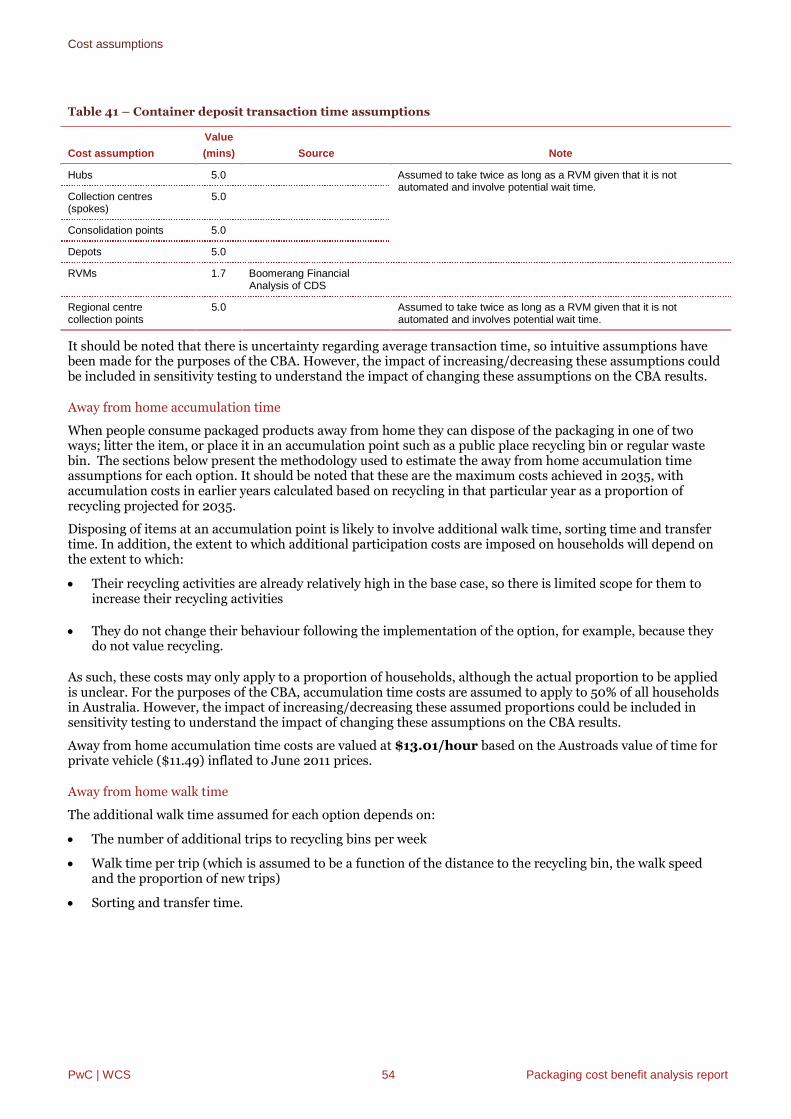
Cost assumptions
PwC | WCS 54 Packaging cost benefit analysis report
Table 41 – Container deposit transaction time assumptions
Cost assumption
Value
(mins) Source Note
Hubs 5.0 Assumed to take twice as long as a RVM given that it is notautomated and involve potential wait time.
Collection centres(spokes)
5.0
Consolidation points 5.0
Depots 5.0
RVMs 1.7 Boomerang FinancialAnalysis of CDS
Regional centrecollection points
5.0 Assumed to take twice as long as a RVM given that it is notautomated and involves potential wait time.
It should be noted that there is uncertainty regarding average transaction time, so intuitive assumptions havebeen made for the purposes of the CBA. However, the impact of increasing/decreasing these assumptions couldbe included in sensitivity testing to understand the impact of changing these assumptions on the CBA results.
Away from home accumulation time
When people consume packaged products away from home they can dispose of the packaging in one of twoways; litter the item, or place it in an accumulation point such as a public place recycling bin or regular wastebin. The sections below present the methodology used to estimate the away from home accumulation timeassumptions for each option. It should be noted that these are the maximum costs achieved in 2035, withaccumulation costs in earlier years calculated based on recycling in that particular year as a proportion ofrecycling projected for 2035.
Disposing of items at an accumulation point is likely to involve additional walk time, sorting time and transfertime. In addition, the extent to which additional participation costs are imposed on households will depend onthe extent to which:
Their recycling activities are already relatively high in the base case, so there is limited scope for them toincrease their recycling activities
They do not change their behaviour following the implementation of the option, for example, because theydo not value recycling.
As such, these costs may only apply to a proportion of households, although the actual proportion to be appliedis unclear. For the purposes of the CBA, accumulation time costs are assumed to apply to 50% of all householdsin Australia. However, the impact of increasing/decreasing these assumed proportions could be included insensitivity testing to understand the impact of changing these assumptions on the CBA results.
Away from home accumulation time costs are valued at $13.01/hour based on the Austroads value of time forprivate vehicle ($11.49) inflated to June 2011 prices.
Away from home walk time
The additional walk time assumed for each option depends on:
The number of additional trips to recycling bins per week
Walk time per trip (which is assumed to be a function of the distance to the recycling bin, the walk speedand the proportion of new trips)
Sorting and transfer time.

Cost assumptions
PwC | WCS 55 Packaging cost benefit analysis report
Additional trips to recycling bins per week
Additional trips to away-from-home recycling bins of one trip per household per week has been assumedfor Options 2C and 3, which are projected by WCS to achieve the highest recycling rates. It should be noted thatthis is assumed to be the maximum achieved in 2035, with assumptions in earlier years calculated based onrecycling in that particular year as a proportion of recycling projected for 2035. The additional trips for otheroptions (except CDS) are assumed to be proportional to the incremental recycling for that option relative toOptions 2C and 3 in each year of the appraisal period. Additional trips for the CDS (Options 4A and 4B) arereduced proportionally to reflect that over 80% of containers are redeemed at CDS collection infrastructure (asopposed to kerbside or CDS) and projected non-beverage container and flexible packaging recycling is notassumed to increase relative to the base case.
Away from home walk time costs are valued at $13.01/hour based on the Austroads value of time for privatevehicle ($11.49) inflated to June 2011 prices.
Walk time per trip
BA estimate that the distance to a rubbish bin is 30 metres. This is also applied to recycling bins given thatthese bins are likely to located next to one another. Given that a high proportion of littering is likely to beunintentional,52 the vast majority (75%) of trips to recycling bins are assumed to be diverted from waste bins.
It should be acknowledged that there is uncertainty regarding the proportion of new trips to away-from-homerecycling infrastructure, with intuitive assumptions used for the purpose of the CBA. However, the impact ofincreasing/decreasing these assumed proportions could be included in sensitivity testing to understand theimpact of changing these assumptions on the CBA results.
Table 42 – Away-from-home walk time per trip
Cost assumption Value Source Note
Distance to recyclingbin (m)
30 BA Financial Analysis of CDS
Proportion of newtrips
25% PwC assumption Away from home recycling infrastructure is assumed to belargely be collocated with existing rubbish bins
Walk speed (m/s) 1.35 VicRoads Supplement to the AustroadsGuide to Road Design, Part 6A
Average unimpeded free-flow walking speed
Away-from-home sorting and transfer time
There is assumed to be additional sorting and transfer times for all options (assumed to be 5 seconds pertrip) given the need to separate packaging and transfer items to separate bins.
With the CDS (Options 4A and 4B), it is necessary to transfer packaging to 2 separate bins. However, theseoptions are assumed to have no incremental (i.e. relative to the base case) impact on non-beverage container orflexible packaging recycling, so doubling this assumption for CDS will result in double counting of costs.
Away-from-home sorting and transfer time costs are valued at $13.01/hour based on the Austroads value oftime for private vehicle ($11.49) inflated to June 2011 prices.
It should be acknowledged that there is uncertainty regarding away from home sorting and transfer time, withintuitive assumptions used for the purpose of the CBA. However, the impact of increasing/decreasing theseassumed proportions could be included in sensitivity testing to understand the impact of changing theseassumptions on the CBA results.
52 See, for example, Keep America Beautiful (2007) Literature Review - Litter: A Review of Litter Studies, Attitude Surveys and Other Litter-related Literature,
p 3.4

Cost assumptions
PwC | WCS 56 Packaging cost benefit analysis report
B. Business/workplace participation costs
Business/workplace participation costs may be incurred by employees taking packaging to temporary storageinfrastructure and cleaners/other staff consolidating packaging in larger storage infrastructure such as skipbins. There are currently around 8 million full time employees in Australia. 53 The value of time for allbusiness/workplace participation costs is assumed to be $42.75 / hour based on the Austroads Guide toProject Evaluation value of time for business vehicles ($37.76/hour) inflated to June 2011 dollars.
Employees
Employees will take packaging to temporary storage infrastructure in their workplace, which will involveadditional trips and sorting time.
There is assumed to be 1 additional trip per day (with additional sorting and transfer time of 1 second peremployee per trip) for Options 2C and 3, which achieve the highest recycling rates in 2035 relative to theother options. It should be noted that this is assumed to be the maximum achieved in 2035, with assumptionsin earlier years calculated based on recycling in that particular year as a proportion of recycling projected for2035. It is assumed that 50% of employees will change their behaviour.
The additional trips for other options (except CDS) are assumed to be proportional to the incremental recyclingfor that option relative to Options 2C and 3 in each year of the appraisal period. With the CDS, recycling of non-beverage containers and flexible packaging is projected to be the same as the base case, so incremental trips willbe as a result of increased beverage container recycling. In line with the experience in South Australia,participation by employees in workplace based CDS is assumed to be 10% with an additional 0.5 trips peremployee per day.
Temporary waste and recycling bins in workplaces are assumed to be co-located, so no additional walk time isassumed (i.e. a trip to the recycling bin related to packaging is assumed to be combined with trips related todisposal or recycling of other products).
It should be acknowledged that there is uncertainty regarding the number of trips and sorting time, withintuitive assumptions used for the purpose of the CBA. However, the impact of increasing/decreasing theseassumed proportions could be included in sensitivity testing to understand the impact of changing theseassumptions on the CBA results.
Cleaners / other staff
Many businesses employ cleaners to transfer the contents of temporary storage infrastructure to largeraccumulation points (such as skip bins). There are nearly 125,000 businesses in Australia with a turnover ofmore than $2 million per year54 (i.e. excluding small businesses). Approximately 50% of large businesses areassumed to employ cleaners who make an additional trip to larger accumulation points every second day by2035 with Options 2C and 2C (which achieve the highest recycling rates relative to other options). It should benoted that this is assumed to be the maximum achieved in 2035, with assumptions in earlier years calculatedbased on recycling in that particular year as a proportion of recycling projected for 2035. The additional tripsfor other options (except CDS) are assumed to be proportional to the incremental recycling for that optionrelative to Options 2C and 3 in each year of the appraisal period.
There is assumed to be additional transfer times for all options (assumed to be 5 seconds per trip) given theneed to separate packaging and transfer items to separate bins. Larger accumulation points are assumed to beco-located, so no additional walk time is assumed.
Time for cleaners/other staff to consolidate packaging in larger storage infrastructure is valued at$42.75/hour based on the Austroads value of time for business vehicles ($37.76/hour) inflated to June 2011prices.
It should be acknowledged that there is uncertainty regarding the number of trips and transfer time, withintuitive assumptions used for the purpose of the CBA. However, the impact of increasing/decreasing these
53 ABS (2011) 6202.0 – Labour Force, Australia, Sep 2011
54 ABS (2011) Counts of Australian Businesses, including Entries and Exits, Jun 2007 to Jun 2009, Table 1

Cost assumptions
PwC | WCS 57 Packaging cost benefit analysis report
assumed proportions could be included in sensitivity testing to understand the impact of changing theseassumptions on the CBA results.
C. Packaging materials collection and transport costs
As outlined in the table below, there are estimated to be costs associated with household kerbside collection($187/tonne) and C&I sector collection ($26/tonne) to collect and transport used packaging fromaccumulation points such as recycling bins to MRFs. These types of collection are assumed to occur in alloptions, although to a varying extent as reflected in recycling projections. For example, kerbside and C&Icollection should occur in tandem with a container deposit scheme (Options 4A and 4B).
Appendix C presents more detail on the source of these assumptions and presents alternative estimates/datasources. Sensitivity testing could be undertaken to determine the impact of changing these assumptions on theCBA results.
It should be noted that the reduction in contamination of kerbside and C&I recycling as a result of the CDSoptions has been reflected in the CBA in the estimates of the market value of resources. A ‘price premium’ hasbeen estimated for certain materials with a CDS to reflect the relatively higher value of items recovered as aresult of reduced contamination.
Table 43 – Packaging material collection and transport cost assumpti0ns
Cost assumption Value Source Note
Kerbside ($/tonne) 187 WCS (2011) See Appendix C
Away from home ($/tonne) 26 WCS (2011) See Appendix C
The core CBA directly applies the kerbside and away from home recycling projections to the cost parameters($/tonne) presented above. It should also be noted that the CDS should divert packaging away from kerbsideand away-from-home recycling, which may reduce the costs of kerbside and away from home collection (i.e.there could be a negative costs in the CBA).
It is estimated that beverage containers in a CDS can be recycled using either municipal (kerbside) recyclingservices (assumed to be 7.1% of total beverage container recycling), C&I recycling services (10.1%) or ‘drop-off’at CDS infrastructure (82.8%).55 In addition, non-packaging paper makes up nearly 40% of the total quantity(tonnes) of kerbside collection56. Recycling services are assumed to be maintained for paper/cardboard, flexiblepackaging and non-beverage containers.
In the core CBA, total beverage container recycling projections for CDS will be multiplied by the proportionrecycled using kerbside (7.1%) and C&I (10.1%) services. These projections are expected to be lower than thebase case, where all packaging is recycled using either kerbside or C&I services. These incremental projectionswill be applied to the parameter values above to estimate negative or avoided costs.
It is arguable that many of these costs will be relatively fixed in the shorter term given that the number of binlifts should not change. However, the reduction in total quantities collected may reduce the number of timesthat a truck has to return a load to the MRF. The table below presents assumptions used to estimate potentialavoided kerbside collection costs of up to $10 million per year (by 2035) with a CDS based on:
Projected at home recycling with a CDS (Options 4A and 4B) relative to the base case between 2016 and2035 based on the proportion of beverage containers recycled using municipal kerbside recycling services(7%)
MRF trips saved due to CDS based on the reduction in kerbside recycling and the assumed tonnes per MRFload
Estimated average time to do a MRF trip and return
Cost to run a truck for one hour.
55 BDA and Wright Corporate Strategy (2010) Beverage Container Investigation – Revised, Table B1.2, p 87.
56 Environment Protection and Heritage Council (201o) 2009-10 Annual Report

Cost assumptions
PwC | WCS 58 Packaging cost benefit analysis report
This alternative estimate of avoided kerbside collection costs could be included in sensitivity testing tounderstand the impact of changing this assumption on the CBA results. This methodology could also bereplicated for away-from-home recycling.
Table 44 – Avoided kerbside collection cost assumptions
Cost assumption Value Source
Load to MRF (tonnes/truck) 10 WCS assumption
Average return trip (hours) 1.5
Truck operating costs ($/hour) 120
It is noted that there may also be longer term savings in the cost of kerbside recycling under CDS options. Forexample, estimates provided by SA from East Waste indicated that a recent upgrade of their fleet costapproximately $1 million or 17% less than it would have without a CDS. These savings have not been included inthe CBA given that they would not be realised each year, but when each recycling company upgraded its fleet.However further investigation of these savings may be warranted and could be conducted for the Decision RIS.
There may also be avoided kerbside residual waste collection costs based on reduced discard of beveragecontainers to the residual waste bin. Unpublished NSW bin audits undertaken between 2003 and 2008indicate that containers comprise around 6% of the residual bin. Based on the estimates prepared for theProblem Report, beverage containers might comprise around 3 to 4 % of the 6%. While the quantity ofbeverage containers discarded to the residual bin may decline slightly, to say 2% the impact on collection costsis unlikely to be significant in any LGA.
D. Processing of recyclate at Material Recovery Facilities
Following kerbside and C&I sector collection and transport of recyclate, the recyclate is processed at a MRF atan estimated cost of $85/tonne. Processing of recyclate at MRFs is assumed to occur in all options, although toa varying extent reflecting differences in recycling projections. For example, a CDS diverts a significantproportion of beverage container recycling away from kerbside and C&I recycling. Beverage containers collectedusing CDS collection infrastructure avoid the need for processing at a MRF. Kerbside and away-from-homerecycling projections for Options 4A and 4B are estimated to be lower than the base case, resulting in negativecosts relative to the base case.
MRF processing costs are estimated to be more variable than kerbside collection costs, so an alternativemethodology to estimate these costs is not considered to be necessary for sensitivity testing.
Table 45 – MRF processing cost assumptions
Cost assumption Value Source Note
Processing cost for materialdelivered to MRF ($/tonne)
45 Based on confidential data fromoperating MRF in NSW providedto WCS
Processing cost for materialdelivered to MRF
Assume residual/reject (%) 20* WCS estimate of contaminationin material received from publicplace recycling and domestickerbside
Assumed cost to landfill residual($/tonne)
200 WCS estimate based on metrolandfill
Assumed cost to landfillresidual. See Appendix D.
Total MRF processing cost(including residual disposal)($/tonne)
85 Total MRF processing costincluding residual disposal
Source: WCS (2011) based on the sources identified in the table aboveNote: * The assumed 20% residual/reject from MRF facilities represents a weighted average of the contamination in recyclables
collected from both domestic kerbside collection and public place recycling. A residual level of 50% can be assumed frompublic place recycling, and a residual level of 15% is assumed from domestic kerbside collection.
It should be noted that the MRF residual (ie. the materials contaminated and not recycled) is assumed to belandfilled and will therefore be reflected in estimates of avoided landfill operating costs and externalities.

Cost assumptions
PwC | WCS 59 Packaging cost benefit analysis report
Scheme operation
A. Government costs to administer regulations
Direct government administration costs relate to costs for government to administer the regulation on anongoing basis, and also include costs related to following up with industry participants to join the co-regulatoryschemes. These costs should be distinguished from scheme administration costs (Section B) which relate to thecosts of establishing an industry run PSO(s) that could be responsible for the establishment and operation ofapproved arrangements under the co-regulatory options (noting that the Australian Government is assumed tofulfil this role under Option 3).
Government costs to administer regulations have been found to generate significant costs for the NationalPackaging Covenant ($640,000 per year)57, and as a result six hours of labour per liable party isassumed. A gross salary of $129,000 was previously estimated by the Department of Sustainability,Environment, Water, Population and Communities58 and on-costs were calculated using the 2009/10 NPPStandard Departmental Staff Costing Template, resulting in an estimate of $180,000 per year.59 Assuming52 weeks per year and a 30% taxation rate results in an estimate of $380 per liable party.
The results of NEPM follow up and enforcement for the current APC are presented in the table below. This dataspans four years, implying that the Government investigates around 246 companies per year. Given therelatively short timeframe for which this data is available, the fact that the number of companies may changeover time and that some options (e.g. Option 2A) may result in more companies being captured, the impact ofincreasing/decreasing these assumed proportions could be included in sensitivity testing.
Table 46 - Results of NEPM follow-up and enforcement (2005-08)
Status of firms Number of firms
Signed NPC 272
Exempt (under $5m pa turnover) 111
Pending 326
NEPM applies (already) 112
Unknown company 71
Not applicable 91
Total firms investigated 983
Years 4
Firms investigated per year 246
Source: Environment Protection and Heritage Council (2010) Decision Regulatory Impact Statement: Used Packaging Materials, p 16
57 Environment Protection and Heritage Council (2010) Decision Regulatory Impact Statement: Used Packaging Materials, p 23; citing Hyder (2008)National Packaging Covenant: Mid-term Review
58 Then the Department of Environment, Water, Heritage and the Arts
59 PwC and Hyder Consulting (2009) Decision Regulatory Impact Statement, prepared for the Environment Protection and Heritage Council, p 215

Cost assumptions
PwC | WCS 60 Packaging cost benefit analysis report
The administration costs per liable party assumed for each of the options are summarised in the table below.
Table 47 –Assumed government costs to administer regulations
OptionCost assumption
($/liable party) Source Note
Option 1 0 Non-regulatoryoption
Development of a National Packaging Waste Strategy.
Option 2A $380 Previous SCEWWorking Groupadvice
Co-regulatory packaging stewardship arrangements under the ProductStewardship Act 2011
Option 2B
Option 2C
Option 3 $380 Requires a separate levy bill and consequential amendments to the Actrelated to administration of levy funds.
Option 4A $380 Co-regulatory or mandatory provisions of the Product Stewardship Act. Mayalso require a separate levy bill and consequently could requireamendments to the Product Stewardship Act related to administration oflevy funds. Consideration could also be given to prohibiting the sale andimport / manufacture of non-recyclable beverage containers.
Option 4B
B. Scheme administration costs
This cost item relates to administrative costs of an industry-run PSO(s) that is assumed to administer theprogram initiatives in all schemes but Option 3 (where the Australian Government will fulfil this function).
Administration costs for the APC were approximately $750,000 in 2008-09 60 and this value is assumed tocontinue for the base case.
Option 1 assumes the establishment of a national body made up of representatives from Commonwealth, State,Territory and local governments. The national body is assumed to oversee the strategy and facilitate theinformation sharing required for coordinated action. It is envisioned that the body would operate in a broadlysimilar manner to the APC Industry Association.61 Scheme administration costs of $750,000 have beenassumed, making no adjustment for the relative efficiency of government versus private administrators.
For each co-regulatory sub-option (Option 2A to 2C) is it envisioned that industry would establish a bodyresponsible for administering an approved co-regulatory arrangement. Such bodies are often referred to as aPSO. The PSO(s) are assumed to be responsible for implementing and directing initiatives that would bedesigned to meet the specified outcomes.62 Scheme regulations are likely to permit multiple approved parties toact as PSOs, which is likely to involve the duplication of fixed costs and increase the scheme administrationcosts. For these options, scheme administration costs are assumed to increase by 50% when there are multiplePSOs operating.
Option 3 is assumed to involve the government placing a mandatory ADF on packaging. Initiativesimplemented under this program could be broadly similar to those outlined for sub-option 2C. However, thekey difference that the fund created by the ADF would be collected and managed by the CommonwealthGovernment.63 As such, there is assumed to be a single Commonwealth body administering the scheme. Noadjustment has been made to account for the relative efficiency of government versus private sectoradministrators.
The CDS (Options 4A and 4B) options are assumed to be administered by a PSO(s), with regulations permittingmultiple approved parties to act as PSOs, in the same manner as the co-regulatory sub-options.
60 Environment Protection and Heritage Council (2010) Decision Regulatory Impact Statement: Used Packaging Materials, p 20
61 PwC and Wright Corporate Strategy (2011) Packaging option report – Draft version 2, 19 August, p 27
62 PwC and Wright Corporate Strategy (2011) Packaging option report – Draft version 2, 19 August, p 30
63 PwC and Wright Corporate Strategy (2011) Packaging option report – Draft version 2, 19 August, p 37
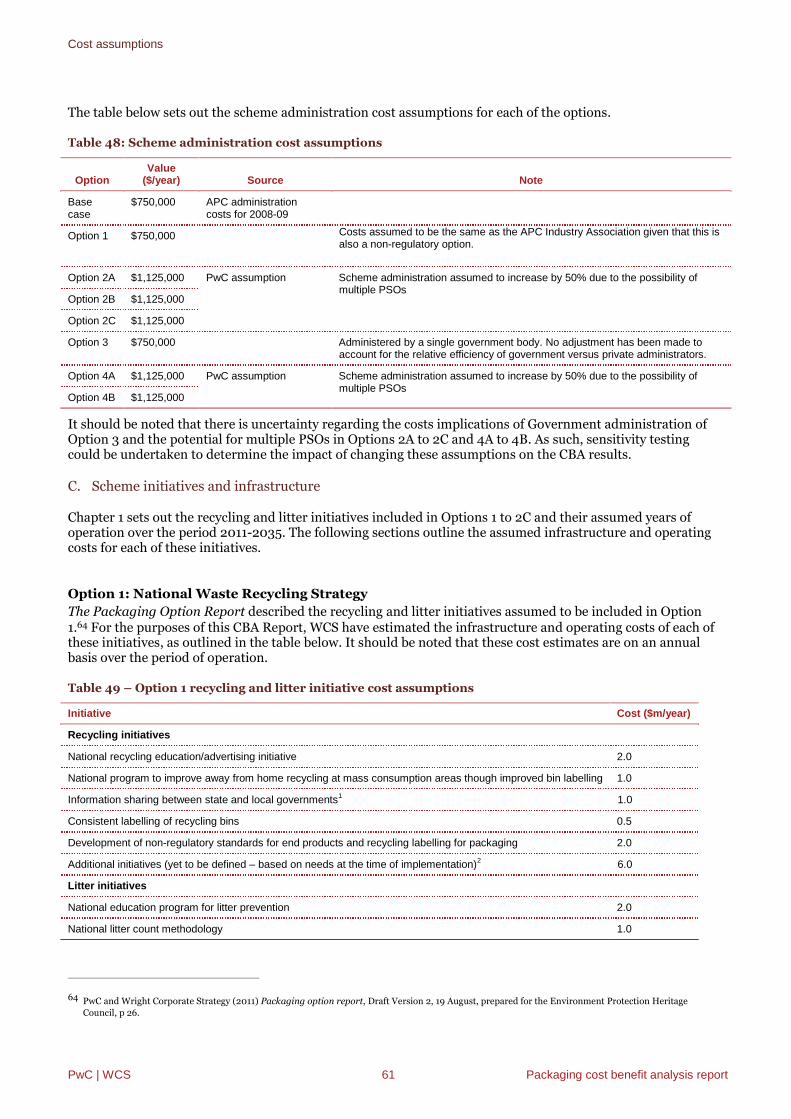
Cost assumptions
PwC | WCS 61 Packaging cost benefit analysis report
The table below sets out the scheme administration cost assumptions for each of the options.
Table 48: Scheme administration cost assumptions
OptionValue
($/year) Source Note
Basecase
$750,000 APC administrationcosts for 2008-09
Option 1 $750,000 Costs assumed to be the same as the APC Industry Association given that this isalso a non-regulatory option.
Option 2A $1,125,000 PwC assumption Scheme administration assumed to increase by 50% due to the possibility ofmultiple PSOs
Option 2B $1,125,000
Option 2C $1,125,000
Option 3 $750,000 Administered by a single government body. No adjustment has been made toaccount for the relative efficiency of government versus private administrators.
Option 4A $1,125,000 PwC assumption Scheme administration assumed to increase by 50% due to the possibility ofmultiple PSOs
Option 4B $1,125,000
It should be noted that there is uncertainty regarding the costs implications of Government administration ofOption 3 and the potential for multiple PSOs in Options 2A to 2C and 4A to 4B. As such, sensitivity testingcould be undertaken to determine the impact of changing these assumptions on the CBA results.
C. Scheme initiatives and infrastructure
Chapter 1 sets out the recycling and litter initiatives included in Options 1 to 2C and their assumed years ofoperation over the period 2011-2035. The following sections outline the assumed infrastructure and operatingcosts for each of these initiatives.
Option 1: National Waste Recycling Strategy
The Packaging Option Report described the recycling and litter initiatives assumed to be included in Option1.64 For the purposes of this CBA Report, WCS have estimated the infrastructure and operating costs of each ofthese initiatives, as outlined in the table below. It should be noted that these cost estimates are on an annualbasis over the period of operation.
Table 49 – Option 1 recycling and litter initiative cost assumptions
Initiative Cost ($m/year)
Recycling initiatives
National recycling education/advertising initiative 2.0
National program to improve away from home recycling at mass consumption areas though improved bin labelling 1.0
Information sharing between state and local governments1 1.0
Consistent labelling of recycling bins 0.5
Development of non-regulatory standards for end products and recycling labelling for packaging 2.0
Additional initiatives (yet to be defined – based on needs at the time of implementation)2 6.0
Litter initiatives
National education program for litter prevention 2.0
National litter count methodology 1.0
64 PwC and Wright Corporate Strategy (2011) Packaging option report, Draft Version 2, 19 August, prepared for the Environment Protection Heritage
Council, p 26.

Cost assumptions
PwC | WCS 62 Packaging cost benefit analysis report
Initiative Cost ($m/year)
Additional initiatives (yet to be defined) 2.0
Source: WCS (2011) based on PwC and Wright Corporate Strategy (2011) Packaging option report, prepared for the EnvironmentProtection Heritage Council, p 26
Note:1. Information sharing between state and local governments: this $1m per year is only incurred from 2015 to 2020. It is considered
appropriate based on the amount of travel, meetings and coordination required for effective information sharing systems to beestablished.
2. Additional initiatives apply from 2021 to 2035. The exact nature of these initiatives will depend on the success of the earlier initiativesand the prevailing issues at the time of implementation (i.e. 2021 onwards). These additional initiatives are discussed Chapter 3, andcould include some of the initiatives proposed in subsequent, more costly options.
The figure below illustrates the distribution of total costs over time for Option 1 based on the assumed years ofoperation of the initiatives. It should be noted that the spike in 2014 represents the development of a nationallitter count methodology, which is assumed to occur in 2014.
Figure 8 – Total cost assumptions over time (2011-2035): Option 1
Source: WCS (2011) based on PwC and Wright Corporate Strategy (2011) Packaging option report, prepared for the EnvironmentProtection Heritage Council, p 26
Option 2A: Co-regulatory Product Stewardship
The Packaging Option Report described the recycling and litter initiatives assumed to be included in Option2A.65 For the purposes of this CBA Report, WCS have estimated the infrastructure and operating costs of eachof these initiatives, as outlined in the table below.
Table 50 – Option 2A recycling and litter initiative cost assumptions
Initiative Cost (m/year)
Recycling initiatives
As per the base case and: 0.0
65 PwC and Wright Corporate Strategy (2011) Packaging option report, Draft Version 2, 19 August, prepared for the Environment Protection Heritage
Council, p 30.
$0.00
$2.00
$4.00
$6.00
$8.00
$10.00
$12.00
To
tal
init
iati
ve
co
sts
($m
illi
on
s)
Recycling initiatives Litter initiatives Total

Cost assumptions
PwC | WCS 63 Packaging cost benefit analysis report
Initiative Cost (m/year)
Additional initiatives (yet to be defined – based on needs at time of implementation)* 2.0
Recycling initiatives
As per the base case 0.0
Source: WCS (2011) based on PwC and Wright Corporate Strategy (2011) Packaging option report, prepared for the EnvironmentProtection Heritage Council, p 30
Note: * Additional initiatives apply from 2021 to 2035. The exact nature of these initiatives will depend on the success of the earlierinitiatives and the prevailing issues at the time of implementation (i.e. 2021 onwards). These additional initiatives are discussedat Chapter 3 above, and could include some of the initiatives proposed in subsequent, more costly options.
The figure below illustrates the distribution of total costs over time for Option 2A based on the assumed years ofoperation of the initiatives. It should be noted that the assumed expenditure on initiatives for this option isrelatively low, with an additional $2 million in recycling initiatives assumed from 2021 onwards. Recycling andlitter projections for this option are not driven by expenditure on initiatives, but instead by improvedcompliance and enforcement as a result of administration by a single jurisdiction (CommonwealthGovernment) instead of multiple state and territory jurisdictions.
Figure 9 – Total cost assumptions over time (2011-2035): Option 2A
Source: WCS (2011) based on PwC and Wright Corporate Strategy (2011) Packaging option report, , prepared for theEnvironment Protection Heritage Council, p 30
Option 2B: Industry Packaging Scheme
The Packaging Option Report described the recycling and litter initiatives assumed to be included in Option2B.66 For the purposes of this CBA Report, WCS have estimated the infrastructure and operating costs of eachof these initiatives, as outlined in the table below.
66 PwC and Wright Corporate Strategy (2011) Packaging option report, Draft Version 2, 19 August, prepared for the Environment Protection Heritage
Council, p 32.
$0.0
$0.5
$1.0
$1.5
$2.0
$2.5
To
tal
init
iati
ve
co
sts
($m
illi
on
s)
Recycling initiatives Litter initiatives Total

Cost assumptions
PwC | WCS 64 Packaging cost benefit analysis report
Table 51 – Option 2B recycling and litter initiative assumptions
InitiativeCost
($m/year)
Recycling initiatives
Increased public place recycling opportunities 10.0*
Improved kerbside recycling through campaigns and education programs 2.0
Improved kerbside recycling through investment in appropriate bin configurations for community circumstances andneeds*
2.0
Additional initiatives (yet to be defined – based on needs at time of implementation. For example, glass end marketdevelopment)
2.0
Improved regional and remote beverage container recovery through organised backload arrangements 1.0
Litter initiatives
Financial incentives to reduce costs for litter clean-up 5.0
Litter prevention campaigns and education campaigns
Improved litter enforcement
Source: WCS (2011) based on PwC and Wright Corporate Strategy (2011) Packaging option report, prepared for the EnvironmentProtection Heritage Council, p 26
Note: *Estimate of costs of $10 million for ‘increased public place recycling opportunities’ is based on an additional 5,000 to 6,000stainless steel indoor bins at a capital cost of up to $2,000 per bin based 0n discussions with David Carter (Packaging Councilof New Zealand) and the National Bin Network. It should be noted that there are not assumed to be additional operating costsfor facility owners because this cost is assumed to be incurred in the base case for beverage containers discarded to theresidual waste bin and collected on a commercial contract.
Additional initiatives apply from 2021 to 2035. The exact nature of these initiatives will depend on the success of the earlierinitiatives and the prevailing issues at the time of implementation (i.e. 2021 onwards). These additional initiatives aredescribed in Chapter 3, and could include some of the initiatives proposed in subsequent, more costly options.
The figure below illustrates the distribution of total costs over time for Option 2B based on the assumed years ofoperation of the initiatives.
Figure 10 – Total cost assumptions over time (2011-2035): Option 2B
Source: WCS (2011) based on PwC and Wright Corporate Strategy (2011) Packaging option report, prepared for the EnvironmentProtection Heritage Council, p 26
$0.0
$5.0
$10.0
$15.0
$20.0
$25.0
To
tal
init
iati
ve
co
sts
($m
illi
on
s)
Recycling initiatives Litter initiatives Total
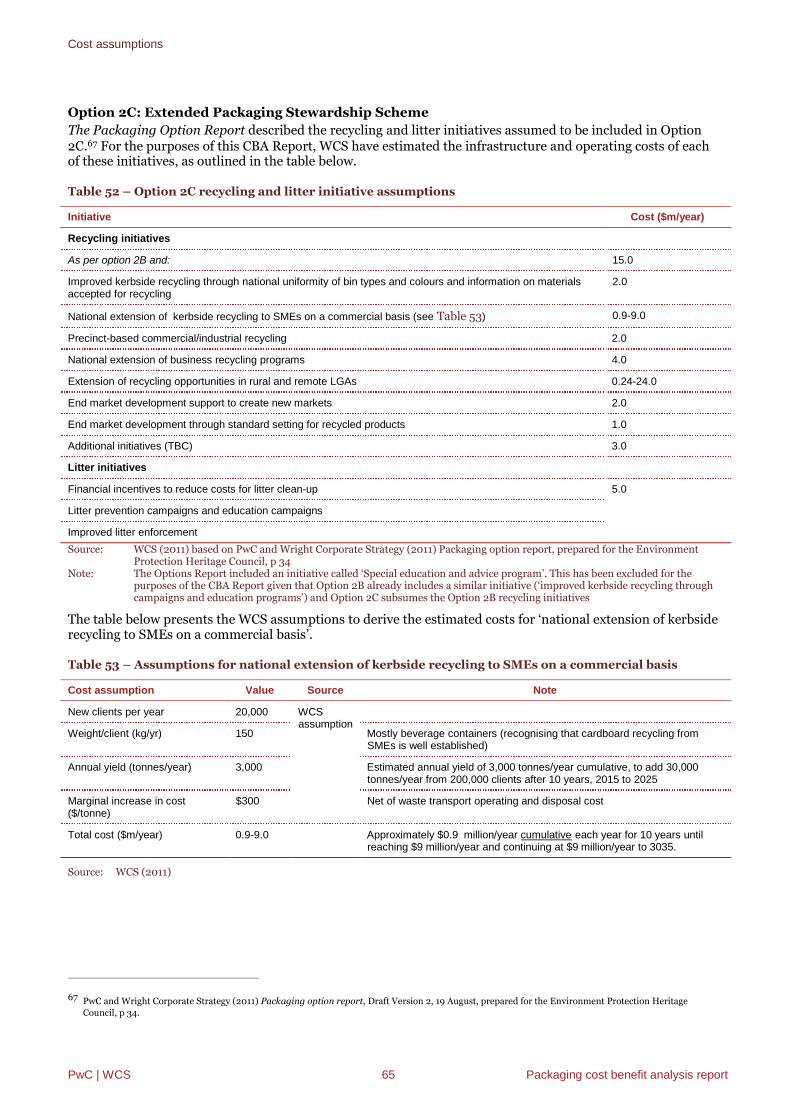
Cost assumptions
PwC | WCS 65 Packaging cost benefit analysis report
Option 2C: Extended Packaging Stewardship Scheme
The Packaging Option Report described the recycling and litter initiatives assumed to be included in Option2C.67 For the purposes of this CBA Report, WCS have estimated the infrastructure and operating costs of eachof these initiatives, as outlined in the table below.
Table 52 – Option 2C recycling and litter initiative assumptions
Initiative Cost ($m/year)
Recycling initiatives
As per option 2B and: 15.0
Improved kerbside recycling through national uniformity of bin types and colours and information on materialsaccepted for recycling
2.0
National extension of kerbside recycling to SMEs on a commercial basis (see Table 53) 0.9-9.0
Precinct-based commercial/industrial recycling 2.0
National extension of business recycling programs 4.0
Extension of recycling opportunities in rural and remote LGAs 0.24-24.0
End market development support to create new markets 2.0
End market development through standard setting for recycled products 1.0
Additional initiatives (TBC) 3.0
Litter initiatives
Financial incentives to reduce costs for litter clean-up 5.0
Litter prevention campaigns and education campaigns
Improved litter enforcement
Source: WCS (2011) based on PwC and Wright Corporate Strategy (2011) Packaging option report, prepared for the EnvironmentProtection Heritage Council, p 34
Note: The Options Report included an initiative called ‘Special education and advice program’. This has been excluded for thepurposes of the CBA Report given that Option 2B already includes a similar initiative (‘improved kerbside recycling throughcampaigns and education programs’) and Option 2C subsumes the Option 2B recycling initiatives
The table below presents the WCS assumptions to derive the estimated costs for ‘national extension of kerbsiderecycling to SMEs on a commercial basis’.
Table 53 – Assumptions for national extension of kerbside recycling to SMEs on a commercial basis
Cost assumption Value Source Note
New clients per year 20,000 WCSassumption
Weight/client (kg/yr) 150 Mostly beverage containers (recognising that cardboard recycling fromSMEs is well established)
Annual yield (tonnes/year) 3,000 Estimated annual yield of 3,000 tonnes/year cumulative, to add 30,000tonnes/year from 200,000 clients after 10 years, 2015 to 2025
Marginal increase in cost($/tonne)
$300 Net of waste transport operating and disposal cost
Total cost ($m/year) 0.9-9.0 Approximately $0.9 million/year cumulative each year for 10 years untilreaching $9 million/year and continuing at $9 million/year to 3035.
Source: WCS (2011)
67 PwC and Wright Corporate Strategy (2011) Packaging option report, Draft Version 2, 19 August, prepared for the Environment Protection Heritage
Council, p 34.

Cost assumptions
PwC | WCS 66 Packaging cost benefit analysis report
The table below presents the WCS assumptions to derive the estimated costs for ‘extension of recyclingopportunities in rural and remote LGAs.
Table 54: Extension of recycling opportunities in rural and remote LGAs
Cost assumption Value Source Note
New client / year 2,000 WCSassumption
Progressive expansion of recycling drop-off opportunities where nokerbside service is available at the rate of 2,000 new clients/year
Yield (kg/year/client) 400 All packaging types
Annual yield (tonnes/yr) 800 Estimated annual yield of 800 tonnes/year cumulative, to add 8,000tonnes/year from 20,000 households after 10 years.
Estimated capital cost for binsand setup ($m/year)
5 Rollout 2015-2035
Operating cost ($/tonne) 300 Inclusive of collection, transport and MRF less avoided waste collectionand disposal cost
Total operating cost ($m/year) 0.24-2.4
$0.24 million/year cumulative for 10 years until reaching $2.4 million/yearand then continuing at $2.4 million/year to 2035.
Source: WCS (2011)
The figure below illustrates the distribution of total costs over time for Option 2C based on the assumed years ofoperation of the initiatives.
Figure 11 – Total cost assumptions over time (2011-2035): Option 2C
Source: WCS (2011) based on PwC and Wright Corporate Strategy (2011) Packaging option report, prepared for the EnvironmentProtection Heritage Council, p 34
$0.0
$5.0
$10.0
$15.0
$20.0
$25.0
$30.0
$35.0
$40.0
$45.0
To
tal
init
iati
ve
co
st
($m
illi
on
s)
Recycling initiatives Litter initiatives Total
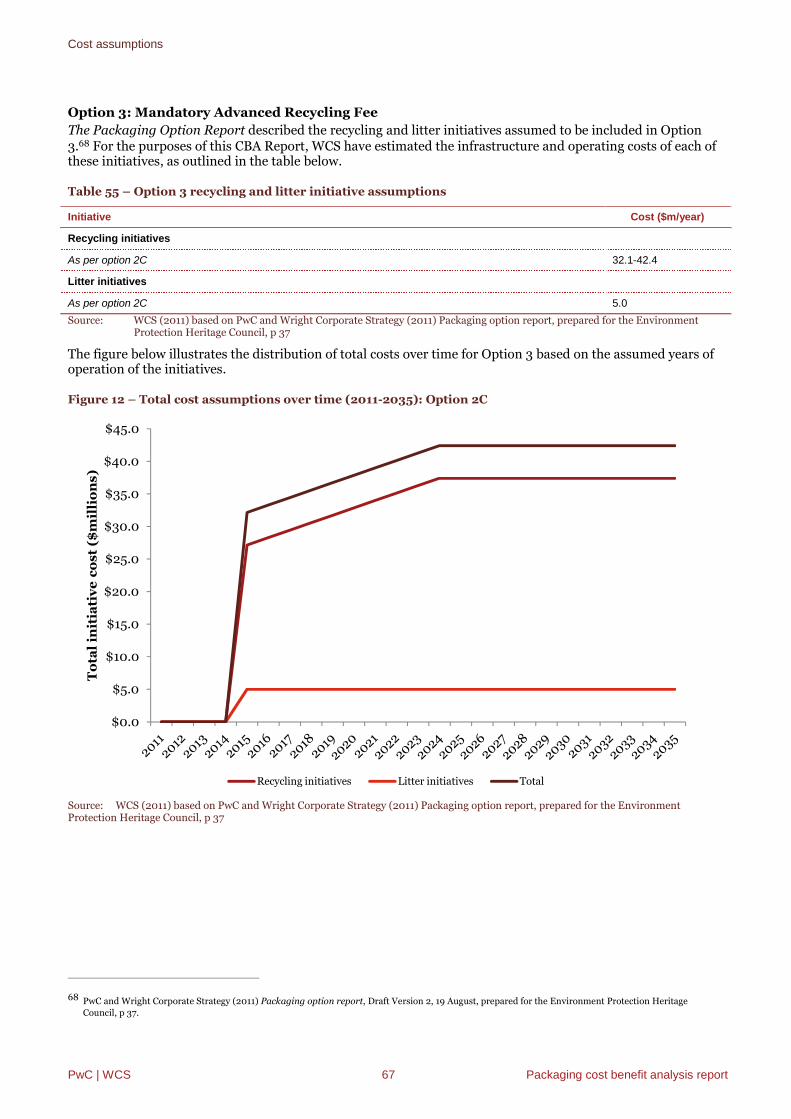
Cost assumptions
PwC | WCS 67 Packaging cost benefit analysis report
Option 3: Mandatory Advanced Recycling Fee
The Packaging Option Report described the recycling and litter initiatives assumed to be included in Option3.68 For the purposes of this CBA Report, WCS have estimated the infrastructure and operating costs of each ofthese initiatives, as outlined in the table below.
Table 55 – Option 3 recycling and litter initiative assumptions
Initiative Cost ($m/year)
Recycling initiatives
As per option 2C 32.1-42.4
Litter initiatives
As per option 2C 5.0
Source: WCS (2011) based on PwC and Wright Corporate Strategy (2011) Packaging option report, prepared for the EnvironmentProtection Heritage Council, p 37
The figure below illustrates the distribution of total costs over time for Option 3 based on the assumed years ofoperation of the initiatives.
Figure 12 – Total cost assumptions over time (2011-2035): Option 2C
Source: WCS (2011) based on PwC and Wright Corporate Strategy (2011) Packaging option report, prepared for the EnvironmentProtection Heritage Council, p 37
68 PwC and Wright Corporate Strategy (2011) Packaging option report, Draft Version 2, 19 August, prepared for the Environment Protection Heritage
Council, p 37.
$0.0
$5.0
$10.0
$15.0
$20.0
$25.0
$30.0
$35.0
$40.0
$45.0
To
tal
init
iati
ve
co
st
($m
illi
on
s)
Recycling initiatives Litter initiatives Total
Cost assumptions
PwC | WCS 68 Packaging cost benefit analysis report
Options 4A and 4B CDS
There are no recycling and litter initiatives included in Opti0ns 4A and 4B, which are CDS options. However,additional infrastructure is required as outlined in Chapter 4.
The BA cost model was provided to WCS on a confidential basis.69 Their model adopted the conventionalapproach to estimating the cost of CDS arrangements whereby estimates are made of the various cost elementson a per container basis. Further, consistent with current normal practice for estimating costs for CDSarrangements in Australia, there was no separation of capital and operating costs. Instead one unit cost is usedand is fully inclusive of both capital and operating costs.
The model contains the following elements:
service areas – such as the cost to consolidate containers, the cost of transport, the cost of RVMs etc.
localities for services – such as kerbside, RVM sites, regional depots and rural and remote depots etc.
unit costs – the cost per container for delivery of the relevant service at the designated locality, as a fullyinclusive capital and operating cost.
In the BA model, detailed supporting estimates were provided of the distribution of containers throughout thesystem covering the number of containers likely to present for re-aggregation at each of the localities whereservices are provided. Using this data, the BA model estimated the cost to deliver CDS services at each of thelocalities and to aggregate the containers to centralised locations for reprocessing.
WCS also prepared cost estimate models for two CDS options in the same format, with the same distribution ofcontainers around the system, the same number of localities for re-aggregation of containers, but usingdifferent estimates for unit costs, which were considered by WCS to be more representative of the current unitcosts.70
The value adopted for Option 4A was 4.5 cents/container and 6.0 cents/container in rural and remote locations.Co-ordination across the system is 0.4 cents/container, baling and transport from collection centres, RVMs andrural and remote collection points to hubs (urban and rural) is 0.72 cents/container, and rural and remotetransport from hubs to reprocessors is estimated at $106.30 per tonne. It should be noted that these estimatesare based on the economic costs of the CDS infrastructure (i.e. include capital and operating costs) and excludethe payment of financial incentives to rural and remote infrastructure operators.
The handling cost adopted for Option 4B was 5.0 cents/container reflecting the smaller number of RVMsproposed for this option, and 6.0 cents/container for rural and remote locations. Co-ordination across thesystem is 0.4 cents/container. Baling for transport is 0.3 cents/container, transport (rural and remote collectionpoint to consolidation depot) is 0.5 cents/container, allowing for backloading efficiencies. Transport fromcollection depots and RVMs to consolidation depots is 0.4 cents/container. Remote transport fromconsolidation depots to reprocessors is estimated at $106.30 per tonne.
It should be noted that these costs are consistent with the 4.0 cents/container handling cost used by BDA/WCSin the Beverage Container Investigation71. Further, the above handling costs are in line with the 4.25cents/container depot handling fee estimate proposed by Stefan Gabrynowicz in his paper dated April 2009.72
69 WCS was required to execute a confidentiality undertaking regarding the handling and copying of the data in this model
70 WCSy concluded that the Boomerang-adopted handling cost was out of date with contemporary practice despite the moderately high deployment of RVMs
in the option. Additional payments proposed to remote hubs and spokes were judged to be insufficient to cover the margin to contemporary costs.
71 BDA Group and Wright Corporate Strategy. Beverage Container Investigation March 2009.
72 Stefan Gabrynowicz, EPA SA. Economic Costs and Benefits of SA’s Container Deposit System April 2009. Note: The 4.25 cents/container is the depothandling fee estimate Gabrynowicz proposed. An estimated of 4.66 cents/container was also proposed as all-up gross cost covering handling fee, admin,transport, super-collector costs

Cost assumptions
PwC | WCS 69 Packaging cost benefit analysis report
The table below presents WCS estimates of scheme costs for Option 4A, which will be applied in the core CBAgiven that the BA costs are confidential and the WCS costs are estimated to be more representative of thecurrent unit costs. However, the BA costs will be included as a sensitivity test to understand the impact of thesecost assumptions on the CBA results, although the unit cost assumptions will not be explicitly stated.73
Table 56 – Boomerang CDS Costs (Option 4A)
Cost assumption Value
Capital and operating costs – Hubs, collection centres and RVMs (c/container) 4.5
Capital and operating costs – Rural/remote collection points (c/container) 6.0
Coordination across system (c/container) 0.4
Baling and transport – collection centres, RVMs and rural/remote collection points to hubs, urban and rural(c/container)
0.72
Rural/remote transport: Hubs to reprocessors ($/tonne) 106.30
Source: WCS (2011)Note:
1. WCS estimates based on “Cash for Containers” investigations during 2010/11 in support of NT Government, and recentdiscussions with SA CDS operators. These estimates are assumed to include the capital and operating costs of infrastructureas well as transport and administration costs.
2. This table is not intended to sum.
The table below presents WCS estimates of scheme costs for Option 4B, which will be applied in the core CBA.The estimated scheme costs have been largely obtained from SA scheme operators on a commercial inconfidence basis. Data has been crosschecked with alternative sources to ensure consistency. The main costs ofany CDS is the handling cost which covers capital and operating costs of depots, RVMs and other redemptionpoints.
Table 57 – Hybrid CDS Costs (Option 4B)
Cost assumption Value
Capital and operating costs – Consolidation points and collection depots (c/container) 5.0
Capital and operating costs – RVMs (c/container) 4.0
Capital and operating costs – Rural/remote collection points (c/container) 6.0
Coordination across system (c/container) 0.4
System administration covering all levels of operation (c/container) 0.1
Baling for transport (c/container) 0.3
Transport: collection depot and RVM to consolidation depot, urban and rural (c/container) 0.4
Transport: Rural/remote collection point to consolidation depot (c/container) 0.5
Rural/remote transport: consolidation depots to reprocessors ($/tonne) 106.30
Source: WCS (2011)Note:
1. WCS estimates based on “Cash for Containers” investigations during 2010/11 in support of NT Government, and recentdiscussions with SA CDS operators. These estimates are assumed to include the capital and operating costs of infrastructureas well as transport and administration costs.
2. Note: This table is not intended to sum.
Industry practice is to express these container handling fees on a unit (i.e. ‘per container’) basis, but theprojections have been estimated on a weight (i.e. ‘per tonne’) basis. As such, it is necessary to convert theseassumptions to be on the same basis as the projections based on assumed weight per container. Themethodology to convert ‘per container’ handling fees to a ‘per tonne’ basis is outlined below.
73 It should be noted that WCS made some minor adjustments to the Boomerang cost estimates in order to reinstate some costs that were omitted.

Cost assumptions
PwC | WCS 70 Packaging cost benefit analysis report
Methodology to convert the basis of the container handling fee assumptions
Step 1: Redemption by infrastructure type
The starting point for the estimate of the container handling fee is to estimate the proportion of containerslikely to be redeemed at each type of collection infrastructure as outlined above in Table 32 and Table 33.Assumptions regarding beverage container redemption by infrastructure type were adjusted for Option 4B toreflect relative differences in the number of collection depots and RVMs.
Table 58 – Assumed trips by infrastructure type (Option 4A)
Infrastructure Type Number Redemption Proportion (%) Source
Hubs 250 25.5 BA estimate of redemption byinfrastructure type (see Table31).Collection depots (spokes) 310 50.5
RVMs (spokes) 640 22.5
Rural/remote collection centres(spokes)
700 1.5
Total 1900 100
Table 59 – Assumed trips by infrastructure type (Option 4B)
Infrastructure Type Number Redemption Proportion (%) Source
Consolidation depots 250 25.5 Table 32, adjusted to reflectrelative differences in thenumber of collection depots andRVMs
Collection depots 600 58.5
RVMs 350 14.5
Rural/remote collection centres 700 1.5
Total 1900 100
Step 2: Allocation of costs by infrastructure type
Some of the CDS costs are applicable to all infrastructure types whereas others are specific to certaininfrastructure types (e.g. rural/remote transport). Costs have been allocated to each infrastructure type basedon the redemption assumptions in Step 1 (above).
Table 60 – Boomerang CDS Costs (Option 4A)
Cost assumption ValueProportion of applicable
infrastructure (%) Note
Capital and operating costs – Hubs, collection centres andRVMs (c/container)
4.5 98 Applies to hubs, collectioncentres and RVMS
= 25% + 49% + 24%
Capital and operating costs – Rural/remote collection points(c/container)
6.0 2 Applies to rural and remoteinfrastructure only
Coordination across system (c/container) 0.4 100 Applies to all infrastructure
Bailing and transport – collection centres, RVMs and regionalcollection points to hubs, urban and rural (c/container)
0.72 100 Applies to all infrastructure
Rural/remote transport: Hubs to reprocessors ($/tonne) 106.30 2 Applies to rural and remoteinfrastructure only
Source: WCS (2011)Note:
1. WCS estimates based on “Cash for Containers” investigations during 2010/11 in support of NT Government, and recentdiscussions with SA CDS operators. These estimates are assumed to include the capital and operating costs of infrastructureas well as transport and administration costs.
2. This table is not intended to sum
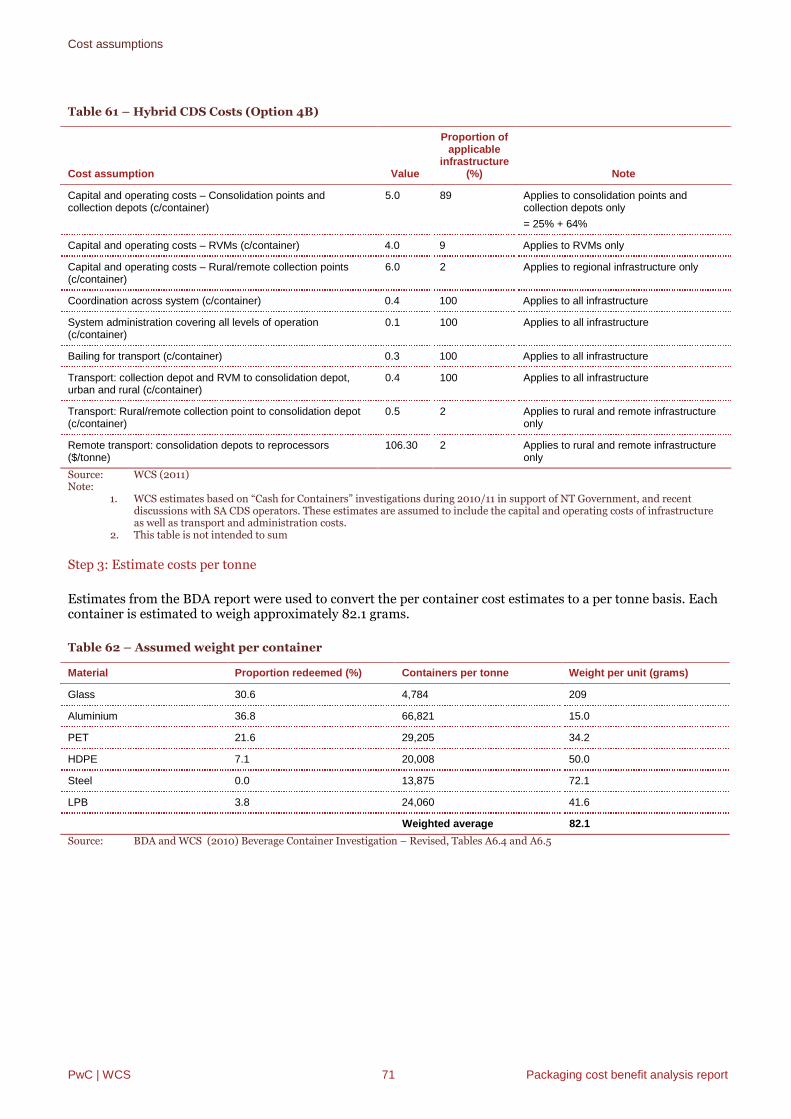
Cost assumptions
PwC | WCS 71 Packaging cost benefit analysis report
Table 61 – Hybrid CDS Costs (Option 4B)
Cost assumption Value
Proportion ofapplicable
infrastructure(%) Note
Capital and operating costs – Consolidation points andcollection depots (c/container)
5.0 89 Applies to consolidation points andcollection depots only
= 25% + 64%
Capital and operating costs – RVMs (c/container) 4.0 9 Applies to RVMs only
Capital and operating costs – Rural/remote collection points(c/container)
6.0 2 Applies to regional infrastructure only
Coordination across system (c/container) 0.4 100 Applies to all infrastructure
System administration covering all levels of operation(c/container)
0.1 100 Applies to all infrastructure
Bailing for transport (c/container) 0.3 100 Applies to all infrastructure
Transport: collection depot and RVM to consolidation depot,urban and rural (c/container)
0.4 100 Applies to all infrastructure
Transport: Rural/remote collection point to consolidation depot(c/container)
0.5 2 Applies to rural and remote infrastructureonly
Remote transport: consolidation depots to reprocessors($/tonne)
106.30 2 Applies to rural and remote infrastructureonly
Source: WCS (2011)Note:
1. WCS estimates based on “Cash for Containers” investigations during 2010/11 in support of NT Government, and recentdiscussions with SA CDS operators. These estimates are assumed to include the capital and operating costs of infrastructureas well as transport and administration costs.
2. This table is not intended to sum
Step 3: Estimate costs per tonne
Estimates from the BDA report were used to convert the per container cost estimates to a per tonne basis. Eachcontainer is estimated to weigh approximately 82.1 grams.
Table 62 – Assumed weight per container
Material Proportion redeemed (%) Containers per tonne Weight per unit (grams)
Glass 30.6 4,784 209
Aluminium 36.8 66,821 15.0
PET 21.6 29,205 34.2
HDPE 7.1 20,008 50.0
Steel 0.0 13,875 72.1
LPB 3.8 24,060 41.6
Weighted average 82.1
Source: BDA and WCS (2010) Beverage Container Investigation – Revised, Tables A6.4 and A6.5

Cost assumptions
PwC | WCS 72 Packaging cost benefit analysis report
The container handling fees are converted to a per tonne basis and then weighted based on the calculations inStep 2.
Table 63 – Container handling fee assumptions ($/tonne) – Option 4A
Cost assumptionValue($/tonne)
Proportion of applicableinfrastructure (%)
Weighted value($/tonne)
Capital and operating costs – Hubs, collection centres andRVMs
548 98 539
Capital and operating costs – Rural/remote collection points 731 2 12
Coordination across system 49 100 49
Bailing and transport – collection centres, RVMs and regionalcollection points to hubs, urban and rural
88 100 88
Rural/remote transport: Hubs to reprocessors 106 2 2
Weighted total 689
Source: WCS (2011)Note:
1. WCS estimates based on “Cash for Containers” investigations during 2010/11 in support of NT Government, and recentdiscussions with SA CDS operators. These estimates are assumed to include the capital and operating costs of infrastructureas well as transport and administration costs.
2. Due to rounding, this table may not add.
Table 64 – Hybrid CDS Costs (Option 4B)
Cost assumption Value ($/tonne)Proportion of applicableinfrastructure (%)
Weighted value($/tonne)
Capital and operating costs – Consolidation points andcollection depots
609 89 544
Capital and operating costs – RVMs (c/container) 487 9 44
Capital and operating costs – Regional collection points 731 2 12
Coordination across system 49 100 49
System administration covering all levels of operation 12 100 12
Bailing for transport 37 100 37
Transport: collection depot and RVM to consolidation depot,urban and rural
49 100 49
Transport: Rural/remote collection point to consolidation depot 61 2 1
Rural/remote transport: consolidation depots to reprocessors 106 2 2
Weighted total 749
Source: WCS (2011)Note:
1. WCS estimates based on “Cash for Containers” investigations during 2010/11 in support of NT Government, and recentdiscussions with SA CDS operators. These estimates are assumed to include the capital and operating costs of infrastructureas well as transport and administration costs.
2. Due to rounding, this table may not add.
Scheme compliance costs
A. Reporting and labelling costs
Businesses that exceed the threshold for inclusion in the scheme (currently an annual turnover of $50 million –see Appendix E for more detail) could incur compliance costs related to preparing action plans and annualreporting. These are estimated in the table below to be around $15,000 per liable party on a weightedaverage basis. It should be noted that these compliance costs relate to the current Covenant and are thereforeassumed to continue in the base case. Therefore, there will therefore only be incremental costs with the optionsto the extent that additional liable parties are captured by the schemes. This will not be the case for Option 1,

Cost assumptions
PwC | WCS 73 Packaging cost benefit analysis report
which is non-regulatory (and assumes continuation of the Covenant), and Options 2B and 2C, which areextensions of current arrangements (i.e. additional funding but capturing the same number of liable parties).
Option 2A brings the APC under the Product Stewardship Act. Increased compliance with this option as aresult of administration by the Commonwealth instead of the states and territories should result in more liableparties being included in the scheme. Similarly, Option 3 is assumed to be administered by the Commonwealthto the same arguments apply.
As outlined in Appendix E, there are currently 567 signatories to the Covenant, of which 531 (94%) are liableparties exceeding the current threshold of $5 million turnover per year. The APC estimates that the Covenantcurrently includes 90% of tonnage and 80% of brands, implying the potential for an additional 59 liableparties if these schemes result in 90% of brands being captured.
Table 65: Estimated direct costs to business signatories of Covenant (2005-2010) participation, 2006
Cost assumptionSmall (turnover up to
$5m/year)Medium (turnover between $5m
and $1b/year)Large (turnover >
$1b/year)
Action plan development (preparedevery 3 years)
$3,000 $5,000 $10,000
Annual reporting $3,000 $10,000 $20,000
Number of businesses 37 505 25
Source: Environment Protection and Heritage Council (2010) Decision Regulatory Impact Statement: Used Packaging Materials, p 22
There is uncertainty regarding the number of additional liable parties that will be captured with Option 2A andOption 3, how the number of liable parties will change over time and whether the mandatory options (Options3, 4A and 4B) will result in liable parties withdrawing from the APC. As a result, the impact ofincreasing/decreasing the number of additional liable parties could be included as a sensitivity test tounderstand the impact of these assumptions on the CBA results.
It should be noted that there are currently costs to industry associations, local governments and environmentalgroups as outlined in the table below (which are assumed to continue in the base case). However, there is noevidence that these costs will change with the options so they have been excluded from the CBA.
Table 66: Estimated direct costs of the Covenant, 2006
SectorTotal annual
cost Typical activities
Industryassociations
$504,000 Participation such as action plan development and implementation, annual reporting,meetings, etc
Local Governments $390,000 Covenant data reporting
Environment groups $15,360 Participation by active groups
Source: Environment Protection and Heritage Council (2010) Decision Regulatory Impact Statement: Used Packaging Materials, p 23
Some businesses could also face costs under a CDS to update labelling of their products. These are expected tobe one off costs to update the design and reconfigure the printing of labels. In the absence of reliable estimatesof the magnitude of these costs, they will be excluded from the CBA but discussed qualitatively.

Cost assumptions
PwC | WCS 74 Packaging cost benefit analysis report
Benefit assumptions
Benefit assumptions
PwC | WCS 75 Packaging cost benefit analysis report
5. Benefit assumptions
There are assumed to be benefits and avoided costs to government, households, businesses and the packagingindustry with the options. The financial benefits and avoided costs are all directly observable values, whereasthe values for society are derived from a stated preference survey of households relating to the amount they arewilling to pay for guaranteed levels of packaging recycling.
Financial benefits
Market value of resources: The financial market value of recovered resources that are divertedfrom the landfill or litter stream
Avoided costs
Avoided regulatory costs: Avoided duplication of regulatory design, implementation andadministration costs by jurisdictions
Avoided landfill externalities: The cost of landfill externalities such as greenhouse gas emissionsand disamenity which are avoided when packaging is recycled
Avoided operating costs of landfill: The direct costs associated with operating landfills includingthe opportunity cost of land, and other ongoing costs
Avoided costs of litter clean up: The direct costs to the government for the range of services theyprovide that contribute to litter prevention including municipal litter services, street sweeping and litterclean up services
Society’s stated preference values:
Society’s willingness to pay for increased recycling: Households place a non-market value onrecovering resources, for example, because they want to live in a less wasteful society or preserveresources or the environment for future generations
The core assumptions for each of these cost categories and potential data sources for sensitivity testing arediscussed below.
In addition, a number of benefits which are excluded from the CBA (either to avoid double counting with otherbenefits, or due to challenges quantifying and monetising) are discussed qualitatively, including:
Co-benefits: Benefits for the recycling of non-packaging recycling such as avoided costs of collectioninfrastructure
Society’s willingness to pay for litter avoidance: Households place a value on litter avoidance due toits negative impacts on society. The value that households place on litter can be considered a non-marketvalue and includes visual amenity, danger to human health due to injuries from broken glass, theopportunity cost of litter clean up and danger to wildlife.
Avoided resource costs: The cost of carbon, electricity and water required for virgin production ofpackaging relative to recycling
Avoided costs of contaminated mixed waste: The avoided costs of removing packaging contaminantsfrom mixed waste
In 2010, PwC conducted a study for TEC on approached to conducting CBAs of CDS options.74 The studyidentified a range of economic and environmental benefits of CDS and theoretical approaches to valuing these.Since this time, the willingness to pay study has been conducted, as well as a range of other studies. Therefore, anumber of benefits have been included in this CBA that were not identified in the 2010 report. Additionally, the2010 report did not seek to quantify the benefits, but identified potential approaches. Therefore, there are a
74 PwC, 2010. Synthesis and critique of existing Consumer Deposit Scheme- Cost Bnefit Analysis. Prepared for the Total Environment Centre, February 2010.

Benefit assumptions
PwC | WCS 76 Packaging cost benefit analysis report
number of benefits that were identified in the report that have not been included in this CBA as it was notpossible or practical to quantify them.
Financial benefits
Market value of resources
The disposal of packaging in landfill means that reprocessors are not able to capture the financial market valueof these resources.
The table below estimates the medium-term prices of packaging materials, which range between $30 - $1,560per tonne depending on the material. There is estimated to be a price premium for certain materials collectedthrough a CDS due to the reduced contamination of kerbside under CDS, as discussed in Appendix F. Thesevalues will be applied in the core CBA for Options 4A and 4B, while the values in the table below will be appliedto all other options.
Table 67 – Market value of packaging materials ($/tonne) – current prices
Material Market value ($ per tonne)
Paper/cardboard $1811
Glass $302
Aluminium Cans $1,5603
Streamed plastics $5604
Plastics – mostly sorted $530
Plastics – fully mixed $3725
Steel Cans $2806
Liquid paperboard $1507
Source: WCS (2011) – based on the following inputs :1. PPI Asia for OCC and Mixed Grade (Visy) and Paper Fibre Network2. Owens Illinois and BDA/MMA (2007)3. LME and Metals Price Archive (Letsrecycle.com)4. Streamed plastics (assuming 40% PET, 20% HDPE, 20% LDPE, 20% mixed) –Recycling industry sources5. Fully mixed plastics (assuming 30% HDPE, 30% PET, 40% mixed) – Recycling industry sources6. Recycling industry sources7. Recycling industry sources
Application of these market value estimates in the CBA is not straight forward and must reflect the following:
The distribution of materials recycled is not likely to remain fixed over the appraisal period, particularlygiven that:
― The recycling of some materials (e.g. paper/recycling) is relatively high and there may be diminishingmarginal returns for the future recycling of these materials
― The options target different products/materials, particularly those with relatively low current recyclinglevels
― Recycling levels in excess of 90% by material are not likely to be feasible.75
Estimates of the material composition of additional recycling with the options are presented inAppendix F and will be applied in the CBA.
It is uncertain that all recyclate quantities will be cleared in the market, particularly given that there arecurrently stockpiling of glass fines. It should be noted, however, that:
― Recycled packaging is likely to only makes up a relatively small proportion of the total quantity ofmaterials recycled. For example, steel cans only make up less than 0.1% of total used steel76
75 PwC and Wright Corporate Strategy (2011) Problem statement for packaging, prepared for the Environment Protection and Heritage Council, p 50

Benefit assumptions
PwC | WCS 77 Packaging cost benefit analysis report
― Options 2C and 3 explicitly include initiatives to develop end markets and it is likely that glass fines willbe targeted given that this has already been identified as an issue
― Companies such as Australian Glass Technology and Colmax are developing new applications such asglass sand for the fines fraction. Currently these markets are relatively low quantity but there ispotential for uses in higher quantity products, such as in road construction. There are a growingnumber of fines processing plants
― Stockpiling may be undertaken so MRFs can take advantage of higher market prices in the future,which could change when these benefits are realised.
Sensitivity testing could be undertaken on the impact of reducing the assumed market value of glass in line withestimated levels of stockpiling (40%).
Appendix F presents more detail on the source of these assumptions and presents alternative data sourceswhich could be included in sensitivity testing to understand the impact of changing these assumptions on theCBA results.
Avoided costs
A. Avoided regulatory costs
There is a broad regulatory failure stemming from fragmented and inconsistent resource recovery and littermanagement frameworks, as discussed in the Problem Statement for Packaging.77
Each jurisdiction has its own waste minimisation legislation or policies. The broad powers provided to eachjurisdiction by waste minimisation legislation – for example the NSW Government’s Waste Avoidance andResource Recovery Act 2001 – means that there is a tangible risk that each jurisdiction will implement adifferent approach to the packaging problem in the absence of a national approach. In fact, specific packagingresponses have already begun to vary in different jurisdictions including a CDS in existence in SA and soon tobe implemented in the NT. Relative to a national approach a state/territory based approach could result in theduplication of planning, administration and effort, which would impose additional costs on society.
Similar arguments regarding duplication of effort can be applied to state policies and programmes to addresslitter and local government initiatives to address packaging waste and litter. Although specific estimates ofthese cost savings are unavailable.
The National Waste Policy Regulatory Impact Statement recently estimated the potential gains from a nationalapproach, as opposed to state/territory based approach. These gains are based on savings from reducedduplication of planning, administration and effort at the jurisdictional level.78 The avoided regulatory costswere calculated following the approach in the Decision Regulatory Impact Statement for Televisions andComputers, as outlined below. This approach indicates that a state based approach has the potential to result inadditional government administration costs in the order of $3 million per annum.
76 BDA Group and Wright Corporate Strategy (2010) Beverage Container Investigation – Revised final report, p. 48.
77 PwC and Wright Corporate Strategy (2011) Problem Statement for Packaging, prepared for the Environment Protection and Heritage Council, 19 August, p
48
78 The Allen Consulting Group (2009) National Waste Policy: Regulatory Impact Statement, p 41; citing PwC and Hyder Consulting (2009) Decision
Regulatory Impact Statement: Televisions and Computers.

Benefit assumptions
PwC | WCS 78 Packaging cost benefit analysis report
Table 68 - A comparison of State/Territory and Commonwealth Government costs for the National WastePolicy
Cost type Commonwealth based (millions/annum) State based (millions / annum)
Regulatory design and implementationcosts
$0.35 $0.4
Direct government administration costs $0.6 $3.5
Total $0.95 $3.9
Source: The Allen Consulting Group (2009) National Waste Policy: Regulatory Impact Statement, p 41; citing PwC and HyderConsulting (2009) Decision Regulatory Impact Statement: Televisions and Computers, pp 113-114
B. Avoided landfill externalities
Landfill of packaging imposes external costs on third parties, such as greenhouse gases (which impact the entireplanet), leachate (which imposes health costs on adjacent communities and habitats) and amenity impacts(which decreases the utility of adjacent communities).
There were at least 665 landfills operating in Australia in 2008, although it is likely that more landfills, bothoperational landfills and closed landfills, may exist.79 In 2006/07, total waste generated was 43.8 milliontonnes, of which 21.1 million tonnes or 48% was disposed of in landfill. 80In 2010, 1.7 million tonnes ofpackaging were disposed of in landfill, accounting for around 8% of total landfill.
Landfill can impact on air, water and soil in a number of ways through:
Landfill gas which is created by the decomposition of organic waste and consists mainly of methane. Whenreleased to the air this contributes to local smog and global warming, and
Leachate, which is formed when water moves from or through waste, and has the potential to contaminatenearby surface and ground water.81
There are also social impacts of landfill on third parties. Landfill may affect the host community, includingthrough noise, odour, dust, increased traffic and exposure to the environmental impacts. In addition, un-managed litter can create amenity impacts in the immediate vicinity of the landfill. The report AustralianLandfill Capacities into the Future found that community objections to landfill are a significant and increasingconstraint on the supply of landfills.82
Over the past decade there has been stringent environmental regulation at some landfills, combined withcollection of landfill gas and the use of landfill gas in energy generation (which displaces fossil fuels). This hasmeant that, over time, the externalities of landfill are reducing.83 However, in the Waste ManagementAssociation of Australia’s national landfill survey, they note that there is:
Inadequate use in small landfills of landfill liners and leachate collections systems to prevent contaminationto groundwater. Limited use of landfill gas capture systems to minimise release of greenhouse gasemissions. This applies particularly to small and medium sized landfills for which the survey response ratewas ‘low’. The survey response for large landfills was just one step higher at ‘low to moderate’.84
79 Waste Management Association of Australia (2009) National Landfill Survey, 2007-08 cited in DEWHA and EPHC (2010) national Waste Report 2010,
Chapter 3L Impacts and opportunities, p 149
80 Hyder (2008) Waste and Recycling in Australia, p 7
81 DEWHA and EPHC (2010) National Waste Report 2010, Chapter 3: Impacts and opportunities, p 150
82 Hyder (2008) Australian landfill capacities into the future, p 5.
83 BDA Group (2009) The full cost of landfill disposal in Australia, p 18
84 Wright Corporate Strategy (2010) Review of the Application of Landfill Standards, p 8

Benefit assumptions
PwC | WCS 79 Packaging cost benefit analysis report
Each material type has a range of impacts. Greenhouse gases are created by paper and cardboard, which areorganic wastes and can take between 10 to 17 years to break down.85 Leachate results from the disposal ofaluminium, steel86 and oxo-degradable plastics.87 All materials are assumed to contribute to disamenity.
The table below presents estimates of the external costs of landfill for large landfills. As discussed in thePackaging Problem Report, large landfills constituted more than 70% by weight in the National Landfill Surveyconducted by the Waste Management Association of Australia.88
Table 69 - External costs of landfill disposal for large urban and rural landfills ($ per tonne)
External cost type External cost value ($/tonne)1
Greenhouse gas emissions (-$5.3)2 – $13.5
Other air emissions $0.2-$1.0
Leachate $0.03
Disamenity $1.0 - $10.0
Source: BDA (2009) The full cost of landfill disposal in Australia, pp 76Note:
1. The range of estimates reflects differences in location (urban versus rural), climate (dry temperate, wet temperate and wettropical) cost controls (best versus poor)
2. Negative values reflect the capture of landfill gas, which can be used as a fuel3. Most modern engineered landfills control leachate through a combination of landfill liners and collection systems and are
generally required to be in suitable locations to avoid risks to groundwater.
Appendix G presents more detail on the source of the estimate of the external costs of landfill disposal forlarge urban and rural landfills. It should be noted that the core CBA has adopted the estimates for large landfillsfor the reasons outlined above, but larger externality costs are expected at smaller landfills, which have lessstringent controls. Weighting the estimate in the table above to account for these differences could alsopotentially be included in sensitivity testing.
C. Avoided operating costs of landfill
There are also avoidable direct costs associated with operating landfills including the opportunity cost of land,and other ongoing operating costs that vary with landfill volumes.
The private costs of landfill include:
land purchase
the approval process
equipment and buildings
construction costs such as excavation and lining of landfill bases to minimise leaching
on-sight gas recovery and flaring
fencing and other measures to prevent waste from being blown into neighbouring properties
operational costs like fuels and materials
monitoring and reporting
capping landfills and landscaping
85 Warnken (2007) The Potential Greenhouse Gas Liability from Landfill in Australia: An examination of the Climate Change Risk from Landfill Emissions
to 2050, p 10 cited in DEWHA and EPHC (2010) National Waste Report 2010, Chapter 3: Impacts and opportunities, p 150
86 DEWHA and EPHC (2010) National Waste Report 2010, Chapter 3: Impacts and opportunities, p 151
87 See, for example, UK Department for Environment, Food and Rural Affairs (2010) Assessing the Environmental Impacts of Ox-degradable plastics across
their life cycle
88 Waste Management Association of Australia (2009) National Landfill Survey 2007-08 cited in DEWHA and EPHC (2010) National Waste Report 2010,
Chapter 3: Impacts and opportunities, pp155-156

Benefit assumptions
PwC | WCS 80 Packaging cost benefit analysis report
rehabilitation and aftercare
employee costs, and
contractors costs.89
The table below presents estimates of the direct costs of landfill for small, medium and large landfills witheither poor controls (for example, no lining or gas recovery) or ‘best practice’ controls.
Table 70 –Operating costs of landfill ($/tonne)
Best practice controls Poor controls
Small $100 $74
Medium $60 $44
Large $40 $30
Source: BDA (2009) The full cost of landfill disposal in Australia, Attachment C
Given that large landfills constituted more than 70% by weight in the National Landfill Survey conducted by theWaste Management Association of Australia,90 private costs of landfill are expected to range from $30 - $40 pertonne.
Appendix H presents more detail on the source of this assumption and presents alternative data sourceswhich could be included in sensitivity testing to understand the impact of changing these assumptions on theCBA results. It should be noted that the core CBA has adopted the estimates for large landfills for the reasonsoutlined above, but higher operating costs are expected at smaller landfills due to decreased economies of scale.Weighting the estimate in the table above to account for these differences could also potentially be included insensitivity testing.
D. Avoided costs of litter cleanup
Governments also offer a range of services that contribute to litter prevention. For example, in Victoria in2008/09 there were 19,498 litter bins provided in metropolitan areas at a cost of $9,724,500 and 18,186 binsprovided in non-metropolitan areas at a cost of $7,112,335.91
It was estimated that in 2008/09 the total cost of providing municipal litter services, street sweeping and litterclean up services in Victoria was $74 million or $13.90 per person. The largest portion of this was for streetsweeping which accounted for 67% of total costs .92 Assuming that the cost per person for litter services inVictoria is similar to other jurisdictions, it is reasonable to say that the cost of litter services nationally could beapproximately $300 million to $350 million annually. Arguably without the significant spend on litterreduction nationally, the negative visual impact of litter could be significantly greater.
The core CBA reduces litter clean up costs in proportion with the percentage reduction in litter tonnes relativeto 2011 (See Figure 6) and packaging litter as a proportion of all litter.
Whilst packaging makes up a significant portion of litter in terms of volume (estimated at 87%)93, it makes upan estimated 37% in terms of number of items.94 This is because packaging litter tends to be higher volumeitems such as food and beverage containers. In contrast, cigarette butts make up nearly 50% of items in thelitter stream and are very low proportion of the total volume of litter.
89 DEWHA and EPHC (2010) National Waste Report 2010, Chapter 3: Impacts and opportunities, p 157
90 Waste Management Association of Australia (2009) National Landfill Survey 2007-08 cited in DEWHA and EPHC (2010) National Waste Report 2010,
Chapter 3: Impacts and opportunities, pp155-156
91 Sustainability Victoria, 2010. Victorian Local Government Annual Survey 2008-09
92 Ibid., p 46.
93 Note that this estimate excludes illegal dumping
94 Calculated from Keep Australia Beautiful (2010) National Litter Index: Annual Report 2009/10, pp 141- 143.

Benefit assumptions
PwC | WCS 81 Packaging cost benefit analysis report
Estimates of the average weight of litter items are not currently available. In order to be conservative, the coreCBA will assume that packaging accounts for 37% of total litter cleanup costs, with potential sensitivity testingto understand the impact of increasing this proportion to 87%.
Society’s stated preference values
Society’s willingness to pay for increased packaging recycling
Households place a value on recovering resources, for example, because they want to live in a less wastefulsociety and preserve resources or the environment for future generations.
In 2010 the Environment Protection and Heritage Council (EPHC) (now the SCEW) commissioned a study toquantitatively estimate households’ willingness to pay for improvements to packaging and beverage containerwaste management. Based on a national sample of 3,432 households from 15 regions within Australia(including eight capital cities and seven regional areas) it was estimated that households are willing to pay, onaverage, $2.77 per year for every 1% increase in the quantity of waste packaging recycled above the currentnational recycling level (with a 95% confidence interval of $2.19 to $3.77).95
The table below presents the recycling projections as a proportion of consumption (%) used to estimate thewillingness to pay for increased recycling. For example, the recycling rate for Options 2C and 3 in 2035represents a 23.9%increase relative to current (2010) recycling levels of 62.5%. This is multiplied by awillingness to pay parameter of $2.77 for every 1% increase in recycling , an 80% aggregation factor to accountfor drop-outs and people in remote areas that were not sampled as part of the study96 and a total of 8.5 millionhouseholds in Australia to derive a total willingness to pay estimate of $451.6 million in 2035. This samecalculation is replicated for each option in each year.
Table 71 – Recycling projections as a proportion of consumption (%) used to estimate willingness to pay forincreased recycling
2010 2015 2020 2025 2030 2035
Base Case 62.5% 67.5% 72.5% 77.1% 79.0% 79.0%
Option 1 62.5% 68.8% 74.0% 79.0% 81.1% 81.1%
Option 2A 62.5% 67.5% 75.4% 79.4% 80.6% 80.6%
Option 2B 62.5% 67.5% 77.3% 81.9% 81.9% 81.9%
Option 2C 62.5% 67.5% 80.0% 83.2% 85.7% 86.4%
Option 3 62.5% 67.5% 80.0% 83.2% 85.7% 86.4%
Option 4A 62.5% 67.5% 77.9% 81.6% 82.8% 82.8%
Option 4B 62.5% 67.5% 77.9% 81.6% 82.8% 82.8%
Source: WCS (2011)
95 PwC (2010) Estimating consumers’ willingness to pay for improvements to packaging and beverage container waste management, p iii
96 PwC (2010) Estimating consumers’ willingness to pay for improvements to packaging and beverage container waste management, p 40

Benefit assumptions
PwC | WCS 82 Packaging cost benefit analysis report
Table 72 – Percentage point increase in recycling relative to 2010
2010 2015 2020 2025 2030 2035
Base Case 0.0 5.0 10.0 14.6 16.5 16.5
Option 1 0.0 6.3 11.5 16.5 18.6 18.6
Option 2A 0.0 5.0 12.9 16.9 18.1 18.1
Option 2B 0.0 5.0 14.8 19.4 19.4 19.4
Option 2C 0.0 5.0 17.5 20.7 23.2 23.9
Option 3 0.0 5.0 17.5 20.7 23.2 23.9
Option 4A 0.0 5.0 15.4 19.1 20.3 20.3
Option 4B 0.0 5.0 15.4 19.1 20.3 20.3
Source: WCS (2011)
Table 73 – Annual recycling willingness to pay estimates by option ($M, undiscounted)
2010 2015 2020 2025 2030 2035
Base Case 0.0 5.0 10.0 14.6 16.5 16.5
Option 1 0.0 94.5 189.0 275.9 311.8 311.8
Option 2A 0.0 119.0 217.3 311.8 351.5 351.5
Option 2B 0.0 94.5 243.8 319.3 342.0 342.0
Option 2C 0.0 94.5 279.7 366.6 366.6 366.6
Option 3 0.0 94.7 330.1 390.4 439.0 450.7
Option 4A 0.0 94.7 330.1 390.4 439.0 450.7
Option 4B 0.0 94.5 291.0 360.9 383.6 383.6
Qualitative discussion of other benefits
The following section qualitatively discusses other benefits which will not be quantified as part of the CBA. Theexistence and extent of some of these benefits is debateable, however, for completeness sake it is appropriatethat even contentious benefits are included in the discussion.
A. Co-benefits
Each of the options could have a range of benefits for recycling of non-packaging items (referred to as ‘co-benefits’). For example, other products such as televisions and computers, mobile phones and batteries couldalso be collected at CDS collection infrastructure. In addition, initiatives targeting increased packaging recyclingor reduced packaging litter may also impact recycling or litter reduction more generally.
While potential co-benefits are an important consideration, these are an indirect benefit of proposed optionsand have been difficult to quantify in the tight timeframes associated with this Consultation RIS. Factorscontributing to this complexity include:
There would be additional costs associated with collecting and storing non-packaging products. Quantifyingthese benefits in the absence of quantifying the associated costs would overstate the net impact of these co-benefits. This would effectively require additional CBAs for each of the products that could potentially becollected at CDS infrastructure, imposing an additional layer of complexity that is not necessary warrantedfor the purposes of a Consultation RIS

Benefit assumptions
PwC | WCS 83 Packaging cost benefit analysis report
A television and computer recycling scheme will be rolled out in 2012. Collection infrastructure associatedwith this scheme has reportedly been designed to derive co-benefits from the collection of other products inaddition to televisions and computers. As a result, many of the potential benefits of the proposed packagingoptions may be captured by this scheme
The experience in South Australia is not directly applicable to Options 4A and 4B given that the proposedmodels rely to a far greater degree on RVMs and smaller ‘shop front’ collection centres, which are likely tobe less suited to accepting other products
As such, a high level qualitative discussion has been included in the CBA Report to assist decision makesunderstand the relativities between the Options.
Option 1
Recycling initiatives
A national recycling education/advertising initiative is likely to result in increased awareness of the importanceof recycling more generally, resulting in increased recycling of non-packaging items.
A national program to improve away-from-home recycling at mass consumption areas through improved binlabelling and consistent labelling of recycling bins may reduce contamination which would increase the amountof non-packaging items, as well as packaging items, recovered.
Litter initiatives
A national education program for litter prevention may impact litter behaviour more generally. A national littercount methodology would also help jurisdictions understand litter issues more generally.
These co-benefits can be considered ‘spill-over’ effects, in that they are benefits that are derived from theinvestment but do not require additional funding.
Option 2A
Option 2A is likely to have minimal impact on the recycling or litter of non-packaging items given that recyclingand litter initiatives are assumed to be the same as the base case, with the exception of additional initiativeswhich are yet to be defined, but will be based on needs at the time of implementation.
Option 2B
Recycling initiatives
Increased public place recycling opportunities and improved recycling through campaigns and educationprograms is likely to increase the awareness of the benefits of recycling more generally, benefiting non-packaging products through increased recycling.
Improved kerbside recycling through investment in appropriate bin configurations is not targeted at packagingspecifically and will benefit non-packaging products (such as newspapers) that are also accepted as part of thisservice. However, improved regional and remote beverage container recovery through improved backloadarrangements is targeted at a sub-set of packaging alone and is not likely to have co-benefits for other products.
Litter initiatives
Financial incentives to reduce costs for litter cleanup (through providing community organisations with fundingfor clean-up campaigns) and increased funding for litter enforcement are not targeted at packaging specifically,and should therefore also benefit other products.

Benefit assumptions
PwC | WCS 84 Packaging cost benefit analysis report
Litter prevention campaigns are likely to impact litter behaviour more generally, resulting in reduced litter ofnon-packaging products.
These co-benefits, like those of Option 1, would not require additional investments.
Option 2C
Option 2C includes the same recycling initiatives as Option 2B and would be expected to generate the same co-benefits that were discussed above.
In addition, improved kerbside recycling through national uniformity of bin types and colours and informationon materials accepted for recycling is not specifically targeted at packaging, and would be likely to benefit otherproducts through increased recycling. A similar argument can be applied to national extension of kerbsiderecycling to SMEs on a commercial basis.
Option 3: Mandatory ADF
Option 3 includes the same recycling initiatives as Option 2C and would be expected to generate the same co-benefits that were discussed above.
The mandatory ADF could also increase the level of producer responsibility imposed on packaging companies.This may lead to additional pressure for companies that produce non-packaging items that can be recycled toengage in product stewardship activities. It may also create additional pressure for packaging companies toconsider sustainability in their packaging design and reduce over-packaging.
Some of these co-benefits, if realised, would not have additional costs. However, other co-benefits, such as non-packaging companies engaging in producer responsibility and re-design of packaging, may come at additionalcost to businesses.
Option 4A and 4B: CDS options
BA, who advocate a CDS, cite a range of benefits of CDS in encouraging other recycling activity such as:
Providing a base level of economic activity for collection centres or depots to be established which can thenbe expanded to collect other materials like used oil, tyres, paint containers etc
Increasing the awareness of the importance of recycling leading to greater recycling of other goods, and
Increasing the recycling of all recyclable materials in remote areas where there is limited or no kerbsiderecycling.97
The depot infrastructure constructed as part of the CDS options could be used for the recycling of non-packaging items, though this would be at additional cost. Many depots in SA currently accept a range of non-packaging items such as newspapers and car batteries (see table in Appendix J), which could lead toadditional benefits of the recycling of other items. Although, it should be noted that the proposed CDS Optionsrely to a far greater degree on RVMs and smaller ‘shop front’ collection centres, which are likely to be less suitedto accepting other products
All these benefits, which may be realised to different extents, are not without cost. For the depots used in CDSto collect other items would require more handling, storage and transportation of items. Unlike some of the co-benefits of other options, these co-benefits are not spill-over effects in that they require additional investments.For example, expanding CDS depot collection to oil, types and paint containers would come at a cost.
97 Boomerang Alliance 2007, Container Deposits: The Common Sense Approach V2.1, p 48.
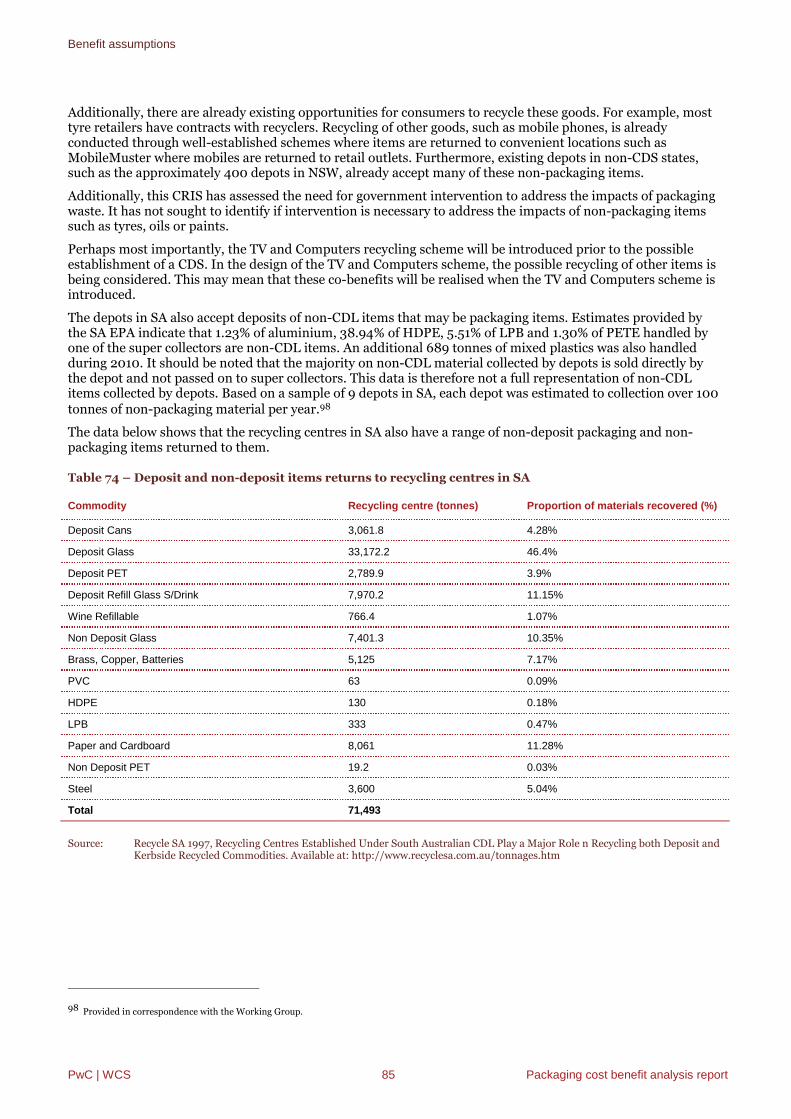
Benefit assumptions
PwC | WCS 85 Packaging cost benefit analysis report
Additionally, there are already existing opportunities for consumers to recycle these goods. For example, mosttyre retailers have contracts with recyclers. Recycling of other goods, such as mobile phones, is alreadyconducted through well-established schemes where items are returned to convenient locations such asMobileMuster where mobiles are returned to retail outlets. Furthermore, existing depots in non-CDS states,such as the approximately 400 depots in NSW, already accept many of these non-packaging items.
Additionally, this CRIS has assessed the need for government intervention to address the impacts of packagingwaste. It has not sought to identify if intervention is necessary to address the impacts of non-packaging itemssuch as tyres, oils or paints.
Perhaps most importantly, the TV and Computers recycling scheme will be introduced prior to the possibleestablishment of a CDS. In the design of the TV and Computers scheme, the possible recycling of other items isbeing considered. This may mean that these co-benefits will be realised when the TV and Computers scheme isintroduced.
The depots in SA also accept deposits of non-CDL items that may be packaging items. Estimates provided bythe SA EPA indicate that 1.23% of aluminium, 38.94% of HDPE, 5.51% of LPB and 1.30% of PETE handled byone of the super collectors are non-CDL items. An additional 689 tonnes of mixed plastics was also handledduring 2010. It should be noted that the majority on non-CDL material collected by depots is sold directly bythe depot and not passed on to super collectors. This data is therefore not a full representation of non-CDLitems collected by depots. Based on a sample of 9 depots in SA, each depot was estimated to collection over 100tonnes of non-packaging material per year.98
The data below shows that the recycling centres in SA also have a range of non-deposit packaging and non-packaging items returned to them.
Table 74 – Deposit and non-deposit items returns to recycling centres in SA
Commodity Recycling centre (tonnes) Proportion of materials recovered (%)
Deposit Cans 3,061.8 4.28%
Deposit Glass 33,172.2 46.4%
Deposit PET 2,789.9 3.9%
Deposit Refill Glass S/Drink 7,970.2 11.15%
Wine Refillable 766.4 1.07%
Non Deposit Glass 7,401.3 10.35%
Brass, Copper, Batteries 5,125 7.17%
PVC 63 0.09%
HDPE 130 0.18%
LPB 333 0.47%
Paper and Cardboard 8,061 11.28%
Non Deposit PET 19.2 0.03%
Steel 3,600 5.04%
Total 71,493
Source: Recycle SA 1997, Recycling Centres Established Under South Australian CDL Play a Major Role n Recycling both Deposit andKerbside Recycled Commodities. Available at: http://www.recyclesa.com.au/tonnages.htm
98 Provided in correspondence with the Working Group.

Benefit assumptions
PwC | WCS 86 Packaging cost benefit analysis report
B. Society’s willingness to pay for reduced packaging litter
In 2010 the EPHC (now the SCEW) commissioned a study to quantitatively estimate households’ willingness topay for improvements to packaging and beverage container waste management. Based on a national sample of3,432 households from 15 regions within Australia (including eight capital cities and seven regional areas) itwas estimated that households are willing to pay, on average $4.15 per 1% reduction in litter based on a 10%(‘noticeable’) or a 20% (‘significant’) improvement.99
The table below presents the projected litter reductions relative to 2010 used to estimate willingness to pay forreduced litter. It should be noted that the willingness to pay study recommends that the unit value estimate isonly applied to litter reduction in the range between and including 10% to 20%.100 For example, a litterreduction of 20% is multiplied by a willingness to pay parameter of $4.15 for every 1% decrease in recycling (i.e.20.0), an 80% aggregation factor to account for drop-outs and people in remote areas that were not sampled aspart of the study101 and a total of 8.5 million households in Australia to derive a total willingness to pay estimateof $5.7 million.
Caution should be exercised when interpreting the litter willingness to pay results given that the estimates fromthe willingness to pay study were not able to be calibrated to determine what respondents actually envisionedby a ‘noticeable’ or ‘significant’ improvement given that the unit of this reduction was not clear. As a result,estimates of the willingness to pay for reduced litter were excluded from the CBA.
Table 75 – Projected litter reductions relative to 2010 (%)
2010 2015 2020 2025 2030 2035
Base Case 0.0% 14.5% 25.0% 39.0% 42.2% 40.7%
Option 1 0.0% 18.0% 32.8% 47.1% 50.9% 49.6%
Option 2A 0.0% 14.5% 36.4% 48.1% 49.6% 48.2%
Option 2B 0.0% 14.5% 42.1% 54.6% 52.2% 51.9%
Option 2C 0.0% 14.5% 48.9% 57.8% 63.1% 63.8%
Option 3 0.0% 14.5% 48.9% 57.8% 63.1% 63.8%
Option 4A 0.0% 14.5% 41.1% 51.8% 54.0% 52.7%
Option 4B 0.0% 14.5% 41.1% 51.8% 54.0% 52.7%
Source: WCS (2011)
Table 76 – Capped litter reduction relative to 2010 used to estimate willingness to pay for reduced litter(%)
2010 2015 2020 2025 2030 2035
Base Case 0.0% 14.5% 20.0% 20.0% 20.0% 20.0%
Option 1 0.0% 18.0% 20.0% 20.0% 20.0% 20.0%
Option 2A 0.0% 14.5% 20.0% 20.0% 20.0% 20.0%
Option 2B 0.0% 14.5% 20.0% 20.0% 20.0% 20.0%
Option 2C 0.0% 14.5% 20.0% 20.0% 20.0% 20.0%
Option 3 0.0% 14.5% 20.0% 20.0% 20.0% 20.0%
Option 4A 0.0% 14.5% 20.0% 20.0% 20.0% 20.0%
Option 4B 0.0% 14.5% 20.0% 20.0% 20.0% 20.0%
99 PwC (2010) Estimating consumers’ willingness to pay for improvements to packaging and beverage container waste management, p iii
100 PwC (2010) Estimating consumers’ willingness to pay for improvements to packaging and beverage container waste management, p iv
101 PwC (2010) Estimating consumers’ willingness to pay for improvements to packaging and beverage container waste management, p 40

Benefit assumptions
PwC | WCS 87 Packaging cost benefit analysis report
Table 77 – Annual litter willingness to pay estimates by option ($M, undiscounted)
2010 2015 2020 2025 2030 2035
Base Case 0.0 3.9 5.7 5.7 5.7 5.7
Option 1 0.0 4.9 5.7 5.7 5.7 5.7
Option 2A 0.0 3.9 5.7 5.7 5.7 5.7
Option 2B 0.0 3.9 5.7 5.7 5.7 5.7
Option 2C 0.0 3.9 5.7 5.7 5.7 5.7
Option 3 0.0 3.9 5.7 5.7 5.7 5.7
Option 4A 0.0 3.9 5.7 5.7 5.7 5.7
Option 4B 0.0 3.9 5.7 5.7 5.7 5.7
C. Avoided resource costs
Currently some 62.5% of all packaging generated in Australia is captured for recycling, leaving 37.5%, or 1.66million tonnes in 2009-10, to be discarded to landfill or littered. Of the predominant materials used inpackaging:
Paper and cardboard represent the only renewable resource in 2009-10, and in excess of 75% of the paperand cardboard packaging was recycled
Steel, aluminium and glass are non-renewable resources that are manufactured from natural resources thatare relatively plentiful. However, they are manufactured using energy sources that are predominantly non-renewable. For steel, aluminium and glass 30%, 67% and 47% respectively were recycled in 2010102, and
Plastics represent a non-renewable resource manufactured from scarce natural resources. In 2010, 34% ofplastic packaging was recycled.
The table below presents estimates of the net environmental benefits (in terms of greenhouse gas emission,energy and water savings) resulting from recycling a tonne of packaging material instead of producing it fromvirgin materials.
These net benefits are not included quantitatively in the CBA due to the uncertainty in accurately quantifyingthem.
Table 78 - Net benefit of recycling 1 tonne of packaging material
Material Resource Greenhouse gases (tonnes CO2e) Cumulative energy demand (GJ LHV) Water use (kl)
Paper / cardboard1 Wood 0.6 9.3-10.8 25.4-28.3
Glass Sand 0.6 6.1-6.9 2.3-2.4
Plastics2 Oil 0.8 – 2.0 38.8-63.0 (22.6) – 71.3
Steel Cans Iron ore 0.4 8.0 (2.4)
Aluminium cans1 Bauxite 15.9 – 17.7 171.1 – 191.4 181.8 - 202.0
Source: NSW Department of Environment, Climate Change and Water (2010) Environmental Benefits of Recycling, p 14.Notes:
1. The range of estimates represents the location of recycling (i.e. kerbside versus C&I)2. The range of estimates represents the location of recycling and the type of plastic.
102 Australian Packaging Covenant (2011) The National Packaging Covenant – 2010 Annual Report, p 11

Benefit assumptions
PwC | WCS 88 Packaging cost benefit analysis report
These benefits could be quantified by applying long term average costs of greenhouse gas emissions ($/tonne),water usage charges ($/kl) and electricity charges ($/kWh), for example based on Treasury modelling of thecarbon tax or regulatory price determinations of utility companies. However, this assumes that additionalrecycling (and use of recycled materials) crowds out upstream production of virgin material. In addition, it isnot robust to include the net environmental benefits without offsetting this with the lost profit of virginproducers.
As a result, this benefit will not be quantified as part of the CBA given that the scale of impact that an Australianpackaging recycling scheme could have on world quantities is not likely be so significant as to change thequantities of virgin materials produced globally each year.
D. Avoided costs of mixed waste contamination
Processing of mixed waste in alternative waste technology (AWT) facilities is progressively being introduced asan alternative to landfill disposal. AWT are particularly being used to process a suite of organic soilconditioning resources that can be used to enhance agricultural production and reduce dependence onimported synthetic fertilisers.
In 2009/10, 0.5 million tonnes of mixed waste was processed in AWTs and this is forecast to grow to around2.0 million tonnes within five years.
Recent regulatory changes for compost-like products in NSW have specified the glass, rigid plastics and filmplastics content of these products so they are acceptable for land application. These packaging fragments formpart of the in-feed waste stream and are challenging to remove from the product lines.
WCS estimated that if all mixed waste AWTs operating in 2009/10 were fitted with suitable equipment andoperated to remove these contaminants (so that the NSW standards are met) this would cost $32 million. Forall future mixed waste AWTs to meet the guidelines, the cost impost is estimated to be $90 million per annumwithin five years.
These additional costs are estimated to amount to around $25/tonne of residual feedstock waste. It should benoted that there is a relatively large degree of uncertainty regarding the future of mixed waste processing andtherefore, this avoided cost is not included in the CBA.
In addition, this benefit only applies if it is actually possible to avoid the need for the contaminant equipmentaltogether at an AWT. No packaging option is projected to completely avoid the discarding of glass and plasticpackaging from the residual waste bin and people are likely to continue to discard other non-packagingcontaminants in the residual waste. As such, it is unlikely that a firm would decline to invest in the extraequipment to remove contaminants.
Therefore, this benefit will be excluded from the core CBA, but could be included as a sensitivity assuming thatthis benefit is not realised until non-beverage recycling reaches 50% and beverage recycling reaches 75%.

Benefit assumptions
PwC | WCS 89 Packaging cost benefit analysis report
Cost benefit analysis
Cost benefit analysis
PwC | WCS 90 Packaging cost benefit analysis report
6. Cost benefit analysis
This section summarise the results of modelling of the benefits and costs of different options to addresspackaging impacts in Australia.
Costs
The table below summarises the incremental present value of costs (relative to the Base Case) for each majorcategory over the analysis period in millions of dollars. For each cost category, CBA model outputs(undiscounted) are presented in the first year of operation of the scheme (‘Year 1’), the year 2020 and the finalyear of the appraisal (2035). It should be noted that the first year of operation differs by Option, ranging from2014 for Option 1 to 2016 for Options 4A and 4B.
The table also presents the present value (PV) of costs (discounted to $2010/11 using a 7% discount rate) overthe entire appraisal period (2011 to 2035). As table 78 shows, Options 4A and 4B, have the highest total costs.This is due to the significant infrastructure investment required in these schemes and the relatively high costsof operating the infrastructure. It should be noted that the infrastructure investment costs of Options 4A and 4Bare based on estimated container handling fees which are designed to cover costs associated with:
Up front capital costs of CDS infrastructure
Ongoing operating costs of CDS infrastructure
Coordination across the system
Bailing and transport.
These costs are offset to a certain extent, however, by avoided cost of collection, transport and recycling as aresult of beverage containers being diverted away from kerbside, C&I collection and recycling systems (andconsequently MRFs). As a result, collection, transport and recycling costs for Options 4A and 4B are negative asthe cost of kerbside recycling, away-from-home recycling and processing at MRFs is lower than in the base case(representing cost savings). Option 1 has the lowest costs of all the options because there are no schemecompliance costs, as well as relatively low scheme design and implementation costs given that it is a voluntaryoption that does not require any additional regulation. It also has relatively low collection, transport andrecycling costs in line with lower projected recycling levels relative to other options.
All the co-regulatory options (ie. Options 2A, 2B and 2C) have similar scheme design and implementation costsand scheme compliance costs. The difference in total costs of Options 2A, 2B and 2C is driven by differences inthe scheme operation costs and collection, transport and recycling costs. Each of the co-regulatory options has adifferent range of initiatives; Option 2C has the largest number of initiatives and therefore, is the highest costco-regulatory option.
Option 3 has similar costs to Option 2C given that it has the same initiatives and projected outcomes withdifferent administrative arrangements.

PwC | WCS 91 Packaging cost benefit analysis report
Table 79 - Incremental costs, annual and present values over the analysis period ($ millions)
Option 1National Waste
Strategy
Option 2a Co-regStewardship
Option 2bIndustry Scheme
Option 2cExtended
Stewardship
Option 3Mandatory ADF
Option 4aBoomerang CDS
Option 4b HybridCDS
Scheme design andimplementation
Year 1 $0 $0 $0 $0 $1 $0 $0
2020 $0 $0 $0 $0 $0 $1 $1
2035 $0 $0 $0 $0 $0 $1 $1
PV $4 $3 $4 $4 $4 $11 $11
Regulation design andimplementation
Year 1 $0 $0 $0 $0 $1 $0 $0
2020 $0 $0 $0 $0 $0 $0 $0
2035 $0 $0 $0 $0 $0 $0 $0
PV $0 $1 $1 $1 $1 $1 $1
Communications Year 1 $0 $0 $0 $0 $0 $0 $0
2020 $0 $0 $0 $0 $0 $1 $1
2035 $0 $0 $0 $0 $0 $1 $1
PV $3 $3 $4 $4 $4 $10 $10
Collection, transportand recycling
Year 1 $0 $0 $0 $0 $0 $0 $0
2020 $17 $32 $49 $78 $78 -$272 -$271
2035 $38 $38 $48 $123 $123 -$293 -$292
PV $219 $239 $365 $630 $630 -$2,269 -$2,260
Household participationcosts
Year 1 $0 $0 $0 $0 $0 $0 $0
2020 $5 $11 $18 $27 $27 $55 $56
2035 $14 $12 $20 $50 $50 $76 $77
PV $83 $83 $152 $250 $250 $447 $457
Business participationcosts
Year 1 $0 $0 $0 $0 $0 $0 $0
2020 $1 $3 $4 $7 $7 $1 $1
2035 $3 $3 $5 $12 $12 $1 $1
PV $20 $20 $37 $61 $61 $7 $7
Collection and transportcosts
Year 1 $0 $0 $0 $0 $0 $0 $0
2020 $5 $7 $8 $14 $14 -$88 -$88
2035 $12 $16 $10 $28 $28 -$107 -$107
PV $53 $70 $58 $125 $125 -$759 -$759
Processing at MRFs Year 1 $0 $0 $0 $0 $0 $0 $0
2020 $6 $12 $19 $30 $30 -$240 -$240
2035 $9 $7 $13 $32 $32 -$263 -$263
PV $63 $66 $118 $194 $194 -$1,964 -$1,964

Cost benefit analysis
PwC | WCS 92 Packaging cost benefit analysis report
Option 1National Waste
Strategy
Option 2a Co-regStewardship
Option 2bIndustry Scheme
Option 2cExtended
Stewardship
Option 3Mandatory ADF
Option 4aBoomerang CDS
Option 4b HybridCDS
Scheme operation Year 1 $0 $0 $0 $0 $0 $0 $0
2020 $9 $0 $20 $38 $38 $542 $584
2035 $9 $2 $20 $43 $42 $626 $674
PV $87 $14 $181 $346 $343 $4,383 $4,720
Government admin ofregs
Year 1 $0 $0 $0 $0 $0 $0 $0
2020 $0 $0 $0 $0 $0 $0 $0
2035 $0 $0 $0 $0 $0 $0 $0
PV $0 $1 $1 $1 $1 $1 $1
Scheme administration Year 1 $0 $0 $0 $0 $0 $0 $0
2020 $0 $0 $0 $0 $0 $0 $0
2035 $0 $0 $0 $0 $0 $0 $0
PV $0 $3 $3 $3 $0 $3 $3
Scheme initiatives andinfrastructure
Year 1 $0 $0 $0 $0 $0 $0 $0
2020 $9 $0 $20 $38 $38 $541 $583
2035 $9 $2 $20 $42 $42 $626 $674
PV $87 $10 $177 $342 $342 $4,379 $4,716
Scheme compliance Year 1 $0 $0 $0 $0 $0 $0 $0
2020 $0 $0 $0 $0 $0 $0 $0
2035 $0 $0 $0 $0 $0 $0 $0
PV $0 $2 $2 $2 $2 $0 $0
Businesses Year 1 $0 $0 $0 $0 $0 $0 $0
2020 $0 $0 $0 $0 $0 $0 $0
2035 $0 $0 $0 $0 $0 $0 $0
PV $0 $2 $2 $2 $2 $0 $0
Total Costs Year 1 $0 $0 $0 $0 $1 $0 $0
2020 $26 $33 $69 $116 $116 $270 $313
2035 $47 $41 $69 $166 $166 $333 $383
PV $311 $258 $552 $982 $979 $2,125 $2,471

PwC | WCS 93 Packaging cost benefit analysis report
Benefits
Willingness to pay benefits have been presented separately from other benefits in the CBA given that the extentof double counting is indeterminate. In arriving at their willingness’ to pay for increased recycling, it is assumedthat they consider both the embedded resources of recycled goods as well as a range of ‘non-use’ values such asenvironmental benefits and a feeling of civic duty. The existing willingness to pay estimates do not allow for theuse and non-use values placed on recycling by households to be separated. Therefore, including both thewillingness’ to pay estimates as well as the market value of resources recovered may lead to double counting ofbenefits.
The following section reports the results of the CBA using the market value of recycled material and table 79details the results of the CBA using the willingness to pay values.
For each benefit category, CBA model outputs (undiscounted) are presented in the first year of operation of thescheme (‘Year 1’), the year 2020 and the final year of the appraisal (2034). It should be noted that the first yearof operation differs by Option, ranging from 20114 for Option 1 to 2016 for Options 4A and 4B. The table alsopresents the PV of benefits (discounted to $2011 using a 7% discount rate) over the entire appraisal period(2011 to 2035).
Market value of recycled materials
Options 2C and 3 have the highest benefits. This is because these options result in the highest level of recyclingand therefore, also have significant benefits which are driven by the embedded value of resources recovered. Asshown below, Options 4A and 4B also have relatively high benefits. This is because under the CDS options thevalue of glass and plastic recovered is higher than under the other options due to reduced contamination.

PwC | WCS 94 Packaging cost benefit analysis report
Table 80 –Incremental benefits using market values of recycled materials, annual and present values over the analysis period ($ millions)
Option 1 NationalWaste Strategy
Option 2a Co-reg
Stewardship
Option 2bIndustryScheme
Option 2cExtended
Stewardship
Option 3Mandatory ADF
Option 4aBoomerang
CDS
Option 4bHybrid CDS
Financial Benefits Year 1 $0 $4 $4 $4 $4 $4 $4
2020 $14 $27 $45 $70 $70 $69 $69
2035 $21 $17 $30 $73 $73 $67 $67
PV $148 $153 $275 $449 $449 $463 $463
Market value ofresources
Year 1 $0 $0 $0 $0 $0 $0 $0
2020 $14 $27 $45 $70 $70 $69 $69
2035 $21 $17 $30 $73 $73 $67 $67
PV $148 $153 $275 $449 $449 $463 $463
Avoided costs Year 1 $0 $4 $4 $4 $4 $4 $4
2020 $11 $22 $33 $49 $49 $38 $38
2035 $17 $18 $26 $54 $54 $32 $32
PV $114 $152 $227 $337 $337 $247 $247
Regulatory costs Year 1 $0 $4 $4 $4 $4 $4 $4
2020 $0 $4 $4 $4 $4 $4 $4
2035 $0 $4 $4 $4 $4 $4 $4
PV $0 $35 $35 $35 $35 $35 $35
Resource costs Year 1 $0 $0 $0 $0 $0 $0 $0
2020 $0 $0 $0 $0 $0 $0 $0
2035 $0 $0 $0 $0 $0 $0 $0
PV $0 $0 $0 $0 $0 $0 $0
Landfill externalities Year 1 $0 $0 $0 $0 $0 $0 $0
2020 $3 $3 $4 $5 $5 $4 $4
2035 $5 $5 $5 $7 $7 $6 $6
PV $31 $30 $36 $43 $43 $36 $36
Landfill operatingcosts
Year 1 $0 $0 $0 $0 $0 $0 $0
2020 $3 $5 $9 $14 $14 $10 $10
2035 $4 $3 $6 $15 $15 $8 $8
PV $29 $31 $55 $91 $91 $62 $62
Mixed wasteprocessing
Year 1 $0 $0 $0 $0 $0 $0 $0
2020 $0 $0 $0 $0 $0 $0 $0
2035 $0 $0 $0 $0 $0 $0 $0

Cost benefit analysis
PwC | WCS 95 Packaging cost benefit analysis report
Table 80 –Incremental benefits using market values of recycled materials, annual and present values over the analysis period ($ millions)
Option 1 NationalWaste Strategy
Option 2a Co-reg
Stewardship
Option 2bIndustryScheme
Option 2cExtended
Stewardship
Option 3Mandatory ADF
Option 4aBoomerang
CDS
Option 4bHybrid CDS
PV $0 $0 $0 $0 $0 $0 $0
Litter clean up Year 1 $0 $0 $0 $0 $0 $0 $0
2020 $5 $10 $17 $26 $26 $19 $19
2035 $8 $6 $11 $28 $28 $15
PV $54 $56 $102 $168 $168 $114 $114
Total Benefits Year 1 $0 $4 $4 $4 $4 $4 $4
2020 $25 $49 $78 $119 $119 $107 $107
2035 $38 $35 $55 $127 $127 $99 $99
PV $262 $304 $503 $786 $786 $710 $710

PwC | WCS 96 Packaging cost benefit analysis report
Willingness to pay for recycled materials
An alternative measure of the increased value of recycling as a result of the options is the willingness to pay forrecycling. Households place a value on increasing recycling that, to an unknown extent, includes the value ofthe embedded resources in recycled goods and a range of other ‘non-use’ components. These non-usecomponents that lead households to value recycling could include the environmental benefits or a feeling ofcivic duty.
In 2010 PwC was commissioned by the EPHC to undertake a study of households’ willingness to pay (WTP) forrecycling. In the study it was found that households were willing to pay on average $2.77 per year for every 1%increase above current levels of tonnes of packaging recycled.103
The below table presents the present value of the willingness to pay benefits estimated using the 95%confidence interval lower bound of $2.19 and upper bound of $3.77, in addition to the core estimate of $2.77.This analysis indicates that the present value of the willingness to pay benefits ranges from $233 million for thelower bound estimate of Option 2A to $1.2 billion for the upper bound estimate of Options 2C and 3.
Table 81 - Summary of willingness to pay benefits (incremental to base case, $millions, PV)
Option 1NationalWaste
Strategy
Option 2ACo-reg
Stewardship
Option 2BIndustryScheme
Option 2CExtended
Stewardship
Option 3Mandatory
ADF
Option 4ABoomerang
CDS
Option4B
HybridCDS
Lower confidence interval PV $234 $233 $422 $689 $689 $465 $465
Point estimate PV $296 $295 $534 $871 $871 $588 $588
Upper confidence interval PV $403 $402 $727 $1,186 $1,186 $801 $801
It is potentially misleading to include both estimates of the willingness to pay for increased recycling and themarket value of materials given the possibility of double counting (i.e. if it was true that households consideredmarket values associated with packaging when responding to the questionnaire that was employed to estimatewillingness to pay). It is not possible to disaggregate this WTP value into the use (i.e. the market value ofresources) and non-use values of recycling, so the extent of this potential double counting is indeterminate.
As well as placing a value on increasing recycling, society places a value on reducing litter. The 2010 PwC studyconducted analysis of the extent to which households value decreases in litter. However, it was not possible toreliably include these WTP for reductions in litter in the CBA. This is because households were asked abouttheir willingness to pay for a ‘visual’ reduction in litter and were not given units of measurement, meaning thatthe results require calibration against the quantity or tonnes of litter expected to be reduced.
Results
The COAG guidelines favour highest NPV, as this assists in selection of the option that generates the greatestnet benefit for the community.104 A BCR is usually useful when there are budget constraints and the most‘effective’ spend for each dollar spent.
Option 2A is the only option with a positive NPVs and BCRs of greater than 1 meaning that the benefits of thisoptions are greater than the costs when non-use values are excluded. All other options have negative NPVs andBCRs meaning that the costs are greater than the benefits when non-use values are excluded. Options 2B hasthe second highest BCR and NPV, with a BCR of 0.91. Options 2C and 3 have the highest benefits, however alsoentail the greater costs than Options 1, 2A or 2B. Options 4A and B have relatively high benefits, however alsohave the greatest costs resulting in the lowest NPV and BCR of the options.
103 PwC, 2010. Estimating consumes’ willingness to pay for improvements to packaging and beverage container waste management.
104 COAG 2007, Best Practice Regulation: A Guide for Ministerial Councils and Standard Setting Bodies.
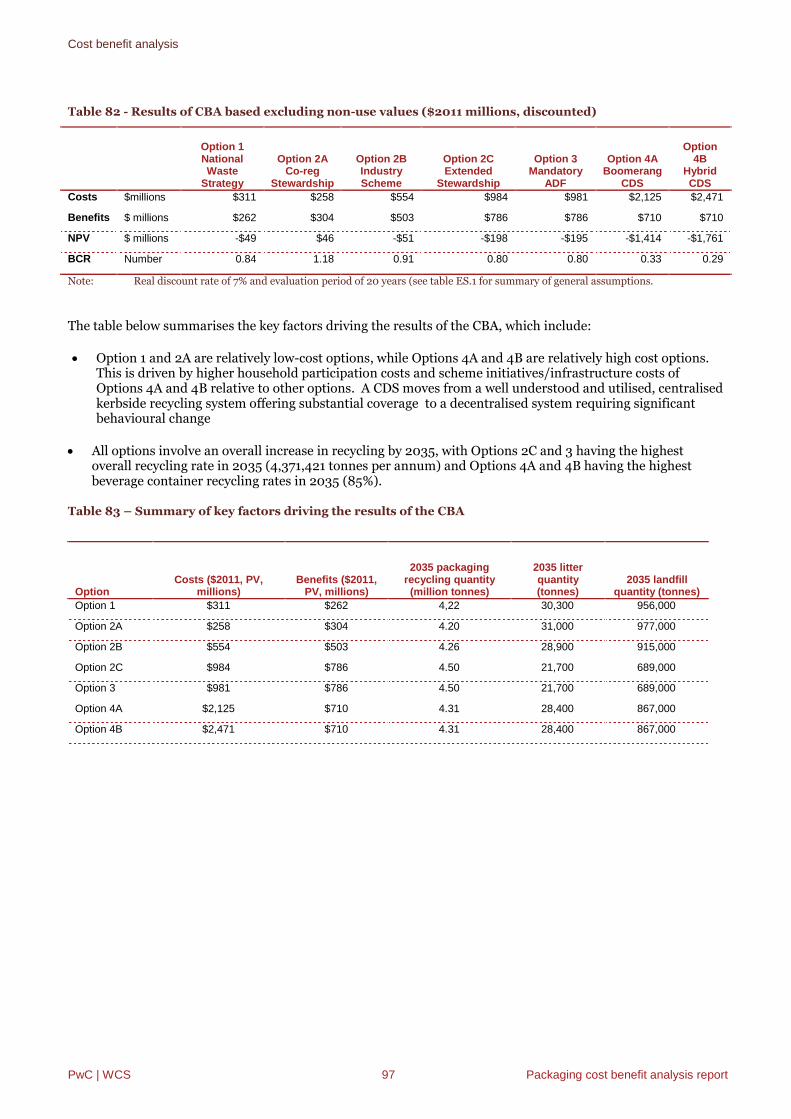
Cost benefit analysis
PwC | WCS 97 Packaging cost benefit analysis report
Table 82 - Results of CBA based excluding non-use values ($2011 millions, discounted)
Option 1NationalWaste
Strategy
Option 2ACo-reg
Stewardship
Option 2BIndustryScheme
Option 2CExtended
Stewardship
Option 3Mandatory
ADF
Option 4ABoomerang
CDS
Option4B
HybridCDS
Costs $millions $311 $258 $554 $984 $981 $2,125 $2,471
Benefits $ millions $262 $304 $503 $786 $786 $710 $710
NPV $ millions -$49 $46 -$51 -$198 -$195 -$1,414 -$1,761
BCR Number 0.84 1.18 0.91 0.80 0.80 0.33 0.29
Note: Real discount rate of 7% and evaluation period of 20 years (see table ES.1 for summary of general assumptions.
The table below summarises the key factors driving the results of the CBA, which include:
Option 1 and 2A are relatively low-cost options, while Options 4A and 4B are relatively high cost options.This is driven by higher household participation costs and scheme initiatives/infrastructure costs ofOptions 4A and 4B relative to other options. A CDS moves from a well understood and utilised, centralisedkerbside recycling system offering substantial coverage to a decentralised system requiring significantbehavioural change
All options involve an overall increase in recycling by 2035, with Options 2C and 3 having the highestoverall recycling rate in 2035 (4,371,421 tonnes per annum) and Options 4A and 4B having the highestbeverage container recycling rates in 2035 (85%).
Table 83 – Summary of key factors driving the results of the CBA
OptionCosts ($2011, PV,
millions)Benefits ($2011,
PV, millions)
2035 packagingrecycling quantity(million tonnes)
2035 litterquantity(tonnes)
2035 landfillquantity (tonnes)
Option 1 $311 $262 4,22 30,300 956,000
Option 2A $258 $304 4.20 31,000 977,000
Option 2B $554 $503 4.26 28,900 915,000
Option 2C $984 $786 4.50 21,700 689,000
Option 3 $981 $786 4.50 21,700 689,000
Option 4A $2,125 $710 4.31 28,400 867,000
Option 4B $2,471 $710 4.31 28,400 867,000

Cost benefit analysis
PwC | WCS 98 Packaging cost benefit analysis report
Distribution of costs and benefitsThe table below qualitatively identifies the primary parties to which costs and benefits quantified as part of thisCBA are likely to accrue.
Table 84 - Distribution of CBA costs and benefits
Option 1Options 2A, 2B and
2C Option 3 Options 4A and 4B
Market value of resources Recyclers Recyclers Recyclers Recyclers
WTP for increased packagingrecycling
Households Households Households Households
WTP for reduced packing litter Households Households Households Households
Avoided regulatory costs State Government State Government State Government State Government
Landfill externalities Households Households Households Households
Landfill operating costs Local Government Local Government Local Government Local Government
Litter clean up Local Government Local Government Local Government Local Government
Regulation design andimplementation
N/A Cth Government Cth Government Cth Government
Government participation costs Cth Government N/A N/A N/A
Communications Cth Government /Industry
Cth Government /Industry
Cth Government /Industry
Cth Government /Industry
Household participation costs Households Households Households Households
Business participation costs Employees /businesses
Employees /businesses
Employees /businesses
Employees /businesses
Collection and transport costs Local Government /Recyclers
Local Government /Recyclers
Local Government /Recyclers
Local Government /Recyclers
Processing at MRFs Local Government /Recyclers
Local Government /Recyclers
Local Government /Recyclers
Local Government /Recyclers
Government administration ofregulations
N/A Cth Government Cth Government Cth Government
Scheme administration Industry PSO(s) Industry PSO(s) Cth Government Industry PSO(s)
Scheme initiatives andinfrastructure
Industry PSO(s) Industry PSO(s) Cth Government Industry PSO(s)
Industry compliance Packaging industry Packaging industry Packaging industry Packaging industry
Sensitivity analysis
In order to test the sensitivity of results to changes in costs, benefits and discount rates a range of sensitivitytests were undertaken. The results of the sensitivity test can be summarised as follows:
Given that costs and benefits continue throughout the entire appraisal period, they are not particularlysensitive to changes in discount rates
Results are very sensitive to changes in the cost estimates. If costs decrease by 30%, all options except theCDS (Options 4A and 4B) become viable without including the willingness to pay estimates
Results are also sensitive to changes in benefits. If benefits are underestimated by 30%, all options exceptthe CDS (Options 4A and 4B) become viable without including the willingness to pay estimates
The CDS (Options 4A and 4B) are not estimated to be viable under any sensitivity testing scenario

Cost benefit analysis
PwC | WCS 99 Packaging cost benefit analysis report
Option 1 is only economically viable when the benefits are increased by 30%, the costs reduced by 30% andthe proportion of litter that is packaging is increased
Option 2A remains economically viable except when costs are increased by 30%, benefits decreased by 30%and in the worst case scenario where costs are increased and benefits decreased,
Option 2B is economically viable when the benefits are increased by 30%, the costs reduced by 30% and theproportion of litter that is packaging is increased.
Option 2C and 3 are only economically viable when benefits overall are increased, overall costs aredecreased and the proportion of packaging litter is increased. However, it should be noted that Option 2Cand 3 have BCRs of above 0.8 under a number of sensitivity tests meaning they are nearing beingeconomically viable.
General sensitivity analysis
Adjusting the discount rates, costs and benefits does not change the relativities of the options.
Options 4A and 4B have negative NPVs and BCRs of below 1 when the costs are decreased or benefits increased.

PwC | WCS 100 Packaging cost benefit analysis report
Table 85 - Summary of general sensitivity testing based on market values, NPV ($ millions)
Option 1 NationalWaste Strategy
Option 2a Co-regStewardship
Option 2bIndustry Scheme
Option 2cExtended
StewardshipOption 3
Mandatory ADFOption 4a
Boomerang CDSOption 4b Hybrid
CDS
Discount rate- 3%NPV
-$81 $59 -$87 -$341 -$336 -$2,458 -$3,040
Discount rate- 10%NPV
-$35 $38 -$37 -$138 -$136 -$971 -$1,216
Discount rate- 1.85%NPV
-$95 $62 -$103 -$404 -$399 -$2,915 -$3,600
Costs- 70%NPV
$45 $124 $115 $98 $100 -$777 -$1,020
Costs- 130%NPV
-$142 -$31 -$217 -$493 -$489 -$2,052 -$2,502
Benefits- 70%NPV
-$127 -$45 -$202 -$433 -$430 -$1,627 -$1,974
Benefits- 130%NPV
-$142 -$31 -$217 -$493 -$489 -$2,052 -$2,502
Benefits 70%; Costs 130%NPV
-$127 -$45 -$202 -$433 -$430 -$1,627 -$1,974
Benefits 130%; Costs 70%NPV
$30 $138 $100 $38 $41 -$1,201 -$1,548
Table 86 - Summary of general sensitivity testing based on market values, BCR
Option 1 NationalWaste Strategy
Option 2a Co-regStewardship
Option 2bIndustry Scheme
Option 2cExtended
StewardshipOption 3
Mandatory ADFOption 4a
Boomerang CDSOption 4b Hybrid
CDS
Discount rate- 3%BCR 0.84 1.13 0.91 0.80 0.80 0.33 0.28
Discount rate- 10%BCR 0.84 1.21 0.91 0.80 0.80 0.34 0.29
Discount rate- 1.85%BCR 0.84 1.12 0.90 0.80 0.80 0.32 0.28
Costs- 70%BCR 1.20 1.69 1.30 1.14 1.15 0.48 0.41
Costs- 130%BCR 0.65 0.91 0.70 0.61 0.62 0.26 0.22
Benefits- 70%BCR 0.59 0.83 0.64 0.56 0.56 0.23 0.20
Benefits- 130%BCR 1.10 1.53 1.18 1.04 1.04 0.43 0.37
Benefits 70%; Costs 130%BCR 0.45 0.64 0.49 0.43 0.43 0.18 0.15
Benefits 130%; Costs 70%BCR 0.84 1.18 0.91 0.80 0.80 0.33 0.29

PwC | WCS 101 Packaging cost benefit analysis report
Household and business participation costs
Household participation costs
When the household participation costs are reduced by 50%, Option 2A remain economically viable and Option2B becomes economically viable. Decreasing the household participation costs does not make any of the otheroptions economically viable.
Increasing the household participation costs has a significant effect on the NPVs and BCRs of each option,making all, except Option 2A, significantly more unviable. Option 2A is the only option that remainseconomically viable when the household participation costs are increased by 25% and 50%.
Business participation costs
Reducing the business participation costs by 25% or 50% does not change the economic viability of any option,with Option 2A remaining economically viable and the other options remaining unviable. Increasing thebusiness participation costs exacerbates the economic non-viability of all the options except Option 2A. Option2A is the only option that is economically viable when the business participation costs are increased by 25% and50%.

PwC | WCS 102 Packaging cost benefit analysis report
Table 87 - Summary of household participation costs sensitivity testing (excluding non-use values), NPV ($ millions) and BCR
Option 1 NationalWaste Strategy
Option 2a Co-reg
StewardshipOption 2b
Industry SchemeOption 2c Extended
StewardshipOption 3 Mandatory
ADF
Option 4aBoomerang
CDSOption 4b
Hybrid CDS
Core results NPV -$49 $46 -$51 -$198 -$195 -$1,414 -$1,761
BCR 0.84 1.18 0.91 0.80 0.80 0.33 0.29
Reduced costs- 50% NPV -$7 $88 $25 -$72 -$69 -$1,191 -$1,533
BCR 0.97 1.41 1.05 0.92 0.92 0.37 0.32
Reduced costs- 75% NPV -$28 $67 -$13 -$135 -$132 -$1,303 -$1,647
BCR 0.90 1.28 0.97 0.85 0.86 0.35 0.30
Increased costs- 125% NPV -$69 $26 -$89 -$260 -$257 -$1,526 -$1,875
BCR 0.79 1.09 0.85 0.75 0.75 0.32 0.27
Increased costs- 150% NPV -$90 $5 -$127 -$323 -$320 -$1,638 -$1,990
BCR 0.74 1.02 0.80 0.71 0.71 0.30 0.26
Table 88 - Summary of business participation costs sensitivity testing (excluding non-use values), NPV ($ millions) and BCR
Option 1 NationalWaste Strategy
Option 2a Co-reg
StewardshipOption 2b
Industry SchemeOption 2c Extended
StewardshipOption 3 Mandatory
ADF
Option 4aBoomerang
CDSOption 4b
Hybrid CDS
Core results NPV -$49 $46 -$51 -$198 -$195 -$1,414 -$1,761
BCR 0.84 1.18 0.91 0.80 0.80 0.33 0.29
Reduced costs- 50% NPV -$39 $57 -$33 -$167 -$164 -$1,411 -$1,758
BCR 0.87 1.23 0.94 0.82 0.83 0.33 0.29
Reduced costs- 75% NPV -$44 $52 -$42 -$182 -$179 -$1,413 -$1,759
BCR 0.86 1.20 0.92 0.81 0.81 0.33 0.29
Increased costs- 125% NPV -$54 $41 -$60 -$213 -$210 -$1,416 -$1,763
BCR 0.83 1.16 0.89 0.79 0.79 0.33 0.29
Increased costs- 150% NPV -$58 $36 -$70 -$228 -$225 $1,418 -$1764
BCR 0.82 1.14 0.88 0.78 0.78 0.33 0.29
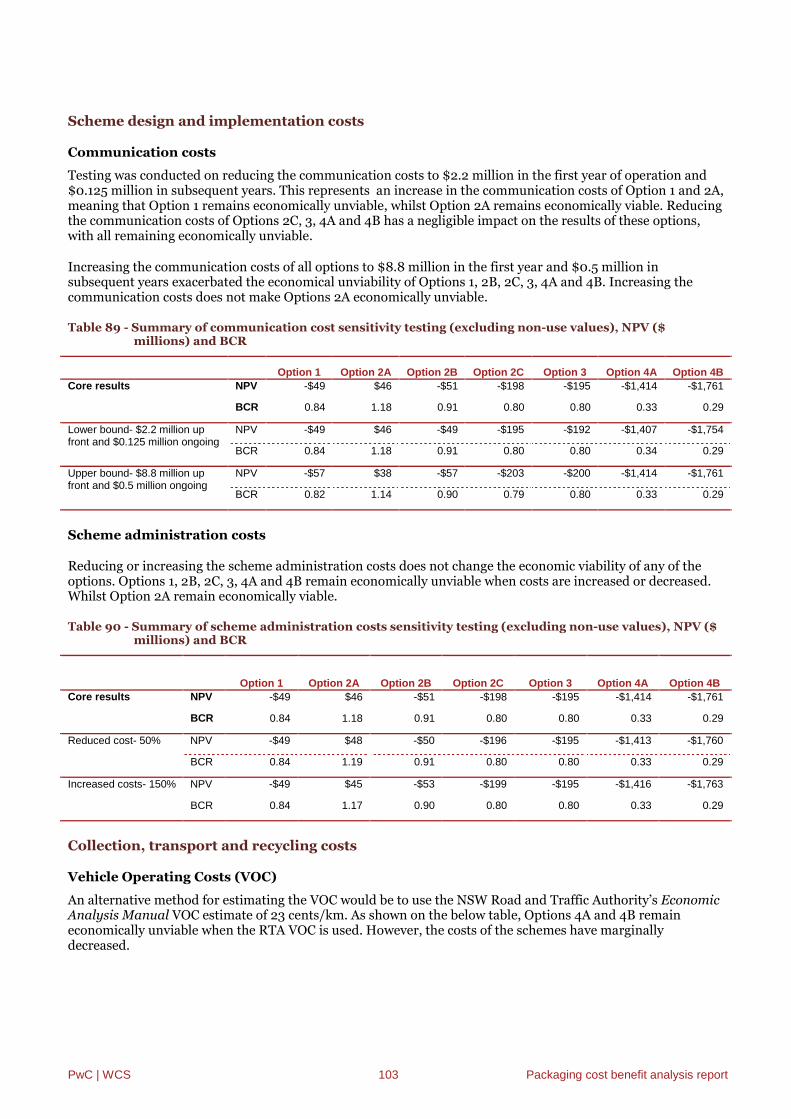
PwC | WCS 103 Packaging cost benefit analysis report
Scheme design and implementation costs
Communication costs
Testing was conducted on reducing the communication costs to $2.2 million in the first year of operation and$0.125 million in subsequent years. This represents an increase in the communication costs of Option 1 and 2A,meaning that Option 1 remains economically unviable, whilst Option 2A remains economically viable. Reducingthe communication costs of Options 2C, 3, 4A and 4B has a negligible impact on the results of these options,with all remaining economically unviable.
Increasing the communication costs of all options to $8.8 million in the first year and $0.5 million insubsequent years exacerbated the economical unviability of Options 1, 2B, 2C, 3, 4A and 4B. Increasing thecommunication costs does not make Options 2A economically unviable.
Table 89 - Summary of communication cost sensitivity testing (excluding non-use values), NPV ($millions) and BCR
Option 1 Option 2A Option 2B Option 2C Option 3 Option 4A Option 4B
Core results NPV -$49 $46 -$51 -$198 -$195 -$1,414 -$1,761
BCR 0.84 1.18 0.91 0.80 0.80 0.33 0.29
Lower bound- $2.2 million upfront and $0.125 million ongoing
NPV -$49 $46 -$49 -$195 -$192 -$1,407 -$1,754
BCR 0.84 1.18 0.91 0.80 0.80 0.34 0.29
Upper bound- $8.8 million upfront and $0.5 million ongoing
NPV -$57 $38 -$57 -$203 -$200 -$1,414 -$1,761
BCR 0.82 1.14 0.90 0.79 0.80 0.33 0.29
Scheme administration costs
Reducing or increasing the scheme administration costs does not change the economic viability of any of theoptions. Options 1, 2B, 2C, 3, 4A and 4B remain economically unviable when costs are increased or decreased.Whilst Option 2A remain economically viable.
Table 90 - Summary of scheme administration costs sensitivity testing (excluding non-use values), NPV ($millions) and BCR
Option 1 Option 2A Option 2B Option 2C Option 3 Option 4A Option 4B
Core results NPV -$49 $46 -$51 -$198 -$195 -$1,414 -$1,761
BCR 0.84 1.18 0.91 0.80 0.80 0.33 0.29
Reduced cost- 50% NPV -$49 $48 -$50 -$196 -$195 -$1,413 -$1,760
BCR 0.84 1.19 0.91 0.80 0.80 0.33 0.29
Increased costs- 150% NPV -$49 $45 -$53 -$199 -$195 -$1,416 -$1,763
BCR 0.84 1.17 0.90 0.80 0.80 0.33 0.29
Collection, transport and recycling costs
Vehicle Operating Costs (VOC)
An alternative method for estimating the VOC would be to use the NSW Road and Traffic Authority’s EconomicAnalysis Manual VOC estimate of 23 cents/km. As shown on the below table, Options 4A and 4B remaineconomically unviable when the RTA VOC is used. However, the costs of the schemes have marginallydecreased.

Cost benefit analysis
PwC | WCS 104 Packaging cost benefit analysis report
Table 91 - Summary of VOC sensitivity testing using RTA VOC (excluding non-use values)
Option 4a BoomerangCDS
Option 4b HybridCDS
Costs $ millions $2,122 $2,469
Benefits $ millions $710 $710
NPV $ millions -$1,412 -$1,759
BCR Number 0.33 0.29
Collection and transport costs
Reducing the collection and transport costs by 50% makes Option 2B economically viable, however reducingthe costs by 50% or 25% does not impact the economic viability of any of the other options. Option 2A remainseconomically viable, whilst Options 1, 2C, 3, 4A and 4B remain economically unviable.
Table 92 - Summary of collection and transport costs sensitivity testing (excluding non-use values) - NPV($ millions) and BCR
Option 1NationalWaste
Strategy
Option 2ACo-reg
Stewardship
Option 2BIndustryScheme
Option 2CExtended
Stewardship
Option 3Mandatory
ADF
Option 4ABoomerang
CDSOption 4B
Hybrid CDS
Core results NPV -$49 $46 -$51 -$198 -$195 -$1,414 -$1,761
BCR 0.84 1.18 0.91 0.80 0.80 0.33 0.29
50% of costs NPV -$22 $81 -$22 -$135 -$132 -$1,794 -$2,141
BCR 0.92 1.36 0.96 0.85 0.86 0.28 0.25
75% of costs NPV -$35 $64 -$37 -$166 -$163 -$1,604 -$1,951
BCR 0.88 1.27 0.93 0.83 0.83 0.31 0.27
Alternative estimates of kerbside transport and collection costs
Sensitivity analysis was conducted of using the BA’s estimate and Sustainability Victoria’s estimate of kerbsidetransport and collection costs. When Sustainability Victoria’s estimate of kerbside costs are used, Option 2Aremains viable. The remaining options are still unviable.
When BA’s estimates of kerbside costs are used, the BCRs and NPVs of all options decrease and Option 2A isthe only option that is viable.

Cost benefit analysis
PwC | WCS 105 Packaging cost benefit analysis report
Table 93 – Summary of kerbside transport and collection costs sensitivity testing (excluding non-usevalues) - NPV ($ millions) and BCR
Option 1 Option 2A Option 2B Option 2C Option 3 Option 4A Option 4B
Core results NPV -$49 $46 -$51 -$198 -$195 -$1,414 -$1,761
BCR 0.84 1.18 0.91 0.80 0.80 0.33 0.29
Sustainability Victoria ($99.60(metro), $172.61 (non-metro))
NPV -$35 $66 -$42 -$171 -$168 -$1,669 -$2,015
BCR 0.88 1.28 0.92 0.82 0.82 0.30 0.26
Boomerang Alliance- $248.47 NPV -$62 $28 -$60 -$223 -$219 -$1,172 -$1,519
BCR 0.81 1.10 0.89 0.78 0.78 0.38 0.32
Distance to infrastructure
Reducing the distance to infrastructure from 10m to 5m does not change the economic viability of any of theoptions.
Table 94 – Summary of distance to infrastructure sensitivity testing (excluding non-use values) - NPV ($millions) and BCR
Option 1NationalWaste
Strategy
Option 2ACo-reg
Stewardship
Option 2BIndustryScheme
Option 2CExtended
Stewardship
Option 3Mandatory
ADF
Option 4ABoomerang
CDS
Option4B
HybridCDS
Core results NPV -$49 $46 -$51 -$198 -$195 -$1,414 -$1,761
BCR 0.84 1.18 0.91 0.80 0.80 0.33 0.29
Reduced distance-50%
NPV -$39 $57 -$33 -$167 -$164 -$1,380 -$1,726
BCR 0.87 1.23 0.94 0.82 0.83 0.34 0.29
Increased distance-150%
NPV -$59 $36 -$70 -$228 -$225 -$1,449 -$1,796
BCR 0.82 1.14 0.88 0.78 0.78 0.33 0.28
Scheme operation costs
CDS infrastructure costs
Testing was conducted of reducing the CDS infrastructure costs by 30%. This reduction in costs exceeds thedifference in the cost estimates proposed by BA on a commercial basis, taking into account that these costswould need to be inflated to June 2011 dollars to be consistent with other costs estimated in the CBA. Asdiscussed earlier in the report, WCS formed the view that the costs associated with Option 4A as proposed byBA were lower than contemporary costs and were lower than the most recent published CDS study. Therefore,the results of this sensitivity analysis should be treated with some caution given that they are not considered toreflect real resource costs of CDS infrastructure.
The NPV of Option 4A significantly improves when infrastructure costs are reduced, however it remainseconomically unviable with a BCR of 0.94. Option 4B has a significantly negative NPV when costs are reducedand also remains economically unviable.

Cost benefit analysis
PwC | WCS 106 Packaging cost benefit analysis report
Table 95 – Summary of CDS infrastructure costs sensitivity testing (excluding non-use values) - NPV ($millions) and BCR
Option 4aBoomerang
CDSOption 4b
Hybrid CDS
Costs $ millions $811 $1,056
Benefits $ millions $710 $710
NPV $ millions -$101 -$346
BCR Number 0.88 0.67
NEPM follow-up and enforcement
Testing was conducted of increasing and decreasing the compliance with NEPM. This had a negligible impacton the results, with all Options having the same BCRs when the number of companies was increased ordecreased. When the number of companies is decreased the NPVs of Options 4A and 4B worsen very slightly.
Table 96 – Summary of NEPM follow-up and enforcement sensitivity testing (excluding non-use values),NPV ($ millions) and BCR
Option 1Option
2AOption
2BOption
2C Option 3Option
4AOption
4B
Core results NPV -$49 $46 -$51 -$198 -$195 -$1,414 -$1,761
BCR 0.84 1.18 0.91 0.80 0.80 0.33 0.29
Government administration ofregulations - Companies + 50%
NPV -$49 $48 -$48 -$194 -$193 -$1,413 -$1,760
BCR 0.84 1.19 0.91 0.80 0.80 0.33 0.29
Government administration ofregulations - Companies - 50%
NPV -$49 $45 -$51 -$197 -$193 -$1,416 -$1,763
BCR 0.84 1.17 0.91 0.80 0.80 0.33 0.29
Benefits- Use values
Avoided kerbside collection costs
An alternative method of estimating kerbside collection costs was used to estimate potential avoided kerbsidecollection costs of up to $2.7 million per year. Sensitivity analysis was conducted of including this avoided cost.
Table 97 – Summary of avoided kerbside collection costs sensitivity testing (excluding non-use values) -NPV ($ millions) and BCR
Option 1 Option 2A Option 2B Option 2C Option 3 Option 4A Option 4B
Core results NPV -$49 $46 -$51 -$198 -$195 -$1,414 -$1,761
BCR 0.84 1.18 0.91 0.80 0.80 0.33 0.29
Avoided kerbsidecosts relatively fixed
NPV -$49 $45 -$51 -$197 -$193 -$2,145 -$2,492
BCR 0.84 1.17 0.91 0.80 0.80 0.25 0.22
Reducing market value of glass for stockpiling
As described, approximately 40% of glass that goes to MRFs for reprocessing is stockpiled and not recycled. Toaccount for the stockpiling of glass that occurs, the market value of glass was reduced by 40%. This has anegligible impact on the results and did not change the BCRs, NPVs or economic viability of any of the options.

Cost benefit analysis
PwC | WCS 107 Packaging cost benefit analysis report
Table 98 – Summary of stockpiling of glass sensitivity testing (excluding non-use values) - NPV ($ millions)and BCR
Option1
NationalWaste
Strategy
Option 2ACo-reg
Stewardship
Option 2BIndustryScheme
Option 2CExtended
Stewardship
Option 3Mandatory
ADF
Option 4ABoomerang
CDS
Option4B
HybridCDS
Core results NPV -$49 $46 -$51 -$198 -$195 -$1,414 -$1,761
BCR 0.84 1.18 0.91 0.80 0.80 0.33 0.29
Reduced value of glass NPV -$49 $46 -$51 -$198 -$195 -$1,414 -$1,761
BCR 0.84 1.18 0.91 0.80 0.80 0.33 0.29
Litter projections
Increasing the proportion of litter that is packaging items
It was assumed that 37% of litter quantities are packaging items. To test the sensitivity of results to thisassumption, the proportion of litter that is packaging was increased to 87% (in line with the proportion ofpackaging items of total litter items). This has a significant impact on the results making Options1, 2B, 2C and 3economically viable and significantly improving their NPVs and BCRs. Options 4A and 4B remainedeconomically unviable.
Table 99 – Summary of proportion of litter that is packaging sensitivity testing (excluding non-use values),NPV ($ millions) and BCR
Option 1 Option 2A Option 2B Option 2C Option 3 Option 4A Option 4B
Core results NPV -$49 $46 -$51 -$198 -$195 -$1,414 -$1,761
BCR 0.84 1.18 0.91 0.80 0.80 0.33 0.29
Increased % ofpackaging litter-87%
NPV $24 $122 $86 $29 $33 -$1,260 -$1,607
BCR 1.08 1.47 1.16 1.03 1.03 0.41 0.35
Litter reduction projections
Increasing or decreasing the litter projections does not change the economic viability of the options, withOption 2A remaining economically viable and the other options remaining unviable.
Table 100 – Summary of litter reduction projections sensitivity testing (excluding non-use values) - NPV ($millions) and BCR
Option 1NationalWaste
Strategy
Option 2ACo-reg
Stewardship
Option2B
IndustryScheme
Option 2CExtended
Stewardship
Option 3Mandatory
ADF
Option 4ABoomerang
CDS
Option4B
HybridCDS
Core results NPV -$49 $46 -$51 -$198 -$195 -$1,414 -$1,761
BCR 0.84 1.18 0.91 0.80 0.80 0.33 0.29
Litter projections- 75% NPV -$62 $32 -$77 -$240 -$237 -$1,443 -$1,790
BCR 0.80 1.13 0.86 0.76 0.76 0.32 0.28
Litter projections- 125% NPV -$35 $61 -$26 -$156 -$153 -$1,386 -$1,733
BCR 0.89 1.23 0.95 0.84 0.84 0.35 0.30

Cost benefit analysis
PwC | WCS 108 Packaging cost benefit analysis report
Packaging litter quantities
Increasing the packaging litter quantities in the base year from 60,000 tonnes to 100,000 tonnes has no impacton the results of the analysis. This is because the percentage reductions in litter and the relativities between theoptions remain the same.
Table 101 – Summary of packaging litter quantity sensitivity testing (excluding non-use values) - NPV ($millions) and BCR
Option 1NationalWaste
Strategy
Option 2ACo-reg
Stewardship
Option 2BIndustryScheme
Option 2CExtended
Stewardship
Option 3Mandatory
ADF
Option 4ABoomerang
CDSOption 4B
Hybrid CDS
Core NPV -$49 $46 -$51 -$198 -$195 -$1,414 -$1,761
BCR 0.84 1.18 0.91 0.80 0.80 0.33 0.29
100,000 tonnes ofpackaging litter
NPV -$48 $48 -$49 -$194 -$191 -$1,412 -$1,759
BCR 0.85 1.18 0.91 0.80 0.80 0.34 0.29

PwC | WCS 109 Packaging cost benefit analysis report
Appendices
Appendix A The recycling supply chain 111
Appendix B Household participation costs 114
Appendix C Collection and transport costs 117
Appendix D Landfill disposal fees 120
Appendix E Thresholds of business size in the Australian Packaging Covenant 122
Appendix F Market value of materials 124
Appendix G Landfill externalities 132
Appendix H Landfill operating costs 134
Appendix I Litter clean up costs 135
Appendix J CDS co-benefits 136

PwC | WCS 111 Packaging cost benefit analysis report
Appendix A The recycling supply chain
Recycling is a multi-step activity in which post-consumer packaging or products are recovered and sorted tomaterial type then sold to manufacturers of specific materials as feedstock for new product production. Therecycling value chains for three types of resource recovery and recycling activities are described below.Descriptions A.1 and A.2 apply to routine arrangements in wide current use; description A.3 applies to CDS.
A.1 Household Kerbside Collection of Used Packaging andOther Recyclable Materials
The main steps in the recycling of household kerbside are as follows:
1. Used packaging or products are discarded to a bin designated for capture of a variety of used materialsto be recycled.
2. Recycling bins are collected and transported to a MRF.3. Packaging or products are sorted to material type at the MRF and recovered to stockpiles of collated
materials for sale to downstream markets, usually to be used in manufacture of new materials.4. Residue materials are usually sent to landfill.5. Specific recovered materials are transported to a specialist processor or manufacturer of specific
materials or products (e.g. paper and cardboard, glass, steel, plastics, aluminum cans.6. The specialist processor or manufacturer combines recovered packaging or product with virgin
feedstock to manufacture new products, some of which may be the same packaging or product.7. Faulty products are used as feedstock to the production process; residues are either used as feedstock
or sent to landfill.8. The new product can be designated as “containing recycled materials”.
A.2 C&I Sector Collection of Recyclable Used Packagingand other Materials
The main steps in C&I recycling are as follows:
1. Used packaging or products are discarded to a bin or location often designated for capture of specificmaterials to be recycled (e.g. glass, cardboard, plastics).
2. Recycling bins are collected and transported to a holding point, often at a recycling facility or MRF.3. Packaging or products placed in stockpiles of collated materials for sale to downstream markets, usually
to be used in manufacture of new materials.4. Residue materials are usually sent to landfill.5. Specific recovered materials are transported to a specialist processor or manufacturer of specific
materials or products (e.g., paper and cardboard, glass, steel, plastics, aluminum cans.6. The specialist processor or manufacturer combines recovered packaging or product with virgin
feedstock to manufacture new products, some of which may be the same packaging or product.7. Faulty products are used as feedstock to the production process; residues are either used as feedstock
or sent to landfill.

Appendix A The recycling supply chain
PwC | WCS 112 Packaging cost benefit analysis report
A.3 The CDS Value Chain for Used Packaging Materials(Household and C&I)
The main steps in the recycling value chain as applied to CDS are (generally) as follows:
1. Used beverage containers are discarded at household (or business) to a bin designated by thehouseholder (or business) for capture of beverage containers to be recycled105.
2. Recycling bins are transported by the householder (or business) to a CDS collection depot.
3. Collection depot operators receive and sort containers to material type and (sometimes) by brand.
4. Specific recovered container materials are transported to a super-collector storage point for aggregationprior to sale to downstream markets, usually to be used in manufacture of new materials.
5. Specific recovered container materials are transported to a specialist processor or manufacturer ofspecific materials or products (e.g. paper and cardboard, glass, steel, plastics, aluminum cans).
6. The specialist processor or manufacturer combines recovered packaging or product with virginfeedstock to manufacture new products, some of which may be the same packaging or product.
7. Faulty products are used as feedstock to the production process; residues are either used as feedstock orsent to landfill.
8. The new product can be designated as “containing recycled materials”.
Option 4A: Boomerang Alliance CDS
Additional detail is also provided on the system operation, collection facility design and incidence of transportcosts for Option 4A, as follows:
System operation:
1. Containers redeemed at collection centres are manually crushed or broken (for product securityreasons), baled or loaded to skips, and transported to the nearest hub for any further material-typecollation, and transported to a material reprocessor
2. Containers redeemed at RVMs are transferred to material reprocessors direct or via a hub dependingon location and container flow
3. Containers redeemed at rural and remote collection points are transferred to a hub then collated, baled,and transported to material reprocessor
Collection facility design
1. Hubs are a mix of shop-fronts and depots established at existing waste facilities.
2. Collection depots are a mix of small shop-fronts and depots established at existing waste facilities.
3. RVMs are predominantly located at shopping centres.
4. Rural and remote collection points will make use of existing retail outlets including outback stores.
Incidence of transport costs
1. The costs of transport from collection centres / RVMs to hubs is incurred by the collection centre /RVM operator
2. The costs of transport from hubs to reprocessors is largely incurred by the reprocessor other than forDarwin, Perth, Hobart and Adelaide
105 Note that where the householder (or business) discards used containers to the kerbside recycling bin in lieu of redeeming the containers at a CDScollection centre, the contents of the kerbside bin are collected, taken to a MRF and recovered for presentation by the MRF operator to a CDS collectioncentre.

Appendix A The recycling supply chain
PwC | WCS 113 Packaging cost benefit analysis report
Option 4B: Hybrid CDS
Additional detail is also provided on the system operation, collection facility design and incidence of transportcosts for Option 4B as follows:
System operation:
1. Containers redeemed at collection depots are manually crushed or broken (for product securityreasons), baled or loaded to skips, and transported to the nearest consolidation depot for any furthermaterial-type collation, and transported to material reprocessor
2. Containers redeemed at RVMs are transferred to material reprocessors direct or via a collection depotor consolidation Depot depending on location and container flow
3. Containers redeemed at a rural and remote collection point are transferred to a consolidation depotthen collated, baled, and transported to a material reprocessor.
Collection facility design
1. Consolidation depots are assumed to be shop-front style and operate as both a hub for consolidationand collation and a redemption point for local returns
2. Collection depots are a mix of small shop-fronts and depots established at existing waste facilities
3. RVMs are mainly at shopping centres
4. Rural and remote collection points will make use of existing retail outlets including outback stores
Incidence of transport costs
1. The costs of transport from collection depots / RVMs to consolidation depots is incurred by thecollection centre / RVM operator
2. The costs of transport from collection depots to reprocessors is largely incurred by the reprocessorother than for Darwin, Perth, Hobart and Adelaide
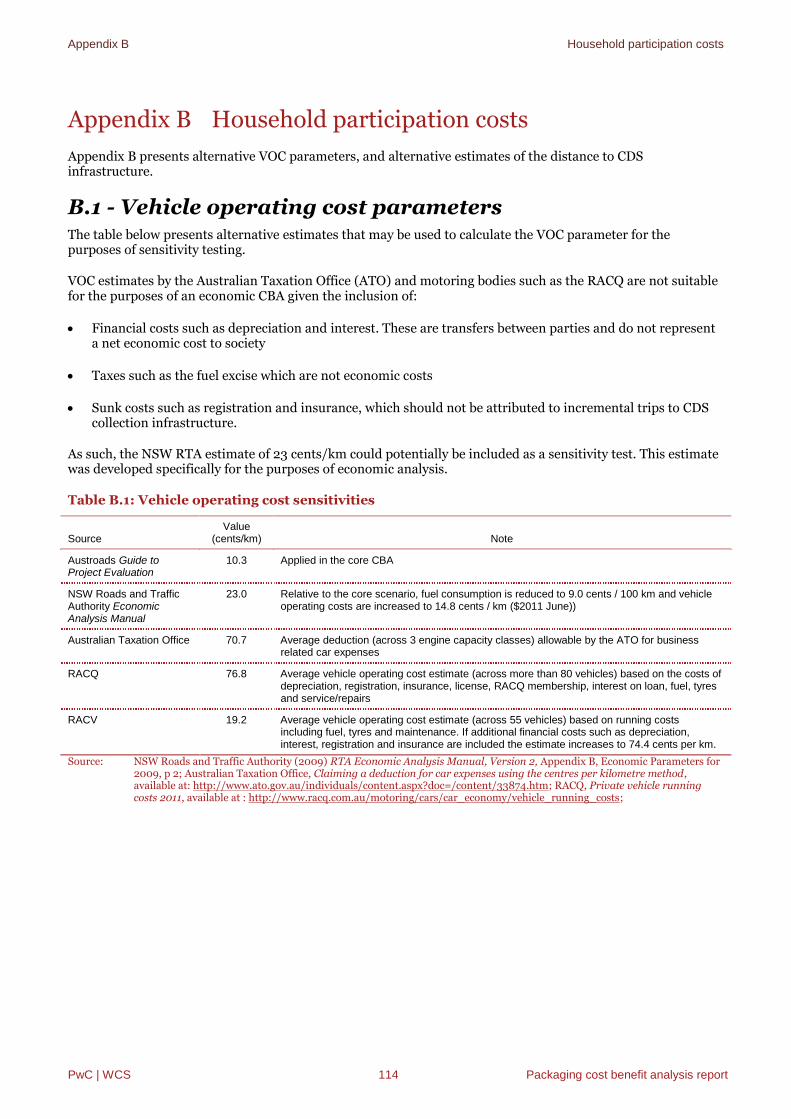
Appendix B Household participation costs
PwC | WCS 114 Packaging cost benefit analysis report
Appendix B Household participation costs
Appendix B presents alternative VOC parameters, and alternative estimates of the distance to CDSinfrastructure.
B.1 - Vehicle operating cost parametersThe table below presents alternative estimates that may be used to calculate the VOC parameter for thepurposes of sensitivity testing.
VOC estimates by the Australian Taxation Office (ATO) and motoring bodies such as the RACQ are not suitablefor the purposes of an economic CBA given the inclusion of:
Financial costs such as depreciation and interest. These are transfers between parties and do not representa net economic cost to society
Taxes such as the fuel excise which are not economic costs
Sunk costs such as registration and insurance, which should not be attributed to incremental trips to CDScollection infrastructure.
As such, the NSW RTA estimate of 23 cents/km could potentially be included as a sensitivity test. This estimatewas developed specifically for the purposes of economic analysis.
Table B.1: Vehicle operating cost sensitivities
SourceValue
(cents/km) Note
Austroads Guide toProject Evaluation
10.3 Applied in the core CBA
NSW Roads and TrafficAuthority EconomicAnalysis Manual
23.0 Relative to the core scenario, fuel consumption is reduced to 9.0 cents / 100 km and vehicleoperating costs are increased to 14.8 cents / km ($2011 June))
Australian Taxation Office 70.7 Average deduction (across 3 engine capacity classes) allowable by the ATO for businessrelated car expenses
RACQ 76.8 Average vehicle operating cost estimate (across more than 80 vehicles) based on the costs ofdepreciation, registration, insurance, license, RACQ membership, interest on loan, fuel, tyresand service/repairs
RACV 19.2 Average vehicle operating cost estimate (across 55 vehicles) based on running costsincluding fuel, tyres and maintenance. If additional financial costs such as depreciation,interest, registration and insurance are included the estimate increases to 74.4 cents per km.
Source: NSW Roads and Traffic Authority (2009) RTA Economic Analysis Manual, Version 2, Appendix B, Economic Parameters for2009, p 2; Australian Taxation Office, Claiming a deduction for car expenses using the centres per kilometre method,available at: http://www.ato.gov.au/individuals/content.aspx?doc=/content/33874.htm; RACQ, Private vehicle runningcosts 2011, available at : http://www.racq.com.au/motoring/cars/car_economy/vehicle_running_costs;

Appendix B Household participation costs
PwC | WCS 115 Packaging cost benefit analysis report
B.2 Distance to container deposit infrastructureThe section below presents alternative estimates that may be used to calculate the distance from households toCDS infrastructure based on the urban intensive and rural residential land area in Australia, the averagedistance to a shopping centre and the average distance to landfill.
Urban intensive and rural residential land area
As outlined in the Problem Statement for Packaging, the total area of land in Australia is approximately 7.7million square kilometres, of which 14,000 square kilometres are for urban intensive uses and 9,400 are forrural residential uses.106
The tables below estimates the land area (km2) per unit of container deposit assuming that they are equallydistributed over rural residential land (rural and remote collection centre points) or urban intensive land (otherinfrastructure types). The maximum distance to a unit of infrastructure is calculated as the radius of a circlewith the estimated area per unit.
Table B.2: Average distance to CDS infrastructure by land area – Options 4A and 4B
Infrastructure type Number Area per unit (km2/unit) Distance (km)
Urban collection centres 1,200 11.7 1.9
Rural/remote centre collectionpoints
700 13.4 2.1
Population density
As outlined in the Options Report, it is assumed collection centres are geographically distributed to ensurecoverage and consumer convenience. Preliminary infrastructure requirements have been estimated, but theseare subject to verification based on a population/geographical analysis.
ABS data on population density by Statistical Local Area was used to estimate the catchment area of each unit ofinfrastructure noting that the Packaging Option Report assumed that there would be 1 collection centre per200,000 homes in metropolitan areas and 1 per 50,000 homes in regional areas.107 The average distance toeach unit of collection infrastructure was estimated as half the radius of a circle with the same area as thecatchment area.
Table B.3: Estimates of average distance to infrastructure based on population density
Assumption Value Source Note
Population density – urban(persons/km2)
401.8 ABS (2011) 3218.0 RegionalPopulation Growth, Australia,Tables 1-10
Population density of all LGAsin capital city StatisticalDivisions
Population density – rural(persons/km2)
3.85 Median population density ofLGAs outside capital cityStatistical Divisions
Catchment households– urban(households/unit of infrastructure)
200,000 Packaging option report Catchment is based on thenumber of households, notpopulation
Catchment households – regional(households per unit of infrastructure)
50,000
Average household size (population perhousehold)
2.6 ABS (2011) 3218.0 RegionalPopulation Growth, Australia,Tables 1-10/ABS (2010)
=(22,328,847/8,527072)
106 Bureau of Rural Sciences (2001/02) Land Use of Australia, Version 3. NOTE: Numbers have been rounded.
107 PwC (2011) Packaging option report – Draft version 2, 19 August, p 40

Appendix B Household participation costs
PwC | WCS 116 Packaging cost benefit analysis report
Assumption Value Source Note
Household and FamilyProjections, Australia, 2006 to2031, Table 1.2
Catchment area – urban (km) 1,304 PwC calculation =(200,000/(401.8/2.6))
Catchment area – regional (km) 34,007 PwC calculation =(50,000/(3.85/26))
Catchment radius – urban 20.4 PwC calculation assumingcatchment area is circular
=((1,304)/π)^(1/2)
Catchment radius - regional 104.0 =((34,007)/π)^(1/2)
Average distance to infrastructure –urban
10.2 Population assumed to beequally distributed within thecatchment area, so radiusdivided by 2
=20.4/2
Average distance to infrastructure -regional
52.02 =64.3/2
Average distance to shopping centres
It is assumed that RVMs are located at convenient locations such as shopping centres. The table below presentsa number of estimates of the average distance to supermarkets.
Table B.4: Estimates of the average distance to shopping centres
Estimate Source
Almost 90% of supermarkets have another supermarket within 3 km
and almost 95% of supermarkets have a competitor within 5 km
ACCC Grocery Inquiry
The majority of residents of Melbourne have a supermarket within
1.5km
VIC Department of Planning and Community Development (2001)
In WA, the average distance of households from their closest
supermarket is 7 km
WA Department of Planning and Infrastructure (2004)
Source: Australian Competition and Consumer Commission (2008) Report of the ACCC Inquiry into the Competitiveness of RetailPrices for Standard Groceries; Department of Planning and Community Development 2001, Proximity to Shopping andServices; WA Department of Planning and Infrastructure (2004) The Perth and Regional Travel Survey.
Average distance to landfill
The majority of CDS infrastructure is assumed to be located at existing waste facilities. The table below presentsa number of estimates of the average distance to landfill in Australia.
Table B.4: Estimates of the average distance to landfill in Australia
Estimate Source
The average distance from the point of waste generation to
reprocessing station is 20 km on average, based on mapping of
landfill locations
NSW Department of Environment, Climate Change and Water
Average distance to landfill assumed to be 30km Grant and James (2005)
Weighted average distance to landfill calculated to be 17 km Grant et. al (2001)
Source: NSW Department of Environment, Climate Change and Water (2010) Environmental Benefits of Recycling; Grant andJames (2005) Life Cycle Impact Data for Resource Recovery for Commercial and Industrial and Construction andDemolition Waste in Australia; Grant, James, Lunfie, Sonneveld and Beavis (2001) Report for Life Cycle Assessments forPaper and Packaging Waste Management Scenarios in New South Wales

Appendix C Collection and transport costs
PwC | WCS 117 Packaging cost benefit analysis report
Appendix C Collection and transport costs
Appendix C provides additional information on the methodology used by WCS to estimate the packagingmaterials collection and transport costs for at-home (domestic kerbside) collection and away-from-homecollection. Alternative estimates that may potentially be included in sensitivity testing have also been providedfor kerbside collection costs and the impact of CDS on kerbside recycling.
C.1 At home (domestic kerbside) collection
Derivation of the WCS estimate of kerbside transport and collection costs
The cost of collecting packaging materials in the conventional dry recycling kerbside system has been estimatedon the basis of the cost per tonne of material collected at kerbside i.e. the cost of providing a collection servicedivided by the number of tonnes collected.
In the majority of instances, local government data on kerbside collections are costed on a per lift basis. In otherwords, the cost to a council for each 240 L Mobile Garbage Bin (MGB) that is lifted, unloaded into the collectionvehicle and hauled to the destination for the material to be processed. The rates commonly quoted are fullyinclusive of both the collection and the disposal or processing. For this analysis, the cost of collecting in thekerbside system has been estimated using:
the cost per lift and transport only has been used108, the weight-based average yield of all dry recyclables per household measured across all of NSW in 2009109,
and the weight-based haul of packaging recyclables across all jurisdictions reporting to NEPC in 2009/10110.
Based on the cost to collect at kerbside and the average yield in kerbside bins, the cost per tonne to collectrecyclables and deliver to a local drop-off point, either a MRF or a transfer facility is estimated to be $187 pertonne of recyclables. On a material-by-material basis, this is assumed to be the cost per tonne for each andevery tonne of the materials collected with the current mix of recyclables seen at kerbside and the currentapproach to pricing kerbside collections.
For this estimate, the collection cost has been based on a situation where kerbside collection vehicles deliverdirectly to a drop-off point for MRF processing. This situation should pertain for the vast majority of kerbsiderecyclables collected across the metropolitan and outer-metropolitan regions of Australia, but it may not be thecase in regional and rural areas. In the more remote areas, recyclables destined for MRF processing areexpected to be aggregated at transfer facilities and hauled in long-haul vehicles to metropolitan MRF facilities,adding an extra layer of cost for collection of these recyclables, with the additional cost directly related to thedistance between source and destination.
In testing options where kerbside recycling is to be extended to more households, the cost per tonne to roll outthose additional services can be calculated via two mechanisms, depending on the basis of the estimate foradditional service:
a) if an additional tonnage haul is assumed, then the extra cost will be $187 per tonne of additional materialcollected
b) if on the other hand the number of additional services (households) to which the kerbside collectionservices are extended is the basis for the estimate, then the cost per service is estimated to be $56 perhousehold per annum and the additional yield will be assumed at 300 kg per household per annum.
In testing options where the haul of recyclables is to be increased from premises that already receive a kerbsidecollection service, then there is assumed to be no additional cost for this extra haul of recyclables. Thissituation of no additional cost for extra haul of recyclables is a function of the basis for pricing kerbsidecollection services – a unit cost per bin lift, which within existing contracts will not change even if the haul ofrecyclables increases. This situation is arguably reasonable to assume for existing services given that the
108 C. Horsey, personal communication
109 Kerbside Waste Audit Data Analysis, 2009, DECCW Presentation
110 NEPC Jurisdiction Reports 2009-10
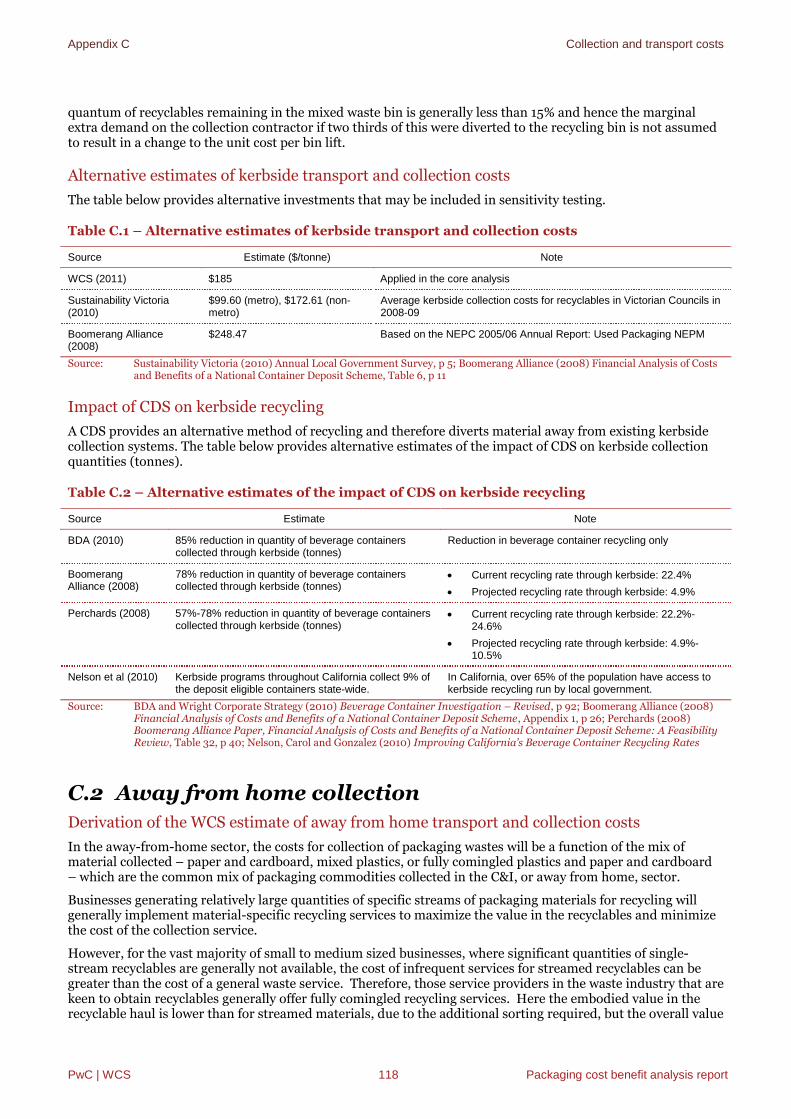
Appendix C Collection and transport costs
PwC | WCS 118 Packaging cost benefit analysis report
quantum of recyclables remaining in the mixed waste bin is generally less than 15% and hence the marginalextra demand on the collection contractor if two thirds of this were diverted to the recycling bin is not assumedto result in a change to the unit cost per bin lift.
Alternative estimates of kerbside transport and collection costs
The table below provides alternative investments that may be included in sensitivity testing.
Table C.1 – Alternative estimates of kerbside transport and collection costs
Source Estimate ($/tonne) Note
WCS (2011) $185 Applied in the core analysis
Sustainability Victoria(2010)
$99.60 (metro), $172.61 (non-metro)
Average kerbside collection costs for recyclables in Victorian Councils in2008-09
Boomerang Alliance(2008)
$248.47 Based on the NEPC 2005/06 Annual Report: Used Packaging NEPM
Source: Sustainability Victoria (2010) Annual Local Government Survey, p 5; Boomerang Alliance (2008) Financial Analysis of Costsand Benefits of a National Container Deposit Scheme, Table 6, p 11
Impact of CDS on kerbside recycling
A CDS provides an alternative method of recycling and therefore diverts material away from existing kerbsidecollection systems. The table below provides alternative estimates of the impact of CDS on kerbside collectionquantities (tonnes).
Table C.2 – Alternative estimates of the impact of CDS on kerbside recycling
Source Estimate Note
BDA (2010) 85% reduction in quantity of beverage containerscollected through kerbside (tonnes)
Reduction in beverage container recycling only
BoomerangAlliance (2008)
78% reduction in quantity of beverage containerscollected through kerbside (tonnes)
Current recycling rate through kerbside: 22.4%
Projected recycling rate through kerbside: 4.9%
Perchards (2008) 57%-78% reduction in quantity of beverage containerscollected through kerbside (tonnes)
Current recycling rate through kerbside: 22.2%-24.6%
Projected recycling rate through kerbside: 4.9%-10.5%
Nelson et al (2010) Kerbside programs throughout California collect 9% ofthe deposit eligible containers state-wide.
In California, over 65% of the population have access tokerbside recycling run by local government.
Source: BDA and Wright Corporate Strategy (2010) Beverage Container Investigation – Revised, p 92; Boomerang Alliance (2008)Financial Analysis of Costs and Benefits of a National Container Deposit Scheme, Appendix 1, p 26; Perchards (2008)Boomerang Alliance Paper, Financial Analysis of Costs and Benefits of a National Container Deposit Scheme: A FeasibilityReview, Table 32, p 40; Nelson, Carol and Gonzalez (2010) Improving California’s Beverage Container Recycling Rates
C.2 Away from home collection
Derivation of the WCS estimate of away from home transport and collection costs
In the away-from-home sector, the costs for collection of packaging wastes will be a function of the mix ofmaterial collected – paper and cardboard, mixed plastics, or fully comingled plastics and paper and cardboard– which are the common mix of packaging commodities collected in the C&I, or away from home, sector.
Businesses generating relatively large quantities of specific streams of packaging materials for recycling willgenerally implement material-specific recycling services to maximize the value in the recyclables and minimizethe cost of the collection service.
However, for the vast majority of small to medium sized businesses, where significant quantities of single-stream recyclables are generally not available, the cost of infrequent services for streamed recyclables can begreater than the cost of a general waste service. Therefore, those service providers in the waste industry that arekeen to obtain recyclables generally offer fully comingled recycling services. Here the embodied value in therecyclable haul is lower than for streamed materials, due to the additional sorting required, but the overall value

Appendix C Collection and transport costs
PwC | WCS 119 Packaging cost benefit analysis report
and the frequency of collection can make the cost of the service equivalent to or cheaper than a general wasteservice.
As with the municipal sector, most away-from-home collection services are priced on a full-service basis – thatis collection and disposal or beneficial processing. For a general waste service the cost is therefore the cost tocollect plus the cost to dispose to landfill. While for a recycling service, the cost to the generator is the cost tocollect less the benefit from material recovery that the contractor is prepared to pass on to the generator.Where the value of the commodities recovered is high, then the cost of the service is expected to be well belowthat of a general waste service, making recycling attractive to the generator. But in instances where the value ofthe commodities is low, as is the case with fully comingled services, the benefit passed back to the generator islow and the marginal difference between the comingled recycling service and a general waste service ismarginal.
To estimate the cost per tonne for collection only – i.e. no contribution from the value of the recoveredmaterials – a first principles approach has been adopted based on industry-sourced and tested costs to own andoperate commercial collection vehicles and the typical levels of productivity expected in the market. Thisapproach gave rise to a cost to collect away-from-home recyclables at $26 per tonne collected and delivered toa facility for sorting.
This first principles based estimate was then compared with market prices obtained on a confidential basis froma number of service providers in a major metropolitan market and found to be consistent with current marketcosts, unencumbered by any element for disposal or beneficial processing and sale of materials.

Appendix D Landfill disposal fees
PwC | WCS 120 Packaging cost benefit analysis report
Appendix D Landfill disposal fees
Appendix D presents WCS estimates of landfill disposal fees.
Derivation of WCS estimate of landfill disposal fees
Packaging that is collected but is unsuitable for recycling must be disposed at landfill. Landfill disposal pricesdiffer between metropolitan, regional and rural areas. The following table shows the tonnages disposed atsmall/rural, medium/regional and large/metro landfills.
Table D.1: Tonnes of waste disposed of at Australian landfills
Number ofLandfills
Tonnes to small/rurallandfill
Tonnes to medium/regionallandfill
Tonnes to large/metrolandfill Total
NSW 85 136,182 1,404,539 4,905,000 6,445,721
QLD 97 142,472 898,998 2,972,000 4,013,470
SA 71 110,475 249,300 920,000 1,279,775
Tas 11 9,650 291,400 120,000 421,050
VIC 56 28,000 1,370,100 3,591,713 4,989,813
WA 6 172,460 759,750 2,697,306 3,629,516
NT 2 50,000 230,000 280,000
ACT 1 205,000 205,000
Total 329 599,329 5,024,087 15,641,019 21,264,345
Source: WMAA National Landfill Survey (WMAA 2007)
The table below shows landfill disposal costs for rural/regional (small), major regional (medium) andmetropolitan (large) landfills in each state, based on average gate fees at between one and five representativefacilities of each type in each state.
Table D.2: Estimated landfill disposal costs
Major metro (large)
$/tonne
Major regional (medium)
$/tonne
Rural/regional (small)
$/tonne
NSW Gate fee 192.58 152.10 127.7
GST 19.08 15.07 12.65
Waste levy 70.30 65.30 20.40
Net disposal fee 103.19 71.73 94.65
QLD Gate fee 81.15 158.08 30.17
GST 8.04 15.67 2.99
Waste levy 0 0 0
Net disposal fee 73.11 142.41 27.18
SA Gate fee 120.00 80.00 5.00
GST 11.89 7.93 0.00
Waste levy 35.00 17.50 17.50
Net disposal fee 73.11 54.57 4.50
Tas Gate fee 39.25 61.50 99.00
GST 3.89 6.09 9.81
Waste levy 2.00 2.00 2.00
Net disposal fee 33.36 53.41 87.19
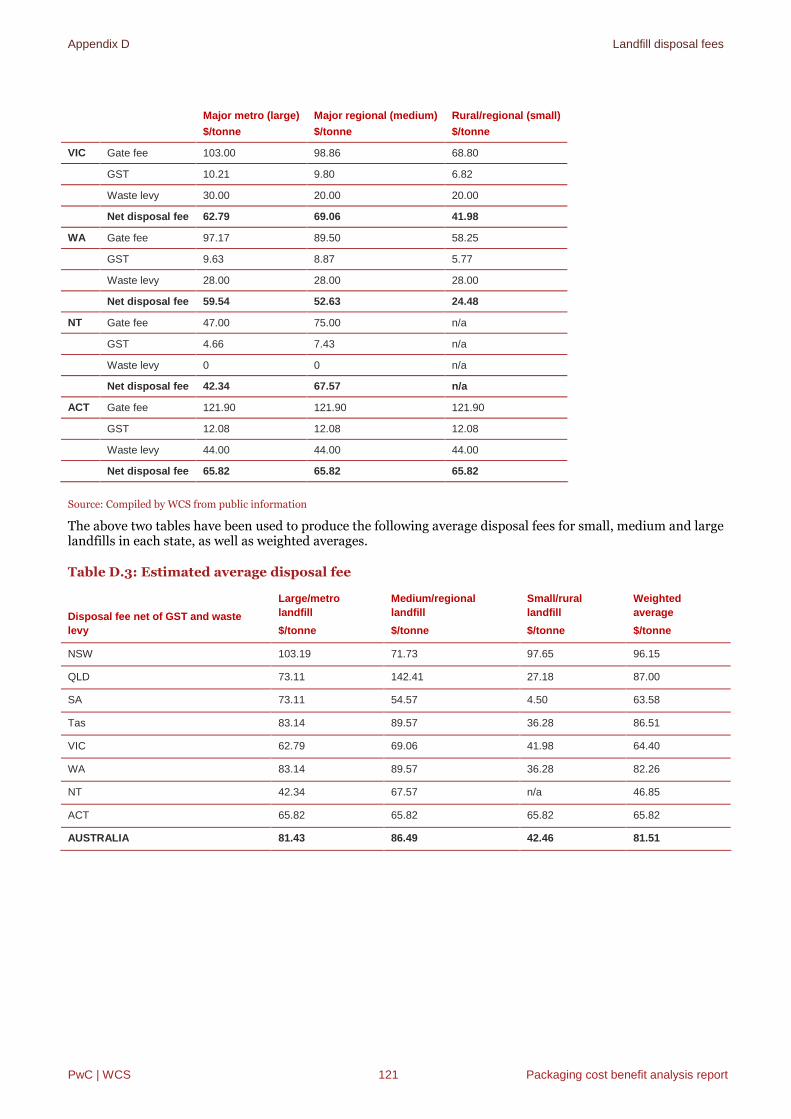
Appendix D Landfill disposal fees
PwC | WCS 121 Packaging cost benefit analysis report
Major metro (large)
$/tonne
Major regional (medium)
$/tonne
Rural/regional (small)
$/tonne
VIC Gate fee 103.00 98.86 68.80
GST 10.21 9.80 6.82
Waste levy 30.00 20.00 20.00
Net disposal fee 62.79 69.06 41.98
WA Gate fee 97.17 89.50 58.25
GST 9.63 8.87 5.77
Waste levy 28.00 28.00 28.00
Net disposal fee 59.54 52.63 24.48
NT Gate fee 47.00 75.00 n/a
GST 4.66 7.43 n/a
Waste levy 0 0 n/a
Net disposal fee 42.34 67.57 n/a
ACT Gate fee 121.90 121.90 121.90
GST 12.08 12.08 12.08
Waste levy 44.00 44.00 44.00
Net disposal fee 65.82 65.82 65.82
Source: Compiled by WCS from public information
The above two tables have been used to produce the following average disposal fees for small, medium and largelandfills in each state, as well as weighted averages.
Table D.3: Estimated average disposal fee
Disposal fee net of GST and waste
levy
Large/metro
landfill
$/tonne
Medium/regional
landfill
$/tonne
Small/rural
landfill
$/tonne
Weighted
average
$/tonne
NSW 103.19 71.73 97.65 96.15
QLD 73.11 142.41 27.18 87.00
SA 73.11 54.57 4.50 63.58
Tas 83.14 89.57 36.28 86.51
VIC 62.79 69.06 41.98 64.40
WA 83.14 89.57 36.28 82.26
NT 42.34 67.57 n/a 46.85
ACT 65.82 65.82 65.82 65.82
AUSTRALIA 81.43 86.49 42.46 81.51

Appendix E Thresholds of business size in the Australian Packaging Covenant
PwC | WCS 122 Packaging cost benefit analysis report
Appendix E Thresholds of business size in the AustralianPackaging Covenant
Appendix E discusses the justification for inclusion of a threshold, the current threshold applied in the APC andan estimate of the distributions of companies by size.
E.1 Justification for a thresholdIt should be noted that, as a general statement, the implementation of new or amended regulations has thepotential to impact consumers, businesses and government. Some regulatory impacts may be positive, such asreduction in environmental externalities from disposal of waste to landfills. However, some impacts may benegative such as industry costs to comply with new regulation. Furthermore, the impacts may affect one partymore than another – for example regulatory compliance costs may affect importers and/or customers. This maybe despite net benefits being generated for the broader community.
Providing an exemption to regulatory requirements is usually designed or intended to reduce the administrativecost on businesses (or individuals) for which activity may be small or peripheral and the cost of compliance isdisproportionately high. It also reduces costs to government since it reduces the scope of enforcement of theregulation.111
Setting a threshold for inclusion (or exclusion) in a regulatory scheme is one method for minimising thefinancial burden of regulation. Such thresholds are often granted on the basis that the burden of regulation fallsdisproportionately on small business, defined as having less than 20 employees112 or $2 million in revenue.113
E.2 Current APC thresholdThe APC is underpinned by the statutory NEPM to provide protection for brand owner Covenant signatoriesagainst ‘free riders’. Under the NEPM firms over a $5 million threshold who are not signatories of the Covenantare subject to the NEPM enforcement provisions. In other words, there is a threshold of $5 million turnover,under which, companies are excluded from the obligations of the APC. This threshold was established by theNEPC and is consistent with Clause 12 of the NEPM that ‘it is not the intention of Council that enforceableobligations will be placed on brand owners that do not significantly contribute to the waste stream’.
E.3 Distributions of companies by sizeThe table below presents the distribution of signatories to the APC by company size based on analysisundertaken in 2008 for the mid-term review.
Table E.1 – Covenant (2005-2010) signatory firms (as at October 2008)
Company size ($ turnover per annum) Number of firms Mid-point value ($ millions) Estimated turnover % total
> $10bn 2 10,000* 20,000 15.0
$5bn - $10 bn 1 7,500 7,500 5.6
$3 bn - $5 bn 2 4,000 8,000 6.0
$1 bn - $3 bn 20 1,500 30,000 22.5
$0.75 bn - $1 bn 14 875 12,250 9.2
$500 m - $750 m 18 625 11,250 8.4
$250 m – 500 m 52 375 19,500 14.6
111 PwC (2011) Threshold for the proposed television and computer recycling scheme: Including analysis of indicative funding model scenarios, prepared for
the Department of the Environment, Water, Heritage and the Arts, p 24
112 ABS (2002) Small Business in Australia, 2001, Catalogue No. 1321.0
113 ATO website, Am I eligible for the small business entity concessions, available at<http://www.ato.gov.au/businesses/content.asp?doc=/content/00103072.htm&pc=001/003/084/004/001&mnu=45054&mfp=001/003&st=&cy=1>,accessed 20 July 2010

Appendix E Thresholds of business size in the Australian Packaging Covenant
PwC | WCS 123 Packaging cost benefit analysis report
Company size ($ turnover per annum) Number of firms Mid-point value ($ millions) Estimated turnover % total
$100 m - $250 m 79 175 13,825 10.4
$75m - $100 m 32 87.5 2,800 2.1
$50 m -$75 m 41 62.5 2,562.5 1.9
$25 m - $50 m 84 37.5 3,150 2.4
$10 m – $25 m 120 17.5 2,100 1.6
$5 m - $10 m 66 7.5 495 0.4
< $5 m 36 2.5 90 0.1
Source: Environment Protection and Heritage Council, Decision Regulatory Impact Statement: Used Packaging Materials, p 21Note: The size distribution of data as at 2008 was used to estimate actual revenues for firms (based on midpoint estimates), and
relative shares of firms contributing to the Covenant. They are derived from an estimate of the ‘representative’ or averageturnover of a company in a particular turnover band (assumed to be the midpoint value in the band), and the number of firmsin each turnover band. * A lower bound estimate has been used for these ‘over $10 billion pa turnover’ firms. This is aconservative approach to estimating the market share (and dominance) of Covenant signatories.

Appendix F Market value of materials
PwC | WCS 124 Packaging cost benefit analysis report
Appendix F Market value of materials
Appendix F presents additional information on the WCS methodology and assumptions to estimate the marketvalue of resources, discusses the price premium for CDS and presents alternative estimates for potentialinclusion in sensitivity testing.
F.1 WCS estimate of the market value of resourcesPrices received by MRF operators for the materials sorted in recycling facilities are confidential to theindividual businesses and significantly influenced to the degree of vertical integration from the MRF through tofurther reprocessing and value adding.
However, there are public information sites where trend data for various commodities typically found in thekerbside recycling packaging haul can be obtained. Using a combination of such trend data and informationprovided on a confidential basis from recycling industry sources, the following data is considered to be broadlyrepresentative of the process that might be obtained for packaging materials recovered from MRFs in capitalcities across Australia.
Table F.1 – Market value of resources
Material Material Value ($/tonne)
Paper/Cardboard $1811
Glass $302
Aluminium Cans $1,5603
Plastics (40:20:20:20) $5604
Plastics – mostly sorted $530
Plastics – fully mixed (30:30:40) $3725
Steel Cans $2806
Liquid Paperboard $1507
Weighted Average (basket) $1628
Sources:1. PPI Asia for OCC and Mixed Grade (Visy) and Paper Fibre Network2. Owens Illinois and BDA/MMA (2007)3. LME and Metals Price Archive (Letsrecycle.com)4. Streamed plastics (assuming 40% PET, 20% HDPE, 20% LDPE, 20% mixed) –Recycling industry sources5. Fully mixed plastics (assuming 30% HDPE, 30% PET, 40% mixed) – Recycling industry sources6. Recycling industry sources7. Recycling industry sources8. Weighted average basket price for recyclables based on national NEPC recyclate mix.
Cardboard and Paper
The two major recyclers of packaging-sourced cardboard and paper in Australia are VISY and AMCOR, andboth organisations source recycled paper and cardboard for in-put feed to their paper mills (i.e. they arevertically integrated and source recycled product as an alternative to virgin feed stock for manufacture of newpackaging products). Notwithstanding that the internal transfer prices for recovered materials within thesebusiness is confidential, there is a reasonable probability that those prices (if available) might also not be fullyreflective of the open market dynamics that shape commodity prices.
Therefore, to develop an understanding of the likely market price for packaging paper and cardboard recoveredfrom MRFs reference was made to:
the Waste Paper Composite index which tracks the changing market prices in the paper recycling andrecovered paper fibre markets (the Index consists of a weighted basket of specific benchmark grades ofscrap/recovered paper)
PPI price data for Old Corrugated Cardboard (OCC) sold in Australia for export to China.
The medium-term trend data gave an indication of price trends, while the PPI price index data providedinformation on OCC prices paid in Australia up to December 2011. With the price trend very stable over the lastsix months, the December 2010 data was projected forward to June 2011 for this analysis.

Appendix F Market value of materials
PwC | WCS 125 Packaging cost benefit analysis report
Premium for CDS
Anecdotal evidence suggests that there is an increase in the value of paper/cardboard recovered throughkerbside when a CDS is in place. This is because there is reduced glass contamination in kerbside, which canlead to a higher market value for other items.
A premium for the price of plastic under CDS has been included in the CBA, however there was not sufficientevidence or data available to include a premium for paper/cardboard. However, further investigation of thisissue would be warranted in the Decision RIS.
Glass
Compared to other recovered packaging materials, glass is heavy, low in value and subject to a stringent qualityspecification for reuse. This means it is generally not viable to export recovered glass. Most recovered glass inAustralia is directed to Owens Illinois (or Amcor in SA) for re-smelting - or is processed for alternative usessuch as aggregate substitute, glass-sand or filtration material.Recovered glass which conforms to specification (98% colour separation and less than 25ppm CSP(ceramics/stones/pyroceramics)) is purchased by Owens Illinois at $72 per tonne. This base rate for relativelyhigh quality sorted glass has not changed in the past decade. A more conservative price of $30 per tonne wasapplied in the core CBA based on advice from WCS.
Kerbside or commingled glass (mixed glass) is collected mixed with other recyclable materials and requiresseparation from those materials, sorting into the three-colour streams and decontamination from CSP. OwensIllinois charges a processing fee (in addition to the purchase price) to processors who deliver this material.
Premium for CDS
The core CBA applied an assumed value for glass of $30 per tonne. However, there is evidence that OwensIllnois purchases glass for as much as $72 per tonne and advice from South Australia that recyclers receive asmuch as $100 per tonne for glass collected by the CDS. The core CBA applies a ‘price premium’ of $100 pertonne for glass collected through the CDS.
Aluminium
Whilst Aluminium, commonly used in the manufacture of many drink cans, is traded on the LME (LondonMetal Exchange). The prices commonly seen are those for virgin metal, which is not representative of themarket value placed on recycled aluminium containers in the typical kerbside recycling haul. For example, inJune 2011, data from the LME and the Metal Prices Archive of Letsrecycle.com reveal the following variation inprices for virgin aluminium metal compared with recycled aluminium cans of various quality.
Table F.2 – Comparison of prices for virgin aluminium metal compared with recycledaluminium cans
Grade of Material Price /tonne
LME 100% Al metal £1,615
LME 70% (clean Al cans) £1,180
Baled and compacted cans £1,040
Loose & flattened cans £980
Loose whole cans £980
For this analysis the June 2011 price paid in UK to recyclers for used aluminium beverage containers that arebaled and compacted was selected as the benchmark price.
Plastics
As with most commodities, plastics are sold both by sorted polymer type and in mixed lots, with higher pricesbeing attained with higher degrees of sorting. In May-June 2011 recycling industry sources indicated that thefollowing prices were being offered to Australian recyclers for recycled plastic packaging materials.

Appendix F Market value of materials
PwC | WCS 126 Packaging cost benefit analysis report
Table F.3 – Prices offered to Australian recyclers for recycled plastic packaging materials
Plastic Type USD $/tonne Comments
PET $750 - $780
PET Coloured $535 - $545
HDPE $660 - $670
HDPE Coloured $640 - $650
LDPE 90/10 $500 - $510 90% clean film, 10% stickers or labels
LDPE 95/5 $550 - $570 95% clean film, 5% stickers or labels
LDPE Colour $290 - $310
Mixed Plastic 442 $370 - $400 40% HDPE, 40% PET mixed colours, 20% other plastics
Mixed Plastic 226 $340-$380 20% HDPE, 20% PET mixed colours, 60% other plastics
Note: These prices primarily include the cost of transporting to reprocesses.
Recycling MRF operators attempt to sort the mixed in-feed plastics to polymer type, but commonly have aresidual amount of plastics that are aggregated into a mixed plastics class. Therefore a number of options areavailable for pricing the basket of plastics that might be recovered in MRFs as follows:
(a) Assuming a sort to polymer type that yields a 40:20:20:20 sort (40% PET, 20% HDPE, 20% LDPE, and20% mixed), indicates a price for the basket of $560 per tonne;
(b) An alternative approach is to― Select the main polymer types that comprise the recycled plastics stream in the domestic
recyclables (PET 61% and HDPE 25%) from recycling activity reports in South Australia― assume they achieve the market price for the coloured class of those polymer and the remainder
(14% mixed), and― assume that yields the lowest quality price for mixed plastics.― This indicates a price for the basket of $530 per tonne;
(c) Using the same selection, but assuming that only 75% of each of the two main polymer types is recovered totype and the balance is in the mixed class, indicates a price for the basket of $501 per tonne;
(d) Assuming all plastics remain mixed and are baled and sold mixed, indicates a price for the basket of $372per tonne.
In all probability, the majority of capital city MRFs will sort the plastics stream to type to some degree oranother, given the pricing differentials between mixed plastics and sorted plastics. Therefore, the fully mixedscenario is unlikely, and one could expect a price for the basket of plastics to be in the range $500 to $560 pertonne, depending on the degree of sort – say $530 per tonne.
Premium for CDS
Plastic beverage containers recovered through the SA CDS are invariably cleaner and presented more accuratelyto polymer type than most shipments received via the kerbside/MRF system. The general industry view is thatthis results in a preference by plastics reprocessors for SA CDS post-consumer PET and HDPE. Does thistranslate to a premium price? This is commercial information not formally available outside the companiesinvolved in transactions. The key factors are the material supply/demand position and the scope for economiesin the reprocessing production line with clean, well sorted containers. Granting both an excess of supply overdemand and the fact that production economies can be achieved with CDS materials, a price premium isentirely feasible, and it is likely continue in a national CDS as current and future production systems could beorganised to take advantage of CDS output quality.
Based on discussions with industry it is estimated that $100/tonne premium for PET and HDPE is available,bringing the total price for the basket of plastics to $660/tonne.
Liquid Paperboard
Liquid paperboard ceased to be recycled in Australia following the closure of the paper recycling mill atShoalhaven in NSW. Therefore, if recovered in the MRF sorting process, these materials are exported to eitherChina or Korea.
There are two common grades of LPB in use in Australia – Standard LPB and Aeseptic LPB.

Appendix F Market value of materials
PwC | WCS 127 Packaging cost benefit analysis report
Standard LPB is high grade cardboard with a liquid-proof polyethylene coating on both sides, and Aeseptic LPB has a thin layer of aluminium foil on one side (the inside of the container).
If included in the paper/cardboard stream of recyclables, LPB containers tend to be flattened in the collectionprocess and may end up in one of three output streams –
i. the aluminium stream for some Aseptic LPB which is removed via the eddy current sorting device,ii. the cardboard stream for many of the LPB containers where much of the material is lost in the hydro
pulping mill at the paper recycling mills, oriii. the waste stream and destined for landfill.
If included in the containers stream, some of the LPB containers retain their shape and can be recovered as partof the manual picking process, then bales and sent for export.
Exported LPB typically achieves a price of $US250 per tonne CIF in China or Korea.
Steel Cans
Tin-plated steel cans are very effectively recovered from all Australian MRFs using electro-magnetic separation.They are also recovered from mixed waste at various AWT facilities, however these cans typically contain ahigher level of residual food contamination compared with the MRF-sourced material. This makes storage,shipping and acceptance of the AWT-sourced material by reprocessors problematic.
Since the closure of Blue Scope’s Port Kembla de-tinning plant in 2006, there is no de-tinning capability inAustralia and steel cans are officially banned as a contaminant in steel feedstock at all Australian steel mills.This means that currently all tin-plated steel cans are exported from Australia.
Clean tin-plated steel cans are currently selling for around USD$380 per tonne CIF delivered in Pakistan.
F.2 Recycling by materialIn order to estimate the value of the material recycled under each option, the projections for recycling reflect achange in the split of material types. Some options target certain material types or recycling locations, andcould therefore have differing impacts on the split of recycling by material type.
Base case
In the base case recycling in tonnes increases for each material type. However, some material types have fastergrowth rates (such as Glass). This means that as a proportion of total recycling, paper/cardboard decreaseswhereas the other materials increase or are stable.
Some material types, such as aluminium cans and paper/cardboard, already have very high recycling rates andit is assumed that recycling rates cannot exceed 90%. Therefore, there is ‘less room’ for growth in the recyclingof these materials. Whereas other materials, with low recycling rates, have more room for growth andconsequently increase as a proportion of total recycling.
Table F.4 - Base case recycling by proportion of materials
Material 2015 2025 2035
% % %
Paper/cardboard 73% 72% 66%
Glass 18% 19% 23%
Plastics: PET beverage 2% 3% 3%
Plastics: HDPE beverage 1% 1% 1%
Plastics: non-beverage (mixed) 1% 1% 1%
Film plastic 2% 2% 2%
Steel cans 2% 2% 2%
Aluminium Cans 1% 1% 1%
Total 100% 100% 100%
Source: WCS (2011) based on products/materials targeted by each optionNote: Due to rounding the tables may not add to 100.

Appendix F Market value of materials
PwC | WCS 128 Packaging cost benefit analysis report
Option 1
The split of recycling by material type is broadly similar in option 1 to the base case, though total recyclingunder Option 1 increases faster than in the base case.
It is assumed that beverage container recycling increases slightly more rapidly than in the base case. This isbecause of the coordinated, national initiatives which are assumed to target beverage containers. Therefore,PET beverage containers increase a proportion of total recycling.
Table F.5 - Option 1 recycling by proportion of materials
Material 2015 2025 2035
% % %
Paper/cardboard 73% 70% 66%
Glass 18% 20% 23%
Plastics: PET beverage 2% 3% 3%
Plastics: HDPE beverage 1% 1% 1%
Plastics: non-beverage (mixed) 1% 1% 1%
Film plastic 2% 2% 2%
Steel cans 2% 2% 2%
Aluminium Cans 1% 1% 1%
Total 100% 100% 100%
Source: WCS (2011) based on products/materials targeted by each optionNote: Due to rounding the tables may not add to 100.
Option 2A
Under option 2A. beverage containers recycling increases at a more rapid rate than in the base case, resulting inbeverage containers making up a greater proportion of total recycling. This is reflected in the beveragecontainer categories (such as plastics and glass) making up an increasing proportion of recycling compared tothe base case.
Table F.6 - Option 2A recycling by proportion of materials
Material 2015 2025 2035
% % %
Paper/cardboard 73% 69% 66%
Glass 18% 21% 23%
Plastics: PET beverage 2% 3% 3%
Plastics: HDPE beverage 1% 1% 1%
Plastics: non-beverage (mixed) 1% 1% 1%
Film plastic 2% 2% 2%
Steel cans 2% 2% 2%
Aluminium Cans 1% 1% 1%
Total 100% 100% 100%
Source: WCS (2011) based on products/materials targeted by each optionNote: Due to rounding the tables may not add to 100.
Option 2B
Option 2B, as proposed by industry, is assumed to particularly target problem areas such as beverage containerrecycling. A range of initiatives such as the provision of recycling bins in public spaces, lead to an increase in therecycling rates of beverage containers. Consequently, plastics and glass recycling increase at a faster rate thanpaper/cardboard, which is the reason for the decrease in the proportion of paper/cardboard and the increase inglass and PET.

Appendix F Market value of materials
PwC | WCS 129 Packaging cost benefit analysis report
Table F.7 - Option 2B recycling by proportion of materials1
Material 2015 2025 2035
% % %
Paper/cardboard 71% 67% 65%
Glass 19% 22% 24%
Plastics: PET beverage 3% 3% 4%
Plastics: HDPE beverage 1% 1% 2%
Plastics: non-beverage (mixed) 1% 1% 1%
Film plastic 2% 2% 2%
Steel cans 2% 2% 2%
Aluminium Cans 1% 1% 1%
Total 100% 100% 100%
Source: WCS (2011) based on products/materials targeted by each optionNote: Due to rounding the tables may not add to 100.
Option 2C
Like Option 2B, Option 2C targets identified problem areas such as beverage container recycling. However,Option 2C involves significantly greater funding and a greater number of initiatives to target phoenix activity.Therefore, there is a greater increase in overall recycling and a particularly significant increase in glass and PETrecycling. This results in glass and PET making up a greater proportion of total recycling.
Table F.8- Option 2c recycling by proportion of materials
Material 2015 2025 2035
% % %
Paper/cardboard 71% 66% 63%
Glass 19% 23% 25%
Plastics: PET beverage 3% 3% 4%
Plastics: HDPE beverage 1% 1% 2%
Plastics: non-beverage (mixed) 1% 1% 1%
Film plastic 2% 2% 2%
Steel cans 2% 2% 2%
Aluminium Cans 1% 1% 1%
Total 100% 100% 100%
Source: WCS (2011) based on products/materials targeted by each optionNote: Due to rounding the tables may not add to 100.
Option 3Option 3 involves the same level of funding and initiatives as Option 2C. Therefore, the projections by materialtype and the split of material types is the same as under Option 2C.
Table F.9 - Option 3 recycling by proportion of materials1
Material 2015 2025 2035
% % %
Paper/cardboard 71% 66% 63%
Glass 19% 23% 25%
Plastics: PET beverage 3% 3% 4%

Appendix F Market value of materials
PwC | WCS 130 Packaging cost benefit analysis report
Plastics: HDPE beverage 1% 1% 2%
Plastics: non-beverage (mixed) 1% 1% 1%
Film plastic 2% 2% 2%
Steel cans 2% 2% 2%
Aluminium Cans 1% 1% 1%
Total 100% 100% 100%
Source: WCS (2011) based on products/materials targeted by each optionNote: Due to rounding the tables may not add to 100.
Options 4A and 4BBoth Option 4A and 4B have the same projected recycling rates. As the CDS options target beverage containers,recycling of glass and PET increase a rate greater than the other material types. This results in glass and PETmaking up an increased proportion of total recycling. Aluminium cans do not increase as a proportion of totalrecycling despite being targeted by the CDS. This is because recycling of aluminium cans is already very highand as it is assumed that the recycling rate of any material type cannot exceed 90%, there is minimal additionalrecycling of aluminium cans that can occur.
Table F.10 - Option 4 recycling by proportion of materials1
Material 2015 2025 2035
% % %
Paper/cardboard 73% 67% 64%
Glass 18% 22% 24%
Plastics: PET beverage 2% 3% 4%
Plastics: HDPE beverage 1% 1% 2%
Plastics: non-beverage (mixed) 1% 1% 1%
Film plastic 2% 2% 2%
Steel cans 2% 2% 2%
Aluminium Cans 1% 1% 1%
Total 100% 100% 100%
Sources: Provided by WCSNote: Due to rounding the tables may not add to 100.
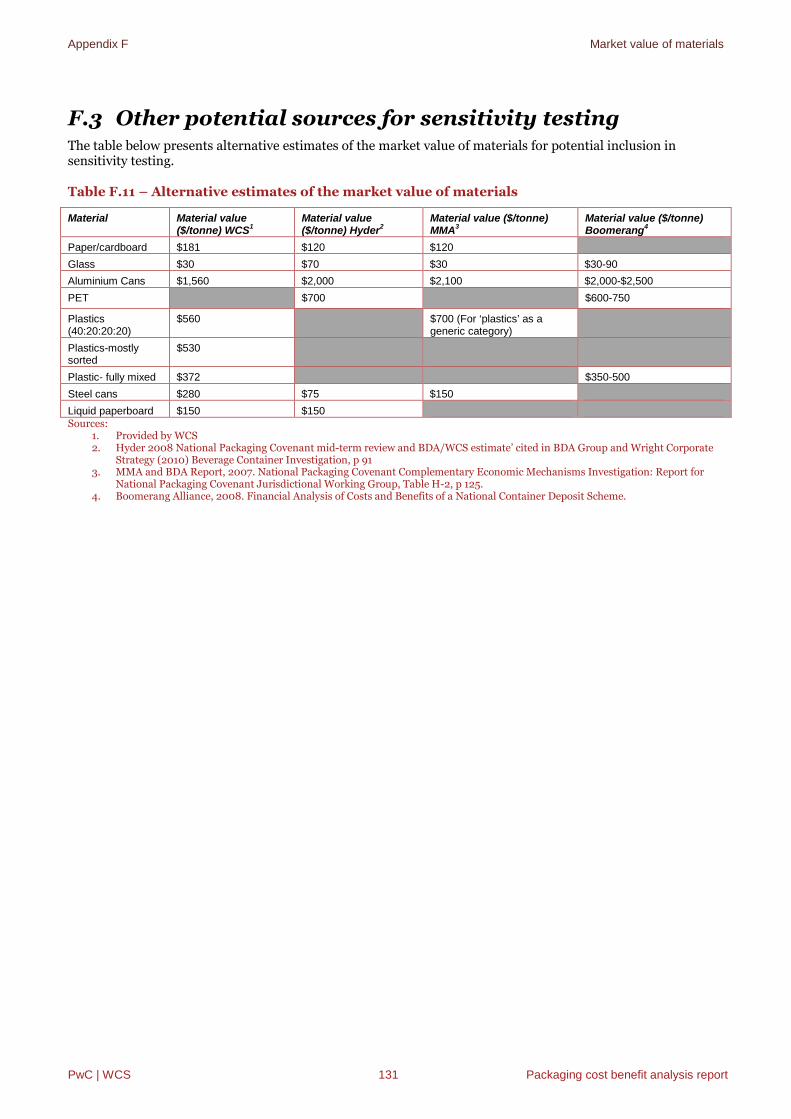
Appendix F Market value of materials
PwC | WCS 131 Packaging cost benefit analysis report
F.3 Other potential sources for sensitivity testingThe table below presents alternative estimates of the market value of materials for potential inclusion insensitivity testing.
Table F.11 – Alternative estimates of the market value of materials
Material Material value($/tonne) WCS1
Material value($/tonne) Hyder2
Material value ($/tonne)MMA3
Material value ($/tonne)Boomerang4
Paper/cardboard $181 $120 $120
Glass $30 $70 $30 $30-90
Aluminium Cans $1,560 $2,000 $2,100 $2,000-$2,500
PET $700 $600-750
Plastics(40:20:20:20)
$560 $700 (For ‘plastics’ as ageneric category)
Plastics-mostlysorted
$530
Plastic- fully mixed $372 $350-500
Steel cans $280 $75 $150
Liquid paperboard $150 $150Sources:
1. Provided by WCS2. Hyder 2008 National Packaging Covenant mid-term review and BDA/WCS estimate’ cited in BDA Group and Wright Corporate
Strategy (2010) Beverage Container Investigation, p 913. MMA and BDA Report, 2007. National Packaging Covenant Complementary Economic Mechanisms Investigation: Report for
National Packaging Covenant Jurisdictional Working Group, Table H-2, p 125.4. Boomerang Alliance, 2008. Financial Analysis of Costs and Benefits of a National Container Deposit Scheme.

Appendix G Landfill externalities
PwC | WCS 132 Packaging cost benefit analysis report
Appendix G Landfill externalities
The table below presents alternative estimates of the costs of landfill externalities in Australia:
Table G.1 – Alternative estimates of the costs of landfill externalities in Australia
Source Estimate Note
BDA and WCS(2010)
$0-$24 BDA cited the Productivity Commission 2006 study which reviewed a number of studies and concluded thatthe external disamenity costs of Australian landfills could range from $0 to $24/tonne of waste. They notedthat the Productivity Commission concluded that the average cost for a properly located, engineering andwell managed site would be less than $1.00/tonne
BDA (2009) $41-$102
The BDA Group quantified the following key non-market costs of landfill:
Greenhouse emissions, using the National Greenhouse Accounts (NGA) Factors publishedby the Department of Climate Change in November 2008.
Other emissions to air, using the National Pollutant Inventory Emission EstimationTechnique Manual for Municipal Solid Waste Landfills published by the Department ofEnvironment and Heritage in May 2005
Emissions to water (leachate)
Disamenity using the Productivity Commission’s estimate of around $1 per tonne of wastefor disamenity associated with a best practice landfill.
The BDA Report concluded that total costs for urban and rural landfills are similar - ranging between $42and $102 per tonne of waste in urban areas and between $41 and $101 per tonne in rural areas, dependingon the level of management controls and prevailing climate.
External costs are significant for landfills with the poorest controls and in wet climates, making up 25%-45%of total costs for landfills in urban areas and 20%-40% of total costs for landfills in rural areas. Thecontribution of external costs to total costs is much lower for landfills with best practice controls at less than4% in urban areas and less than 1% in rural areas.
EuropeanCommission(2000)
€11-20 The report estimated environmental impacts based on both a modern landfill with modern leachatecollection and treatment and with landfill gas collected to generate electricity and heat. Old landfillswere assumed not to have a liner and leachate collection or gas collection.
The total external impact of landfills in Europe is estimated to range between 11 and 20 Euros pertonne of waste delivered to modern and old landfills respectively. Because of the larger populationsand closer settlement in Europe, a greater number of households could be expected to be directlyimpacted by each landfill, and this is borne out in the large environmental cost attributed to disamenityimpacts on local communities arising from noise, dust, litter, odour and vermin.
Porter (2002) US$3-15 In 2002 Porter estimated the external costs of landfilling in the US at between $US3 and $US15 per ton114.This estimate covers methane emissions, leachate and amenity impacts and draws on earlier work115. Itignores land costs and assumes no landfill gas is recovered.
EnvirosConsulting(2004)
£1.5-2.2 In 2003 the UK Department for Environment Food and Rural Affairs commissioned Cambridge Econometricsto identify and estimate the disamenity costs of landfill in Great Britain. Disamenity costs were defined as those local nuisance costs experienced by households living close to a landfill such as odour, dust, litter, noise, vermin, and visual intrusion. The study used hedonic pricing116 to estimate disamenity costs. Thedisamenity cost in the UK was estimated at between £1.5 and £2.2 per tonne of waste disposed to landfill.
Davies andDoble (2004)
£4.6-6 In 2004 the external costs of landfilling in the UK were explored as part of a study on a landfill tax for the UK.Davies and Doble 2004117 estimated external costs at around £4.6 - £6 per tonne of waste landfilled. Theestimates cover global pollutants such as greenhouse gases, local (urban) air pollution, transport impacts118,leachate, disamenity and pollution displacement. The disamenity values were derived by transferring resultsfrom US studies of property pricing to the UK context.
114 Porter 2002
115 Miranda and Hale 1997
116 Hedonic pricing is an economic valuation method based on assessing the indirect impact on a market price – in this case housing prices – when an
externality occurs. Landfill sites were categorised, and variation in the level of prices of adjacent houses that are solely attributable to disamenity impacts were identified.
117 Davies and Doble 2004
118 The estimates shown in this section include many components of the costs of disposal (and these are specified). In later sections of the report our
assessment of external costs ignores collection and transport impacts as these will be similar whether sent to landfill or for recycling.

Appendix G Landfill externalities
PwC | WCS 133 Packaging cost benefit analysis report
Source Estimate Note
Covec (2007) NS$10-60
In 2007 the New Zealand Ministry for the Environment commissioned a cost-benefit analysis of recycling119.The study by Covec estimates the external costs of landfilling at around NZ$10-$60 per tonne of wastelandfilled. The estimates cover avoided disamenity impacts, greenhouse gases and leachate.
ProductivityCommission(2006)
$0-24 In 2006 the Productivity Commission examined the external costs of landfill as part of its Inquiry into WasteGeneration and Resource Efficiency in Australia. The Productivity Commission examined a range ofestimates including the value of avoided air and water emission benefits at landfills inferred using ‘eco-dollars’. ‘Eco-dollars’ is a proprietary tool for the monetary valuation of environmental impacts associatedwith changes in waste management. The initial estimates were developed by Nolan-ITU as part of anIndependent Assessment of Kerbside Recycling in Australia (Nolan-ITU/SKM) in 2001.
The Productivity Commission reviewed the basis of the Nolan-ITU eco-dollar values and concluded theywere ‘implausibly high’120. This was attributed to
the inclusion of estimates based on the potential impacts of pollution without any risk adjustment forthe expected impact; and
valuing all pollution as if it occurred in a large metropolitan area where human health costs of pollutionare relatively high.
The Productivity Commission identified the value of avoided air and water emission benefits at landfillsinferred using the ‘eco-dollar’ approach was between $89 and $182 per tonne. When correcting for thefactors identified above, the Productivity Commission estimated that the environmental benefits were morelikely in the order of $0 to $5 per tonne.
Source: BDA and WCS (2010) Beverage Container Investigation; BDA (2009) The full cost of landfill disposal in Australia;European Commission (2000) A study on the economic valuation of environmental externalities from landfill disposal andincineration of waste, undertaken by COWI Consulting Engineers and Planners AS; Porter (2001) The Economics of Waste,Resource for the Future; Enviros Consulting (2004) Valuation of the external costs and benefits to health and environmentof waste management options, Final Report for DEFRA; Davies and Doble (2004) The Development and implementation ofa landfill tax in the UK, in Addressing the Economics of Waste, OECD; Covec (2007) Recycling: Cost Benefit Analysis,prepared for the New Zealand Ministry for the Environment; Productivity Commission (2006) Waste Management Report,Report no 38, Canberra
Note: Overseas estimates have been left in their original currency
119 Covec 2007
120 Productivity Commission 2006, page 425
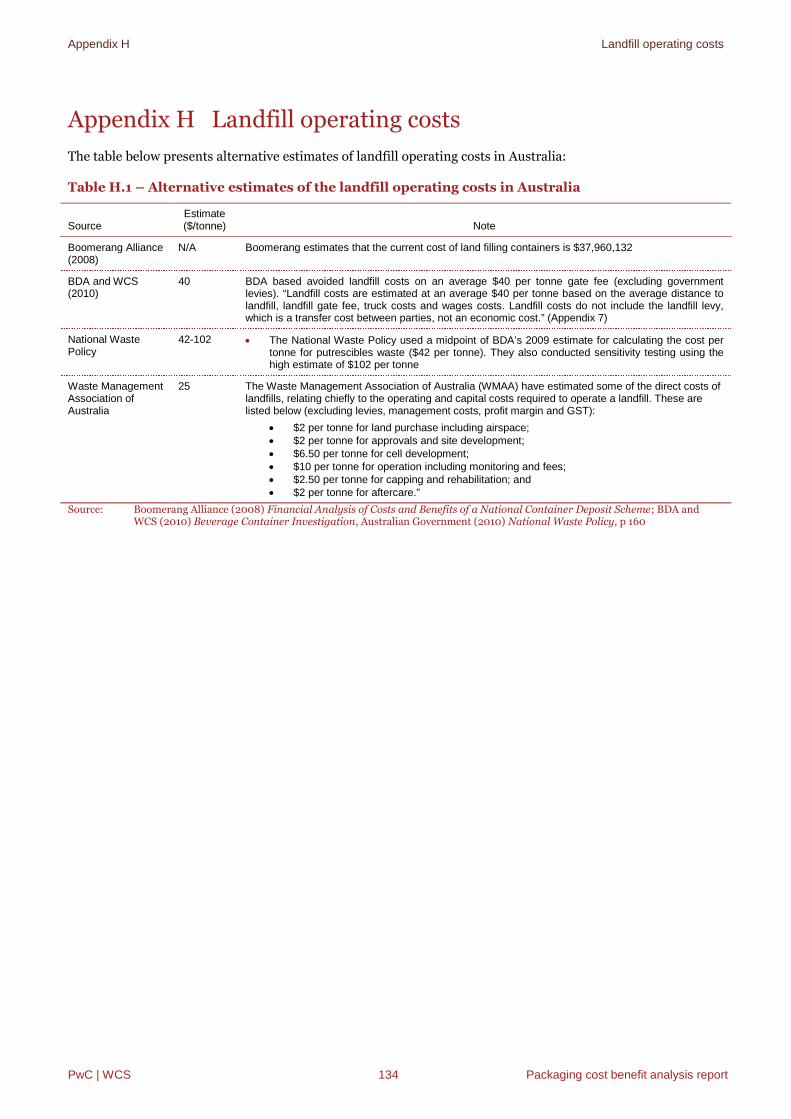
Appendix H Landfill operating costs
PwC | WCS 134 Packaging cost benefit analysis report
Appendix H Landfill operating costs
The table below presents alternative estimates of landfill operating costs in Australia:
Table H.1 – Alternative estimates of the landfill operating costs in Australia
SourceEstimate($/tonne) Note
Boomerang Alliance(2008)
N/A Boomerang estimates that the current cost of land filling containers is $37,960,132
BDA and WCS(2010)
40 BDA based avoided landfill costs on an average $40 per tonne gate fee (excluding governmentlevies). “Landfill costs are estimated at an average $40 per tonne based on the average distance tolandfill, landfill gate fee, truck costs and wages costs. Landfill costs do not include the landfill levy,which is a transfer cost between parties, not an economic cost.” (Appendix 7)
National WastePolicy
42-102 The National Waste Policy used a midpoint of BDA’s 2009 estimate for calculating the cost pertonne for putrescibles waste ($42 per tonne). They also conducted sensitivity testing using thehigh estimate of $102 per tonne
Waste ManagementAssociation ofAustralia
25 The Waste Management Association of Australia (WMAA) have estimated some of the direct costs oflandfills, relating chiefly to the operating and capital costs required to operate a landfill. These arelisted below (excluding levies, management costs, profit margin and GST):
$2 per tonne for land purchase including airspace; $2 per tonne for approvals and site development; $6.50 per tonne for cell development; $10 per tonne for operation including monitoring and fees; $2.50 per tonne for capping and rehabilitation; and $2 per tonne for aftercare.”
Source: Boomerang Alliance (2008) Financial Analysis of Costs and Benefits of a National Container Deposit Scheme; BDA andWCS (2010) Beverage Container Investigation, Australian Government (2010) National Waste Policy, p 160

Appendix I Litter clean up costs
PwC | WCS 135 Packaging cost benefit analysis report
Appendix I Litter clean up costs
The table below presents alternative estimates of litter cleanup costs in Australia:
Table I.1 – Alternative estimates of litter clean up costs in Australia
Source Estimate Note
SustainabilityVictoria (2010)
$74 million
$13.92 perperson
Overall cost of litter and street sweeping maintenance for local governments was over $74mill or$13.92 per person in Victoria
o Maintenance of litter bins, traps and litter clean up cost just $25 milliono Street sweeping services cost nearly $50 million a year (74% of this cost was
metropolitan local governments) ($49,561,215)o Roadside litter and illegally dumped rubbish cost local governments in Victoria nearly $6
million annually to collect
BoomerangAlliance (2008)
$48 million Boomerang estimates that the CDS could result in a saving of $48mill p.a in litter clean up costs. They estimated that containers make up 28.38% of litter volume and therefore, the cost of litter
abatement of containers is $58,760,000
Water WA(2006)
$66 perkerb km
Used an upper bound estimate that street sweeping in Western Australia cost $66 per kerb km(based on monthly clean up)
Indicative costs were reported from the Town of Victoria Park in Perth (population 27,500 peopleand approximately 17.6km2), it cost $130,000 for one street sweeper to collect 720-1080 tonnes ofwaste (main roads swept fortnightly, residential streets monthly)
BDA and WCS(2010)
$100,000per council
The average annual expenditure was calculated at just under $100,000 per year per Council, withthe amount spent annually increasing in proportion to population size (this was calculated from theNolan-ITU report and the McGregor marketing report)
Nolan-ITU(2002)
$16.5million
Nolan-ITU121 in 2002 undertook an investigation of the costs borne by key players in WA litterabatement, including Local Government, State Government and non-government organisations(NGOs) with a litter-related mandate.
Nolan-ITU caution that the estimate of direct costs to managing litter in WA is conservative as ‘itdoes not take into account many other direct costs associated with litter management such asthose incurred by special event organisers, shopping centres, transport authorities and NationalParks to name a few’.
This results in a Nolan ITU estimate of $99,994 per council for litter abatement
McGregorMarketing(1994)
$105,061per council
The McGregor (1994) CPI adjusted (into 2010 $) Australian council average of $105,061 Cited in Nolan-ITU (2002)
Brisbane CityCouncil
$6 million BCC reports that they spend more than $6 million per year on litter clean up
Source: Sustainability Victoria (2010) Annual Local Government Survey, p 5; Boomerang Alliance (2008) Financial Analysis ofCosts and Benefits of a National Container Deposit Scheme: Water WA (2006) Stormwater Management Manual forWestern Australia; Nolan-ITU (2002) Western Australian Local Government Association Litter Management Options inWestern Australia; Brisbane City Council (2010) Litter costs
121 Nolan-ITU (2002), Western Australian Local Government Association Litter Management Options in Western Australia

Appendix J CDS co-benefits
PwC | WCS 136 Packaging cost benefit analysis report
Appendix J CDS co-benefits
Appendix J provides additional detail on the non-packaging items currently accepted at CDS infrastructure inSouth Australia.
Table J.1 – Depots and commodities handled at CDS depots in South Australia
Depot
● = Buy
● = Drop off
Dep
osit
Co
nta
iners
Win
eB
ott
les
New
sp
ap
er
Card
bo
ard
Car
Batt
eri
es
No
n-D
ep
osit
Pla
sti
cB
ott
les
HD
PE
Milk
No
n-
Dep
osit
No
nF
err
ou
sM
eta
ls
Ste
el
Mix
ed
Cle
an
Pla
sti
cs
No
nD
ep
osit
Ste
el
can
s
Metropolitan
Daws RoadEdwardstown
● ● ● ● ● ● ● ● ● ● ●
Daws RoadOaklands Pk
● ● ● ● ● ● ● ● ● ● ●
NorthPlympton
● ● ● ● ● ● ● ● ● ● ●
Blackwood ● ● Beerboxesonly
● ●
Brighton ● No glass
Burton ● ● ● ● ● ● ● ● ●
ScoutsElizabethWest
● ● ● ● ● ● ● ● ● ● ●
GlenOsmond
● ● ● ● ● ● ● ● ● ● ●
GoldenGrove
● ● ● ● ● ● ● ● ● ● ●
Hackham ● ● ● ● ● ● ● ● ● ●
Holden Hill ● ● ● ● ● ● ● ● ● ●
Lonsdale ● ● ● ● ● ● ● small
quantities
●
Magill ● ● ● ● ● ● ● ● ● ● ●
ModburyNorth
● ● ● ● ● ● ● ● ●
Marlston ● ● ● ● ● ● ● ●
Newton ● ● ● ● ● ● ● ● ● ●
ScoutsGreenfields
● ● ● ● ● ● ● ● ● ● ●
Welland ● ● ● ● ● ● ● ● ● ●
ScoutsPayneham
● ● ● ● ● ● ● ● ● ● ●
Pooraka ● ● ● ● ● ● ● ●
Scouts PortAdelaide
● ● ● ● ● ● ● ● ● ● ●
Prospect ● ● ● ● ●
Royal Park ● ● ● ● ●
Reynella ● ● ● ● ● ● ●
ScoutsSalisbury
● ● ● ● ● ● ● ● ● ● ●
Seaford ● ● ● ● ● ● ● ● ● ● ●
Sheidow Park ● ● Beerboxesonly
● ●
Scouts MunnoPara
● ● ● ● ● ● ● ● ● ● ●
Thebarton ● ● ● ● ●
Welland ● ● ● ● ● ● ● ● ● ●
ScoutsWillaston
● ● ● ● ● ● ● ● ● ● ●
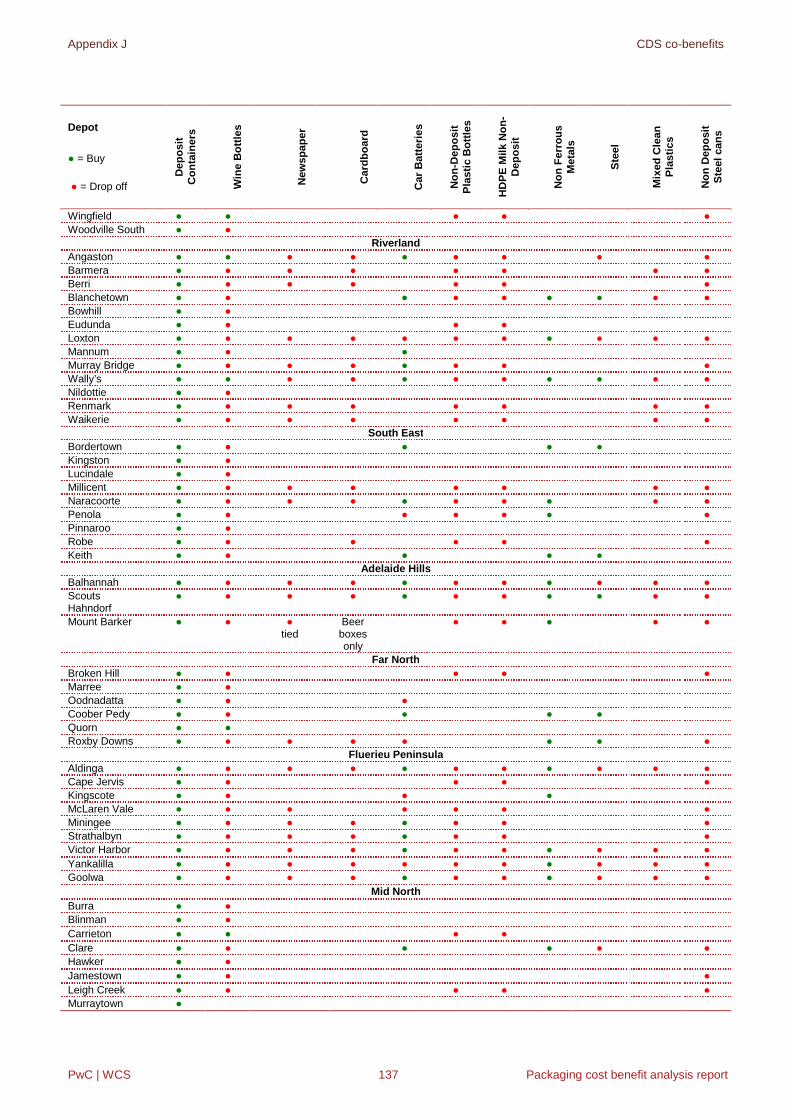
Appendix J CDS co-benefits
PwC | WCS 137 Packaging cost benefit analysis report
Depot
● = Buy
● = Drop offD
ep
osit
Co
nta
iners
Win
eB
ott
les
New
sp
ap
er
Card
bo
ard
Car
Batt
eri
es
No
n-D
ep
osit
Pla
sti
cB
ott
les
HD
PE
Milk
No
n-
Dep
osit
No
nF
err
ou
sM
eta
ls
Ste
el
Mix
ed
Cle
an
Pla
sti
cs
No
nD
ep
osit
Ste
el
can
s
Wingfield ● ● ● ● ●
Woodville South ● ●
Riverland
Angaston ● ● ● ● ● ● ● ● ●
Barmera ● ● ● ● ● ● ● ●
Berri ● ● ● ● ● ● ●
Blanchetown ● ● ● ● ● ● ● ● ●
Bowhill ● ●
Eudunda ● ● ● ●
Loxton ● ● ● ● ● ● ● ● ● ● ●
Mannum ● ● ●
Murray Bridge ● ● ● ● ● ● ● ●
Wally’s ● ● ● ● ● ● ● ● ● ● ●
Nildottie ● ●
Renmark ● ● ● ● ● ● ● ●
Waikerie ● ● ● ● ● ● ● ●
South East
Bordertown ● ● ● ● ●
Kingston ● ●
Lucindale ● ●
Millicent ● ● ● ● ● ● ● ●
Naracoorte ● ● ● ● ● ● ● ● ● ●
Penola ● ● ● ● ● ● ●
Pinnaroo ● ●
Robe ● ● ● ● ● ●
Keith ● ● ● ● ●
Adelaide Hills
Balhannah ● ● ● ● ● ● ● ● ● ● ●
ScoutsHahndorf
● ● ● ● ● ● ● ● ● ● ●
Mount Barker ● ● ● tied
Beerboxesonly
● ● ● ● ●
Far North
Broken Hill ● ● ● ● ●
Marree ● ●
Oodnadatta ● ● ●
Coober Pedy ● ● ● ● ●
Quorn ● ●
Roxby Downs ● ● ● ● ● ● ● ●
Fluerieu Peninsula
Aldinga ● ● ● ● ● ● ● ● ● ● ●
Cape Jervis ● ● ● ● ●
Kingscote ● ● ● ●
McLaren Vale ● ● ● ● ● ● ●
Miningee ● ● ● ● ● ● ● ●
Strathalbyn ● ● ● ● ● ● ● ●
Victor Harbor ● ● ● ● ● ● ● ● ● ● ●
Yankalilla ● ● ● ● ● ● ● ● ● ● ●
Goolwa ● ● ● ● ● ● ● ● ● ● ●
Mid North
Burra ● ●
Blinman ● ●
Carrieton ● ● ● ●
Clare ● ● ● ● ● ●
Hawker ● ●
Jamestown ● ● ●
Leigh Creek ● ● ● ● ●
Murraytown ●

Appendix J CDS co-benefits
PwC | WCS 138 Packaging cost benefit analysis report
Depot
● = Buy
● = Drop offD
ep
osit
Co
nta
iners
Win
eB
ott
les
New
sp
ap
er
Card
bo
ard
Car
Batt
eri
es
No
n-D
ep
osit
Pla
sti
cB
ott
les
HD
PE
Milk
No
n-
Dep
osit
No
nF
err
ou
sM
eta
ls
Ste
el
Mix
ed
Cle
an
Pla
sti
cs
No
nD
ep
osit
Ste
el
can
s
Orroroo ● ●
Peterborough ● ●
Eyre Peninsula
Cleve ● ● ● ● ● ●
Ceduna ● ● ● ● ● ● ● ●
Cowell ● ●
Cummins ● ●
Darke Peak ●
Elliston ● ●
Kimba ● ●
Port Augusta ● ●
Port Lincoln ● ●
Port Neill ● ●
HamiltonAldinga
● ● Beerboxes
● ● ● ● ● ●
Streaky Bay ● ●
Tumby Bay ● ● ●
Whyalla ● ● ● ● ● ● ● ●
Wudinna ● ● ● ● ● ● ● ●
Lock ● ● ●
Yorke Peninsula
Minlaton ● ●
Owen ● ●
Port Broughton ● ● ● ● ● ●
Stansbury ● ● ● ● ● ●
Warooka ● ●
Scotty’sWarooka
● no
glass
Source: Recyclers of South Australia, Depots and Commodities Handled, available at: http://www.recyclesa.com.au/

pwc.com.auwrightstrategy.com
© 2011 PricewaterhouseCoopers. All rights reserved. In this document, "PwC" refers toPricewaterhouseCoopers a partnership formed in Australia, which is a member firm ofPricewaterhouseCoopers International Limited, each member firm of which is a separate legal entity.

![Principles and Standards for Benefit–Cost Analysis] Introduction- Professionalizing Benefit–Cost Analysis](https://static.fdocuments.us/doc/165x107/56d6beb21a28ab30169333bb/principles-and-standards-for-benefitcost-analysis-introduction-professionalizing.jpg)