Attachment B: Area of Review and Corrective Action
20
Area of Review and Corrective Action Plan for ADM CCS#1 Permit Number: IL-115-6A-0002 Page B1 of 20 ATTACHMENT B: AREA OF REVIEW AND CORRECTIVE ACTION PLAN Facility Information Facility name: Archer Daniels Midland, CCS#1 Well IL-115-6A-0002 Facility contact: Mr. Mark Burau, Plant Manager, 4666 Faries Parkway, Decatur, IL, (217) 424-5750, [email protected] Well location: Decatur, Macon County, IL; 39 o 52’ 37.06469” N, 88 o 53’ 36.25685” W The Illinois Basin Decatur Project (IBDP) well CCS#1 is located approximately 0.7 miles southwest of the CCS#2 well at the Illinois Industrial Carbon Capture and Sequestration (IL- ICCS) project, which is expected to begin injection operation in 2015. Because of the proximity to the planned injection activity at CCS#2 and the expected convergence/interaction of the CO2 plume and aggregate pressure from both injection sites, delineation of the area of review (AoR) for CCS#1 incorporates injection activities at CCS#2 (i.e., the two wells will create a single CO2 plume and pressure front). Accordingly, this AoR and Corrective Action Plan includes some information that is relevant to both CCS#1 and CCS#2. Computational Modeling Model Name and Authors/Institution ECLIPSE 300 (v2011.2) reservoir simulator with the CO2STORE module, Schlumberger. Description of Model Model Description ECLIPSE 300 is a compositional finite-difference solver that is commonly used to simulate hydrocarbon production and has various other applications including carbon capture and storage modeling. The CO2STORE module accounts for the thermodynamic interactions between three phases: an H2O-rich phase (i.e., ‘liquid’), a CO2-rich phase (i.e., ‘gas’), and a solid phase, which is limited to several common salt compounds (e.g. NaCl, CaCl2, and CaCO3). Mutual solubilities and physical properties (e.g. density, viscosity, enthalpy, etc.) of the H2O and CO2 phases are calculated to match experimental results through a range of typical storage reservoir conditions, including temperature ranges between 12°C-100°C and pressures up to 60 MPa. Details of this method can be found in Spycher and Pruess (2005). Additional assumptions governing the phase interactions throughout the simulations are as follows: The salt components may exist in both the liquid and solid phases.
Transcript of Attachment B: Area of Review and Corrective Action
Area of Review and Corrective Action Plan for ADM CCS#1
Permit Number: IL-115-6A-0002 Page B1 of 20
ATTACHMENT B: AREA OF REVIEW AND CORRECTIVE ACTION PLAN
Facility Information
Facility name: Archer Daniels Midland, CCS#1 Well
IL-115-6A-0002
Facility contact: Mr. Mark Burau, Plant Manager,
4666 Faries Parkway, Decatur, IL,
(217) 424-5750, [email protected]
Well location: Decatur, Macon County, IL;
39o 52’ 37.06469” N, 88 o 53’ 36.25685” W
The Illinois Basin Decatur Project (IBDP) well CCS#1 is located approximately 0.7 miles
southwest of the CCS#2 well at the Illinois Industrial Carbon Capture and Sequestration (IL-
ICCS) project, which is expected to begin injection operation in 2015. Because of the proximity
to the planned injection activity at CCS#2 and the expected convergence/interaction of the CO2
plume and aggregate pressure from both injection sites, delineation of the area of review (AoR)
for CCS#1 incorporates injection activities at CCS#2 (i.e., the two wells will create a single CO2
plume and pressure front). Accordingly, this AoR and Corrective Action Plan includes some
information that is relevant to both CCS#1 and CCS#2.
Computational Modeling
Model Name and Authors/Institution
ECLIPSE 300 (v2011.2) reservoir simulator with the CO2STORE module, Schlumberger.
Description of Model
Model Description
ECLIPSE 300 is a compositional finite-difference solver that is commonly used to simulate
hydrocarbon production and has various other applications including carbon capture and storage
modeling. The CO2STORE module accounts for the thermodynamic interactions between three
phases: an H2O-rich phase (i.e., ‘liquid’), a CO2-rich phase (i.e., ‘gas’), and a solid phase, which
is limited to several common salt compounds (e.g. NaCl, CaCl2, and CaCO3). Mutual solubilities
and physical properties (e.g. density, viscosity, enthalpy, etc.) of the H2O and CO2 phases are
calculated to match experimental results through a range of typical storage reservoir conditions,
including temperature ranges between 12°C-100°C and pressures up to 60 MPa. Details of this
method can be found in Spycher and Pruess (2005). Additional assumptions governing the phase
interactions throughout the simulations are as follows:
The salt components may exist in both the liquid and solid phases.
Area of Review and Corrective Action Plan for ADM CCS#1
Permit Number: IL-115-6A-0002 Page B2 of 20
The CO2-rich phase (i.e., ‘gas’) density is obtained by using the Redlich-Kwong equation
of state. The model was accurately tuned and modified as further described below
(Redlich and Kwong, 1949).
The brine density is first approximated as pure water then corrected for salt and CO2
concentration by using Ezrokhi’s method (Zaytsev and Aseyev, 1992).
The CO2 gas viscosity is calculated per the methods described by Vesovic et al. (1990)
and Fenghour et al. (1999).
The gas density was obtained using a modified Redlich-Kwong equation of state following a
method developed by Spycher and Pruess, where the attraction parameter is made temperature
dependent:
𝑃 = (𝑅𝑇𝐾
𝑉 − 𝑏𝑚𝑖𝑥) − (
𝑎𝑚𝑖𝑥
𝑇𝐾 ½𝑉(𝑉 + 𝑏𝑚𝑖𝑥)
)
where V is the molar volume, P is the pressure, TK is the temperature in Kelvin, R is the universal
gas constant, and amix and bmix are the attraction and repulsion parameters.
The transition between liquid CO2 and gaseous CO2 can lead to rapid density changes of the gas
phase; the simulator uses a narrow transition interval between the liquid and gaseous density to
represent the two phase CO2 region.
Because the compression facility controls the CO2 delivery temperature to the injection wells
between 80°F and 120°F, the temperature of the injectate will be comparable to the reservoir
formation temperature within the injection interval. Therefore, the simulations were carried out
based on isothermal operating conditions. With respect to time step selection, the software
algorithm optimizes the time step duration based on specific convergence criteria designed to
minimize numerical artifacts. For these simulations, time step size ranged from 8.64x101 to
8.64x10⁵ seconds or 0.001 to 10 days. In all cases, the maximum solution change over a time
step is monitored and compared with the specified target. Convergence is achieved once the
model reaches the maximum tolerance “sufficiently small change” for temperature and pressure
calculation results on successive iterations. New time steps are chosen so that the predicted
solution change is less than a specified target.
Description of AoR Delineation Modeling Effort
The 3D geologic model developed for the injection simulations is based on the interpretation of a
diverse collection of geological, geophysical, and petrophysical data acquired throughout the
construction of the IBDP wells (CCS#1 and Verification Well #1 (VW#1)). Structurally, the
model is also based on the interpretation of both two dimensional (2D) and three dimensional
(3D) seismic survey data in conjunction with dipmeter log data acquired from the IBDP wells.
Petrophysical and transport properties based on the interpreted well log data and the analysis of
core samples recovered from the IBDP wells were then distributed throughout each layer in the
geocellular model.

Area of Review and Corrective Action Plan for ADM CCS#1
Permit Number: IL-115-6A-0002 Page B3 of 20
The model implements porosity and permeability well logs from CCS#1, VW#1, and
Verification Well #2 (VW#2). Seismic inversion was performed on the 3D surface seismic cube
resulting in a seismic porosity cube. This seismic porosity cube was integrated with logs to guide
interpolation of porosity throughout the 3D model. For the Mt. Simon, the PorosityCube was
sampled into the geomodel’s 3D grid and was also used to describe lateral heterogeneity beyond
the seismic survey’s footprint. A workflow was prepared to document log upscaling and property
modeling.
In November 2011, injection of CO2 into CCS#1 began and, as of January 2014, approximately
730,000 metric tons of CO2 have been injected. Operational data from this project was used to
calibrate the reservoir model being used for both the IBDP and IL-ICCS projects. Data obtained
includes injection well bottom hole pressure (BHP), multi-zone pressure data from VW#1,
Spinner data, i.e. injection profile logs in CCS#1, and reservoir saturation tools (RST) from both
IBDP wells. These datasets have provided additional information to allow calibration of various
reservoir parameters including intrinsic permeabilities, relative permeabilities, wellbore skin
values, vertical to horizontal permeability ratios, and rock compressibility. These calibrations
allow the model to be updated periodically to improve the accuracy between the model
prediction versus the actual result.
Monitoring data used for pressure matching includes:
Injection rate;
Injection bottom hole pressure – real-time data collected from a down hole gauge in the
injection well about 600 ft above the perforations;
Westbay multilevel ground water characterization and monitoring system pressures –
real-time pressures located at specific zones in the Verification Well #1 1000 ft. north of
the injection well. Five out of ten zones were used for model calibration;
Spinner data-flow partitioning between perforations – log run in injection well through
March 2013; and
RST well logs – CO2 saturations around CCS#1 and VW#1 – logs run through March
2013.
More detailed information on model inputs and assumptions is given in the following
subsections.
Model Inputs and Assumptions
The geologic/hydrogeologic and operational information that serve as inputs to the model are
described in the following subsections.
Site Geology and Hydrology
The Class VI well targets an injection zone in the Cambrian Mt. Simon Sandstone of the Illinois
Basin (see coordinates above under “Facility Information”). Information on the injection and

Area of Review and Corrective Action Plan for ADM CCS#1
Permit Number: IL-115-6A-0002 Page B4 of 20
confining zones was collected during drilling and testing conducted pursuant to the CCS#1
Underground Injection Control (UIC) Class I (non-hazardous) permit IEPA UIC-012-ADM, as
well as from existing Illinois State Geological Survey (ISGS) studies and reports. Data from an
ISGS database of core sample data and additional core sample analyses from sites within
approximately 30–80 miles of the injection well were also used.
The Mt. Simon Sandstone is the first sedimentary unit overlying the Precambrian granitic
basement rock. The depositional environment of the Mt. Simon has “commonly been interpreted
to be a shallow, sub-tidal marine environment,” based on surface study of the upper Mt. Simon
or studies of Wisconsin or Ozark Dome outcrops. However, based on core sample and log
analysis from the CCS#1 well, the upper Mt. Simon is interpreted to have been deposited “in a
tidally influenced system similar to the reservoirs used for natural gas storage in northern
Illinois,” while the basal 600 ft (the target injection zone) represents an “arkosic sandstone that
was originally deposited in a braided river-alluvial fan system.” In this lower zone, “abundant
amounts” of secondary porosity occur due to the dissolution of feldspar grains.
Directly overlying the Mt. Simon Sandstone is the Cambrian Eau Claire Formation. Based on
data from CCS#1, in the area of the injection well, the Eau Claire consists of a basal shale layer
overlain by very fine-grained limestone interbedded with thin siltstone layers. The Eau Claire
serves as a confining zone for gas storage projects elsewhere in the Illinois Basin. Two other
regional shale units are identified as secondary confining zones—the Ordovician Maquoketa
Formation and the Devonian New Albany Shale—though these units lie above the lowermost
USDW. No resolvable faults or folds were identified in the injection or confining zones based on
3D seismic data collected in 2011.
Only limited data and modeling results are available on ground water flow in the deep Illinois
Basin, which is based on modeling results from Gupta and Bair (1997). Flow patterns in the Mt.
Simon are “influenced by the geologic structure with flow away from arches such as the
Kankakee Arch and toward the deeper parts of the Illinois Basin” (see Figure 1). In the model, an
initial fluid pressure of 3,205 psi (at elevation -6,345 ft MSL), an initial temperature of 112ºF (at
elevation -5,365 ft MSL; gradient 1ºF/ft), and an initial salinity of 200,000 ppm were used. MSL
is defined as mean sea level.
The lowermost USDW is the Ordovician St. Peter Sandstone, based on total dissolved solids
(TDS) sampling of the upper St. Peter during the drilling of CCS#1.

Area of Review and Corrective Action Plan for ADM CCS#1
Permit Number: IL-115-6A-0002 Page B5 of 20
Figure 1. Observed head in the Mt. Simon Sandstone. The red dot represents the location of CCS#1
(potentiometric surface = 76 m/249 ft above mean sea level).
Model Domain
The static geological model includes the entire Mt. Simon and the overlying seal (the Eau
Claire), spanning a 40 × 40 mile area. The final reservoir model was represented by a 146 × 146
× 148 grid in a Cartesian system with 146 grid points in the x-direction, 146 grid points in the y-
direction, and 148 grid points in the z-direction, for a total of 3,154,768 grid points. Model
domain information is summarized in Table 1.
Table 1. Model domain information.
Coordinate System State Plane
Horizontal Datum NAD27
Coordinate System Units Ft
Zone Eastern
FIPSZONE 1,201 ADSZONE 3,776
Coordinate of xmin 277,028.18 Coordinate of xmax 408,692.78
Coordinate of ymin 1,103,729.25 Coordinate of ymax 1,235,364.89
Coordinate of zmin -6431.19 Coordinate of zmax -4290.78
Area of Review and Corrective Action Plan for ADM CCS#1
Permit Number: IL-115-6A-0002 Page B6 of 20
Porosity
Injection Zone Porosity
The total porosity of the injection zone was determined based on neutron and density logs of
CCS#1, while effective porosity was determined from helium porosimetry on a “limited number”
of core samples. The results of these methods compared well to each other, and so neutron-
density crossplot porosity was used to approximate effective porosity. For the injection interval
of CCS#1 (-6,982 to -7,050 ft KB), the average effective porosity was found to be 21.0%. Within
the AoR, KB is defined as Kelly Bushing which is approximately 682 ft above MSL.
Additionally, the open-hole log based porosity was classified using Schlumberger Elemental Log
Analysis (ELAN) as described in the CCS#1 Geophysical Log Descriptive Report. In the log
analysis, the log analyst stated that the lower zone of the Mt. Simon has an average porosity of
16.8%, though there are intervals where the porosity approaches 30%.
Based on the analysis of log results from CCS#1, ADM identified three porosity/permeability
zones within the Mt. Simon. These zones, with the average porosity and permeability values
indicated by ADM, are illustrated in Figure 2.
The lower zone of the Mt. Simon, extending from the base of the formation at -6,367 MSL
(-7,049 ft KB) to -5,738 ft MSL (-6,420 ft KB), is described as containing “the highest average
porosity and quite good permeability.” The middle zone, extending from -5,738 ft MSL (-6,420
ft KB) to -5,268 ft MSL (-5,950 ft KB), and the upper zone, extending from -5,268 ft MSL
(-5,950 ft KB) to the top of the Mt. Simon at -4,862 ft MSL (-5,544 ft KB), have lower porosities
and permeabilities.
Confining Zone Porosity
The median porosity of the Eau Claire Formation is 4.7%, based on information from an ISGS
database of UIC well core samples.
Permeability
Injection Zone Permeability
ADM determined intrinsic permeability for areas of the injection zone based on available core
analyses and CCS#1 well testing results, and developed a core porosity-permeability transform
based on grain size to estimate permeability over intervals without core samples. From this
method, ADM calculated a geometrical average intrinsic permeability of 194 mD for the CCS#1
injection interval.
ADM also reported additional permeability values based on pressure transient analysis of data
from CCS#1 pressure fall-off tests. Using PIE pressure transient software, ADM estimated
permeability of 185 mD over 75 ft of vertical thickness in the injection zone. ADM also directly
calculated permeability for this interval from core samples and well log analyses, with a result of
182 mD. The CCS#1 well log reports an average permeability in the injection zone of 33 mD,

Area of Review and Corrective Action Plan for ADM CCS#1
Permit Number: IL-115-6A-0002 Page B7 of 20
though permeability in the perforated interval ranges from 60 mD to “several hundred” mD
(Figure 2).
Figure 2. Reproduced layers of the geologic model and average porosity/permeability values, as identified by
ADM based on log analysis, along with the approximate perforated intervals of CCS#1 and CCS#2. Depths
are shown with respect to mean sea level-MSL (and are equal to the Z-coordinates used in the model); they
do not represent distances with respect to the kelly bushing. Horizontal distances are not to scale.
Area of Review and Corrective Action Plan for ADM CCS#1
Permit Number: IL-115-6A-0002 Page B8 of 20
Confining Zone Permeability
While no core samples were taken from the shale zone of the Eau Claire at CCS#1, 12 plugs of
upper interval Eau Claire (very fine sandstone, microcrystalline limestone, and siltstone) were
available for testing. Average horizontal permeability for these sidewall rotary core samples was
determined to be 0.000344 mD. However, the vertical permeability of the actual shale interval is
expected to be much lower because vertical permeability of plugs “is generally lower than
horizontal permeability and shale permeability is generally much lower than sandstone,
limestone, and siltstone.” Based on the analysis of log results from CCS#1, the Eau Claire,
extending from the top of the Mt. Simon to -4,545 ft MSL (-5,227 ft KB), is described as having
“only a few small intervals of less than a few feet that have any permeability greater than 0.1
mD,” which do not appear to be continuous.
ADM also cited a median permeability value of 0.000026 mD from the ISGS UIC core database.
In addition, based on a set of core samples from a site approximately 80 miles to the north of the
proposed Class VI location, of the 110 analyses conducted, most were in the range of < 0.001 to
0.001 mD, with five in the range of 0.100 to 0.871 mD (the maximum value in the data set). This
indicates that even the more permeable beds in the Eau Claire Formation are expected to be
relatively tight and tend to act as sealing lithologies.
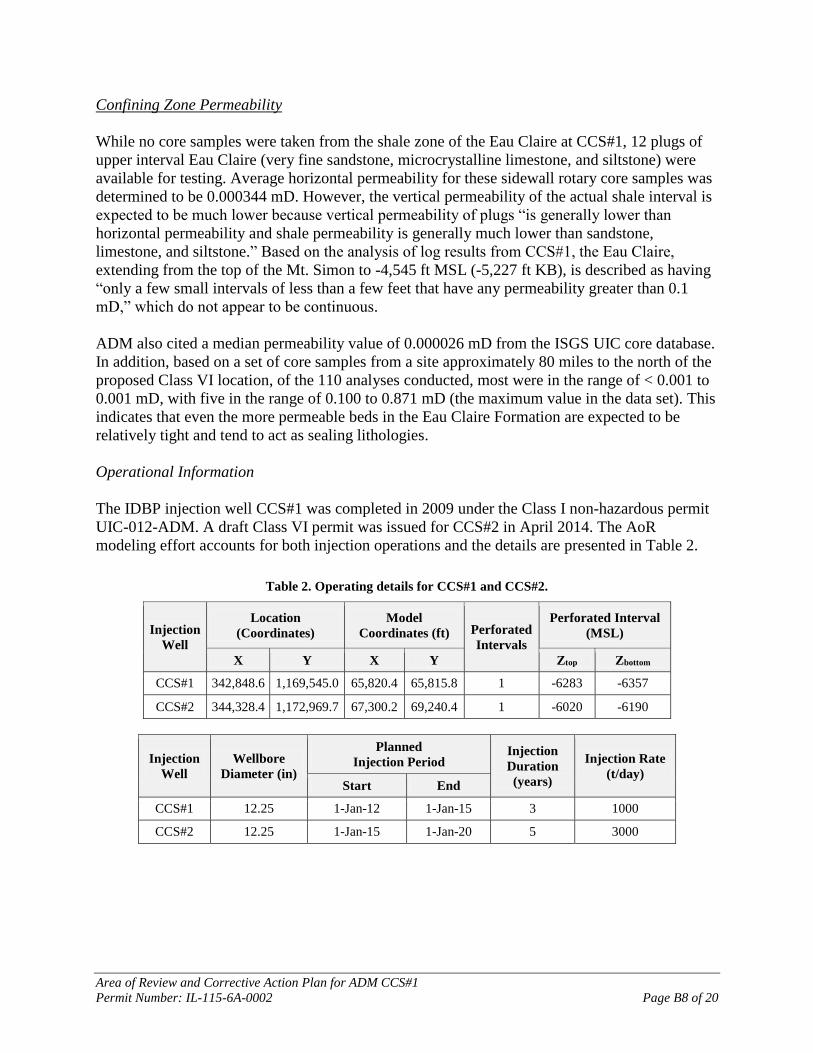
Operational Information
The IDBP injection well CCS#1 was completed in 2009 under the Class I non-hazardous permit
UIC-012-ADM. A draft Class VI permit was issued for CCS#2 in April 2014. The AoR
modeling effort accounts for both injection operations and the details are presented in Table 2.
Table 2. Operating details for CCS#1 and CCS#2.
Injection
Well
Location
(Coordinates)
Model
Coordinates (ft) Perforated
Intervals
Perforated Interval
(MSL)
X Y X Y Ztop Zbottom
CCS#1 342,848.6 1,169,545.0 65,820.4 65,815.8 1 -6283 -6357
CCS#2 344,328.4 1,172,969.7 67,300.2 69,240.4 1 -6020 -6190
Injection
Well
Wellbore
Diameter (in)
Planned
Injection Period Injection
Duration
(years)
Injection Rate
(t/day) Start End
CCS#1 12.25 1-Jan-12 1-Jan-15 3 1000
CCS#2 12.25 1-Jan-15 1-Jan-20 5 3000
Area of Review and Corrective Action Plan for ADM CCS#1
Permit Number: IL-115-6A-0002 Page B9 of 20
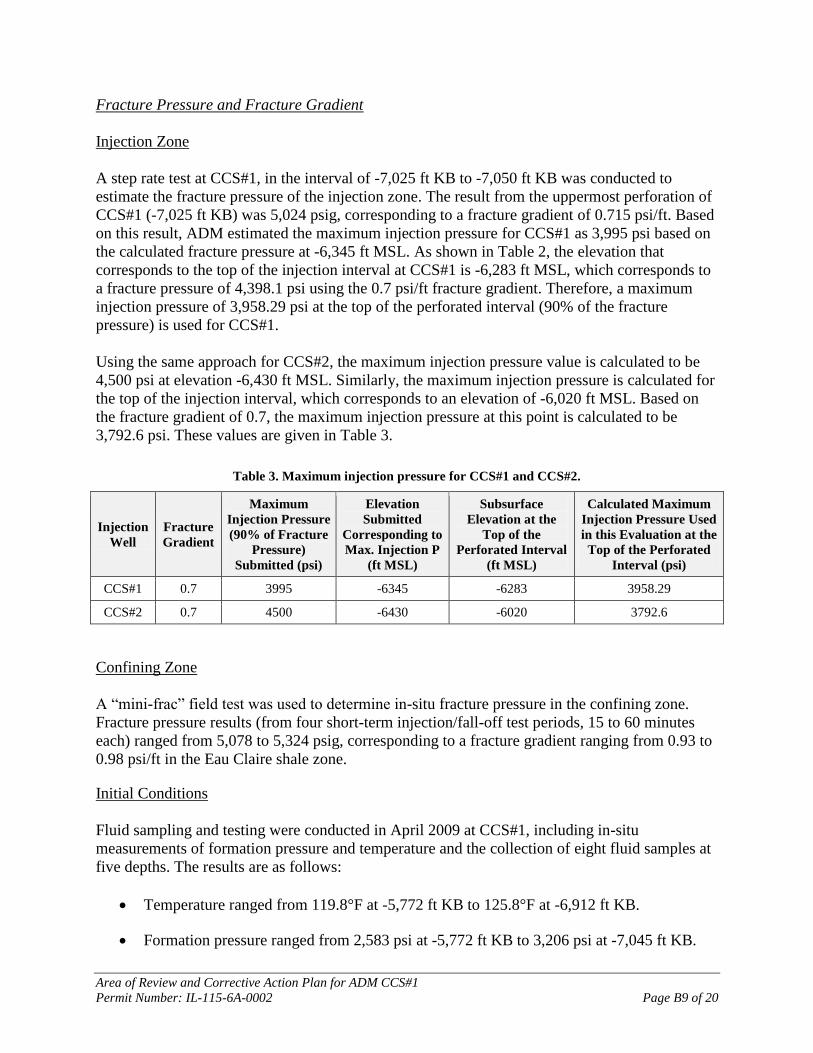
Fracture Pressure and Fracture Gradient
Injection Zone
A step rate test at CCS#1, in the interval of -7,025 ft KB to -7,050 ft KB was conducted to
estimate the fracture pressure of the injection zone. The result from the uppermost perforation of
CCS#1 (-7,025 ft KB) was 5,024 psig, corresponding to a fracture gradient of 0.715 psi/ft. Based
on this result, ADM estimated the maximum injection pressure for CCS#1 as 3,995 psi based on
the calculated fracture pressure at -6,345 ft MSL. As shown in Table 2, the elevation that
corresponds to the top of the injection interval at CCS#1 is -6,283 ft MSL, which corresponds to
a fracture pressure of 4,398.1 psi using the 0.7 psi/ft fracture gradient. Therefore, a maximum
injection pressure of 3,958.29 psi at the top of the perforated interval (90% of the fracture
pressure) is used for CCS#1.
Using the same approach for CCS#2, the maximum injection pressure value is calculated to be
4,500 psi at elevation -6,430 ft MSL. Similarly, the maximum injection pressure is calculated for
the top of the injection interval, which corresponds to an elevation of -6,020 ft MSL. Based on
the fracture gradient of 0.7, the maximum injection pressure at this point is calculated to be
3,792.6 psi. These values are given in Table 3.
Table 3. Maximum injection pressure for CCS#1 and CCS#2.
Injection
Well
Fracture
Gradient
Maximum
Injection Pressure
(90% of Fracture
Pressure)
Submitted (psi)
Elevation
Submitted
Corresponding to
Max. Injection P
(ft MSL)
Subsurface
Elevation at the
Top of the
Perforated Interval
(ft MSL)
Calculated Maximum
Injection Pressure Used
in this Evaluation at the
Top of the Perforated
Interval (psi)
CCS#1 0.7 3995 -6345 -6283 3958.29
CCS#2 0.7 4500 -6430 -6020 3792.6
Confining Zone
A “mini-frac” field test was used to determine in-situ fracture pressure in the confining zone.
Fracture pressure results (from four short-term injection/fall-off test periods, 15 to 60 minutes
each) ranged from 5,078 to 5,324 psig, corresponding to a fracture gradient ranging from 0.93 to
0.98 psi/ft in the Eau Claire shale zone.
Initial Conditions
Fluid sampling and testing were conducted in April 2009 at CCS#1, including in-situ
measurements of formation pressure and temperature and the collection of eight fluid samples at
five depths. The results are as follows:
Temperature ranged from 119.8°F at -5,772 ft KB to 125.8°F at -6,912 ft KB.
Formation pressure ranged from 2,583 psi at -5,772 ft KB to 3,206 psi at -7,045 ft KB.
Area of Review and Corrective Action Plan for ADM CCS#1
Permit Number: IL-115-6A-0002 Page B10 of 20
Fluid density ranged from 1,090 g/L to 1,137 g/L, with an average of 1,119 g/L (of the
five samples taken).
TDS ranged from 164,500 ppm at -5,772 ft KB to 228,100 ppm at -7,045 ft KB, with an
average of 196,700 ppm.
For the initial conditions in the model, aqueous pressure was determined to be 3,205 psi at a
reference elevation of -6,345 ft MSL. The initial temperature is 112°F at a reference elevation of
-5,365 ft MSL, with a gradient of 1°F/100 ft. Salinity is spatially constant, at 200,000 ppm.
Boundary Conditions
No-flow boundary conditions were applied to the upper and lower boundaries of the model, with
the assumption that the reservoir and the caprock are continuous throughout the region. A pore
volume multiplier of 10,000 was applied to each cell in the horizontal boundaries of the
ECLIPSE model in order to simulate an extensive reservoir. The horizontal boundaries were
selected as: hydrostatic initial conditions for the aqueous phase, no-flow conditions for the gas
phase, and initial conditions for salt.
AoR Pressure Front Delineation
To delineate the pressure front, the minimum or critical pressure (Pi,f) necessary to reverse flow
direction between the lowermost USDW and the injection zone—and thus cause fluid flow from
the injection zone into the formation matrix—must be calculated. ADM calculated Pi,f using the
method provided in the March 2011 draft of the UIC Program Class VI Well Area of Review and
Corrective Action Evaluation Guidance, where the pressure front is given by:
𝑃𝑖,𝑓 = 𝑃𝑢 ·𝜌𝑖
𝜌𝑢+ 𝜌𝑖𝑔 · (𝑧𝑢 − 𝑧𝑖)
Where:
Pu = initial pressure of the lowermost USDW,
ρi = fluid density of the injection zone,
ρu = fluid density of the lowermost USDW,
g = acceleration due to gravity,
zu = elevation of the lowermost USDW, and
zi = elevation of the injection zone.
Using this method, ADM calculated a Pi,f value equal to 171 psi (1.18 MPa).
As an alternative approach for estimating a critical pressure in the injection zone, in December
2013, ADM applied a method developed and published by Nicot et al. (2008):
Δ𝑃
𝑔=
𝜉
2(𝑧𝑢 − 𝑧𝑖)
2

Area of Review and Corrective Action Plan for ADM CCS#1
Permit Number: IL-115-6A-0002 Page B11 of 20
This method estimates a pressure differential that would displace fluid initially present in a
hypothetical borehole into the lowermost USDW and is based on two assumptions: (1)
hydrostatic conditions; and (2) initially linearly varying densities in the borehole and constant
density once the injection zone fluid is lifted to the top of the borehole.
ADM used the Nicot method to calculate the pressure differential based on an injection depth of
-6,800 ft KB and a lowermost USDW depth of approximately -3,300 ft KB. The results yield an
estimate of approximately 85.9 psi (0.59 MPa).
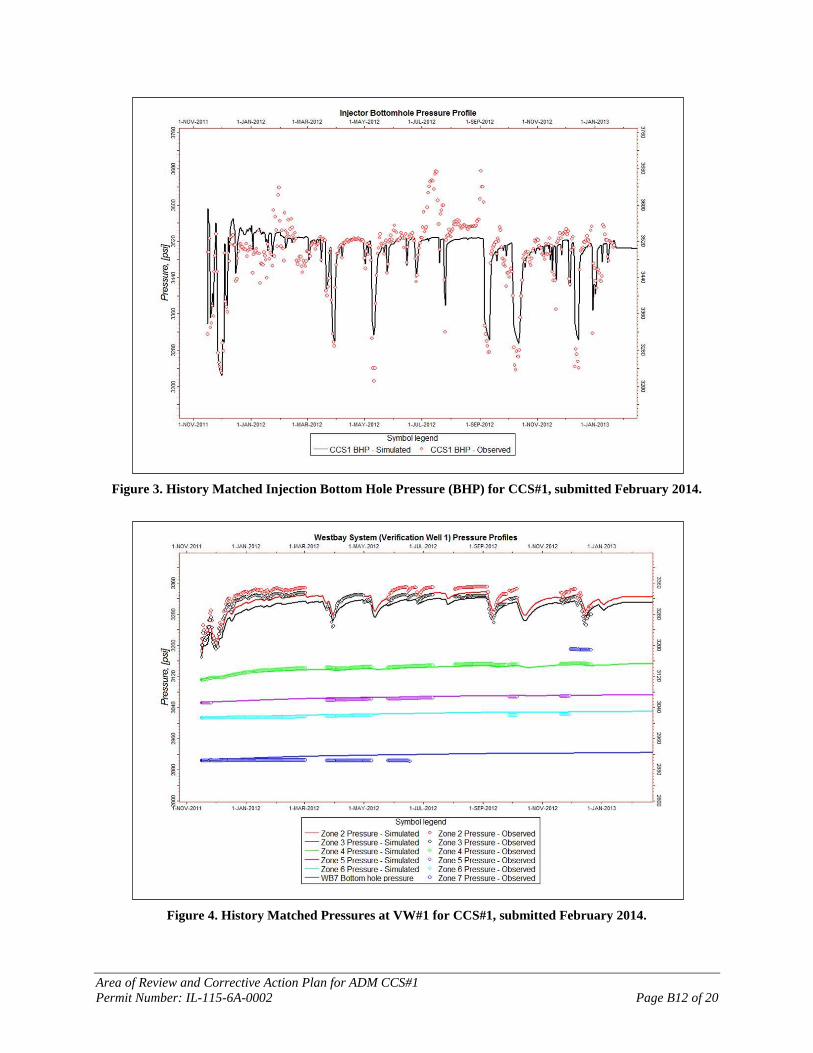
Model Calibration
The site model has been calibrated using operational data obtained from the IBDP operation
through January 2013. The IBDP injection rate was input into the simulation to calculate the
bottom hole pressures and pressures at five different zones at the verification well, and the
simulated pressures were compared to the observed pressures. Reservoir permeability and skin
were the main parameters impacting the injection pressure calibration and were used as fitting
parameters. Actual spinner data was used to set the fractions of the total injection between the
two sets of perforations in the injection well. These data along with the simulation allowed for
fine tuning of the well bore skin values at respective perforations together with the permeability
to match injection bottom hole pressure (Figure 3).
Once the injection bottom hole pressure was calibrated, simulated pressures at five different
zones at the verification well were fine-tuned calibrating the kv/kh ratio of the tight sections and
compressibility of the reservoir rock (Figure 4).
RST well logs helped estimate the location, saturation, and thickness of the CO2 column around
the injection and verification wells. This information helped fine tune the end points of relative
permeability curves which dominate the CO2 and brine flow in the reservoir. Figure 5 and Figure
6 show the relative permeability curves for the two reservoir rock types used to characterize the
lower and middle Mt. Simon storage units. These figures show the relative permeability with
respect to brine saturation (Sw), for the CO2-brine system during drainage and imbibition, where:
brine drainage represents the relative permeability of brine during drainage, brine imbibition
represents the relative permeability of brine during imbibition, CO2 drainage represents the
relative permeability of CO2 during drainage, and CO2 imbibition represents the relative
permeability of CO2 during imbibition. Please note that drainage is defined as CO2 replacing
brine in the pores and imbibition is defined as brine replacing CO2 in the pores. Using the
calibrated model, a predictive simulation was run to evaluate plume development and pressure
perturbation during the course of injection.
Area of Review and Corrective Action Plan for ADM CCS#1
Permit Number: IL-115-6A-0002 Page B12 of 20
Figure 3. History Matched Injection Bottom Hole Pressure (BHP) for CCS#1, submitted February 2014.
Figure 4. History Matched Pressures at VW#1 for CCS#1, submitted February 2014.

Area of Review and Corrective Action Plan for ADM CCS#1
Permit Number: IL-115-6A-0002 Page B13 of 20
Figure 5. Calibrated Relative Permeability Curves – Type 1 LL Mt. Simon, submitted February 2014.
Figure 6. Calibrated Relative Permeability Curves - Type 3 UL Mt. Simon, submitted February 2014.
Area of Review and Corrective Action Plan for ADM CCS#1
Permit Number: IL-115-6A-0002 Page B14 of 20
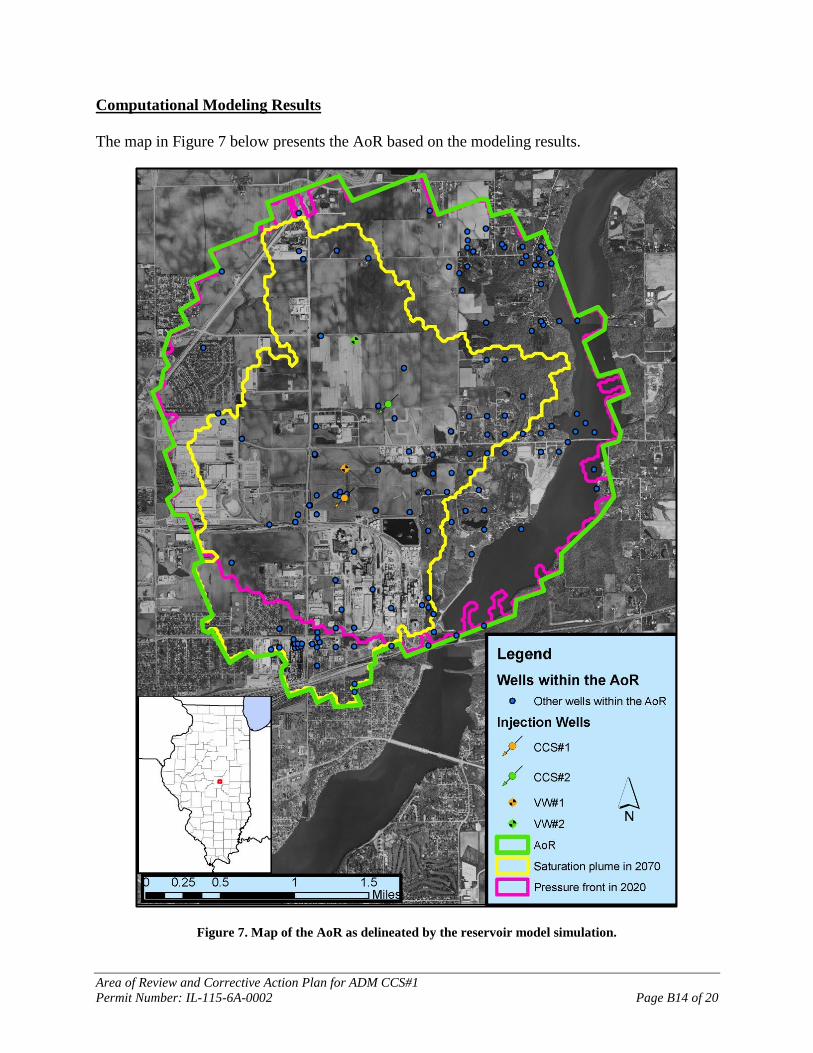
Computational Modeling Results
The map in Figure 7 below presents the AoR based on the modeling results.
Figure 7. Map of the AoR as delineated by the reservoir model simulation.

Area of Review and Corrective Action Plan for ADM CCS#1
Permit Number: IL-115-6A-0002 Page B15 of 20
Corrective Action Plan and Schedule
An estimated 215 wells are located within the vicinity of the AoR; they were evaluated and data
on the wells was submitted to EPA by ADM in February 2014 as part of the CCS#2 permit
application.
Tabulation of Wells within the AoR
Wells within the AoR
The only existing wells within the AoR which currently penetrate the caprock (Eau Claire
Formation) are the IBDP injection well (CCS#1), the IBDP verification well (VW#1), and the
IL-ICCS verification well (VW#2). As stated above, CCS#1 was drilled in 2009. VW #1 was
drilled in 2010, and VW#2 was drilled in 2011. The IBDP wells are currently in operation. The
IL-ICCS verification well has been cased but not completed. Well construction records have
been provided to EPA. The Illinois Environmental Protection Agency (IEPA) is currently the
regulatory agency monitoring the IBDP well operations under the Class I permit UIC-012-ADM.
The IL-ICCS well VW#2 is permitted by the Illinois Department of Natural Resources (IDNR)
as a monitor test well (No. 3205). The proposed IL-ICCS injection well CCS#2 was issued a
final Class VI permit by EPA on September 23, 2014 (No. IL-115-6A-0001) that allows ADM to
commence construction.
The latest estimate shows that a total of 215 wells are located within the vicinity of the proposed
well. Water wells (157 of 215 wells) are the most common well type. The domestic water wells
have depths of less than 60 m (200 ft). Other wells include stratigraphic test holes, non-domestic
water wells, and oil and gas wells. All wells within the four townships-area of the injection well
site were also identified (total of 3,761 wells). Information regarding these wells was provided as
a supplement to the permit application (available in an electronic format).
Ten oil and gas wells are located within approximately 2.4 km (1.5 miles) of the injection well
location. The closest well is located in the northeast quarter of Section 5, T16N, R3E. This well
(API number 121150061800) was drilled as a gas well in 1933 and was -27 m (-88 ft KB) deep.
There is no record of this well being plugged. This well was likely collecting naturally occurring
methane from the Quaternary sediments. The other nine wells are located in Section 5, T16N,
R3E or Section 28 and Section 29, T17N, R3E. The deepest of these oil wells is API number
121150054700, located in the northwest quarter of Section 28. This well was drilled into the
Lower Devonian and was -714 m KB (-2,344 ft KB) deep.
Like other areas with humid climates (Freeze and Cherry, 1979), the water table in central
Illinois is expected to reflect the elevation of the land surface. Steady-state ground water flow
modeling for the IBDP site indicates that shallow ground water flows toward the east and
southeast toward the Sangamon River and Lake Decatur.
Wells Penetrating the Confining Zone
With the exception of the injection and verification wells previously detailed, there are no known
wells within the area of review that penetrate deeper than -762 m KB (-2,500 ft KB). The depth
Area of Review and Corrective Action Plan for ADM CCS#1
Permit Number: IL-115-6A-0002 Page B16 of 20
to the top of the injection zone (Mt. Simon Sandstone) is -1,690 m KB (-5,545 ft KB). Therefore,
there are only three known wells that penetrate the uppermost injection zone:
Operating Wells: Three wells penetrating the uppermost injection zone are known to be
in use within the AoR. The IBDP wells (CCS#1 and VW#1) began operation in
November 2011. The IL-ICCS verification well (VW#2) has been drilled and cased but
not completed. The location of the proposed IL-ICCS injection well CCS#2, which is
expected to begin operation in 2015/2016, is also within the AoR.
Properly Plugged and Abandoned wells: No wells deeper than -762 m KB (-2,500 ft KB)
are known to have been plugged and abandoned within the AoR.
Temporarily Abandoned Wells: No wells deeper than -762 m KB (-2,500 ft KB) are
known to have been temporarily abandoned within the AoR.
No plugging affidavits are provided, as the IBDP wells are currently in use.
If any of these wells are taken out of service, ADM will provide information to EPA to confirm
that they have been properly plugged to ensure USDW protection pursuant to requirements at 40
CFR Part 146.
Wells Requiring Corrective Action
Based on information about the wells in existence at the time of permit issuance, no corrective
action is required at this time.
Plan for Site Access
Not applicable.
Justification of Phased Corrective Action
Not applicable.
Area of Review Reevaluation Plan and Schedule
ADM will take the following steps to evaluate project data and, if necessary, reevaluate the AoR.
AoR reevaluations will be performed during the post-injection phase. ADM will:
Review available monitoring data and compare it to the model predictions. ADM will
analyze monitoring data from CCS#1, which will be used as a monitoring well during the
post-injection phase as described in the Post-Injection Site Care (PISC) and Site Closure
Plan (see Attachment E to this permit); monitoring and operational data from the CCS#2
injection well; monitoring data from the verification and geophysical wells; other
surrounding wells; and other sources to assess whether the predicted CO2 plume
migration is consistent with actual data. Specific steps of this review include:
Area of Review and Corrective Action Plan for ADM CCS#1
Permit Number: IL-115-6A-0002 Page B17 of 20
o Reviewing available data on the position of the CO2 plume and pressure front
(including pressure and temperature monitoring data and RST saturation and
seismic survey data). Specific activities will include:
Correlating data from time-lapse RST logs, time-lapse VSP surveys, and
other seismic methods (e.g., 3D surveys) to locate and track the movement
of the CO2 plume. A good correlation between the data sets will provide
strong evidence in validating the model’s ability to represent the storage
system. Also, limited 2D and 3D seismic surveys will be employed to
determine the plume location at specific times.
Reviewing downhole reservoir pressure data collected from various
locations and intervals using a combination of surface and downhole
pressure gauges.
o Reviewing ground water chemistry monitoring data taken in the shallow (i.e., in
Quaternary and/or Pennsylvanian strata) monitoring wells, the St. Peter, and the
Ironton-Galesville to verifying that there is no evidence of excursion of carbon
dioxide or brines that represent an endangerment to any USDWs.
o Reviewing operating data, e.g., on injection rates and pressures at CCS#2 during
that well’s injection phase, and verifying that it is consistent with the inputs used
in the most recent modeling effort.
o Reviewing any geologic data acquired since the last modeling effort, e.g.,
additional site characterization performed, updates of petrophysical properties
from core analysis, etc. Identifying whether any new data materially differ from
modeling inputs/assumptions.
Compare the results of computational modeling used for AoR delineation to monitoring
data collected. Monitoring data will be used to show that the computational model
accurately represents the storage site and can be used as a proxy to determine the
plume’s properties and size. ADM will demonstrate this degree of accuracy by
comparing monitoring data against the model’s predicted properties (i.e., plume
location, rate of movement, and pressure decay). Statistical methods will be employed
to correlate the data and confirm the model’s ability to accurately represent the storage
site.
If the information reviewed is consistent with, or is unchanged from, the most recent
modeling assumptions or confirms modeled predictions about the maximum extent of
plume and pressure front movement, ADM will prepare a report demonstrating that,
based on the monitoring and operating data, no reevaluation of the AoR is needed. The
report will include the data and results demonstrating that no changes are necessary.
If material changes have occurred (e.g., in the behavior of the plume and pressure front,
operations, or site conditions) such that the actual plume or pressure front may extend
Area of Review and Corrective Action Plan for ADM CCS#1
Permit Number: IL-115-6A-0002 Page B18 of 20
beyond the modeled plume and pressure front, ADM will re-delineate the AoR. The
following steps will be taken:
o Revising the site conceptual model based on new site characterization,
operational, or monitoring data.
o Calibrating the model in order to minimize the differences between monitoring
data and model simulations.
o Performing the AoR delineation as described the Computational Modeling section
of this AoR and Corrective Action Plan.
Review wells in any newly identified areas of the AoR and apply corrective action to
deficient wells. Specific steps include:
o Identifying any new wells within the AoR that penetrate the confining zone and
provide a description of each well’s type, construction, date drilled, location,
depth, record of plugging and/or completion.
o Determining which abandoned wells in the newly delineated AoR have been
plugged in a manner that prevents the movement of carbon dioxide or other fluids
that may endanger USDWs.
o Performing corrective action on all deficient wells in the AoR using methods
designed to prevent the movement of fluid into or between USDWs, including the
use of materials compatible with carbon dioxide.
Prepare a report documenting the AoR reevaluation process, data evaluated, any
corrective actions determined to be necessary, and the status of corrective action or a
schedule for any corrective actions to be performed. The report will be submitted to EPA
within one year of the reevaluation. The report will include maps that highlight
similarities and differences in comparison with previous AoR delineations.
Update the AoR and Corrective Action Plan to reflect the revised AoR, along with other
related project plans, as needed.
AoR Reevaluation Cycle
ADM will reevaluate the above described AoR every five years. In addition, monitoring and
operational data (e.g., of CCS#2 data) will be reviewed periodically (likely annually) by ADM
during the post-injection phase. The reservoir flow model will be history matched against the
observed parameters measured at the monitoring wells. Pressure will be monitored as described
in the PISC and Site Closure Plan (see Attachment E to this permit). The time lapse pressure
monitoring data will be compared to the model predicted time lapse pressure profiles. ADM will
provide a brief report of this review to the UIC Program Director and discuss the findings.
If data suggest that a significant change in the size or shape of the actual CO2 plume as compared
to the predicted CO2 plume and/or pressure front is occurring or there are deviations from

Area of Review and Corrective Action Plan for ADM CCS#1
Permit Number: IL-115-6A-0002 Page B19 of 20
modeled predictions such that the actual plume or pressure front may extend vertically or
horizontally beyond the modeled plume and pressure front, ADM will initiate an AoR
reevaluation prior to the next scheduled reevaluation. Such deviations may be evidenced by the
results of direct or indirect monitoring activities including mechanical integrity test (MIT)
failures or a loss of mechanical integrity (MI); observed pressure and saturation profiles; changes
in the physical or chemical characteristics of the CO2; any detection of CO2 above the confining
zone (e.g., based on hydrochemical/physical parameters); microseismic data indicating slippage
in or near the confining zone or microseismic data within the injection zone that indicates
slippage and propagation into the confining zone; or arrival of the CO2 plume and/or pressure
front at certain monitoring locations that diverges from expectations, as described below.
Triggers for AoR Reevaluations Prior to the Next Scheduled Reevaluation
Unscheduled reevaluation of the AoR will be based on quantitative changes of the monitoring
parameters in CCS#1 and the deep monitoring wells, including unexpected changes in the
following parameters: pressure, temperature, neutron saturation, and the deep ground water (>
3,000 ft below KB) constituent concentrations indicating that the actual plume or pressure front
may extend beyond the modeled plume and pressure front. These changes include:
Pressure: Changes in pressure that are unexpected and outside three (3) standard
deviations from the average will trigger a new evaluation of the AoR.
Temperature: Changes in temperature that are unexpected and outside three (3) standard
deviations from the average will trigger a new evaluation of the AoR.
RST Saturation: Increases in CO2 saturation that indicate the movement of CO2 into or
above the confining zone will trigger a new evaluation of the AoR unless the changes are
found to be related to the well integrity. (Any well integrity issues will be investigated
and addressed.)
Deep ground water constituent concentrations: Unexpected changes in fluid constituent
concentrations that indicate movement of CO2 or brines into or above the confining zone
will trigger a new evaluation of the AoR unless the changes are found to be related to the
well integrity. (Any well integrity issues will be investigated and addressed.)
Exceeding Fracture Pressure Conditions: Pressure in any of the project wells exceeding
90 percent of the geologic formation fracture pressure at the point of measurement. The
PISC and Site Closure Plan (see Attachment E to this permit) provides discussion of
pressure monitoring.
Exceeding Established Baseline Hydrochemical/Physical Parameter Patterns: A
statistically significant difference between observed and baseline hydrochemical/physical
parameter patterns (e.g., fluid conductivity, pressure, temperature) immediately above the
confining zone. The PISC and Site Closure Plan provides extended information regarding
how pressure, temperature, and fluid conductivity will be monitored.
Compromise in Injection and Monitoring Well Mechanical Integrity: A failure of an
MIT in CCS#1 or a monitoring well that indicates a loss of mechanical integrity at the
well or wells.
Area of Review and Corrective Action Plan for ADM CCS#1
Permit Number: IL-115-6A-0002 Page B20 of 20
Seismic Monitoring Identification of Subsurface Structural Features: Seismic
monitoring data that indicates the presence of a fault or fracture in or near the confining
zone or a fault or fracture within the injection zone that indicates propagation into the
confining zone. The PISC and Site Closure Plan provides information about the
microseismic monitoring network.
An unscheduled AoR reevaluation may also be needed if it is likely that the actual plume or
pressure front may extend beyond the modeled plume and pressure front because any of the
following has occurred:
Seismic event greater than M3.5 within 8 miles of the injection well;
If there is an exceedance of any Class VI operating permit condition (e.g., exceeding the
permitted volumes of carbon dioxide injected at CCS#2); or
If new site characterization data changes the computational model to such an extent that
the predicted plume or pressure front extends vertically or horizontally beyond the
predicted AoR.
ADM will discuss any such events with the UIC Program Director to determine if an AoR
reevaluation is required.
If an unscheduled reevaluation is triggered, ADM will perform the steps described at the
beginning of this section of this Plan.