ATS Company Reports: Aries agro ltd.
13
-
Upload
ats-investments -
Category
Economy & Finance
-
view
43 -
download
1
Transcript of ATS Company Reports: Aries agro ltd.


Current price 117.50
Sector Agri Chemicals
No of shares 13004339
52 week high 164.40
52 week low 57.25
BSE Sensex 27437.94
Nifty 8305.25
Average Volume 102679
BSE Code 532935
NSE Symbol ARIES
Aries Agro Ltd.
Recommendation
– BUY/HOLD
Date – 24/04/2015

Company Overview
Aries Agro Ltd (Aries Agro) is an agriculture chemicals manufacturer. The company manufactures nutrients sulphur,
magnesium, calcium, water-soluble, nitrogen (N), phosphorous (P) and potassium (K) nutritional products for plants
and animals. Its products are chelated micronutrient fertilizers, farm equipment, major fertilizers, multi-micronutrient
fertilizers, agriculture products, nutritional products, plant nutrition, plant protection, and veterinary products. Aries
Agro’s nutritional products include aries total, calbor, marino, zincomix, ferromix, sulfonite, and tetrabor. The company
markets products under brand name, AGROMIN. It also offers in-house research and development to develop
bactericides for agriculture. Aries Agro is headquartered in Mumbai, Maharashtra, India.
In addition, it provides veterinary products comprising protein and mineral feed supplements for poultry, cattle, and
broilers; and herbal milk booster for dairy cattle, as well as offers seeds, farm equipment, machinery, etc. The
company also sells its products to Sri Lanka, Bangladesh, Pakistan, Ecuador, Brazil, the United States, Taiwan,
Kenya, Vietnam, Australia, and New Zealand. AAL has 6 plants in India and two in AAL subsidiaries in UAE. The
plants are presently located at Bangalore, Mumbai, Hyderabad, Kolkata, Gujarat, Lucknow, Sharjah, UAE (Subsidiary
Company) and Fujairah, UAE (Subsidiary Company).
AAL has five subsidiaries viz Aries Agro Care Pvt Limited, Aries Agro Equipments Private Limited, Aries Agro Produce
Private Limited, Golden Harvest Middle East FZC and a step down Subsidiary viz Amarak Chemicals FZC.
AAL has a very wide distribution network across the country. It operates along a distribution channel comprising of
about more than 6,400 distributors and a direct retail touch point of more than 86,000 dealers. Their reach extends to
most of the major fertilizer consuming districts of the country with the retail outlets spread over 27 states in India. It
also wants to enter new markets in India by expanding its distribution activities in states like Kashmir, Kerala, Manipur
and Goa. The current market capitalisation stands at Rs 156.05 crore.

Category No. of Shares Percentage
Promoters 6,857,926 52.74
General Public 4,371,129 33.61
Other Companies 1,418,623 10.91
Others 146,600 1.13
Foreign - NRI 138,583 1.07
Foreign Institutions 50,000 0.38
Financial Institutions 21,478 0.17
Market Cap (Rs Cr) – 153.19
Company P/E (x) – 12.19
Industry P/E (x) – 42.88
Book Value (Rs) – 102.50
Price / BV (x) – 1.15
Dividend (%) – 20 %
EPS (TTM) – 9.66
Dividend Yield (%) – 1.70 %
Face Value (Rs) – 10
Share Holding Pattern Financial Details

Industry Overview
Agrochemicals are different chemical compounds that are mainly used in agriculture. Mostly, synthetic chemicals such
as di-methyl amine and organophosphates are used as agrochemicals. Further, animal, plant manure are also used
as agrochemicals. Agrochemicals are generally used by mixing with the soil and spraying on the crops. The primary
functions of agrochemicals include protection of crops, improvement of crop yields, maintenance of the food & soil
quality and modification of the growth process of plants. Based on these functions, agrochemicals are classified as
pesticides, insecticides, herbicides, fungicides, fertilizers and liming & acidifying agents among others. Pesticides and
fertilizers have had the largest share in the global agrochemicals consumption over the past few years. Apart from
agricultural fields, agrochemicals are also used on indoor plants in domestic houses, on ornamental crops in nurseries
and in animal husbandry.
Changing agrochemicals usage patterns followed by increased global population & consumer health awareness are
the key driving factors of agrochemicals market demand. Population enlargement has resulted in increased food
consumption. Hence a rise in demand for nutritious and quality foods is likely to occur over the coming years. This
overall situation has led in extensive usage of agrochemicals, especially pesticides, fertilizers, insecticides and
acidifying agents. Pesticides are used to manage and destroy pests, pathogens and other micro-organisms, while
fertilizers are applied for advancement of plant growth. Insecticides are used as insect growth regulators while liming
or acidifying agents are used to adjust the pH level in soils. Pesticides segment is growing at a greater pace than
fertilizer. Growing horticulture and floriculture industries are likely to increase the demand for pesticides.
In terms of global demand for agrochemicals market, the developing countries in Asia Pacific region are expected to
show a steadfast growth by the end of forecast period. China followed by Japan and India are anticipated to have
favorable agrochemicals market by 2020. China is likely to show increased agrochemicals usage especially for maize,
rice and soyabeans. In India, a similar scenario is anticipated since agrochemicals are mainly used for protection of
cash crops, which include major cereals such as wheat, jowar rice as well as cotton and sugarcane.

Balance Sheet
Mar '14 Mar '13 Mar '12 Mar '11 Mar '10
Sources Of Funds
Total Share Capital 13.00 13.00 13.00 13.00 13.00
Equity Share Capital 13.00 13.00 13.00 13.00 13.00
Reserves 127.38 119.18 112.40 96.58 85.23
Networth 140.38 132.18 125.40 109.58 98.23
Secured Loans 93.24 112.83 103.06 94.73 78.47
Unsecured Loans 27.94 29.40 8.18 3.37 4.53
Total Debt 121.18 142.23 111.24 98.10 83.00
Total Liabilities 261.56 274.41 236.64 207.68 181.23
Application Of Funds
Gross Block 46.13 47.38 40.00 42.08 40.61
Less: Revaluation Reserves 0.00 0.00 0.00 7.93 8.21
Less: Accum. Depreciation 11.23 10.43 10.28 10.10 8.30
Net Block 34.90 36.95 29.72 24.05 24.10
Capital Work in Progress 10.85 13.61 19.94 17.07 15.73
Investments 20.28 20.28 20.28 18.06 14.64
Inventories 99.48 102.40 102.82 84.19 46.87
Sundry Debtors 95.05 82.44 68.56 48.87 69.52
Cash and Bank Balance 12.45 20.30 17.91 7.34 6.77
Total Current Assets 206.98 205.14 189.29 140.40 123.16
Loans and Advances 52.43 61.10 49.90 61.25 48.42
Fixed Deposits 0.00 0.00 0.00 32.90 0.00
Total CA, Loans & Advances 259.41 266.24 239.19 234.55 171.58
Current Liabilities 53.75 56.84 64.46 78.77 38.94
Provisions 10.10 5.82 8.03 7.28 5.86
Total CL & Provisions 63.85 62.66 72.49 86.05 44.80
Net Current Assets 195.56 203.58 166.70 148.50 126.78
Total Assets 261.59 274.42 236.64 207.68 181.25
Contingent Liabilities 456.09 69.45 66.39 24.41 5.23
Book Value (Rs) 107.96 101.64 96.43 84.26 75.54

Profit and Loss Account
Mar '14 Mar '13 Mar '12 Mar '11 Mar '10
Income
Sales Turnover 232.87 186.76 191.62 158.26 139.75
Excise Duty 0.00 0.00 0.00 2.27 1.58
Net Sales 232.87 186.76 191.62 155.99 138.17
Other Income 2.26 3.23 5.32 3.41 3.74
Stock Adjustments 1.33 -2.36 16.86 25.27 12.89
Total Income 236.46 187.63 213.80 184.67 154.80
Expenditure
Raw Materials 99.84 71.56 98.38 85.60 75.70
Power & Fuel Cost 0.91 0.62 0.54 0.62 0.50
Employee Cost 23.08 20.46 18.61 16.90 13.93
Other Manufacturing Expenses 13.48 12.04 9.86 1.43 0.87
Selling and Admin Expenses 0.00 0.00 0.00 40.78 30.09
Miscellaneous Expenses 54.39 46.06 47.10 2.72 4.48
Total Expenses 191.70 150.74 174.49 148.05 125.57
Operating Profit 42.50 33.66 33.99 33.21 25.49
PBDIT 44.76 36.89 39.31 36.62 29.23
Interest 24.88 21.01 20.92 12.46 8.68
PBDT 19.88 15.88 18.39 24.16 20.55
Depreciation 1.47 1.85 1.89 1.81 1.60
Profit Before Tax 18.41 14.03 16.50 22.35 18.95
Extra-ordinary items 0.00 0.00 0.00 -0.34 -1.42
PBT (Post Extra-ord Items) 18.41 14.03 16.50 22.01 17.53
Tax 6.88 4.69 6.06 7.64 6.38
Reported Net Profit 11.53 9.34 10.45 14.72 12.56
Total Value Addition 91.85 79.18 76.11 62.45 49.88
Equity Dividend 2.60 1.95 1.95 2.60 1.95
Corporate Dividend Tax 0.44 0.33 0.32 0.43 0.32
Per share data (annualised)
Shares in issue (lakhs) 130.04 130.04 130.04 130.04 130.04
Earning Per Share (Rs) 8.87 7.18 8.03 11.32 9.66
Equity Dividend (%) 20.00 15.00 15.00 20.00 15.00

Dividend History

Index and Company Price Movement Comparison

Symbol Value Action
RSI(14) 75.469 Overbought
STOCH(9,6) 76.941 Buy
STOCHRSI(14) 52.559 Neutral
MACD(12,26) 36.330 Buy
ADX(14) 80.079 Overbought
Williams %R -22.825 Buy
CCI(14) 84.8056 Buy
ATR(14) 26.7893 High Volatility
Highs/Lows(14) 33.7929 Buy
Ultimate Oscillator 51.526 Buy
ROC 298.210 Buy
Bull/Bear Power(13) 80.7140 Buy
Technical Indicators
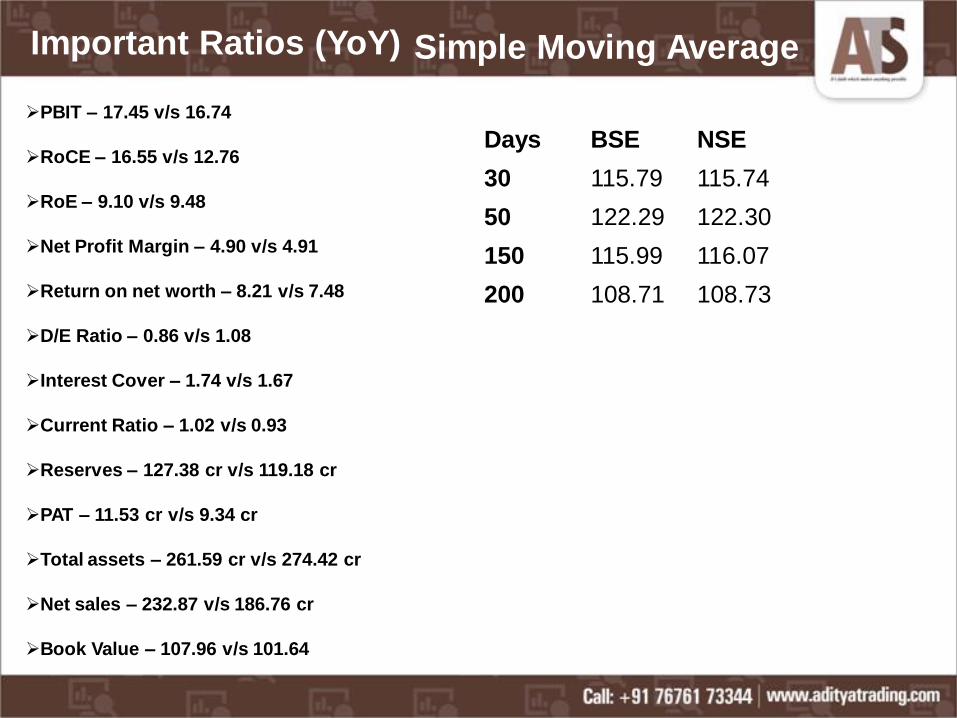
PBIT – 17.45 v/s 16.74
RoCE – 16.55 v/s 12.76
RoE – 9.10 v/s 9.48
Net Profit Margin – 4.90 v/s 4.91
Return on net worth – 8.21 v/s 7.48
D/E Ratio – 0.86 v/s 1.08
Interest Cover – 1.74 v/s 1.67
Current Ratio – 1.02 v/s 0.93
Reserves – 127.38 cr v/s 119.18 cr
PAT – 11.53 cr v/s 9.34 cr
Total assets – 261.59 cr v/s 274.42 cr
Net sales – 232.87 v/s 186.76 cr
Book Value – 107.96 v/s 101.64
Important Ratios (YoY)
Days BSE NSE
30 115.79 115.74
50 122.29 122.30
150 115.99 116.07
200 108.71 108.73
Simple Moving Average
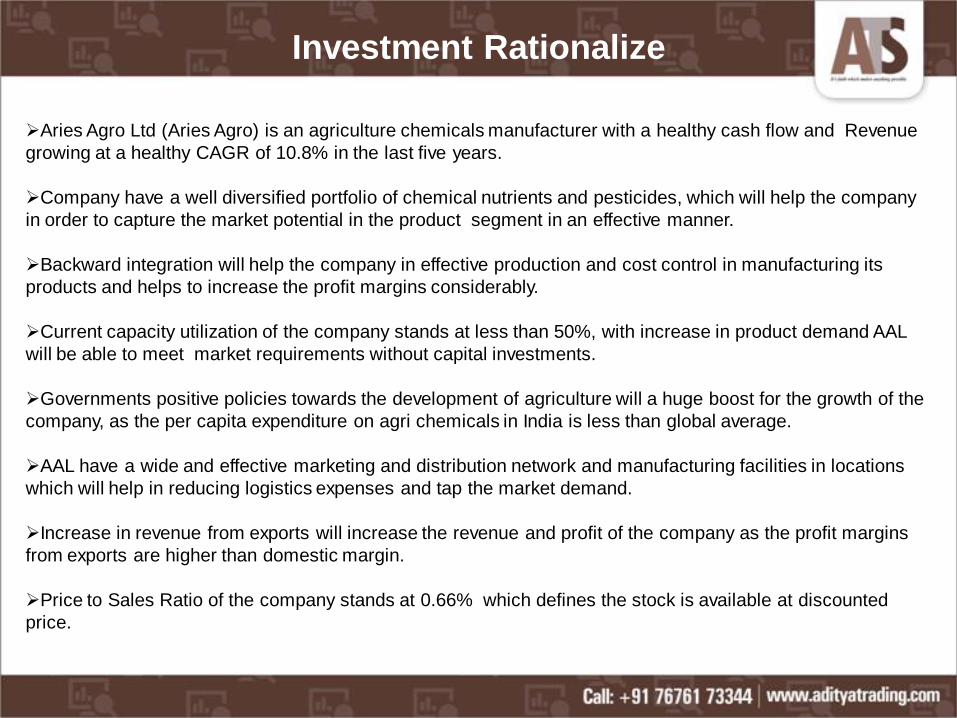
Investment Rationalize
Aries Agro Ltd (Aries Agro) is an agriculture chemicals manufacturer with a healthy cash flow and Revenue
growing at a healthy CAGR of 10.8% in the last five years.
Company have a well diversified portfolio of chemical nutrients and pesticides, which will help the company
in order to capture the market potential in the product segment in an effective manner.
Backward integration will help the company in effective production and cost control in manufacturing its
products and helps to increase the profit margins considerably.
Current capacity utilization of the company stands at less than 50%, with increase in product demand AAL
will be able to meet market requirements without capital investments.
Governments positive policies towards the development of agriculture will a huge boost for the growth of the
company, as the per capita expenditure on agri chemicals in India is less than global average.
AAL have a wide and effective marketing and distribution network and manufacturing facilities in locations
which will help in reducing logistics expenses and tap the market demand.
Increase in revenue from exports will increase the revenue and profit of the company as the profit margins
from exports are higher than domestic margin.
Price to Sales Ratio of the company stands at 0.66% which defines the stock is available at discounted
price.


![1 6/13/2015 ARIES PULSAR STARLITE Overview of ARIES Physics Studies ARIES-I, ARIES-II/IV, ARIES-III [D- 3 He], Pulsar, ARIES-RS, ARIES-ST, ARIES-AT presented.](https://static.fdocuments.us/doc/165x107/56649d3e5503460f94a176ec/1-6132015-aries-pulsar-starlite-overview-of-aries-physics-studies-aries-i.jpg)