ATS-16: Making Data Count, Miguel Figliozzi
19
Cyclists’ comfort levels Presenter: Miguel Figliozzi Professor of Civil and Environmental Engineering Oregon Active Transportation Summit Monday March 14 th , 2016 1
-
Upload
btaoregon -
Category
Government & Nonprofit
-
view
127 -
download
0
Transcript of ATS-16: Making Data Count, Miguel Figliozzi
Cyclists’ comfort levels
Presenter: Miguel Figliozzi
Professor of Civil and Environmental Engineering
Oregon Active Transportation Summit
Monday March 14th, 2016
1

Cyclists’ comfort levels
What are the main sources of stress?
What are the impacts of facility type and trip purpose?
Findings and policy implications
2

ORcycle Project
Smartphone app to collect cyclists data
Available for iOS and Android
3

Trip Questions
4
Questions after completing a trip:
- Purpose
- Frequency
- Route choice factors
- Comfort level
- Safety concerns? (optional)
- Additional comments? (optional)

GPS coordinates*
5
*Heatmap, not adjusted by trip frequency

Exploratory route comfort study
6
Each trip rated on a 1 to 5 scale
Ordinal Logistic Regression
Route Comfort as Dependent Variable
One independent variable at the time
Pooled models (data for trip purpose,
trip characteristics, stressors)
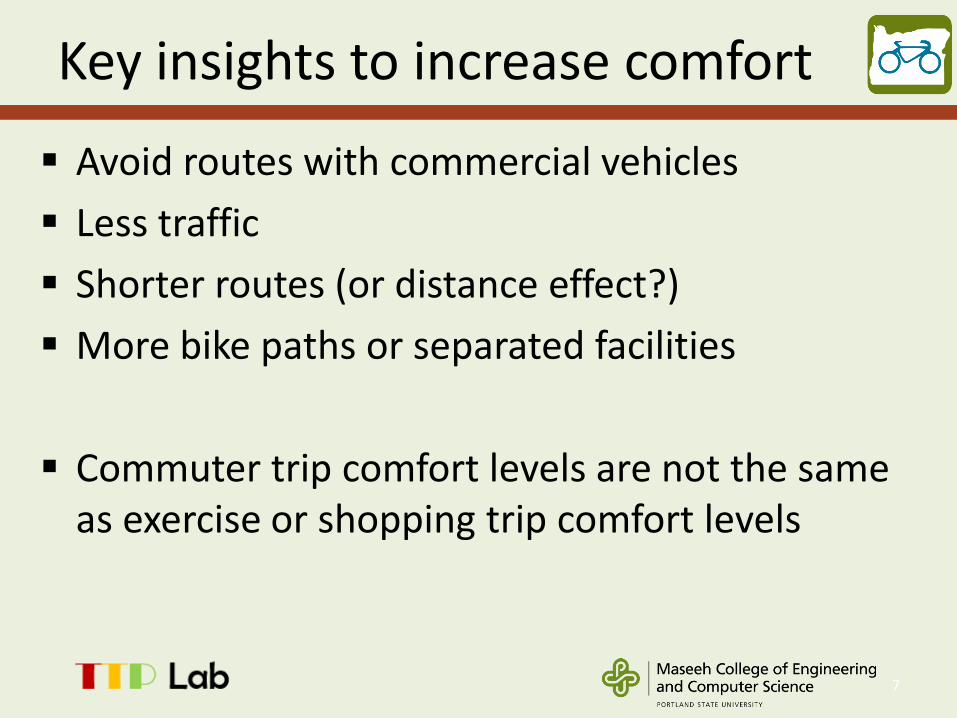
Key insights to increase comfort
Avoid routes with commercial vehicles
Less traffic
Shorter routes (or distance effect?)
More bike paths or separated facilities
Commuter trip comfort levels are not the same as exercise or shopping trip comfort levels
7

Measuring stress levels for real-world on-road cyclists: do bicycle facilities, intersections, and traffic
levels affect cyclists’ stress?
8

Galvanic Skin Response (GSR)
GSR has been utilized by many research studies in fields ranging from psychology to sports medicine.
9

Many ingredients…
Power meter
10
SmartphoneGSR sensor
CamerasHeart rate sensor
Awesome volunteer !

Facility types: mixed traffic, off-street, wide bike lane, and standard bike lane
1
2
3
4
5
6
5
46
3
2
1
EngineeringBuilding

Does peak traffic impact stress levels?
Do intersections impact stress levels?
What about facility types?
Conflicts with other vehicles?
12
Key Findings
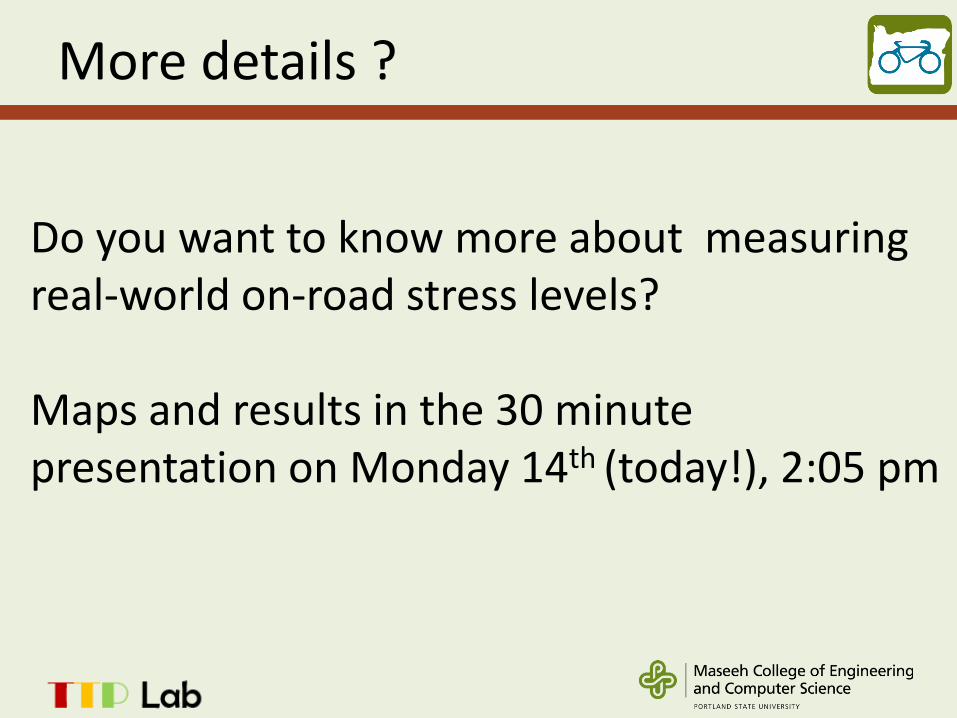
More details ?
13
Do you want to know more about measuring real-world on-road stress levels?
Maps and results in the 30 minute presentation on Monday 14th (today!), 2:05 pm

Final comments
14
Results are very promising
Data complementarities
- General policy insights: revealed data + questions
- Very specific stress measurements for a facility, e.g.
- compare paths or intersections - before/after

Learn more… Related Papers and Reports
15
1. Blanc, B., & Figliozzi, M. (2016a). Modeling the Impacts of Facility Type, Trip Characteristics, and Trip Stressors on Cyclists’ Comfort Levels Utilizing Crowdsourced Data. Forthcoming 2016 Transportation Research Record.
2. Blanc, B., Figliozzi, M, Clifton, K. (2016b). How Representative of Bicycling Populations are Smartphone Application Surveys of Travel Behavior, Forthcoming 2016 Transportation Research Record
3. Figliozzi, M.A., (2015). Evaluating the use of crowdsourcing as a data collection method for bicycle performance measures and identification of facility improvement needs, Final Report SPR 768, ODOT, http://www.oregon.gov/ODOT/TD/TP_RES/pages/researchreports.aspx
4. Caviedes, A. & Figliozzi, M. (2016) Measuring stress levels for real-world on-road cyclists: do bicycle facilities, intersections, and traffic levels affect cyclists’ stress? Presented at 2016 Transportation Research Board Annual Meeting, Washington DC.
5. More papers under review…

CollaboratorsModeling and ORcycle:
Bryan Blanc (*)Bikram Maharjan (**)Robin Murray (**)
(*) Department of Civil and Environmental Engineering, PSU(**) Department of Computer Science, PSU
16

CollaboratorsModeling and measuring real-world on-road Stress
Alvaro Caviedes (*)Robin Murray (**)Hoang Le (**)Feng Liu (**)Wu-chi Feng (**)
(*) Department of Civil and Environmental Engineering, PSU(**) Department of Computer Science, PSU
17
NITC supported video analysis piece

Safety reports & AskODOT
18
Since Nov. 2015 users can email safety reports to
ODOT using the app
- AskODOT receives the email with safety report
data and a link to google maps
- Plus photos and comments
- Commitment to respond within 5 business days

THANK YOU
Questions? Comments… Visit our webpage:
http://www.pdx.edu/transportation-lab
Email us at: [email protected]
19