ATRIUM COMPANY PRESENTATION - Atrium … company...2009 2010 2011 2012 2013 2014 2015 2016 1H2017 5...
17
ATRIUM – COMPANY PRESENTATION THE LEADING OWNER & MANAGER OF CENTRAL EASTERN EUROPEAN SHOPPING CENTRES August 2017
Transcript of ATRIUM COMPANY PRESENTATION - Atrium … company...2009 2010 2011 2012 2013 2014 2015 2016 1H2017 5...

ATRIUM –COMPANY PRESENTATION
THE LEADING OWNER & MANAGER OF
CENTRAL EASTERN EUROPEAN
SHOPPING CENTRES
August 2017

2
* Subject to any legal and regulatory requirements and restrictions of commercial viability
All numbers in this presentation as reported in the 6M results to 30 June 2017 unless explicitly stated otherwise, incl. a 75% stake in Arkady Pankrac
ATRIUM – LEADING OWNER & MANAGER OF CEE SHOPPING CENTRES
60 properties with a MV of c.€2.6bn and 1.1 million m² GLA
Focus on shopping centres, primarily food-anchored
1H17 GRI: €98.8m, NRI: €95.5m
Adjusted EPRA EPS: 16.4 €cents, EPRA NAV per share: €5.40
Special dividends of 14 €cents each paid in September 2016 and June 2017
Board-approved dividend of 27 €cents per share for 2017*
Research coverage by Bank of America Merrill Lynch, Baader Bank, HSBC, Kempen, Raiffeisen and Wood & co
Strong management team with a proven track record
Central European focus with dominant presence in the most mature & stable countries
Robust balance sheet: 30.3% net LTV/ €121m cash & marketable securities
Investment grade rating with a “Stable” outlook by Fitch and S&P
Balance between solid income producing platform & opportunities for future growth
A UNIQUE INVESTMENT OPPORTUNITY
KEY FIGURES
3
POLAND
21
SLOVAKIA
3
CZECH REP.
6
HUNGARY
22
RUSSIA
7
ROMANIA
1
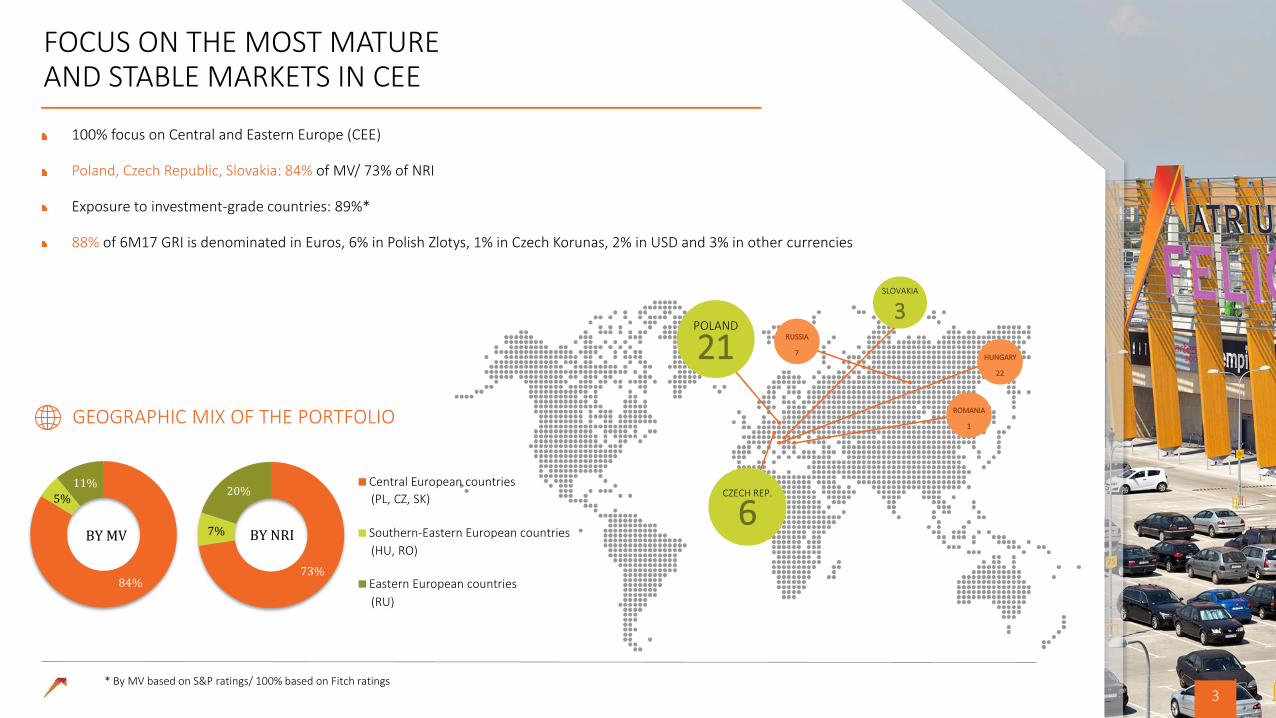
FOCUS ON THE MOST MATURE AND STABLE MARKETS IN CEE
100% focus on Central and Eastern Europe (CEE)
Poland, Czech Republic, Slovakia: 84% of MV/ 73% of NRI
Exposure to investment-grade countries: 89%*
88% of 6M17 GRI is denominated in Euros, 6% in Polish Zlotys, 1% in Czech Korunas, 2% in USD and 3% in other currencies
GEOGRAPHIC MIX OF THE PORTFOLIO
* By MV based on S&P ratings/ 100% based on Fitch ratings
77%
7%
16%
BY NRI
Central European countries
Southern-Eastern European countries
Eastern European countries
(PL, CZ, SK)
(HU, RO)
(RU)
84%
5%
11%
BY MV
73%
7%
20%
BY NRI
Central European countries
Southern-Eastern Europeancountries
Eastern European countries

4
RESTRUCTURING: MANAGEMENT MAKES A DIFFERENCE
WHERE WE STARTED
€1.6bn (Dec’08) STANDING INVESTMENT PORTFOLIO €2.6bn
93.6% (Dec’08) OCCUPANCY (GLA) 95.5%
71% (FY08) OPERATING MARGIN 96.6%
€727m (Dec’08) DEVELOPMENT AND LAND €326.5m
61%, 8.3% (Dec’08) GROSS LTV, COST OF DEBT 33.3%, 3.6%
BB- (2009) CREDIT RATING BBB-
€24 cent p.s. (FY09) ADJ. EPRA EARNINGS €16.4 cent p.s. (1H17)
€3 cent p.s. (FY09) DIVIDEND €27 cent p.s. (approved for 2017)* +
€14 cent p.s. special dividend Jun’17
CORPORATE GOVERANANCE & TRANSPARENCY
AWARDS + FIRST SUSTAINABILITY REPORT
WHERE WE ARE TODAY
* Subject to any legal and regulatory requirements and restrictions of commercial viability
2013 2012 2011 2010 1H2017 2009 2014 2015 2016

5
STANDING INVESTMENTS PORTFOLIO DETAILED OVERVIEW*
Country
No of properties
Gross lettable area
Market value 30/06/2017
Market value per m² of GLA
Net equivalent yield (weighted
average)**
EPRA net initial yield***
Revaluation during
6M 2017
EPRA Occupancy
m² €m € % % €m %
Poland 21 522,600 1,535.7 2,939 6.3% 6.1% 0.1 95.6%
Czech Republic 6 112,500 514.0 4,569 5.6% 5.5% -0.5 98.5%
Slovakia 3 61,200 164.9 2,694 7.2% 6.2% 0.6 97.6%
Russia 7 241,400 289.1 1,198 12.5% 11.5% 2.7 94.4%
Hungary 22 97,700 61.3 628 9.4% 12.1% -0.1 98.2%
Romania 1 56,600 79.7 1,408 8.1% 8.0% 0.0 100.0%
Total Group 60 1,092,000 2,644.7 2,422 7.0% 6.8% 2.7 96.2%
Portfolio quality boost & repositioning (6Y): €1bn prime bought in 7 acquisitions, €220m non-core sold in 93 disposals
Atrium owns 60 shopping centres and smaller retail properties, which are all internally managed with two exceptions
78% of the total standing investments portfolio is located in Poland and the Czech Republic,
with Poland exceeding 58%
The top 10 assets:
Represent 63% of Atrium’s standing investments’ portfolio value
7 are located in Poland, 2 in the Czech Republic and 1 in Slovakia
* All numbers incl. the 75% stake in Arkady Pankrac ** The external appraisers’ equivalent yield is a weighted average yield that takes into consideration estimated rental values, occupancy rates and lease expiries *** The EPRA Net initial yield is calculated as the annualised net rental income divided by the market value
MARKET VALUE PER COUNTRY
58.2% 19.4%
6.2%
10.9%
3.0% 2.3%
Poland (58.2%)
Czech Republic (19.4%)
Slovakia (6.2%)
Russia (10.9%)
Romania (3.0%)
Hungary (2.3%)

6
RESILIENT INCOME: STRONG TENANTS, LONG LEASE DURATION
LEASE EXPIRY BY ANNUALISED RENTAL INCOME
TENANT MIX BY ANNUALISED RENTAL INCOME
Fashion Apparel tenants generate 39% of income (32% of GLA),
and Hyper/ Supermarket retailers generate 9% (18% of GLA)
The tenant mix with large exposure to food retailing and everyday
necessities has proven its economic resilience
The long duration of lease contracts and the wide range of
expiries provide resilient income streams
Average lease duration is 4.9 years
39%
13% 12%
9%
10%
7%
4% 3% 2% 1%
Fashion Apparel (39%)
Speciality goods (13%)
Home (12%)
Hyper/Supermarket (9%)
Health and Beauty (10%)
Restaurants (7%)
Entertainment (4%)
Services (3%)
Non Retail (2%)
Specialty Food (1%)
8.6%
20.4% 14.6%
11.5% 11.3% 5.5%
28.0%
0%
10%
20%
30%
40%
50%
2017 2018 2019 2020 2021 2022 >2022

7
Group name
Main brands % of Annualised Rental Income**
International presence
Sales 2016 € Bn, worldwide
S&P credit rating (if rated)
AFM 4.0% 1,923 stores/ 14 countries
52.8 BBB+/ Stable
LPP 3.6% 1,703 stores/ 17 countries
1.4 -
Metro Group 2.9% 2,064 stores/ 29 countries
58.4 -
Hennes & Mauritz 2.6% 4,351 stores/ 64 countries
23.3 -
Inditex 2.3% 7,292 stores/ 93 countries
23.3 -
Kingfisher 1.4% 1,100 stores/ 10 countries
12.1 BBB/ Stable
ASPIAG 1.3% 12,500 stores/
44 countries 33.1 -
New Yorker 1.3% 1,000 stores/ 40 countries
-
Carrefour 1.2% 11,935 stores/
30 countries 103.7 BBB+/ Stable
A.S. Watson 1.2% 13,500 stores/
24 countries 45.7 -
Top 10 tenants 21.8%
TOP 10 TENANTS - WELL-KNOWN GLOBAL RETAILERS*
* As of YE-2016 ** Including 100% of Arkady Pankrac

8
21%
30% 31%
13%
5% Poland - Redevelopment (€70m)
Poland - Land (€99m)
Turkey (€100m)
Russia (€43m)
Other (€15m)
FOCUS ON STRONGER PORTFOLIO VIA UPGRADES, REDEVELOPMENTS & EXTENSIONS
€326.5M fair value, representing 11% of our
total real estate portfolio
52% located in Poland
21% (€70m) are redevelopments & extensions
March 2014: Atrium’s largest project – Atrium Felicity (74,100 m² GLA) in Lublin, Poland
March 2015: extension of Atrium Copernicus in Torun, Poland (+17,300 m² of GLA)
DEVELOPMENT AND LAND PER COUNTRY
COMPLETED PROJECTS
ONGOING PROJECTS
Substantial redevelopment & extension programme to deliver almost 70,000 m² new GLA, including:
Atrium Promenda (Warsaw) – Stage 1 completed: 7,600 m² GLA added/ Stage 2 ongoing: will add 13,400 m² GLA
Atrium Targowek (Warsaw) – 8,600 m² GLA extension; expected completion – end of 2018
Atrium Reduta (Warsaw) – 5,800 m² GLA extension; expected completion – end of 2019
ATRIUM TARGOWEK
ATRIUM PROMENADA
ATRIUM REDUTA
9
4
333
501
838
5 2 102
- 109
2017-2019 2020 2021 2022 Total
Bonds Bank Loans
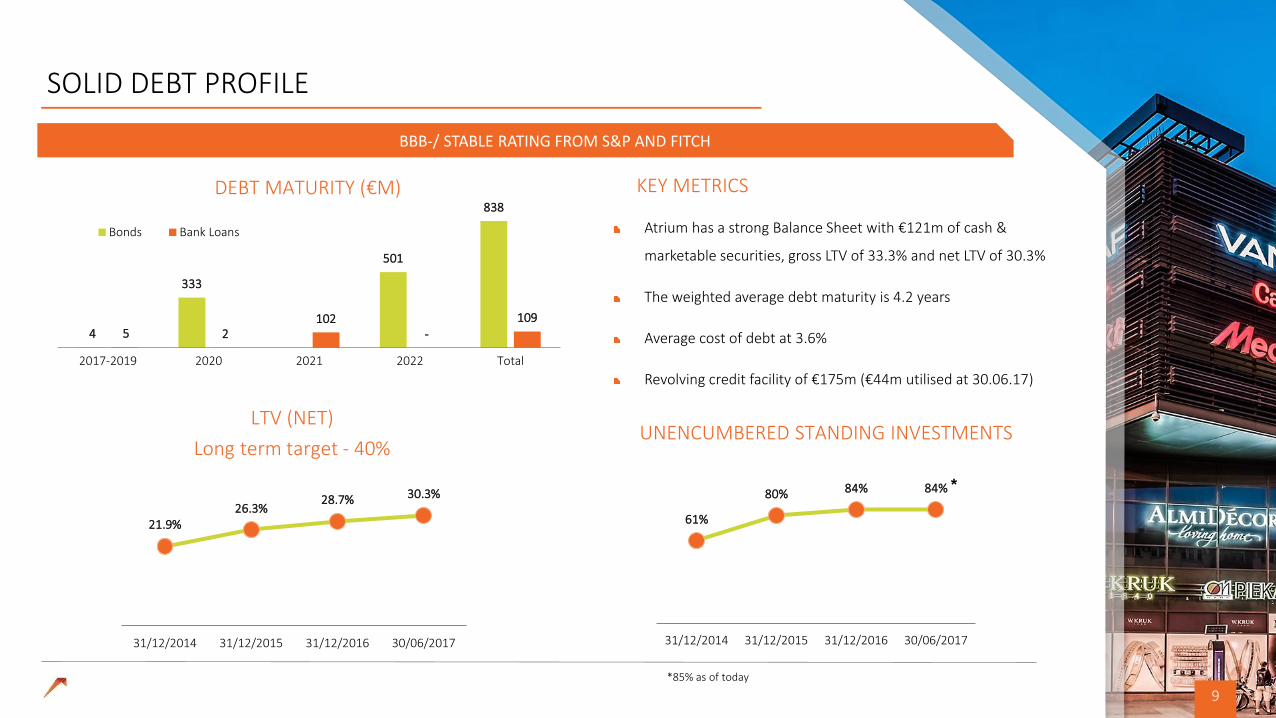
SOLID DEBT PROFILE
Atrium has a strong Balance Sheet with €121m of cash &
marketable securities, gross LTV of 33.3% and net LTV of 30.3%
The weighted average debt maturity is 4.2 years
Average cost of debt at 3.6%
Revolving credit facility of €175m (€44m utilised at 30.06.17)
DEBT MATURITY (€M)
BBB-/ STABLE RATING FROM S&P AND FITCH
KEY METRICS
21.9% 26.3%
28.7% 30.3%
31/12/2014 31/12/2015 31/12/2016 30/06/2017
UNENCUMBERED STANDING INVESTMENTS
*85% as of today
LTV (NET)
Long term target - 40%
61%
80% 84% 84%
31/12/2014 31/12/2015 31/12/2016 30/06/2017
*

10
0.24 0.25 0.28
0.32 0.34 0.36
0.33 0.31
0.16
0.03 0.12 0.14
0.17 0.21
0.24 0.27
0.00
0.10
0.20
0.30
0.40
0.50
2009 2010 2011 2012 2013 2014 2015 2016 1H2017
Adjusted EPRA EPS Dividend per share p.a.
+23%
STRATEGIC FOCUS & FUTURE GROWTH
CORPORATE VISION: The Group’s vision is to remain one of the leading owners and managers of food anchored shopping centres in Central
Europe and for the Atrium brand to become a hallmark of high quality retail for consumers and retailers
MILESTONE 1: Solid investment grade rating
Long-term leverage target of net debt to real estate value of 40%
Long-term target for development & land bank <15% of total real estate asset
MILESTONE 2: Sustainable dividend
FINANCIAL TARGETS:
LIQUIDITY - Significant liquid funds directly available for investments
DEVELOPMENT & LAND - Monetise the land bank through selective development or divestment
EXTENSIONS - Redevelopment and extension potential
THREE KEY DRIVERS OF FUTURE GROWTH:
DIVIDEND CAGR (2010-16)
Special div.
0.27
0.14
Special div.
0.14
0.14

11
SUSTAINABILITY – IT MATTERS: OUR CUSTOMERS, OUR PLACES, OUR PEOPLE
For more information on our sustainability strategy , as well as our sustainability reports, please see our website www.aere.com/sustainability
Atrium is committed to sustainable growth, reflecting our long-term business approach and our dedication to corporate citizenship
We strive for economic efficiency, social fairness and environmental sustainability in all our endeavours
Atrium’s sustainability vision is to lead the CEE market, and to continue to create value for all our stakeholders
Our strategy is centred around three focus areas – our customers, our assets, and our employees
Atrium’s sustainability achievements include:
Our 1st ever participation in GRESB resulting in a “Green Star” ranking (2016)
The EPRA Gold award for our financial reporting standards and transparency (2016)
Our first Sustainability Report , “It Matters”, in line with the EPRA best practice recommendations (2017)
We will continue to increase our efforts, to participate in GRESB, and to promote transparency and environmental regulation in the real estate sector
A COMPANY THAT CARES FOR AND ENGAGES WITH
ITS CUSTOMERS
SHOPPING CENTRES WITH OPTIMAL SUSTAINABLE
PERFORMANCE
A TALENTED AND DIVERSE WORKFORCE THAT IS PROUD TO
WORK FOR US

12
APPENDIX 1 – MACRO OVERVIEW

13
MACRO OVERVIEW OF OUR MARKETS
* Simple arithmetic average for comparison purposes Sources: IMF, rating agencies
Macro Indicator PolandCzech
RepublicRussia Slovakia Hungary Romania
Total /
Average*France Germany
2016 population (M people) 38.0 10.6 143.4 5.4 9.8 19.8 227.0 64.6 82.7
2016 GDP in PPP ($ Bn) 1,054.1 350.7 3,799.7 170.1 270.3 441.6 6,086.5 2,733.7 3,980.2
2016 GDP per capita PPP ($) 27,764 33,222 26,490 31,339 27,482 22,348 28,108 42,314 48,111
2017f GDP per capita PPP ($) 29,349 34,849 27,466 33,055 28,965 23,958 29,607 43,653 49,815
2020f GDP per capita PPP ($) 34,281 39,405 30,699 39,184 33,623 28,686 34,313 48,321 55,079
2016 real GDP growth (%) 2.8% 2.4% -0.2% 3.3% 2.0% 4.8% 2.5% 1.2% 1.8%
2017f real GDP growth (%) 3.4% 2.8% 1.4% 3.3% 2.9% 4.2% 3.0% 1.5% 1.8%
2018f real GDP growth (%) 3.2% 2.2% 1.4% 3.7% 3.0% 3.4% 2.8% 1.7% 1.6%
2021f real GDP growth (%) 2.8% 2.3% 1.5% 3.4% 2.2% 3.3% 2.6% 1.8% 1.2%
2016 unemployment (%) 6.1% 4.0% 5.5% 9.7% 4.9% 6.0% 6.0% 10.0% 4.2%
2017f unemployment (%) 5.6% 3.8% 5.5% 7.9% 4.4% 5.4% 5.4% 9.6% 4.2%
2020f unemployment (%) 5.2% 4.5% 5.5% 6.4% 4.2% 6.0% 5.3% 8.7% 4.2%
2016 inflation (%) 0.8% 2.0% 5.4% 0.2% 1.8% -0.5% 1.6% 0.7% 1.7%
2017f inflation (%) 2.3% 2.3% 4.4% 1.4% 2.8% 2.2% 2.6% 1.4% 1.6%
2020f inflation (%) 2.5% 2.0% 4.0% 2.0% 3.0% 2.5% 2.7% 1.7% 2.2%
Country rating/ outlook - Moody's A2/ stable A1/ stable Ba1/ stable A2/ positive Baa3/ stable Baa3/ stable n.a. Aa2/ stable Aaa/ stable
Country rating/ outlook - S & P BBB+/ stable AA-/ stable BB+/ positive A+/ stable BBB- / stable BBB-/ stable n.a. AA/ stable AAA/ stable
Country rating/ outlook - Fitch A-/ stable A+/ stable BBB-/ stable A+/ stable BBB-/ stable BBB-/ stable n.a. AA/ stable AAA/ stable
Atrium country exposure by NRI (6M2017) 52% 15% 20% 6% 4% 3% 100%
Atrium country exposure by MV at 30/06/17 58% 20% 11% 6% 2% 3% 100%
14
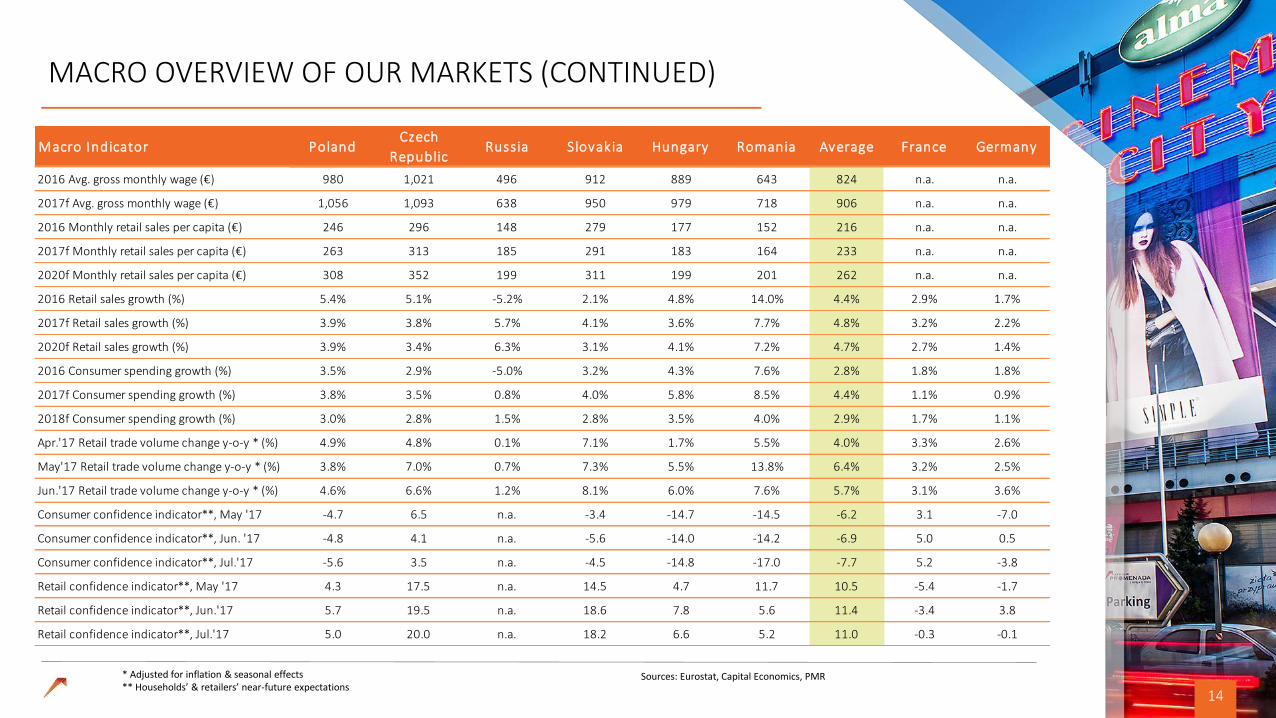
MACRO OVERVIEW OF OUR MARKETS (CONTINUED)
* Adjusted for inflation & seasonal effects ** Households’ & retailers’ near-future expectations
Sources: Eurostat, Capital Economics, PMR
Macro Indicator PolandCzech
RepublicRussia Slovakia Hungary Romania Average France Germany
2016 Avg. gross monthly wage (€) 980 1,021 496 912 889 643 824 n.a. n.a.
2017f Avg. gross monthly wage (€) 1,056 1,093 638 950 979 718 906 n.a. n.a.
2016 Monthly retail sales per capita (€) 246 296 148 279 177 152 216 n.a. n.a.
2017f Monthly retail sales per capita (€) 263 313 185 291 183 164 233 n.a. n.a.
2020f Monthly retail sales per capita (€) 308 352 199 311 199 201 262 n.a. n.a.
2016 Retail sales growth (%) 5.4% 5.1% -5.2% 2.1% 4.8% 14.0% 4.4% 2.9% 1.7%
2017f Retail sales growth (%) 3.9% 3.8% 5.7% 4.1% 3.6% 7.7% 4.8% 3.2% 2.2%
2020f Retail sales growth (%) 3.9% 3.4% 6.3% 3.1% 4.1% 7.2% 4.7% 2.7% 1.4%
2016 Consumer spending growth (%) 3.5% 2.9% -5.0% 3.2% 4.3% 7.6% 2.8% 1.8% 1.8%
2017f Consumer spending growth (%) 3.8% 3.5% 0.8% 4.0% 5.8% 8.5% 4.4% 1.1% 0.9%
2018f Consumer spending growth (%) 3.0% 2.8% 1.5% 2.8% 3.5% 4.0% 2.9% 1.7% 1.1%
Apr.'17 Retail trade volume change y-o-y * (%) 4.9% 4.8% 0.1% 7.1% 1.7% 5.5% 4.0% 3.3% 2.6%
May'17 Retail trade volume change y-o-y * (%) 3.8% 7.0% 0.7% 7.3% 5.5% 13.8% 6.4% 3.2% 2.5%
Jun.'17 Retail trade volume change y-o-y * (%) 4.6% 6.6% 1.2% 8.1% 6.0% 7.6% 5.7% 3.1% 3.6%
Consumer confidence indicator**, May '17 -4.7 6.5 n.a. -3.4 -14.7 -14.5 -6.2 3.1 -7.0
Consumer confidence indicator**, Jun. '17 -4.8 4.1 n.a. -5.6 -14.0 -14.2 -6.9 5.0 0.5
Consumer confidence indicator**, Jul.'17 -5.6 3.5 n.a. -4.5 -14.8 -17.0 -7.7 5.2 -3.8
Retail confidence indicator**, May '17 4.3 17.5 n.a. 14.5 4.7 11.7 10.5 -5.4 -1.7
Retail confidence indicator**, Jun.'17 5.7 19.5 n.a. 18.6 7.8 5.6 11.4 -3.4 3.8
Retail confidence indicator**, Jul.'17 5.0 20.0 n.a. 18.2 6.6 5.2 11.0 -0.3 -0.1

15
COUNTRY & REAL ESTATE RISK/ YIELD
YIELDS ON 10Y BONDS IN LOCAL CURRENCIES, AUGUST 2012- AUGUST 2017
Sources: Bloomberg, C&W
Country
Sovereign ratings
10Y gov. bond
yield, local currency
Prime shopping
centre gross yield*
Spread from SC yield to 10Y gov.
bond yields
Fitch August
2017 C&W
(2Q17)
Russia BBB- 7.74% 11.00% 3.26%
Romania BBB- 3.87% 6.75% 2.88%
Poland A- 3.42% 4.75% 1.33%
Hungary BBB- 3.08% 6.00% 2.92%
Czech Rep. A+ 0.96% 4.25% 3.29%
Slovakia A+ 0.82% 5.25% 4.43%
Germany AAA 0.38% 3.70% 3.32%
* Except Germany – net

16
DISCLAIMER
This document has been prepared by Atrium (the “Company”). This document is not to be reproduced nor distributed, in whole or in part, by any person
other than the Company. The Company takes no responsibility for the use of these materials by any person.
The information contained in this document has not been subject to independent verification and no representation, warranty or undertaking, express or
implied, is made as to, and no reliance should be placed on, the fairness, accuracy, completeness or correctness of the information or opinions contained
herein. None of the Company, its shareholders, its advisors or representatives nor any other person shall have any liability whatsoever for any loss arising
from any use of this document or its contents or otherwise arising in connection with this document.
This document does not constitute an offer to sell or an invitation or solicitation of an offer to subscribe for or purchase any securities, and this shall not
form the basis for or be used for any such offer or invitation or other contract or engagement in any jurisdiction.
This document includes statements that are, or may be deemed to be, “forward looking statements”. These forward looking statements can be identified
by the use of forward looking terminology, including the terms “believes”, “estimates”, “anticipates”, “expects”, “intends”, “may”, “will” or “should” or, in
each case their negative or other variations or comparable terminology. These forward looking statements include all matters that are not historical facts.
They appear in a number of places throughout this document and include statements regarding the intentions, beliefs or current expectations of the
Company. By their nature, forward looking statements involve risks and uncertainties because they relate to events and depend on circumstances that may
or may not occur in the future. Forward looking statements are not guarantees of future performance. You should assume that the information appearing
in this document is up to date only as of the date of this document. The business, financial condition, results of operations and prospects of the Company
may change. Except as required by law, the Company do not undertake any obligation to update any forward looking statements, even though the situation
of the Company may change in the future.
All of the information presented in this document, and particularly the forward looking statements, are qualified by these cautionary statements. You
should read this document and the documents available for inspection completely and with the understanding that actual future results of the Company
may be materially different from what the Company expects.
This presentation has been presented in € and €m’s. Certain totals and change movements are impacted by the effect of rounding.

THANK YOU