
Atradius Country Report · quarrying and oil and gas extraction sector ... expected to widen to 3.5...
16
Atradius Country Report North American Free Trade Agreement (NAFTA) countries – November 2015
Transcript of Atradius Country Report · quarrying and oil and gas extraction sector ... expected to widen to 3.5...

Atradius Country ReportNorth American Free Trade Agreement (NAFTA) countries – November 2015

2
Contents Canada Page 3
Mexico Page 6
USA Page 10

3
Key indicators 2012 2013 2014 2015* 2016**
Real GDP (y-on-y, % change) 1.9 2.0 2.4 1.0 2.0
Consumer prices (y-on-y, % change) 1.5 0.9 1.9 1.2 2.1
Private consumption (y-on-y, % change) 1.9 2.5 2.7 1.9 2.2
Retail sales (y-on-y, % change) 0.9 2.2 2.6 1.0 0.9
Industrial production (y-on-y, % change) 1.4 1.8 4.1 -1.3 0.1
Unemployment rate (%) 7.3 7.1 6.9 6.9 6.8
Real fixed investment (y-on-y, % change) 4.8 0.4 0.2 -2.7 -0.3
Exports of goods and non-factor services 2.6 2.0 5.4 2.0 4.0(y-on-y, % change)
Fiscal balance (% of GDP) -3.1 -2.7 -1.6 -2.0 -1.4
Government debt (% of GDP) 68.5 66.1 68.5 73.5 72.2
* estimate **forecast Source: IHS
Good:The credit risk situation in the sector is benign / business performance in the sector is above its long-term trend.
Fair:The credit risk credit situation in the sector is average / business performance in the sector is stable.
Poor: The credit risk situation in the sector is relatively high / business performance in the sector is below long-term trend.
Bleak:The cedit risk situation in the sector is poor / business performance in the sector is weak compared to its long-term trend.
Excellent:The credit risk situation in the sector is strong / business performance in the sector is strong compared to its long-term trend.
Canadian industries performance forecast
Agriculture
Electronics/ICT
Automotive/Transport
Financial Services
Chemicals/Pharma
Food
Construction
Machines/Engineering
ConstructionMaterials
ConsumerDurables
Paper Services Steel TextilesMetals
November 2015
CanadaUSA: 54.3 % USA: 76.8 %
China: 11.5 % China: 3.7 %
Mexico: 5.6 % United Kingdom: 2.9 %
Germany: 3.1 % Japan: 2.1 %
Japan: 2.6 % Mexico: 1.0 %
Main import sources (2014, % of total)
Main export markets (2014, % of total)

0
3,000 3,000
2,000 2,000
4,000 4,000
5,000 5,000
1,000 1,000
4
The insolvency environment
Sources: Office of the Superintendent of Bankruptcy Canada; Atradius Economic Research
*forecast
(Calendar year: % change on previous year)
Canadian business insolvencies
% change
2010
-24.9 %
2011
-10.5 %
2012
-11.2 %
2013
-1.5 %
2014
-2.2 %
2015*
7.0 %
0
3,187 3,1163,335
4,0723,643
3,236
2016*
1.0 %
3,370
Canadian corporate insolvencies expected to increase in 2015 and 2016
After double-digit year-on-year decreases between 2010 and 2012, the pace of insolvency decline slowed down in 2013 and 2014. Due to the more difficult economic environment and low commodity prices (see report below), it is expec-ted that business insolvencies will increase again in 2015 by 7 % to about 3,300 cases, followed by another 1 % increase in 2016.
Main economic developments Growth expected to slow down in 2015
The Canadian economy has seen robust growth since 2010, mainly due to in-creased global demand for commodities, especially oil. However, as the world´s fifth largest oil producer, Canada has been affected by the steep decrease in oil prices since mid-2014. According to Statistics Canada, GDP shrank 0.2 % in Q1 of 2015 compared to the previous quarter and 0.1% in Q2 of 2015; technically entering recession. The GDP decrease was mainly a result of contractions in manufacturing, mining, quarrying, oil and gas extraction and wholesale trade. According to Statistics Canada, in Q2 of 2015 the value added of the mining, quarrying and oil and gas extraction sector decreased 4.5 %, mainly due to the decline in the non-conventional oil extraction industry (down 5.7 %), which experienced maintenance shutdowns and production difficulties. Support activi-ties for mining, and oil and gas extraction even contracted 18 %.
Economic growth is expected to slow down to 1 % in 2015, but to rebound 2 % in 2016.
5
4
3
2
1
0
2012 2013 2014 2015e 2016f
Source: IHS
1.9 2.02.4
1.0
2.0
Real GDP growth(y-on-y, % change)

5
2012 2013 2014 2015e 2016fSource: IHS
Private consumption(y-on-y, % change)
5
4
3
2
1
0
1.92.22.5
1.9
2.7
Private consumption growth remains subdued
After growing 2.7 % in 2014, private consumption is expected to grow only 1.9 % in 2015. Household debt expanded in recent years, with most consumer borrowing going into buying homes, as property values have gone up and interest rates are low. However, it is estimated that housing is currently over-valued by about 30 %, and household indebtedness has increased to more than 160 % of disposable income. This could pose a risk to the economy, especially if interest rates and unemployment were to increase in the future. The unem-ployment rate is expected to remain stable in 2015 and 2016, at around 6.9 %, and inflation is expected to increase only slightly in 2016. Nevertheless, any potential economic downturn in the future could turn the consumer debt issue into a real problem.
Industrial production expected to contract in 2015
In 2015 the Canadian dollar has depreciated further against the US dollar, while the Canadian Central Bank has lowered the interest rate twice, to the current 0.5 %. This was seen as a move to boost investments and to make Canadian exports even cheaper.
However, so far, the weaker exchange rate and lower interest rate have not led to a surge of exports of manufactured goods to the US, which accounts for more than 75 % of Canadian exports. Industrial production is expected to contract 1.3 % in 2015. The potential of manufacturing to compensate for the decrease in the energy sector is limited, as manufacturing contribution to GDP has steadily decreased in recent years (in 2014 it accounted for 10% of GDP, down from 18 % in 2000). At the same time, the Canadian manufacturing sector has lost inter-national competitiveness, as currencies of other countries exporting to the US have also depreciated against the USD. Additionally, input costs (often priced in USD) have increased and Canadian wages are high by international comparison.
The growth of exports of goods and non-factor services is expected to slow down to 2 % in 2015, and to increase 4 % in 2016. The current account deficit is expected to widen to 3.5 % of GDP in 2015.
Problems in the oil sector trigger investment contraction
Energy firms, which account for about 30 % of capital spending, are expected to reduce investment by about 40 %. At the same time, investment in the manu-facturing sector remains subdued. Real fixed investment in Canada is expected to decrease 2.7 % in 2015, and to contract another 0.3 % in 2016.
Public deficit increases, but government debt remains manageable
Canada´s government debt is expected to increase in 2015 to 73.5 % of GDP, but, as a share of GDP, it remains relatively low compared to the US and most Western European countries. Despite an increase in 2014, the fiscal deficit is expected to remain modest, at 2.0 % in 2015 and 1.4 % in 2016. However, a hig-her increase in 2016 and beyond cannot be ruled out after the landslide victory of the Liberal Party in the October 2015 general elections. During the election campaign, the party said that it plans to run higher deficits for the coming three years in order to increase infrastructure spending as a measure to boost econo-mic growth.
2012 2013 2014 2015e 2016fSource: IHS
Industrial production (y-on-y, % change)
6
4
2
0
-2
2012 2013 2014 2015e 2016fSource: IHS
Real fixed investment (y-on-y, % change)
10
5
0
-5
-10
2012 2013 2014 2015e 2016fSource: IHS
Government debt (% of GDP) 100
80
60
40
20
0
1.40.1
1.8
-1.3
4.1
4.8
-0.3
0.4
-2.7
0.2
68.5 72.266.1
73.568.5

6
Key indicators 2012 2013 2014 2015* 2016**
Real GDP (y-on-y, % change) 4.0 1.4 2.1 2.3 2.8
Consumer prices (y-on-y, % change) 4.0 3.8 4.0 2.7 3.2
Private consumption (y-on-y, % change) 4.9 2.3 2.0 2.9 2.2
Industrial production (y-on-y, % change) 2.9 -0.6 1.9 0.3 2.1
Real fixed investment (y-on-y, % change) 4.8 -1.6 2.3 3.4 2.6
Exports of goods and non-factor services 5.8 2.4 7.3 7.5 4.8(y-on-y, % change)
Fiscal balance (% of GDP) -2.6 -2.5 -3.2 -3.0 -2.8
Current account/GDP (%) -1.3 -2.4 -2.1 -2.2 -2.2
Foreign debt/GDP (%) 32 35 37 44 48
International reserves 4.9 5.4 5.8 5.5 5.1(in months of merchandise imports)
* estimate **forecast Source: EIU, IHS, IMF
Mexican industries performance forecast
Agriculture
Electronics/ICT
Automotive/Transport
Financial Services
Chemicals/Pharma
Food
Construction
Machines/Engineering
ConstructionMaterials
ConsumerDurables
Paper Services Steel TextilesMetals
November 2015
MexicoUSA: 49.0 % USA: 80.3 %
China: 16.6 % Canada: 2.7 %
Japan: 4.4 % Spain: 1.5 %
South Korea: 3.4 % China: 1.5 %
Germany: 3.4 % Brazil: 1.2 %
Main import sources (2014, % of total)
Main export markets (2014, % of total)
Good:The credit risk situation in the sector is benign / business performance in the sector is above its long-term trend.
Fair:The credit risk credit situation in the sector is average / business performance in the sector is stable.
Poor: The credit risk situation in the sector is relatively high / business performance in the sector is below long-term trend.
Bleak:The cedit risk situation in the sector is poor / business performance in the sector is weak compared to its long-term trend.
Excellent:The credit risk situation in the sector is strong / business performance in the sector is strong compared to its long-term trend.

7
Main economic developments Low structural growth in the last 20 years
Mexico’s economy is highly dependent on oil (accounting for more than 30 % of government revenues) and closely linked to the US business cycle, which accounts for 80 % of Mexican exports. Since 1994, GDP growth has been struc-turally low at an average annual rate of 2.6 %, due to low investment and weak productivity.
A modest rebound expected in 2016 after subdued growth rates in 2014 and 2015
Since the second half of 2014, Mexico´s economic performance has been ham-pered by a more volatile global economic environment and domestic political woes. Since fall 2014, concerns over the security situation have grown, following the disappearance of 43 students in the city of Iguala. These were presumably kidnapped and killed by police forces in league with a regional drug cartel. Public discontent about the way president Peña Nieto handled the situation resulted in country-wide protests and falling approval ratings. Since then, several other crime-related incidents and corruption scandals have weighed negatively on business and consumer confidence, affecting domestic demand. Industrial production remains subdued, and is expected to grow only 0.3 % in 2015. This, combined with fiscal consolidation measures aimed at the negative impact of lower oil prices on government finances, has resulted in sluggish real GDP in H1 of 2015.
That said, real exports have picked up again since the beginning of 2015, as Mexico benefits from the robust performance of the US economy. Domestic de-mand is expected to increase as inflation decreases. In 2016, economic growth is forecast to reach 2.8 % after a growth of 2.3 % in 2015.
Sound fiscal policies to counter the oil price decrease
Overall, Mexico’s budgetary policy has been solid, with acceptable public sector finances (government debt of 50 % of GDP and a budget deficit of 3.0 % of GDP in 2015). There have been improvements in the fiscal framework and higher tax revenues, following a tax reform passed in 2013.
However, fiscal flexibility is still constrained by low tax revenues (Mexico has a narrow tax base of only 10 %) and the structural decrease in oil revenues. With oil accounting for about a third of government revenues, decreased oil prices are putting pressure on government finances and complicating the implementation of energy reforms.
Nevertheless, oil price hedges limit the effect of the recent decline in oil prices on government finances. At the same time, budget cuts have been implemented and the bidding process for exploration and exploitation of oil fields by private companies has been kept on track. Public debt is expected to peak at 52 % of GDP in 2016.
5
4
3
2
1
0
2012 2013 2014 2015e 2016f
Sources: EIU, IHS, IMF
4.0
1.4
2.12.3
2.8
Real GDP growth(y-on-y, % change)
2012 2013 2014 2015e 2016fSources: EIU, IHS
Industrial production (y-on-y, % change)
3
2
1
0
-1
-2
-3
2.92.1
-0.6
0.3
1.9
2012 2013 2014 2015e 2016fSources: EIU, IHS, IMF
Fiscal balance (% of GDP) 0
-1
-2
-3
-4
-5
-2.6-2.8
-2.5-3.0-3.2

8
Monetary policy helps to spur growth
The Bank of Mexico has kept the benchmark interest rate at a record low of 3 % since June 2014 in order to boost economic growth, while inflation remains below its target range of 2 %-4 % (a 2.7 % increase in consumer prices is forecast for 2015). That said, the concern remains that an increase of US interest rates by the Federal Reserve could spur foreign investors to withdraw capital, leading the Bank of Mexico to follow suit.
Solid bank sector, but performance is below potential
In general, Mexico’s banks are well capitalised and liquid, with limited expo-sure to foreign currency risks. However, they are performing below potential (bank assets as a percentage of GDP stand at just 45 %), constraining the credit growth needed to stimulate more private consumption. A cautious lending poli-cy is also restricting financing options for small and medium-sized enterprises.
Crucial reforms have been passed
Since 2013 the Peña Nieto administration and the Mexican Congress have passed some comprehensive reforms to overcome the economy´s structural weaknesses: low earnings capacity, limited fiscal flexibility and high dependen-cy on volatile portfolio capital inflows. In the past, reform efforts have often failed because of a lack of political will or insufficient support from opposition parties in Congress, in effect, impeding economic efficiency and longer-term GDP growth.
Despite some public protests, an education reform bill was passed in early 2013. This was followed by bills to liberalise the telecommunications market, to re-form the tax system to broaden the narrow tax base, and to open the monopo-lised electricity market.
However, with oil production decreasing over the last 10 years and the government´s high dependence on oil revenues, the centrepiece of the reform efforts is the reorganisation of the energy sector. Pemex, the state-owned oil and gas company, lacks the know-how and financial resources to invest in exploration and production, mainly because it pays 90% of its revenues to the state. Pemex therefore urgently needed permission to cooperate with private (foreign) investors for joint exploration, refining and distribution. Finally, the constitutional changes implemented at the end of 2014 have put an end to Pemex’s 75-year monopoly and enabled foreign companies to invest in the exploitation of offshore oil fields and shale gas.
Although the first auction of shallow water oil fields held in July 2015 failed, the government proved to be a quick learner as it adjusted contract terms to make fields more investors-friendly, thereby showing its continued commitment to these important reforms. A second auction held in September 2015 went much better, with three of the five fields being sold. One of them was purchased by Eni of Italy, which was a welcome sign of faith from one of the world’s energy majors. These fields are expected to generate a peak of 90,000 barrels per day of light and medium crude oil by 2022 and to reverse the downward trend in oil production by 2018.
Reorganisation of the energy sector is the centrepiece of reform efforts.

9
Proper implementation of reforms is key
A comprehensive and swift implementation of the reforms would increase investment and significantly improve the economy´s productivity and compe-titiveness, raising Mexico´s potential annual GDP growth rate from 3.0 %-3.5 % to 4 %-5 % in the long term. Lower energy and electricity costs should increase the productivity and profitability of Mexican industries, especially export driven ones such as the automotive industry. Moreover, it would boost foreign direct investment and reduce dependency on volatile portfolio capital inflows.
However, proper implementation is key (e.g. transparent bidding processes). It remains to be seen to what degree the big state-owned electricity and energy businesses are willing to accept competition and end their monopolies. Public protests and political struggles between the main parties could still derail pro-per implementation.
More needs to be done to tackle the poor domestic security linked to drug-related violence and rampant corruption, both of which severely affect the business climate and hamper economic performance by discouraging investors. At the same time, the profitability of many businesses has suffered from threats and violence against business owners, including the kidnapping of their family members. For a solid recovery of the country’s medium-term earnings capacity, Mexico would need to improve its law enforcement, the independence of the judiciary system and to overhaul police institutions. In this respect, the approval of a comprehensive anti-corruption law by the Mexican Congress is another step in the right direction.
A strong position to deal with external challenges
In general, Mexico´s economy is well positioned to deal with the current chal-lenges stemming from decreased oil prices, a stronger USD and the expected increase in US interest rates (potentially leading to higher exchange rate volati-lity). Its resilience is underpinned by prudent macroeconomic policies, a flexible exchange rate and solid external balances, with limited current account deficits and external refinancing needs.
Depreciation of the Mexican peso against the USD could pose a challenge for businesses that have increased their USD borrowing over the past years. That said, corporate debt is still low, at 21 % of GDP. About two-thirds of this debt is being externally financed, and refinancing risks are being mitigated by suffi-cient foreign exchange reserves to cover imports for more than five months. There is additional liquidity potential from a precautionary IMF credit line of USD 70 billion on which Mexico can draw in times of adverse global credit conditions. Solvency is also robust: foreign debt ratios are under control (44% of GDP, 110% of exports).
2012 2013 2014 2015e 2016fSources: EIU, IHS, IMF
Current account (% of GDP)
0
-1
-2
-3
-4
-5
-1.3
-2.2-2.4 -2.2-2.1
2012 2013 2014 2015e 2016fSources: EIU, IHS, IMF
International reserves (in months of merchandise imports)
10
8
6
4
2
0
4.9 5.15.4 5.55.8
Drug-related violence and corruption remain major stumbling blocks for more investment.

10
Key indicators 2012 2013 2014 2015* 2016**
Real GDP (y-on-y, % change) 2.2 1.5 2.4 2.5 2.8
Consumer prices (y-on-y, % change) 2.1 1.5 1.6 0.1 1.6
Private consumption (y-on-y, % change) 1.5 1.7 2.7 3.1 3.2
Retail sales (y-on-y, % change) 2.7 2.4 2.2 2.0 2.9
Industrial production (y-on-y, % change) 2.8 1.9 3.7 1.3 1.6
Unemployment rate (%) 8.1 7.4 6.2 5.4 5.2
Real fixed investment (y-on-y, % change) 6.3 2.4 4.1 4.4 5.9
Exports of goods and non-factor services 3.4 2.8 3.4 1.7 3.7(y-on-y, % change)
Fiscal balance (% of GDP) -7.9 -4.4 -3.8 -3.4 -3.8
Government debt (% of GDP) 120.2 121.8 121.5 120.4 120.6
* estimate **forecast Source: IHS
US industries performance forecast
Agriculture
Electronics/ICT
Automotive/Transport
Financial Services
Chemicals/Pharma
Food
Construction
Machines/Engineering
ConstructionMaterials
ConsumerDurables
Paper Services Steel TextilesMetals
November 2015
USAChina: 19.9% Canada: 19.2%
Canada: 14.8% Mexico: 14.8%
Mexico: 12.5% China: 7.6%
Japan: 5.7% Japan: 4.1%
Germany: 5.2% United Kingdom: 3.3%
Main import sources (2014, % of total)
Main export markets (2014, % of total)
Good:The credit risk situation in the sector is benign / business performance in the sector is above its long-term trend.
Fair:The credit risk credit situation in the sector is average / business performance in the sector is stable.
Poor: The credit risk situation in the sector is relatively high / business performance in the sector is below long-term trend.
Bleak:The cedit risk situation in the sector is poor / business performance in the sector is weak compared to its long-term trend.
Excellent:The credit risk situation in the sector is strong / business performance in the sector is strong compared to its long-term trend.

11
USA: developments in some main sectorsAutomotive
The US automotive sector is performing well, with new car sales approaching pre-recession levels, driven by the robust economic performance and improved consumer confidence. The aftermarket segment remains stable, aided by lower fuel prices. Gross margins of automotive businesses are expected to remain stable in the coming months as the industry benefits from lower raw material prices. However, at the same time there is some headwind from a stronger USD. The average payment duration in the US automotive industry ranges from 30 to 60 days. Payment behaviour in this sector has been rather good over the past two years. The number of protracted payments, non-payments and insolvency cases is low. Given the positive performance outlook, we expect the current in-solvency rate to remain stable. Due to the generally benign indicators, we assess the credit risk and business performance of the automotive sector to be good, and our underwriting stance continues to be open. However, we generally have a neutral underwriting stance on the alternative fuel vehicles segment, which is currently impacted by low oil prices and a lack of infrastructure/charging points.
Construction
The US construction sector is benefiting from robust household consump-tion as demand for new housing is increasing. Non-residential construction also showed satisfying performance. That said, downward pressure on many businesses´ revenues remains, and increasing salaries, healthcare costs for staff and miscellaneous expenses continue to tighten margins. Banks are principally willing to lend to the construction industry, but only for viable and promising projects. Construction insolvencies have continued to improve overall in the US in 2015, however, small businesses in the industry are generally still paying later and have higher bankruptcy rates and more delinquent debt than other indust-ries. The decreasing trend in insolvencies is expected to continue in the coming months. Due to the positive development, we have steadily increased our cover for this industry over the past few years.
Retail/consumer durables
The general outlook for the US retail and consumer durables industry remains positive, given the continued increase in US consumer spending. Home products companies generate about half of the consumer durables retail sector´s revenue and operating profit. Specific industry subsectors may be viewed more positively than others, e.g. solid home sales should support demand for furniture and other home goods. Online sales, which average about 5% of total sales, are expected to remain the fastest growing segment of the retail industry and shift the retail landscape. Merger and acquisition activity will remain high as companies seek to turn their stable margins and stronger balance sheets into enhanced product portfolios with greater geographic diversity. Despite the generally good outlook for consumer durables retail, there is always the risk that sales prices may suffer if demand unexpectedly slows and compe-tition intensifies. While high earners continue to spend, thanks to gains in the housing and equity markets, many lower and middle-income consumers still remain cautious, partly due to the rising food and healthcare costs.
Despite the general upswing, the consumer durables retail sector continues to be characterised by increased competition and continued price and margin pressu-re. Therefore, businesses within the industry should be carefully evaluated and liquidity should be closely observed.
Payments in the US automotive industry take 30 days on average.
Smaller construction businesses still have higher bankruptcy rates.
Fierce competition and continued price and margin pressure remain issues.

12
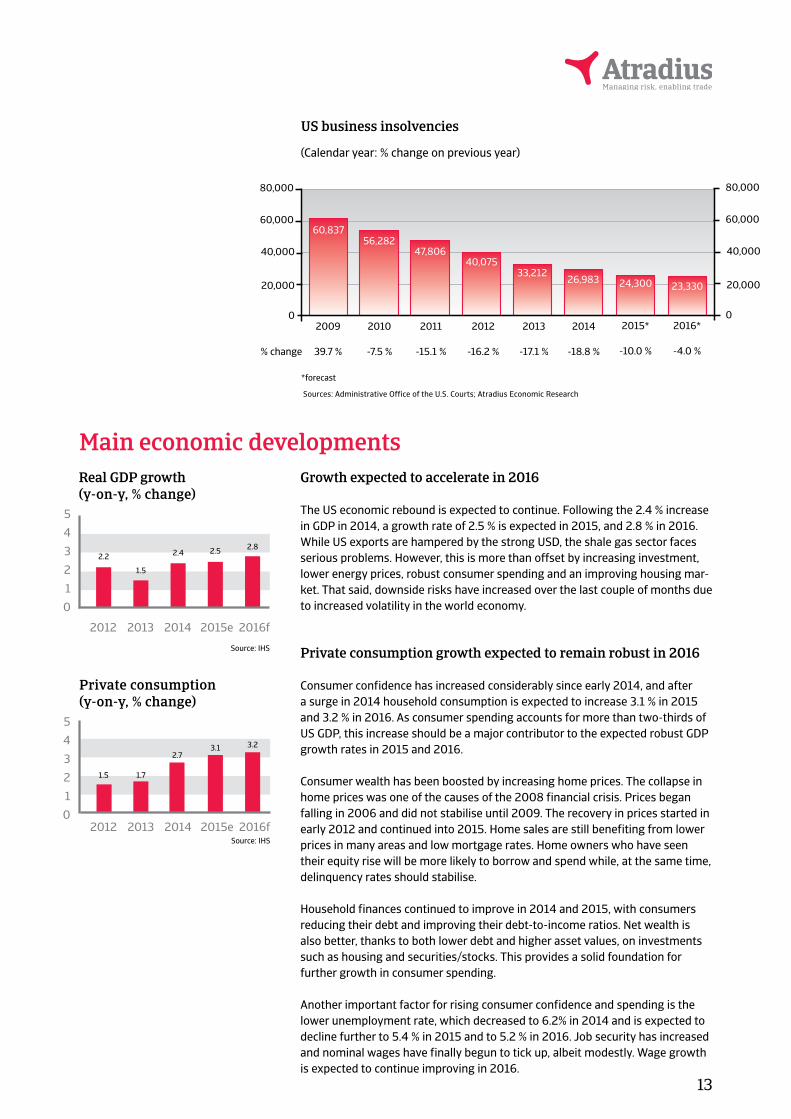
The insolvency environmentUS corporate insolvencies expected to decrease further in 2015 and 2016
After sharp year-on-year increases in 2008 and 2009, the number of corpo-rate insolvencies has steadily decreased every year since. According to figures provided by the US Courts, the number of business bankruptcies filed in Federal Courts declined 18.8 % year-on-year in 2014, to 26,983 cases.
We expect this positive downward trend to continue in 2015 and 2016 due to the anticipated continuation of economic growth (see economic report below). However, the pace of decline in insolvencies is forecast to slow down.
(1 year trailing sum of insolvency counts, quarterly data)
Insolvency trends: United States
The insolvency environment US corporate insolvencies expected to decrease further in 2015 and 2016 After year-on-year increases of more than 40% in 2008 and 2009, the number of corporate insolvencies has steadily decreased every year since. According to figures provided by the US Courts, the number of business bankruptcies filed in Federal Courts declined 18.8% year-on-year in 2014, to 26,983 cases. We expect this positive downward trend to continue in 2015 and 2016 due to the anticipated continuation of economic growth (see economic report below). However, the pace of decline in insolvencies is forecast to slow down. Bitte diese Graphik einfügen
Sources: Administrative Office of the U.S. Courts; IHS Bitte Graphik einfügen US business insolvencies (Calendar year: % change on previous year) Sources: Administrative Office of the U.S. Courts; Atradius Economic Research
Steel and metals
Currently, the revenue performance of the US steel and metals sectors is ne-gatively affected by the lower cost of imported (Chinese) steel and decreasing demand from the oil/gas industry, which suffers from the oil price decline. The latter particularly affects the oil country tubular goods (OCTG) sector. Profit margins of steel and metals businesses have decreased over the last 12 months due to the negative impact lower import pricing has had on the sector, and this declining trend is expected to continue. Competition is increasing, as companies try to expand their regional reach (local to regional, regional to national) in order to find new business and increase revenues and profits. Financing requirements and gearing are generally high in this industry. Payment delays and defaults have increased and are expected to rise further, as the cash flow of end-buyers has been impacted by lower growth, especially in the OCTG sector. Insolven-cies have increased in the OCTG-related segment and are expected to increase further in 2015, by about 10 % - 15 %.
Sources: Administrative Office of the U.S. Courts; IHS
Rising insolvencies in the oil sector-related segments.
Pace of insolvency decrease expected to slow down.
13
2012 2013 2014 2015e 2016fSource: IHS
Private consumption(y-on-y, % change)
5
4
3
2
1
0
1.5
3.2
1.7
3.12.7
Main economic developments Growth expected to accelerate in 2016
The US economic rebound is expected to continue. Following the 2.4 % increase in GDP in 2014, a growth rate of 2.5 % is expected in 2015, and 2.8 % in 2016. While US exports are hampered by the strong USD, the shale gas sector faces serious problems. However, this is more than offset by increasing investment, lower energy prices, robust consumer spending and an improving housing mar-ket. That said, downside risks have increased over the last couple of months due to increased volatility in the world economy.
Private consumption growth expected to remain robust in 2016
Consumer confidence has increased considerably since early 2014, and after a surge in 2014 household consumption is expected to increase 3.1 % in 2015 and 3.2 % in 2016. As consumer spending accounts for more than two-thirds of US GDP, this increase should be a major contributor to the expected robust GDP growth rates in 2015 and 2016.
Consumer wealth has been boosted by increasing home prices. The collapse in home prices was one of the causes of the 2008 financial crisis. Prices began falling in 2006 and did not stabilise until 2009. The recovery in prices started in early 2012 and continued into 2015. Home sales are still benefiting from lower prices in many areas and low mortgage rates. Home owners who have seen their equity rise will be more likely to borrow and spend while, at the same time, delinquency rates should stabilise.
Household finances continued to improve in 2014 and 2015, with consumers reducing their debt and improving their debt-to-income ratios. Net wealth is also better, thanks to both lower debt and higher asset values, on investments such as housing and securities/stocks. This provides a solid foundation for further growth in consumer spending.
Another important factor for rising consumer confidence and spending is the lower unemployment rate, which decreased to 6.2% in 2014 and is expected to decline further to 5.4 % in 2015 and to 5.2 % in 2016. Job security has increased and nominal wages have finally begun to tick up, albeit modestly. Wage growth is expected to continue improving in 2016.
5
4
3
2
1
0
2012 2013 2014 2015e 2016f
Source: IHS
2.2
1.5
2.4 2.5 2.8
Real GDP growth(y-on-y, % change)
0
40,000 40,000
20,000 20,000
60,000 60,000
80,000 80,000
Sources: Administrative Office of the U.S. Courts; Atradius Economic Research
*forecast
(Calendar year: % change on previous year)
US business insolvencies
% change
2009
39.7 %
2010
-7.5 %
2011
-15.1 %
2012
-16.2 %
2013
-17.1 %
2014
-18.8 %
0
40,07533,212
26,983
60,83756,282
47,806
2015* 2016*
-10.0 % -4.0 %
24,300 23,330

14
2012 2013 2014 2015e 2016fSource: IHS
Industrial production (y-on-y, % change)
5
4
3
2
1
0
2012 2013 2014 2015e 2016fSource: IHS
Real fixed investment (y-on-y, % change)
10
8
6
4
2
0
2.8
1.61.91.3
3.7
6.3 5.9
2.4
4.44.1
Additionally, household consumption is aided by the strong USD, low inflation and low interest rates. Due to the low interest rate environment US consumers have increased their purchases of big-ticket items like cars and houses. The US consumer price index (CPI) is forecast to decline to 0.1 % in 2015.
The CPI has decreased since mid-2014 as a result of declining oil prices. The decrease in oil prices is, on balance, positive for the US economy. Due to a strong increase in production over the past couple of years, the US is currently self-suf-ficient in oil. While the lower oil price reduces the profits of producers, it benefits consumers, who are more likely to spend the extra money.
However, a downside risk for household consumption growth in 2016 could be larger stock market volatility, given the relatively high exposure to equities through investments and/or retirement savings.
Decreasing exports hurt the manufacturing sector
US companies are expected to continue to benefit from low financing costs as it is anticipated that the Federal Reserve will be cautious in raising interest rates later this year with inflation being low and the value of the dollar rising.
However, the strong USD continues to hurt US export businesses, with their pro-fit levels decreasing further. US exports contracted in H1 of 2015, partially due to the fact that the increasing strength of the USD hurts the international competi-tiveness of US exporters. In real effective terms, the USD has appreciated more than 10 % since mid-2014. There is decreased demand for US exports in key markets like Canada (whose currency has depreciated sharply against the USD) and China, where economic growth has slowed down. This adverse development mainly affects the manufacturing sector. Industrial production growth is expec-ted to slow down in 2015 and 2016.
After a low growth rate of 1.7 % in 2015 exports are currently expected to grow 3.7 % in 2016. However, this forecast could prove to be overly optimistic if the USD appreciates further and external demand from emerging markets continues to decrease.
Investment set to improve
In the first half of 2015 business investment remained subdued as the US energy sector adjusts to the low oil prices. However, investment in business equipment has recovered in Q3 of 2015 indicating businesses are optimistic in the face of weak external conditions. Real fixed investment is expected to grow 4.4 % in 2015 and even by more than 5% in 2016. However, capital spending in the oil sector will remain subdued due to the plunge in oil prices.
An interest rate increase in early 2016?
Throughout the first half of 2015, the continued robust GDP growth cemented predictions that the Federal Reserve (Fed) would raise the low interest rate of 0.25 % set in September 2015. However, uncertainty regarding the global mar-kets and its potential effects on US growth has motivated the Fed to delay an interest rate increase again in its September and October meetings.

15
2012 2013 2014 2015e 2016fSource: IHS
Fiscal balance (% of GDP)0
-2
-4
-6
-8
-10-7.9
-3.8-4.4
-3.4-3.8
It remains to be seen if the Fed will still increase interest rates in 2015, given the more volatile global economic environment and the low inflation rate, which currently is still far below the Fed´s 2 % target. At the same time, despite decreasing unemployment, the labour market is still not performing at a level strong enough to offer enough confidence to pursue a rate hike. The labour participation rate has steadily decreased since 2008, to 62 %, the lowest rate the US has seen since 1977. This decline can be partially attributed to changing demographics (the aging population). Lower participation in the labour force is a significant driver of declining unemployment, so until these numbers become more robust, the Fed is likely to remain hesitant.
With diminished threats of external shocks for the US economy, inflation is expected to increase again while the wage growth and the participation rate in the labour force are forecast to improve in the coming months. This would lead to the Fed increasing interest rates in late 2015/early 2016.
Public deficit decreases, but government debt remains high
As a result of the 2008 financial crisis, both government debt and the budget deficit increased sharply from 2009 to 2011. After reaching 4.4 % of GDP in 2014, the budget deficit is expected to decrease in 2015, to 3.8 % of GDP. Howe-ver, government debt remains high, at 120 % of GDP.
The political struggle over government finances still remains a potential risk to the US economic outlook in the mid and long term. The dispute between Republicans and Democrats in the US Congress over government policy and the fiscal budget led to a temporary shutdown of the government in autumn 2013. Congress has not yet reached a long-term solution, and the unwillingness to make concessions has proven to be a stumbling block to comprehensive budget consolidation.
That said, end of October 2015 the Republicans in the US Congress have reached a compromise budget deal with the White House to avert the prospect of a renewed government shutdown. This agreement will last until March 2017. The agreement raises the debt ceiling and increases the budget.

If you’ve found this country report useful, why not visit our website www.atradius.com, where you’ll find many more Atradius publications focusing on the global economy, including more country reports, industry analysis, advice on credit management and essays on current business issues.
On Twitter? Follow @Atradius or search #countryreports to stay up to date with the latest edition.
Connect with Atradius on Social Media
Atradius N.V.David Ricardostraat 1 – 1066 JS Amsterdam
Postbus 8982 – 1006 JD AmsterdamThe Netherlands
Phone: +31 20 553 [email protected]
@atradius Atradius atradius
DisclaimerThis report is provided for information purposes only and is not intended as a recommendation as to particular transactions, investments or strategies in any way to any reader. Readers must make their own independent decisions, commercial or otherwise, regarding the information provided. While we have made every attempt to ensure that the information contained in this report has been obtained from reliable sources, Atradius is not responsible for any errors or omissions, or for the results obtained from the use of this information. All information in this report is provided ’as is’, with no guarantee of completeness, accuracy, timeliness or of the results obtained from its use, and without warranty of any kind, express or implied. In no event will Atradius, its related partnerships or corporations, or the partners, agents or employees thereof, be liable to you or anyone else for any decision made or action taken in reliance on the information in this report or for any consequential, special or similar damages, even if advised of the possibility of such damages.
Copyright Atradius N.V. 2015


