
ATMOSPHERIC IMPACT REPORT: GfE-MIR Alloys and …
107
Address: 480 Smuts Drive, Halfway Gardens | Postal: P O Box 5260, Halfway House, 1685 Tel: +27 (0)11 805 1940 | Fax: +27 (0)11 805 7010 www.airshed.co.za ATMOSPHERIC IMPACT REPORT: GfE-MIR Alloys and Minerals (Pty) Ltd Ekurhuleni, Gauteng Province Project done on behalf of Savannah Environmental (Pty) Ltd Project Compiled by: T Bird A Bruwer Project Manager T Bird Report No: 17SAV28 Revision 1.3 | Date: June 2019
Transcript of ATMOSPHERIC IMPACT REPORT: GfE-MIR Alloys and …

Address: 480 Smuts Drive, Halfway Gardens | Postal: P O Box 5260, Halfway House, 1685 Tel: +27 (0)11 805 1940 | Fax: +27 (0)11 805 7010
www.airshed.co.za
ATMOSPHERIC IMPACT REPORT: GfE-MIR Alloys and Minerals (Pty) Ltd
Ekurhuleni, Gauteng Province
Project done on behalf of Savannah Environmental (Pty) Ltd
Project Compiled by: T Bird
A Bruwer
Project Manager T Bird
Report No: 17SAV28 Revision 1.3 | Date: June 2019

GfE-MIR Alloys and Minerals (Pty) Ltd
Report No.: 17SAV28 Revision 1.3 Final i
Report Details
Project Name GfE-MIR Alloys and Minerals (Pty) Ltd
Client Savannah Environmental
Report Number 17SAV28
Report Version Revision 1.3 Final
Date June 2019
Prepared by T Bird, Pr. Sci. Nat., PhD (Wits)
André Bruwer, M.Eng. (University of Pretoria)
Reviewed by Renee von Gruenewaldt (Pr. Sci. Nat.), MSc (University of Pretoria)
Notice
Airshed Planning Professionals (Pty) Ltd is a consulting company located in Midrand, South Africa, specialising in all aspects of air quality, ranging from nearby neighbourhood concerns to regional air pollution impacts as well as noise impact assessments. The company originated in 1990 as Environmental Management Services, which amalgamated with its sister company, Matrix Environmental Consultants, in 2003.
Declaration Airshed is an independent consulting firm with no interest in the project other than to fulfil the contract between the client and the consultant for delivery of specialised services as stipulated in the terms of reference.
Copyright Warning
Unless otherwise noted, the copyright in all text and other matter (including the manner of presentation) is the exclusive property of Airshed Planning Professionals (Pty) Ltd. It is a criminal offence to reproduce and/or use, without written consent, any matter, technical procedure and/or technique contained in this document.
Revision Record
Revision Number Date Reason for Revision
Draft 7 May 2019 Draft for client review
Revision 1 28 May 2019 Minor typographical updates, updates to enterprise details (Section1), process description (Section 2), and raw material production rates (Section 3).
Revision 1.1 12 June 2019 Process description update and inclusion of non-routine unit processes.
Revision 1.2 26 June 2019 Minor changes to design capacity processing rates
Revision 1.3 28 June 2019 Update applicant name on maps. Include dust management plan as Annexure C.

GfE-MIR Alloys and Minerals (Pty) Ltd
Report No.: 17SAV28 Revision 1.3 Final ii
Abbreviations
AEL Atmospheric Emissions Licence
AERMOD A dispersion modelling suite; see p17
AIR Atmospheric Impact Report
Airshed Airshed Planning Professionals (Pty) Ltd
AMS American Meteorological Society
AQMS Air quality monitoring station
AQO Air Quality Officer
AQSRs Air Quality Sensitive Receptor(s)
AST Anemometer starting threshold
ASTM American Society Testing and Materials (now ASTM International)
CALEPA Californian Environmental Protection Agency
DEA Department of Environmental Affairs
EIA Environmental Impact Assessment
HPA Highveld Priority Area
IRIS Integrated Risk Information System
MES Minimum Emission Standards (as defined in Section 21 of the National Environmental Management Air Quality Act)
NAAQ Limit National Ambient Air Quality Limit concentration
NAAQS National Ambient Air Quality Standards (as a combination of the NAAQ Limit and the allowable frequency of exceedance)
NAEIS National Atmospheric Emissions Inventory System
NDCR National Dust Control Regulations
NEMAQA National Environmental Management Air Quality Act
NPi Australian National Pollution Inventory (published by the Australian Department of the Environment)
OEHHA (CALEPA) Office of Environmental Health Hazard Assessment
ORTIA OR Tambo International Airport
SAAELIP South African Atmospheric Emission Licencing and Inventory Portal
SAAQIS South African Air Quality Information System
SAWS South African Weather Services
TCEQ ESL Texas Commission on Environmental Quality Effects Screening Level
URF Unit Risk Factor
US ATSDR United States Agency for Toxic Substances and Disease Registry
US EPA United States Environmental protection Agency
WHO World Health Organisation

GfE-MIR Alloys and Minerals (Pty) Ltd
Report No.: 17SAV28 Revision 1.3 Final iii
Glossary Air pollution(a) The presence of substances in the atmosphere, particularly those that do not occur naturally
Dispersion(a) The spreading of atmospheric constituents, such as air pollutants
Dust(a) Solid materials suspended in the atmosphere in the form of small irregular particles, many of which are microscopic in size
Frequency of exceedance
Permissible margin of tolerance of the Limit Concentration
Instability(a) A property of the steady state of a system such that certain disturbances or perturbations introduced into the steady state will increase in magnitude, the maximum perturbation amplitude always remaining larger than the initial amplitude
Limit Concentration Maximum allowable concentration of a pollutant applicable for an applicable averaging period
Mechanical mixing(a) Any mixing process that utilizes the kinetic energy of relative fluid motion
Oxides of nitrogen (NOx)
The sum of nitrogen oxide (NO) and nitrogen dioxide (NO2) expressed as nitrogen dioxide (NO2)
Particulate matter (PM)
Total particulate matter, that is solid matter contained in the gas stream in the solid state as well as insoluble and soluble solid matter contained in entrained droplets in the gas stream
PM10 Particulate Matter with an aerodynamic diameter of less than 10 μm
PM2.5 Particulate Matter with an aerodynamic diameter of less than 2.5 μm
Stability(a) The characteristic of a system if sufficiently small disturbances have only small effects, either decreasing in amplitude or oscillating periodically; it is asymptotically stable if the effect of small disturbances vanishes for long time periods
Standard A combination of the Limit Concentration and the allowable frequency of exceedance
Notes:
(a) Definition from American Meteorological Society’s glossary of meteorology (AMS, 2014)

GfE-MIR Alloys and Minerals (Pty) Ltd
Report No.: 17SAV28 Revision 1.3 Final iv
Symbols and Units
°C Degree Celsius
CO Carbon monoxide
g Gram(s)
g/s Grams per second
ha Hectare
kg Kilograms
1 kilogram 1 000 grams
km Kilometre
m Metres
mamsl Metres above mean sea level
m/s Metres per second
µg Microgram(s)
µg/m³ Micrograms per cubic metre
µm Micrometre
m² Square metre
m3 Cubic metre
m3/hr Cubic metre per hour
mg/m2.day Milligram per square metre per day
mg/Am3 Milligram per actual cubic metre
mg/Nm3 Milligram per normal cubic metre (normalised at 273 K; 101.3 kpa)
m3/hr Cubic metre per hour
mm Millimetres
NO2 Nitrogen dioxide
NOx Oxides of nitrogen
O3 Ozone
PM10 Thoracic particulate matter (aerodynamic diameter less than 10 µm)
PM2.5 Inhalable particulate matter (aerodynamic diameter less than 2.5 µm)
SO2 Sulfur dioxide (1)
t/a Tonnes per annum
TOC Total Organic Compounds
TSP Total Suspended Particulates
TVOC Total Volatile Organic Compounds
1 ton 1 000 000 grams
Notes:
(1) The spelling of “sulfur” has been standardised to the American spelling throughout the report. The International Union of Pure and Applied Chemistry, the international professional organisation of chemists that operates under the umbrella of UNESCO, published, in 1990, a list of standard names for all chemical elements. It was decided that element 16 should be spelled “sulfur”. This compromise was to ensure that in future searchable data bases would not be complicated by spelling variants. (IUPAC. Compendium of Chemical Terminology, 2nd ed. (the "Gold Book"). Compiled by A. D. McNaught and A. Wilkinson. Blackwell Scientific Publications, Oxford (1997). XML on-line corrected version: http://goldbook.iupac.org (2006) created by M. Nic, J. Jirat, B. Kosata; updates compiled by A. Jenkins. ISBN 0-9678550-9-8.doi: 10.1351/goldbook)"

GfE-MIR Alloys and Minerals (Pty) Ltd
Report No.: 17SAV28 Revision 1.3 Final v
Executive Summary
GfE-MIR buys, sells and processes minerals and alloys from its facility in Vulcania, Brakpan (Figure 1-3). The facility triggers
four Listed Activities according to Section 21 of the National Environmental Management Air Quality Act. In a metal recovery
process, waste aluminium beverage cans are milled to form an input to the alumino-thermic plant that produces a number of
ferroalloys. Some of the ferroalloys and other input raw materials, depending on client requirements, are subsequently mixed
and pressed into briquettes and dried prior to dispatch. The Listed Activities are supported by various unit processes including
crushing and screening; water-based separation units; as well as material storage, handling and warehousing. The GfE-MIR
facility will need to comply with the minimum emission standards applicable to the listed activity categories triggered by the
active processes. Criteria pollutants emitted during operation of the facility include sulfur dioxide (SO2), oxides of nitrogen
(NOX), particulate matter (PM10 and PM2.5), and carbon monoxide. The release of non-criteria pollutants and the impact of
nuisance dustfall associated with the processes were also considered.
Airshed Planning Professionals (Pty) Ltd (Airshed) was appointed by Savannah Environmental to conduct an air quality impact
assessment for the project. The main objective of the air quality study is to determine air quality related impacts as a result of
the GfE-MIR facility.
The terrain within the study domain is flat or gently sloping (less than 10%). The meteorological data set accessed for the
assessment was from the South African Weather Services (SAWS) OR Tambo International Airport (ORTIA) meteorological
station for the period 2016 to 2018. The ORTIA station wind field was dominated by winds from the north-west. Calm conditions
occurred less than 3% of the time.
The main background sources include: vehicle tailpipe emissions; household fuel combustion; industrial sources; biomass
burning (for example, veld fires); and, various miscellaneous fugitive dust sources. Concentrations of criteria pollutants, SO2
and NO2, measured at the Springs AQMS comply with NAAQS over all applicable averaging periods. Daily PM10
concentrations were in non-compliance with the applicable NAAQS during 2018, however, compliance with the annual NAAQS
was noted.
Dispersion modelling of the process related emissions associated with normal operation of the GfE-MIR facility:
• does not result in a substantive concentrations of criteria air pollutants (NO2, SO2, PM10, PM2.5, and CO).
o The impact of the facility, based on information available, is rated as LOW, however, some additional
mitigation is recommended.
• Similarly, the GfE-MIR facility does not result in a substantive non-criteria pollutant concentrations or nuisance
dustfall.
• Recommendations for ambient and source monitoring have been made to supplement the existing dust
management plan.
It is the opinion of the specialist that the project can be authorised, but that mitigation measures and monitoring be documented
implemented prior to expiration of a Provisional AEL (usually valid for 1 year), in order to meet the requirements of the listed
activity.

GfE-MIR Alloys and Minerals (Pty) Ltd
Report No.: 17SAV28 Revision 1.3 Final vi
Table of Contents
Introduction ................................................................................................................................................................................ 1
Background and Context....................................................................................................................................................... 1
Purpose and Scope............................................................................................................................................................... 1
1 Enterprise Details ............................................................................................................................................................. 2
1.1 Enterprise Details ................................................................................................................................................... 2
1.2 Location and Extent of the Plant ............................................................................................................................. 3
1.3 Description of Surrounding Land Use (within 5 km radius) .................................................................................... 3
1.4 Atmospheric Emission Licence and other Authorisations ....................................................................................... 3
2 Nature of the Process....................................................................................................................................................... 8
2.1 Process Description ................................................................................................................................................ 8
2.2 Listed Processes .................................................................................................................................................. 17
2.3 Unit Processes ..................................................................................................................................................... 17
3 Technical Information ..................................................................................................................................................... 19
3.1 Raw Material Used and Production Rates ............................................................................................................ 19
3.2 Production Rates .................................................................................................................................................. 20
4 Atmospheric Emissions .................................................................................................................................................. 22
4.1.1 Point Sources .................................................................................................................................................. 22
4.1.2 Fugitive Sources .............................................................................................................................................. 22
4.1.3 Emission Source Summary ............................................................................................................................. 28
4.2 Emergency Incidents ............................................................................................................................................ 29
5 Impact of Enterprise on the Receiving Environment ...................................................................................................... 30
5.1 Analysis of Emissions’ Impact on Human Health ................................................................................................. 30
5.1.1 Study Methodology .......................................................................................................................................... 30
5.1.2 Legal Requirements ......................................................................................................................................... 32
5.1.3 Atmospheric Dispersion Potential .................................................................................................................... 39
5.1.4 Ambient Air Quality Monitoring Data ................................................................................................................ 44
5.1.5 Dispersion Modelling Results – Normal Operations ........................................................................................ 50
5.1.6 Impact Significance Rating – Normal Operations ............................................................................................ 58
5.1.7 Qualitative Assessment – Other Development Phases ................................................................................... 59
5.2 Analysis of Emissions’ Impact on the Environment .............................................................................................. 62
5.2.1 Dustfall Rates .................................................................................................................................................. 62
5.2.2 Impact Significance Rating .............................................................................................................................. 62

GfE-MIR Alloys and Minerals (Pty) Ltd
Report No.: 17SAV28 Revision 1.3 Final vii
5.3 Main Findings ....................................................................................................................................................... 62
5.4 Recommendations ................................................................................................................................................ 63
5.4.1 Ambient Monitoring .......................................................................................................................................... 63
5.4.2 Source Monitoring ............................................................................................................................................ 64
6 Complaints ..................................................................................................................................................................... 65
7 Current or planned air quality management interventions.............................................................................................. 65
8 Compliance and Enforcement Actions ........................................................................................................................... 65
9 Additional Information..................................................................................................................................................... 66
Annexure A .............................................................................................................................................................................. 67
Annexure B .............................................................................................................................................................................. 68
References ............................................................................................................................................................................... 69
Appendix A: Impact Assessment Methodology ........................................................................................................................ 70
Appendix B: Authors Curriculum Vitae ..................................................................................................................................... 73
Annexure C: Dust Management Action Plan (2018) ................................................................................................................ 80

GfE-MIR Alloys and Minerals (Pty) Ltd
Report No.: 17SAV28 Revision 1.3 Final viii
List of Tables
Table 1-1: Enterprise details ...................................................................................................................................................... 2
Table 1-2: Contact details of responsible person....................................................................................................................... 2
Table 1-3: Location and extent of the plant ................................................................................................................................ 3
Table 1-4: List of nearest AQSRs .............................................................................................................................................. 7
Table 2-1: Listed activities ....................................................................................................................................................... 17
Table 2-2: The unit processes ................................................................................................................................................. 17
Table 3-1: Raw materials consumption rates ........................................................................................................................... 19
Table 3-2: Production rates ...................................................................................................................................................... 20
Table 3-3: By-products ............................................................................................................................................................. 21
Table 4-1: Parameters for point sources of atmospheric pollutant emissions at the facility .................................................... 23
Table 4-2: Atmospheric pollutant emission rates for the facility ............................................................................................... 23
Table 4-3: Point Source Emission Estimation Information ....................................................................................................... 25
Table 4-4: Area, volume and/or line source parameters .......................................................................................................... 25
Table 4-5: Fugitive source emissions rates ............................................................................................................................. 26
Table 4-6: Area Source Emission Estimation Information ....................................................................................................... 27
Table 4-7: Annual pollutant emission rates (by source group) [units: t/a] ................................................................................ 28
Table 5-1: Summary description of AERMOD model suite with versions used in the investigation ........................................ 31
Table 5-2: Simulation domain .................................................................................................................................................. 32
Table 5-3: Listed Activity Subcategory 4.1 ............................................................................................................................... 33
Table 5-4: Listed Activity Subcategory 4.9 ............................................................................................................................... 33
Table 5-5: Listed Activity Subcategory 4.11 ............................................................................................................................. 34
Table 5-6: Listed Activity Subcategory 4.21 ............................................................................................................................. 34
Table 5-7: National Ambient Air Quality Standards for criteria pollutants ................................................................................ 36
Table 5-8: Acceptable dustfall rates ......................................................................................................................................... 36
Table 5-9: Most stringent health-effect screening level identified for all non-criteria pollutants assessed ............................... 37
Table 5-10: Proposed unit risk factors for pollutants of interest in the current assessment ..................................................... 38
Table 5-11: Excess Lifetime Cancer Risk (New York Department of Health) .......................................................................... 38
Table 5-12: Monthly temperature summary (2016 - 2018) ...................................................................................................... 41
Table 5-13: Data availability at the Springs AQMS (2018) ...................................................................................................... 45
Table 5-14: Screening of non-criteria pollutants against health risk guidelines ....................................................................... 57
Table 5-15: Impact Significance Rating for Normal Operations ............................................................................................... 58
Table 5-16: Impact Significance Rating for Closure Phase ..................................................................................................... 59
Table 5-17: Impact Significance Rating for the No-Go / Shut-down option ............................................................................. 61

GfE-MIR Alloys and Minerals (Pty) Ltd
Report No.: 17SAV28 Revision 1.3 Final ix
List of Figures
Figure 1-1: Site Layout – No 2 Atomic Street ............................................................................................................................ 4
Figure 1-2: Site Layout – No 10 Atomic Street .......................................................................................................................... 5
Figure 1-3: Location of the map of the facility in relation to its surroundings ............................................................................. 6
Figure 2-1: Process flow diagram – Aluminium Granulation Plant 1 .......................................................................................... 8
Figure 2-2: Process flow diagram – Aluminium Granulation Plant 2 .......................................................................................... 9
Figure 2-3: Process flow diagram – Aluminium Telic Mills ......................................................................................................... 9
Figure 2-4: Process flow diagram – Alumino-thermic Mixing Plant .......................................................................................... 11
Figure 2-5: Process flow diagram – Alumino-thermic Plant ..................................................................................................... 11
Figure 2-6: Process flow diagram – Alumino-thermic Crushing Plant ...................................................................................... 12
Figure 2-7: Process flow diagram - Ball Mill ............................................................................................................................. 12
Figure 2-8: Process flow diagram – Separation Plant .............................................................................................................. 13
Figure 2-9: Process flow diagram – Briquetting Crushing and Screening Plant ...................................................................... 14
Figure 2-10: Process flow diagram – Briquetting Impact Crusher and Screening Plant .......................................................... 15
Figure 2-11: Process flow diagram – Roll Crusher .................................................................................................................. 15
Figure 2-12: Process flow diagram – Briquetting Plant 1 ......................................................................................................... 16
Figure 2-13: Process flow diagram – Briquetting Plant 2 ......................................................................................................... 17
Figure 5-1: Period average, day-time and night-time wind roses (measured data; 2016 to 2018) .......................................... 40
Figure 5-2: Seasonal wind roses (measured data; 2016 to 2018) ........................................................................................... 41
Figure 5-3: Monthly average temperature profile (measured data; 2016 to 2018; OR Tambo SAWS station) ........................ 42
Figure 5-4: Monthly rainfall figures (measured data; 2016 to 2018; OR Tambo SAWS station) ............................................. 43
Figure 5-5: Diurnal atmospheric stability (AERMET processed SAWS data, 2016 to 2018) ................................................... 44
Figure 5-6: Polar plots for Springs AQMS, 2018 ...................................................................................................................... 46
Figure 5-7: Time variation of SO2 concentrations at the Springs AQMS ................................................................................. 47
Figure 5-8: Time variation of NO2 concentrations at the Springs AQMS ................................................................................. 48
Figure 5-9: Time variation of PM10 concentrations at the Springs AQMS ................................................................................ 49
Figure 5-10: Simulated hourly average SO2 concentrations due to the GfE-MIR facility ......................................................... 50
Figure 5-11: Simulated daily average SO2 concentrations due to the GfE-MIR facility ............................................................ 51
Figure 5-12: Simulated annual average SO2 concentrations due to the GfE-MIR facility ........................................................ 51
Figure 5-13: Simulated hourly average NO2 concentrations due to the GfE-MIR facility ......................................................... 52
Figure 5-14: Simulated annual average NO2 concentrations due to the GfE-MIR facility ........................................................ 53
Figure 5-15: Simulated daily average PM10 concentrations due to the GfE-MIR facility .......................................................... 54
Figure 5-16: Simulated annual average PM10 concentrations due to the GfE-MIR facility ...................................................... 54
Figure 5-17: Simulated daily average PM2.5 concentrations due to the GfE-MIR facility ......................................................... 55
Figure 5-18: Simulated annual average PM2.5 concentrations due to the GfE-MIR facility ...................................................... 56
Figure 5-19: Simulated hourly average CO concentrations due to the GfE-MIR facility .......................................................... 57
Figure 5-20: Simulated daily dustfall rates as a result of GfE-MIR .......................................................................................... 62
Figure 5-21: Recommended dustfall monitoring locations ....................................................................................................... 64

GfE-MIR Alloys and Minerals (Pty) Ltd
Report No.: 17SAV28 Revision 1.3 Final i
NEMA Regulation (2017), Appendix 6 NEMA Regulations - Appendix 6 Relevant section in report
Details of the specialist who prepared the report. Report Details (page i)
The expertise of that person to compile a specialist report including curriculum vitae.
Appendix B: Authors Curriculum Vitae (page 70)
A declaration that the person is independent in a form as may be specified by the competent authority.
Report Details (page i)
An indication of the scope of, and the purpose for which, the report was prepared.
Background and Context (page 1)
Purpose and Scope (page 1)
An indication of quality and age of base data used. Section 5.1.2.6 and 5.1.4
A description of existing impacts on the site, cumulative impacts of the proposed development and levels of acceptable change.
Sections 5.1; 5.2; and, 5.4
The date and season of the site investigation and the relevance of the season to the outcome of the assessment.
A site investigation was undertaken 15 March 2018 and additional detailed information regarding normal operations was provided.
Description of the current land use in the region, simulations undertaken for the current operations and meteorological data included used in the study are considered representative of all seasons.
Sections 1.3, 1.4, 5.1.2.6 and 5.1.4.
A description of the methodology adopted in preparing the report or carrying out the specialised process.
Section 5.1.1: Study Methodology (page 30)
The specific identified sensitivity of the site related to the activity and its associated structures and infrastructure.
Section 1.4 (page 3)
An identification of any areas to be avoided, including buffers. Not applicable
A map superimposing the activity including the associated structures and infrastructure on the environmental sensitivities of the site including areas to be avoided, including buffers.
Section 1 (page 2)
A description of any assumptions made and any uncertainties or gaps in knowledge.
Sections 4 and 5.1.4
A description of the findings and potential implications of such findings on the impact of the proposed activity, including identified alternatives, on the environment.
Section 5.1: Analysis of Emissions’ Impact on Human Health (page 30)
Section 5.2: Analysis of Emissions’ Impact on the Environment: (page 62)
Section 5.4: Recommendations (page 63)
Any mitigation measures for inclusion in the EMPr. Section 5.4: Recommendations (page 63)
Any conditions for inclusion in the environmental authorisation Section 5.4: Recommendations (page 63)
Any monitoring requirements for inclusion in the EMPr or environmental authorisation.
Section 5.4: Recommendations (page 63)
A reasoned opinion as to whether the proposed activity or portions thereof should be authorised.
Section 5.3: Main Findings (page 62)
If the opinion is that the proposed activity or portions thereof should be authorised, any avoidance, management and mitigation measures that should be included in the EMPr, and where applicable, the closure plan.
Section 5.3: Main Findings (page 62)
A description of any consultation process that was undertaken during the course of carrying out the study.
Not applicable.
A summary and copies if any comments that were received during any consultation process.
Comments received will be dealt with by the EAP through the S&EIA process and will be recorded in the associated reports.
Any other information requested by the competent authority. None

GfE-MIR Alloys and Minerals (Pty) Ltd
Report No.: 17SAV28 Revision 1.3 Final 1
INTRODUCTION
Background and Context
GfE-MIR buys, sells and processes minerals and alloys from its facility in Vulcania, Brakpan (Figure 1-3). The facility triggers
four Listed Activities according to Section 21 of the National Environmental Management Air Quality Act. In a metal recovery
process, waste aluminium beverage cans are milled to form an input to the alumino-thermic plant that produces a number of
ferroalloys. Some of the ferroalloys and other input raw materials, depending on client requirements, are subsequently mixed
and pressed into briquettes and dried prior to dispatch. The Listed Activities are supported by various unit processes including
crushing and screening; water-based separation units; as well as material storage, handling and warehousing.
Airshed Planning Professionals (Pty) Ltd (Airshed) was appointed by Savannah Environmental to conduct an air quality impact
assessment for the facility. The main objective of the air quality study is to determine air quality related impacts as a result of
the GfE-MIR facility.
Purpose and Scope
The main purpose of the project is to develop an Atmospheric Impact Report (AIR) in support of the Atmospheric Emissions
License (AEL) application for the GfE-MIR facility. To successfully develop an AIR, the following tasks are included in the scope
of work:
1. Review of ambient air quality monitoring information (if available).
2. Review of guidelines and standards against which air emissions, ambient air quality and inhalation health impacts
are assessed and/or screened.
3. Study of physical environmental parameters that influence the dispersion of pollutants in the atmosphere, including
terrain, land use and meteorology.
4. Identification and quantification of routine air quality emissions from the storage facility.
5. Atmospheric dispersion modelling to determine ground level pollutant concentrations.
6. A health risk and environmental screening study based on predicted ground level pollutant concentrations in
comparison with selected air quality criteria.
7. A comprehensive report in the prescribed format of an AIR to support the application for an AEL.

GfE-MIR Alloys and Minerals (Pty) Ltd
Report No.: 17SAV28 Revision 1.3 Final 2
1 ENTERPRISE DETAILS
1.1 Enterprise Details
The details of the GfE-MIR Brakpan operations are summarised in Table 1-1. The contact details of the responsible person
are provided in Table 1-2.
Table 1-1: Enterprise details
Enterprise Name GfE-MIR Alloys and Minerals (Pty) Ltd
Trading as N/A
Type of Enterprise Proprietary Limited
Company Registration Number 2003/030762/07
Registered Address
5 Atomic street
Vulcania
Brakpan
1554
Telephone Number (General) (011) 740 1034
Industry Type/Nature of Trade Buy sell and process minerals and alloys for the steel and foundry
industries
Land Use Zoning as per Town Planning Scheme Industrial 2
Land Use Rights if Outside Town Planning Scheme N/A
Table 1-2: Contact details of responsible person
Responsible Person R K Symons
Telephone Number (011) 740 1034
Cell Number (083) 658 9798
Fax Number (011) 740 9051
Email Address [email protected]
After Hours Contact Details (083) 658 9798

GfE-MIR Alloys and Minerals (Pty) Ltd
Report No.: 17SAV28 Revision 1.3 Final 3
1.2 Location and Extent of the Plant
Table 1-3: Location and extent of the plant
Physical Address of the Plant
No 2 and No 10 Atomic street
Vulcania
Brakpan
1554
Description of Site (Where no Street Address) n/a
Coordinates of Approximate Centre of Operations Latitude: -26.253876°
Longitude: 28.367816°
Extent
No 2 Atomic street: 0.4 ha (Layout in Figure 1-1)
No 5 Atomic street: 1.07 ha (storage and administration)
No 10 Atomic street: 1.32 ha (Layout in Figure 1-2)
Elevation Above Sea Level 1 578 and 1 656 mamsl
Province Gauteng
Metropolitan/District Municipality City of Ekurhuleni
Local Municipality N/A
Designated Priority Area Highveld Priority Area
1.3 Description of Surrounding Land Use (within 5 km radius)
The GfE-MIR facility is located within the industrial area of Vulcania, Brakpan. The closest residential area (Brenthurst) is
located approximately 80 m to the north-east of the GfE-MIR boundary. In accordance with the Regulations Regarding Air
Dispersion Modelling (DEA, 2014), hospitals, clinics, and schools were identified as air quality sensitive receptors (AQSRs)
(Figure 1-3 and Table 1-4) and were included in the dispersion model setup as discrete receptors.
1.4 Atmospheric Emission Licence and other Authorisations
This report will accompany the AEL application.

GfE-MIR Alloys and Minerals (Pty) Ltd
Report No.: 17SAV28 Revision 1.3 Final 4
Figure 1-1: Site Layout – No 2 Atomic Street

GfE-MIR Alloys and Minerals (Pty) Ltd
Report No.: 17SAV28 Revision 1.3 Final 5
Figure 1-2: Site Layout – No 10 Atomic Street

GfE-MIR Alloys and Minerals (Pty) Ltd
Report No.: 17SAV28 Revision 1.3 Final 6
Figure 1-3: Location of the map of the facility in relation to its surroundings

GfE-MIR Alloys and Minerals (Pty) Ltd
Report No.: 17SAV28 Revision 1.3 Final 7
Table 1-4: List of nearest AQSRs
Receptor ID
Receptor details Distance from centre of
proposed site (m) Direction from proposed site
33 Life Occupational Healthcare Clinic 699 SE
4 Brenthurst Primary School 701 N
2 Brakpan High School 779 N
3 Dalpark Primary School 1,160 WSW
6 Laerskool Môrewag 1,191 ENE
5 Hoërskool Stoffberg 1,338 NW
1 Hoërskool Die Anker 1,595 ESE
23 Life Dalview Hospital 1,646 NW
19 Bouncing Bubbles Pre-School 1,925 W
36 Brakpan Medical Centre 1,943 N
21 Ons Kuier Plekkie 1,957 WNW
18 Volkskool Brakpan 2,485 WSW
32 Reedville Clinic 2,604 ESE
17 Impala Kleuterskool 3,183 SW
8 Theo-Twala Primary School 4,092 SE
35 Kwa-Thema Community Health Centre 5,034 SSE
12 Olympia Park High School 5,233 SE
34 Clinic - Kwa Thema X3 5,243 SSE
9 Tlakula Secondary School 5,309 SSE
14 Lefa-Ifa Secondary School 5,343 SE
13 Laban Motlhabi Comprehensive School 5,491 SE
31 San Michele Home 5,540 S
20 Curro Castle Helderwyk 6,052 WSW
7 Kwa-Thema Skills School 6,518 SE
11 Qedusizi Primary School 6,557 SSE
38 Thembelisha Clinic 7,076 SSE
15 Phelang School 7,090 SE
30 Unjani Clinic Langaville 7,189 SSE
37 Van Dyk Park Clinic 7,532 W
16 Kwa -Thema Primary School 7,901 SE
10 Zimisele High School 8,101 SE
22 Andries Raditsela Clinic 8,834 SSE

GfE-MIR Alloys and Minerals (Pty) Ltd
Report No.: 17SAV28 Revision 1.3 Final 8
2 NATURE OF THE PROCESS
2.1 Process Description
Aluminium granulation process
Used aluminium beverage cans (UBC) and telic (aluminium shavings) are the primary input for the Aluminium Plants. The
aluminium beverage cans do contain a small percentage of other items included in the sorting and baling process at the
supplier. These could include steel cans, non-beverage can aluminium, cardboard, etc. The cans are sorted and as far as
possible, all non-UBC is removed. Non-UBC is disposed of as follows:
• steel items are sold to scrap dealers;
• aluminium items (excluding cans) are sold to scrap dealers; and,
• domestic type waste such as paper or cardboard is sent to a landfill.
The purpose of the aluminium plants is to use UBC and Telic to produce clean aluminium granules of varying sizes ranging in
size from 0 mm to 20 mm. In order to achieve this, the UBC goes through the following process steps:
• pass through the de-baler (if baled cans are processed);
• pass through mills to cut the UBC up in to pieces;
• pass under a magnet to remove any steel;
• pass through the burner to remove the paint;
• pass through secondary mills to produce the final granules;
• passing through screens to separate the different sizes; and,
• rescreening of a small quantity of products on a small stand-alone trommel screen.
Aluminium Telic (fragments and shavings) are only passed through a mill to cut the aluminium into granules. Granules from
both the aluminium plants and telic mills are used as raw material in the alumino-thermic process and the briquetting process
or sold.
Process flow diagrams for the granulation process are provided in Figure 2-1 to Figure 2-3.
Figure 2-1: Process flow diagram – Aluminium Granulation Plant 1

GfE-MIR Alloys and Minerals (Pty) Ltd
Report No.: 17SAV28 Revision 1.3 Final 9
Figure 2-2: Process flow diagram – Aluminium Granulation Plant 2
Figure 2-3: Process flow diagram – Aluminium Telic Mills
Alumino-thermic process
The alumino-thermic plant produces a number of ferroalloys using an alumino-thermic process. The raw materials are mixed
together at the mixing plant before being transferred to the alumino-thermic plant, where the three outputs are produced:
different ferroalloys dependant on raw materials used, calcium aluminate, and, bag-house dust. Most of the ferroalloy
produced is sold, but a portion is moved to the briquetting plants and made into briquettes. The unit processes are described
below.
Mixing Plant
1. The raw materials are weighed on a platform scale before being loaded, by fork lift, into a feed bin.
2. The material is then transferred from the feed bin to a closed mixer using a conveyor.
3. The mixer is then run for approximately 10 minutes before dropping out into a bulk bag.
4. Bags of mixed raw materials are transferred, by fork lift, to the alumino-thermic plant.

GfE-MIR Alloys and Minerals (Pty) Ltd
Report No.: 17SAV28 Revision 1.3 Final 10
Sacrificial lining
1. Each ladle used in the alumino-thermic plant is lined with a spray on sacrificial lining. The purpose of this lining is to
prevent the metal and calcium aluminate from sticking in the ladle and damaging the refractory lining when removed.
2. The lining is a mixture of refractory and calcium aluminate and water.
3. The lining is dried using the retained heat in the refractory from the previous day’s production.
Calcining Plant
1. The raw material to be calcined is milled to less than 2 mm.
2. The raw material is loaded, by fork lift, into a feed bin, and then into the calcining tube using a conveyor.
3. The calcining tube is heated to approximately 850°C. Due to the heat in the tube, some of the oxygen is removed
from material, changing manganese dioxide (MnO2) to manganese oxide (Mn3O4).
4. The calcining tube slowly rotates moving the material slowly down the chute and falls out the other end.
Alumino-thermic Plant
1. The mixed raw materials from the mixing plant are weighed and loaded into a feed bin.
2. A small amount of mix is placed in a refractory-lined ladle that is placed in the burning chamber. This raw material
is then ignited.
3. Once the material inside the ladle is burning, raw material is slowly and continuously fed into the ladle. This material
burns as it enters the vessel. The feed is stopped when the ladle is almost full.
4. The materials continue to burn for a short period of time, and when the reaction is complete the ladle is removed
from the chamber and left to cool over-night.
5. The following day the ladle is turned over, using a forklift, and the contents removed.
6. The metal is then separated from the calcium aluminate by hand.
Crushing Plant
1. The material is fed into a feed bin using a front-end loader.
2. From the feed bin into the primary crusher via a conveyor.
3. From the crusher the material is moved on a conveyor into a second feed bin.
4. From the second feed bin the material is fed into the secondary crusher via conveyor.
5. From the secondary crusher, the material is fed into a trommel screen via conveyor.
6. From the screen the 0-5 mm fraction falls into a bulk bag.
7. From the screen the 5-50 mm fraction falls onto a conveyor and is fed into a bulk bag.
8. From the screen, the oversize (anything larger than 50 mm) falls onto a conveyor and is returned to the secondary
crusher to be re-crushed.
This crushing plant is used primarily to crush the Calcium Aluminate and the metal produced in the alumino-thermic plant. It
is also used to crush other raw materials unrelated to the alumino-thermic process, as and when required.
Ball Mill
1. The material is fed into a feed bin using a forklift.
2. From the feed bin material is moved into the ball mill via a conveyor.
3. From the ball mill the material is moved on a conveyor into a bulk bag.
4. Dust is extracted from the ball mill through a bag house and the dust falls out into a bag. The fine material collected
in filter bags is added to the milled product.
The ball mill is used to mill manganese ore to the required fraction (less than 2 mm). The ball mill is used on occasion, usually
less than 20% of a year.
Process flow diagrams for the alumino-thermic process steps are provided in Figure 2-4 to Figure 2-7.

GfE-MIR Alloys and Minerals (Pty) Ltd
Report No.: 17SAV28 Revision 1.3 Final 11
Figure 2-4: Process flow diagram – Alumino-thermic Mixing Plant
Figure 2-5: Process flow diagram – Alumino-thermic Plant

GfE-MIR Alloys and Minerals (Pty) Ltd
Report No.: 17SAV28 Revision 1.3 Final 12
Figure 2-6: Process flow diagram – Alumino-thermic Crushing Plant
Figure 2-7: Process flow diagram - Ball Mill

GfE-MIR Alloys and Minerals (Pty) Ltd
Report No.: 17SAV28 Revision 1.3 Final 13
Separation Plant
The input to this plant is silicon dross that contains a mixture of pure silicon metal and silicon dross. The plant is a water-based
density separator and the purpose is to separate the pure metal from the dross. Because the density of the metal and the
dross are very similar, it is not possible to separate the two components completely. The plant has two outputs, high grade
with approximately 80% silicon metal and low grade with approximately 35% silicon metal.
Silicon dross is received from the supplier in the (approximate) size range 0 to 400 mm and is stored on a concrete slab,
against a bunker wall at 10 Atomic Street. The material is kept damp to prevent dust generation during the crushing process
and through wind entrainment. The material is crushed to 20 mm and screened into two size fractions; 0 to 5 mm and 5 to
20 mm. The 5 to 20 mm fraction is used as input to the Separation Plant while the 0 to 5 mm fraction is used in the Briquetting
Plant.
The step by step process of Separation Plant (Figure 2-8) is as follows:
1. The input material is moved from the concrete bunker into the feed bin by front-end loader.
2. From the feed bin the material is fed, via a conveyor, into a tumbler screen that loosens any fine material (0 to 5 mm)
that may be attached to the larger fractions, due to the moisture content of the material.
3. The finer fraction material falls through the screen onto a conveyor for transfer into a bulk bag, which is moved to
the briquetting plant.
4. The coarse-fraction material is moved on a conveyor to a second screen that splits the material into five size
fractions.
5. Any remaining material that is less than 5 mm drops through the screen onto a conveyor and into a bulk bag. The
remaining four sizes drop from the screen into four separation troughs.
6. The separation troughs are filled with water and separate the material into two grades based on density.
7. The two material grades are collected and moved via conveyors into bulk bags. The high-grade material from the
plant is either sold as is, or it is blended with other silicon-based products and then sold. The low-grade material is
crushed and used to make briquettes in the briquetting plant.
Figure 2-8: Process flow diagram – Separation Plant

GfE-MIR Alloys and Minerals (Pty) Ltd
Report No.: 17SAV28 Revision 1.3 Final 14
Briquetting Plant
Four unit-processes form part of the briquetting plant.
The size of the raw materials used in the briquetting plants needs to be either less than 5 mm or less than 3 mm, depending
on the type of briquette being made. Some of the raw materials received from suppliers are greater than 5mm and GfE has a
number of crushing and screening plants to reduce the size fraction, as required. These crushing and screening plants are
also used to crush material unrelated to the briquetting plant, as and when required.
Crushing and Screening Plant 2 (Figure 2-9)
This plant is used to crush and screen raw materials from 0-300mm down to 0-20mm.
1. Material is loaded into a feed bin with a front-end loader.
2. From the bin, a conveyor transfers the material into a jaw crusher and then onto a vibrating screen.
3. The screen produces three sizes – 0 to 5 mm, 5 to 20 mm and larger than 20 mm
a. The 0 to 5 mm material is either fed into a bulk bag or directly into the feed bin of the screening and
impact crusher plant, via conveyors.
b. The 5 to 20 mm is fed into a bulk bag via a conveyor.
c. The large fraction (+20 mm) is fed back into the jaw crusher, via a conveyor, for further crushing.
Figure 2-9: Process flow diagram – Briquetting Crushing and Screening Plant
Screening and Impact/Cone crusher plant (Figure 2-10)
This plant is used to crush raw materials from 20 mm down to 0-5 mm or 0-3 mm and then screen to 0-3 mm or 0-5 mm. The
crushing portion of the plant can be bypassed and used just as a screening plant.
1. Material is loaded into the feed bin either by front end loader of directly from the Crushing and Screening Plant 2
via a conveyor.
2. Material is transferred into a trommel screen via a conveyor, and produces two sizes.
3. The finer size is loaded into a bulk bag via a conveyor.
4. The coarser size is either loaded into a bulk bag or passed through the Impact Crusher or Cone Crusher and then
returned to the trommel screen – all via conveyors.

GfE-MIR Alloys and Minerals (Pty) Ltd
Report No.: 17SAV28 Revision 1.3 Final 15
Figure 2-10: Process flow diagram – Briquetting Impact Crusher and Screening Plant
Roll Crusher Plant (Figure 2-11)
This plant is used to crush material that is up to 20mm in size and can be adjusted to produce any size down to 0-1mm.
1. Material is loaded into the feed bin either using a front-end loader or a fork lift.
2. Material is transferred from the feed bin into the Roll Crusher via a conveyor.
3. Crushed material from the roll crusher is loaded into a bulk bag via a conveyor.
Figure 2-11: Process flow diagram – Roll Crusher
Briquetting Units
The two briquette plants are used to produce briquettes of varying specification depending on client needs. The two plants
are similar except for the inclusion of a dryer on one of the briquetting units. The step by step process for each plant is
described below.
Plant 1 (Figure 2-12)
1. Depending on the briquette recipe, raw materials are mixed together on a concrete slab and then loaded into a
feed bin, using a front-end loader.
2. A measured amount of raw material mix, from the feed bin, is loaded into a mixer via conveyor belt.
3. Various binder materials are added manually to the conveyor belt feeding the mixer.
4. Liquid binder is manually added at the mixer.

GfE-MIR Alloys and Minerals (Pty) Ltd
Report No.: 17SAV28 Revision 1.3 Final 16
5. When thoroughly mixed, the material is released from the mixer onto a conveyor belt that feeds the briquetting
wheels.
6. The raw materials are compressed by the briquetting wheels and the briquettes are formed.
7. The briquettes then pass over a static grill screen. The whole briquettes are fed into a drier, via a conveyor. Any
fine material that falls through the screen is returned to the conveyor that feeds the briquetting wheel.
8. The drier uses paraffin burners to maintain a temperature of approximately 80 to 120°C. The briquettes move
slowly through the drier on a conveyor belt over a period of approximately 15 minutes.
9. On exiting the drier, the briquettes are moved via a conveyor into a feed bin, then via a screen to bagging.
10. Conveyors at the base of the drier and screen catch and transfer any fine material into a bulk bag for re-use in the
next briquetting mix.
Plant 2 briquetting uses a similar process as Plant 1, with the exclusion of the drier (Figure 2-13).
Figure 2-12: Process flow diagram – Briquetting Plant 1

GfE-MIR Alloys and Minerals (Pty) Ltd
Report No.: 17SAV28 Revision 1.3 Final 17
Figure 2-13: Process flow diagram – Briquetting Plant 2
2.2 Listed Processes
All listed processes, as specified in the NEM:AQA, currently conducted or proposed to be conducted at the premises in terms
of this application are given in Table 2-1.
Table 2-1: Listed activities
Process Number: Listed Process Description:
4.1 Drying and Calcining
4.9 Ferro-alloy Production
4.11 Agglomeration Operations
4.21 Metal recovery
2.3 Unit Processes
The unit processes associated with the listed activities at the premises in respect of this application are listed in Table 2-2.
Table 2-2: The unit processes
Unit Process Function of Unit Process Batch or Continuous
Process
Aluminium granulation process
De-baler and Mill To de-bale compacted cans and to chop the cans into smaller
piece Continuous
Magnet To remove steel prior from used beverage can pieces (if any) Continuous

GfE-MIR Alloys and Minerals (Pty) Ltd
Report No.: 17SAV28 Revision 1.3 Final 18
Unit Process Function of Unit Process Batch or Continuous
Process
Burner To remove paint from beverage cans Continuous
Mills and screen To produce final aluminium granules and screen to separate
granule sizes Continuous
Baghouses and off-gas scrubbers To remove dust and minimise potentially harmful off-gases
released during paint removal Continuous
Alumino-thermic process
Calcining Plant Conversion of manganese dioxide (MnO2) to manganese oxide
(Mn3O4)
Batch (approximately 4
days per year)
Alumino-thermic mixing Plant Raw materials, as required by client recipe are mixed together Continuous (6 days per
week)
Alumino-thermic Plant
Production of Ferro Manganese Ultra-low carbon (less than
0.15% carbon) and Ferro Manganese Low Carbon (less than
0.5% carbon). The aluminothermic method uses aluminium rather
than electricity as an energy source where the aluminium is
sourced from a waste stream, recycled aluminium beverage cans
and telic produced at GfE-MIR’s Aluminium recycling plant.
Continuous (5 days per
week and 12 hours on
Saturdays)
Crushing and screening unit Crushing and screening of ferro alloy and calcium aluminate
produced in alumino-thermic process.
Continuous (5 days per
week)
Ball mill Milling of manganese ore to the required fraction (less than 2 mm). Batch (approximately
20% of the year)
Driers
Paraffin-fuelled driers. Used on trial basis. Off-gases from one drier
vent into an alumino-thermic burning chamber and then through a
baghouse.
Batch (less than 4 days
per year)
Separation plant
Jaw crusher Raw material is crushed prior to sizing on screens. Larger
fractions (between 5 and 20 mm) moved to separation plant.
Continuous (5 days per
week)
Separation tanks Water filled troughs used to separate material into two grades
based on density.
Continuous (5 days per
week)
Screens (tumbling) Fine fractions (5 mm or less) moved to bulk bags and onto
briquetting plant.
Continuous (5 days per
week)
Briquetting plant
Crushing and Screening Plant Raw material crushing and size screening. Batch (12 hours / day; 5
days per week)
Roll Crusher Used to crush raw materials from up to 20mm down to 0 to 3mm. Batch (12 hours / day; 5
days per week)
Screening Plant
Size screening of raw materials prior to briquetting pressing. This
plant also contains a cone crusher and an impact crusher, but
they are generally bypassed and only the screen is utilized.
Batch (12 hours / day; 5
days per week)

GfE-MIR Alloys and Minerals (Pty) Ltd
Report No.: 17SAV28 Revision 1.3 Final 19
Unit Process Function of Unit Process Batch or Continuous
Process
Briquetting Plants Mixed raw materials and binders are pressed into briquettes.
Some briquettes passed through a drier prior to screening.
Continuous (12 hours /
day; 5 days per week)
Screening Plant Fine fraction removal and size screening before to packing and
storage for customer sales.
Batch (12 hours / day; 5
days per week)
3 TECHNICAL INFORMATION
Raw material consumption rates for the GfE-MIR facility are tabulated in Table 3-1, while production rates are tabulated in
Table 3-2. By-products (Table 3-3) that are removed off-site include domestic waste, steel and aluminium fragments, as well
as small quantities of laboratory chemical waste.
3.1 Raw Material Used and Production Rates
Table 3-1: Raw materials consumption rates
Plant area Raw Material Type Design Consumption
Rate (Mass) Units (quantity/period)
Aluminium Plants Used aluminium beverage cans 570 – 650 tonnes per month
Aluminium telic (shavings) 115 tonnes per month
Calcining Plant Manganese ore 330 kilogram per hour
Alumino-thermic
Plant
Manganese oxide
650(a) tonnes per month Manganese ore
Ilmenite
Lime 70 tonnes per month
Fluorspar 50 tonnes per month
Aluminium granules 230 tonnes per month
Sodium nitrate 30 kg per day
Calcium aluminate and refractory 70 tonnes per week
Separation Plant Silicon dross 900 tonnes per month
Briquetting Plants Ferro silicon
5 028(a) tonnes per month
Silicon dross
Silicon carbide
Aluminium granules
Aluminium oxide
Fluorspar
Anthracite
Carbon
Ferro manganese
Ferro chrome

GfE-MIR Alloys and Minerals (Pty) Ltd
Report No.: 17SAV28 Revision 1.3 Final 20
Plant area Raw Material Type Design Consumption
Rate (Mass) Units (quantity/period)
Ferro niobium
Direct Reduced Iron
Pig iron
Calcium aluminate
Silicon carbide scrap (from Al Smelter)
Aluminox
Ferro titanium
Ferro molybdenum
Haematite
Starch
Cement 300 tonnes per month
Sodium silicate 480 tonnes per month
Bentonite 180 tonnes per month
Polyvinyl Acetate 12 tonnes per month
Aluminium dust (from aluminium plant bag
houses)
variable tonnes per month
Baghouse dust from the alumino-thermic plant
Baghouse dust from a steel furnace
Various products from the steel industry
All Plants Water
Electricity 450 000 kWh per month
Diesel 10 000 litres per month
Paraffin 15 000 litres per month
Liquid Petroleum Gas 6 000 kg per month
Chemicals used in laboratory 200 litres per month
Note:
(a) Quantities of individual raw materials vary monthly depending on client requirements.
Binder material consumption rates are more constant.
3.2 Production Rates
Table 3-2: Production rates
Plant Product
Maximum
Production
Capacity
(Quantity)
Design
Production
Capacity
(Quantity)
Actual
Production
Capacity
(Quantity)
Units
(Quantity/Period)
Aluminium Plants Aluminium
granules 800 800 400 tonnes per month

GfE-MIR Alloys and Minerals (Pty) Ltd
Report No.: 17SAV28 Revision 1.3 Final 21
Table 3-3: By-products
By-Product Name
Maximum
Production
Capacity
(Quantity)
Design
Production
Capacity
(Quantity)
Actual
Production
Capacity
(Quantity)
Units
(Quantity/Period) Notes
Domestic-type waste 7.5 7.5 2.0 tonnes per month Sent to landfill
Steel fragments 7.5 7.5 2.0 tonnes per month Sold to scrap dealers
Other Aluminium
waste 2.0 2.0 0.5 tonnes per month Sold to scrap dealers
Sediment from
scrubbers 53 53 24 tonnes per month
Utilized in briquetting
plant
Waste bags (bag
house and packaging) 1.5 1.5 0.4 tonnes per month
Dust 34.5 34.5 9.0 tonnes per month
In part collected through
baghouses. Used in
briquetting plant.
Waste chemicals from
laboratory 200 200 100 litres per month
Disposed of through
appropriate channels.
Calcining Plant Manganese oxide 330 330 (a) kilograms per hour
Alumino-thermic Plant Ferro manganese
450(b) 450(b) 220(b) tonnes per month
tonnes per month Ferro titanium
Plant Product
Maximum
Production
Capacity
(Quantity)
Design
Production
Capacity
(Quantity)
Actual
Production
Capacity
(Quantity)
Units
(Quantity/Period)
Separation Plant
High grade silicon
dross (80%
silicon)
425 425 150 tonnes per month
Low grade silicon
dross (35%
silicon)
425 425 150 tonnes per month
Briquetting Plants
Briquettes sold as
per customer
requirements
4 000 6 000 1 200 tonnes per month
Notes:
(a) only operational for four days in the past year
(b) Production rates for ferro-manganese and ferro-titanium vary depending on client requirements. Values given are total production rates for
the plant. Ferro-manganese production rates are higher than ferro-titanium.

GfE-MIR Alloys and Minerals (Pty) Ltd
Report No.: 17SAV28 Revision 1.3 Final 22
4 ATMOSPHERIC EMISSIONS
4.1.1 Point Sources
Point source emissions from the operation of the GfE-MIR facility are restricted to five sources: two aluminium plant stacks, a
venturi scrubber and a baghouse associated with the alumino-thermic plant, and a stack associated with the briquetting drier.
The parameters (Table 4-1) and pollutant emission rates (Table 4-2) used in dispersion modelling setup are summarised
below. Emissions from the point sources were based on measured emission rates and concentrations (Table 4-3).
4.1.2 Fugitive Sources
Fugitive sources (Table 4-4 and Table 4-5) include: materials handling, crushing activities, and the paved access road along
which vehicle entrainment of particulates is likely to occur. Published emission factors were used to estimate emissions from
the materials handling activities (Table 4-6).

GfE-MIR Alloys and Minerals (Pty) Ltd
Report No.: 17SAV28 Revision 1.3 Final 23
Table 4-1: Parameters for point sources of atmospheric pollutant emissions at the facility
Point Source code
Source name Latitude (decimal degrees)
Longitude (decimal degrees)
Height of Release Above
Ground (m)
Height Above Nearby
Building (m) (a)
Diameter at Stack Exit (m)
Actual Gas Exit Temperature
(°C)
Actual Gas Volumetric Flow
(m³/hr)
Actual Gas Exit Velocity
(m/s)
AS1 (b) Aluminium Stack (1) -26.253653 28.368652 8 4.6 0.10 (c) 33 2 410 13.6
AS2 (b) Aluminium Stack (2) -26.253373 28.368216 6 2.5 0.20 33 2 410 13.6
AT1 Alumino Thermic Stack (new
venturi) -26.254268 28.366799 10.5 6.5 0.63 40 20 000 25.0
AT2 Alumino Thermic (big
baghouse) -26.254259 28.366385 8.5 4.5 0.45 43 17 000 25.0
BS Briquette stack -26.254201 28.368919 2.6 (d) -3.4 0.2 (e) 77 601 16.7
DR1 Drier(f) -26.253403 28.368051 5 1 0.20 Not yet measured
DR2 Drier(g) -26.254259 28.366385 8.5 4.5 0.45 Included in measurements for AT2.
Notes: (a) Relative to lowest point of nearest building (b) Emissions sampling conducted on AS2. Emission parameters are assumed to be similar for AS1 and AS2 due to the similarity of the processes. (c) Square ducting (d) Horizontal release (e) Square ducting. Two pipes, 100 mm each, 0.2m effective diameter (f) Operated on trial basis for less than 876 hours per year. Emissions not yet measured. (g) Operated on trial basis for less than 876 hours per year. Emissions vented via AT2.
Table 4-2: Atmospheric pollutant emission rates for the facility
Point Source code
Pollutant Name
Maximum release rate Emissions
Hours Type of Emissions
(mg/Nm³) (mg/Am³) (g/s) Averaging
period
AS1(a)
PM 1.6 1.18 7.50E-04
Hourly 8 760 Continuous
SO2 30.3 22.34 1.83E-03
NOX 40.2 29.64 3.61E-03
CO 1.8 1.33 8.06E-04
NH3 0.079 0.06 3.61E-05
HCl 0.076 0.06 3.61E-05
HF 0.076 0.06 3.61E-05
Heavy metals 0.16 0.12 1.60E-05
Hg 0.0037 0.003 3.71E-07
Cd+Tl 0.012 0.01 1.20E-06
TVOC 84.6 62.38 8.48E-03
Dioxins and Furans 18.2 (ng I-TEQ/Nm3) (c) 1.34E-05 1.83E-09

GfE-MIR Alloys and Minerals (Pty) Ltd
Report No.: 17SAV28 Revision 1.3 Final 24
Point Source code
Pollutant Name
Maximum release rate Emissions
Hours Type of Emissions
(mg/Nm³) (mg/Am³) (g/s) Averaging
period
AS2 (a)
PM 1.6 1.18 5.04E-04
Hourly 8 760 Continuous
SO2 30.3 22.34 9.55E-03
NOX 40.2 29.64 1.27E-02
CO 1.8 1.33 5.67E-04
NH3 0.079 0.06 2.49E-05
HCl 0.076 0.06 2.39E-05
HF 0.076 0.06 2.39E-05
Heavy metals 0.16 0.12 5.04E-05
Hg 0.0037 0.003 1.17E-06
Cd+Tl 0.012 0.01 3.78E-06
TVOC 84.6 62.38 2.67E-02
Dioxins and Furans 18.2 (ng I-TEQ/Nm3) (c) 1.34E-05 5.73E-09
AT1 (b)
SO2 0.28 0.20 4.17E-05
Hourly 6 864 Continuous (24 hours 5 days per week and 12
hours on Saturdays) NOX 57.5 41.45 1.02E-01
CO 122 87.95 7.22E-04
AT2 PM 12.3 8.94 2.44E-02 Hourly 6 864 Continuous (24 hours 5 days per week and 12
hours on Saturdays)
BS
PM 38.2 (c) 24.6 3.89E-03
Hourly 3 120 Batch (12 hours per day; 5 days per week)
SO2 11.7 7.54 1.14E-03
NOX 15.0 9.67 2.81E-02
CO 0.48 0.31 4.08E-04
NH3 2.0 1.29 1.94E-04 Notes:
(a) Measurement campaign was conducted on AS2. Concentrations were assumed to be similar for AS1, while emission rates were recalculated based on specific stack parameters. (b) Emissions measurements for the alumino-thermic processes were conducted on the baghouses, prior to the installation of the venturi scrubber. The off-gases from both alumino-thermic processes are scrubbed in the venturi.
It was conservatively assumed that the baghouse emissions would similar to the sum of emissions measured from the two baghouses. (c) Bold text indicates non-compliance with minimum emission standards applicable for Subcategory 4.11 applicable from 1 April 2020.

GfE-MIR Alloys and Minerals (Pty) Ltd
Report No.: 17SAV28 Revision 1.3 Final 25
Table 4-3: Point Source Emission Estimation Information
Point Source code
Basis for Emission Rates
AS2, AT2, BS Emissions report (C&M Consulting Engineers, 26 March 2019). Particle size distributions as reported by C&M Consulting Engineers for the point sources were used to fractionate the total PM
measured.
AS1 Assumed, on the basis of process similarity, to be similar to measured emissions for AS2 (reported in C&M Consulting Engineers, 26 March 2019)
AT1 Emission parameters (flow rate, exit temperature, diameter) provided by GfE-MIR. Emission concentrations assumed to be the sum of emissions from the two baghouses as reported in C&M
Consulting Engineers, 26 March 2019.
Table 4-4: Area, volume and/or line source parameters
Source code Source Description Latitude (decimal degrees) of SW
corner
Longitude (decimal degrees) of SW corner
Height of Release Above Ground (m)
Length of Area (m)
Width of Area (m)
Angle of Rotation from True North (°)
MHBP Materials Handling – Briquetting Plant -26.254479 28.368670 3.98 88 30 -48
MHATP Materials Handling – Alumino-thermic Plant -26.254510 28.366531 3.75 130 27 -4.95
MHAP1 Materials Handling – Aluminium Plant 1 -26.253777 28.368394 3.23 26 18 -6.9
MHAP2 Materials Handling – Aluminium Plant 2 -26.253569 28.367896 2.68 55 20 21.5
CRBP Crushing – Briquetting Plant -26.254479 28.368670 3.98 88 30 -48
CRATP Crushing – Alumino-thermic Plant -26.254510 28.366531 3.75 130 27 -4.95
BMILL Ball mill baghouse(b) -26.253532 28.367927 4.0 55 20 21.5
BPR1 (a) Paved road Section 1 -26.256114 28.366629 0.5 199.0 10 -47.1
BPR2 (a) Paved road Section 2 -26.254784 28.367968 0.5 54.8 10 -93.9
BPR3 (a) Paved road Section 3 -26.254291 28.367925 0.5 111.1 10 -102.5
BPR4 (a) Paved road Section 4 -26.253315 28.367673 0.5 171.4 10 175.2
BPR5 (a) Paved road Section 5 -26.253461 28.365964 0.5 70.9 10 83.0
BPR6 (a) Paved road Section 6 -26.254095 28.366058 0.5 26.1 10 86.4
BPR7 (a) Paved road Section 7 -26.254330 28.366077 0.5 102.0 10 130.8
VEE1 (b) Vehicle exhaust – Area 1 -26.252016 28.367080 0.5 158 84
VEE2 (b) Vehicle exhaust – Area 2 -26.253361 28.367827 0.5 130 145
VEE3 (b) Vehicle exhaust – Alumino-thermic area -26.254510 28.366531 0.5 130 27 -4.95
VEE4 (b) Vehicle exhaust – Roads -26.253273 28.367094 0.5 100 135

GfE-MIR Alloys and Minerals (Pty) Ltd
Report No.: 17SAV28 Revision 1.3 Final 26
Source code Source Description Latitude (decimal degrees) of SW
corner
Longitude (decimal degrees) of SW corner
Height of Release Above Ground (m)
Length of Area (m)
Width of Area (m)
Angle of Rotation from True North (°)
Notes:
(a) Municipal roads used for delivery of raw materials and dispatch of products. (b) Exhaust emissions associated with the front-end loaders and fork-lifts (b) Non-routine operations accounting for approximately 1 752 hours per year. Emissions not yet measured. Enclosed in building. .
Table 4-5: Fugitive source emissions rates
Area Source code
Pollutant Name Emission rate (g/s.m2) Emission Hours Type of Emission Wind Dependent
(yes/no)
MHBP
Particulates (total suspended particulates) 8.10E-03 3 120 per year Continuous Yes
Particulates (PM10) 3.83E-03 3 120 per year Continuous Yes
Particulates (PM2.5) 4.21E-04 3 120 per year Continuous Yes
MHATP
Particulates (total suspended particulates) 5.12E-03 6 240 per year Continuous Yes
Particulates (PM10) 2.42E-03 6 240 per year Continuous Yes
Particulates (PM2.5) 2.66E-04 6 240 per year Continuous Yes
MHAP1
Particulates (total suspended particulates) 1.15E-03 8 760 per year Continuous Yes
Particulates (PM10) 5.43E-04 8 760 per year Continuous Yes
Particulates (PM2.5) 5.97E-05 8 760 per year Continuous Yes
MHAP2
Particulates (total suspended particulates) 6.07E-04 6 240 per year Continuous Yes
Particulates (PM10) 2.87E-04 6 240 per year Continuous Yes
Particulates (PM2.5) 3.16E-05 6 240 per year Continuous Yes
CRBP
Particulates (total suspended particulates) 5.56E-02 3 120 per year Continuous No
Particulates (PM10) 1.81E-02 3 120 per year Continuous No
Particulates (PM2.5) 7.22E-03 3 120 per year Continuous No
CRATP
Particulates (total suspended particulates) 6.94E-02 6 240 per year Continuous No
Particulates (PM10) 1.94E-02 6 240 per year Continuous No
Particulates (PM2.5) 7.78E-03 6 240 per year Continuous No
BPR1-7 Particulates (total suspended particulates) 1.14E-05 3 120 per year Continuous No
GfE-MIR Alloys and Minerals (Pty) Ltd
Report No.: 17SAV28 Revision 1.3 Final 27
Area Source code
Pollutant Name Emission rate (g/s.m2) Emission Hours Type of Emission Wind Dependent
(yes/no)
Particulates (PM10) 2.20E-06 3 120 per year Continuous No
Particulates (PM2.5) 5.31E-07 3 120 per year Continuous No
VEE1 - 4
Particulates (PM10) 2.37E-08 6 240 per year Continuous No
Particulates (PM2.5) 2.17E-08 6 240 per year Continuous No
SO2 1.58E-10 6 240 per year Continuous No
NOX 2.96E-07 6 240 per year Continuous No
CO 1.23E-07 6 240 per year Continuous No
TVOC 2.77E-08 6 240 per year Continuous No
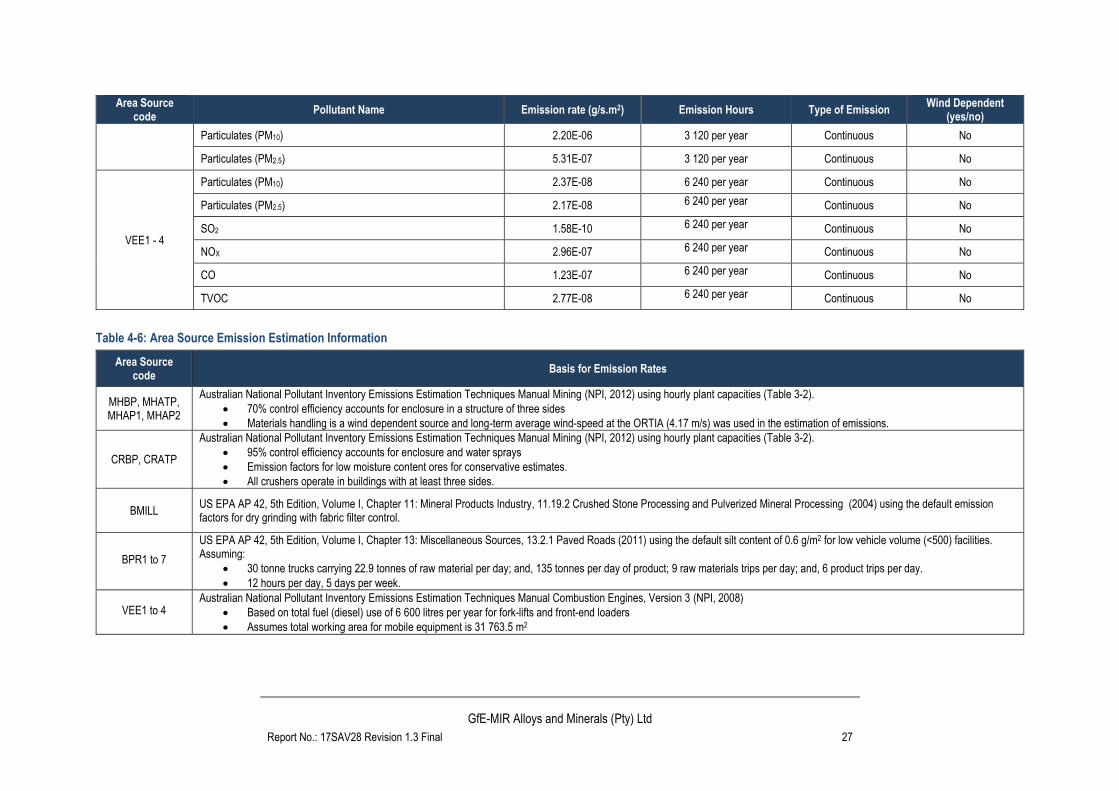
Table 4-6: Area Source Emission Estimation Information
Area Source code
Basis for Emission Rates
MHBP, MHATP, MHAP1, MHAP2
Australian National Pollutant Inventory Emissions Estimation Techniques Manual Mining (NPI, 2012) using hourly plant capacities (Table 3-2).
• 70% control efficiency accounts for enclosure in a structure of three sides
• Materials handling is a wind dependent source and long-term average wind-speed at the ORTIA (4.17 m/s) was used in the estimation of emissions.
CRBP, CRATP
Australian National Pollutant Inventory Emissions Estimation Techniques Manual Mining (NPI, 2012) using hourly plant capacities (Table 3-2).
• 95% control efficiency accounts for enclosure and water sprays
• Emission factors for low moisture content ores for conservative estimates.
• All crushers operate in buildings with at least three sides.
BMILL US EPA AP 42, 5th Edition, Volume I, Chapter 11: Mineral Products Industry, 11.19.2 Crushed Stone Processing and Pulverized Mineral Processing (2004) using the default emission factors for dry grinding with fabric filter control.
BPR1 to 7
US EPA AP 42, 5th Edition, Volume I, Chapter 13: Miscellaneous Sources, 13.2.1 Paved Roads (2011) using the default silt content of 0.6 g/m2 for low vehicle volume (<500) facilities. Assuming:
• 30 tonne trucks carrying 22.9 tonnes of raw material per day; and, 135 tonnes per day of product; 9 raw materials trips per day; and, 6 product trips per day.
• 12 hours per day, 5 days per week.
VEE1 to 4 Australian National Pollutant Inventory Emissions Estimation Techniques Manual Combustion Engines, Version 3 (NPI, 2008)
• Based on total fuel (diesel) use of 6 600 litres per year for fork-lifts and front-end loaders
• Assumes total working area for mobile equipment is 31 763.5 m2

GfE-MIR Alloys and Minerals (Pty) Ltd
Report No.: 17SAV28 Revision 1.3 Final 28
4.1.3 Emission Source Summary
Emissions associated with the normal operation of the GfE-MIR facility were estimated as described in Section 4. Annual total emissions are summarised in Table 4-7. The crushers were quantified
to be the largest contributing source to the total suspended particulate (TSP) fraction, while the stack emissions were the largest sources of fine particulates (PM10 and PM2.5) and gaseous
emissions.
Table 4-7: Annual pollutant emission rates (by source group) [units: t/a]
Source group
TSP (a) PM10 PM2.5 SO2 NOX CO NH3 HCl HF Heavy metals
Hg Cd+Tl TVOC Dioxins
and Furans
Paved roads (unmitigated)
0.94 0.18 0.04
Materials handling
0.25 0.12 0.01
Crushing, screening and milling
2.22 0.67 0.27
Stack emissions
0.94 0.94 0.41 0.15 3.48 0.08 0.01 2.28E-03 2.28E-03 2.10E-03 4.85E-05 1.57E-04 1.11 2.38E-07
Vehicle exhaust
emissions 0.02 0.02 0.02 1.24E-04 0.23 0.10 0.02
Total 4.38 1.93 0.75 0.15 3.71 0.17 0.01 2.28E-03 2.28E-03 2.10E-03 4.85E-05 1.57E-04 1.13 2.38E-07
Dispersion modelling was completed for the normal operation of the facility including existing mitigation measures.

GfE-MIR Alloys and Minerals (Pty) Ltd
Report No.: 17SAV28 Revision 1.3 Final 29
4.2 Emergency Incidents
In the absence of continuous emissions monitoring (which is not required by the listed activities operational on site), no details
for emergency events are available. Emergency incidents should to be documented in detail. The summary of each emergency
incident must include:
(a) Nature and cause of incident;
(b) Actions taken immediately following the incident to minimise impact; and
(c) Actions taken subsequent to event to reduce the likelihood of reoccurrence.
It is likely that the licensing authority may stipulate in the AEL the maximum number of hours per year that emergency events
can occur. The AEL will also include the procedures for during and after emergency incidents, including plant shutdown,
repairs, rectification, and reporting requirements.

GfE-MIR Alloys and Minerals (Pty) Ltd
Report No.: 17SAV28 Revision 1.3 Final 30
5 IMPACT OF ENTERPRISE ON THE RECEIVING ENVIRONMENT
5.1 Analysis of Emissions’ Impact on Human Health
5.1.1 Study Methodology
The study methodology may conveniently be divided into a “preparatory phase” and an “execution phase”.
The preparatory phase included the following basic steps prior to performing the actual dispersion modelling and analyses:
1. Understand scope of work
2. Review of legal requirements (e.g. dispersion modelling guideline) (see Section 5.1.2)
3. Decide on dispersion model (see Section 5.1.1.1)
The Regulations Regarding Air Dispersion Modelling (Gazette No 37804 published 11 July 2014) was referenced for the
dispersion model selection (Government Gazette, 2014).
Three levels of assessment are defined in the Regulations Regarding Air Dispersion Modelling:
• Level 1: where worst-case air quality impacts are assessed using simpler screening models
• Level 2: for assessment of air quality impacts as part of license application or amendment processes, where impacts
are the greatest within a few kilometres downwind (less than 50 km)
• Level 3: requires more sophisticated dispersion models (and corresponding input data, resources and model
operator expertise) in situations:
- where a detailed understanding of air quality impacts, in time and space, is required;
- where it is important to account for causality effects, calms, non-linear plume trajectories, spatial variations
in turbulent mixing, multiple source types, and chemical transformations;
- when conducting permitting and/or environmental assessment process for large industrial developments
that have considerable social, economic and environmental consequences;
- when evaluating air quality management approaches involving multi-source, multi-sector contributions
from permitted and non-permitted sources in an airshed; or,
- when assessing contaminants resulting from non-linear processes (e.g. deposition, ground-level ozone
(O3), particulate formation, visibility).
The assessment of the impact as a result of emissions from the GfE-MIR facility was considered to fall within the scope of a
Level 2 assessment (to be used for air quality impact assessments in standard / generic licence or amendment processes
where impacts are the greatest within a few kilometres downwind (less than 50km)).
The execution phase (i.e. dispersion modelling and analyses) firstly involves gathering specific information in relation to the
emission source(s) and site(s) to be assessed, and secondly the actual simulation of the emission sources. The information
gathering included:
• Source information: Emission rate, exit temperature, volume flow, exit velocity and release height;
• Site information: Site building layout, terrain information, land-sea interface and land use data;
• Meteorological data: Wind speed, wind direction, temperature, cloud cover and mixing height; and,
• Receptor information: Locations using discrete receptors and/or gridded receptors.
When supplied with the above information, the dispersion model uses this specific input data to run various algorithms to
estimate the dispersion of pollutants between the source and receptor. The model output is in the form of a simulated time-

GfE-MIR Alloys and Minerals (Pty) Ltd
Report No.: 17SAV28 Revision 1.3 Final 31
averaged concentration at the receptor. These simulated concentrations are added to suitable background concentrations and
compared with the relevant ambient air quality standard or guideline.
5.1.1.1 Dispersion Model Selection
As per the National Code of Practice for Air Dispersion Modelling use was made of the US EPA approved AERMOD
atmospheric dispersion modelling suite for the simulation of ambient air pollutant concentrations and dustfall rates. AERMOD
is a gaussian plume model, which are best used for near-field applications where the steady-state meteorology assumption is
most likely to apply. AERMOD is a model developed with the support of the AMS/EPA Regulatory Model Improvement
Committee (AERMIC), whose objective has been to include state-of the-art science in regulatory models (Hanna, Egan,
Purdum, & Wagler, 1999). AERMOD is a dispersion modelling system with three components, namely: AERMOD (AERMIC
Dispersion Model), AERMAP (AERMOD terrain pre-processor), and AERMET (AERMOD meteorological pre-processor).
AERMOD is an advanced new-generation model designed to simulate pollution concentrations from continuous point, flare,
area, line, and volume sources. AERMOD offers advanced algorithms for plume rise and buoyancy, and the computation of
vertical profiles of wind, turbulence and temperature. However, retains the single straight-line trajectory limitation. AERMET is
a meteorological pre-processor for AERMOD. Input data can come from hourly cloud cover observations, surface
meteorological observations and twice-a-day upper air soundings. Output includes surface meteorological observations and
parameters and vertical profiles of several atmospheric parameters. AERMAP is a terrain pre-processor designed to simplify
and standardise the input of terrain data for AERMOD. Input data includes receptor terrain elevation data. The terrain data
may be in the form of digital terrain data. The output includes, for each receptor, location and height scale, which are elevations
used for the computation of air flow around hills. A disadvantage of the model is that spatial varying wind fields, due to
topography or other factors cannot be included. Input data types required for the AERMOD model include: source data,
meteorological data (pre-processed by the AERMET model), terrain data and information on the nature of the receptor grid.
Version 8.1 of the AERMOD and its pre-processors were used in the study (Table 5-1).
Table 5-1: Summary description of AERMOD model suite with versions used in the investigation
Module Interface Version Executable Description
AERMOD Breeze v8.1 (US) EPA 18081 Gaussian plume dispersion model.
AERMET Breeze v7.9 (US) EPA 18081 Meteorological pre-processor for creating AERMOD compatible formats.
BPIP Dated: 04274 Building pre-processor for including building downwash effects in the simulation of pollutant dispersal.
5.1.1.2 Receptor Grid
The dispersion of pollutants expected to arise from the proposed operations was simulated for an area covering 10 km (east-
west) by 10 km (north-south). The area was divided into a grid matrix with a resolution of 250 m (Table 5-2). Additional nested
grids at finer resolution were included within 2 500 m and 400 m of the facility (Table 5-2). AERMOD calculates ground-level
concentrations and dustfall rates at each grid point.

GfE-MIR Alloys and Minerals (Pty) Ltd
Report No.: 17SAV28 Revision 1.3 Final 32
Table 5-2: Simulation domain
Parameter Simulation domain
South-western corner of simulation domain 636 601 m (Easting); 7 090 480m (Northing)
Domain size 10 x 10 km
Projection Grid: UTM Zone 35S, Datum: WGS-84
Grid resolution
250 m across simulation domain
100 m within 2 500 m of facility
50 m within 400 m of facility
5.1.1.3 Sources Simulated
All routine emissions from the GfE-MIR facility were included in the dispersion model (as per Table 4-2 and Table 4-5). Non-
routine emissions (from the drier – approximately 876 hours) were not included. The off-gas from the drier is passed through
the alumino-thermic baghouse prior to venting to the atmosphere.
5.1.2 Legal Requirements
5.1.2.1 Atmospheric Impact Report
The format of the AIR is stipulated in the Regulations Prescribing the Format of the Atmospheric Impact Report, Government
Gazette No. 36904, Notice Number 747 of 2013 (11 October 2013), it’s amendment stipulated in Government Gazette No.
38633, No. R284 (2 April 2015). (Government Gazette, 2013).
5.1.2.2 Listed Activities and Minimum Emission Standards
The Minister, in terms of Section 21 of the NEM:AQA, published a list of activities which result in atmospheric emissions and
which are believed to have significant detrimental effects on the environment, human health and social welfare. All scheduled
processes as previously stipulated under APPA were included as listed activities, with additional activities being included in
the list. The Listed Activities and Minimum National Emission Standards were first published on the 31st of March 2010
(Government Gazette No. 33064), with a revision of the schedule on the 22nd of November 2013 (Government Gazette No.
37054), and subsequent amendments.
Four of the unit processes at the GfE-MIR facility trigger Listed Activities under Section 21 of the National Environmental
Management: Air Quality Act (NEM:AQA) and require an Atmospheric Emissions License (AEL) to operate. Due to the date
of plant commissioning and application for authorisation, these activities will be required to comply with the new plant Minimum
Emission Standards (MES). The applicable listed activities categories include: Sub-category 4.1 (Drying and Calcining) (Table
5-3); Sub-category 4.9 (Ferro alloy Production) (Table 5-4); Sub-category 4.11 (Agglomeration Operations) (Table 5-5); and,
Sub-category 4.21 (Metal Recovery) (Table 5-6).

GfE-MIR Alloys and Minerals (Pty) Ltd
Report No.: 17SAV28 Revision 1.3 Final 33
Table 5-3: Listed Activity Subcategory 4.1
Sub-category 4.1 – Drying and Calcining
Description: Drying and calcining of mineral solids including ore.
Application: Facilities with a capacity of more than 100 tonnes per month product.
Substance or Mixture of Substances Plant Status
Emission concentration limit
(mg/Nm³ under normal
conditions of 273 Kelvin and
101.3 kPa) Common Name Chemical Symbol
Particulate matter N/A
New)
100 (50)
Sulfur dioxide SO2 1 000 (1 000)
Oxides of nitrogen NOX, expressed as NO2 1 200 (500)
Table 5-4: Listed Activity Subcategory 4.9
Sub-category 4.9 – Ferro-alloy Production
Description: Production of alloys of iron with chromium, manganese, silicon or vanadium; the separation of
titanium slag from iron-containing minerals using heat.
Application: All installations.
Substance or Mixture of Substances Plant Status
Emission concentration limit
(mg/Nm³ under normal
conditions of 273 Kelvin and
101.3 kPa) Common Name Chemical Symbol
Sulfur dioxide SO2 Existing (New)
500 (500)
Oxides of nitrogen NOX, expressed as NO2 750 (400)
Particulate matter from primary fume capture system, open and semi-closed furnaces
Particulate matter N/A Existing (New) 100 (30)
Particulate matter from primary fume capture system, closed furnaces
Particulate matter N/A Existing (New) 100 (50)
Particulate matter from secondary fume capture system, all furnaces
Particulate matter N/A Existing (New) 100 (50)
(a) The following special arrangements shall apply –
i. Secondary fume capture installations shall be fitted to all new furnace installations
ii. Emissions of Cr(VI), Mn and V from primary fume capture systems of ferrochrome, ferromanganese and
ferrovanadium furnaces, respectively, to be measured and reported to licensing authority annually.

GfE-MIR Alloys and Minerals (Pty) Ltd
Report No.: 17SAV28 Revision 1.3 Final 34
Table 5-5: Listed Activity Subcategory 4.11
Sub-category 4.11 – Agglomeration Operations
Description: Production of pellets or briquettes using presses, inclined discs or rotating drums.
Application: All installations.
Substance or Mixture of Substances Plant Status
Emission concentration limit
(mg/Nm³ under normal
conditions of 273 Kelvin and
101.3 kPa) Common Name Chemical Symbol
Particulate matter N/A Existing (New)
100 (30)
Ammonia NH3 50 (30)
Table 5-6: Listed Activity Subcategory 4.21
Sub-category 4.21 – Metal Recovery
Description: The recovery of metal from any form of scrap material by the application of heat.
Application: All installations.
Substance or Mixture of Substances Plant Status
Emission concentration limit
(mg/Nm³ under normal
conditions of 273 Kelvin and
101.3 kPa) Common Name Chemical Symbol
Particulate matter N/A
Existing (New)
25 (10)
Carbon monoxide CO 75 (50)
Sulfur dioxide SO2 50 (50)
Oxides of nitrogen NOX, expressed as NO2 200 (200)
Hydrogen chloride HCl 10 (10)
Hydrogen fluoride HF 1 (1)
Sum of lead, arsenic,
antimony, chromium, cobalt,
copper, manganese, nickel,
vanadium
Pb+As+Sb+Cr+Co+Cu+Mn+Ni+V 0.5 (0.5)
Mercury Hg 0.05 (0.05)
Cadmium and Thallium Cd+Tl 0.05 (0.05)
Total organic compounds N/A 10 (10)
Ammonia NH3 10 (10)
Emission concentration limit
(ng I-TEQ/Nm³ under normal
conditions of 10% O2;
273 Kelvin and 101.3 kPa)
Dioxins and furans PCDD/PCDF Existing (New) 0.1 (0.1)

GfE-MIR Alloys and Minerals (Pty) Ltd
Report No.: 17SAV28 Revision 1.3 Final 35
5.1.2.3 Reporting of Atmospheric Emissions
The National Atmospheric Emission Reporting Regulations (Government Gazette No. 38633) came into effect on 2 April 2015.
The purpose of the regulations is to regulate the reporting of data and information from an identified point, non-point and
mobile sources of atmospheric emissions to an internet-based National Atmospheric Emissions Inventory System (NAEIS).
The NAEIS is a component of the South African Atmospheric Emission Licencing and Inventory Portal (SAAELIP). Its objective
is to provide all stakeholders with relevant, up to date and accurate information on South Africa's emissions profile for informed
decision making.
Emission sources and data providers are classified according to groups. The facility would be classified under Group A (“Listed
activity published in terms of section 21(1) of the NEMA:AQA”). Emission reports from Group A must be made in the format
required for NAEIS and in accordance with the atmospheric emission license or provisional atmospheric emission license.
As per the regulation, GfE-MIR and/or their data provider must register on the NAEIS within 30 days after commencing with
proposed activities. Data providers must inform the relevant authority of changes if there are any:
• Change in registration details;
• Transfer of ownership; or
• Activities being discontinued.
A data provider must submit the required information for the preceding calendar year to the NAEIS by 31 March of each year.
Records of data submitted must be kept for a period of 5 years and must be made available for inspection by the relevant
authority.
The relevant authority must request, in writing, a data provider to verify the information submitted if the information is
incomplete or incorrect. The data provider then has 60 days to verify the information. If the verified information is incorrect or
incomplete the relevant authority must instruct a data provider, in writing, to submit supporting documentation prepared by an
independent person. The relevant authority cannot be held liable for cost of the verification of data. A person guilty of an
offence in terms of Section 13 of these regulations is liable for penalties.
5.1.2.4 National Ambient Air Quality Standards
Criteria pollutants are considered those pollutants most commonly found in the atmosphere, that have proven detrimental
health effects when inhaled and are regulated by ambient air quality criteria. South African NAAQS for SO2, NO2, PM10, CO,
ozone (O3), benzene (C6H6), and lead (Pb) were published on 13 March 2009. Standards for PM2.5 were published on 24 June
2012. The standards applicable to the project are listed in Table 5-7.

GfE-MIR Alloys and Minerals (Pty) Ltd
Report No.: 17SAV28 Revision 1.3 Final 36
Table 5-7: National Ambient Air Quality Standards for criteria pollutants
Pollutant Averaging
Period Limit Value
(µg/m³) Limit Value
(ppb) Frequency of Exceedance
Compliance Date
SO2
10-minute 500 191 526 Currently enforceable
1-hour 350 134 88 Currently enforceable
24-hour 125 48 4 Currently enforceable
1-year 50 19 - Currently enforceable
NO2 1-hour 200 106 88 Currently enforceable
1-year 40 21 - Currently enforceable
PM10 24-hour 75 - 4 Currently enforceable
1-year 40 - - Currently enforceable
PM2.5
24-hour 40 - 4 Currently enforceable
25 - 4 1 Jan 2030
1-year 20 - - Currently enforceable
15 - - 1 Jan 2030
CO 1-hour 30 000 26 000 88 Currently enforceable
Benzene 1-year 5 1.6 - Currently enforceable
5.1.2.5 National Dust Control Regulations
The National Dust Control Regulations (NDCR) was gazetted on 1 November 2013 (No. 36974). The purpose of the
regulations is to prescribe general measures for the control of dust in all areas including residential and light commercial areas.
The standard for acceptable dustfall rate is set out in Table 5-8. The method to be used for measuring dustfall rate and the
guideline for locating sampling points shall be ASTM D1739: 1970, or equivalent method approved by any internationally
recognized body. The measurement of dustfall and the submission of a dust mitigation plant is only applicable to those
installation identified, and notified by written notice, by the local air quality officer.
Table 5-8: Acceptable dustfall rates
Restriction Area Dustfall Rate
(mg/m².day, 30-day average) Permitted Frequency of Exceeding Dustfall Rate
Residential area D<600 Two in a year, not sequential months
Non-residential area 600<D<1200 Two in a year, not sequential months
A revised Draft National Dust Control Regulations were published on 25 March 2018 (Government Gazette No. 41650) which
references the same acceptable dustfall rates but refers to the latest version of the ASTM D1739 method to be used for
sampling.
It is important to note that dustfall is assessed for nuisance impact and not inhalation health impact.

GfE-MIR Alloys and Minerals (Pty) Ltd
Report No.: 17SAV28 Revision 1.3 Final 37
5.1.2.6 Non-criteria Pollutants
Ambient pollutant concentrations, either from the dispersion modelling or from direct physical measurements, are typically
compared to defined standards or other thresholds to assess the health and/or environmental risk implications of the predicted
or measured air quality. In South Africa, NAAQS have been set for criteria pollutants at limits deemed to uphold a permissible
level of health risk and the assessment has accordingly been based on a comparison between the predicted concentrations
and the NAAQS.
Where NAAQS have not been set health-effect screening levels, appropriate for assessing the non-criteria pollutants emitted
from the facility, were identified from literature reviews and internationally recognised databases. These non-criteria pollutants
for which screening levels were identified include: lead (Pb), arsenic (As), antimony (Sb), chromium (Cr), cobalt (Co), copper
(Cu), manganese (Mn), nickel (Ni), vanadium (V), mercury (Hg), cadmium (Cd), thallium (Tl), hydrogen chloride (HCl),
hydrogen fluoride (HF), total organic compounds (TOC), volatile organic compounds (VOC), ammonia (NH3) and dioxins and
furans. The health-effect screening levels used are listed in Table 5-9.
Table 5-9: Most stringent health-effect screening level identified for all non-criteria pollutants assessed
Compound Acute exposure(a)
[units: µg/m3]
Chronic exposure(b)
[units: µg/m3]
Lead (Pb) (c) (d)
Arsenic (As) 0.2 (g) 0.015 (g)
Antimony (Sb) (c) (d)
Chromium (Cr) (c) 0.1 (e)
Cobalt (Co) (c) 0.1 (f)
Copper (Cu) 100 (g) (d)
Manganese (Mn) (c) 0.05 (e)
Nickel (Ni) 0.2 (g) 0.014 (g)
Vanadium (V) 0.8 (f) 0.1 (f)
Mercury (Hg) 0.25 (i) 0.025 (i)
Cadmium (Cd) (c) 0.005 (j)
Thallium (Tl) (c) (d)
Ammonia (NH3) 1 184 (f) 67.2 (f)
Hydrogen chloride (HCl) 2 100 (g) (e)
Hydrogen fluoride (HF) 240 (g) 14 (g)
Total organic compounds (TOC) (c) 100 (k)
Volatile organic compounds (VOC) (c) 5 (h)
(a) Hourly concentrations compared with short-term / acute exposure health effect screening level
(b) Annual concentrations compared with long-term / chronic exposure health effect screening level
(c) No hourly health screening level
(d) No annual health screening level
(e) US-EPA IRIS Inhalation Reference Concentrations (μg/m³)
(f) US ATSDR Maximum Risk Levels (MRLs) (μg/m³)
(g) Californian OEHHA (μg/m³)
(h) NAAQS for benzene (surrogate)
(i) Texas Commission on Environmental Quality Effects Screening Level (µg/m³) (November 2016)
(j) WHO guideline (µg/m³)
(k) Texas Commission on Environmental Quality long-term Effects Screening Level for diesel fuel vapour

GfE-MIR Alloys and Minerals (Pty) Ltd
Report No.: 17SAV28 Revision 1.3 Final 38
Unit risk factors (URFs) are applied in the calculation of carcinogenic risks. These factors are defined as the estimated
probability of a person (60-70 kg) contracting cancer as a result of constant exposure to an ambient concentration of 1 µg/m³
over a 70-year lifetime. In the generic health risk assessment undertaken as part of the current study, maximum possible
exposures (24-hours a day over a 70-year lifetime) are assumed for all areas beyond the boundary of the facility. Unit risk
factors were obtained from the WHO (2000) and from the US EPA IRIS database. The most stringent URFs (obtained from
the WHO, IRIS and California EPA (CALEPA) databases) for compounds of interest in the current study are given in Table
5-10.
Table 5-10: Proposed unit risk factors for pollutants of interest in the current assessment
Compound Selected Criteria
(µg/m³)-1 Source
Arsenic 4.3 x 10⁻³ IRIS
Benzene 2.9 x 10⁻⁵ CALEPA
Cadmium 4.2 x 10⁻³ CALEPA
Chromium (VI) 1.5 x 10⁻¹ CALEPA
Nickel 3.8 x 10⁻⁴ WHO
Dioxins 33 CALEPA
The New York Department of Health have a qualitative ranking of cancer risk estimates, from very low to very high (Table
5-11).
Table 5-11: Excess Lifetime Cancer Risk (New York Department of Health)
Risk Ratio Qualitative Descriptor
Equal to or less than one in a million Very low
Greater than one in a million to less than one in ten thousand Low
One in ten thousand to less than one in a thousand Moderate
One in a thousand to less than one in ten High
Equal to or greater than one in ten Very high
5.1.2.7 Highveld Priority Area
The Highveld Airshed was the second priority area declared by the minister. This required that an Air Quality Management
Plan for the area be developed. The plan includes the establishment of an emissions reduction strategies and intervention
programmes based on the findings of a baseline characterisation of the area. The implication of this is that all contributing
sources in the area will be assessed to determine the emission reduction targets to be achieved over the following few years.
The project area is located within the footprint demarcated as the Highveld Priority Area (HPA). Emission reduction strategies
will be included for the numerous coal mines in the area with specific targets associated with it. The Department of
Environmental Affairs (DEA) published the management plan for the Highveld Priority Area in September 2011. Included in
this management plan are seven goals, each of which has a further list of objectives that have to be met. The goals for the
Highveld Priority area are as follows:
• Goal 1: By 2015, organisational capacity in government is optimised to efficiently and effectively maintain, monitor
and enforce compliance with ambient air quality standards

GfE-MIR Alloys and Minerals (Pty) Ltd
Report No.: 17SAV28 Revision 1.3 Final 39
• Goal 2: By 2020, industrial emissions are equitably reduced to achieve compliance with ambient air quality standards
and dustfall limit values
• Goal 3: By 2020, air quality in all low-income settlements is in full compliance with ambient air quality standards
• Goal 4: By 2020, all vehicles comply with the requirements of the National Vehicle Emission Strategy
• Goal 5: By 2020, a measurable increase in awareness and knowledge of air quality exists
• Goal 6: By 2020, biomass burning and agricultural emissions will be 30% less than current
• Goal 7: By 2020, emissions from waste management are 40% less than current
Goal 2 applies directly to the project, the objectives associated with this goal include:
• Emissions are quantified from all sources;
• Gaseous and particulate emissions are reduced;
• Fugitive emissions are minimised;
• Emissions from dust generating activities are reduced;
• Incidences of spontaneous combustion are reduced;
• Abatement technology is appropriate and operational;
• Industrial Air Quality Management (AQM) decision making is robust and well-informed, with necessary information
available;
• Clean technologies and processes are implemented;
• Adequate resources are available for AQM in industry;
• Ambient air quality standard and dustfall limit value exceedances as a result of industrial emissions are assessed;
and,
• A line of communication exists between industry and communities.
Each of these objectives is further divided into activities, each of which has a timeframe, responsibility and indicator. Further
details are available in the DEA (2011) Highveld Priority Management Plan.
5.1.3 Atmospheric Dispersion Potential
Physical and meteorological mechanisms govern the dispersion, transformation, and eventual removal of pollutants from the
atmosphere. The analysis of hourly average meteorological data is necessary to facilitate a comprehensive understanding of
the dispersion potential of the site. The primary meteorological parameters for air pollutant dispersion include wind speed,
wind direction and ambient temperature. Other meteorological parameters that influence the air concentration levels include
rainfall (washout) and a measure of atmospheric stability. Atmospheric stability is not normally measured but rather derived
from other parameters such as the vertical height temperature difference or the standard deviation of wind direction. The depth
of the atmosphere in which the pollutants can mix is similarly derived from other meteorological parameters by means of
mathematical parameterizations. The meteorological data used for the assessment was from the SAWS OR Tambo
International Airport (ORTIA) meteorological station for the three-year period 2016 to 2018. The parameters of interest are
discussed below.
5.1.3.1 Topography
The study area is characterised by terrain elevations in the range 1 578 and 1 656 mamsl. The terrain within the study domain
is flat or gently sloping (less than 10%), and therefore does not meet the recommendation to include terrain in the dispersion
model setup.

GfE-MIR Alloys and Minerals (Pty) Ltd
Report No.: 17SAV28 Revision 1.3 Final 40
5.1.3.2 Surface Wind Field
The wind field for the study area is described with the use of wind roses. Wind roses comprise 16 spokes, which represent
the directions from which winds blew during a specific period. The colours used in the wind roses below, reflect the different
categories of wind speeds; the yellow area, for example, representing winds in between 4 and 5 m/s. The dotted circles provide
information regarding the frequency of occurrence of wind speed and direction categories. Calm conditions are periods when
the wind speed was below 1 m/s. These low values can be due to “meteorological” calm conditions when there is no air
movement; or, when there may be wind but it is below the anemometer starting threshold (AST).
The period, day-time and night-time wind roses are shown in Figure 5-1 for the OR Tambo International Airport (ORTIA) SAWS
station, and seasonal wind roses are shown in Figure 5-2.
The ORTIA station wind field was dominated by winds from the north and north-west, with winds of increased speeds more
frequently originating to the north. Winds were infrequently from the south-west. Calm conditions occurred approximately 1.5%
of the time, most frequently at night (2.4%). During the day, winds at higher wind speeds occurred more frequently from the
north and north-west. Night-time airflow had was also dominated by north and north-westerly winds but at lower wind speeds.
Calm conditions were most frequently recorded in autumn and most infrequently in spring (Figure 5-2). Although the seasonal
wind fields were similar to the period average slight variations were observed. The autumn and winter wind fields showed
more frequent winds from the south, with a predominance of north-westerly winds. Winds in the higher wind speed categories
are most common in spring, with the fewest calm conditions. The wind field in summer shows a predominance of northerly
winds.
Figure 5-1: Period average, day-time and night-time wind roses (measured data; 2016 to 2018)

GfE-MIR Alloys and Minerals (Pty) Ltd
Report No.: 17SAV28 Revision 1.3 Final 41
Figure 5-2: Seasonal wind roses (measured data; 2016 to 2018)
5.1.3.3 Temperature
Air temperature is important, both for determining the effect of plume buoyancy and determining the development of the mixing
and inversion layers. The monthly temperature trends are presented in Table 5-12 and Figure 5-3. The warmest temperatures
experienced from October to February, while the coolest temperature occur in June and July.
Table 5-12: Monthly temperature summary (2016 - 2018)
Hourly Minimum, Hourly Maximum and Monthly Average Temperatures (°C)
Irene weather station (2016 - 2018)
Statistic Jan Feb Mar Apr May Jun Jul Aug Sep Oct Nov Dec
Minimum 8.3 10.7 7.3 5.7 2.3 -1.1 -2.3 0.0 -0.6 2.8 3.9 10.7
Average 20.3 19.9 19.3 17.3 13.9 12.2 11.4 14.2 18.1 18.4 19.1 20.5
Maximum 35.0 31.1 29.4 28.3 22.8 21.8 21.8 26.8 30.7 32.8 31.8 32.8

GfE-MIR Alloys and Minerals (Pty) Ltd
Report No.: 17SAV28 Revision 1.3 Final 42
Figure 5-3: Monthly average temperature profile (measured data; 2016 to 2018; OR Tambo SAWS station)
5.1.3.4 Precipitation
Precipitation is important to air pollution studies since it represents an effective removal mechanism for atmospheric pollutants
and inhibits dust generation potentials. According to the rainfall data from the ORTIA station, the mean annual precipitation is
650 mm (for the three-year period 2016 to 2018 - Figure 5-4). Precipitation occurs as showers and thunderstorms and falls
mainly from October to May (approximately 90 days of measurable rain per year. The winter months are dry with the combined
rainfall in June, July and August making up only 1 % of the annual total.

GfE-MIR Alloys and Minerals (Pty) Ltd
Report No.: 17SAV28 Revision 1.3 Final 43
Figure 5-4: Monthly rainfall figures (measured data; 2016 to 2018; OR Tambo SAWS station)
5.1.3.5 Atmospheric Stability
The new-generation air dispersion models describe atmospheric stability as a continuum rather than discrete classes used in
older models. The atmospheric boundary layer properties are therefore described by two parameters; the boundary layer
depth and the Obukhov length. The Obukhov length (LMo) provides a measure of the importance of buoyancy generated by
the heating of the ground and mechanical mixing generated by the frictional effect of the earth’s surface. Physically, it can be
thought of as representing the depth of the boundary layer within which mechanical mixing is the dominant form of turbulence
generation (CERC, 2004). The atmospheric boundary layer constitutes the first few hundred metres of the atmosphere. During
daytime, the atmospheric boundary layer is characterised by thermal turbulence due to the heating of the earth’s surface.
Night-times are characterised by weak vertical mixing and the predominance of a stable layer. These conditions are normally
associated with low wind speeds and lower dilution potential.
Diurnal variation in atmospheric stability, as calculated from modelled data, and described by the inverse Obukhov length and
the boundary layer depth is provided in Figure 5-5. The highest concentrations for ground level, or near-ground level releases
from non-wind dependent sources would occur during weak wind speeds and stable (night-time) atmospheric conditions. For
elevated releases, unstable conditions can result in very high concentrations of poorly diluted emissions close to the stack.
This is called looping and occurs mostly during daytime hours. Neutral conditions disperse the plume equally in both the
vertical and horizontal planes and the plume shape is referred to as coning. Stable conditions prevent the plume from mixing
vertically, although it can still spread horizontally and is called fanning. For ground level releases, the highest ground level
concentrations will occur during stable night-time conditions.
Together with topography, atmospheric stability accounts for occurrence of low-level inversion layers where pollutants may
not disperse effectively. The upper air profile, generated by the AERMET pre-processor, accounts for periods when inversion
layers develop in the upper air.
Jan Feb Mar Apr May June Jul Aug Sep Oct Nov Dec
2016 123 65 137 14 49 11 15 0 3 50 210 120
2017 116 118 26 64 46 0 2 0 4 81 76 109
2018 63 93 115 23 24 0 1 0 11 52 50 78
0
50
100
150
200
250
Rai
nfal
l (m
m)

GfE-MIR Alloys and Minerals (Pty) Ltd
Report No.: 17SAV28 Revision 1.3 Final 44
Figure 5-5: Diurnal atmospheric stability (AERMET processed SAWS data, 2016 to 2018)
5.1.4 Ambient Air Quality Monitoring Data
Measured air quality data sets from the City of Ekurhuleni ambient monitoring network, including meteorological parameters,
were provided for use in this assessment. The dataset for the period 2018 was accessed from the Springs air quality monitoring
station was used, based on proximity to the GfE-MIR facility (5.2 km south-east). Although data for 2016 and 2017 was
requested, no data was not available via the South African Air Quality Information System (saaqis.environment.gov.za).
Data availability for the period (2018) is greater than 80% for SO2, PM10 and CO; while NO2 availability is low (Table 5-13).
Annual average concentrations of criteria pollutants measured at the Springs AQMS comply with SO2, NO2 and PM10 NAAQS
(Table 5-13). Hourly and daily exceedances were compliant with NAAQS for SO2 and NO2, while daily PM10 concentrations
exceeded the limit concentration 7 days during 2018; more than the permitted 4 days per year.

GfE-MIR Alloys and Minerals (Pty) Ltd
Report No.: 17SAV28 Revision 1.3 Final 45
Table 5-13: Data availability at the Springs AQMS (2018)
Pollutant Availability Annual average
concentration (µg/m³) Hourly exceedances Daily exceedances
SO2 82% 17.8 6 (maximum 535.6 µg/m³) -
NOx 55% 31.5 - n/a
CO 87% 0.4 - -
PM10 86% 24.6 n/a 7 (maximum 186 µg/m³)
The ‘openair’ statistical package (Carslaw & Ropkins, 2012; Carslaw, 2014) was used to plot the ambient pollutant
concentrations measured at the Spring AQMS. An analysis of the observed pollutant (SO2, NO2, and PM10) concentrations at
the Springs AQMS involved categorising the concentration values into wind speed and direction bins for different
concentrations. Polar plots can provide an indication of the directional contribution as well as the dependence of concentrations
on wind speed, by providing a graphical impression of the potential sources of a pollutant at a specific location. The directional
display is fairly obvious, i.e. when higher concentrations are shown to occur in a certain sector, e.g. south-westerly sector for
SO2 (Figure 5-6 (a)), it is understood that most of the high concentrations occur when winds blow from that sector. The dotted
circular lines indicate the wind-speed with which the concentrations are associated. Therefore, high concentrations (12 ppb or
31 μg/m³ or above) originate to the south-westerly sector at wind speeds greater than 3 m/s. Similarly, low wind speeds
(<2 m/s) result in an almost equal contribution to SO2 concentrations from all wind sectors.
A polar plot for hourly median NO2 (Figure 5-6 (b)) indicates elevated concentrations at low wind speeds from all directions.
The source is possibly associated where vehicle exhaust emissions on roads are the likely source of NO2. A daily average
PM10 polar plot indicates that elevated PM10 concentrations recorded at the Spring AQMS originate from the east of the station
at wind speeds above 2 m/s (Figure 5-6 (c)).
A time variation plot provides information regarding any time-based variations in pollutant concentrations. The figures indicate
the mean ± the 95% confidence interval. SO2 concentrations (Figure 5-7) show a peak in the mid-morning (probably
associated with the break-up of inversion layers and trapped pollutant plumes coming to ground. The increase in SO2
concentrations during winter (May - June) is likely to be associated with the use of coal, wood and gas for heating requirements,
especially in informal settlements or areas where electrification is less common, and increased frequency of inversion
conditions leading to poor pollutant dispersion. A time variation of NO2 indicates morning and evening peaks – a pattern
usually associated with vehicle traffic (Figure 5-8). The PM10 time variation pattern does not clearly suggest typical sources
patterns for either domestic fuel burning, road use, or industrial sources (Figure 5-9).

GfE-MIR Alloys and Minerals (Pty) Ltd
Report No.: 17SAV28 Revision 1.3 Final 46
(a) Hourly mean SO2 polar plot (b) Hourly mean NO2 polar plot (c) Daily mean PM10 polar plot
Figure 5-6: Polar plots for Springs AQMS, 2018

GfE-MIR Alloys and Minerals (Pty) Ltd
Report No.: 17SAV28 Revision 1.3 Final 47
Figure 5-7: Time variation of SO2 concentrations at the Springs AQMS
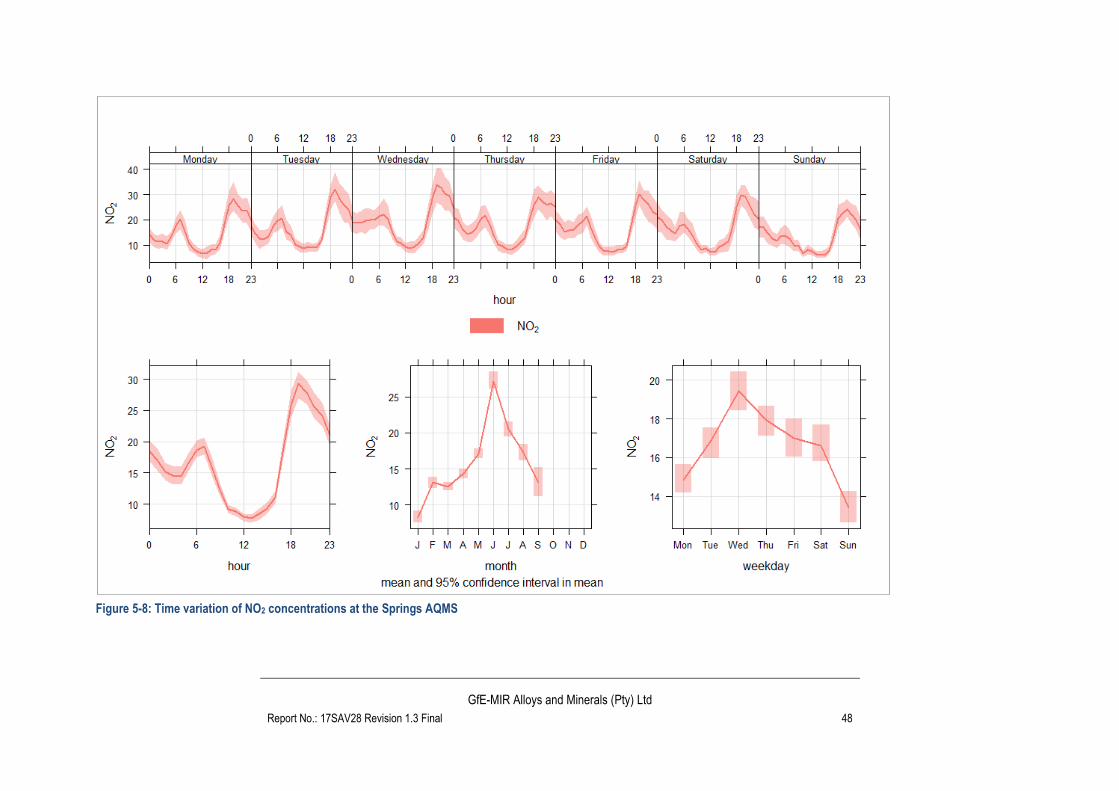
GfE-MIR Alloys and Minerals (Pty) Ltd
Report No.: 17SAV28 Revision 1.3 Final 48
Figure 5-8: Time variation of NO2 concentrations at the Springs AQMS

GfE-MIR Alloys and Minerals (Pty) Ltd
Report No.: 17SAV28 Revision 1.3 Final 49
Figure 5-9: Time variation of PM10 concentrations at the Springs AQMS

GfE-MIR Alloys and Minerals (Pty) Ltd
Report No.: 17SAV28 Revision 1.3 Final 50
5.1.5 Dispersion Modelling Results – Normal Operations
5.1.5.1 Simulated SO2 Concentrations
The simulated hourly SO2 concentrations were compliant with the hourly and daily limit concentration (Figure 5-10 and Figure
5-11) where the maximum simulated SO2 concentration were 5.5 μg/m³ and 1.8 µg/m³, respectively. Annual average SO2
concentrations were simulated to be less than 0.6 µg/m³ across the domain (Figure 5-12).
Figure 5-10: Simulated hourly average SO2 concentrations due to the GfE-MIR facility

GfE-MIR Alloys and Minerals (Pty) Ltd
Report No.: 17SAV28 Revision 1.3 Final 51
Figure 5-11: Simulated daily average SO2 concentrations due to the GfE-MIR facility
Figure 5-12: Simulated annual average SO2 concentrations due to the GfE-MIR facility

GfE-MIR Alloys and Minerals (Pty) Ltd
Report No.: 17SAV28 Revision 1.3 Final 52
5.1.5.2 Simulated NO2 Concentrations
The simulated hourly NOX concentrations were compliant with the hourly limit concentration of 200 µg/m³ (Figure 5-13),
assuming all NOX converts to NO2, such that the maximum simulated NO2 concentration was 81.3 μg/m³. Annual average NO2
concentrations were simulated to be less than 4.8 µg/m³ across the domain (Figure 5-14).
Figure 5-13: Simulated hourly average NO2 concentrations due to the GfE-MIR facility

GfE-MIR Alloys and Minerals (Pty) Ltd
Report No.: 17SAV28 Revision 1.3 Final 53
Figure 5-14: Simulated annual average NO2 concentrations due to the GfE-MIR facility
5.1.5.3 Simulated PM10 Concentrations
The simulated daily PM10 concentrations were compliant with the daily limit concentration (Figure 5-15) where the maximum
simulated concentration was 19.7 μg/m³. Annual average PM10 concentrations were simulated to be less than 5.4 µg/m³
across the domain (Figure 5-16).

GfE-MIR Alloys and Minerals (Pty) Ltd
Report No.: 17SAV28 Revision 1.3 Final 54
Figure 5-15: Simulated daily average PM10 concentrations due to the GfE-MIR facility
Figure 5-16: Simulated annual average PM10 concentrations due to the GfE-MIR facility

GfE-MIR Alloys and Minerals (Pty) Ltd
Report No.: 17SAV28 Revision 1.3 Final 55
5.1.5.4 Simulated PM2.5 Concentrations
The simulated daily PM2.5 concentrations were compliant with the daily limit concentration (Figure 5-17) where the maximum
simulated concentration was 5.9 μg/m³. Annual average PM2.5 concentrations were simulated to be less than 1.9 µg/m³ across
the domain (Figure 5-18).
Figure 5-17: Simulated daily average PM2.5 concentrations due to the GfE-MIR facility

GfE-MIR Alloys and Minerals (Pty) Ltd
Report No.: 17SAV28 Revision 1.3 Final 56
Figure 5-18: Simulated annual average PM2.5 concentrations due to the GfE-MIR facility
5.1.5.5 Simulated CO Concentrations
The simulated hourly CO concentrations were compliant with the hourly limit concentration (Figure 5-19).

GfE-MIR Alloys and Minerals (Pty) Ltd
Report No.: 17SAV28 Revision 1.3 Final 57
Figure 5-19: Simulated hourly average CO concentrations due to the GfE-MIR facility
5.1.5.6 Non-criteria Pollutants
A screening exercise of non-criteria pollutants emitted from normal operations at the GfE-MIR facility, was undertaken to
identify pollutants that would be likely to exceed the most stringent health-effect screening levels identified (Table 5-14). The
simulated ground level concentrations for non-criteria pollutants were below the most stringent health effect screening levels
for all averaging periods.
Table 5-14: Screening of non-criteria pollutants against health risk guidelines
Metallic element
Acute exposure(a) [units: µg/m3] Chronic exposure(b) [units: µg/m3]
Minimum concentration(c)
Maximum concentration(d)
Strictest health effect
screening level
Minimum concentration(c)
Maximum concentration(d)
Strictest health effect
screening level
Baseline Emissions
As 2.97E-07 0.009 0.2 (e) 0 0.0007 0.015 (e)
Ni 4.02E-07 0.012 0.2 (e) 0 0.0010 0.014 (e)
(a) hourly concentrations compared with short-term / acute exposure health effect screening level
(b) annual concentrations compared with long-term / chronic exposure health effect screening level
(c) minimum concentration simulated across the domain
(d) maximum concentration simulated across the domain
(e) Californian OEHHA (μg/m³)
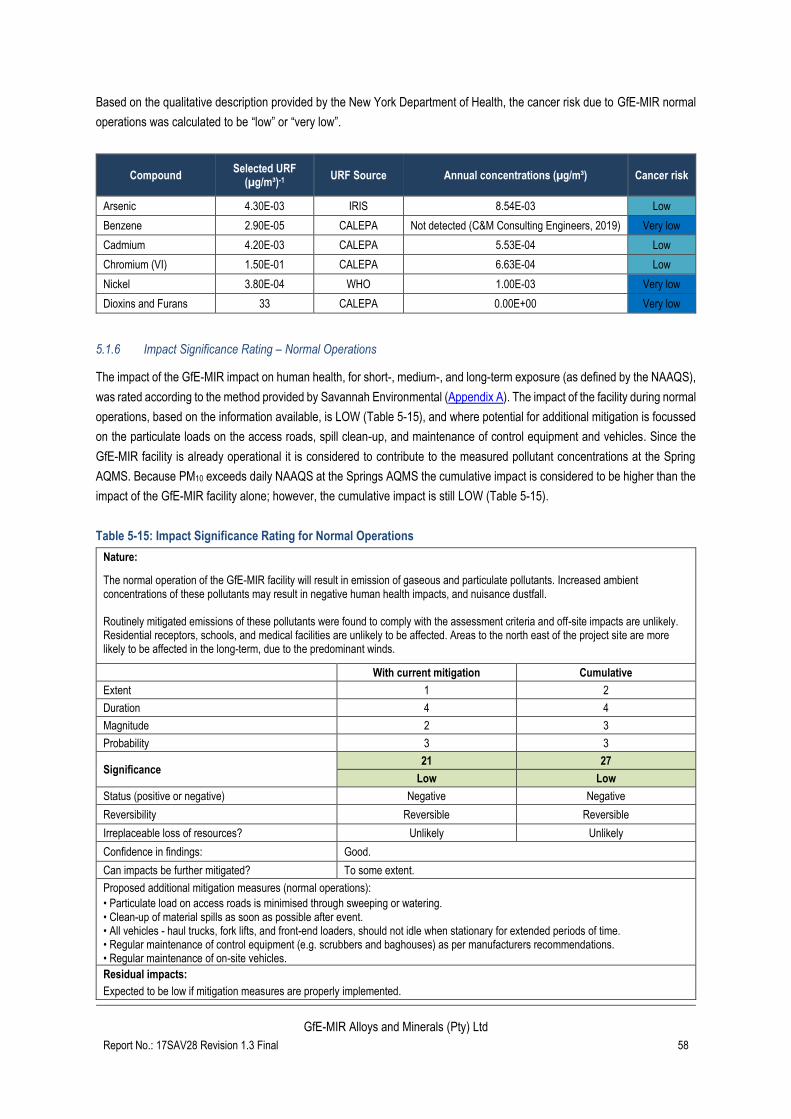
GfE-MIR Alloys and Minerals (Pty) Ltd
Report No.: 17SAV28 Revision 1.3 Final 58
Based on the qualitative description provided by the New York Department of Health, the cancer risk due to GfE-MIR normal
operations was calculated to be “low” or “very low”.
Compound Selected URF
(µg/m³)-1 URF Source Annual concentrations (µg/m³) Cancer risk
Arsenic 4.30E-03 IRIS 8.54E-03 Low
Benzene 2.90E-05 CALEPA Not detected (C&M Consulting Engineers, 2019) Very low
Cadmium 4.20E-03 CALEPA 5.53E-04 Low
Chromium (VI) 1.50E-01 CALEPA 6.63E-04 Low
Nickel 3.80E-04 WHO 1.00E-03 Very low
Dioxins and Furans 33 CALEPA 0.00E+00 Very low
5.1.6 Impact Significance Rating – Normal Operations
The impact of the GfE-MIR impact on human health, for short-, medium-, and long-term exposure (as defined by the NAAQS),
was rated according to the method provided by Savannah Environmental (Appendix A). The impact of the facility during normal
operations, based on the information available, is LOW (Table 5-15), and where potential for additional mitigation is focussed
on the particulate loads on the access roads, spill clean-up, and maintenance of control equipment and vehicles. Since the
GfE-MIR facility is already operational it is considered to contribute to the measured pollutant concentrations at the Spring
AQMS. Because PM10 exceeds daily NAAQS at the Springs AQMS the cumulative impact is considered to be higher than the
impact of the GfE-MIR facility alone; however, the cumulative impact is still LOW (Table 5-15).
Table 5-15: Impact Significance Rating for Normal Operations
Nature:
The normal operation of the GfE-MIR facility will result in emission of gaseous and particulate pollutants. Increased ambient concentrations of these pollutants may result in negative human health impacts, and nuisance dustfall. Routinely mitigated emissions of these pollutants were found to comply with the assessment criteria and off-site impacts are unlikely. Residential receptors, schools, and medical facilities are unlikely to be affected. Areas to the north east of the project site are more likely to be affected in the long-term, due to the predominant winds.
With current mitigation Cumulative
Extent 1 2
Duration 4 4
Magnitude 2 3
Probability 3 3
Significance 21 27
Low Low
Status (positive or negative) Negative Negative
Reversibility Reversible Reversible
Irreplaceable loss of resources? Unlikely Unlikely
Confidence in findings: Good.
Can impacts be further mitigated? To some extent.
Proposed additional mitigation measures (normal operations):
• Particulate load on access roads is minimised through sweeping or watering. • Clean-up of material spills as soon as possible after event. • All vehicles - haul trucks, fork lifts, and front-end loaders, should not idle when stationary for extended periods of time. • Regular maintenance of control equipment (e.g. scrubbers and baghouses) as per manufacturers recommendations. • Regular maintenance of on-site vehicles.
Residual impacts:
Expected to be low if mitigation measures are properly implemented.
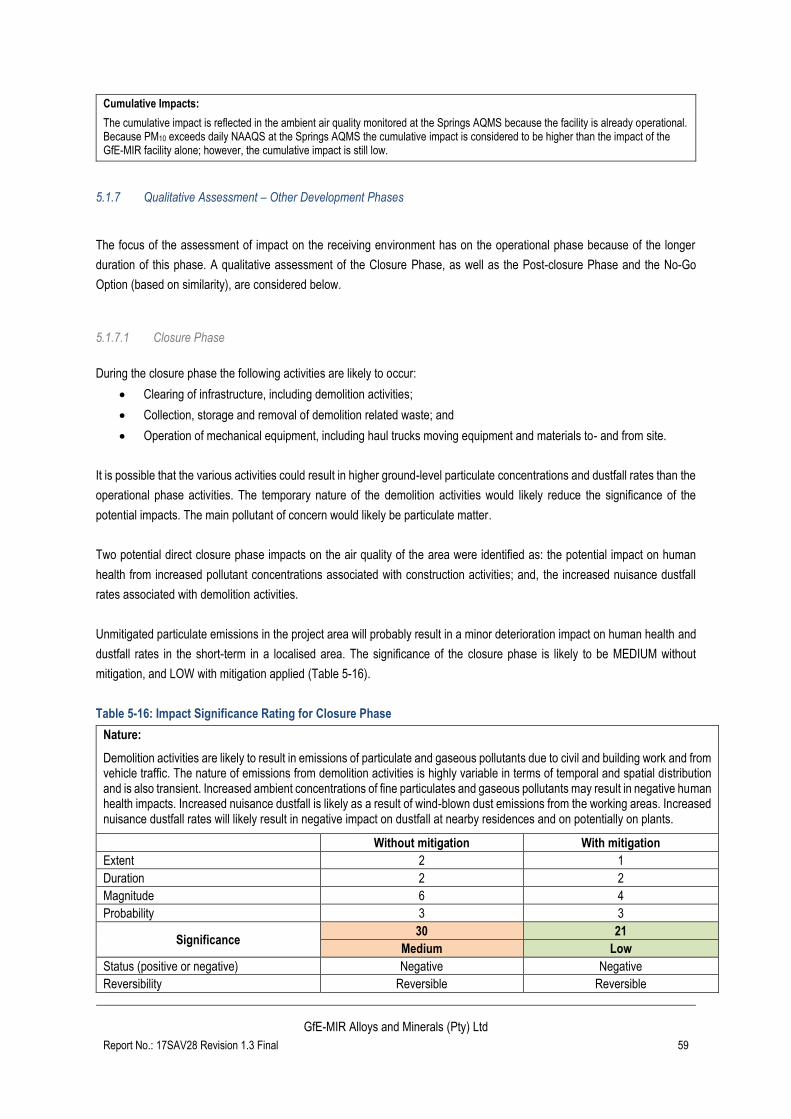
GfE-MIR Alloys and Minerals (Pty) Ltd
Report No.: 17SAV28 Revision 1.3 Final 59
Cumulative Impacts:
The cumulative impact is reflected in the ambient air quality monitored at the Springs AQMS because the facility is already operational. Because PM10 exceeds daily NAAQS at the Springs AQMS the cumulative impact is considered to be higher than the impact of the GfE-MIR facility alone; however, the cumulative impact is still low.
5.1.7 Qualitative Assessment – Other Development Phases
The focus of the assessment of impact on the receiving environment has on the operational phase because of the longer
duration of this phase. A qualitative assessment of the Closure Phase, as well as the Post-closure Phase and the No-Go
Option (based on similarity), are considered below.
5.1.7.1 Closure Phase
During the closure phase the following activities are likely to occur:
• Clearing of infrastructure, including demolition activities;
• Collection, storage and removal of demolition related waste; and
• Operation of mechanical equipment, including haul trucks moving equipment and materials to- and from site.
It is possible that the various activities could result in higher ground-level particulate concentrations and dustfall rates than the
operational phase activities. The temporary nature of the demolition activities would likely reduce the significance of the
potential impacts. The main pollutant of concern would likely be particulate matter.
Two potential direct closure phase impacts on the air quality of the area were identified as: the potential impact on human
health from increased pollutant concentrations associated with construction activities; and, the increased nuisance dustfall
rates associated with demolition activities.
Unmitigated particulate emissions in the project area will probably result in a minor deterioration impact on human health and
dustfall rates in the short-term in a localised area. The significance of the closure phase is likely to be MEDIUM without
mitigation, and LOW with mitigation applied (Table 5-16).
Table 5-16: Impact Significance Rating for Closure Phase
Nature:
Demolition activities are likely to result in emissions of particulate and gaseous pollutants due to civil and building work and from vehicle traffic. The nature of emissions from demolition activities is highly variable in terms of temporal and spatial distribution and is also transient. Increased ambient concentrations of fine particulates and gaseous pollutants may result in negative human health impacts. Increased nuisance dustfall is likely as a result of wind-blown dust emissions from the working areas. Increased nuisance dustfall rates will likely result in negative impact on dustfall at nearby residences and on potentially on plants.
Without mitigation With mitigation
Extent 2 1
Duration 2 2
Magnitude 6 4
Probability 3 3
Significance 30 21
Medium Low
Status (positive or negative) Negative Negative
Reversibility Reversible Reversible

GfE-MIR Alloys and Minerals (Pty) Ltd
Report No.: 17SAV28 Revision 1.3 Final 60
Irreplaceable loss of resources? Highly likely Likely
Confidence in findings: Moderate due to highly variable nature of demolition activities.
Can impacts be mitigated? Yes, with minimum control efficiency of 50%.
Proposed mitigation measures:
• Wet suppression at key handling points or cleared areas, and on roads. • Reduce unnecessary traffic. • Strict on-site speed control (i.e. 40km/hr for haul trucks). • Reduction of extent of open areas to minimised the time between clearing and infrastructure demolition, and/or use of wind breaks and water suppression to reduce emissions from open areas. • Restriction of major disturbance to periods of low wind speeds (less than 5 m/s). • Stabilisation of disturbed soil (for example, chemical, rock cladding, or vegetation). • Re-vegetation of cleared areas as soon as practically feasible.
Residual impacts:
Expected to be low if mitigation measures are properly implemented.
Cumulative Impacts:
The cumulative impact is likely to show elevated concentrations at nearest air quality monitoring stations, especially in the short-term (daily) and during periods of high wind speeds.
5.1.7.2 No-Go Option and Post-closure Phase
Should the no-go option (facility shut down) be embarked on, only the existing activities will occur in the area without the
addition of the GfE-MIR facility. The extent of the no-go option is assumed to be at the site level. Without the GfE-MIR facility,
the air quality is likely to persist, or slightly improve, in the long-term. The resultant impact of the no-go option is therefore
LOW (Table 5-17). The post-closure impacts of will be similar to the no-go option.

GfE-MIR Alloys and Minerals (Pty) Ltd
Report No.: 17SAV28 Revision 1.3 Final 61
Table 5-17: Impact Significance Rating for the No-Go / Shut-down option
Nature:
No-go or shut down of the GfE-MIR facility will reduce emissions of particulate and gaseous pollutants in the local area. The nature of the impract of other facilities and sources in the area will continue to contribute to ambient air quality.
Without mitigation
Extent 1
Duration 2
Magnitude 4
Probability 3
Significance 21
Low
Status (positive or negative) Negative
Reversibility Reversible
Irreplaceable loss of resources? Likely
Confidence in findings: Good.
Can impacts be mitigated? Unknown due to nature of other sources in the vicinity.
Proposed mitigation measures:
Unknown
Residual impacts:
Unknown
Cumulative Impacts:
No additional cumulative impact

GfE-MIR Alloys and Minerals (Pty) Ltd
Report No.: 17SAV28 Revision 1.3 Final 62
5.2 Analysis of Emissions’ Impact on the Environment
5.2.1 Dustfall Rates
Dustfall deposition rates were estimated due to TSP emissions from the quantified fugitive sources during the normal
operations of the facility (Table 4-7). Simulated dustfall rates (Figure 5-20) were found to be acceptable for residential areas
as defined by the NDCR, within 20 m of the south-eastern boundary of the 10 Atomic Street property (Table 5-8).
Figure 5-20: Simulated daily dustfall rates as a result of GfE-MIR
5.2.2 Impact Significance Rating
The impact of the facility was rated according to the method provided by Savannah Environmental (Appendix A) where the
significance of nuisance dustfall is likely to be similar to the normal operations (Table 5-15).
5.3 Main Findings
The main findings from the air quality impact assessment are:
• The GfE-MIR facility will need to comply with the minimum emission standards applicable to the listed activity
categories triggered by the active processes.
• Ambient air quality data from the Springs AQMS shows compliance with short-term and annual SO2 and NO2
standards, although short-term peak concentrations can occur. Daily PM10 concentrations were in non-compliance
with the NAAQS, where elevated concentrations originate to the east of the station. The GfE-MIR facility is located
north-west of the Springs AQMS.

GfE-MIR Alloys and Minerals (Pty) Ltd
Report No.: 17SAV28 Revision 1.3 Final 63
• Emissions quantification and dispersion modelling show that the GfE-MIR facility does not result in a substantive
concentrations of criteria air pollutants (NO2, SO2, PM10, PM2.5, and CO).
o The impact of the facility, based on information available, is rated as LOW, however, some additional
mitigation is recommended.
• Similarly, the GfE-MIR facility does not result in a substantive non-criteria pollutant concentrations or nuisance
dustfall.
• A draft dust management plan was prepared, and submitted to the authorities, in April 2018 (Savannah
Environmental, 2018). The following objectives are set out in this Dust Management Plan (Annexure C):
o Minimise dust and air emissions generated due to the GfE-MIR operations.
o Suppression of generated dust and particulate pollution control.
o Ensure emissions from all vehicles, including delivery vehicles, are minimised where possible, for the
during normal operations.
o Minimise nuisance to the community from dust emissions and comply with workplace health and safety
requirements during normal operations.
• Quarterly dustfall monitoring reports to be submitted to the licensing authority. Annual emissions monitoring and
reporting, as per license conditions.
It is the opinion of the specialist that the project can be authorised, but that mitigation measures and monitoring be
implemented prior to expiration of a Provisional AEL (usually valid for 1 year), in order to meet the requirements of the listed
activity.
5.4 Recommendations
5.4.1 Ambient Monitoring
Environmental indicators are used in air quality monitoring to simplify environmental assessments. Indicators are defined as
a single measure of a condition of an environmental element that represents the status or quality of that element, and a
threshold is the value of an indicator or index. For example, ambient PM10 concentrations monitored within a specific area will
be the indicator, with the NAAQS being the threshold.
It is recommended that a dustfall monitoring network consisting of five single dust buckets be established at key locations
around the boundaries of No 2 and No 10 Atomic street, to measure dustfall during normal operations of the facility (Figure
5-21). The recommended method should be as per the NDCR and the performance indicator should be compliance with the
non-residential dustfall standard.

GfE-MIR Alloys and Minerals (Pty) Ltd
Report No.: 17SAV28 Revision 1.3 Final 64
Figure 5-21: Recommended dustfall monitoring locations
5.4.2 Source Monitoring
It is recommended that as minimum the following emission sources be monitored once per year, or as directed by the licensing
authority:
• all stack sources, including the Aluminium Plant 1 and 2; Briquetting Plant Drier; Alumino-thermic Plant Scrubber
and baghouse.
• vehicle exhaust emissions testing for GfE-MIR owned and operated vehicles.

GfE-MIR Alloys and Minerals (Pty) Ltd
Report No.: 17SAV28 Revision 1.3 Final 65
6 COMPLAINTS
The facility introduced a complaints register during 2018. Two complaints have been received to date.
Date of complaint Complaint detail Finding from investigation Resolution
2019-01-24
Dust emissions from the
alumino-thermic bag
house stack
Fabric filter bags had been burned
The plant was shut down. Venturi
scrubber installed to replace the
baghouse.
2019-02-15
Dust emissions from the
alumino-thermic bag
house stack
Fabric filter bags had been burned in
the second baghouse
The plant was shut down. Bags
replaced after which the plant was
restarted.
7 CURRENT OR PLANNED AIR QUALITY MANAGEMENT INTERVENTIONS
The following air quality interventions have been implemented or are planned for implementation before the end of 2019.
Proposed intervention Target pollutants Date of implementation
Installation of venturi scrubber to the Alumino-
thermic process to reduce gaseous emissions
All pollutants emitted from the alumino-thermic
process. March 2019
Concreting and paving the previously unpaved
area outside the Aluminium Plant 1 Particulate emissions
May 2019 (65%
complete)
Upgrade of scrubber on Aluminium Plant 1
including, increasing stack height by 3 meters All pollutants emitted from the Aluminium Plant 1. April 2019
Installation of baghouse on one of the briquetting
crushing and screening plants Particulate emissions
Planned within 6 months
(before end of 2019)
8 COMPLIANCE AND ENFORCEMENT ACTIONS
The following compliance and enforcement actions have occurred in the past three (3) years:
A pre-application meeting was held on site on 21st February 2018. A Notice of Intention to issue a compliance notice ("pre-
compliance notice") was been issued by the Gauteng Department of Agriculture and Rural Development to the applicant on
7th March 2018. During the pre-application meeting, it was advised that a public participation process should be undertaken
before an application is submitted.
An advert, notifying the public of the Section 24G Application for a Waste Management License and the Section 22A
Application for an Atmospheric Emissions License required by GfE-MIR Alloys and Minerals (Pty) Ltd was placed in the Citizen
and Brakpan Herald on 16 March 2018. The 30-day review period was from 16th March 2018 to 19th April 2018. No comments
were received during this period.
On the 2nd March 2018, a meeting was held with the City of Ekurhuleni (CoE) Air Quality, CoE recommended a Dust
Management Action Plan (DMAP). On the 6th March 2018, a dust notice was received by CoE, and a DMAP was compiled
and submitted to Flip Visser.
A letter providing motivation as to why a combined application form should be completed was submitted to the Gauteng
Department of Agriculture and Rural Development (GDARD) on 15th June 2018. GDARD advised that separate applications
would be applicable for the different processes. Therefore, five different application forms were submitted on the 27th June
2018. GDARD received the applications on the 14th September and issued a directive on the 24th January 2019. Two (2)
extensions were granted by GDARD and the final public review period is from the 10th of July to the 12th August 2019.

GfE-MIR Alloys and Minerals (Pty) Ltd
Report No.: 17SAV28 Revision 1.3 Final 66
9 ADDITIONAL INFORMATION
No other information.

GfE-MIR Alloys and Minerals (Pty) Ltd
Report No.: 17SAV28 Revision 1.3 Final 67
ANNEXURE A

GfE-MIR Alloys and Minerals (Pty) Ltd
Report No.: 17SAV28 Revision 1.3 Final 68
ANNEXURE B

GfE-MIR Alloys and Minerals (Pty) Ltd
Report No.: 17SAV28 Revision 1.3 Final 69
REFERENCES
C&M Consulting Engineers. (2019). Emission Survey: GfE-MIR Alloys and Minerals SA (Pty) Ltd, Brakpan, Gauteng (Report
no. 770/17). Pretoria: C&M Consulting Engineers.
Carslaw, D. (2015). The openair manual - open-source tools for analysing air pollution data. Manual for version 1.1-4. King's
College London.
Carslaw, D., & Ropkins, K. (2012). openair - an R package for air quality data analysis. Environmental Modelling and Software,
27-28, 52 - 61.
CERC. (2004). ADMS Urban Training. Version 2. Unit A.
DEA. (2011). The Highveld priority area air quality management plan. Durban: Department of Environmental Affairs and
uMoya-NILU Consulting (Pty) Limited.
DEA. (2014). Regulations regarding Air Dispersion Modelling. Department of Environmental Affairs, Government Gazette No.
37804, 11 July 2014.
Government Gazette. (2013, November 22). Listed activities and associated minimum emissions standards. National
Environmental Management: Air Quality Act (39/2004), 37054.
Government Gazette. (2013, October 11). Regulations Prescribing Format of Atmospheric Impact Report. National
Environmental Management: Air Quality Act (39/2004), 36904.
Government Gazette. (2014, July 11). Regulations Regarding Air Dispersion Modelling. National Environmental Management:
Air Quality Act (39/2004), 37804.
Government Gazette. (2018, October 31). Amendments to the Listed Activities. National Environmental Management: Air
Quality Act (39/2004), 42013.
Hanna, S. R., Egan, B. A., Purdum, J., & Wagler, J. (1999). Evaluation of ISC3, AERMOD, and ADMS Dispersion Models with
Observations from Five Field Sites.
NPI. (2008). Emissions Estimation Technique Manual for Combustion Engines. Version 3. Canberra: Australian Government
Department of Sustainability, Environment, Water, Population and Communities.
NPI. (2012). Emission Estimation Technique Manual for Mining. Version 3.1. Canberra: Australian Government Department
of Sustainability, Environment, Water, Population and Communities.
Savannah Environmental. (2018). GfE-MIR Metals and Alloys Dust Management Action Plan. Woodmead, Johannesburg:
Savannah Environmental.
US EPA. (2011). AP 42, 5th Edition, Volume 1, Chapter13: Miscellaneous Sources, 13.2.1 Introduction to Fugitive Dust
Sources, Paved Roads. Retrieved from http://www.epa.gov/ttn/chief/ap42
GfE-MIR Alloys and Minerals (Pty) Ltd
Report No.: 17SAV28 Revision 1.3 Final 70
Appendix A: IMPACT ASSESSMENT METHODOLOGY
The potential significance of potential environmental impacts identified will be determined using the significance rating as
described below.
Assessment of Impacts
Direct, indirect and cumulative impacts of the issues identified through the scoping study, as well as all other issues identified
in the EIA phase must be assessed in terms of the following criteria:
» The nature, which shall include a description of what causes the effect, what will be affected and how it will be affected.
» The extent, wherein it will be indicated whether the impact will be local (limited to the immediate area or site of
development) or regional, and a value between 1 and 5 will be assigned as appropriate (with 1 being low and 5 being
high):
» The duration, wherein it will be indicated whether:
the lifetime of the impact will be of a very short duration (0–1 years) – assigned a score of 1;
the lifetime of the impact will be of a short duration (2-5 years) - assigned a score of 2;
medium-term (5–15 years) – assigned a score of 3;
long term (> 15 years) - assigned a score of 4; or
permanent - assigned a score of 5;
» The consequences (magnitude), quantified on a scale from 0-10, where 0 is small and will have no effect on the
environment, 2 is minor and will not result in an impact on processes, 4 is low and will cause a slight impact on processes,
6 is moderate and will result in processes continuing but in a modified way, 8 is high (processes are altered to the extent
that they temporarily cease), and 10 is very high and results in complete destruction of patterns and permanent cessation
of processes.
» The probability of occurrence, which shall describe the likelihood of the impact actually occurring. Probability will be
estimated on a scale of 1–5, where 1 is very improbable (probably will not happen), 2 is improbable (some possibility,
but low likelihood), 3 is probable (distinct possibility), 4 is highly probable (most likely) and 5 is definite (impact will occur
regardless of any prevention measures).
» the significance, which shall be determined through a synthesis of the characteristics described above and can be
assessed as low, medium or high; and
» the status, which will be described as either positive, negative or neutral.
» the degree to which the impact can be reversed.
» the degree to which the impact may cause irreplaceable loss of resources.
» the degree to which the impact can be mitigated.
The significance is calculated by combining the criteria in the following formula:
S=(E+D+M)P
S = Significance weighting
E = Extent
D = Duration
M = Magnitude
P = Probability
The significance weightings for each potential impact are as follows:
» < 30 points: Low (i.e. where this impact would not have a direct influence on the decision to develop in the area),
» 30-60 points: Medium (i.e. where the impact could influence the decision to develop in the area unless it is effectively
mitigated),

GfE-MIR Alloys and Minerals (Pty) Ltd
Report No.: 17SAV28 Revision 1.3 Final 71
» > 60 points: High (i.e. where the impact must have an influence on the decision process to develop in the area).
Assessment of impacts must be summarised in the following table format. The rating values as per the above criteria must
also be included. Complete a table and associated ratings for each impact identified during the assessment.
Example of Impact table summarising the significance of impacts (with and without mitigation)
Nature:
[Outline and describe fully the impact anticipated as per the assessment undertaken]
Without mitigation With mitigation
Extent High (3) Low (1)
Duration Medium-term (3) Medium-term (3)
Magnitude Moderate (6) Low (4)
Probability Probable (3) Probable (3)
Significance Medium (36) Low (24)
Status (positive or negative) Negative Negative
Reversibility Low Low
Irreplaceable loss of resources? Yes Yes
Can impacts be mitigated? Yes Yes
Mitigation:
“Mitigation“, means to anticipate and prevent negative impacts and risks, then to minimise them, rehabilitate or repair impacts to the
extent feasible.
Provide a description of how these mitigation measures will be undertaken keeping the above definition in mind.
Cumulative impacts:
“Cumulative Impact”, in relation to an activity, means the past, current and reasonably foreseeable future impact of an activity, considered
together with the impact of activities associated with that activity, which in itself may not be significant, but may become significant when
added to existing and reasonably foreseeable impacts eventuating from similar or diverse activities1.
Residual Risks:
“Residual Risk”, means the risk that will remain after all the recommended measures have been undertaken to mitigate the impact
associated with the activity (Green Leaves III, 2014).
Assessment of Cumulative Impacts
As per DEA’s requirements, specialists are required to assess the cumulative impacts. In this regard, please refer to the
methodology below that will need to be used for the assessment of Cumulative Impacts.
“Cumulative Impact”, in relation to an activity, means the past, current and reasonably foreseeable future impact of an activity,
considered together with the impact of activities associated with that activity, which in itself may not be significant, but may
become significant when added to existing and reasonably foreseeable impacts eventuating from similar or diverse activities2.
The role of the cumulative assessment is to test if such impacts are relevant to the proposed project in the proposed location
(i.e. whether the addition of the proposed project in the area will increase the impact). This section should address whether
the construction of the proposed development will result in:
» Unacceptable risk
» Unacceptable loss
» Complete or whole-scale changes to the environment or sense of place
» Unacceptable increase in impact
1 Unless otherwise stated, all definitions are from the 2014 EIA Regulations, GNR 982 2 Unless otherwise stated, all definitions are from the 2014 EIA Regulations, GNR 982

GfE-MIR Alloys and Minerals (Pty) Ltd
Report No.: 17SAV28 Revision 1.3 Final 72
The specialist is required to conclude if the proposed development will result in any unacceptable loss or impact considering
all the projects proposed in the area.
Example of a cumulative impact table:
Nature: Complete or whole-scale changes to the environment or sense of place (example)
Overall impact of the proposed project
considered in isolation
Cumulative impact of the project and other
projects in the area
Extent Low (1) Low (1)
Duration Medium-term (3) Long-term (4)
Magnitude Minor (2) Low (4)
Probability Improbable (2) Probable (3)
Significance Low (12) Low (27)
Status (positive/negative) Negative Negative
Reversibility High Low
Loss of resources? No No
Can impacts
be mitigated?
Yes
Confidence in findings:
High.
Mitigation:
“Mitigation“, means to anticipate and prevent negative impacts and risks, then to minimise them, rehabilitate or repair impacts to the
extent feasible.
Provide a description of how these mitigation measures will be undertaken keeping the above definition in mind.
Environmental Management Plan Table format
Measures for inclusion in the draft Environmental Management Programme must be laid out as detailed below:
OBJECTIVE: Description of the objective, which is necessary in order to meet the overall goals; these take into account the
findings of the environmental impact assessment specialist studies
Project component/s List of project components affecting the objective
Potential Impact Brief description of potential environmental impact if objective is not met
Activity/risk source Description of activities which could impact on achieving objective
Mitigation:
Target/Objective
Description of the target; include quantitative measures and/or dates of completion
Mitigation: Action/control Responsibility Timeframe
List specific action(s) required to meet the mitigation
target/objective described above
Who is responsible for the
measures
Time periods for implementation of
measures
Performance Indicator Description of key indicator(s) that track progress/indicate the effectiveness of the management plan.
Monitoring Mechanisms for monitoring compliance; the key monitoring actions required to check whether the objectives are
being achieved, taking into consideration responsibility, frequency, methods and reporting

GfE-MIR Alloys and Minerals (Pty) Ltd
Report No.: 17SAV28 Revision 1.3 Final 73
APPENDIX B: AUTHORS CURRICULUM VITAE

GfE-MIR Alloys and Minerals (Pty) Ltd
Report No.: 17SAV28 Revision 1.3 Final 74

GfE-MIR Alloys and Minerals (Pty) Ltd
Report No.: 17SAV28 Revision 1.3 Final 75

GfE-MIR Alloys and Minerals (Pty) Ltd
Report No.: 17SAV28 Revision 1.3 Final 76

GfE-MIR Alloys and Minerals (Pty) Ltd
Report No.: 17SAV28 Revision 1.3 Final 77

GfE-MIR Alloys and Minerals (Pty) Ltd
Report No.: 17SAV28 Revision 1.3 Final 78
GfE-MIR Alloys and Minerals (Pty) Ltd
Report No.: 17SAV28 Revision 1.3 Final 79

GfE-MIR Alloys and Minerals (Pty) Ltd
Report No.: 17SAV28 Revision 1.3 Final 80
ANNEXURE C: DUST MANAGEMENT ACTION PLAN (2018)

GfE-MIR Alloys and Minerals
Dust Management Action Plan
Brakpan, Gauteng Province
27 March 2018

Dust Management Action Plan March 2018
GfE-MIR Alloys and Minerals
Prepared by:
Prepared for:
GfE-MIR Alloys and Minerals
Atomic Road
Vulcania
Brakpan

Gfe-MIR Alloys and Minerals March 2018
Project Details Page i
PROJECT DETAILS
Title : Dust Management Action Plan for the GfE-MIR Alloys and Minerals Briquetting
Plant
Authors : Savannah Environmental (Pty) Ltd
Sharon Meyer and Terri Bird (Airshed Planning Professionals Pty Ltd)
Client : GfE-MIR Alloys and Minerals
Mike Cunningham
Report Revision : Revision 1
Date : March 2018
When used as a reference this report should be cited as: Savannah Environmental (2018) Dust Management
Action Plan for the GfE-MIR Alloys and Minerals Briquetting Plant, Brakpan, Gauteng Province.
COPYRIGHT RESERVED
This technical report has been produced for GfE-MIR Alloys and Minerals Pty Ltd. The intellectual
property contained in this report remains vested in Savannah Environmental (Pty) Ltd. No part of the
report may be reproduced in any manner without written permission from Savannah Environmental (Pty)
Ltd or GfE-MIR Alloys and Minerals Pty Ltd.

Gfe-MIR Alloys and Minerals March 2018
Table of Contents Page ii
TABLE OF CONTENTS
PROJECT DETAILS ............................................................................................................................................................ i
TABLE OF CONTENTS ...................................................................................................................................................... ii
1 Objectives of the Dust Management Plan..........................................................................................................3
1.1..... Process Description and Source Identification 3
1.2..... Emission Control Options – Open areas 5
1.3..... Transportation Facilities 6
1.4..... General Control Initiatives 9
2 Air Quality Monitoring Programme....................................................................................................................10
2.1..... Monitoring Standards 10
2.1.1 Ambient Monitoring........................................................................................................................................10
2.2..... Monitoring Equipment 10
2.2.1 Dustfall Sampling.............................................................................................................................................10
2.3..... Monitoring Programme 11
2.4..... Justification for Monitoring Programme 11
3 Audits and Inspections........................................................................................................................................12
4 Incidents, Complaints and Reporting................................................................................................................12
4.1..... Incidents 12
4.2..... Complaints 12
4.3..... Reporting 13
5 timeframes............................................................................................................................................................14
6 Review...................................................................................................................................................................14
7 Conclusion............................................................................................................................................................14

Gfe-MIR Alloys and Minerals March 2018
3
1 OBJECTIVES OF THE DUST MANAGEMENT PLAN
The purpose of a Fugitive Dust Management Plan is to provide a detailed description of
measures that can be implemented to reduce and manage fugitive dust emissions. This
document outlines the methodology to reduce, manage and prevent dust emissions from the
briquetting stockpile area and main briquetting building. The following objectives are set out
in this Dust Management Plan:
Minimise dust and air emissions generated due to the GfE-MIR operations.
Suppression of generated dust and particulate pollution control.
Ensure emissions from all vehicles, including delivery vehicles, are minimised where
possible, for the duration of the operation phase.
Minimise nuisance to the community from dust emissions and comply with workplace
health and safety requirements for the duration of the operation phase.
»
1.1 Process Description and Source Identification
Raw materials are delivered by truck (approximately 10 trucks per week) and stockpiled in an
open area (1100 square meters) (Figure 1). Materials are moved as needed into the briquetting
plant (2120m2) where they are crushed (if necessary); mixed with a binding agent (Figure 2),
and pressed and compacted into briquettes, which are packed into large bags and stored to
be sold at a later stage (Figure 3).
Figure 1: Stockpiling area at briquetting plant

Gfe-MIR Alloys and Minerals March 2018
4
Figure 2: Handling of materials within the briquetting building
Figure 3: Storage of briquettes in large bags
Sources of emissions include:
Materials handling (delivery of raw materials; movement of raw materials from
stockpiles into building);
Fugitive emissions from the briquetting building because of material crushing and
loading of crushed material into briquetting hoppers;
Vehicle entrainment of particulates (entrainment by delivery vehicles; front-end
loaders (FELs); and fork-lifts);

Gfe-MIR Alloys and Minerals March 2018
5
Vehicle exhaust emissions, including gases and particulates, from: delivery vehicles,
FELs, and fork-lifts;
Wind-blown dust from the materials stockpiles and areas of material spillage; and
General housekeeping issues on site.
1.2 Emission Control Options – Open areas
The main techniques adopted to reduce potential windblown dust include source area
reduction, source improvement; and surface treatment methods:
Source extent reduction:
o Reduction in area of exposed raw material.
o Reduce the frequency of disturbance of raw materials.
o Dust spillage prevention and/or removal.
Source Improvement:
o Disturbed area wind exposure reduction, e.g. cladding between the
briquetting operation and the neighbouring properties.
Surface Treatment:
o Wet suppression.
o Chemical stabilisation.
o Covering of surface with less erodible aggregate material.
A combination of the above measures should be applied to the GfE-MIR operations to ensure
exposed areas are kept free of dry fine materials.
Table 1: Air quality management measures for stockpiles and open areas
Criteria Description
Wind Blown Dust Stockpiles and stockpile area
Emission hours During dry autumn, winter and spring months
During periods with high wind speeds
During periods of vehicular activity and deliveries.
Accountable person(s) Environmental Officer
Target control At least 70% on stockpiles.
At least 40% on stockpile areas.
Performance indicators Dustfall rates less than 1 200 mg/m2/day on-site.
No dust should be visible from exposed areas during episodes ofstrong winds.
Operating procedures Reduce drop-heights of raw materials from delivery vehicles orFELs (if practical);
Tarpaulin covers over entire extent of stockpiles; and
Water sprays on stockpiles and stockpile area.
Good housekeeping with daily cleaning up of site, including litter,spraying of material spills, containment of dirty water.
High CAPEX and long-term controls would include:
o Partial enclosure of the stockpile area (similar to productstorage area),
o Raw materials to arrive in sealed bags as possible;
o Cementing the full extent of the stockpile area, usingdirty recycled water to dampen the material and then

Gfe-MIR Alloys and Minerals March 2018
6
Criteria Descriptionsweep the damp material into bags for use in thebriquetting plant.
o Should the above not be effective, it is recommendedthat a long term solution could be the creation of aclosed trench downslope of the stockpile area (Figure 4).All spills can be sprayed into the trench on a daily basis.This can evaporate, and damp materials can bebagged for reuse in the briquettes. Dirty water can berecycled for spraying on site. Rain water collection intoJojo tanks could be used for dust suppression (Figure 5).
Inspections Visual inspections by the Environmental Officer during periods of highwind speeds to ensure mitigation measures are in place.
Internal & Externalreporting
Dust bucket/s on site to assess efficacy of dust suppressionactions.
Monthly reporting to senior management.
Monthly evaluation of dustfall rates.
1.3 Transportation Facilities
High volumes of delivery trucks to the three GfE-MIR facilities may contribute to significant
particulate emissions. Even though the roads are municipal roads, management of particulate
loads on the roads near the GfE-MIR facilities is recommended, where possible.
Two types of controls can be implemented to reduce emissions from roads:
(a) Traffic control measures aimed at reducing the entrainment of material by restricting traffic
volumes and reducing vehicle speeds, and
(b) Measures aimed at binding the surface material or enhancing moisture retention, such as
wet suppression and chemical stabilization.
The main dust generating factors on road surfaces include:
Vehicle speeds;
Number of wheels per vehicle;
Traffic volumes;
Particle size distribution of surface material;
Moisture content of surface materials; and
Climate.
The use of water sprays on roads is the most common means of suppressing fugitive dust due
to vehicle entrainment, but it is not necessarily the most efficient means. Other options can
include: regular sweeping and road surface clearing; and chemical suppressants. It is
suggested that the following mitigation and management measures are considered for
implementation to reduce impacts from vehicle particulate entrainment impacts:
1. Road surface material clean-up, followed up by ad hoc spill / or loose material clean
up.
2. Application of water to roads as a wet suppressant;
3. Covering of loaded trucks to prevent material spillages on the roads;
4. Repair/maintenance of paved road verges (pavements) where delivery trucks park;
5. Mitigation of surrounding open areas (stockpiles) to prevent loose/fine material being
deposited on the roads; and

Gfe-MIR Alloys and Minerals March 2018
7
6. Washing down of vehicles post-delivery or pick-up, so that dirty water from the trucks is
captured in the dirty water trench.
Figure 4: Recommended area for dirty water trench in relation to stockpile areas.
Recommend
ed area for
dirty water
trench
Stockpile
areas

Gfe-MIR Alloys and Minerals March 2018
8
Figure 5: Proposed Process Flow for Dust and Dirty Water Management

Gfe-MIR Alloys and Minerals March 2018
9
Table 2: Air quality management measures for roads
Criteria Description
Roads Road / road sections used by raw material transport vehicles.
Road / road sections used by product transport vehicles.
Operational hours 7h30 to 16h30 Monday to Friday.
Accountable person(s) Environmental Officer
Target control At least 50% as a result of:
Regular watering;
Regular sweeping to remove loose surface materials;
Covering of loaded trucks (raw materials or product).
Performance indicators No loose dust on road surfaces
Minimal visible dust when vehicles are moving on roads.
Dustfall rates less than 1 200 mg/m2/day near-site.
Operating procedures Regular (at least on a twice daily basis) watering of road surfaces,especially near materials handling points.
Immediate clean-up of loading spillages.
Water spraying road surfaces in between clean-up in the areabetween stockpiles where the road is covered by a thick layer ofdust.
Better housekeeping in terms of managing litter, maintainingverges and managing storm water on site.
Inspections Ad-hoc visual inspections by the Environmental Officer to ensuremitigation measures are in place
Quarterly inspections may be carried out by Ekurhuleni Air QualityControl Division to ensure systems are in place for continuous dustmanagement.
Alternatively an external inspection and report can be carriedout on a 6-monthly basis with report submission to Ekurhuleni.
Internal & Externalreporting
Monthly reporting to senior management
Monthly evaluation of dustfall rates and dust inspection logbooks(see Table 3)
1.4 General Control Initiatives
GfE-MIR should undertake the following general control initiatives:
1. Demarcation of specific areas where vehicles may travel;
2. Enforcement of vehicle speed restrictions (as far as practical on municipal roads),
through engagement with Municipality;
3. Ensure stockpiles of materials are covered, dust suppressed and allow runoff to the dirty
water trench;
4. Ensuring open areas prone to wind erosion are kept clean by spraying dust into trench;
and
5. Regular inspection and maintenance of the dust control equipment.
An environmental officer should be trained or employed by GfE-MIR Alloys and Minerals. The
Environmental Officer (EO) is responsible for the inspection, management and reporting on all
environmental issues on site, and will be responsible for implementing and maintaining the Dust
Management Action Plan.

Gfe-MIR Alloys and Minerals March 2018
10
2 AIR QUALITY MONITORING PROGRAMME
The monitoring programme will be expanded and revised after completion of the quantitative
assessment of all sources at GfE-MIR Alloys and Minerals during preparation of the Atmospheric
Impact Report (AIR).
2.1 Monitoring Standards
2.1.1 Ambient Monitoring
Should this be considered necessary by Ekurhuleni Air Quality Control Division, it is anticipated
that the Municipality would install equipment and carry out dust monitoring for the area.
Considering that the area is industrial, and that several companies operating are generating
dust, it is recommended that the below monitoring be undertaken as an indication of local
contribution to dust emissions.
The methods recommended for ambient monitoring are likely to include:
For dustfall, the NDCR specifies that the method to be used for measuring dustfall and
the guideline for locating sampling points shall be ASTM D1739 (American Standard for
Testing and Material) (1970), or equivalent method approved by any internationally
recognized body as per the National Dust Control Regulations GN R 827.
For PM10 and PM2.5 the method as set out by British Standards (BS EN 12341).
Should the discussed ambient monitoring be implemented the guidelines for ambient
monitoring will mostly be satisfied. An on-site weather station would support on-site particulate
monitoring.
2.2 Monitoring Equipment
2.2.1 Dustfall Sampling
The ASTM method covers the procedure of collection of dustfall and its measurement and
employs a simple device consisting of a cylindrical container (not less than 150 mm in
diameter) exposed for one calendar month (30 ±2 days). Even though the method provides
for a dry bucket, de-ionised (distilled) water can be added to ensure the dust remains trapped
in the bucket.
The bucket stand includes wind shield at the level of the rim of the bucket to provide an
aerodynamic shield. The bucket holder is connected to a 2m galvanized steel pole, which is
either planted and cemented or directly attached to a fence post (Figure 6). This allows for a
variety of placement options for the fallout samplers. Two buckets are usually provided for
each dust bucket stand. Thus, after the first month, the buckets are exchanged with the
second set.
Collected samples are sent to a laboratory for gravimetric analysis. At the laboratory, each
sample will be rinsed with clean water to remove residue from the sides, and the contents

Gfe-MIR Alloys and Minerals March 2018
11
filtered through a coarse (>1 mm) filter to remove insects and other course organic detritus.
The sample is then filtered through a pre-weighed paper filter to remove the insoluble fraction.
This residue and filter are dried, and gravimetrically analysed to determine total dustfall.
Figure 6: Dustfall collection unit example
2.3 Monitoring Programme
It is recommended that, as a minimum: annual stack emission sampling, annual vehicle
exhaust emissions testing for GfE-MIR owned and operated vehicles, continuous dustfall; and
six months PM10 and PM2.5 sampling be conducted as part of the GfE-MIR’s dust management
plan. These requirements will be discussed within the Air Impact Report that will be submitted
to the relevant authority.
2.4 Justification for Monitoring Programme
Recommended sampling locations and reasons will be provided after the quantitative
assessment of the facility on air quality.

Gfe-MIR Alloys and Minerals March 2018
12
3 AUDITS AND INSPECTIONS
Periodic inspections and external audits are essential for progress measurement, evaluation
and reporting purposes. It is recommended that internal site inspections and progress reporting
be undertaken at regular intervals (at least quarterly), with annual environmental audits being
conducted. Annual environmental audits should be continued at least until operation closure.
Results from site inspections and monitoring efforts should be combined to determine progress
against source- and receptor-based performance indicators. Progress should be reported to
all interested and affected parties, including authorities and persons affected by pollution.
The criteria to be taken into account in the inspections and audits must be made transparent
by way of minimum requirement checklists included in the management plan. Corrective
action or the implementation of contingency measures must be proposed to the stakeholder
forum in the event that progress towards targets is indicated by the quarterly/annual reviews
to be unsatisfactory.
4 INCIDENTS, COMPLAINTS AND REPORTING
4.1 Incidents
Emergency incidents, such as unmanaged dust generation events, will need to be
documented in detail. The summary of each emergency incident must include:
(a) Nature and cause of incident;
(b) Actions taken immediately following the incident to minimise impact; and
(c) Actions taken subsequent to reduce the likelihood of re-occurrence.
4.2 Complaints
A complaints register must be kept at all times detailing the following:
(a) Date and time of complaint;
(b) Person/entity lodging complaint and contact details;
(c) Nature of complaint;
(d) Actions taken immediately following the complaint to rectify situation;
(e) Actions taken to inform complainant of activities undertaken to rectify complaint and
to determine if corrective action was sufficient.
Should a complaint be received, the Site Manager should identify the cause of the complaint
and implement appropriate measures to reduce or eliminate the source of emission leading
to a complaint.

Gfe-MIR Alloys and Minerals March 2018
13
4.3 Reporting
The following reporting strategy is suggested:
1. Daily reporting in dust inspection and watering and cleaning log-books.
2. Internal dust monitoring report to be complied monthly.
3. Quarterly reports to City of Ekurhuleni Air Quality Division.
4. Annual monitoring reports to be compiled and supplied to stakeholders.
Table 3 and Table 4 provide examples of a dust inspection logbook and a water spray or
sweeping logbook that can be used as part of the day-to-day dust management at GfE-MIR.
Table 3: Example of dust inspection logbook
Date:
Inspector’s name:
Location:Surface dust assessment
Visible Dust Plume
Assessment
Very
little
Thin
coating
Thick
coating
No
Visible
Plume
Slightly
Visible
Plume
Clearly
Visible
Plume
Raw materials on Culperous
Road
Materials on briquette
stockpile area
Dust within briquette building
Dust from other operations
Table 4: Example of water spray/surface clean-up logbook
Date:
Operator’s name:
Location: Water spray applied/Area cleaned
Frequency of
watering
Frequency of
cleaningProblems
Stockpile area – briquetting
plant
Culperous Road
Inside the briquetting
building
Other surfaces around
briquetting plant

Gfe-MIR Alloys and Minerals March 2018
14
5 TIMEFRAMES
It is suggested that the less expensive actions be initiated immediately. Dust suppression
activities and log books should be adopted as of 1st April 2018. The full action plan should be
implemented by 01 August 2018, including the dirty water trench as recommended.
6 REVIEW
The dust management plan is a dynamic document and should be reviewed and updated at
least every five years as suggested by the Department of Environmental Affair’s Air Quality
Management Plan manual or upon any significant changes to GfE-MIR operations or if
requested by the municipality.
An Environmental Officer on site should be responsible for the monitoring of the
implementation of the Dust Management Action Plan, and should also identify any changes
required in the Plan in order to manage dust efficiently.
7 CONCLUSION
This Dust Management Action Plan was compiled by Savannah Environmental (Pty) Ltd and
Airshed Planning Professionals (Pty) Ltd. The recommendations provided have been identified
as practical and effective dust management actions that can be implemented over the short
term for long term results. The report has been compiled in response to the dust notice from
the City of Ekurhuleni Air Pollution Control Sector as received on 06.03.2018.
Kind Regards
Sharon Meyer
Principal Environmental Consultant
Savannah Environmental (Pty) Ltd
011 656 3237


![GFE Case Study 12_Investing in Change[1]](https://static.fdocuments.us/doc/165x107/577ca7c21a28abea748c8b79/gfe-case-study-12investing-in-change1.jpg)


