ATMOSPHERIC EFFECTS ON HEDONIC AND UTILITARIAN...
74
1 ATMOSPHERIC EFFECTS ON HEDONIC AND UTILITARIAN CUSTOMERS Authors: Maria Andersson Sara Palmblad Tajana Prevedan Tutor: Michaela Sandell Examiner: Rana Mostaghel Subject: Marketing Level and semester: Bachelor thesis - Spring 2012
Transcript of ATMOSPHERIC EFFECTS ON HEDONIC AND UTILITARIAN...

1
ATMOSPHERIC EFFECTS ON HEDONIC
AND UTILITARIAN CUSTOMERS
Authors: Maria Andersson
Sara Palmblad
Tajana Prevedan
Tutor:
Michaela Sandell
Examiner:
Rana Mostaghel
Subject:
Marketing
Level and semester: Bachelor thesis - Spring
2012
2
The authors of this study would like to thank everyone that
has contributed to the making of this bachelor thesis.
We want to give a special thank to Michaela Sandell,
who has guided us throughout this paper.

3
Abstract
This study brings up the importance of using the store environment as a tool for creating positive
consumer experiences. It compares two consumer shopping motives, hedonic (related to
sensations and fun) and utilitarian (related to fulfilling a task). The atmospheric variables that the
environment consists of are discussed and found to be affecting these two consumer groups in
different ways. The study takes a quantitative approach for investigating how these two
consumer types are affected by the store environment. Hedonic and utilitarian consumers are
then compared to see if there are any differences in how these consumers experience the store
environment. The findings show that there are no differences in what atmospherics that are liked
more by a hedonic compared to a utilitarian shopper. However, atmospherics are found to be
more memorable for hedonic consumers. Hedonic consumers are also found to like being in the
store more when signs are clear, and when it is easy to find departments, fitting rooms and cash
registers. The results also showed that to make hedonic customers revisit the store, retailers
should focus on the style of the store, floor space allocation, product presentation, sound level,
lighting and the interior material. To make utilitarian revisit the store, retailers should focus on
atmospherics such as architecture, the cleanliness, floor space allocation, product presentation,
flooring, color scheme of the store and the interior material.
Key words: Atmospherics, Hedonic, Utilitarian, Store environment, Experience marketing,
Retail
4
Table of Contents 1. Introduction ............................................................................................................................................. 7
1.1 Background ......................................................................................................................................... 7
1.2 Problem discussion ............................................................................................................................. 9
1.3 Purpose .............................................................................................................................................. 10
1.4 Outline of thesis ................................................................................................................................ 10
2. Literature review .................................................................................................................................. 11
2.1 Experience marketing ....................................................................................................................... 11
2.1.1 What is experience marketing? .................................................................................................. 11
2.1.2 Experience marketing as a tool .................................................................................................. 12
2.1.3 Personal variables affecting experience ..................................................................................... 13
2.2 Hedonic and utilitarian values........................................................................................................... 14
2.3 Approach and avoidance-behavior .................................................................................................... 15
2.4 Atmospherics .................................................................................................................................... 15
2.4.1 Layout and design ...................................................................................................................... 17
2.4.2 General interior variables ........................................................................................................... 17
2.5 Research gap ..................................................................................................................................... 18
2.5.1 Research question ...................................................................................................................... 19
3. Method ................................................................................................................................................... 20
3.1 Research purpose .............................................................................................................................. 20
3.2 Research approach ............................................................................................................................ 20
3.3 Research strategy .............................................................................................................................. 21
3.4 Research design ................................................................................................................................ 21
3.5 Data sources ...................................................................................................................................... 22
3.5.1 Source criticism ......................................................................................................................... 22
3.6 Research method ............................................................................................................................... 23
3.7 Survey design .................................................................................................................................... 24
3.7.1 General design ........................................................................................................................... 24
3.7.2 Introduction text ......................................................................................................................... 24
3.7.3 Question types ............................................................................................................................ 25
3.8 Sampling ........................................................................................................................................... 26
3.9 Data analysis method ........................................................................................................................ 27
3.10 Operationalization ........................................................................................................................... 29
3.11 Reliability ........................................................................................................................................ 33
3.12 Validity ........................................................................................................................................... 34
3.12.1 Pre-testing the survey ............................................................................................................... 35
3.13 Summary ......................................................................................................................................... 36
4. Data analysis .......................................................................................................................................... 37
4.1 Descriptive data ................................................................................................................................ 37
4.1.1 Response examination................................................................................................................ 37
4.1.2 Frequency examination .............................................................................................................. 38
4.2 Quality criteria .................................................................................................................................. 39
5
4.2.1 Reliability ................................................................................................................................... 39
4.2.2 Validity ...................................................................................................................................... 40
4.2.3 Summary .................................................................................................................................... 41
4.3 Hedonic and utilitarian respondents .................................................................................................. 41
4.3.1 Hedonic and utilitarian motives versus men and women ........................................................... 41
4.3.2 Summary .................................................................................................................................... 41
4.4 Comparative analysis of Atmospherics ............................................................................................. 42
4.4.1 Atmospherics and shopping motive ........................................................................................... 42
4.4.1.1 Atmospherics with most yes/no answers ................................................................................ 42
4.4.1.2 Atmospherics with least yes/no answers ................................................................................. 43
4.4.1.3 Most liked and disliked atmospherics ..................................................................................... 43
4.4.2 Atmospherics and if the hedonic and utilitarian shoppers had visited the store before ............. 44
4.4.3 Atmospherics and if hedonic and utilitarian shoppers liked being in the store .......................... 44
4.4.4 Atmospherics and the experience of the visit as a whole ........................................................... 45
4.4.5 Atmospherics and if respondents would like to visit store again. .............................................. 46
4.4.6 Conclusion ................................................................................................................................. 47
4.5 Comparative analysis of experiences ................................................................................................ 48
4.5.1 Experiences among hedonic and utilitarian shoppers ................................................................ 48
4.5.2 If experience was affected by a previous store visit .................................................................. 48
4.5.3 Experience and the liking or disliking to be in the store ............................................................ 48
4.5.4 Experiences and the liking or disliking of the experience as a whole ........................................ 49
4.5.5 Experiences and wanting to visit the store again ....................................................................... 50
4.5.6 Liked to be in the store and wanting to visit the store again ...................................................... 50
4.5.7 Summary .................................................................................................................................... 51
5. Discussion............................................................................................................................................... 52
5.1 Atmospherics as a whole .................................................................................................................. 52
5.2 Previous store visits .......................................................................................................................... 53
5.3 Liking or disliking being in the store environment ........................................................................... 53
5.4 Wanting to visit the store again......................................................................................................... 54
5.5 Experiences ....................................................................................................................................... 55
5.6 Summary ........................................................................................................................................... 55
6. Conclusions ............................................................................................................................................ 57
6.1 Academic implications ...................................................................................................................... 57
6.2 Managerial implications .................................................................................................................... 58
6.3 Limitations ........................................................................................................................................ 58
6.4 Further research ................................................................................................................................ 59
7. Reference list ......................................................................................................................................... 60
Appendix 1 - The Survey .......................................................................................................................... 64
Appendix 2 - Survey in English ............................................................................................................... 68

6
List of Tables
Table 1 ........................................................................................................................................................ 29
Table 2 ........................................................................................................................................................ 43
Table 3 ........................................................................................................................................................ 43
Table 4 ........................................................................................................................................................ 45
Table 5 ........................................................................................................................................................ 46
Table 6 ........................................................................................................................................................ 47
Table 7 ........................................................................................................................................................ 49
Table 8 ........................................................................................................................................................ 49
Table 9 ........................................................................................................................................................ 50
Table 10 ...................................................................................................................................................... 51
Table 11 ...................................................................................................................................................... 56
Table 12 ...................................................................................................................................................... 56
List of Figures
Figure 1 - Summary of the method chapter ............................................................................................... 36
Figure 2 - Hedonic and utilitarian customers in this study ........................................................................ 39
Figure 3 - Hedonic and utilitarian shopping motives among males and females ....................................... 41
7
1. Introduction
This chapter introduces the important terms of this study and how they are connected. It is
followed by a problem discussion, leading to the purpose of this study.
1.1 Background
Consumers of today demand more from shopping than just the purchasing of a core product
(Fiore & Kim, 2007; Turley & Chebat, 2002). Researchers have found two dimensions for
consumption reasons; hedonic, relating to feelings of sensations, and utilitarian, relating to
fulfilling a task (Batra & Ahtola, 1990 in Voss et al., 2003; Bäckström & Johansson, 2006).
Shopping is an experience that fills an emotional function (Bäckström & Johansson, 2006) and
some consumers seek arousal and enjoyment from shopping (Turley & Chebat, 2002). The
knowledge of this has contributed to the development of the term experience marketing.
Experience is what occurs when a person is “encountering, undergoing or living through things”
(Schmitt, 1999, p. 57). Experience marketing focuses on creating consumer experiences and
retailers compete by trying to stage consumer experiences by stimulating for example senses,
feelings and thoughts (Schmitt, 1999). If experiences are managed successfully, consumers
spend more time in the store, which may lead to longer browsing time (Turley & Chebat, 2002)
which increases impulse shopping (Beatty & Ferrell, 1998).
The consumer experience derives from two factors; the product itself or the environment
surrounding it (Berry et al., 2002 in Jain & Bagdare, 2009). Studies show that the store
environment functions as a successful tool for creating consumer experiences (Bäckström &
Johansson, 2006; Turley & Milliman, 2000). For example, consumers who find the environment
to be pleasing tend to evaluate the products more positively than if the environment is perceived
as unpleasant (Obermiller & Bitner, 1984 in Bitner, 1992). In order to create an experience,
retailers can shape different controllable elements of the physical store (Jain & Bagdare, 2009;
Terrblanche & Boshoff, 2001; Turley & Milliman, 2000), such as color, lighting, music, flooring
and product arrangements (Baker et al., 2002; Turley & Chebat, 2002).
8
Consumers use environmental cues when forming perceptions of the store (Bitner, 1992; Turley
& Chebat, 2002; Turley & Milliman, 2000). The store environment is highly connected with
successful sales in retail business (Bäckström & Johansson, 2006; Turley & Milliman, 2000). If
retailers know what variables contribute to positive in-store experiences, and combine these in a
way that stimulates the consumers positively, it is possible to influence consumers buying
intention (Miranda, 2008; Turley & Milliman, 2000). The key to make customers browse more
and stay longer in the retail environment is an appropriate combination of atmospherics and
providing the customer with an exciting shopping experience (Bellenger & Korgaonkar, 1980).
Browsing and staying longer increases impulse shopping and the amount of money customers
spend (Beatty & Ferrell, 1998; Turley & Milliman, 2000).
Today it is common that retailers offer similar products, which makes it important to distinguish
the company from competitors (Schmitt, 1999; Turley & Chebat, 2002). The physicality of the
store is a clear distinguishing factor in retail. It includes merchandise, in-store promotion,
location, environment and atmosphere (Davies & Ward, 2005). Store environments are difficult
for competitors to copy, which makes them a successful differentiation tool (Baker et al., 1992;
Davies & Ward, 2005; Turley & Chebat, 2002) that could give the retailer a competitive
advantage. Finding a competitive advantage is critical for retailers as it keeps from focusing on
offering a low price. Especially retailers with products similar to competitors have a greater need
to differentiate themselves (Turley & Chebat, 2002) and to present a unique shopping experience
(Baker et al., 2002; Tynan & McKechnie, 2009). Working effectively with store design should
therefore be of primary concern for retailers in competitive situations (Baker et al., 2002; Turley
& Chebat, 2002).
In order to satisfy the needs of the modern consumer retailers have to focus on providing
consumers with positive shopping experiences (Bäckström & Johansson, 2006; Schmitt, 1999;
Tynan & McKechnie, 2009). Some retailers have acknowledged this and are spending more
focus and resources to create such experiences (Bäckström & Johansson, 2006, Bigham, 2008 in
Tynan & McKechnie, 2009).
9
1.2 Problem discussion
There are many variables to consider when developing a successful shopping experience (Fiore
& Kim, 2007; Turley & Milliman, 2000). In order to understand how experiences are formed,
there is a need to take a customer perspective (Tynan & McKechnie, 2009). Previous studies
(Bäckström & Johansson, 2006) have demonstrated that the personnel have an immense impact
on customer experience and satisfaction in retail environments (Bitner, 1992). Bäckström and
Johansson (2006) examined how both consumers and retailers relate to in-store experiences.
Their result showed that even though retailers use new techniques to enhance consumer
experiences, the consumers’ seemed to be more interested in values of a more traditional nature,
such as the behavior of personnel, a satisfactory product range and a facilitating store layout.
However, a study by Lin and Liang (2011), showed that the physical environment is more
important than the social environment in service environments. According to their study, both
ambient and design factors are more influential on customer emotion and satisfaction than
personnel and the customer climate (Ibid). Since the physical environment is shown to be more
influential on customer emotion, this study will only focus on the store environment.
Research by Babin and Darden (1995) suggest that retailers should not expect atmospherics to
have the same effect on all consumers. According to Babin et al. (1995) shopping experiences
are subjective and may provide both utilitarian and hedonic value to customers. Depending on
the shopping motive, one of the values may inhibit the other. For example a customer that is
focused on a task might be distracted from what otherwise would contribute to an enjoyable
experience (Ibid). The problem that arises, because of different shopping motives, is that it
becomes difficult for the retailer to customize experiences that fit all customer types. In order to
create positive experiences for customers, regardless of their shopping motive, retailers need to
know what both types of customers’ value.
Although most major retailers nowadays do not make unconsidered decisions about store layout
and design, there are still many small and medium sized retailers that do (Turley & Milliman,
2000). This is a problem since redesigning unsuccessful store environments requires a lot of time
and resources (Turley & Chebat, 2002). Retailers that successfully plan the store environment
can make consumers feel pleasure and arousal. This increases the likelihood that consumers will
10
stay longer and spend more money (Babin & Dardin, 1995; Baker et al., 1992; Donovan et al.,
1994: Turley & Milliman, 2000). Managers need to understand how the environment can be used
to create customer experiences because if experiences are managed successfully, this will not
only contribute to increased sales numbers (Babin & Dardin, 1995; Baker et al., 1992; Donovan
et al., 1994; Turley & Milliman, 2000) but could also give a competitive advantage (Tynan &
McKechnie, 2009), and result in loyal customers that spread positive word of mouth (Smilansky,
2009 in Tynan & McKechnie, 2009). In order to create value for the company with the help of
the retail environment, managers need to have knowledge about what environmental aspects
create experiences that are valuable to different types of customers.
1.3 Purpose
The purpose of this study is to identify what creates positive consumer experiences in physical
retail environments.
1.4 Outline of thesis
The following chapters in this thesis will contain of:
Theory The theoretical chapter will present experience marketing, hedonic and
utilitarian value, approach and avoidance behavior, atmospherics and the
research gap.
Method The methodology chapter starts with a description of the research purpose,
approach, strategy and design. This is followed by an explanation of the
quantitative research method, survey design, sampling, data analysis
method, operationalization, reliability and validity.
Data analysis The data analysis chapter consists of results from the quantitative study
and that are presented through text, tables and figures.
Discussion The discussion chapter the survey results will be compared with the
theoretical chapter.
Conclusion The conclusion chapter will present the findings, the academic and
managerial implications, limitations and suggestions for further research.
11
2. Literature review
This literature review will first present the term experience marketing and how it can be used as
a marketing tool. Consumption motives, approach and avoidance behavior and the term
atmospherics are investigated and followed by a discussion of a research gap.
2.1 Experience marketing
2.1.1 What is experience marketing?
The term experience can be interpreted in different ways. It is for example used to express a
process, participation in an activity, the emotions that are felt through different stimuli and as an
outcome of learning experiences (Poulsson & Kale, 2004). Pine and Gilmore (1998, p. 98)
described experience as something that occurs “when a company intentionally uses services as
the stage and goods as props, to engage individual customers in a way that creates a memorable
event”. According to Schmitt (1999, p. 57) experiences “provide sensory, emotional, cognitive,
behavioral and relational values” which occurs “as a result of encountering, undergoing or living
through things”. Poulsson and Kale, (2004, p. 270) developed the definition of commercial
experiences as “engaging acts of co-creation between a provider and a consumer wherein the
consumer perceives value in the encounter and in the subsequent memory of that encounter.”
The value in experience comes from its intensity and the feelings of delight associated with it
(Ibid). Since experiences are co-created (Poulsson & Kale, 2004; Tynan & McKechnie, 2009),
the marketing practitioner should be flexible when responding to customer needs. The provider
of experiences should come up with values that their customers will value. The value proposition
offered should be a combination of sensory, relational, emotional, functional/utilitarian, social
and informational values (Tynan & McKechnie, 2009).
The consumption of experiences is traditionally associated with entertainment and leisure
industries such as amusement parks and theaters. Today, many industries such as tourism,
restaurants, manufacturing and retailing offer experiences to their customers in order to compete
on the market (Pine & Gilmore, 1998; Poulsson & Kale, 2004).
12
2.1.2 Experience marketing as a tool
Some retailers use experiences as a marketing tool by offering fun events, astonishing displays
and promotional activities that draw the customers to the store (Poulsson & Kale, 2004).
According to Pine and Gilmore (1998) experiences are created every time a company manages to
engage their customers in a personal or memorable way. Retailers should create marketing
experiences and captivate their customers by tying design elements and staged events to a
coherent theme. Further the retailers should focus on creating positive impressions and
eliminating negative ones, engage all five senses to support the theme and create memorable
experiences (Ibid). Schmitt (1999) presented an implementation tool for marketing managers,
suggesting experiences can be provided through; communications, displays of visual and verbal
identity, co-branding, product presence, spatial environments, electronic media and people.
These experience providers must be managed coherently, consistently and by paying attention to
detail (Ibid). According to Poulsson and Kale (2004) a successful experience should contain a
mixture of relevance, novelty, surprise, learning and engagement in order to provide meaningful
value to the customer. The more elements of this mix a marketer can offer, the greater the
intensity of the experience will be for the customer (Ibid).
There is an increase in experience-orientation among retailers, which can be seen in the variety
of activities that they engage in to satisfy their customers. A study by Bäckström and Johansson
(2006) showed the techniques retailers use when trying to create compelling in-store experiences
for their customers; (1) Education and knowledge intermediaries provide help and instructions
on how to use products. The use of technology is used more frequently to make the knowledge
more easy and fun. (2) Inspiration means presenting products in interesting ways to provide the
customer with suggestions and ideas on combinations or the usage of products. (3) Innovation
and facilitating cross-shopping by combining product categories that usually is not bought in the
same store to enhance the in-store experience. (4) Try-out opportunities allows and encourages
the customers to test the, fit, feel, taste or performance of products in the store. This increases the
possibility of a pleasurable experience as well as help consumers visualize the benefits of the
product offering. (5) Stimulating senses attracts the consumers’ attention. Besides the usage of
music or scents many stores entertain their customers with the help of technology-induced
movement (Bäckström & Johansson, 2006). Sensory experiences add value such as aesthetics or
13
excitement to products (Schmitt, 1999). By using multiple sensory cues retailers can increase the
effect and make it a more memorable (Pine & Gilmore, 1998) and positive experience for
customers (Tynan & McKechnie, 2009).
2.1.3 Personal variables affecting experience
People's reactions to retail settings are not universal. Different types of consumers behave
differently when exposed to the same atmospheric stimulus (Turley & Milliman, 2000). Different
individuals perceive experiences differently because they are personal and develop from the
interaction between a staged event and the state of mind (Pine & Gilmore, 1998). By interacting
with the customers the retailer is able to engage them in the experience (Poulsson & Kale, 2004).
Bäckström and Johansson (2006) present a theoretical framework for aspects that traditionally
are said to influence customers’ in-store experience. The framework consists of personal and
situational variables. Personal variables like age and mood influence consumers’ experiences.
Situational variables consist of elements in the store environment that influences consumers.
These variables correlate with different aspects that influence in-store experiences. Consumers
that are in a good mood tend to evaluate the store positively, whilst consumers that feel worn out
or tired may evaluate the store more negatively (Ibid).
A study by Eroglu and Machleit (1993) showed that customers experience the shopping
environment differently depending on their shopping motives. Task-oriented customers
experience more crowding and less satisfaction with the shopping environment than non-task
oriented customers (Ibid). The task-oriented customer pays little attention to the aspects of the
store environment that do not help them achieve their goal (Korgaonkar, 1981 in Eroglu &
Machleit, 1993). Non-task-oriented shoppers are shoppers who sees shopping and browsing as a
form of recreation or entertainment. These types of recreational customers are more engaged in
information seeking and pay more attention to stimulating and surprising environmental cues.
This makes an attractive decor and effective in-store merchandising key in attracting recreational
shoppers (Bellenger & Korgaonkar, 1980).
14
2.2 Hedonic and utilitarian values
Voss (et al., 2003) mean that there are two reasons for consuming products, hedonic and
utilitarian. Measuring hedonic and utilitarian dimensions is useful when companies want to know
the effects of experiential marketing or functional positioning strategies (Ibid).
Hedonic value is described to reflect the emotional value of the shopping (Baker et al., 2002),
and relates to the senses involved in using the product (Voss et al., 2003). Hedonic value is
subjective and personal and results from feelings, fun, fantasies and playing (Bäckström &
Johansson, 2006; Holbrook & Hirschman, 1982). According to Solomon et al. (2010) there are
different sorts of hedonic shopping motives such as utility anticipation, the optimization of
choice, negotiation, the feeling of power and authority, affiliation and stimulation. Hirschman
and Holbrook (1982, p. 92) define hedonic consumption as; “Those facets of consumer behavior
that relate to the multisensory, fantasy and emotive aspects of product usage experience”. The
experiential value of the shopping experience includes fun and aesthetic pleasure from imaginary
and sensory elements (Ibid). A study by Olsen and Skallerud (2011) suggests that hedonic
shopping value is for instance positively linked to accessibility and product value, which
activates the emotional worth and felt pleasure of the shopping experience. Physical aspects had
a negative effect on the hedonic shopping value (Ibid).
Utilitarian value is described as fulfilling a task (Bäckström & Johansson, 2006) and relates to
the functions of a product (Voss et al., 2003), as well as its performance. The selection of a
product is efficient and instrumental, and based on logical reasoning regarding the available
product information (Holbrook & Hirschman, 1982). Solomon et al., (2010) describes the
satisfaction of utilitarian needs as emphasizing the objective and tangibles. Utilitarian function is
related to the basics of reward or punishment, meaning the attitude towards if it will be
pleasurable or painful (Ibid). Olsen and Skallerud (2011) study results showed that utilitarian
shopping value is positively linked to the physical aspects and product assortment that is driven
by a sense of accomplishment, a goal to obtain sought-after goods, of the shopping trip (Ibid).
A Swedish study showed that retailers mainly focus their efforts on providing hedonic values
with the exception of grocery retailers who also represented a glimpse of utilitarian values. Even
15
though companies are using an increasing amount of advanced techniques to create positive
hedonic oriented consumer experiences, the consumers describe utilitarian aspects such as layout
and price as the most memorable experiences. This result suggests that utilitarian values such as
tidiness, a facilitating store layout, accommodating personnel and satisfying selection of products
need to be prioritized (Bäckström & Johansson, 2006).
2.3 Approach and avoidance-behavior
In order to conceptualize the effects of the store environment on consumer and employee
behavior, Bitner (1992) introduced the term servicescape. The servicescape is the physical
setting of the store, which includes environmental dimensions that influence humans cognitively,
emotionally and physiologically. These influences result in a behavior to approach or avoid the
servicescape (Ibid). Approach and avoidance-behavior originates from Mehrabian and Russel’s
(1974, in Bitner, 1992) research about how humans are affected by the physical environment.
Positive store atmosphere has been shown to increase approach behavior (Donovan & Rossiter,
1982) and approach behavior to an environment results in wanting to stay for a long time,
exploring the environment further (Bitner, 1992; Maymand & Ahmadinejad, 2011). Negative
atmosphere increases avoidance-behavior (Donovan & Rossiter, 1982) and avoidance behavior
comes from negative experiences, which results in wanting to leave the environment and never
return (Bitner, 1992). Retailers that seek to give customers a pleasurable experience should
encourage approach behavior not only to gain pleased customers (Bitner, 1992), but also because
pleasurable experiences from store environment leads to approach behavior, staying longer in the
store. Longer time spent in the store increases the likelihood of impulse shopping and impulsive
buying intentions that positively affects spending more money (Beatty & Ferrell, 1998; Donovan
& Rossiter, 1982; Maymand & Ahmadinejad, 2011).
2.4 Atmospherics
Researches that seek to conceptualize different aspects of the store environment that influences
experiences and behaviors often refer to these aspects as atmospherics (Baker, 1986; Sullivan &
Adcok, 2002 in Bäckström & Johansson, 2006). Kotler introduced the term atmospherics in
1973. It is the concept that has received the most attention regarding effects of the environment
on consumers (Bäckström & Johansson, 2006). According to Kotler (1973), atmospherics consist
16
of controllable elements of the store environment that the retailer consciously manipulates in
order to create certain effects on buyers. Many suggestions have been made about what elements
of the store environment should be regarded as atmospherics (Turley & Milliman, 2000;
Bäckström & Johansson, 2006). Bitner (1992) suggest the term environmental dimensions that
divided environmental cues into ambient conditions, space/function and signs, symbols and
artifacts. Ambient conditions are explained to consist of temperature, air quality, noise music and
odor (Ibid). These ambient factors, as well as design factors, are related to the customer’s overall
satisfaction (Lin & Liang, 2011).
Bitner’s (1992) environmental dimensions and Kotler’s (1973) atmospherics both describe
controllable aspects of the environment and Turley and Hoffman (2002) suggest that these terms
should be regarded as equal, since they both describe the same things. Turley and Milliman
(2000) try to classify atmospherics cues by using Berman and Evans (1995 in Turley &
Milliman, 2000) research. It is meant to help managers to identify and plan for using different
atmospherics, which will help to reach their target customers. Atmospherics are divided into;
external variables, general interior variables, layout and design variables, point of purchase and
decoration variables and human variables (Ibid).
Marketers claim that working with atmospherics is an important marketing strategy (Turley &
Milliman, 2000) and atmospheric planning can determine the success or failure of a company
(Bitner, 1990 in Turley & Milliman, 2000). In Turley and Milliman’s (2000) literature review, 25
of 28 studies found that atmospherics had a significant influence on sales. It was also concluded
that if atmospherics are managed properly, the outcome would be a unique shopping experience
for the customer (Turley & Chebat, 2002). Turley and Hoffman (2002) argue that working with
atmospherics is essential in order to create and offer in-store experiences. By doing this, retailers
have the possibility to influence consumer product decision (Ibid). However, since store
atmospherics interact with personal characteristics (Bitner, 1992) different customer groups and
individuals are differently affected by store atmospherics (Babin & Dardin, 1995; Bitner, 1992;
Turley & Chebat, 2002; Turley & Milliman, 2000). This makes the environment possible to use
as a segmentation tool (Turley & Chebat, 2002).
17
2.4.1 Layout and design
Store design usually describes tangible elements of the store environment. It could consist of the
overall style expressed through decoration and architecture (Gottdeiner, 1998, in Bäckström &
Johansson, 2006). It often relates to store layout and display, where display relates to the
presentation of products. Store design needs to fill certain factors as having a clean environment
(Bäckström & Johansson, 2006). Layout and design variables consists of space and allocation,
placement of merchandise, grouping of merchandise, placement of equipment, placement of cash
registers, waiting areas and waiting rooms, department locations, traffic flow, racks and cases
and furniture (Turley & Milliman, 2000).
Bäckström & Johansson (2006) imply that positive store layout experiences often derive from
products being available and easy to find. Using signs and information bills, making it easier for
the customer to find what he or she needs, has also been found to enhance positive consumer
experience. How products are displayed and presented in a store seems to enhance positive
consumer experience. When the products are easily available for the customer and are sorted in a
range of varieties (by color, trademark and style) this has a positive effect on consumer
experience (Ibid).
2.4.2 General interior variables
General interior variables consist of flooring and carpeting, color schemes, lighting, music,
scents, width of aisles, wall composition, paint and wallpaper, cleanliness. Several studies have
investigated general interior variables and consumers perceptions of these. What these studies
have in common is that perceptions of the interior influences approach and avoidance-behavior,
time spent in environment and sales (Turley & Milliman, 2000).
Single atmospherics such as music, scents, lighting and color has been the object for many
studies (Turley & Milliman, 2000). It has been found that playing music in stores has a
significant impact on consumer behavior. It affects sales, arousal, perceptions of time, and in-
store traffic flow (Turley & Milliman, 2002). In a study by Kerfoot et al. (2003), merchandise
color was found to have an immediate impact on the respondents, and tended to be the key
presentation element of a display. Color coordination was shown to be very important, since
18
using strongly contrasting colors and uncoordinated color arrangement resulted in unpleasant
responses and was associated with cramped and jumbled presentations. Using a wide variety of
colors was viewed as attractive and appealing, and had potential to positively impact respondents
to browse more. The respondents in this study only commented on the color in relation to
merchandise and not the background color (Ibid). Color has also been found to affect time spent
in store, pleasant feelings, arousal, image, and the ability to attract customers (Turley &
Milliman, 2000).
What is aesthetically pleasing is closely connected to the materials used in a store or display. For
example, glass cubes were thought of as being unusual, neat and tidy and displaying a smart
appearance associated with an up-market image. The combination of glass and chrome were
deemed as funky and fashionable. Shelves and rails were unattractive and red as a fixture color
was seen as tacky and garish, and were associated with low quality. Wood, on the other hand,
was associated with quality. It was inviting, seen as light and airy when used in displays, and
gave a more exclusive ambience when used for flooring and hangers. Displays that were neat and
sparse were associated with more exclusive brands, showing that the respondents associated
space with quality. Though, too much space made the respondents feel uncomfortable, since they
felt as if the personnel were staring at them, leaving them no privacy to browse alone (Kerfoot et
al., 2003).
2.5 Research gap
According to Turley and Hoffman (2002), offering a positive store environment is crucial in
order to offer experiences rather than just products or services (Ibid). Retail environments consist
of atmospherics (Bäckström & Johansson, 2006; Kotler, 1973; Turley & Milliman, 2000), and
there has been little research done about the layout and design aspects of the atmospherics
(Turley and Milliman, 2000). Multiple studies have investigated how singular atmospheric
variables such as color, music, material, scent, lighting and etcetera affect consumers in store
experiences (Bäckström & Johansson, 2006; Turley & Milliman, 2000). However there is a lack
of research regarding the interaction of the atmospherics in the store environment and how these
create and affect the consumer in-store experience (Baker et al., 1992; Beatty & Ferrell, 1998;
Davies & Ward, 2005).
19
The retail stores studied by Bäckström and Johansson (2006) all emphasized giving the
customers hedonic experiences, but the customers valued utilitarian experiences more. There
seems to be a knowledge gap amongst retailers regarding what factors in the retail environment
contributes to a positive store visit for the customers. Understanding and creating consumer
experiences requires a holistic approach from the consumers’ point of view (Tynan &
McKechnie, 2009). Researchers agree that the store environment can be used to create customer
experiences (Bäckström & Johansson, 2006; Turley & Milliman, 2000), however no study
combine the effects of atmospherics and how these affect hedonic and utilitarian consumers
experiences, although there is said to be a difference on how these types of customers experience
the store environment. Utilitarian consumers are said to pay little attention to things in the
environment that does not help them achieve their goal. Hedonic consumers are said to pay more
attention to decor and in-store merchandising and are also said to be more satisfied with the
environment than utilitarian consumers (Eroglu & Machleit, 1993; Bellenger & Korgaonkar,
1980). Voss et al. (2003) say that measuring hedonic and utilitarian dimensions is useful when
companies want to know the effects of experiential marketing or functional positioning strategies
(Ibid). Retailers need to know how the store environment should be designed to provide
experiences for both hedonic and utilitarian consumers. But no study, to the authors’ knowledge,
provides information that focuses on controllable elements of the store and how these can be
used to create positive experiences for both customer types.
This leaves the opportunity to research how hedonic and utilitarian customer groups are affected
by the store environment. An understanding of what factors in the environment that contributes
to approach and avoidance for these customer groups is important, because this helps retailers to
understand the outcome of the experience. By comparing hedonic and utilitarian consumers and
their experiences in retail environments there is a possibility to see differences in how they are
affected by the store atmospherics, and how these could be used to create positive experiences.
2.5.1 Research question
What atmospherics in a retail environment create a positive experience for hedonic compared to
utilitarian customers?

20
3. Method
This chapter presents the methods used in order to gather the empirical information required to
answer the research question.
3.1 Research purpose
A research purpose can be explanatory, exploratory or descriptive. The formulation of the
research question determines the research purpose and thus indicates the direction of the study.
Exploratory research purposes are useful when there is little knowledge about an area and there
is a need to create an overriding picture. Explanatory research purposes helps to explain why
things work in a specific way, since it seeks to identify the reason for a specific cause. When
there is a lot of information to be found about a specific marketing problem, but a clear and
distinct image is missing, a descriptive design is preferable (Christensen et al., 2001).
Descriptive research purposes answer questions of how, how many and also who-, what- and
when- questions. It is more common to use a descriptive research design when it is desirable to
investigate how things are, instead of explaining why they are the way they are (Christensen et
al., 2010). Because this study wants to answer the question of “what” it is appropriate to use a
descriptive research approach.
3.2 Research approach
Research can take an inductive or deductive approach. An inductive approach is often used for
qualitative studies since it is a process that involves gathering information about a topic in order
to formulate a research problem. Deductive approaches follows a linear research process and
starts with a research problem and then follows with gathering empirical data that is supposed to
answer the question (Bryman & Bell, 2005). A deductive approach is useful when it is desirable
to gather empirical information on the individual's view on defined conditions (Jacobsen, 2002),
which is the case in this study.
21
This study follows a deductive research approach since the research follows a linear process that
started out with the gathering of information on a specific topic. The research question will be
answered by gathering relevant empirical information.
3.3 Research strategy
There are different approaches for gathering data. Qualitative data often consists of words and
pictures, with methods that often require some form of deep interview in order to gather
empirical information. Quantitative data is more often statistically oriented and a common
method for collecting quantitative data is surveys. This is because researchers often want to
gather a large amount of results than can be generalized to a whole population. Quantitative
research approach seeks to measure, detect and determine relationships between different
variables. This makes a quantitative approach useful when some knowledge about the
investigation area already exists (Christensen et al., 2001).
According to Bryman and Bell (2005), quantitative studies are highly connected to a deductive
research approach and are very useful when wanting to answer questions of what. A quantitative
method makes it more likely to reach a larger group of respondents (Bryman & Bell, 2005). This
is of importance since in order to reach as many respondents as possible; it is useful to use
quantitative data. This is because there is no possibility to conduct interviews with a large
representative group of people in the given amount of time. Since the authors wish to answer the
question of what atmospherics create a positive in-store experience generally, a quantitative
strategy is appropriate. In this way a larger group of respondents can be investigated.
3.4 Research design
Comparative research design is applicable for studies when it is of interest to compare two
different cases to each other. This type of research design makes it possible to use quantitative as
well as qualitative methods (Bryman & Bell, 2005) and can focus on individuals, groups,
organizations and even societies (Bryman & Bell, 2011). In quantitative research, comparative
studies are often used as a prolonging of a cross-sectional research design. Cross sectional
research design is a wide and shallow investigation that studies a representative group of people

22
in a specific moment in time, and allows the results to be statistically generalized over a
population (Christensen et al., 2001).
This study is based on a comparative research design as it investigates differences between
hedonic and utilitarian consumers. Consumers will be divided into either utilitarian or hedonic
consumers and differences between what atmospherics affect these groups will then be
investigated. This makes it appropriate to use comparative design as a prolonging of a cross-
sectional design, since this study is of quantitative character.
3.5 Data sources
Secondary data is previously collected data that has been compiled in a different context and for
another purpose. The data consist of information found within organizations, in various
databases, scientific journals, reports and so forth. Secondary data is inexpensive and time
saving, but it can be difficult to find the specific data needed and it may be outdated when found.
This is a reason for the collection of new information, so called primary data. Primary data is up-
to-date and the needed information can be collected in the format most suitable for the research
purpose. Primary data is obtained through observations or communication with individuals or
groups. Techniques used to gather information are surveys, interviews, observations and
experiments (Christensen et al., 2001).
For this study, primary data has been used. By using a survey as a method for collecting primary
data, the researchers were able to adjust the questions to the research purpose and collect up-to-
date quantifiable data.
3.5.1 Source criticism
To ensure the reliability of secondary data (Christensen et al., 2001) the sources was reviewed
critically.
The authors chose to present definitions of the term experience marketing made by Pine and
Gilmore (1998), Schmitt (1999) and Poulsson and Kale (2004). Schmitt, Pine and Gilmore are
pioneers on the subject of experience marketing and even if their articles would not qualify as

23
scientific, their definitions of the term are valid and frequently used by other researchers. This is
the reason why the authors of this thesis estimated that their work still was relevant enough to
present and use as definitions.
Baker et al., (1992) examines the store environments effect on consumer behavior. Their study is
limited to only a few atmospherics, and includes social factors, meaning interaction from
personnel, as an atmospheric. The term atmospherics is not used in this study, instead a
framework including factors in the store environment, and social factors as personnel is
presented. However the study indicated that pleasure and arousal derived from the environment,
increased the willingness to buy, and further research on environmental cues is suggested.
Lin and Liang (2011) investigate the effects of the store environment, and even though this study
focuses on social aspects and service environments they state that the physical environment is
more important than the social, which makes their research interesting for this study.
3.6 Research method
The five major research methods are; experiments, surveys, archival analyses, histories and case
studies. The suitability of the different research methods varies depending on the type of research
question, the degree of control that the researcher has over the event and if the focus lies on
current instead of historical events (Yin, 2006). One of the most common methods for collecting
quantitative data when following comparative design is survey (Bryman & Bell, 2005). The
survey method is appropriate to use when the researcher focuses on current events, has no
control over respondent behavior or the investigated event and the research question is who,
what, where, how many or how much (Yin, 2006).
A survey study is a cross-sectional study where data is collected using questionnaires or
structured interviews on one occasion. The aim is to obtain quantitative data relating to two or
more variables, which are reviewed in order to find covariance patterns (Bryman & Bell, 2005).
Questionnaires can be made online and shared easily through email, web pages or social media.
These web-surveys have the advantage of being cheap, fast and easy to distribute but have the
24
disadvantage of low response rates due to internet and computer availability (Christensen et al.
2010)
Since the researchers want to know what atmospherics create a positive experience, and have no
control over respondents’ behavior and are interested in present events, the most appropriate
research method for this study is to conduct a survey. A survey facilitates the possibility to
investigate the correlation between several variables and to reach many respondents (Bryman &
Bell, 2005), which is what the authors strive to do. By conducting structured interviews the
authors would not be able to collect a sufficient amount of responses to study the variety. To
reach as many respondents as possible, at a low price and fast, the authors conducted a web-
survey.
3.7 Survey design
The survey consisted of a short introduction text, together with personal questions, and
statements (see Appendix 1 for the actual survey and Appendix 2 for English translation).
3.7.1 General design
The respondents could see the whole survey, look through it and see all the questions at the same
time (see Appendix 1). By doing this, the authors hoped that respondents would see the survey as
relatively short, and would be more likely to answer. Authors also tried to keep an “airy” look on
the survey, with space between the questions, and with a simple design, making it easy to browse
through. Bryman & Bell (2005) means that a light and short looking survey has a positive effect
on response rate (Ibid). All questions were mandatory to answer, in order to be able to get a
result out of the survey questions. The survey was sent to Swedish respondents and was therefore
written in Swedish.
3.7.2 Introduction text
The authors followed Bryman and Bell’s (2005) suggestions on presenting an introducing text
prior to the survey, containing details about the survey. It is recommended to explain the purpose
of the study, what the survey is a part of (for example a thesis), and who is conducting the
survey. It is also important to explain the role the respondent has in answering the survey. It
25
should be declared that the respondent has anonymity and that he or she answers voluntarily.
Information about how to contact the researchers should also be included in case the respondent
would have any further questions (Ibid). In order to have a high response rate, authors ensured
the anonymity in the introducing text. The estimated time of filling in the survey was presented
so that the respondent would be prepared on how much time the survey takes to complete (see
Appendix 1 & 2).
Grocery retailers sell fast moving essential and non-essential consumer goods such as food,
toiletries, disposable diapers etcetera. The authors believe that consumers visit grocery stores and
supermarkets more frequently than other retail stores because of the vital qualities of goods such
as food. Since food is essential for survival the authors also believe that grocery stores and
supermarkets are visited mainly for utilitarian reasons. These beliefs lead to the decision to
exclude these types of retail-stores from the survey, in order not to get a preponderance of
utilitarian oriented answers. A short sentence informing the respondents that the survey does not
include grocery stores was therefore added to the introduction text and repeated as a reminder
twice in the survey.
3.7.3 Question types
The survey started with personal questions such as gender, age, occupation. After these questions
a short text followed, informing respondents that following questions will be about their most
recent store visit, and reminded them that grocery stores and service were excluded from this
study. The authors wanted the respondents to base their answers on their latest store visit because
according to Pine and Gilmore (1998) experiences occur when a company intentionally uses
services and goods to engage customers in a way that creates a memorable event (Ibid).
Therefore the atmospherics the respondents remembered from this store visit is considered by the
authors to be part of their experience.
The survey for this study consists almost exclusively of closed questions. Closed questions are
easier to process, because the code for the analysis can be derived directly from the available
answers (Bryman & Bell, 2011). Closed questions help to clarify the meaning of the question for
the respondent and are easier and quicker for the respondents to fill in. Closed questions also
26
reduce the possibility for the researchers interpreting respondents answer in the wrong way
(Bryman & Bell, 2011).
According to Bryman and Bell (2011), open questions take time to analyze, because the answers
need to be coded. Open questions also require more time and effort from respondents, which
could mean that respondents avoid answering those questions, or the entire survey. This may
lead to low response rate (Ibid). Open questions, where respondents have the opportunity to
answer with own words, has been avoided in the survey, to save time when analyzing, and to
obtain a high response rate. For questions where there could be other answers possible than those
available in the survey, the respondents had the ability to click “Other” and type the answers
themselves. The Other answer was used for questions like; my current occupation, how I felt
when leaving/entering the store and the type of store that I last visited. However, this was only
done with questions where the respondent could choose one single word.
Bryman and Bell (2005) argue that questions need to be easy to understand, not include
negations, or be leading. Questions should also not be formulated as double questions since this
can make respondents confused (Ibid). When formulating questions, authors strived to keep the
text simple and without words that could be misunderstood or difficult to understand. Instead of
asking, are you a hedonic or a utilitarian shopper the authors asked did you have an errand.
Every question was carefully looked through by the authors, the tutor and a test group that was
asked to give feedback. Some questions were skipped due to being too similar to each other,
which could have made respondents irritated.
Statements were used instead of questions because authors believed that it is easier to approve or
deny a statement.
3.8 Sampling
The population for this study is everyone that visits stores. As a method for selecting
respondents, authors used convenience sampling. Convenience sampling is when researchers use
respondents that are available and easy to reach (Bryman & Bell, 2005). For this reason the
survey was conducted in Sweden and within the social network of the authors. For the survey,
27
600 respondents were chosen to participate and were invited via the social networking site
Facebook. All contacts of the authors that spoke Swedish were invited and asked to answer the
survey that was presented in a link on the event page.
Another form of sampling, similar to snowball sampling was also used, in order to complement
the convenience sampling. Snowball sampling means that selected respondents answer the
researchers’ questions, and then recommend other respondents for the researchers (Bryman &
Bell, 2005). Since the authors' contacts on Facebook mainly consisted of people aged 20-40,
other age groups were underrepresented in the sample. In order to reach specific respondent age
groups that the authors had difficulties to reach, some contacts in the desired age were selected to
pass the survey on to peers.
In line with Christensen et al. (2010) recommendations, the researchers sent out reminders to
those respondents who had not confirmed their participation in the survey. Because of the limited
time frame and since keysurvey.com demanded a fee after 200 responses, the authors set a
response limit at 200 respondents.
3.9 Data analysis method
There are multiple ways to analyze data; univariate analysis, bivariate analysis and multivariate
analysis. In a univariate analysis the researcher analyses one variable at the time. This can be
done by conducting for example a frequency table or a diagram. In a bivariate analysis the
researcher analyze two variables at the time to uncover whether the variables are related or not.
This can be done by testing the variables in for example a contingency table, Pearson’s r, Phi and
Cramer’s V (Bryman & Bell, 2011). A dichotomous variable can also be translated into a two-
point scale, which can be treated as a nominal scale (microsiris.com).
First, a descriptive data analysis was conducted in order to present the response rate and
frequencies. This was done by conducting univariate analysis, which was read by looking at the
amount and percentages of what the respondents answered. By looking at the univariate analysis,
it was possible to quickly see which questions that were not answered. The questions that are not
answered or answered wrongly will be removed. The frequency examination will present the
28
most basic information about the respondents, meaning if they are usually more hedonic than
utilitarian, how often they shop, what their last shopping motive was, which shop that was the
most recently visited retail store and what the occupation of the respondents were.
Secondly, in order to see if the survey answers measures up to the quality criteria, reliability and
validity will be tested. The reliability will be tested using Cronbach’s alpha where the average of
the coefficients will present if the survey answers measure up to the reliability. Validity will
examine what variables that will be dependent and independent.
Thirdly, a contingency table will be conducted in order to see differences between hedonic and
utilitarian versus men and women. The contingency table will be read by looking at the
percentages of who many hedonic versus utilitarian respondents there are among men and
women. The Pearson Chi-square will be looked upon to see if there is any significance in the
result.
Fourthly, several tests are needed in order to do a comparative analysis of the atmospherics. The
atmospheric variables and most of the questions compared to them are nominal scale (including
the dichotomous variables). These were tested by conducting contingency tables. The same type
of test was conducted when testing nominal variables and likert scales. The results will be read
by looking at the Phi in order to see if there was any significance between for example the
atmospherics and wanting to visit the store again among hedonic respondents. Hedonic and
utilitarian respondents were tested separately by using “select cases” in SPSS. The significances
among the atmospherics and for example wanting to visit the store again will be presented in a
table in the data analysis, in order to see the differences between hedonic and utilitarian
customers. The significant numbers will be marked by a star-symbol (*). If there is no significant
relationship between the atmospherics and for example to visit the store again, the results are less
important to show in a table and will instead be described in text.
Finally, the experience variables were likert scale and were mostly tested using a contingency
table, since the other variables such as wanting to visit the store again were nominal scale. The
contingency table were looked upon and presented in the same fashion as the atmospherics.
29
Since the experience variables were tested against another likert scale, a Pearsons r test was
conducted. The Phi was looked upon to see if there were any relationships between the variables
that will be presented using a table. Once again, the hedonic and utilitarian respondents were
tested separately using “select cases” in SPSS.
The data collected was tested by using a computer with the program PASW Statistics 18 by
SPSS Inc. Since the survey was designed and shared via keysurvey.com, it was possible to
download the excel-file containing all respondents’ answers and import it in the SPSS-program.
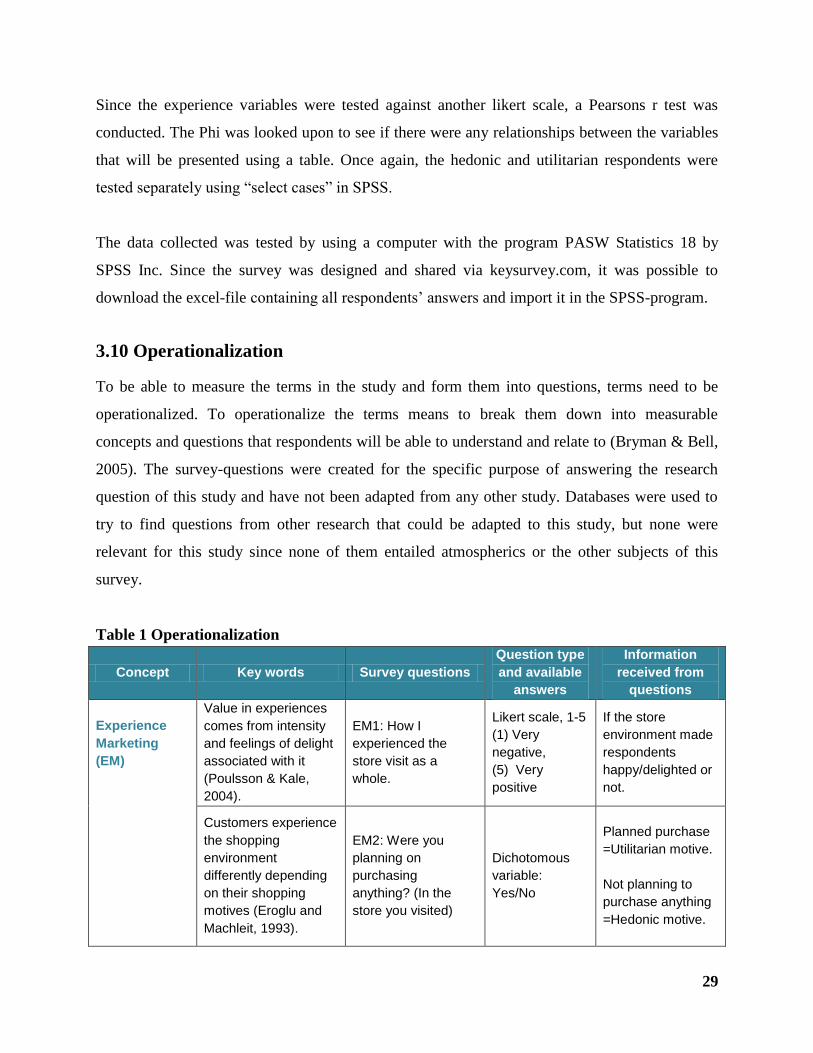
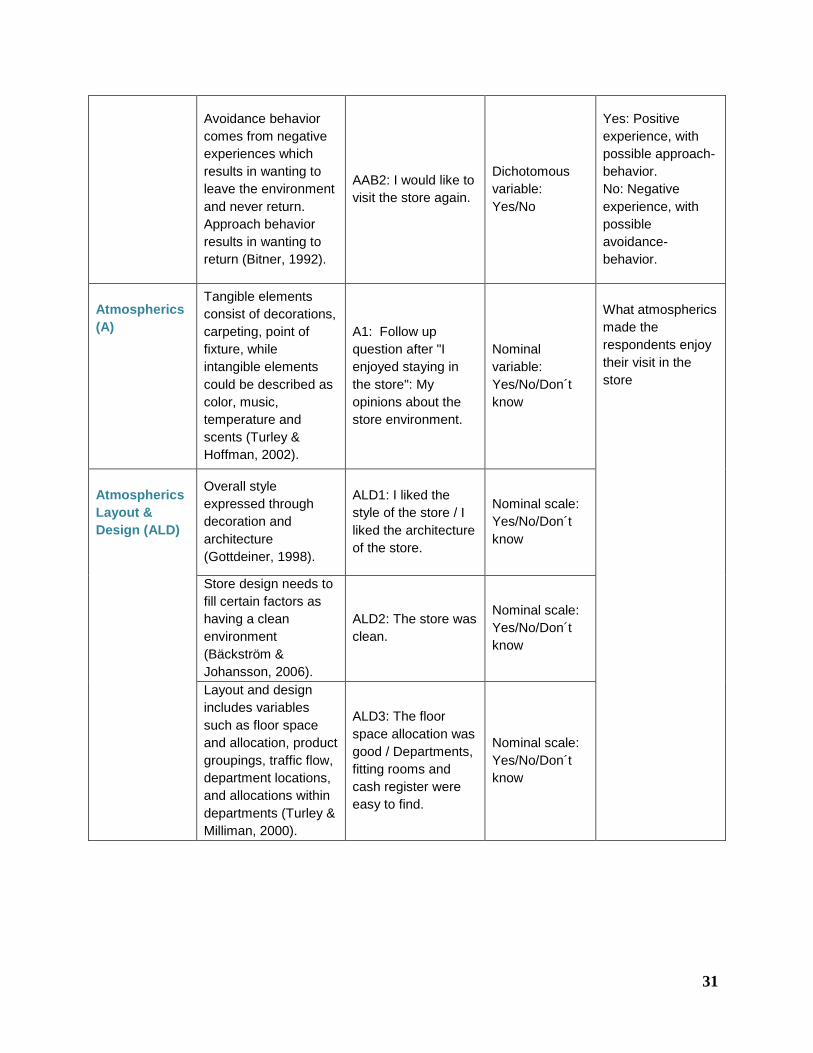
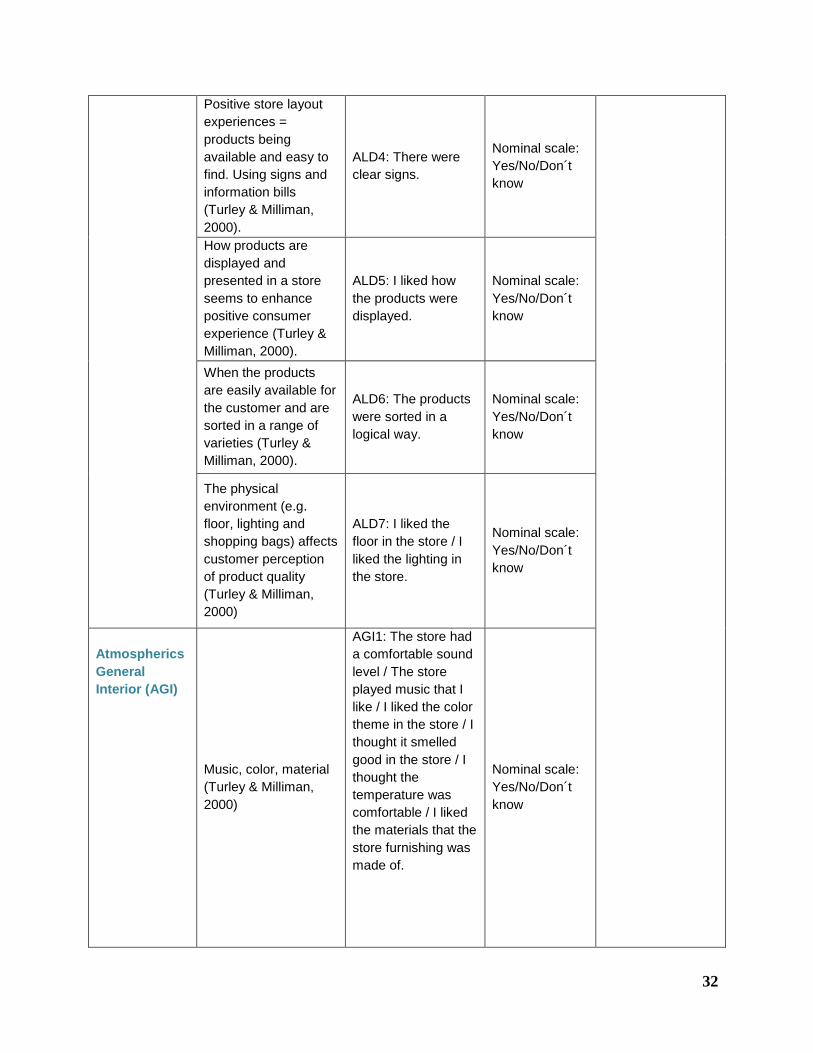
3.10 Operationalization
To be able to measure the terms in the study and form them into questions, terms need to be
operationalized. To operationalize the terms means to break them down into measurable
concepts and questions that respondents will be able to understand and relate to (Bryman & Bell,
2005). The survey-questions were created for the specific purpose of answering the research
question of this study and have not been adapted from any other study. Databases were used to
try to find questions from other research that could be adapted to this study, but none were
relevant for this study since none of them entailed atmospherics or the other subjects of this
survey.
Table 1 Operationalization
Concept Key words Survey questions
Question type
and available
answers
Information
received from
questions
Experience
Marketing
(EM)
Value in experiences
comes from intensity
and feelings of delight
associated with it
(Poulsson & Kale,
2004).
EM1: How I
experienced the
store visit as a
whole.
Likert scale, 1-5
(1) Very
negative,
(5) Very
positive
If the store
environment made
respondents
happy/delighted or
not.
Customers experience
the shopping
environment
differently depending
on their shopping
motives (Eroglu and
Machleit, 1993).
EM2: Were you
planning on
purchasing
anything? (In the
store you visited)
Dichotomous
variable:
Yes/No
Planned purchase
=Utilitarian motive.
Not planning to
purchase anything
=Hedonic motive.

30
Hedonic and
Utilitarian (HU)
Hedonic value results
from feelings, fun,
fantasies and playing
(Bäckström &
Johansson, 2006;
Holbrook &
Hirschman, 1982).
HU1: I visit stores for
pleasure, without
having a specific
errand.
Frequency
format:
Always / Often /
Half of the times
/ Seldom /
Never
Shows if they are
usually utilitarian or
hedonic shoppers.
The techniques
retailers use today to
create compelling in-
store experiences for
their customers; (1)
Education and
knowledge
intermediaries (2)
Inspiration (3)
Innovation (4) Try-out
opportunities (5)
Stimulating senses
(Bäckström and
Johansson, 2006).
HU2: I was inspired
during my store visit
/ I learned something
about a product
during my visit /
Something in the
store environment
surprised me / I had
the opportunity to
test the products
before purchase / My
senses were
stimulated at the visit
(sight, sound, smell,
taste, hearing)
Likert scale, 1-5
(1) Disagree
(2) Partly
disagree
(3) Neither
(4) Partly agree
(5)Fully agree
Shows if they were
happy/satisfied
with the visit in
general.
If not happy
with these hedonic
aspects, this will
show that the H
was not that
important for
general
satisfaction.
Utilitarian motive
relates to fulfilling a
task, sense of
accomplishment, goal
to obtain a sought-
after goods
(Bäckström &
Johansson, 2006).
HU3: It was easy to
find specific products
in the store / It was
easy to get through
the store / There
were accessible aids
available like
shoehorn or a mirror
/ There was
orderliness in the
store / Products
were easy to access.
Likert scale, 1-5
(1) Disagree
(2) Partly
disagree
(3) Neither
(4) Partly agree
(5)Fully agree
If respondents are
happy/satisfied
with the visit in
general, but not
happy with these
utilitarian aspects,
this will show that
the U was not that
important for the
general
satisfaction.
Approach and
Avoidance
Behavior
(AAB)
Approach behavior
results in wanting to
stay in the
environment,
exploring it further.
Avoidance-behavior
results in wanting to
leave the environment
(Bitner, 1992).
AAB1: I enjoyed
staying in the store
Dichotomous
variable:
Yes/No
Yes: Positive
experience, with
possible approach-
behavior.
No: Negative
experience, with
possible
avoidance-
behavior.
31
Avoidance behavior
comes from negative
experiences which
results in wanting to
leave the environment
and never return.
Approach behavior
results in wanting to
return (Bitner, 1992).
AAB2: I would like to
visit the store again.
Dichotomous
variable:
Yes/No
Yes: Positive
experience, with
possible approach-
behavior.
No: Negative
experience, with
possible
avoidance-
behavior.
Atmospherics
(A)
Tangible elements
consist of decorations,
carpeting, point of
fixture, while
intangible elements
could be described as
color, music,
temperature and
scents (Turley &
Hoffman, 2002).
A1: Follow up
question after "I
enjoyed staying in
the store": My
opinions about the
store environment.
Nominal
variable:
Yes/No/Don´t
know
What atmospherics
made the
respondents enjoy
their visit in the
store
Atmospherics
Layout &
Design (ALD)
Overall style
expressed through
decoration and
architecture
(Gottdeiner, 1998).
ALD1: I liked the
style of the store / I
liked the architecture
of the store.
Nominal scale:
Yes/No/Don´t
know
Store design needs to
fill certain factors as
having a clean
environment
(Bäckström &
Johansson, 2006).
ALD2: The store was
clean.
Nominal scale:
Yes/No/Don´t
know
Layout and design
includes variables
such as floor space
and allocation, product
groupings, traffic flow,
department locations,
and allocations within
departments (Turley &
Milliman, 2000).
ALD3: The floor
space allocation was
good / Departments,
fitting rooms and
cash register were
easy to find.
Nominal scale:
Yes/No/Don´t
know
32
Positive store layout
experiences =
products being
available and easy to
find. Using signs and
information bills
(Turley & Milliman,
2000).
ALD4: There were
clear signs.
Nominal scale:
Yes/No/Don´t
know
How products are
displayed and
presented in a store
seems to enhance
positive consumer
experience (Turley &
Milliman, 2000).
ALD5: I liked how
the products were
displayed.
Nominal scale:
Yes/No/Don´t
know
When the products
are easily available for
the customer and are
sorted in a range of
varieties (Turley &
Milliman, 2000).
ALD6: The products
were sorted in a
logical way.
Nominal scale:
Yes/No/Don´t
know
The physical
environment (e.g.
floor, lighting and
shopping bags) affects
customer perception
of product quality
(Turley & Milliman,
2000)
ALD7: I liked the
floor in the store / I
liked the lighting in
the store.
Nominal scale:
Yes/No/Don´t
know
Atmospherics
General
Interior (AGI)
Music, color, material
(Turley & Milliman,
2000)
AGI1: The store had
a comfortable sound
level / The store
played music that I
like / I liked the color
theme in the store / I
thought it smelled
good in the store / I
thought the
temperature was
comfortable / I liked
the materials that the
store furnishing was
made of.
Nominal scale:
Yes/No/Don´t
know
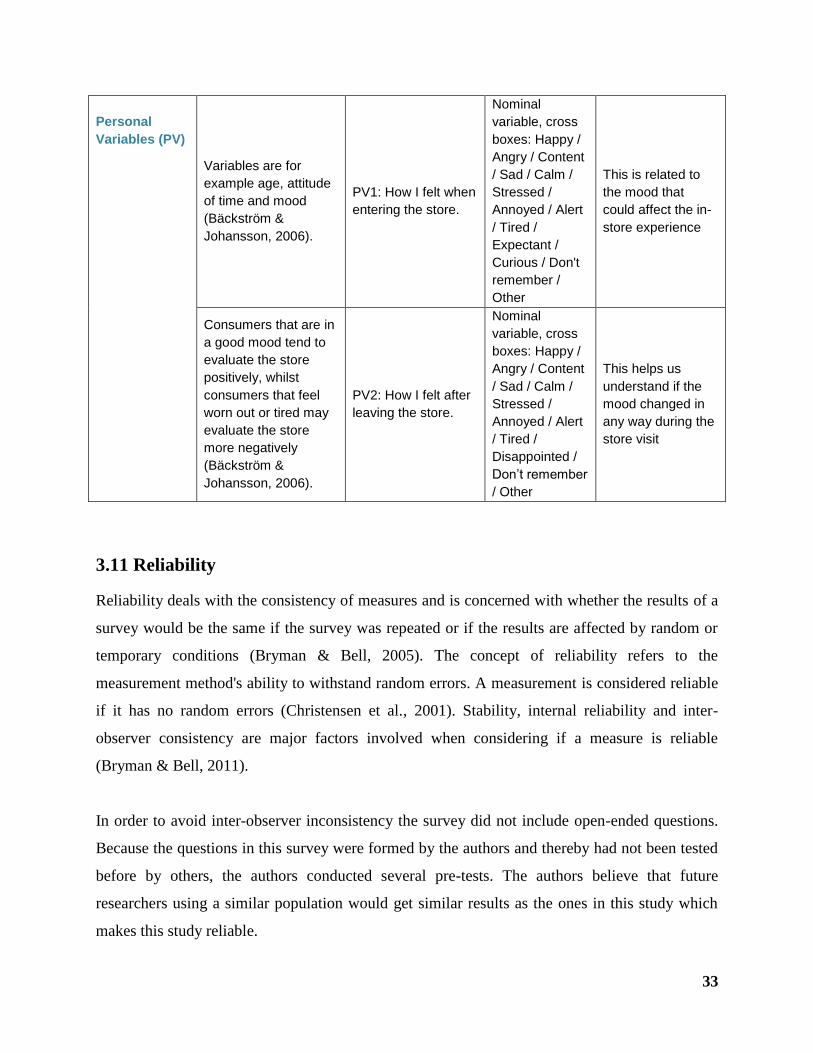
33
Personal
Variables (PV)
Variables are for
example age, attitude
of time and mood
(Bäckström &
Johansson, 2006).
PV1: How I felt when
entering the store.
Nominal
variable, cross
boxes: Happy /
Angry / Content
/ Sad / Calm /
Stressed /
Annoyed / Alert
/ Tired /
Expectant /
Curious / Don't
remember /
Other
This is related to
the mood that
could affect the in-
store experience
Consumers that are in
a good mood tend to
evaluate the store
positively, whilst
consumers that feel
worn out or tired may
evaluate the store
more negatively
(Bäckström &
Johansson, 2006).
PV2: How I felt after
leaving the store.
Nominal
variable, cross
boxes: Happy /
Angry / Content
/ Sad / Calm /
Stressed /
Annoyed / Alert
/ Tired /
Disappointed /
Don’t remember
/ Other
This helps us
understand if the
mood changed in
any way during the
store visit
3.11 Reliability
Reliability deals with the consistency of measures and is concerned with whether the results of a
survey would be the same if the survey was repeated or if the results are affected by random or
temporary conditions (Bryman & Bell, 2005). The concept of reliability refers to the
measurement method's ability to withstand random errors. A measurement is considered reliable
if it has no random errors (Christensen et al., 2001). Stability, internal reliability and inter-
observer consistency are major factors involved when considering if a measure is reliable
(Bryman & Bell, 2011).
In order to avoid inter-observer inconsistency the survey did not include open-ended questions.
Because the questions in this survey were formed by the authors and thereby had not been tested
before by others, the authors conducted several pre-tests. The authors believe that future
researchers using a similar population would get similar results as the ones in this study which
makes this study reliable.

34
3.12 Validity
Validity deals with whether the survey measures what it is supposed to measure (Bryman & Bell,
2011). To achieve validity one should reach similar results regardless of the measurement
method. For a quantitative measurement to be valid, reliability must also be very good.
Reliability is a necessary but not sufficient condition to achieve validity. It is not enough that the
method removes random errors because even sophisticated measurements can measure the
wrong things (Christensen et al., 2001). Internal validity is concerned with the causality between
two or more variables, and if there is a connection between the independent and dependent
variables (Bryman & Bell, 2011). External validity is concerned with whether the results from a
research can be generalized outside the specific context that the research has been conducted in
(Bryman & Bell, 2005).
The main way in which researchers try to generate a representative sample is by probability
sampling. The process of random selection largely eliminates bias from the selection of a sample
but does not guarantee a representative sample (Ibid). According to Bryman and Bell (2011)
even a representative sample is only representative of the population from which the sample was
selected, which is why generalizations cannot be made beyond that population.
The authors used convenience sampling and are aware of the fact that the respondents in the
survey are not representative of the entire shopping population of Sweden. The aim of this study
is not to be able to generalize the results, but to compare hedonic and utilitarian shopping
experiences. The utilitarian or hedonic shoppers that participated in this study do not necessarily
represent shoppers in other countries, but are however believed to be representative for hedonic
and utilitarian shoppers in Sweden.
Ecological validity deals with the question of whether or not the opinions, values, attitudes and
knowledge collected in studies are the same as the ones expressed in people´s everyday natural
social environment (Bryman & Bell, 2011). The authors asked respondents to remember their
reactions and experiences from a recent store visit, instead of intervening in natural situations or
creating artificial shopping environments. Although answering questions in a survey may involve
a limited ecological validity (Bryman & Bell, 2011), the authors believe the results are more

35
ecologically valid than if the study had been performed in a laboratory or a room for interviews,
since it would not be conducted in a natural environment. Answering the survey allows the
respondents to relate to a situation in a natural environment.
3.12.1 Pre-testing the survey
Measurement validity or construct validity is concerned with if the term that is designed to
measure a concept, correctly reflects that concept (Bryman & Bell, 2005). To prevent
misinterpretation and irrelevant questions, the survey questions should be tested in a pilot survey
to give the researchers the possibility to reformulate or remove questions (Bryman & Bell, 2005;
Christensen et al., 2010). A pilot study preferably consists of a small group of individuals
comparable to the population from which the sample is taken. These individuals should not be
part of the sample selection for the survey (Bryman & Bell, 2005).
To increase the validity of the survey it was pre-tested in three different ways in different stages
of the process. The first draft was sent by email and Facebook to the tutor and a small group of
people who were selected based on the probability of a quick response. After the first feedback
the researchers altered the layout, the grouping of the age variable, corrected spelling mistakes
and rephrased the questions that were unclear to the respondents. A clarification that service and
grocery stores were not included in the survey was also added due to the feedback.
To make sure that respondents comprehend the concepts and questions in the survey correctly, a
group of fellow students and friends were interviewed and asked to interpret the questions and
the used terminology. Those interviewed were selected based on their availability, but also on the
basis of age. This is because the researchers wanted to ensure that the questionnaire was equally
understandable by different generations. This was done to be absolutely sure that the future
respondents understand the questions and react to the answers in a similar way, to increase the
validity of the survey.
After the pre-test on the questions and further alterations based on the feedback, a pre-test on the
answers was made. The survey questionnaire was sent to a new test group consisting of 10
people who responded to the survey believing that it was the completed questionnaire. These
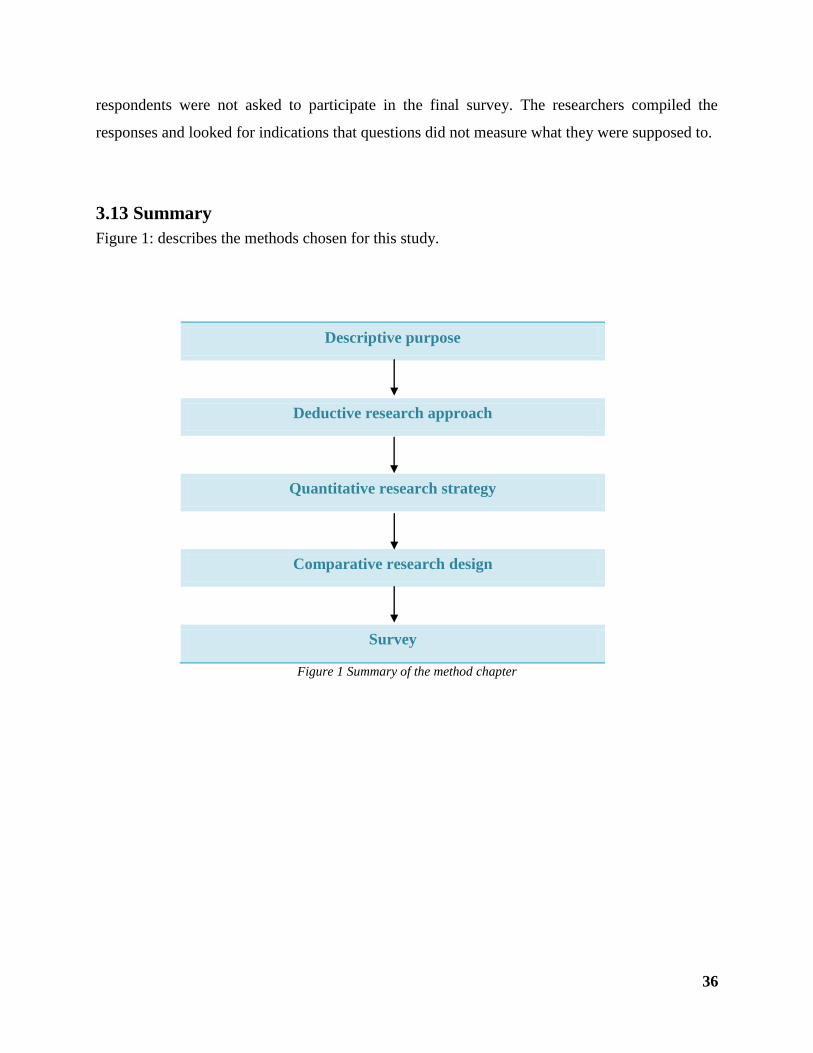
36
respondents were not asked to participate in the final survey. The researchers compiled the
responses and looked for indications that questions did not measure what they were supposed to.
3.13 Summary
Figure 1: describes the methods chosen for this study.
Descriptive purpose
Deductive research approach
Quantitative research strategy
Comparative research design
Survey
Figure 1 Summary of the method chapter
37
4. Data analysis
The data analysis is divided into five chapters. First, a descriptive analysis of the respondents
will be presented to give an overview of the study. Second, the reliability and validity testing of
the data will be described. Third, hedonic and utilitarian motives among men and women will be
presented. Fourth, a comparative analysis of the atmospherics in relationship with hedonic and
utilitarian shopping motives will be presented in order to see differences between hedonic and
utilitarian shoppers. Finally, a comparative analysis of the hedonic and utilitarian experiences
in relationship with hedonic and utilitarian shopping motives will be presented.
4.1 Descriptive data
The descriptive data will present the response rate and frequency examination of the
respondents.
4.1.1 Response examination
The survey was available online for five days and was shared with about 650 people via
Facebook and email. With a response of 277 completed surveys answers, this gives the study a
response rate of approximately 42.6%. According to Bryman and Bell (2005), there are a lot of
published articles with low response rates. If the survey uses convenience sampling, the response
rate is said to be less important (Ibid). Even though the response rate is less important for this
study since a convenience sample was used, the authors strived to exceed the minimum limit of
respondents that was set. This was accomplished by sending personal reminders through private
messages on Facebook resulting in an increase of responses. Out of the 277 completed survey
answers, 274 survey answers were evaluated as valid. Invalid survey answers contained of one
respondent who answered the survey based on a grocery store experience, and two respondents
who did not answer all of the questions in the survey. This is because the authors by mistake did
not make two questions mandatory, when changing some questions after receiving feedback
from the pre-test.
38
Respondents that were invited to answer the survey, but did not participate could have done this
for several reasons. Since the survey was mainly shared via Facebook, it is possible that potential
respondents might not have noticed the survey due to not being logged in or having a busy news
feed. Chosen participants could also have seen the invite but decided not to answer or to ignore
the invitation.
Feedback was received from some of the respondents regarding the way respondents were
invited to answer the survey. By inviting respondents to an event, some participants believed that
there was a specific time and date for answering the survey. This would then lead them to not
answering. However, when this feedback was received, a reminder was sent out to respondents
to answer the survey and that there was no specific date or time for doing this.
4.1.2 Frequency examination
According to the results, most respondents are balanced hedonic and utilitarian shoppers
(36.9%), meaning that the shopping motives are evenly divided between having an errand and
shopping for fun. There were more utilitarian shoppers (32.5%) than hedonic shoppers (30.6%).
However, in the respondents latest store visit, 32.1% (88 respondents) visited the store without
any specific errand, which means they had hedonic shopping motives, and 67.9% (186
respondents) had an errand in the store which means they had utilitarian shopping motives. As
expected by the researchers, most respondents visit retail stores 1-3 times a week (51.1%), or 1-3
times a month (35.7%). A group of 10.2% of the respondents visits stores 4-7 times a week, and
3.3% of the respondents visit retail stores 1-3 times every three months or less. The most recently
visited retail store was a fashion store (51.1%). Most of the respondents were state, municipal
and/or privately employed (60.9%) or student (21.9%).
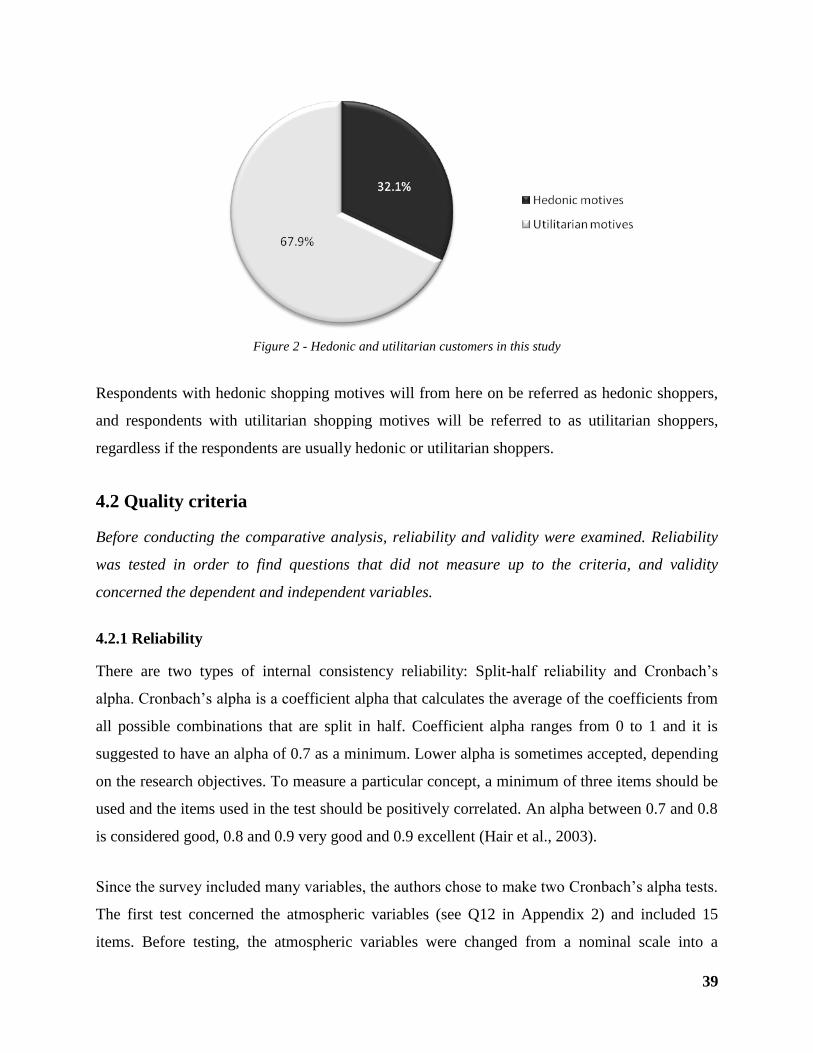
39
Figure 2 - Hedonic and utilitarian customers in this study
Respondents with hedonic shopping motives will from here on be referred as hedonic shoppers,
and respondents with utilitarian shopping motives will be referred to as utilitarian shoppers,
regardless if the respondents are usually hedonic or utilitarian shoppers.
4.2 Quality criteria
Before conducting the comparative analysis, reliability and validity were examined. Reliability
was tested in order to find questions that did not measure up to the criteria, and validity
concerned the dependent and independent variables.
4.2.1 Reliability
There are two types of internal consistency reliability: Split-half reliability and Cronbach’s
alpha. Cronbach’s alpha is a coefficient alpha that calculates the average of the coefficients from
all possible combinations that are split in half. Coefficient alpha ranges from 0 to 1 and it is
suggested to have an alpha of 0.7 as a minimum. Lower alpha is sometimes accepted, depending
on the research objectives. To measure a particular concept, a minimum of three items should be
used and the items used in the test should be positively correlated. An alpha between 0.7 and 0.8
is considered good, 0.8 and 0.9 very good and 0.9 excellent (Hair et al., 2003).
Since the survey included many variables, the authors chose to make two Cronbach’s alpha tests.
The first test concerned the atmospheric variables (see Q12 in Appendix 2) and included 15
items. Before testing, the atmospheric variables were changed from a nominal scale into a
40
dichotomous scale, by recoding the answer do not know into a system missing variable, yes as 1
and no as 0. The alpha result came out as 0.875, which is considered to be a very good alpha. In
the item-total statistics, it was shown that deleting items would not affect the alpha result to be
anything more or less than very good.
The second Cronbach’s alpha test concerned the experience questions in the survey (see Q14 in
Appendix 2) and included 10 items with the scale of 1 to 5. The alpha result came out as 0.750,
which is considered to be good. Just like the first test, deleting any items would not affect the
result to be anything more or less than good.
4.2.2 Validity
In order to do a test, researchers need to decide which variable comes before the other. It is not
possible to claim that the independent variables are prior to the dependent variables when both
variables have been collected at the same time. The decisions about what variables are dependent
and independent are therefore based on common sense or theoretical ideas, in order to make a
conclusion. It is therefore always a risk that the conclusions are false or unfounded. A dependent
variable is a variable that is affected causally by another (independent) variable, and an
independent variable is a variable that exerts a causal effect on another (dependent) variable
(Bryman & Bell, 2005).
Which variables that is dependent and independent depends on what tests that is to be conducted.
Since this study contain of several tests, the dependent and independent sometimes varies. First,
a test was conducted in order to see if the hedonic and utilitarian shoppers were affected by the
atmospherics. This means that the hedonic and utilitarian shoppers were the independent
variable, and the atmospherics was the dependent variable, affecting the hedonic and utilitarian
shoppers. Secondly, in order to test if the atmospherics affected for example the enjoyment of
staying in the store, the hedonic shoppers and utilitarian shoppers were selected and tested
separately. This means that the enjoyment of staying in the store was an independent variable and
atmospherics were dependent, since the atmospherics could affect the enjoyment of being in the
store.
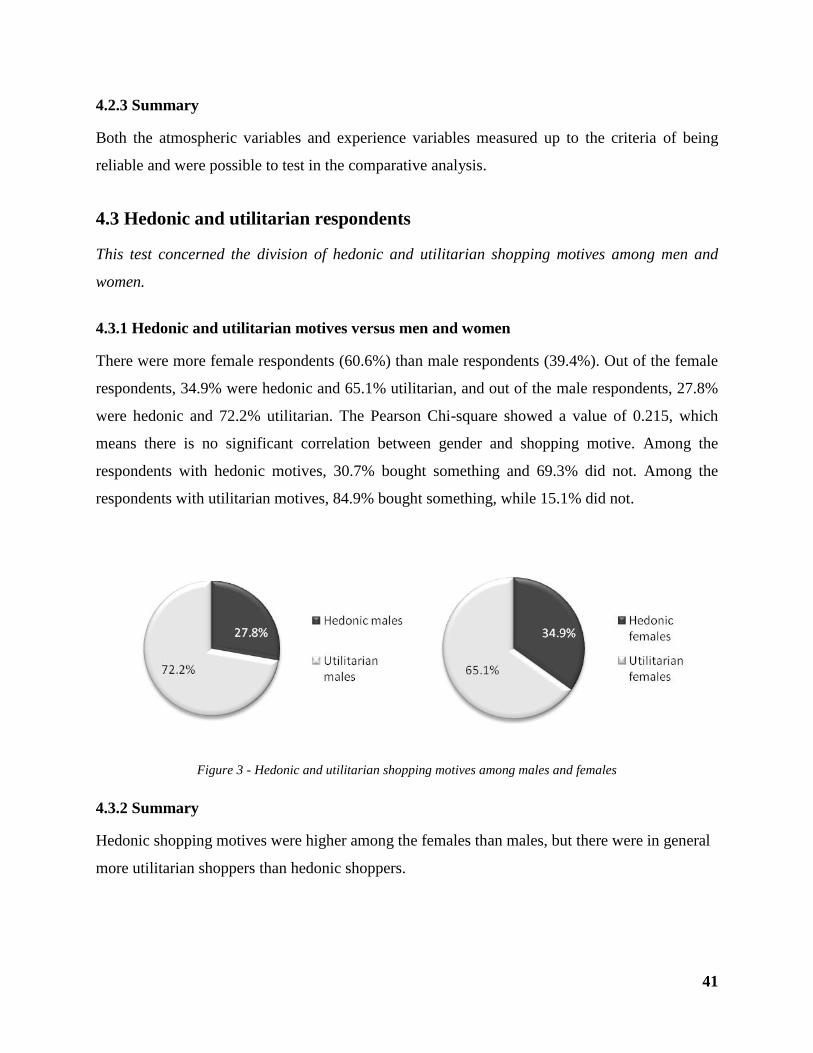
41
4.2.3 Summary
Both the atmospheric variables and experience variables measured up to the criteria of being
reliable and were possible to test in the comparative analysis.
4.3 Hedonic and utilitarian respondents
This test concerned the division of hedonic and utilitarian shopping motives among men and
women.
4.3.1 Hedonic and utilitarian motives versus men and women
There were more female respondents (60.6%) than male respondents (39.4%). Out of the female
respondents, 34.9% were hedonic and 65.1% utilitarian, and out of the male respondents, 27.8%
were hedonic and 72.2% utilitarian. The Pearson Chi-square showed a value of 0.215, which
means there is no significant correlation between gender and shopping motive. Among the
respondents with hedonic motives, 30.7% bought something and 69.3% did not. Among the
respondents with utilitarian motives, 84.9% bought something, while 15.1% did not.
Figure 3 - Hedonic and utilitarian shopping motives among males and females
4.3.2 Summary
Hedonic shopping motives were higher among the females than males, but there were in general
more utilitarian shoppers than hedonic shoppers.
42
4.4 Comparative analysis of Atmospherics
Five tests were conducted to compare the atmospherics among hedonic and utilitarian shoppers.
First, atmospherics in relationship with shopping motive was conducted to see the differences in
what the shoppers noticed and liked. Second, atmospherics in relationship with previous visits
affected what hedonic and utilitarian shoppers noticed in the environment. Third, the authors
looked upon if atmospherics affected the enjoyment of being in the store environment among the
hedonic and utilitarian shoppers. Fourth, if the atmospherics affected the hedonic and utilitarian
shoppers’ experience of the visit of the store as a whole. Finally, a test was conducted to see if
there was any relationship between the atmospherics and wanting to visit the store again.
4.4.1 Atmospherics and shopping motive
There were no significant relationships between what hedonic or utilitarian shoppers thought
about the different atmospherics in their latest store visit. There were however patterns in what
hedonic and utilitarian shoppers had opinions about or not.
4.4.1.1 Atmospherics with most yes/no answers
Respondents with hedonic shopping motives mostly had opinions on following atmospherics;
departments, fittings rooms and cash register were easy to find (97.7%), I liked the style of the
store (96.5%), and the floor space allocation was good (95.5%). Among utilitarian respondents,
most atmospherics that received a yes or no-answers were; the store was clean (94.6%), the floor
space allocation was good (94.6%), the products were presented in a logic way (92.5%), I liked
the style of the store (92.4%), and departments, fitting rooms and cash registers were easy to find
(91.9%).
In general, respondents mostly answered yes or no to atmospherics such as; I liked the style of
the store (94.9%), the environment was clean (94.2%), departments, fitting rooms and cash
registers were easy to find (93.8%), the store had a comfortable sound level (91.2%), and I
thought the temperature was comfortable (90.9%).
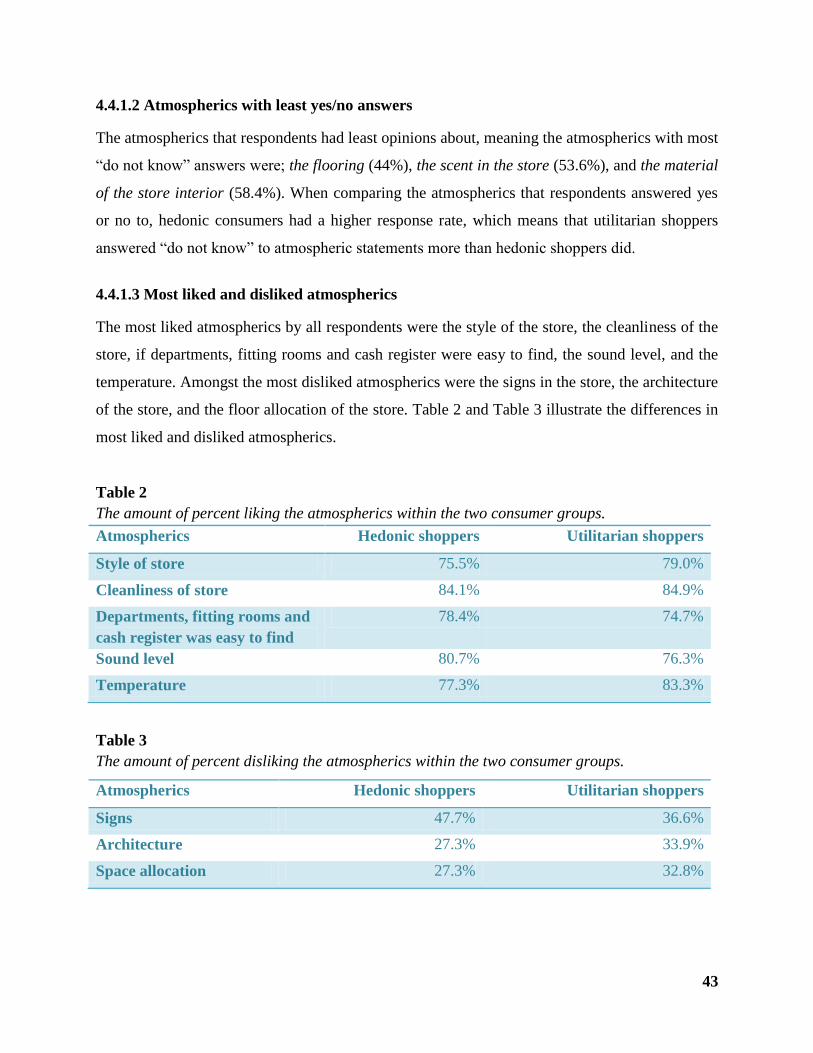
43
4.4.1.2 Atmospherics with least yes/no answers
The atmospherics that respondents had least opinions about, meaning the atmospherics with most
“do not know” answers were; the flooring (44%), the scent in the store (53.6%), and the material
of the store interior (58.4%). When comparing the atmospherics that respondents answered yes
or no to, hedonic consumers had a higher response rate, which means that utilitarian shoppers
answered “do not know” to atmospheric statements more than hedonic shoppers did.
4.4.1.3 Most liked and disliked atmospherics
The most liked atmospherics by all respondents were the style of the store, the cleanliness of the
store, if departments, fitting rooms and cash register were easy to find, the sound level, and the
temperature. Amongst the most disliked atmospherics were the signs in the store, the architecture
of the store, and the floor allocation of the store. Table 2 and Table 3 illustrate the differences in
most liked and disliked atmospherics.
Table 2
The amount of percent liking the atmospherics within the two consumer groups.
Atmospherics Hedonic shoppers Utilitarian shoppers
Style of store 75.5% 79.0%
Cleanliness of store 84.1% 84.9%
Departments, fitting rooms and
cash register was easy to find
78.4% 74.7%
Sound level 80.7% 76.3%
Temperature 77.3% 83.3%
Table 3
The amount of percent disliking the atmospherics within the two consumer groups.
Atmospherics Hedonic shoppers Utilitarian shoppers
Signs 47.7% 36.6%
Architecture 27.3% 33.9%
Space allocation 27.3% 32.8%
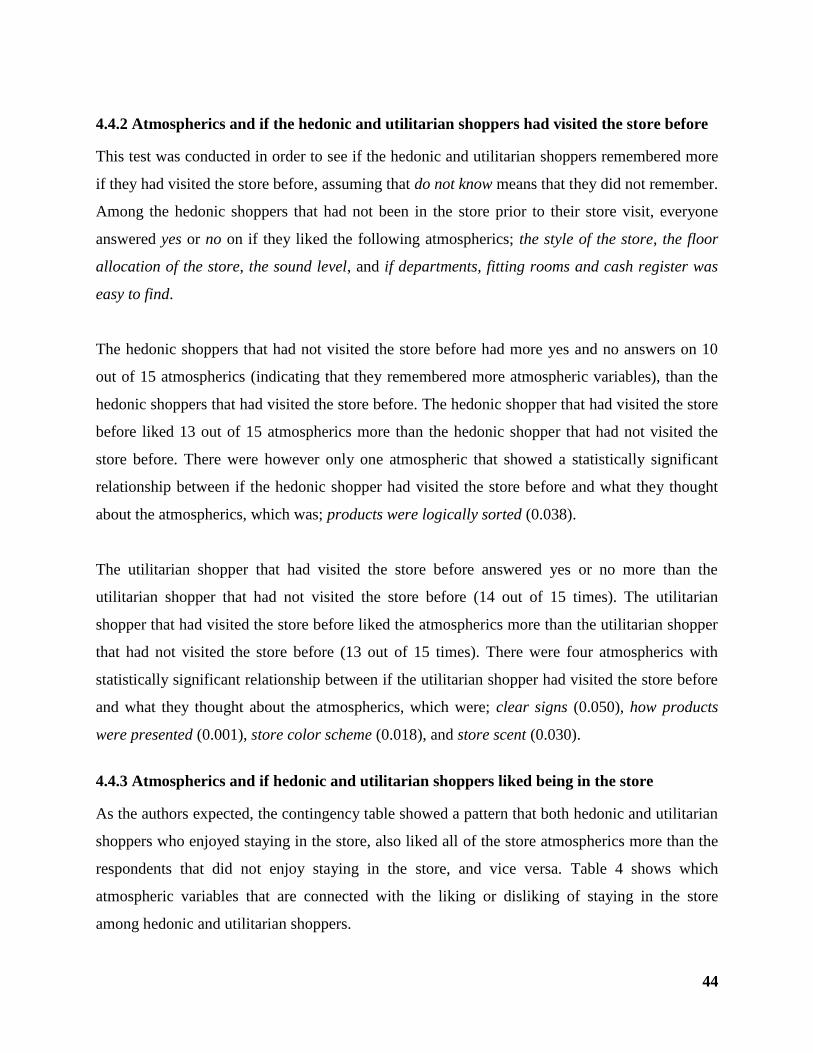
44
4.4.2 Atmospherics and if the hedonic and utilitarian shoppers had visited the store before
This test was conducted in order to see if the hedonic and utilitarian shoppers remembered more
if they had visited the store before, assuming that do not know means that they did not remember.
Among the hedonic shoppers that had not been in the store prior to their store visit, everyone
answered yes or no on if they liked the following atmospherics; the style of the store, the floor
allocation of the store, the sound level, and if departments, fitting rooms and cash register was
easy to find.
The hedonic shoppers that had not visited the store before had more yes and no answers on 10
out of 15 atmospherics (indicating that they remembered more atmospheric variables), than the
hedonic shoppers that had visited the store before. The hedonic shopper that had visited the store
before liked 13 out of 15 atmospherics more than the hedonic shopper that had not visited the
store before. There were however only one atmospheric that showed a statistically significant
relationship between if the hedonic shopper had visited the store before and what they thought
about the atmospherics, which was; products were logically sorted (0.038).
The utilitarian shopper that had visited the store before answered yes or no more than the
utilitarian shopper that had not visited the store before (14 out of 15 times). The utilitarian
shopper that had visited the store before liked the atmospherics more than the utilitarian shopper
that had not visited the store before (13 out of 15 times). There were four atmospherics with
statistically significant relationship between if the utilitarian shopper had visited the store before
and what they thought about the atmospherics, which were; clear signs (0.050), how products
were presented (0.001), store color scheme (0.018), and store scent (0.030).
4.4.3 Atmospherics and if hedonic and utilitarian shoppers liked being in the store
As the authors expected, the contingency table showed a pattern that both hedonic and utilitarian
shoppers who enjoyed staying in the store, also liked all of the store atmospherics more than the
respondents that did not enjoy staying in the store, and vice versa. Table 4 shows which
atmospheric variables that are connected with the liking or disliking of staying in the store
among hedonic and utilitarian shoppers.
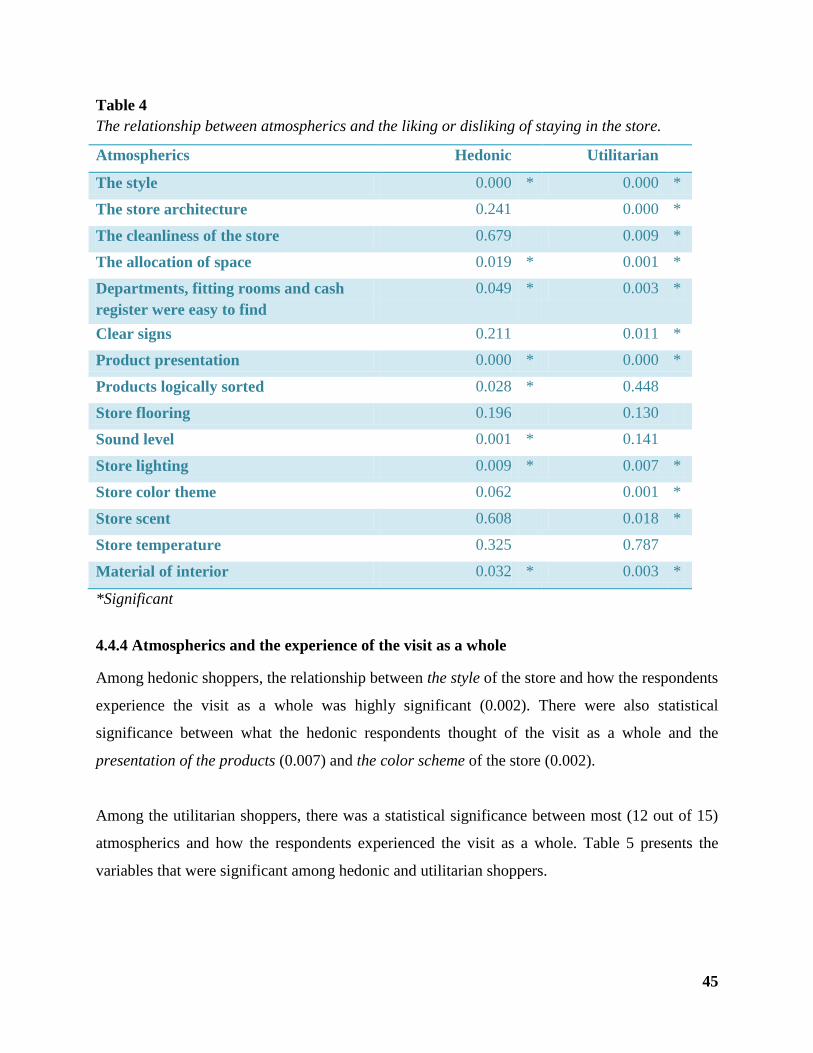
45
Table 4
The relationship between atmospherics and the liking or disliking of staying in the store.
Atmospherics Hedonic Utilitarian
The style 0.000 * 0.000 *
The store architecture 0.241 0.000 *
The cleanliness of the store 0.679 0.009 *
The allocation of space 0.019 * 0.001 *
Departments, fitting rooms and cash
register were easy to find
0.049 * 0.003 *
Clear signs 0.211 0.011 *
Product presentation 0.000 * 0.000 *
Products logically sorted 0.028 * 0.448
Store flooring 0.196 0.130
Sound level 0.001 * 0.141
Store lighting 0.009 * 0.007 *
Store color theme 0.062 0.001 *
Store scent 0.608 0.018 *
Store temperature 0.325 0.787
Material of interior 0.032 * 0.003 *
*Significant
4.4.4 Atmospherics and the experience of the visit as a whole
Among hedonic shoppers, the relationship between the style of the store and how the respondents
experience the visit as a whole was highly significant (0.002). There were also statistical
significance between what the hedonic respondents thought of the visit as a whole and the
presentation of the products (0.007) and the color scheme of the store (0.002).
Among the utilitarian shoppers, there was a statistical significance between most (12 out of 15)
atmospherics and how the respondents experienced the visit as a whole. Table 5 presents the
variables that were significant among hedonic and utilitarian shoppers.
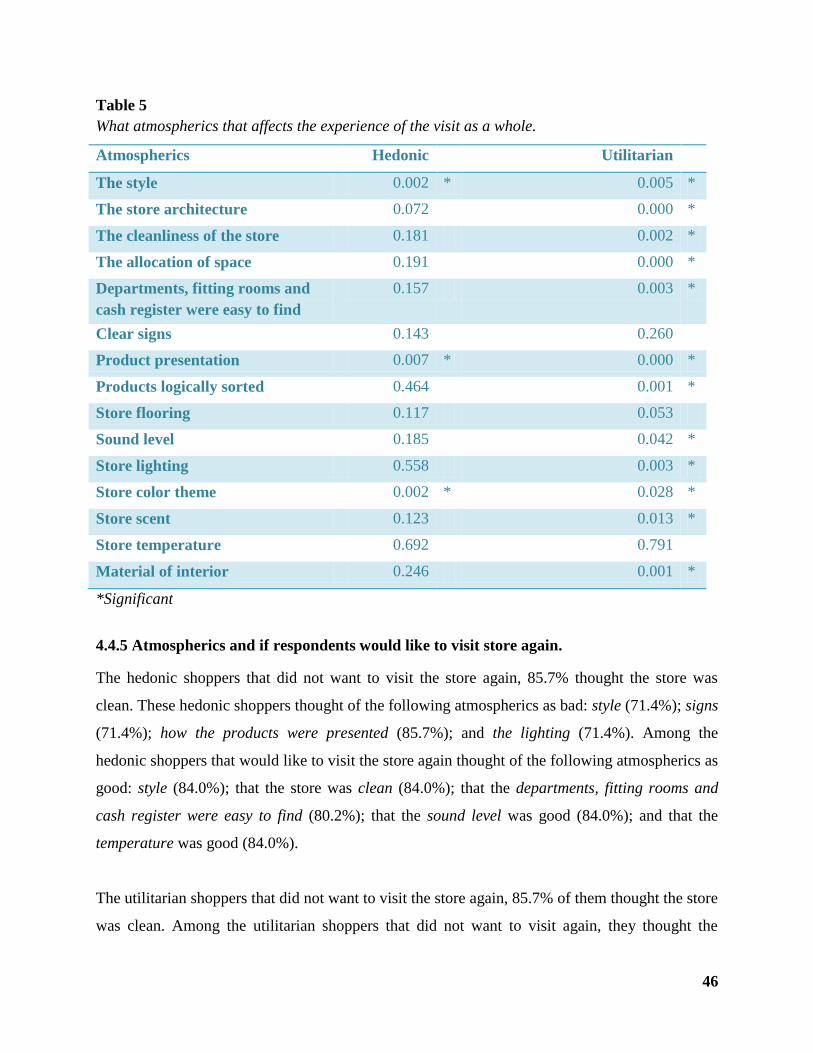
46
Table 5
What atmospherics that affects the experience of the visit as a whole.
Atmospherics Hedonic Utilitarian
The style 0.002 * 0.005 *
The store architecture 0.072 0.000 *
The cleanliness of the store 0.181 0.002 *
The allocation of space 0.191 0.000 *
Departments, fitting rooms and
cash register were easy to find
0.157 0.003 *
Clear signs 0.143 0.260
Product presentation 0.007 * 0.000 *
Products logically sorted 0.464 0.001 *
Store flooring 0.117 0.053
Sound level 0.185 0.042 *
Store lighting 0.558 0.003 *
Store color theme 0.002 * 0.028 *
Store scent 0.123 0.013 *
Store temperature 0.692 0.791
Material of interior 0.246 0.001 *
*Significant
4.4.5 Atmospherics and if respondents would like to visit store again.
The hedonic shoppers that did not want to visit the store again, 85.7% thought the store was
clean. These hedonic shoppers thought of the following atmospherics as bad: style (71.4%); signs
(71.4%); how the products were presented (85.7%); and the lighting (71.4%). Among the
hedonic shoppers that would like to visit the store again thought of the following atmospherics as
good: style (84.0%); that the store was clean (84.0%); that the departments, fitting rooms and
cash register were easy to find (80.2%); that the sound level was good (84.0%); and that the
temperature was good (84.0%).
The utilitarian shoppers that did not want to visit the store again, 85.7% of them thought the store
was clean. Among the utilitarian shoppers that did not want to visit again, they thought the
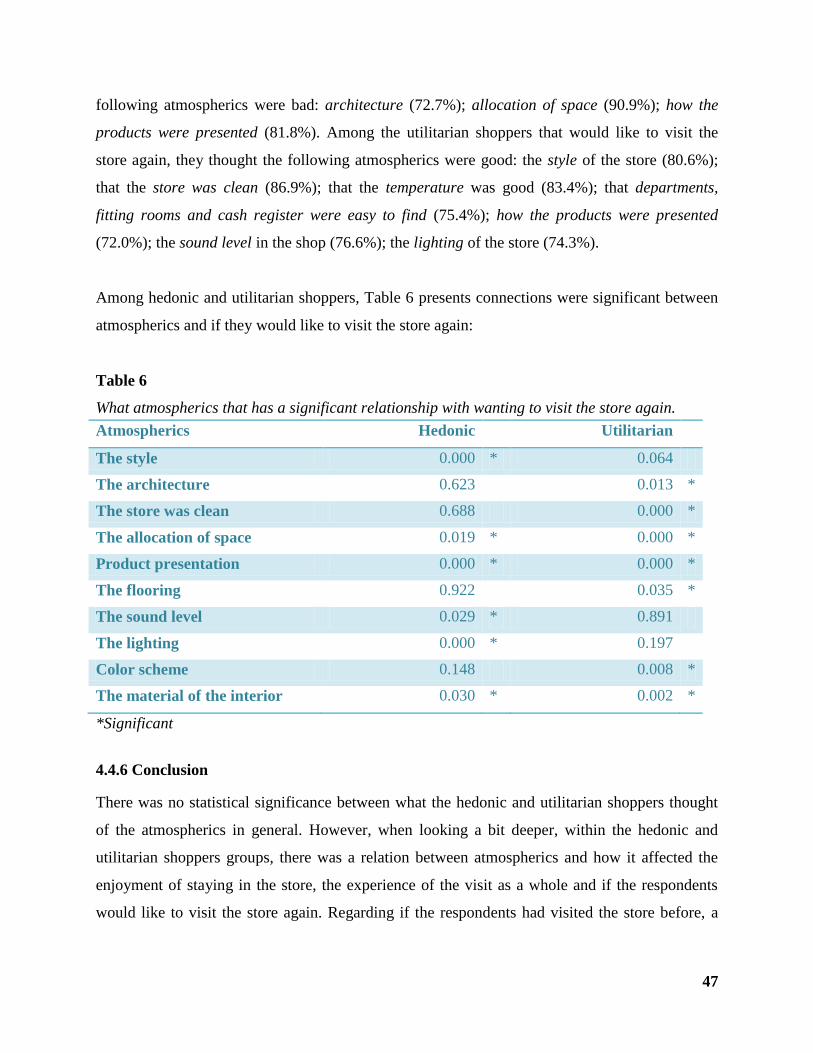
47
following atmospherics were bad: architecture (72.7%); allocation of space (90.9%); how the
products were presented (81.8%). Among the utilitarian shoppers that would like to visit the
store again, they thought the following atmospherics were good: the style of the store (80.6%);
that the store was clean (86.9%); that the temperature was good (83.4%); that departments,
fitting rooms and cash register were easy to find (75.4%); how the products were presented
(72.0%); the sound level in the shop (76.6%); the lighting of the store (74.3%).
Among hedonic and utilitarian shoppers, Table 6 presents connections were significant between
atmospherics and if they would like to visit the store again:
Table 6
What atmospherics that has a significant relationship with wanting to visit the store again.
Atmospherics Hedonic Utilitarian
The style 0.000 * 0.064
The architecture 0.623 0.013 *
The store was clean 0.688 0.000 *
The allocation of space 0.019 * 0.000 *
Product presentation 0.000 * 0.000 *
The flooring 0.922 0.035 *
The sound level 0.029 * 0.891
The lighting 0.000 * 0.197
Color scheme 0.148 0.008 *
The material of the interior 0.030 * 0.002 *
*Significant
4.4.6 Conclusion
There was no statistical significance between what the hedonic and utilitarian shoppers thought
of the atmospherics in general. However, when looking a bit deeper, within the hedonic and
utilitarian shoppers groups, there was a relation between atmospherics and how it affected the
enjoyment of staying in the store, the experience of the visit as a whole and if the respondents
would like to visit the store again. Regarding if the respondents had visited the store before, a
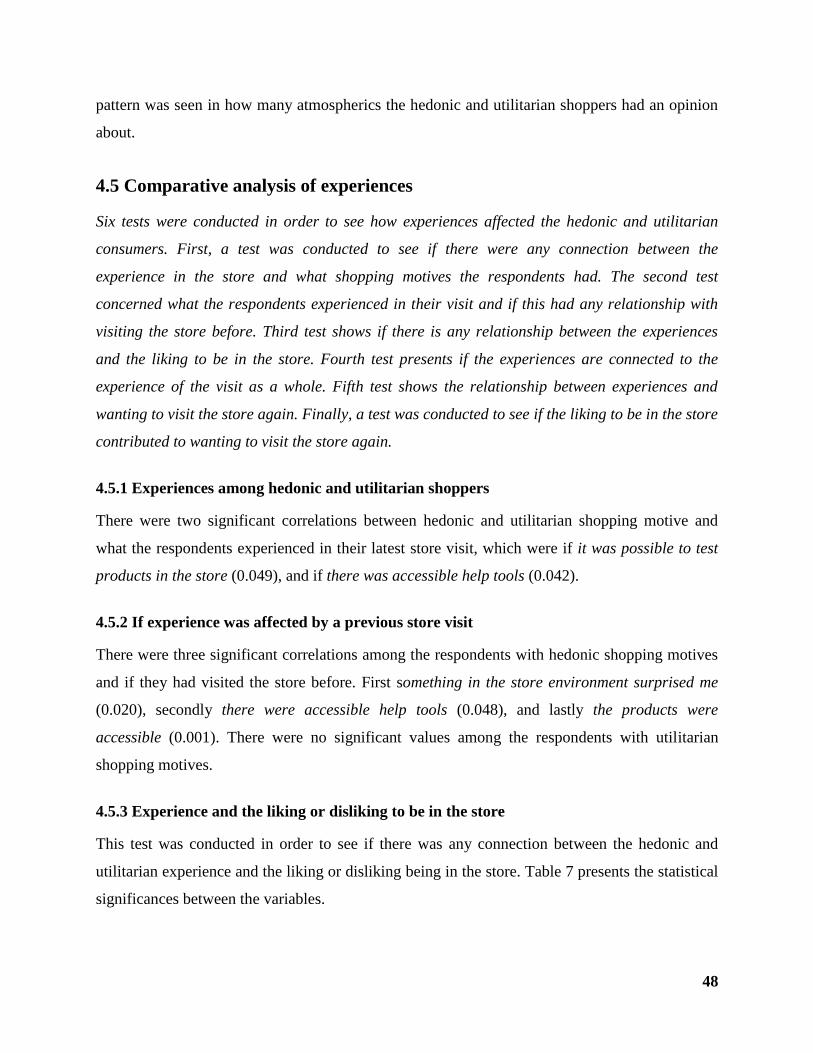
48
pattern was seen in how many atmospherics the hedonic and utilitarian shoppers had an opinion
about.
4.5 Comparative analysis of experiences
Six tests were conducted in order to see how experiences affected the hedonic and utilitarian
consumers. First, a test was conducted to see if there were any connection between the
experience in the store and what shopping motives the respondents had. The second test
concerned what the respondents experienced in their visit and if this had any relationship with
visiting the store before. Third test shows if there is any relationship between the experiences
and the liking to be in the store. Fourth test presents if the experiences are connected to the
experience of the visit as a whole. Fifth test shows the relationship between experiences and
wanting to visit the store again. Finally, a test was conducted to see if the liking to be in the store
contributed to wanting to visit the store again.
4.5.1 Experiences among hedonic and utilitarian shoppers
There were two significant correlations between hedonic and utilitarian shopping motive and
what the respondents experienced in their latest store visit, which were if it was possible to test
products in the store (0.049), and if there was accessible help tools (0.042).
4.5.2 If experience was affected by a previous store visit
There were three significant correlations among the respondents with hedonic shopping motives
and if they had visited the store before. First something in the store environment surprised me
(0.020), secondly there were accessible help tools (0.048), and lastly the products were
accessible (0.001). There were no significant values among the respondents with utilitarian
shopping motives.
4.5.3 Experience and the liking or disliking to be in the store
This test was conducted in order to see if there was any connection between the hedonic and
utilitarian experience and the liking or disliking being in the store. Table 7 presents the statistical
significances between the variables.
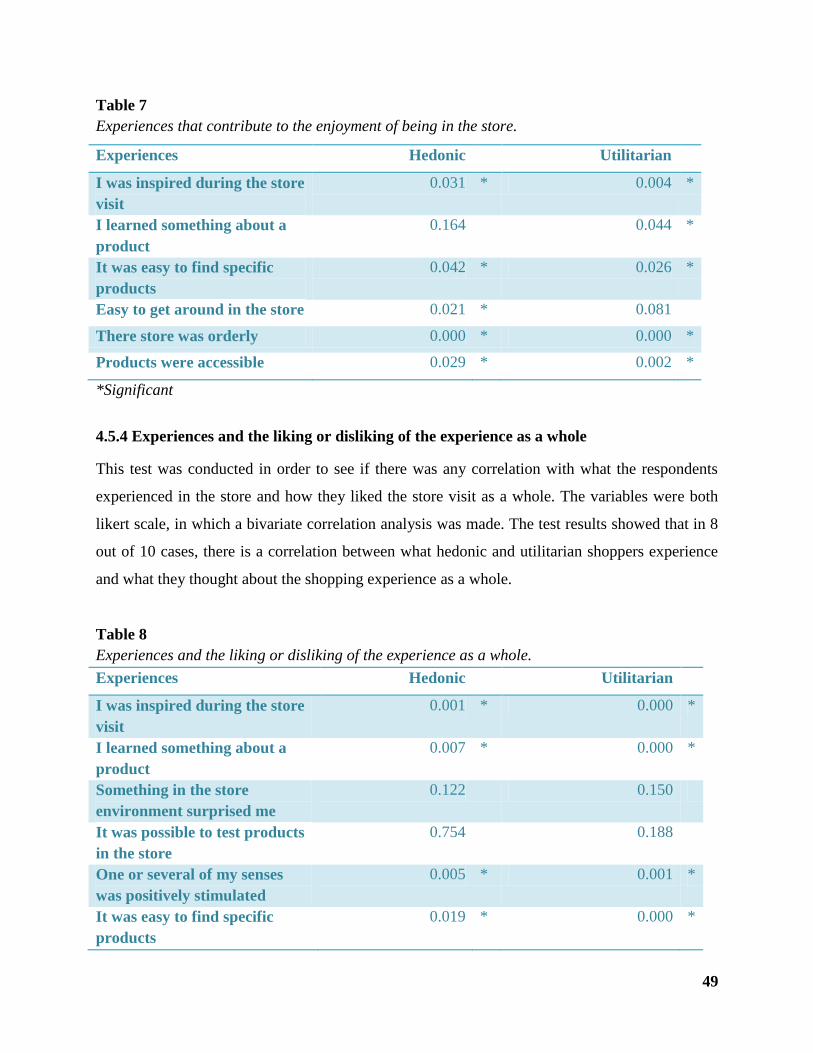
49
Table 7
Experiences that contribute to the enjoyment of being in the store.
Experiences Hedonic Utilitarian
I was inspired during the store
visit
0.031 * 0.004 *
I learned something about a
product
0.164 0.044 *
It was easy to find specific
products
0.042 * 0.026 *
Easy to get around in the store 0.021 * 0.081
There store was orderly 0.000 * 0.000 *
Products were accessible 0.029 * 0.002 *
*Significant
4.5.4 Experiences and the liking or disliking of the experience as a whole
This test was conducted in order to see if there was any correlation with what the respondents
experienced in the store and how they liked the store visit as a whole. The variables were both
likert scale, in which a bivariate correlation analysis was made. The test results showed that in 8
out of 10 cases, there is a correlation between what hedonic and utilitarian shoppers experience
and what they thought about the shopping experience as a whole.
Table 8
Experiences and the liking or disliking of the experience as a whole.
Experiences Hedonic Utilitarian
I was inspired during the store
visit
0.001 * 0.000 *
I learned something about a
product
0.007 * 0.000 *
Something in the store
environment surprised me
0.122 0.150
It was possible to test products
in the store
0.754 0.188
One or several of my senses
was positively stimulated
0.005 * 0.001 *
It was easy to find specific
products
0.019 * 0.000 *
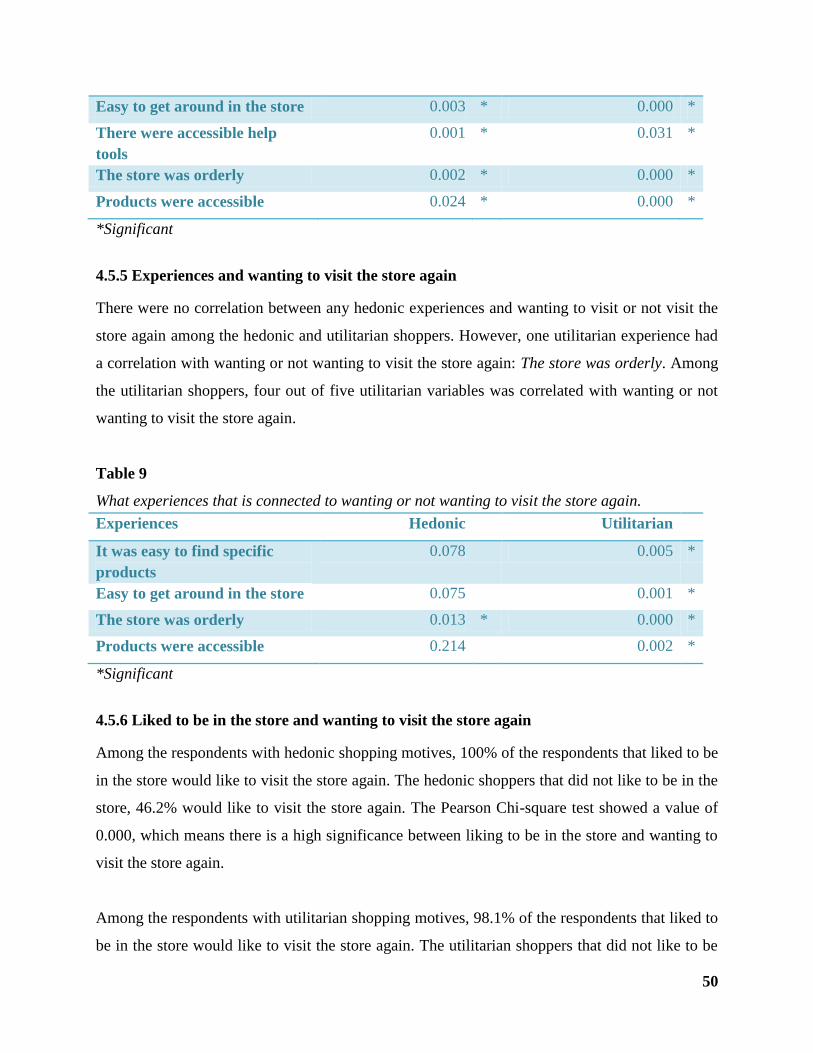
50
Easy to get around in the store 0.003 * 0.000 *
There were accessible help
tools
0.001 * 0.031 *
The store was orderly 0.002 * 0.000 *
Products were accessible 0.024 * 0.000 *
*Significant
4.5.5 Experiences and wanting to visit the store again
There were no correlation between any hedonic experiences and wanting to visit or not visit the
store again among the hedonic and utilitarian shoppers. However, one utilitarian experience had
a correlation with wanting or not wanting to visit the store again: The store was orderly. Among
the utilitarian shoppers, four out of five utilitarian variables was correlated with wanting or not
wanting to visit the store again.
Table 9
What experiences that is connected to wanting or not wanting to visit the store again.
Experiences Hedonic Utilitarian
It was easy to find specific
products
0.078 0.005 *
Easy to get around in the store 0.075 0.001 *
The store was orderly 0.013 * 0.000 *
Products were accessible 0.214 0.002 *
*Significant
4.5.6 Liked to be in the store and wanting to visit the store again
Among the respondents with hedonic shopping motives, 100% of the respondents that liked to be
in the store would like to visit the store again. The hedonic shoppers that did not like to be in the
store, 46.2% would like to visit the store again. The Pearson Chi-square test showed a value of
0.000, which means there is a high significance between liking to be in the store and wanting to
visit the store again.
Among the respondents with utilitarian shopping motives, 98.1% of the respondents that liked to
be in the store would like to visit the store again. The utilitarian shoppers that did not like to be
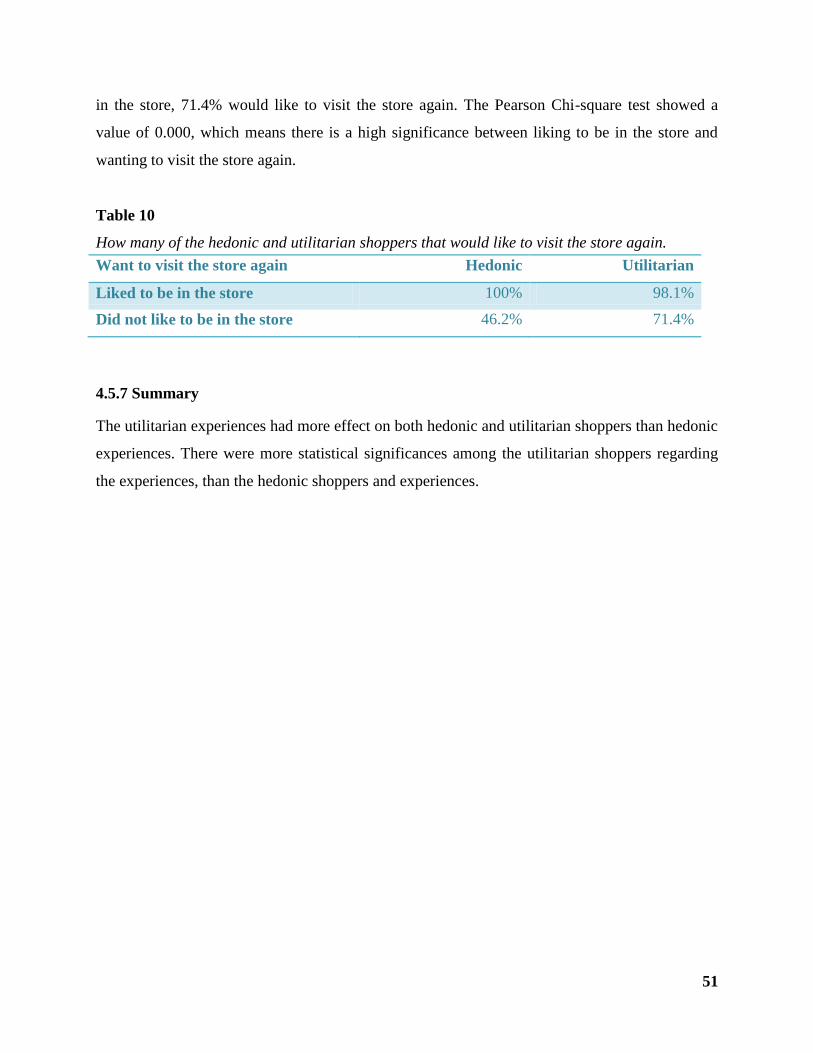
51
in the store, 71.4% would like to visit the store again. The Pearson Chi-square test showed a
value of 0.000, which means there is a high significance between liking to be in the store and
wanting to visit the store again.
Table 10
How many of the hedonic and utilitarian shoppers that would like to visit the store again.
Want to visit the store again Hedonic Utilitarian
Liked to be in the store 100% 98.1%
Did not like to be in the store 46.2% 71.4%
4.5.7 Summary
The utilitarian experiences had more effect on both hedonic and utilitarian shoppers than hedonic
experiences. There were more statistical significances among the utilitarian shoppers regarding
the experiences, than the hedonic shoppers and experiences.
52
5. Discussion
This chapter presents a discussion of the findings in this study, as well as the limitations. The
results from the study is discussed and related to the previous findings presented in the literature
review.
The respondents that answered yes or no to an atmospheric question are in this study regarded as
having remembered that atmospheric since having an opinion about it. Since the atmospheric is
remembered, it has contributed to the consumers store experience. If the respondents answered
do not know, it could mean they did not notice or have forgotten the atmospheric, but it could
also mean that they simply did not have an opinion about that specific atmospheric.
5.1 Atmospherics as a whole
Researchers (Babin & Dardin, 1995; Bitner, 1992; Turley & Chebat, 2002; Turley & Milliman,
2000) found that different consumers were affected differently by atmospherics. However, no
significance was found between liking atmospherics and being a hedonic or utilitarian consumer
in this study, which indicates that there are no specific atmospherics that are liked more by
hedonic or utilitarian consumers. The least remembered atmospherics were flooring, scent and
material. Some stores may not have a specific scent and this might lead to respondents answering
do not know. Many studies have focused on scent having an effect on shopping behavior, and the
same goes for materials (Turley & Milliman, 2000). Since it is not always obvious what
materials the store environment is made up of, materials may be difficult to notice. This could be
an explanation for materials being one of the atmospherics least noticed by respondents, even
though according to Kerfoot et al. (2003) the materials used in a store are closely connected with
what is aesthetically pleasing.
When it comes to statements about liking atmospherics, hedonic consumers were in majority
over utilitarian in answering yes or no instead of do not know. This indicates that the store visit
was more memorable to hedonic consumers, which supports Eroglu and Machleit’s (1993)
findings that utilitarian consumers pay less attention than hedonic consumers to aspects of the

53
store environment that does not help them achieve their goal (Ibid). This means that utilitarian
consumers in this study do not care or pay as much attention to the environment as consumers
with hedonic shopping motives.
Bäckström & Johansson (2006) propose that to provide a high utilitarian value, the store needs to
be tidy and clean, which was one of the atmospherics with the highest percentage of yes or no-
answers for utilitarian customers in this study, meaning that this was something that utilitarian
consumers noticed and/or had a strong opinion about.
5.2 Previous store visits
Hedonic and utilitarian shoppers that had visited the store before liked the atmospherics more.
Since the store has been visited by the same respondent before, this indicates an approach
behavior that could possibly be caused by pleasing atmospherics in the store environment. If the
shopper had visited the store before, it could also indicate that the more they visit a store, the
more they come to like the store environment. This could mean that if the respondent visits the
store more often, he or she could become less picky about it. The case could also be that the
respondent visits the store because he or she has to.
5.3 Liking or disliking being in the store environment
This study found that if hedonic consumers liked to be in the store or not was related to if the
departments, fitting rooms and cash registers were easy to find and that the store provided clear
signs, which could be related to information seeking. This indicates that the hedonic consumers
are more engaged in trying to find his or her way around the store, which supports the study of
Bellenger and Korgaonkar (1980) that state that hedonic customers are engaged in information
seeking. In general, for both customer groups, the flooring and the temperature were the only
variables that were not significant for liking to be in the store. This could be because these
atmospherics are taken for granted in case there is nothing particularly odd with them, as for
example, a very high temperature, or uncomfortable or slippery floor. The number of
atmospherics that significantly contributed to if utilitarian customers liked or disliked to be in the
store, are more than those that contribute to the hedonic customers positive store visit. This could
54
mean that other things in the store are of importance for the hedonic customer, such as the
products or the personnel.
Both hedonic and utilitarian customers had strong opinions on the style of the store in this study,
and significance was found between the style of the store and if hedonic customers liked their
stay in the store or not. Since both hedonic and utilitarian shoppers seemed to pay attention to the
atmospherics, this could have to do with the store style being a big part of the store environment
and is something that permeates the entire store, making it easier to assimilate. However, several
more atmospherics were significant for if a utilitarian consumer liked to be in the store or not.
These findings does not support the Bellenger and Korgaonkar (1980) study in which it was
suggested that attractive decor and in-store merchandising should be important for attracting
hedonic customers.
Eroglu and Machleit (1993) also claim that utilitarian consumers are less satisfied with the store
environment, compared to hedonic consumers. In this study, several atmospherics were
significant for if a utilitarian consumer liked to be in the store or not. The results also indicated
that utilitarian consumers had more atmospherics that were significant for the total store
experience than hedonic, which could mean that utilitarian consumers are a bit more demanding.
5.4 Wanting to visit the store again
Positive evaluation of store atmospherics was positively correlated with liking to be in the store.
Respondents that rated the store atmospherics negatively did not like to be in the store, which
supports Bitner’s (1992) and Donovan and Rossiter’s (1982) suggestions on that a positive
atmosphere leads to approach behavior and negative store atmosphere leads to avoidance
behavior.
Utilitarian consumers had more atmospherics with significance between the atmospherics and
wanting to visit the store again. Amongst these were the architecture, cleanliness, color scheme,
and the flooring. However, flooring was not significant for liking to be in the store.
55
5.5 Experiences
To be inspired by the store visit, that the store was in order, and that products were easy to find,
mattered for creating a positive experience for both hedonic and utilitarian customers. This is
positively related to Bäckström & Johansson’s (2006) findings that how products are displayed
and presented seems to enhance the consumer experience (Ibid). However, hedonic shoppers
valued more than utilitarian that it was easy to get around the store, while utilitarian customers
wanted to learn something about a product, which was one of the techniques used by retailers to
enhance consumer experience in the Bäckström and Johansson (2006) study. Poulsson and Kale
(2004) argue that managers, in order to create a positive consumer experience, should present a
mixture of relevance, novelty, surprise, learning and engagement, which was also found in this
study to positively affect experiences of both shopper types. All hedonic and utilitarian values,
except the possibility to test the products, were important for the creation of positive store
experiences. In Bäckström and Johansson’s (2006) study, letting consumers try products was part
of how retailers tried to manage experiences for customers, which in this study, did not
contribute to a positive store experience. Retailers in Bäckström and Johansson’s study also used
techniques to inspire and stimulate consumer senses and provide them with product knowledge.
According to this study these types of techniques highly affected the in-store experience for both
utilitarian and hedonic customers.
For hedonic customers, it was important that the store was orderly, if they were to visit again,
when for utilitarian customers, it was required more from the store experience, such as accessible
products, easy to find products, and easy to get around in the store as well as the store being
orderly.
5.6 Summary
Table 11 and Table 12 show the important atmospherics and experiences for hedonic compared
to utilitarian customers. Hedonic is represented with the number 1, utilitarian is represented with
the number 2, and if there is significance for both hedonic and utilitarian customers, this is
represented with the number 3.
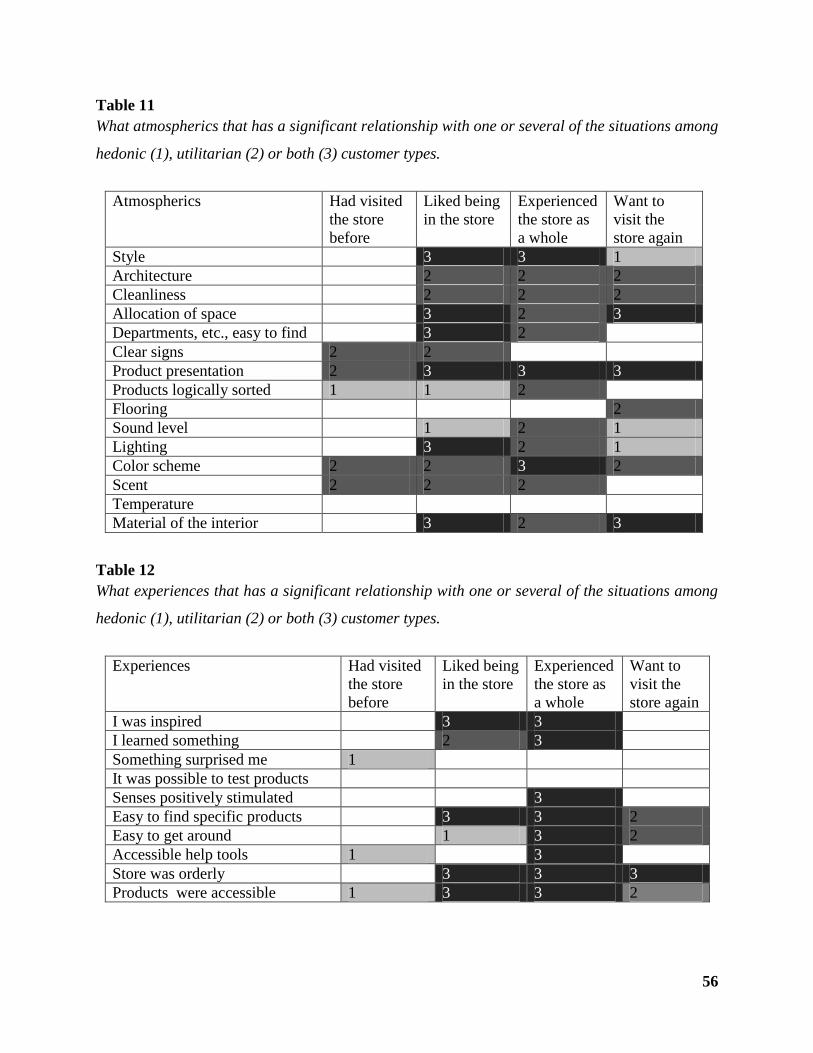
56
Table 11
What atmospherics that has a significant relationship with one or several of the situations among
hedonic (1), utilitarian (2) or both (3) customer types.
Atmospherics Had visited
the store
before
Liked being
in the store
Experienced
the store as
a whole
Want to
visit the
store again
Style 3 3 1
Architecture 2 2 2
Cleanliness 2 2 2
Allocation of space 3 2 3
Departments, etc., easy to find 3 2
Clear signs 2 2
Product presentation 2 3 3 3
Products logically sorted 1 1 2
Flooring 2
Sound level 1 2 1
Lighting 3 2 1
Color scheme 2 2 3 2
Scent 2 2 2
Temperature
Material of the interior 3 2 3
Table 12
What experiences that has a significant relationship with one or several of the situations among
hedonic (1), utilitarian (2) or both (3) customer types.
Experiences Had visited
the store
before
Liked being
in the store
Experienced
the store as
a whole
Want to
visit the
store again
I was inspired 3 3
I learned something 2 3
Something surprised me 1
It was possible to test products
Senses positively stimulated 3
Easy to find specific products 3 3 2
Easy to get around 1 3 2
Accessible help tools 1 3
Store was orderly 3 3 3
Products were accessible 1 3 3 2
57
6. Conclusions
In order to create a positive consumer experience it is important that the customer gets inspired,
that he or she feels that the store is orderly, that products are accessible. It is also important that
the consumer feels that he or she has learned something, has been positively surprised, that there
are accessible help tools, and that it is easy to find specific products. Consumers also want to
have their senses stimulated in some way in order to have a positive store experience.
The most important atmospherics for creating consumer experiences was found to be the style of
the store, the presentation of the products and the color theme of the store. These atmospherics
affects both the experience of the visit as a whole and the liking or disliking of being in the store.
The style of the store was an important variable, since it always noticed by customers. If the
consumers like the atmospherics, he or she will also revisit the store. Customers that have visited
the store before will also like the atmospheric more than the customer who visits the store for the
first time.
The style of the store, the allocation of floor space, that departments, fittings rooms and cash
register are easy to find, that the products are presented in an interesting way, and that there is a
liking of the material and lighting in the store affects the consumers liking of the store visit.
6.1 Academic implications
This study has contributed to an understanding on which atmospheric and experience variables
that affects hedonic versus utilitarian shoppers. It is described which atmospheric variables that
are liked among hedonic versus utilitarian customers depending on if they have visited the store
before. It also described which atmospherics that are connected with the liking and disliking of
being in the store, which atmospherics that affects the experience of the visit as a whole and
which atmospherics that is connected to wanting to visit or not to visit the store again. Regarding
the experiences, this study describes which hedonic and utilitarian experiences that are important
for hedonic versus utilitarian shoppers. It is also tested if the hedonic and utilitarian experiences
are connected with previous visits, the liking to be in the store, the store visit as a whole and
58
wanting to visit the store again, among the hedonic versus utilitarian shoppers. This study could
therefore function as an understanding to what specific atmospherics or experiences that are
connected to hedonic versus utilitarian shoppers, when shaping retail store environment.
6.2 Managerial implications
Atmospherics play an important role in forming positive consumer experiences and to manage
these in an effective way should create a positive outcome in the shape of profits and returning
customers for retailers. The following atmospherics; style of the store, allocation of floor space,
departments fitting rooms and cash register, presentation of products, color scheme, store
lighting, and material in the store should be focused on by managers because they are significant
for the creation of positive in store experiences for both utilitarian and hedonic customers.
Depending on the type of store or products sold managers might know if their customer base
mainly consists of one or the other customer type and could therefore customize the
atmospherics to best fit the needs and wants of that type. If the store has a hedonic target group,
focus should lie on store style, floor space allocation, presentation of products, sound level,
lighting and material of the interior. If the target group mainly consists of utilitarian customers,
focus should be on architecture, having a clean store, floor space allocation, presentation of
products, flooring, color scheme of store and the material of the interior. Even though all
atmospherics are not proven to be significant for creating a positive store experience, they should
still be managed since they contribute to the impression of the store as a whole.
Today, retail managers focus on providing hedonic values for customers, although this study
showed that retailers should focus on providing utilitarian values for customers, since this study
showed that utilitarian values effect experiences more.
6.3 Limitations
There was a difference in the number of hedonic and utilitarian shoppers, where 88 respondents
were hedonic and 186 were utilitarian. This might affect the study in a way that when hedonic
and utilitarian shoppers are compared, there are not as many hedonic representatives. The study
was also only conducted in Sweden, which makes it hard to generalize the results among other

59
countries. Further research need to be tested in other cultures in order to enhance the
generalization of our findings.
Three questions in the survey were not included in the data analysis. Two of the questions
consisted of check-boxes. This made these questions difficult to test. This was discovered after
the completion of the survey. This resulted in not being able to test if mood affected the store
experience and if their mood was changed during the store visit. The third question concerned
the music and was not included since the authors were not able to test it in the same manner as
the other atmospherics. The authors do not believe that the removal of this question has affected
the results of this study in a significant way.
6.4 Further research
This study found that if the customer had visited the store before, he or she would like the store
atmospherics more than the consumer that had not visited the store prior to the visit. It could be
interesting for retailers to know how consumers that frequently visit the store are affected by
atmospherics in comparison to consumers that visit the store for the first time.
There was not a specific store type investigated in this study and there could be differences in
how atmospherics in different store types affect consumers. Different kinds of stores could be
more hedonic or utilitarian-oriented for example, depending on the products or the target group.
Therefore the authors suggest further research on different kinds of store types and their effect on
consumer behavior.
Authors believe that an observational study should be conducted with observations in actual
store environments in order to observe real reactions to atmospherics and other variables that
affect store experiences. By doing this, it should be possible to see how all atmospherics
correlate in creating an experience for the consumer. It could also be of interest to investigate the
effects that in-store variables have on a subconscious level, because it is possible that these
variables affect hedonic and utilitarian customers differently.

60
7. Reference list
Babin, J. B. & Darden, R.W., (1995) “Consumer Self-regulation In a Retail Environment”, Journal of Retailing,
Vol. 71, No. 1, pp. 47-70
Babin, J. B, Darden, R. W., & Griffin, M., (1994) “Work and/or Fun: Measuring Hedonic and Utilitarian Shopping
Value”, Journal Of Consumer Research, Vol. 20, No. 4, pp. 644-656,
Baker, J., Levy, M. & Grewal, D., (1992) “An Experimental Approach to Making Retail Store Environmental
Decisions”, Journal of Retailing, Vol. 68, No. 4, pp. 445-459
Baker, J., Parasuraman, A., Grewal, D. & Voss, G., (2002) “The Influence of Multiple Store Environment Cues on
Perceived Merchandise Value and Patronage Intentions”, Journal of Marketing, Vol. 66, No. 2, pp. 120-141
Beatty, S. & Ferrell, M. E., (1998), “Impulse Buying: Modelling Its Precursors”, Journal of Retailing, Vol. 74, No.2,
pp. 169-191
Bellenger, D. & Korgaonkar, P., (1980) “'Profiling the Recreational Shopper”, Journal of retailing, Vol. 56, No. 3,
p. 77
Bitner, M. J., (1992) “Servicescapes: The Impact of Physical Surroundings on Customers and Employees”, Journal
of Marketing, Vol. 58, pp. 57-71
Bryman, A. & Bell, E., (2005) “Företagsekonomiska Forskningsmetoder”, Liber AB: Malmö
Bryman, A. & Bell, E., (2011) “Business Research Methods”, 3rd edition, Oxford University Press: Oxford
Bäckström, K. & Johansson, U., (2006) “Creating and Consuming Experiences in Retail Store Environments:
Comparing Retailer and Consumer Perspectives”, Journal of Retailing and Consumer Services, No. 13, pp. 417-430
Christensen, L., Engdahl, N., Grääs, C. & Haglund, L., (2001) “Marknadsundersökning - En Handbok”,
Studentlitteratur AB: Lund
Christensen, L., Engdahl, N., Grääs, C. & Haglund, L., (2010) “Marknadsundersökning - En Handbok”,
Studentlitteratur AB: Lund
61
Davies, B. J. & Ward, P., (2005) “Exploring the Connections Between Visual Merchandising and Retail Branding:
An Application of Facet Theory”, International Journal of Retail & Distribution Management, Vol. 33 Iss: 7, pp.
505 - 513
Donovan R.J., & Rossiter, J.R., (1982) “Store Atmosphere: An Environmental Psychology Approach”, Psychology
of Store Atmosphere, Vol. 58, No. 1, pp. 34-57
Donovan, R. J., Rossiter, J. R., Marcoolyn, G. & Nesdale, A., (1994) “Store Atmosphere and Purchasing Behavior”,
Journal of Retailing, Vol. 70, No. 3, pp. 283-294
Eroglu, S. & Machleit, K., (1990) “An Empirical Study of Retail Crowding: Antecedents and Consequences”,
Journal of Retailing, 66, 2, p. 201
Fiore, A. M. & Kim J., (2007) “An Integrative Framework Capturing Experiential and Utilitarian Shopping
Experience”, International Journal of Retail & Distribution Management, Vol. 35 Iss: 6, pp.421 - 442
Hair, J. H., Babin, B., Money, A. H., & Samouel, P., (2003) “Essentials of Business Research Methods”, Wiley &
Sons, Inc., Danvers, MA, USA, pp. 172
Hirschman, E. C. & Holbrook, M. B., (1982) “Hedonic Consumption: Emerging Concepts, Methods and
Propositions”,The Journal of Marketing, Vol. 46, No. 3, pp. 92-101
Holbrook, M. & Hirschman, E., (1982) “The Experiential Aspects of Consumption: Consumer Fantasies, Feelings,
and Fun”, Journal of Consumer Research, Vol. 9, No. 2, pp. 132-140
Jacobsen, D. I. (2002) “Vad, Hur och Varför? - Om Metodval i Företagsekonomi och Andra Samhällsvetenskapliga
Ämnen”, Studentlitteratur AB: Malmö
Jain, R. & Bagdare, S., (2009) “Determinants of Customer Experience In New Format Retail Stores”, Journal of
Marketing & Communication, Vol. 5, No. 2, pp. 34-44
Kerfoot, S., Davies, B. & Ward, P., (2003) “Visual Merchandising and The Creation of Discernible Retail Brands”,
International Journal of Retail & Distribution Management, Vol. 31 Iss: 3, pp. 143 - 152
Kotler, P., (1973) “Atmospherics As a Marketing Tool”, Journal of Retailing, Vol. 49, No. 4, pp. 48-64

62
Lin, J-S. C. & Liang H-Y., (2011) “The Influence of Service Environments on Customer Emotion and Service
Outcome”, Managing Service Quality, Vol. 21, No. 4, pp. 350-372
Maymand, M.M., & Ahmadinejad, M. (2011) “Impulse Buying: The Role of Store Environmental Stimulation and
Situational Factors (An Empirical Investigation)”, African Journal of Business Management, Vol. 5, No. 34, pp.
13057-13065
Microsiris.com, The decision tree for statistics [online] Available at:
<http://microsiris.com/Statistical%20Decision%20Tree/Glossary.htm#TWO-POINT%20SCALE>
[Retrieved: 2012-05-22]
Miranda, M. J., (2009) “Engaging The Purchase Motivations to Charm Shoppers”, Marketing Intelligence &
Planning, Vol. 27 Iss: 1, pp.127 - 145
Olsen S. O. & Skallerud K., (2011) “Retail Attributes’ Differential Effects on Utilitarian Versus Hedonic Shopping
Value”, Journal of Consumer Marketing, Vol. 28, Iss: 7, pp. 532-539
Pine, B. J. & Gilmore, J., (1998) “Welcome To the Experience Economy”, Harvard Business Review, Vol 78, No. 1,
97-105.
Poulsson, S. & Kale, S., (2004), “The Experience Economy and Commercial Experiences”, Marketing Review, Vol.
4, No. 3, pp. 267-277
Schmitt B., (1999) ” Experiential Marketing”, Journal of Marketing Management, Vol. 15, No. 1-3, pp. 53-67
Solomon, M. R., Bamossy G., Askegaard S. & Hogg M. K., (2010), “Consumer Behavior - A European
Perspective”, 4th edition, Prentice Hall, Harlow
Terblanche, N. S. & Boshoff, C., (2001) “Measuring Customer Satisfaction With Some of The Controllable
Elements of The Total Retail Experience: An Exploratory Study”, South African Journal of Business Management,
Vol. 32, No. 2, pp. 35-41.
Turley, L. W. & Chebat, J-C., (2002) “Linking Retail Strategy, Atmospheric Design and Shopping Behaviour”,
Journal of Marketing Management, No. 18, pp. 125-144
Turley, L. W. & Hoffman, K. D., (2002) “Atmospherics, Service Encounters and Consumer Decision Making: An
Integrative Perspective”, Journal of Marketing Theory & Practice, Vol. 10, Issue 3, pp. 33-47

63
Turley, L. W. & Milliman, R. E., (2000) “Atmospheric Effects on Shopping Behaviour: A Review of The
Experimental Evidence”, Journal of Business Research, No. 49, pp. 193-211
Tynan, C. & McKechnie, S., (2009) “Experience Marketing: A Review and Reassessment”, Journal of Marketing
Management, Vol. 25, No. 5-6, pp. 501-517
Voss, E. K., Spangenberg, R. E. & Grohmann, B., (2003) “Measuring The Hedonic and Utilitarian Dimensions of
Consumer Attitude”, Journal of Marketing Research, Vol. 40, No. 3, pp. 310-320
Yin, R., (2006), “Fallstudier - Design och Genomförande”, Liber AB: Malmö
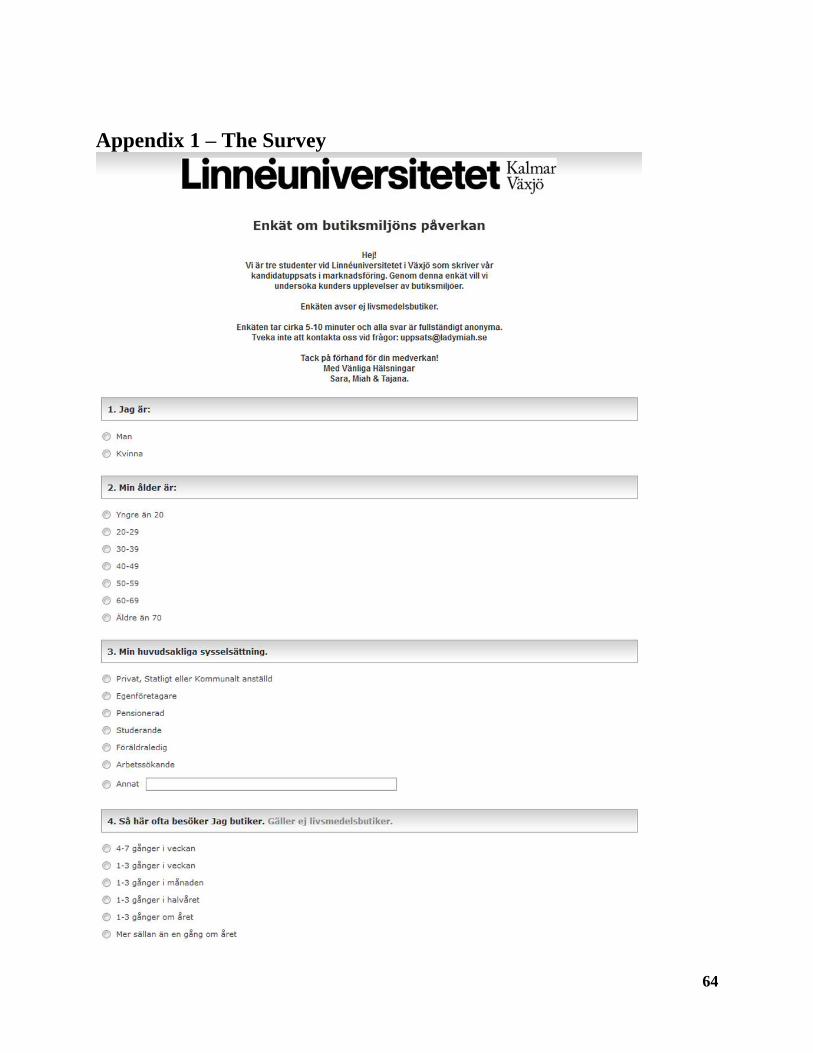
64
Appendix 1 – The Survey

65
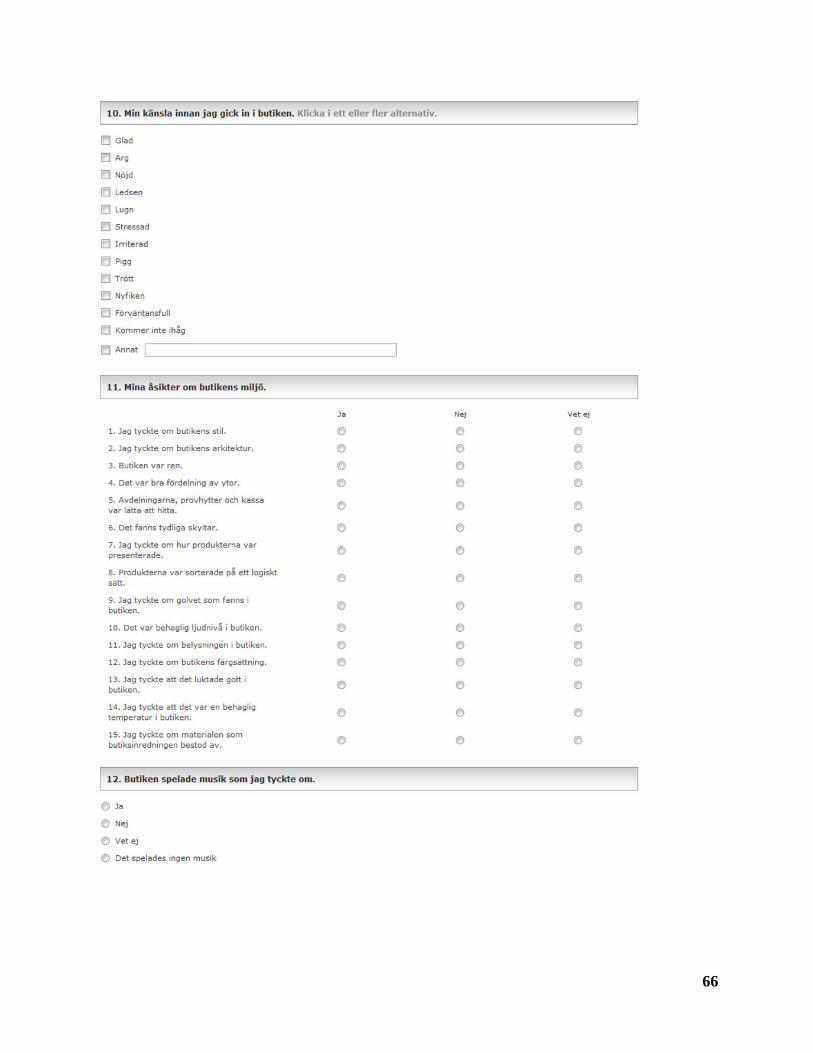
66
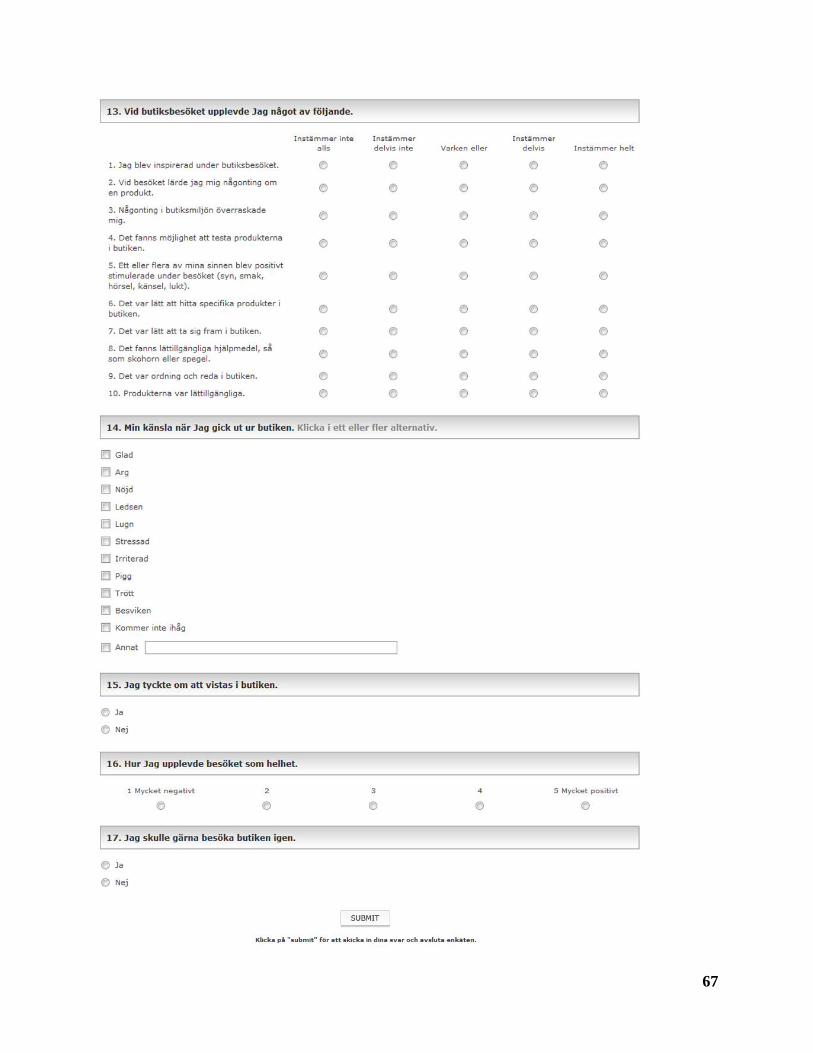
67

68
Appendix 2 - Survey in English
Note: This is not the SPSS coding of the survey answers, but the survey questions (Q) and answers (A) translated into English, so all readers of this study can easily understand the material.
Introduction text: Hello!
We are three students at Linnaeus University in Växjö who are writing our bachelor thesis in marketing. With this survey we want to examine customers' perceptions of retail environments.
The questionnaire does not concern grocery stores.
The survey takes about 5-10 minutes to complete and all responses are completely anonymous. Do not
hesitate to contact us with any questions: [email protected]
Thanks in advance for your participation Best regards
Sara, Miah & Tajana Q1 [Gender] A1 = male A2 = female
Q2 [Age] A1 = younger than 20 A2 = 20-29 A3 = 30-39 A4 = 40-49 A5 = 50-59 A6 = 60-69 A7 = older than 70 Q3 [Occupation] A1 = state, municipal, privately employed A2 = self-employed A3 = retired A4 = student A5 = parental leave A6 = unemployed A7 = other Q4 [Shop visit frequency] A1 = 4-7 times a week A2 = 1-3 times a week A3 = 1-3 times a month A4 = 1-3 times every half hear
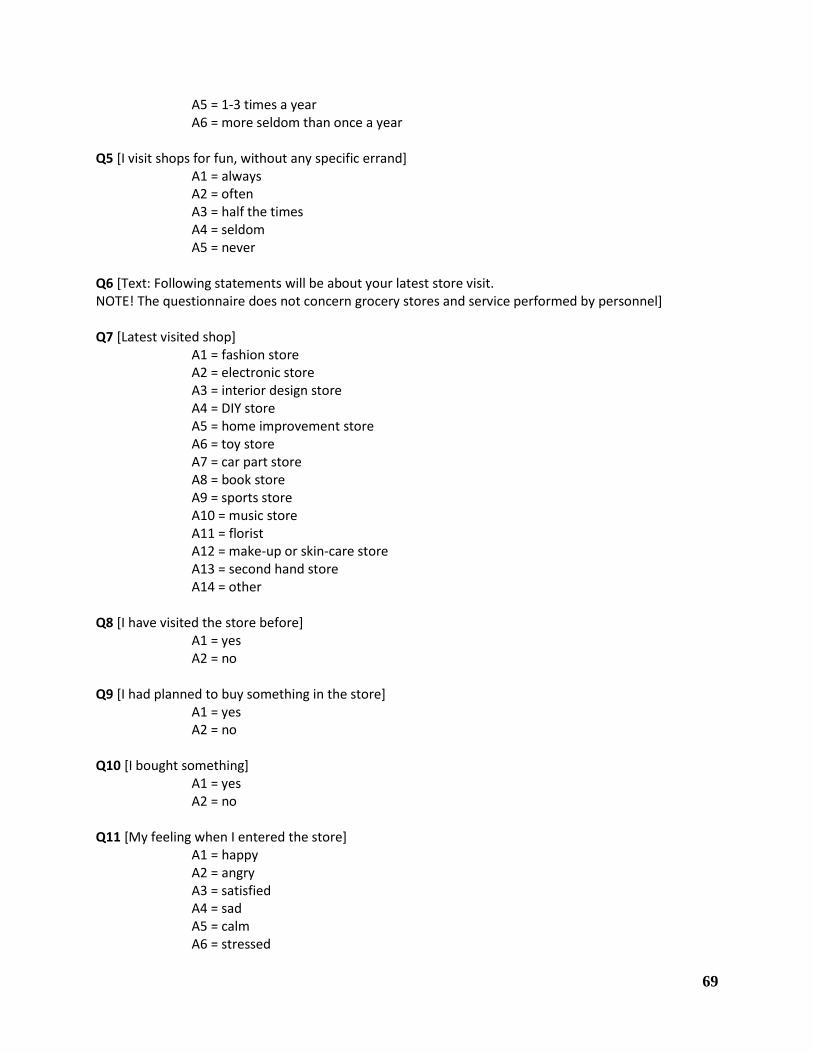
69
A5 = 1-3 times a year A6 = more seldom than once a year Q5 [I visit shops for fun, without any specific errand] A1 = always A2 = often A3 = half the times A4 = seldom A5 = never Q6 [Text: Following statements will be about your latest store visit. NOTE! The questionnaire does not concern grocery stores and service performed by personnel] Q7 [Latest visited shop] A1 = fashion store A2 = electronic store A3 = interior design store A4 = DIY store A5 = home improvement store A6 = toy store A7 = car part store A8 = book store A9 = sports store A10 = music store A11 = florist A12 = make-up or skin-care store A13 = second hand store A14 = other Q8 [I have visited the store before] A1 = yes A2 = no Q9 [I had planned to buy something in the store] A1 = yes A2 = no Q10 [I bought something] A1 = yes A2 = no Q11 [My feeling when I entered the store] A1 = happy A2 = angry A3 = satisfied A4 = sad A5 = calm A6 = stressed
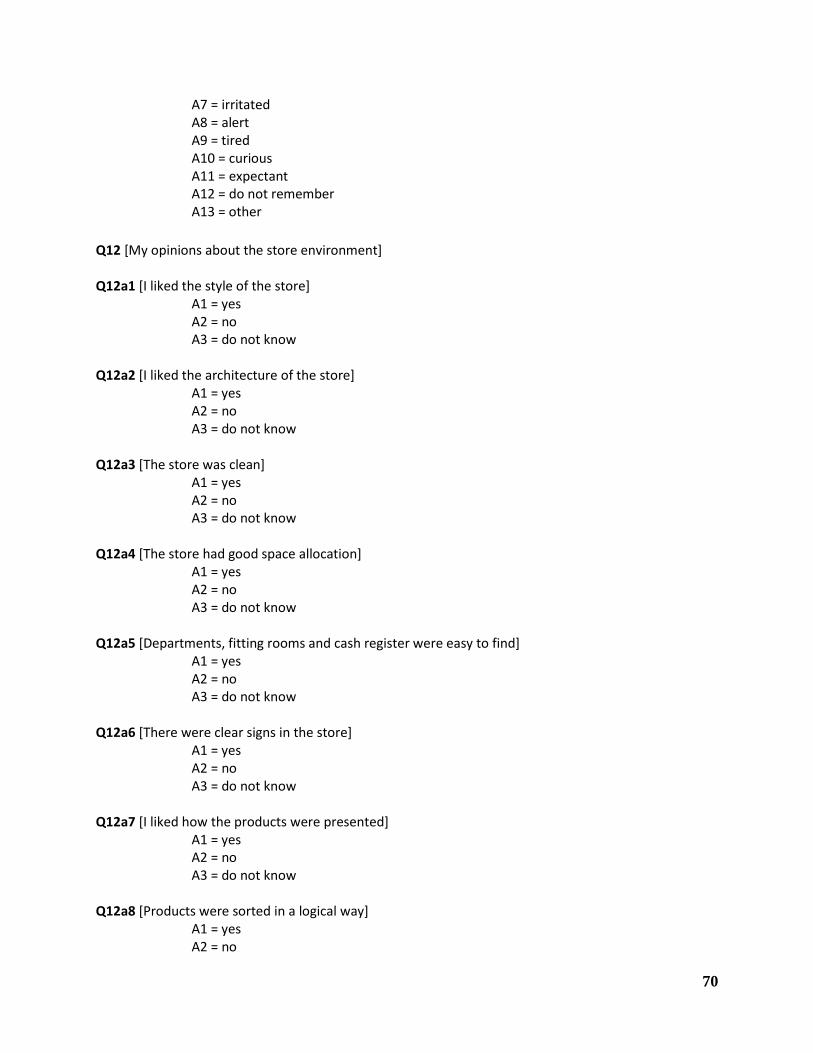
70
A7 = irritated A8 = alert A9 = tired A10 = curious A11 = expectant A12 = do not remember A13 = other
Q12 [My opinions about the store environment] Q12a1 [I liked the style of the store] A1 = yes A2 = no A3 = do not know Q12a2 [I liked the architecture of the store] A1 = yes A2 = no A3 = do not know Q12a3 [The store was clean] A1 = yes A2 = no A3 = do not know Q12a4 [The store had good space allocation] A1 = yes A2 = no A3 = do not know Q12a5 [Departments, fitting rooms and cash register were easy to find] A1 = yes A2 = no A3 = do not know Q12a6 [There were clear signs in the store] A1 = yes A2 = no A3 = do not know Q12a7 [I liked how the products were presented] A1 = yes A2 = no A3 = do not know Q12a8 [Products were sorted in a logical way] A1 = yes A2 = no
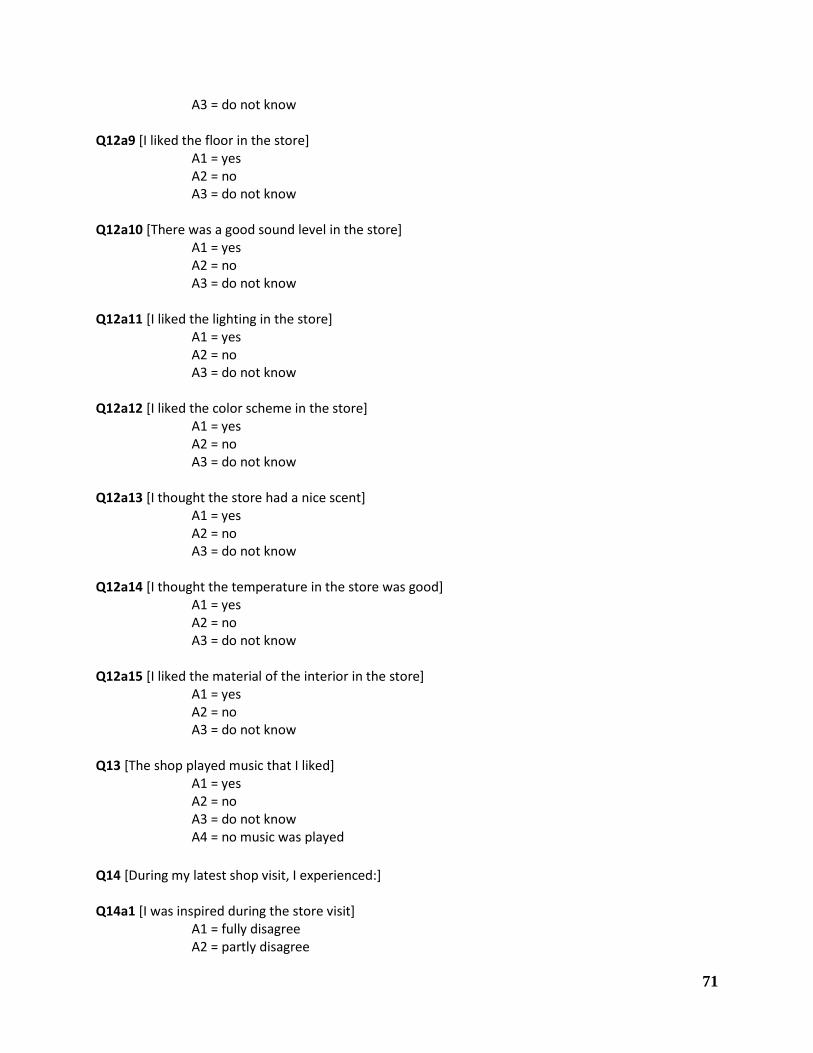
71
A3 = do not know Q12a9 [I liked the floor in the store] A1 = yes A2 = no A3 = do not know Q12a10 [There was a good sound level in the store] A1 = yes A2 = no A3 = do not know Q12a11 [I liked the lighting in the store] A1 = yes A2 = no A3 = do not know Q12a12 [I liked the color scheme in the store] A1 = yes A2 = no A3 = do not know Q12a13 [I thought the store had a nice scent] A1 = yes A2 = no A3 = do not know Q12a14 [I thought the temperature in the store was good] A1 = yes A2 = no A3 = do not know Q12a15 [I liked the material of the interior in the store] A1 = yes A2 = no A3 = do not know Q13 [The shop played music that I liked] A1 = yes A2 = no A3 = do not know A4 = no music was played
Q14 [During my latest shop visit, I experienced:] Q14a1 [I was inspired during the store visit] A1 = fully disagree A2 = partly disagree
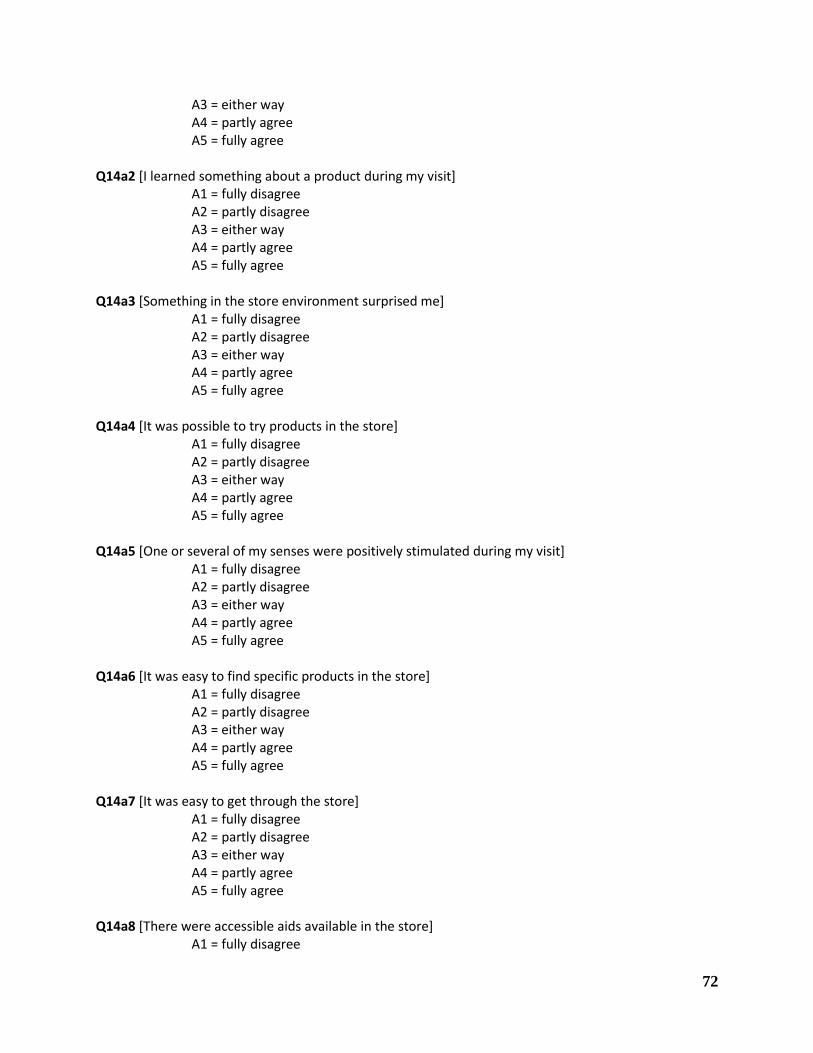
72
A3 = either way A4 = partly agree A5 = fully agree Q14a2 [I learned something about a product during my visit] A1 = fully disagree A2 = partly disagree A3 = either way A4 = partly agree A5 = fully agree Q14a3 [Something in the store environment surprised me] A1 = fully disagree A2 = partly disagree A3 = either way A4 = partly agree A5 = fully agree Q14a4 [It was possible to try products in the store] A1 = fully disagree A2 = partly disagree A3 = either way A4 = partly agree A5 = fully agree Q14a5 [One or several of my senses were positively stimulated during my visit] A1 = fully disagree A2 = partly disagree A3 = either way A4 = partly agree A5 = fully agree Q14a6 [It was easy to find specific products in the store] A1 = fully disagree A2 = partly disagree A3 = either way A4 = partly agree A5 = fully agree Q14a7 [It was easy to get through the store] A1 = fully disagree A2 = partly disagree A3 = either way A4 = partly agree A5 = fully agree Q14a8 [There were accessible aids available in the store] A1 = fully disagree
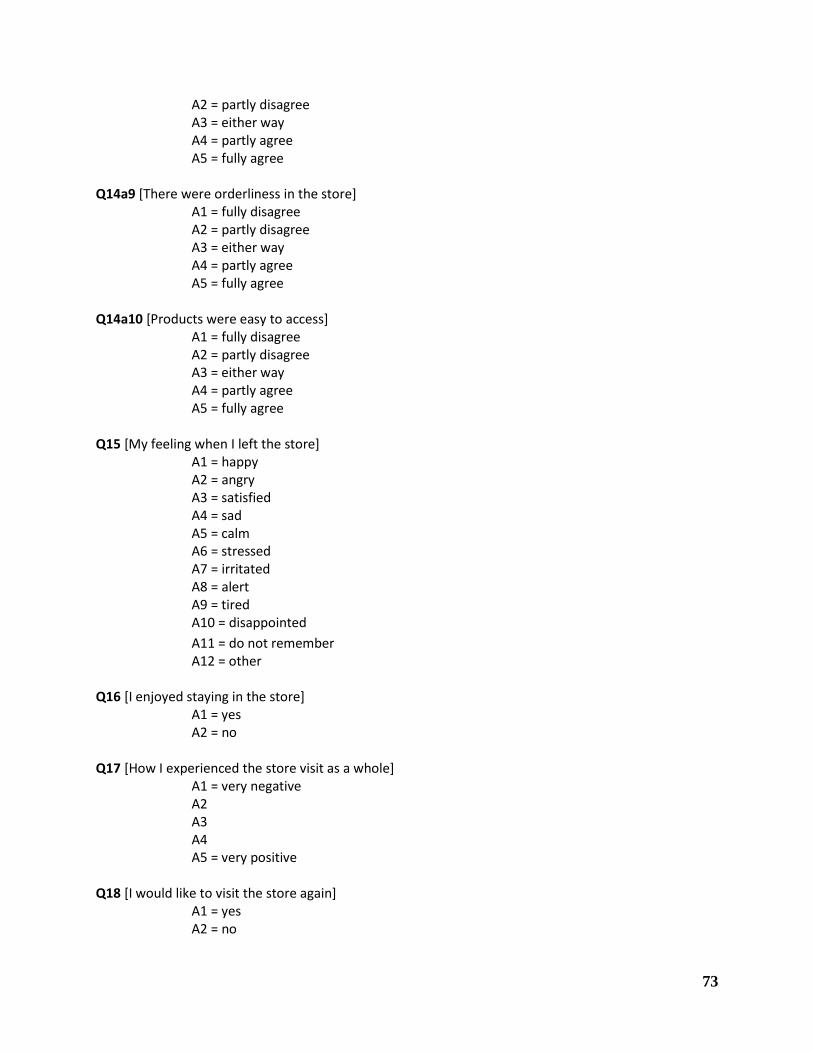
73
A2 = partly disagree A3 = either way A4 = partly agree A5 = fully agree Q14a9 [There were orderliness in the store] A1 = fully disagree A2 = partly disagree A3 = either way A4 = partly agree A5 = fully agree Q14a10 [Products were easy to access] A1 = fully disagree A2 = partly disagree A3 = either way A4 = partly agree A5 = fully agree Q15 [My feeling when I left the store] A1 = happy A2 = angry A3 = satisfied A4 = sad A5 = calm A6 = stressed A7 = irritated A8 = alert A9 = tired A10 = disappointed
A11 = do not remember A12 = other Q16 [I enjoyed staying in the store] A1 = yes A2 = no Q17 [How I experienced the store visit as a whole] A1 = very negative A2 A3 A4 A5 = very positive Q18 [I would like to visit the store again] A1 = yes A2 = no
74
Linnaeus University – a firm focus on quality and competence On 1 January 2010 Växjö University and the University of Kalmar merged to form Linnaeus University.
This
new university is the product of a will to improve the quality, enhance the appeal and boost the
development potential of teaching and research, at the same time as it plays a prominent role in working
closely together with local society. Linnaeus University offers an attractive knowledge environment
characterised by high quality and
a competitive portfolio of skills.
Linnaeus University is a modern, international university with the emphasis on the desire for knowledge,
creative thinking and practical innovations. For us, the focus is on proximity to our students, but also on
the world around us and the future ahead.
Linnæus University
SE-391 82 Kalmar/SE-351 95 Växjö
Telephone +46 772-28 80 00