Atlantic Menhaden, Brevoortia tyrannus, Purse Seine .... A brief introduction should portray the...
30
NOAA Technical Report NMFS 59 September 1987 Atlantic Menhaden, Brevoortia tyrannus, Purse Seine Fishery, 1972-84, with a Brief Discussion of Age and Size Composition of the Landings Joseph W. Smith William R. Nicholson Douglas S. Vaughan Donnie L. Dudley Ethel A. Hall U.S. DEPARTMENT OF COMMERCE National Oceanic and Atmospheric Administration National Marine Fisheries Service
Transcript of Atlantic Menhaden, Brevoortia tyrannus, Purse Seine .... A brief introduction should portray the...

NOAA Technical Report NMFS 59 September 1987
Atlantic Menhaden,Brevoortia tyrannus,Purse Seine Fishery, 1972-84,with a Brief Discussion ofAge and Size Compositionof the LandingsJoseph W. SmithWilliam R. NicholsonDouglas S. VaughanDonnie L. DudleyEthel A. Hall
U.S. DEPARTMENT OF COMMERCENational Oceanic and Atmospheric AdministrationNational Marine Fisheries Service

NOAA TECHNICAL REPORT NMFS
Guidelines for Contributors
FORM OF MANUSCRIPT
Authors are encouraged to retain manuscripts on word processing storagemedia, such as diskettes, floppy disks, cassette or magnetic tapes, and submit a hard copy run from the storage media. Hardcopy should be typeddouble-spaced on white bond paper in the following sequence:
Title pageContentsAbstractTextAcknowledgmentsCitationsText footnotesAppendixTablesFigure LegendsFigures
CONTENTS OF MANUSCRIPT
Contents. Contains all text headings with page numbers omitted.
Abstract. Not to exceed one double-spaced typed page. Should includea sentence or two explaining to the general reader why the research wasundertaken and why the results should be viewed as important. Abstractshould convey the main point of the paper and outline the results or conclusions. Footnotes and references do not belong in the abstract.
Text. A brief introduction should portray the broad significance of thepaper. The entire text should be intelligible to readers from differentdisciplines. All technical terms should be defined. Follow the U. S. Government Printing Office Style Manual, 1984 edition.
Fishery nomenclature follows the American Fisheries Society SpecialPublication No. 12, A list ofCommon and Scientific Names ofFishes fromthe United States and Canada, 4th edition, 1980.
Abbreviations and symbols. Define all symbols, abbreviations, andacronyms. Define all symbols in equations and formulas. Abbreviate unitsof measure only when used with numerals or in tables and figures wherethere is lack of space. Periods are rarely used except for et aI., vs., e.g.,i.e., etc.
Measurements should be expressed in metric units. Other equivalent unitsmay be given in parentheses.
Text footnotes. Type on a separate sheet from the text. Footnotes are notused for reference material or personal communications, but rather to explain or define terms in the text and for contribution numbers.
Personal communications are noted in parentheses in the text (name,affiliation, brief address including zip code, month and year).
Citations. All written sources should be listed in the Citations section,including unpublished and processed material. In text, cite as Smith andJones (1977) or (Smith and Jones 1977); if more than one citation, listchronologically (Smith 1936; Jones 1975; Doe 1977). All sources cited inthe text should be listed alphabetically by the senior authors' surname underthe heading CITATIONS. Abbreviations of periodicals and serials shouldconform to the Biosis Data BaseTM. The author is responsible for the accuracy of all citations.
Acknowledgments. Gather all acknowledgments into a brief statementat the end of the text. Give credit only for exceptional contributions andnot to those whose contributions are part of their normal duties.
Tables. Tables should supplement, not duplicate, the text. Each table shouldappear on a separate page, and be numbered consecutively. Headings shouldbe short but amply descriptive so that the reader need not refer to the text.For values less than I, zeros should precede all decimal points. Give eachcolumn a heading with units of measure indicated in parentheses. Do notchange the unit of measure within a column. Table footnotes should benumbered consecutively in Arabic numerals across the page from left toright and down; to avoid confusion with exponents, place them to the leftof numerals, e.g., 310. All tables should be cited consecutively in the textand their placement, where first mentioned. indicated in the left-hand marginof the manuscript page. Lengthy tables that are typed in the proper formatand are clean and legible can be used camera-ready.
Figures. Photographs and line drawings should be of professional qualityclear and concise-and reducible to 42 picas for full-page width or to 20picas for a single-column width, and a maximum of 57 picas high. All illustrations must be proportioned so that they are legible when reduced tofit the page format. Line weight and lettering should be sharp and even.Lettering on graphs should be upper and lower case, and vertical letteringshould be avoided as much as possible (except for vertical, y, axis). Forvalues less than I, zeros should precede all decimal points. Reproductionsof line art work are accepted in the form of photographic prints from negativesor photomechanical transfer. Halftones should be sharply focused with goodcontrast. Micron rules should be inserted on electron micrographs, evenwhen magnification is included in the figure legend. There should be gooddistinction between identifying letters (preferably press-on) and backgroundof photograph. All figures should be cited consecutively in the text and theirplacement, where first mentioned, indicated in the left-hand margin of themanuscript page. Each figure should be labeled in pencil on the back. DONaT SEND original or photographic prints of figures to the Scientific Editor;they will be requested when the manuscript is accepted for publication.
Copyright. Government publications are in the public domain, i.e., theyare not protected by copyright.
SUBMISSION OF MANUSCRIPTSSend original hardcopy and two duplicated copies of the manuscript to:
Dr. Andrew E. Dizon, Scientific EditorNOAA Technical Reports NMFSSouthwest Fisheries CenterNational Marine Fisheries Service, NOAAP.O. Box 271La Jolla, CA 92038-0271
Indicate whether word processing storage media are available, but do notforward disks until requested by Scientific Editor or Scientific Publicationsoffice.
Copies of published reports. For single monographs, the senior authorwill be provided with 50 copies free of charge and 50 to his or her organization. For collections of papers, each senior author will receive 50 separatesand one cover, and his or her organization will receive the same. Additionalcopies may be purchased in lots of 100.
ADDITIONAL INFORMATION
Questions regarding editorial policy and procedures may be forwarded to:Nancy Peacock, Managing EditorNOAA Technical Reports NMFSNational Marine Fisheries Service, NOAAScientific Publications OfficeBin CI5700Seattle, WA 98115

NOAA Technical Report NMFS 59
Atlantic Menhaden,Brevoortia tyrannus,Purse Seine Fishery, 1972-84,with a Brief Discussion ofAge and Size Compositionof the Landings
Joseph W. SmithWilliam R. NicholsonDouglas S. VaughanDonnie L. DudleyEthel A. Hall
September 1987
U.S. DEPARTMENT OF COMMERCEC. William Verity, Jr., Secretary
National Oceanic and Atmospheric AdministrationAnthony J. Calia, Administrator
National Marine Fisheries ServiceWilliam E. Evans, Assistant Administrator for Fisheries

The National Marine Fisheries Service (NMFS) does not approve, recommend
or endorse any proprietary product or proprietary material mentioned in thispublication. No reference shall be made to NMFS, or to this publication furnished
by NMFS, in any advertising or sales promotion which would indicate or implythat NMFS approves, recommends or endorses any proprietary product or pro
prietary material mentioned herein, or which has as its purpose an intent to cause
cirectly or indirectly the advertised product to be used or purchased because ofthis NMFS publication.
II
CONTENTS
Introduction
Changes in sampling and reporting procedures
Changes in the fishery 4
Total landings, vessels, effort, and CPUE in the fishery 5
Landings, age composition, effort, and CPUE by area 6North Atlantic 6Middle Atlantic and Chesapeake Bay 7South Atlantic 8North Carolina fall fishery 9
Length and weight statistics 10
Summary II
Acknowledgments 15
Citations 15
Appendix Tables 16
III

Atlantic Menhaden,Brevoortia tyrannus, PurseSeine Fishery, 1972-84,with a Brief Discussion ofAge and Size Compositionof the Landings
Joseph W. SmithWilliam R. NicholsonDouglas S. VaughanDonnie L. DudleyEthel A. HallBeau/1m Labor(//or\"SOlllheasT Fisheries Cell/erNaTional Marine Fisheries Sen'ice. NOAABeau/1m, NorTh Carolina 285/6-9722
ABSTRACT
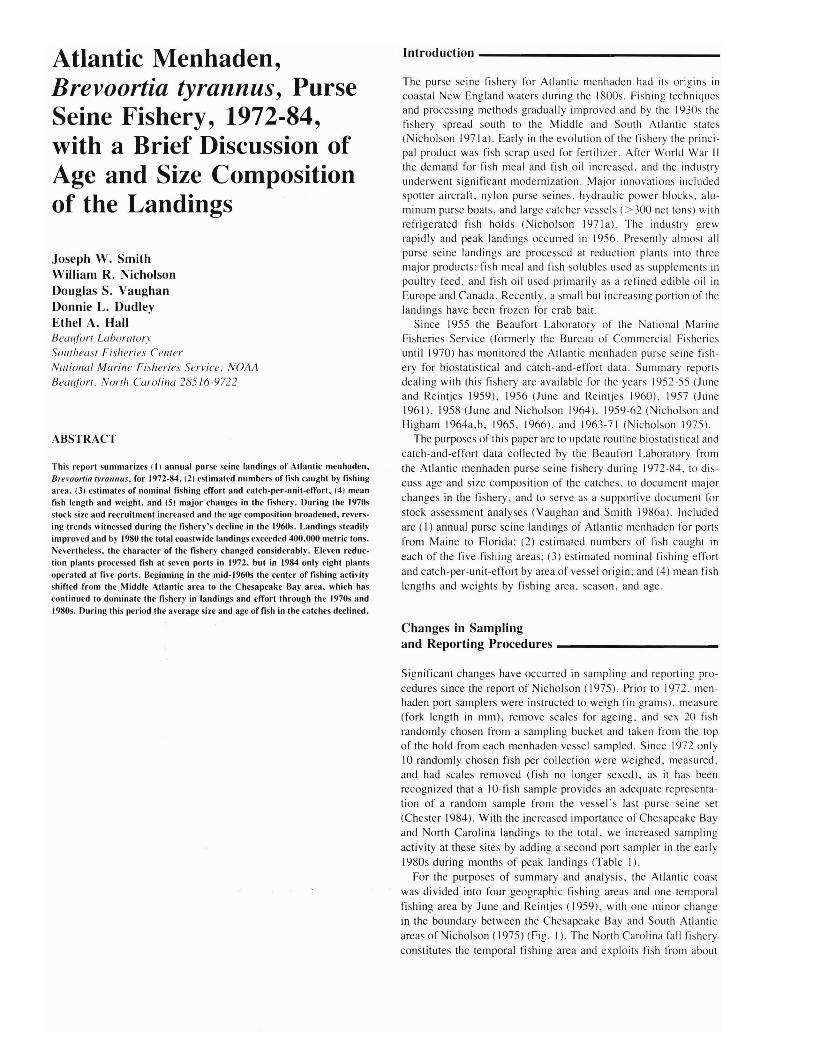
This report summarizes (I) annual purse seine landings of Atlantic menhaden,Brevoortia (vra1lfllls. for 1972-84,12) estimated numbers of fish caught by l1shingarea. (3) estimates of nominal fishing en'ort and catch-per-unit-effort, (4) meanfish length and weight. and (51 major changes in the fishery. During the 1970sstock size and recruitment increased and the age composition broadened. reversing trends witnessed during the fishery's decline in the 1960s. Landings steadilyimproved and by 1980 the total coast wide landings exceeded 400.000 metric tons.Nevertheless. the character of the fishery changed considerably. Eleven reduction plants processed fish at seven ports in 1972. bUI in 1984 only eight plantsoperated at live ports. Beginning in the mid-1960s the center of fishing aclivityshifted from the Middle Atlantic area to the Chesapeake Bay area. which hascontinued to dominate the fishery in landings and effort through the 1970s and1980s. During this period the aver'age size and age of fish in the catches declined.
Introduction _
The purse seine fishery for Atlantic menhaden had its origins incoastal New England waters during the 1800s. Fishing techniquesand processing methods gradually improved and by the 1930s thefishery spreau south to the Middle and South Atlantic states(Nicholson 1971 a). Early in the evolution of the fishery the principal product was fish scrap useu for fertilizer. After World War IIthe demand for fish meal and fish oil increascd. and the industryunderwent significant modemization. Major innovations includedspotter aircraft, nylon purse seines, hydraulic power blocks. aluminum purse boats. and large catcher vessels (> 300 net tons) withrefrigerated fish holds (N icholson 1971 a). The industry grewrapidly and peak landings occurred in 1956, Presently almost allpurse seine landings are processed at reduction plants into threemajor products: fish meal and fish solubles used as supplements inpoultry feed, anu fish oil used primarily as a refined edible oil inEurope and Canada. Reccntly. a small but increasing portion of thelanuings have been frozen for crab bait.
Since 1955 the Beaufort Laboratory of the National MarineFisheries Service (formerly the Bureau of Commcrcial Fisheriesuntil 1970) has monitored the Atlantic menhaden purse seine fishery for biostatistical and catch-and-effort data. Summary reportsdealing with this fishery are available for the years 1952-55 (Juneand Reintjes 1959), 1956 (June and Reintjes 1960). 1957 (June1961), 1958 (June anu Nicholson 1(4). 1959-62 (Nicholson andHigham 1964a.b. 1965. 1966). and 1963-71 (Nicholson 1975).
The purposes of this paper are to update routinc biostatistical andcatch-and-effort data collected by the Beaufort Laboratory fromthe Atlantic menhaden purse seine fishcry during 1972-84. to discuss age and size composition of the catches. to document majorchanges in the fishery. and to serve as a supportive document forstock assessment analyses (Vaughan and Smith 1986a). Includedare ( I) annual purse seine landings of Atlantic menhaden for portsfrom Maine to Florida; (2) estimated numbers of fish caught ineach of the five fishing areas; (3) estimated nominal fishing effortand catch-per-unit-effort by area of vessel origin; and (4) mean fishlengths and weights by fishing area, season, and age.
Changes in Samplingand Reporting Procedures _
Significant changes have occurred in sampling and reporting procedures since the report of Nicholson (1975). Prior to 1972. menhaden port samplers were instructed to weigh (in grams). measure(fork length in mm). remove scales for ageing. and sex 20 fishrandomly chosen from a sampling bucket and taken from the topof the hold from each menhaden vessel sampled. Since 1972 only10 randomly chosen fish per collection were weighed. measured.and had scales removed (fish no longer sexed). as it has beenrecognized that a IO-fish sample provides an adequate representation of a random sample from the vessel's last purse seine set(Chester 1984). With the increased importance of Chesapeake Bayand North Carolina landings to the total. we increased samplingactivity at these sites by adding a second port sampler in the early1980s during months of peak landings (Table I).
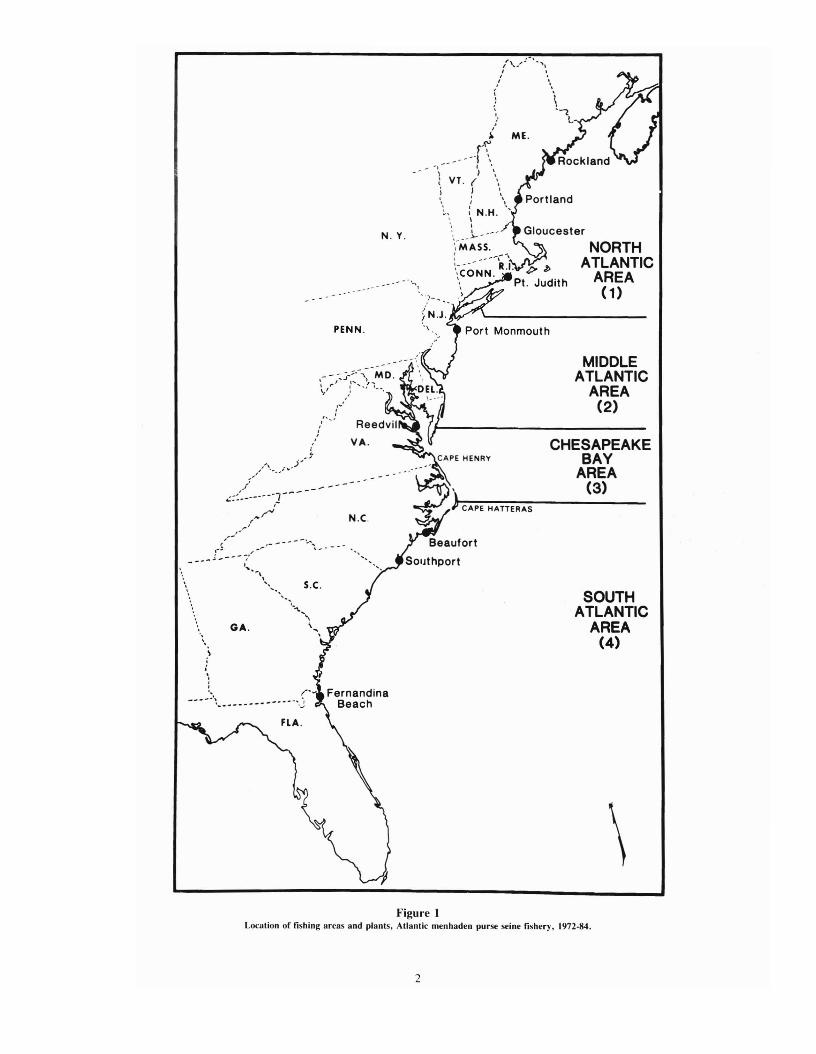
For the purposes of summary and analysis. the Atlantic coastwas divided' into four geographic fishing areas and one temporalfishing area by June and Reintjes (1959). with one minor changein the boundary between the Chesapeake Bay and South Atlanticareas of Nicholson (1975) (Fig. I). The North Carolina fall fisheryconstitutes thc temporal fishing area and exploits fish from about
\
NORTHATLANTIC
AREA(1)
MIDDLEATLANTIC
AREA(2)
SOUTHATLANTIC
AREA(4)
CHESAPEAKEBAY
AREA(3)
,-,,'\,./' ""'ll
I •I '
I ', ', '\ ,, \
~ ~('. ,; ...
~ ME.r\'_.\ '
... 'I"'---~ I '.
~ > \~ VT. ( •i J \, ' ,
I ,
: N.H. "\
~ ... ~.1.>--
",-MASS,: .. ' --, ..,"~CC;NN, R.I, P. 1>
\ Pt, Judith.>
VA .
PENN,
- - ••... 1
N. Y.
- - -.. ~-;---\-MD.\ ,,.1 t' .... / ""i__•
, ",,,
,'''-;,.I.
GA,
\.i,,,,'.
- .... _.,~ ..... ~ - _.... _. - -_. - -",j
..
.
Figure ILocation of fishing areas and plants, Atlantic menhaden purse seine fishery, 1972·84.
2

Table 1Number of IO-fish samples collected from Allantic menhaden purse seine catches by fishing area, port, and plant, 1972-84.
Locatiun 1972 1973 1974 1975 1976 1977 197R 1979 1980 1981 1982 In3 1984
NORTH ATLANTIC AREA
Rockland. ME 0 2 0 0 0 4 3 II 62
Portland. ME I 0 0 7 0 0 0 2 6
Gloucester. MA 0 6 20 21 18 30 64 66 66 100 60 95 171
Poinl Judilh. RI 6 2 13 14 18 15 15 9 0
MIDDLE ATLANTIC AREA
POrl Monmouth. NJ 47 59 67 133 125 171 116 92 109 115
CHESAPEAKE BAY AREA
Reedville. VA 0
(3 plants) 170 191 III 125 108 110 108 97 84 170 243 270 266
306 228 125 124 132 158 137 133 137 164 233 338 301
SOUTH ATLANTIC AREA
Beaufort. NC 27 89 97 103 89 74 53 64 114 158 139 205 191
(3 plants) 7 2 II 45 22 33 41 42 32 27 28 59 55
10 0 53 66 41 50 48 53 43 37 59 94 78
Soulhport. NC 13 32 40 53 63 49 63 42 27 66 88 29
Fernandina Beach. FL 70 26 6 43 26 32 59 39 119 80 52 42 45
Totals 656 636 543 727 647 724 m 637 731 921 907 TI49 TI69
*Plant did not operate.
Cape Hatteras south to the southern border of North Carolina. This
fishery usually begins in late October or early November, depending upon the arrival of migratory menhaden from waters farther
north, and ends the last day of February of the next calender year
(although most fishing activity usually stops by mid-January). For
standardized data summary. the first week of the fall fishery is
taken to be the week which ends between 8 and 14 November.
Vessels rarely fished in areas other than where their home port
and processing plant were located (Table 2). Exceptions included
vessels from the plant at Port Monmouth, NJ (Middle Atlantic
area) which frequently fished in Long Island Sound (North Atlantic
area). and vessels from plants in Chesapeake Bay which in 1983
84 tended to fish more often in areas north of the Chesapeake Bayarea and also in the South Atlantic area during November and
December. Vessels from Ihe South Atlantic area rarely fished inareas to the north.
Estimated numbers of fish are calculated as describe(j in Chester(1984). However. unlike previous summary reports for Atlanticmenhaden. we report the estimated numbers of fish by area cuughlrather than by area IUl/ded. The former is biogeographically more
realistic. and better serves our purpose of providing a supportivedocument for population mol!eling and stock assessment analyses(Vaughan and Smith 1986a). Furthermore, recent state manage
ment options developed for the Atlantic menhaden fishery(Vaughan and Smith IY86b) were devisel! basel! on area of cap
ture. In this light. Table 3 shows tonnage of fish by area landed,
and from a historical perspective serves the concerns of state fish
eries managers and menhaden industry personnel. Estimates of
number of fish by area caught (Tables 8-12) were not derived
directly from tonnages in Table 3. but rather from the proportion
of sampled fish caught by fishing area as computed via our sam
pling program.
In this report we use the term "landings" to refer to ( I) the total
weight of fish (in metric tons) offloaded at a plant (or plants), or
(2l the coastwide estimate of total number of fish harvested and
offloaded at docksid~. We use the terms "catch" or "area caught"
3
in reference to estimates of number of fish caught in a given fishing
area. In a sense, our use of the term "catch-per-unit-effort (CPUEl"
is a misnomer, because in this report CPUE is actually "Iandingsper-unit-effort" defined as metric tons of fish landed per vesselweeki.
Historic port sampling data for size and age were re-examined
for errors using recently developed editing programs on the com
puter; corrections were made to the data set where appropriate.
Hence, estimated numbers of fish caught at age for 1970-84
(Tables 4 and 8-12) may differ slightly with numbers reported
by Nicholson (1975) and those in ASMFC (1981). Estimated
numbers-at-age for years prior 10 1970 are from two sources:
1965-69, estimated numbers by area caught are from the data set
IA ves)el week is one vessel fishing at least one day of one week.
Table 2Percentages of Atlantic menhaden (estimaled numbers of
fish) caught by purse seine vessels in areas other than wheretheir home ports were located.
Year orth Allantic Middle Allanlic Chesapeake Bay
1972 0.0 14.7 5.1
1973 0.0 213 2.4
1974 0.0 17.2 130
1975 0.0 548 10.8
1976 0.0 267 15.2
1977 00 207 93
1978 0.0 58.7 88
1979 0.0 48.6 0.6
1980 00 59.4 00
1981 0.0 62.6 3.1
1982 0.0 3.2
1983 00 20.0
1984 00 20.1
*Planl did not operate.

*LanLlings from two arc<.JS combined to protect confidential diJta.
Table 3Allantie menhaden purse seine landings (10-' metric tons) by area landed,
1940-84.
used by Ahrenholz et aL (1987): 1955-64, estimated numbers-at
age are available only by area landed and are from Nicholson
( 1975)
Appendix formats used by Nicholson (1975) which featured
length-frequency distributions for sampled fish by port and age,
and mean lengths of sampled fish by month and age. were consolidated and refined. In Appendix Tables 2-13 we report simple
mean lengths and simple mean weights by fishing area (and coast
wide). age (in yr), and season. Appendix Table 1 defines seasons
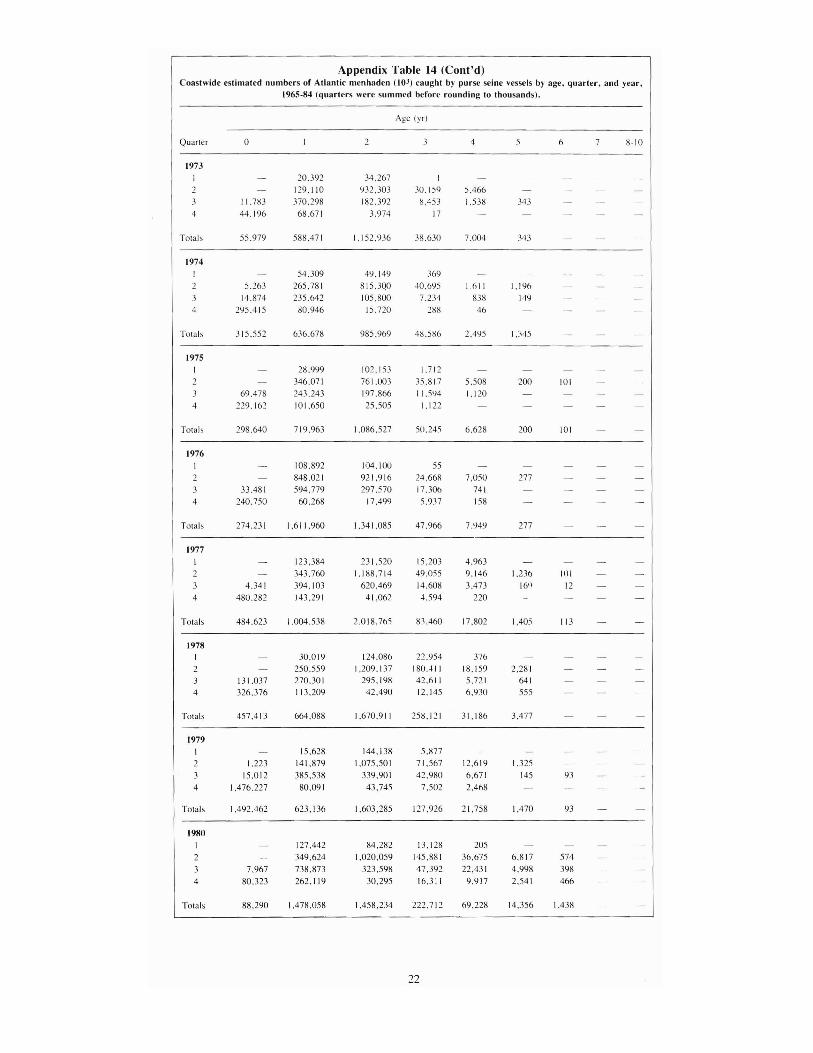
(= quarters) used in subsequent appendices. Coastwide estimates
of numbers of fish landed by age and quarter for \965-84 that were
used in stock assessment analyses (Vaughan and Smith 1986a) are
given in Appendix Table 14.
North Middle Chesapeake South
Year Atlanti,' Atlantic Bay Allantic
Changes in the Fishery _
As documented by Nicholson (1975), the purse seine fishery forAtlantic menhaden declined through the 1960s when fish became
scarce in the northern half of their range. Stock size decreased dueto low recruitment and the age structure became truncated (Ahren
holz et aL 1987). Plants closed and the vessels reduced their
fishing north of Chesapeake Bay. During the mid-1960s landings
and CPUE at plants in Chesapeake Bay declined even as effort
increased. South of Cape Hatteras, the fishery was relatively smalland there was little change. During the 1970s recruitment levels
increased and by the latter part of the decade the age structurebegan to broaden (Ahrenholz et aL 1987). Nevertheless, the char
acter of the fishery changed considerably during the 1970s. Eleven
reduction plants operated at seven ports in 1972, but in 1984 only
eight plants processed fish at five ports.
Plants in the North Atlantic area primarily process fish offal
from the New England trawl fisheries, but they process menhaden
during summer and early fall when the fish are available locally.
Must vessels fishing for North Atlantic plants are trawlers that
convert to purse seine fishing during summer. In 1972 only two
plants (PI. Judith, RI, and Gloucester, MA) were active in the
North Atlantic area (Fig. \). [n 1975 three facilities processedmenhaden (Gloucester, MA, Portland, ME, and Rockland, ME),
and although purse seine vessels continued to land menhaden at PI.Judith, the reduction plant had closed and the fish were transported
via truck to the facility at Portland for processing. Landings at PI.
Judith were handled in this manner through 1979 and again in
1982. After 1983 the plant at Portland closed. In 1984 only the
facilities at Gloucester and Rockland processed menhaden. Clo
sure of the plants at PI. Judith and Portland was not related directly
to a scarcity of menhaden, rather it was primarily due to local
factory-odor abatement problems. In 1984 the plant at Gloucester
came under similar scrutiny and was inactive during 1985 and
1986.
During the 1950s and early 1960s as many as five reductionplants were active in the Middle Atlantic area, but through the1970s only one plant at Port Monmouth, NJ, was active. It ceased
operation after the 1981 fishing season. During the late 1960s and
early 1970s acquisitions and consolidation reduced the number ofoperating factories in the Chesapeake Bay area (Nicholson 1975).By 1973 only two processing plants remained in the ChesapeakeBay area: both were in Reedville, VA, and both were active
through 1985. One of these temporarily suspended operations afterthe 1985 fishing season. During the mid-1960s plants in
Chesapeake Bay acquired larger and faster vessels, and the fishingseason was extended into November as migratory schools of fishwere exploited off the Virginia capes (Nicholson \975). This trend
continued through the 1980s with Virginia plants processing fish
into December in 8 of 13 years between 1972 and 1984. [n some
years (1980s) migratory fish harvested as far south as Cape Hat
teras, NC, were processed in Virginia. Moreover, beginning in
1983 vessels from Chesapeake Bay caught significant numbers offish (Table 2) in the Middle Atlantic and North Atlantic areas, left
vacant after the plant at Port Monmouth closed in 1981. Thus, by
the mid-1980s vessels from Chesapeake Bay exploited Atlantic
menhaden in all four geographical fishing areas.In the South Atlantic area. the number of processing plants
remained relatively stable from 1972 to 1984. Two plants in Beau
fort, NC, uperated during all years of the period in both the
217.727791672237.2257.9295.9362.4378.33465363S297.2361.4409'l593260816414712.16028510.U65915298575'l537.7.1469269.22734219.61935234S161.6259.4
250336593469292.22502340.5341 I.,441.,75.7
401.5381.33S2441S.6326.3
36634920.128.S2S731.937332940639721.831126.43'l.7
41.964473752.1l70.382.162.209.925.S61S3S.452971.7
51.2
52.8413IS.37.9542.4
15.717.8IS.I32.2
38.254.035.864.530.56S.46S.7
North Carol illa
fall fishery TOlal
46.536.724534.133.632.942.4
38345937245.9
59.550.749.S
60361.653279.15XS31.3190
.,7 9
45232.959.74695S.540.834255.S59.320054.0So.O
52S39.643.46S.636.441.3
63136.744.142.234.2
1940 16.S 91.1 .'5.31941 .,35 104.1 60.21942 14.6 77.7 21.9194.' 9.8 96.8 42.11944 27.5 1226 32.21945 34.0 136.4 35. I1946 42.9 183.8 57.61947 44.2 1858 SI.21948 44.4 137.4 6831'14'1 522 1498 62S1950 493 1430 63.11951 51.0 1686 5611952 58.1 193.7 45.71'l53 59.7 363.2 77.S1954 649 3357 12601955 83.' 317.6 132.71956 98.5 37S,3 94.01957 835 3045 126.01958 36.0 211.1 151.31959 66.0 2509 196.81960 66.4 250.0 108.51961 58.6 274.6 128.71962 64.7 249.9 155.11963 35.2 111.7 10401964 15.0 35.2 1.14. I1965 11.9 458 126.11966 1.8 6.0 115.01967 00 17.1 91.11968 6.7 262 115.51969 29 125 no1970 4.3 11.4 IS2.91971 10.4 23.0 170.71972 14.5 546 245.51973 299 277.41974 358 194.81975 231 14981976 284 24.1.31977 15.0 24411978 314 214.11979 29.4 23071980 29.7 282.S1981 21.8 21591982 =-:":'''--;;:2'''93''-.7'1~-'-'--'-"--
1983 31S91984 23S6
4

"summer" fishery" and the North Carolina fall fishery. A third
plant in Beaufort operated during the summer fishery of 1972,
1973. 1975. and 1978-80. and during each North Carolina fall
fishery. 1972-84: this plant was inactive during 1985 and J986.One plant in Southport. NC, was active during the summer fishery,
1972-83. and during the North Carolina fall fishery of 1975, 1977,
IC)78. and 1980-83. It closed after the 1983 fishing season. Thesingle plant in Fernandina Beach. FL, was active during all years,
1972-1984
Total Landings, Vessels, Effort,and CPUE in the Fishery _
Total landings of Atlantic menhaden declined precipitously during
the I960s. falling from 575.900 metric tons in 1961 to 161,600 mt
in 1969 (Table 3). Landings gradually increased through the early
1970s. yet fluctuated between 250,200 mt in 1975 and 365.900 mt
~Th~ summer fishery in the South Afl£lntic area IfCiditionally refers to the fishery fromApril through carty November. after which time migratory schools of fish from morenOrlherly latitudes begin 10 £Ippcar in North Carolina coastal waters.
in 1972. During the late 1970s landings remained above the340,000 mt level anu continued to climb. By 1980. 40 1,500 mt
were landed and the landings of 418.600 mt in 1983 were the
greatest since 1962.
During the 1960s t'"le estimated number of fish in the coastwidelandings declined to a low of 868.18 million fish in 1969 (Table 4).
As landings improved through the early 1970s, estimated numbersoffish landed ranged from 969.1 million in 1971 to 1.990.6 mil
lion in 1974. Estimated total numbers of fish exceeded :1.000million in 1976 and remained above this level through 1984. Our
estimate of 3,984.0 million fish landed in 1981 was the greatest
since 1959.
Although estimated numbers of fish in the landings during 1976
84 approached, and even surpassed in some years. the estimates of
the 1950s, the age composition of the landings during the late
1970s and early 1980s changed considerably (Table 4). The fishery
has always relieu heavily on prespawning fish (age 2 and younger)
(Table 4). Prior to the population decline in the early 1960s, the
annual percentage of prespawners in the total landings averaged
83% between 1955-62 (range: 51-96%). Over the period 1975-84
greater numbers of prespawners were taken and their annual percentage in the total landings was 94% (range: 87-98'7c). Notewor-
Table 4Estimated numbers (106) of Atlantic menhaden by age caught by purse seine vessels, 1955-84.
Age (yr)
Year 0 4 6 8·10 Total
1955 761.01 67415 1.057.68 267.31 30721 38.07 1053 184 0.64 3.118.44
1956 3637 2.07326 902.72 319.60 44.78 15068 28.70 n.72 1.99 3.56482
1957 29958 1.599.98 1.361.77 96.73 70.80 4052 3693 426 1.10 3.511.671958 10606 858.16 1.63535 7205 1725 15.94 909 4.88 043 2.71921
1959 1140 4.038.72 851.29 388.27 3341 11.87 12.3n 4.55 1.77 5.35364
19f1O 7217 281.01 2.20863 76.37 10220 23 77 7.95 2.36 065 2.775.11
1961 025 83242 50360 1.209.57 1918 29.38 2.86 .81 0.24 2.59831
1962 51.58 51411 834.52 217.25 423.37 30.75 24.60 298 0.70 2.09986
1963 96.89 724.23 70920 122.53 44.97 5238 1042 333 056 1.764511964* 30259 703.95 60498 8350 1794 7.85 6.62 1.31 032 1.729.06
1965 249.12 74521 42140 7776 12 17 1.81 1.22 075 006 1.50948
1966 34945 55082 404.14 3170 389 036 0.11 0.11 0.04 1.340.611967 6.95 63320 26567 7277 509 0.49 O.UI 984181968 15426 37736 53895 65.69 10.67 098 0.06 1.147.981969** 15813 37233 284.31 47.81 544 0.15 0.01 868.18
1970 2142 87085 473.92 3263 402 011 1.402.961971 72.85 26329 52432 8829 1784 2.51 9691U
1972 50 16 981.27 48847 173.06 1912 186 1.713.951973 55.% 58847 1.15294 3863 700 034 1.843361974 31555 636.68 98597 4859 249 1.35 1.990.63
1975 29864 719.96 1.086.53 50.24 663 020 0.10 2.162.30197n 274.23 1.611.96 1.341.09 47.97 7.95 0.28 3.283.471977 484.62 1.004.54 2.081.77 83.46 17.80 141 0.11 3.67371
1978 457.41 66409 1.670.91 258.12 31.19 348 3.U852U1979 1.492.46 623.14 1.603.29 127. 93 21.76 1.47 0.U9 3.87U13
1980 8829 1.47806 1458.23 222. 71 6923 1436 1.44 3.332321981 1.18757 69866 1.811.46 22220 4747 1537 1.27 3.984.U21982 114.11 91944 1739.55 37967 1633 5.78 0.53 0.32 3.175721983 96441 517.22 2.293.06 114.35 47.37 5.01 023 046 3.942.111984 1.294.22 1.024.17 892.09 271.50 50.34 15.21 051 3.548.04
* 1955-64 dala from Nicholson ( 1975).
** 1965-69 data from database used by Ahrenholz el al. ( 1987).
5

thy were the large numbers elf age-O menhaden (i.e., "peanuts")caught during 1974, 1979, 199 I, 19~3, dnd 1984, most of which
were taken during the North Carolina fall fi~hery.
Total number of vessels in tht: fishery fell from 150 vessels in
1955 to 51 vessels in the early 197t)s (Table 5). Vessel numbers
in.::reased slightly during the mid-I Y70s to 04, then declined further
to 38 vessels in 1984.Since the mid-1950s to early I%Os when nominal ~ffmt ex·
pended by the tleet averaged over 2,000 vessel weeks per year, the
general trend in nominal effort has been one pf dec'line (Table 6).
On the other hand, effective effort 1 has probably increased. as
modem vessels are much more efficient than their earlier counter
parts, owing in part to faster steel-hull vessels with grea'er refrig
erated hold capacities amI better coordination among vessels and
spotter aircraft. This has allowed for increased time spent fishing
'In the Atlantic menhaden fishery. observed or nominal fishing effort cannOI bedirlelly adjusted to units of effeelive effort (effort thai is a more reliable measure offisillng m,'rtalityI for reasons oUllined by Nicholson (197Ia) and Schaaf and HunlSIllan (19721.
Table 5!'lumbers of purse seine vessels that landed Atlantic menhaden durin~ the
tishing season by area of vessel ori~il1, 1955-84.
Given these improvements, the fishing power (If the modem fleei
has probably mlll,' than doubled (Ahrenholl et al. 19~7).
Catch-per-unit-etfort trends in Chesapeake Bay and areas northshowed general declines through the 1960s, with improvementthrough tht: 11I7()s and early 19S0s (Table 7). South ofChesapea~,c
Bay dramatIc decline, in CPUE were not apparent dunng the
1960s, and CPUE tended to increase during the 1970s and early
IYSOs.
Landings, Age Composition. Effort,and CPUE by Area _
North Atlantic
For rhe penod 1955-6:: annual landings in the North Atlantic area
averaged 11% 01 the total annual landings for the entire fishery(Table 3). Landing, declined through the 1960s and as the popula
tion recovered in the IY70s the North Atlantic area again con
tributed significantly to the total landings. Between 1972 and
1981" anllual North Atlantic landtngs averaged about 8% of the
total I ishery.
The purse seine fishery for Atlantic menhaden in the North
Atlantic area is Cllmprised almot exclusively of age-2 fish and
older, with ages 2 and 3 predominating (Table 8). During the
Fishing
season Total I
North
Atlantic:!
VlIddk Chesapc.Jkc
A!lantil" Bay'South
Atlantic·
NC
fall
I ishcr~
~North Atlanli( C1Tl'a ldth..1.ings ~·UI !982-84 are cumbincd with other areas to pro{~CI
landings conFidentialily.
Table 6Atlantic menhaden nominal fishing elTort (vessel weeks) by area of vessel
origin, 1955·84.
*1955-71 data d" aot agree with Nicholson (I Y75) because he adjusted (re
duced) efFort in the North Atlantic area. and to some exlent areas farther
south. to compensate for the small Sill' of vessels that frequently fished in
those areas. Present values are unadjusted estimates 0f nominal fishing efFort
1955 526 1,018 454 488 262 2.74~
1956 564 979 487 563 2~5 2.878
1957 431 1,094 552 469 229 2.775
1958 268 821 578 397 279 2.343
1959 413 980 685 518 251 2.847
1960 321 906 416 286 168 2.097
1961 292 1.018 482 396 "3 2.371
1962 322 1.035 581 310 103 2.351
1963 265 874 676 276 240 2.3311964 143 381 806 292 185 1.807
1965 96 302 838 361 20~ 1.805
1966 41 89 809 269 178 1.3861967 0 126 781 241 168 1.3161968 28 122 636 255 168 1.2091969 39 116 523 173 144 9q5
1970 30 62 536 177 101 900
1971* ~7 79 512 180 39 ~,)7
1972 89 101 564 199 20 973
1973 138 116 629 203 13 ! .099
1974 152 127 589 238 39 1.145
1975 146 95 616 287 74 1.21~
1976 142 123 570 254 74 1.163
1977 117 131 663 216 112 1.139
1978 110 90 614 274 122 1.21t)
1979 98 95 589 274 142 1.198
1980 67 128 636 231 Y6 1.15R
1981 83 137 545 239 129 1.133
1982 135 0 535 207 71 94,
1983 103 0 600 147 145 995
1984 100 0 570 96 126 R92
1955 150 39 ~8 20 34 'Ii
1956 149 40 47 24 10 63
1957 144 33 46 ~5 11 lJ4
1958 130 23 t.4 ~R 26 63
1959 144 34 4., 3 ; ~5 59
1960 115 19 ~~..; ~2 20 ~7
1961 117 21 47 2:' 20 44
1962 112 20 47 24 15 49
1963 112 10 46 36 16 4'>
1964 III 9 17 3!i 11\ 51
1965 84 6 I' 38 i ~I 40.
1966 76 5 10 36 16 43
1967 64 0 4 32 16 46
1%8 59 4 25 16 45
19b9 51 4 22 16 36
1970 54 4 I 18 II 37
1971 5 I 20 II 32
1972 51 ~ 4 19 II 5
1973 58 If) 6 23 II 4
1974 63 ,2 6 22 12 12
1975 61 9 5 22 14 17
1976 62 I: 4 21 12 13
1977 64 j 7 5 24 II) 16
1978 53 13 5 22 II 18
1979 54 II 4 22 13 18
1980' 51 5 6 24 12 19
1981 57 , 7 23 13 19
1982 47 9 0 22 8 18
1983 41 7 0 24 10 17
1984 38 6 0 26 6 12
I Includes all vessel> thai landed fish during thc year. Within a year. the sum
of vt: ....~e:s across all areas doe~ not equal the total because numerous vessels
that participated in the summer fi,hery in Chesapeake Bay also fished from the
port of Beaulort .. C. during the North Carolina fall fishery.
:Ve"els fishing from New England ports in recent years are mostly trawlers
that convert 10 purse seiners in summer. Some Fish regularly and others fish
sp0radicall,
llne/udes vessels that Fished only in Ihe summer fishery. Does not include
vessels added in OClober or November.
41ncludcs only vessels that landed regularly in the summer fishery.
'1955-dO data from ASMFC (1981).
North
Year Atlantic
Middle
Atlantic
Chesapeake
Bay
South
Allantic
NC fall
fishery Coaslwide
-_.._-_._--------------------"
I Table 7Calch-per-unit·eITort data (melric tons/vessel week) for Ihe Atlantic men-
haden purse seine fishery, 1955-84.
orth Middle Chesapc"kc South NC fall
Atlantic AII"nlic Bay Atlantic fishcry
1~55 158 .112 292 8~ 246
1~56 175 .186 1~.1 122 259
1~57 1~4 278 228 78 227
1~58 114 257 262 104 252
145~ 160 256 287 122 328
1%0 207 28.1 261 128 .170
1%1 201 270 267 III 382
1%2 201 241 267 1311 250
196.1 1l.1 128 154 124 258
1%4 105 n 166 159 208
1965 124 152 150 102 254
1966 44 67 14.1 91 403
1967 0 1.16 117 141 305
1%8 239 215 182 1.12 .114
1969 74 108 1.18 190 287
1~70 14.1 184 .141 240 181
i971 120 291 .1.1.1 21.1 203
1~72 16.1 541 4.15 2.11 270
I ~7.1 217 .172 18.1 185
1974 2.16 272 1~.1 40.1
1975 158 21 I 207 241
1976 200 .151 200 245
1~77 128 .107 2.11 288
1978 285 .104 220 .113
1979 .100 .1.17 225 380
1480 443 .170 230 37.1
1~8 I 26.1 317 .131 500
1482 4.17 284 430
198.1 454 213 472
1484 356 198 545
'CPUE dala from Iwo "reus combined 10 prOiecl confidential landings.
1960s estimated numbers of fish caught fell from 130.7 million in1962 to zero effort and no landings in 1967". Thruugh the early1970s increasing numbers of age-2 and ·3 fish were captured andby 1980 and 1981 age-4 and -5 fish also made significant contributions to the North Atlantic catch. By the late 1970s annual estimates of total numbers of menhaden caught in the North Atlantic
area approached pre-1963 levels.The numbcr of active purse seine vessels in the North Atlantic
area increaseJ through the 1970s to 13 by 1978. but pre-1963levels of participation in the fishery were not attained (Table 5).The numbers of vessels declined in the 1980s and in 1984 only sixvessels fished out of two ports (Gloucester and Rockland). Effortin the North Atlantic area increased during thc 1970s to 152 vesselweeks in 1974, but then fluctuated between 67 vessel weeks in1<.)80 to 146 vessel weeks in 1975 (Table 6). During the mid-1970sCPUE levels in the North Atlantic area ranged from 128 mt/vesselweek in 1977 to 236 mt/vessel week in 1974 (Table 7). CPUE
gradually increaseJ through the latc 1970s and reached 443 mt/vessel week in 1980. CPUE levels greater than 250 mt/vessel weekwere maintained through 19846
'Although no menhaden were landed for reduction "I North Allantic ports in 1967. anestlmaled .1.3 million fish were caught in Ihe North Atlanlie "rea (T"ble 8). but were
I"nded in eilher Ihe Middle Allantie or Chesapeake Bay "reus.hCPUE v"llies for Middle AII"nlie "nd Chesape"ke B"y "reus for 1972-81 have beencombined 10 proleel landings confidentiality. Likewise. CPUE values for the NorthAII"nlic "nd Chesape"ke Bay areas for 1982-84 have also been combined.
7
Middle Atlantic and Chesapeake Bay
Between 1973 and 1981 only one plant operated in the MiddleAtlantic area and only two plants operated in Chesapeake Bay;therefore, a discussion of Atlantic menhaden landings from these
areas, 1973-81, requires that actual landings information be combined to protect confidential data. Furthermore, after 1981 thefacility in New Jersey closed. hence the Chesapeake Bay area
landings for 1982-84 were necessarily combined with North At
lantic area landings, again for reasons of confidentiality.
Prior to 1962, annual landings of Atlantic menhaden in the
Middle Atlantic area surpassed those of the Chesapeake Bay area,often more than twofold (1955-57, 1960, 1961) (Table 3). Between 1955 and 1962 annual Middle Atlantic area landings aver
aged 67% of the total from both areas combined. Landings for bothareas declined sharply in the 1960s, low values being 6,000 mt forthe Middle Atlantic area in 1966 and 72,000 mt for the ChesapeakeBay area in 1969. By 1972 several plants in New Jersey andDelaware closed and only the plant at P0I1 Monmouth remained .Between 1972 and 1981 landings shifted dramatically in favor ofChesapeake Bay plants, with annual landings for the area oftenexceeding the Middle Atlantic area landings fourfold (1975, 197780). Between 1972 and 1981, annual landings from both areascombined averaged 68% of the total landings for the entire Atlanticmenhaden fishery. During 1982-84 landings from the combinedNorth Atlantic and Chesapeake Bay areas averaged 75% of thetotal landings for the entire fishery (Table 3) .
Estimated numbers of fish caught in the Middle Atlantic areaincreased through the early 1970s and reached almost 400 millionin 1976, although never approaching the record levels of over1,000 million caught prior to 1961 (Table 9). Estimated numbersdeclined to 52.1 million by 1978 and remained below the 100million level through 1982. After the closure of the plant at Port
Monmouth, vessels from Chesapeake Bay began more frequentexploitation of waters in the Middle Atlantic and North Atlanticareas. By 1983 plants in Virginia processed an estimated 300.2
million fish harvested in Middle Atlantic waters. During the 1970sand early 1980s, age-2 fish predominated in catches from theMiddle Atlantic area, with relatively large numbers of age-I fishtaken in 1972, 1976, and 1978 and age-3 fish in 1972, 1977, and1984
As processing facilities in New Jersey and Delaware closed inthe 1960s, the number of active vessels fell sharply (Table 5).
Before 1964 over 40 vessels landed Atlantic menhaden in theMiddle Atlantic area, but by 1973 only 6 vessels were active, allbased at the Port Monmouth plant. Between 1972 and 1981 nominal effort at the Port Monmouth plant averaged 114 vessel weeks,or 12% of the average annual effort expended in the Middle Atlantic area between 1955 and 1962 (Table 6).
Estimated total numbers of fish caught in the Chesapeake Bayarea declined through the 1960s to a low of 254 million in 1969(Table 10). Estimated numbers fluctuated thereafter, but generallytended to increase toward and beyond the 1,000 million level. In1980 an estimated 2,015.8 million fish were harvested in theChesapeake Bay area, the greatest number since 1959. The catchof 1982 also surpassed 2,000 million fish. As Chesapeake Bay arealandings increased during the 1970s, age composition of the catchshifted towards a greater percentage of age-2 fish. Between 1955
and 1971 estimated numbers of age-I fish uutnumbereJ age-2 fishin 9 out of 17 years (Table 10). Between 1972 and 1984 estimatednumbers of age-2 fish predominated over age-I fish in 10 of 13
years; in 1983 age-2 fish comprised 83% of the total estimated

Table 8Estimated number< (106) of Atlantic menhaden by age caught by purse seine vessels in the North
Atlantic area. t95;;-84.
Age (yr)
Year 0 4 6 8-10 Towl
IY55 0.42 2174 114.62 21.94 7.94 093 038 167.97
IY56 11.7Y 69.51 15.8Y 8125 12.91 250 0.72 IY4.57IY57 2.01 83.87 3503 2Y 42 Ib.15 17.13 2.83 0.46 186.90IY58 o 1.1 44.18 205\} 7.08 5.76 436 200 001} 84.191451} 8.17 .17.13 Y597 105Y 4.06 4.27 2.08 090 16.1.37
1Y60 8864 .14.87 40.53 652 2.39 060 011 173661%1 5.11 10715 (,.76 12.27 1.35 OA'l 0.14 133271%2 .1.04 29.25 77.72 Y88 8.94 125 062 13070IY63 1.34 1058 14.48 23.54 594 1.64 (130 57821%4* 1.Y2 586 4 12 5.17 4.5Y O'lY o 17 2282
1Y65 0.82 4.1.\ 235 lAY 1.11 0.57 0.06 10.541Y66 0.11 133 I 15 0.16 0.11 o II 0.04 3.00
1Y67 078 1.85 066 004 3331%8 1.65 5.b3 2.lb 027 002 Y.731116lJ** 0.49 4.04 2.'l5 0.13 820
1470 15.00 1.04 16.04IY71 4.97 32.31 11.62 1.44 50.341472 2.76 2Y 78 5 17 086 38571Y7.\ 10826 11.62 0.77 0.34 120.YY1974 88.29 42.07 2.45 135 134.15
IY75 7Y.b6 .\.112 464 0.20 o 10 11772
1976 OOY 127.16 2638 620 028 160.11IY77 609 1.1A2 1058 137 007 51.531478 3280 8781 ~2. 74 2.92 146.26
IY7Y 138 9805 562Y Ib.77 1.47 009 174.06
IY80 723 Y4.10 51.51 1150 0.92 16627
Inl 2Y90 6214 44.44 15.00 1.27 152.76
IY82 28.94 84.42 12.5 I 4.8Y 0.46 032 131.55198.\ 12128 46Y4 1783 219 0.23 19046
IY84 8.74 83.17 18.70 5.48 0.14 11629
*1955-04 dala from Nicholson (IY75).
** IY65-6Y dala from dalabase uscd by Ahrenholl CI 01 ( 1987)
number of fish caughl in the Chesapeake Bay area. Relatively largenumbers of age-O fish were taken in the Chesapeake Bay areaduring 19t<1. 1983. and 1984. and also large numbers ofage-3 fishwere caught 1978-84 compared wilh 1'173-77.
The numher of vessels fishing from plants in Chesapeake Bayremained fairly stable during 1972-84. ranging from 19 to 26(Table 5). During the same period nominal effort declined from therecord high leveb of the mid-1960s (838 vessel weeks in 1965) andstabilized near the 600 vessel-week level (Table 6).
Combined CPUE values for the Middle Atlantic and Che.,apeakeBayareasO declined through the mid-I 970s to 211 mt!vessel wel:kin 1975 (Table 7). From 1976 through 1981 CPUE values rcmained above the 300 mt/vessel week level. In 1983 ccmbincdCPUE for the North Atlantic and Chesapeake Bay areas peaked at454 mt/vessel week.
South Atlantic
Landings in the South Atlantic area remained fairly stable duringthe 1960s. despite the large tluctuations in other fishing areas~Landings gradually increased through the late 1970s (Tabl~ 3). By19t< 1 South Atlantic landings totaled 79.100 mt, a record for thisarea for the period 1955-84. The plant at Southport. NC. annuallyaccounted for a majority of the landings in the South Atlantic area.and closure of this plant after the 1983 fishing season is retlectedin the 1984 landings for the area of only 19.000 mt.
Historically. catches from the South Atlantic area have consistedprimarily of age-I and -2 menhaden. For the period 1972-84 theseage classes annually comprised between 62Clr and almost 100ck ofthe total catch from the area (Table I I). In 1981. 1983. and 1984.significant numbers of age-O fish were caught. In 198\ over 42million age-O fish were captured. primarity during October inNorth Carolina estuarine waters. During I'1t<3 and 1984 most of theage-O fish harvested in the South Atlantic area were caught byvessels from Virginia off the North Carolina coast but were processed in Reedville. Similarly. in 1982-84 some older fish (ages 4
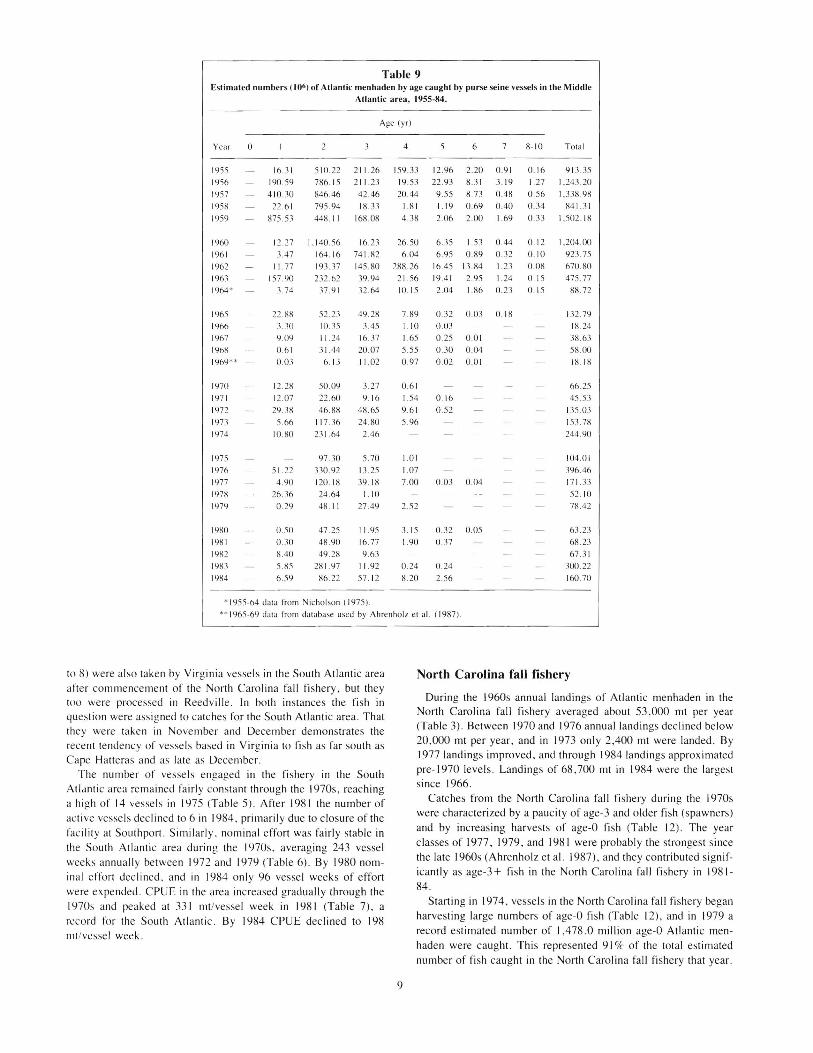
Table 9Estimated numbers (106) or Atlantic menhaden by age caught by purse seine vessels in the Middle
Atlantic area, 1955-84.
Age (yr)
Year 0 2 4 6 7 8-10 Total
1955 16.31 510.22 211.26 159.33 1296 220 091 0.16 913.35
1956 190.59 786.15 211.23 19.53 22.93 831 3.19 1.27 1.243.201957 41030 84646 4246 2044 9.55 8.73 048 056 1.338.981958 22.61 795.94 18J3 181 1.19 069 040 034 841.31
1959 87553 448.11 168.08 438 2.06 2.00 1.69 033 1.502.18
1960 1227 1.140.56 1623 265U 635 J.53 044 o 12 1.204.00
1961 3.47 164.16 741.82 6.04 6.95 089 032 0.10 92375
1962 11.77 193.:17 14580 28826 1645 13.84 1.23 008 67U801963 15790 232.62 39.94 21.56 1941 2.95 1.24 o 15 475771964* 374 3791 32.64 10 15 2.04 1.86 023 o 15 8872
1965 2288 52.2] 49.28 789 032 003 o 18 132791960 330 10.35 345 I 10 003 18241967 9.U9 11.24 1637 165 025 001 38631908 0.61 31.44 20.07 555 030 0.04 58001969** 003 6.13 1102 0.97 0.02 001 1818
1970 1228 5009 3.27 0.61 66251971 12.07 22.60 916 1.54 0.16 45.531972 2938 4688 48.65 961 0.52 135.03
1973 566 11736 24.80 5.96 153781974 1080 231.64 2.46 244.90
1975 9730 5.70 1.01 104UI
1976 51.22 33092 13.25 1.07 396461977 4.90 120.18 3918 700 0.03 0.04 171.331978 2636 2464 1.10 52.10
1979 0.29 48 I I 2749 252 7842
198U U50 4725 11.95 3.15 032 005 63.231981 030 4890 1677 1.90 0.37 68231982 8.40 4928 9.63 67.31
1983 585 281.97 11.92 0.24 024 300221984 659 86.22 57.12 820 256 160.70
* 1955-04 data from I jchulsun (1975).
** 1965-69 data from database uscd by Ahrenholz et al. (1987).
to 8) were also taken by Virginia vessels in the South Atlantic areaafter commencement of the North Carolina fall fishery, but they1l)0 were processed in Reedville. In both instances the fish inquestion were assigned to catches for the South Atlantic area. Thatthey were taken in November and December demonstrates therecent tendency of vessels based in Virginia to fish as far south asCape Hatteras and as late as December.
The number of vessels engaged in the fishery in the SouthAtl&ntic area remained fairly constant through the 1970s, reachinga high of 14 vessels in IY75 (Table 5). After 1981 the number ofactive vessels declined to 6 in 1984. primarily due to closure of thefacility at Southport. Similarly. nominal effort was fairly stable inthe South Atlantic area during the IY70s, averaging 243 vesselweeks annually between 1972 and 1979 (Table 6). By 1980 nominal effort declined, and in 1984 only 96 vessel weeks of effortwere expended. CPUE in the area increased gradually through the1970s and peaked at 331 mt/vessel week in 1981 (Table 7), an:cord for the South Atlantic. By 1984 CPUE declined to 198mt/vcssel week.
9
North Carolina fall fishery
During the 1960s annual landings of Atlantic menhaden in theNorth Carolina fall fishery averaged about 53,000 mt per year(Table 3). Between 1970 and 1976 annual landings declined below20,000 mt per year, and in 1973 only 2,400 mt were landed. By1977 landings improved, and through 1984 landings approximatedpre-I970 levels. Landings of 68,700 mt in 1984 were the laroestsince 1966. b
Catches from the North Carolina fall fishery during the 1970swere characterized by a paucity of age-3 and older fish (spawners)and by increasing harvests of age-O fish (Table 12). The yearclasses of 1977, 1979, and 1981 were probably the strongest sincethe late 1960s (Ahrenholz et at. 1987), and they contributed significantly as age-3 + fish in the North Carolina fall fishery in 198184.
Starting in 1974, vessels in the North Carolina fall fishery beganharvesting large numbers of age-O fish (Table 12), and in 1979 arecord estimated number of 1,478.0 million age-O Atlantic menhaden were caught. This represented 91 C;c of the total estimatednumber of fish caught in the North Carolina fall fishery that year.

Table 10Estimated numbers (06 ) of Atlantic menhaden by age caught by purse seine vessels in the
Chesapeake Ba) area, 1955-84.
Age Iyrl
Ye"r 0 4 0 8-10 Tot"1
1955 12.18 33424 38292 1152 5.17 043 746.-\61956 67437 06.90 049 741.761957 1.92 1.05735 176.58 3 '0 022 0.08 1.239 371958 048 49088 561.70 5.25 090 039 1.059f>f>1959 10.71 2.12456 281 10 1957 243594
1960 14258 66694 2.M 812.161961 32780 214.20 2043~ 032 I) If> 746.821962 42.-\0 20408 370.64 32.78 35.29 027 685461963 51.54 31864 192.83 4543 075 609191964;' 227 28 17058 314.05 27.90 O.M 74045
1965 68.18 485.23 10450 1352 032 0.08 f> 71 821966 214.14 22072 21035 1065 0.65 o 17 650f>91907 662 21 181 14374 18.-\2 0.27 380861968 4144 1~841 23233 2581 038 009 4484719f>W* 4639 6540 12532 15-,87 097 253.95
1970 2.74 500.14 22602 21.51 1.07 007 751.561971 40.03 90 16 290.58 45.53 4.27 0.87 471.441972 o 17 598.71 27~.29 92u7 4.34 048 970651973 18.77 426112 714.71 2.12 028 1.101.901974 16.67 42600 40611 ~ Q:, 851.79
1975 4401 32169 549.49 566 020 921.051970 14.43 881.59 678.0f> 2.40 0.52 1.577.001977 430 51885 1.42231 450 1l.09 1.950.111978 0.12 337.24 1.08006 36.71 1.454 121979 5.15 453.21l 921.80 2238 1.41l2 52
1980 7.79 83839 1.09217 74.20 3.33 2.015.881981 7095 261.76 1.027.91 3095 I 01 1.392581982 808 518.87 1.31873 16661 2.012281983 167.24 140.35 1.511.17 IIU5 043 1.830041984 18694 45087 693.16 8807 1.41904
* 1955-64 data from Nicholson (1975).
** 1965-69 data from d"tabase used by Ahrenhol7. et al. ( 1987).
Over 1,000 million age-O fish were taken again in 1981 and numbers harvested in 1984 approximated this level.
During the late 1960s poor prospects of fish abundance in theNorth Carolina fall fishery contributed te a decline in the numbercf active vessels in the fishery (Nicholson 1975). The number ofvessels dropped sharply to only 5 in 1'172 and 4 in 1'173 (Table 5).As catches improved during the late 1970s, the number of vesselsincreased to as many as 19 in 1980 and 1981, but then fell to 12by 1984. Nominal effort increased from 1972 to 1984, approachingthe ISO-vessel-week level twice (1979 and 19~3) (Table 6), and
generally fluctuated about the 100-vessel-week level during theremainder of the period. CPUE increased throughout the late 1970sand early 1980s and exceeded levels observed during the early1960s (Table 7); in 1984 a record high for the North Carolina fallfishery of 545 mt/ves~el week was recorded.
10
Length and Weight Statistics _
Simple mean lengths and weights for Atlantic menhaden sampledfrom 1972 to 1984 are presented by area caught, quarter, and age(Appendix Tables 2-13). Nicholson (1975) reported that the meanlength of age 0-4 fish sampled at various ports increased throughthe mid- to late 1960s. He concluded that these changes weresignificant and indicated increased growth rates over the period.
During the 1970s and early 1980s a reversal of this trend wasobserved. In all areas for 1972-84, the mean length of age 1-4 fishtended to decline. This trend is most apparent when coastwideannual mean lengths and weights at age are summarized (AppendixTables 7 and 13); the mean length of age 1-4 Atlantic menhadendeclined about 30-60 mm over the period. Because fish weightvaries as a power of length, the decline in mean weight over thesame period is even more striking and holds important ramifications regarding stock biomass and yield from the fishery (Vaughanand Smith 1986a). The mean weights of Atlantic menhaden age1-4 in 1972 were 128,330,547, and 631 g, respectively, but in
1984 mean weights for respective age groups were 78, 149, 28~,
and 405 g (Appendix Table 13).

Table 11Estimated numbers (106) of Atlantic menhaden by age caught by purse seine vessels in the South
Atlantic area, 1955-84.
Age ryr)
Yc"r 0 3 4 6 8-10 ,,,wi
1955 () 51 292.~4 113.04 1347 11.38 437 24
1Q 50 1.147.8~ 10.91 n.89 1.159.~R
1957 1\.21 117.91 231.56 042 3~316
1958 1.47 31520 13539 ~.25 026 460.57
1959 1.203.39 4~96 0.X4 i.07319
1900 1.\.86 111.84 273. 73 39943
1%1 490.44 74.% 5436 030 620.06
1962 2.21 29755 250.30 181 551.~7
19(,3 17~.22 220.55 0.33 39910
1964* 166 51022 18455 69643
1965 377 200.64 194.08 033 005 3%.R61'166 254.RO 67.29 050 322591907 033 329 15 63.81 0.1I3 393.31
1468 037 212.14 204.96 0.52 41~.19
191>9** 1I.05 258 12 113.58 032 372.06
1970 336.96 16448 50144
1971 128 14583 195.62 003 34275
1972 33444 16086 o 17 49547
1973 148.18 212.50 007 360691974 151 28 24365 082 395.74
1975 311.62 335.17 4.15 079 651.721976 785 59879 18582 79247
1977 337.97 48429 1.89 824 14
1978 162.61 489.21 9682 042 749061979 9.25 87.19 477.36 13.09 586.90
1nO 036 376.81 27907 26.04 0.29 682.57
1981 42.03 190.57 54789 99.07 U.12 87969
1982 433 25885 286.95 10418 076 0.07 655.15
1983 96.74 165.09 27443 19.87 1143 1.74 046 56976
1984 137.69 156.02 ~3.83 10.05 38759
* 1955-64 data from Nicholson (1975).
** 1965-69 dara from database used by Ahrenholz et al. (1987).
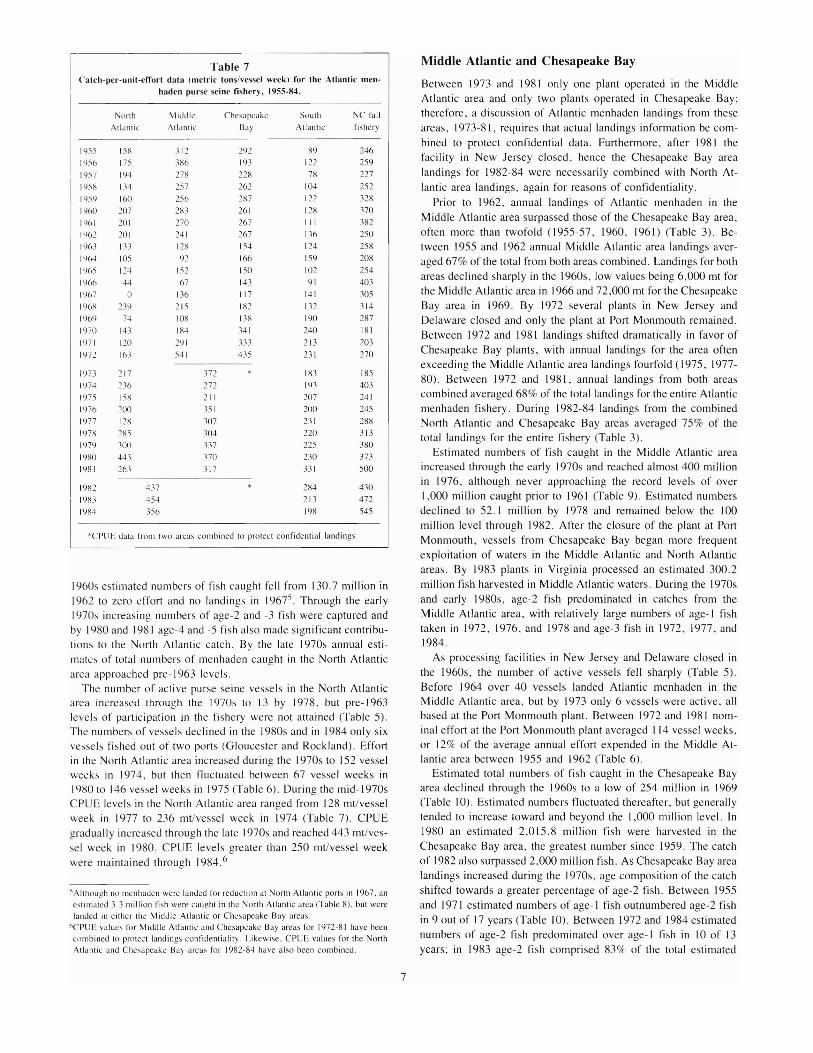
An explanation for this phenomenon may be threefuld (ASMFCIn I: Ahrenholz et al. I(87), but it is unknown whether theseinterpretations are independent of, or confound, one another. First,Atlantic menhaden are protracted spawners and prevailing environmental factors may favor success of the later (late winter or spring)spawn. rather than the earlier (fall or winter) spawn. Thus, thelater-spawned young-of-the-year would have a shorter first growing season and presumably would enter the fishery as age-I and -2fish at a smaller size than would fall or early winter spawned fish.Second. since 1970 the center of fishing activity has shifted southward frum the North Atlantic and the Middle Atlantic areas to theChe!--apeake Bay and the South Atlantic areas. Since Atlantic menhaden stratify along the East Cua!--t of the U.S. by size and ageduring summer, with larger individuals of a given age elass occurring in more northern latitudes (Nicholson 1971 b), the fishery hasconcentrated fishing in locations of smaller individuals of a givenage class. Third, Atlantic menhaden exhibit density-dependentgrowth. The relatively strong year classes of 1975, 1979, 1981,and 1983 proJuceJ smaller-than-average-sized fish at a given age.Figures 2 anJ 3 show this size differential of sampled fish at agefor the 1967 and 1983 fishing seasons. These length frequency
II
distributions portray not only size differences at age between years,but also geographical size differences at age within years.
Summary _
The purse seine fishery for Atlantic menhaden declined throughthe 1960s when fish became scarce in the northern half of theirrange due to poor recruitment and truncation of the stuck's agestructure. During the mid- to late IY70s recruitment improved andthe age structure broadened. As fish again became available inNew England waters, up to four reduction plants processed Atlantic menhaden in the North Atlantic fishing area during themid-1970s. However, by the late 1970s and early 1980s localfactory-odor abatement problems forced several of these plants toclose. [n the Middle Atlantic area only one plant processed fishthrough the 1970s, but it closed after 1981. [n the Chesapeake Bayarea the number of active plants and the size of the fleet remainedfairly stable through the early 1980s. Beginning in 1983 theChesapeake Bay fleet increased its efforts in the Middle Atlanticand North Atlantic areas and abo along the North Carolina coast

Table 12Estimated numbers (106 ) of Atlantic menhaden by age caught by purse seine vessels during the
North Carolina fall fishery. 1955-H4.
Age Iyr)
Yc-Jr 0 4 0 8-10 Total
1955 74232 .1076 51J8 7.32 1671 274 0.39 o 10 851.421'156 36.37 6042 26.~7 3748 930 46.50 748 1.03 225611957 284.39 1241 23.30 1560 20n 1474 11.07 095 008 383261958 104.11 29.34 98.0)8 1963 7.20 860 404 248 273481959 0.69 6.87 35.'019 103.81 1844 5.75 609 0.78 0.54 17896
1960 5831 14.32 3876 2263 35.17 10.90 4.03 1.32 042 185861961 025 10.71 45.17 10190 576 1000 062 174411%2 6.97 0.71 17.17 761 22.10 415 1.82 050 61.031963 45.35 6947 61.86 2625 8.18 943 153 045 011 222631904* 7.165 1941 66.55 17.10 303 0.04 017 009 180M
1965 17716 3646 69.77 1050 ! .57 295461966 13531 n.oo 11603 1570 098 340.091967 8316 4609 3609 2.51 020 168051968 11245 16.00 6858 13.66 2.59 032 21.1.591969** 111.69 48.78 38.80 15.96 0.55 215.79
1970 1868 2147 1834 0.81 234 004 67671971 31.55 15.22 10.55 1.26 041 0.04 59031972 5000 18.75 3.08 IKO 74.221973 37.21 8.68 0.10 002 46011974 29888 48.55 16.28 029 005 30403
1975 25463 8666 24.91 1.60 367801976 251.94 8027 1913 5.94 016 357441977 480.33 14283 48.90 441 o 13 676591978 457.30 16424 4249 12.14 093 0.55 683.661979 1.478.07 81.07 57.96 867 247 1.62823
1980 80 14 262.36 32.51 1042 9.94 254 047 404.371981 1.074.60 246.04 15687 1326 1.490 761982 10170 13.1.32 5565 1482 305 0.89 309441981 70044 20593 102.21 2478 17.43 084 1.051.631984 96959 410.69 20.13 3310 2337 7.17 0.17 1.464.41
*1955-64 data from Nicholson 11975).** 1965-69 data from dalabase used by Ahrenhol7 el al ( 1987).
during late fall and early winter. In the South Atlantic area. thenumber of active plants remained relatively unchanged through theearly 1980s. although a major facility closed after 1983: consequently. fleet size and landings also declined. Participation in the
North Carolina fall fishery increased through the 1970s and early1980s as the prospects for greater catches improved.
As the Atlantic menhaden stock has rebuilt. landings increased
trom 161,600 mt in 1969 to 418.600 mt in 1983; coastwide esti-
12
mates of numbers of fish landed increased from 969.1 million in197\ to almost 4.000 million in 1981. Through the 19705 and early
1980s greater numbers of age-O menhaden were harvested duringthe North Carolina fall fishery. In turn. age-O fish made increasingly greater contributions to annual coastwide estimates of numbers of Atlantic menhaden landed. Also as the stock has rebuilt, the
mean length of sampled fish ages 1-4 declined 30-60 mm. while
the mean weight of the same age classes declined 50-250 g.

North AtlanticArea 30
20
30
> ~ Age 4 n=43() 20Z 10 16 Age 3 n~125w 30 10:::J Age 2 n=470 20W 6 10 16 20 26 30 36
a: 10 Age 1u. Age 0#. 6 10 16 20 26 30 36
Middle AtlanticArea 20
> 30 10
() 20~ Age 4 n= 108
Z 6 10 16 36n=952w 10
Age 3:::J 30
0 20Age 2 n=406
w 6 10 16 36a: Age 1 n=85u. 10
#. Age 06 10 16 20 26 30 36
Chesapeake BayArea 20
> 30 10()
~ Age 4z 20W 6 10 16 36:::J 30 10 Age 3 n=3790w 20
Age 2 n= 2,294a: 6 10 36U.
10 Age 1 n~3,203
#. Age 010 16 20 26 30
South AtlanticArea
30 10>
~Age 4()Z 26 30 36W 30 Age 3:::J0 20 Age 2 n=990w 26 30 36a: 10 Age 1 n= 4,699u.#. Age 0
10 16 20 26 30 36
N.C. FallFishery 20
30 10
> 20 ~Age 4()Z 5 20 36W 30 10 Age 3 n:::293:::J Age 2 n=4050 20W 5 10 36a: 10 Age 1 n= 702u.#. Age 0
5 10 15 20 25 30 35
FORK LENGTH (cm)
Figure 2Length frequency distributions of Atlantic menhaden sampled from the purse seine fishery during 1967.
13

Figure 3Length frequency distributions of Atlantic menhaden sampled from the purse seine fishery during 1983.
14

Acknowledgments _
We wish to express our appreciation to menhaden plant owners andmanagers who provided records of vessel offloadings and alsoaccess for our port agents to sample Atlantic menhaden landings.We thank all past and present members of the Menhaden Programat the Beaufort Laboratory who contributed to the Atlantic menhaden database. We are especially indebted to Charles W. Krouse,Jr., for his cumputer programming talents. Dean W. Ahrenholz forhis helpful suggestions and encouragement during preparation ofthe manuscript. and Beverly W. Harvey who showed exceptionalpatience and skill in preparing our multitudinous tables. Sheryan P.Epperly. John V. Merriner, James R. Waters, and an anonymousreviewer for the Technical Repurt series made valuable commentson various drafts of the manuscript.
The authors wish to dedicate this report to the memory of RobertB. Chapoton. who served as a Branch Leader in the MenhadenProgram at the Beaufort Laboratory until his untimely death inMay 19~5. Bob's career with the National Marine Fisheries Service (formerly the Bureau of Commercial Fisheries) spanned almost three decades. During the latter half of his tenure Bob maintained Atlantic and gulf menhaden catch and effort data, annuallyformulated quantitative forecasts of menhaden landings, andserved as scientific liaison to the menhaden industry and the Atlantic and Gulf States Marine Fisheries Commissions. During thelate 11)70s and early 1980s. most of Bob's boundless energies weredirected toward developing state management options for Atlanticmenhaden. Boh' s contacts in the menhaden industry and fisheriesmanagement circles were also counted among his friends. His wit,steadfastness, and friendship will be missed by all who knew him.
15
Citations _
AHRENHOLZ. D. w.. w. R. NELSON, and S P EPPERLY
1987. Population and fishery characteristics of Atlantic menhaden. Brcl'(Wr1ia
(vrannus. Fi,h. Bull., U.S. X5:56~-6UO
ASMFC (ATLANTIC STATES MARiNE: FISHERIES COMMISSION).
1981. Fishery management plan fur Atlantic menhaden. Atl. States Mar.
Fish. Comm., Fish. Manage. Rep. 2. 134 p.CHESTER. A. J.
1984. Sampling stati>!ics in the Atlantic menhaden fishery. U.S. Dep. Com
mer.. NOAA Tech. Rep. NMFS 9, 16 p.
JUNE. F. C1961 Age and size compusition of the menhaden catch along the Atlantic coast
of the United States. 1~57. with a brief review of the commercial fish
ery. U.S Fish Wildl. Serv., Spec. Sci Rep Fish. 373. 39 p.
JUNE, F. C. and W R. NICHOLSON
1964. Age and size composition of the menhaden catch along the Atlantic coast
c,f the United States. 1958. with a brief review of the commercial fish
ery. U.S. Fish Wildl. Serv .. Spec. Sci. Rep. Fish. 446. 40 p.
JUNE. F. c.. and J. W REINTJES.
IY59. Age and size composition of the menhaden catch alung the Atlantic Cuast
of the United States, 1952-55, with a hrief review of the commercial fish
ery U.S. Fish Wildl. Serv .. Spec. Sci. Rep Fish 317,65 p.
I'JbO. Age and size composition of the menhaden catch along the Atlantic coast
of the United States. 1956: with a brief review of the commercial fish
ery. U.S Fish Wildl. Serv .. Spec. Sci. Rep Fish 336.38 p.
NICHOLSON. W. R.
1971 a Changes in catch and effort in the Atlantic menhaden purse-seine fi,h-
ery 1940-68. Fish. Bull., U.S. 69765-781
IY71 b. Coastal movements of Atlantic menhaden as inferred from changes in
age and length distributions. Trans. Am. Fish. Soc. 100:708-716.
1975. Age and size composition uf lhe Atlantic menhaden. Bre\'()Qrtia ryran-nus. purse seine catch. 1903-71. with a brief discussion of the fishery. U.S.
Dep. Commer.. NOAA Tcch. Rep. NMFS Spec. Sci. Rep. Fish. 684. 28 p.
NICHOLSON, W. R., and J. R. HIGHAM. Jr.
1964a. Age and si7e composition of the menhaden catch along the Atlantic
coast of the United States, 1959. with a brief review of the cummercial
fishery. U.S. Fish Wildl. Serv., Spec. Sci. Rep. Fish. 478. 34 p.
1964b. Age and size cumposition of the 1960 menhaden catch along the U.S.
Atlantic coast. wilh a brief review of the commcrical fishery. U.S. Fish
Wildl. Serv.. Spec. Sci Rep. Fish. 479, 41 P
1965. Age and size composition of the menhaden catch along the Atlantic coast
uf the United States. 1961. with a brief review of the cummercial fish
ery. US. Fish Wildl. Serv .. Spec. Sci. Rep. Fish. 495. 28 p
1966. Age and size composition of the menhaden catch along lhe Atlantic COqS!
of the United States. 1962. with a brief review of the commercial fish
ery. U.S. Fish Wildl Serv .. Spec. Sci. Rep Fish 527.24 p.
SCHAAF. W E.. and G R. HUNTSMAN.
1972. Effects of fishing on the Atlantic menhaden stock: 1955-1969. Trans.
Am. Fish. Soc. 101:290-297.
VAUGHAN. D S., and J. W. SMITH.
1986a. A siock as~essmen( of the Atlantic menhaden, Bre\'uortia fyraf1llll5,
fishery. Unpubl. manuscr.. Southeast Fish. Cent. Beaufort Lab .. Nat. Mar.
Fish. Serv .. NOAA. Beaufort. NC 28516-9722, 72 p.. IY86b. Management optIons for the Atlanlic menhaden. Bret'uortill tyramw.'i,
·fishery. Unpubl. manuscr.. Southeast Fish. Cent. Beaufort Lab., Nat. Mar.
Fish. Serv .. NOAA, -Beaufort, NC 28516-9722. 33 p.

Appendix Table 1Quarterly time increments used insubsequent appendices for Atlanticmenhaden.
Ending dale of
Quarter first week last week
>2/29 <6/01
>5/30 <8130
3 >8/29 <11/29
4 >11/28 <2129*
*February of next calendar year. butsame fishing season.
Appendix Table 2Mean fork length (mm) of Atlantic menhaden sampled from the North Atlantic area by quarter and age, 1972-84.
Quarter I ()uart~r 2 Quarter 3Age Iyr) Age Iyr) Age Iyr)
Year 4 4 6 3 4 6
1972 297 319 320 325197.1 252 303 338 275 311 326 3321974 253 294 .135 .124 263 .100 .114 3381975 244 246 282 .101 326 333 262 282 .1 131976 220 198 240 278 297 .110 252 288 .1011977 246 265 277 287 290 267 280 294 298 .1301978 211 221 240 217 240 286 295 238 258 292 3021979 207 267 191 230 262 276 295 241 264 282 .116 .11.11980 228 240 240 2.19 260 274 284 294 267 284 290 294 .1041981 202 229 2T!. 28.1 220 257 284 294 299 255 274 292 30.1 .1 171982 202 2.10 271 .114 217 238 270 297 302 .1 17 23.1 24.1 2831983 219 246 265 293 .100 241 262 27.1 2851984 2.16 251 271 282 291 252 268 28.1 288
Appendix Table 3Mean fork length (mm) of Atlantic menhaden sampled from the Middle Atlantic area by quarter and age. 1972-84.
Quarter I Quarter 2 Quarler 3Age Iyr) Age Iyrl Age tyrl
Year 4 4 6 4
1972 299 .111 307 22.1 249 .114 .121 337 223 277 .112 .12.1
197.1 238 304 .141 233 254 295 ,'.1 I1974 211 211 231 288 215 244 287
1975 224 224 281 307 249 279 296
1976 176 197 285 185 222 281 298 189 231 291 ,'2O1977 237 259 281 185 224 250 273 267 322 172 234 26.1 285
1978 216 221 246 226 241 275 236 254 27.1
1979 202 231 251 265 214 24., 26.1 28 I
1980 218 244 273 296 281 202 234 258 277
1981 188 210 229 221 226 260 270 199 2.15 246 27.1 ,109
1982 181 220 23.1 179 228 238
198.1 181 17.1 207 225 185 234 254 278 288
1984 172 208 230 289 301 170 219 253 28.1
16

Appendix Table 4Mean fork length (mm) of Atlantic menhaden sampled from the Chesapeake Bay area by quarter and age, 1972-84.
Quoner I Quoner 2 Quarter 3 Quaner 4
Age Iyrl Age (yrl Age Iyr) Age(yr)
YCi.Ir 4 0 4 5 0 4 0 4
1972 197 267 305 316 344 207 284 312 315 123 201 254
197.1 17K 222 279 32.1 131 212 233 291 124 217 250
1974 124 176 221 281 136 197 233 293 128 183
I'!75 154 204 257 294 126 176 211 278 116 168 207
I'!76 15.\ 209 288 .102 164 199 278 284 128 163 210 162 204
1977 160 205 277 158 18.1 241 127 163 193 231 19U 210 275 300
1978 142 182 209 162 192 225 129 173 203 232
197'! 167 194 229 174 198 223 133 170 205 237
1980 195 212 170 196 212 220 124 165 204 225 229 122 156
1981 177 198 128 176 189 206 249 129 176 202 226 237
1982 160 180 19.1 168 193 204 140 181 206 229
198.1 161 181 198 174 194 206 200 126 186 209 211 118
1984 158 184 207 11.1 171 197 215 115 164 203 233
Appendix Table 5Mean fork length (mm) of Atlantic menhaden sampled from the South Atlantic area by quarter and age, 1972-84.
Quone .. I Quoner 2 Quarter 3 Quarter 4
Age (yrl Age (yrl Age (yr) Age (yr)
Year 4 4 5 6 0 4 0 4 6 8
1472 169 198 160 201 286 174 204
1973 151 185 165 193 223 195 210
1974 1.18 214 284 177 218 262 183 228
1975 159 197 241 161 191 236 311 175 204
1976 159 183 [53 201 96 165 216
1977 115 182 135 190 264 160 190
1978 126 170 200 280 137 184 203 214 145 197 203
1979 1.15 174 219 153 185 205 89 175 202 230
1980 122 176 1.15 18.1 200 115 147 205 224 251
1981 154 171 202 141 187 204 209 92 152 198 216
1982 135 171 191 143 179 19.1 210 275 93 148 191 203
198.1 125 160 198 197 141 173 200 222 134 146 188 206 205 287 123 268 275 284 278 329
1984 1.10 169 155 185 205 103 165 194 209 115 142
17

Appendix Table 6 Appendix Table 7:\-Iean fork length (mm) of Atlantic menhaden sampled during the North Mean fork length (mm) of Atlantic menhaden sampled coastwide by age,
Carolina fall fishery by quarter and age. 1972-R4, 1972-84.
l,)uaner 3 l,)uaner 4 Age (yr)
Age (yr) Age Iyr)
YCdr 0 4 6
Year 0 4 0 4 61'172 II') 194 2b1 310 319 335
1972 182 2M 31.' 118 168 262 314 1973 131 202 220 302 334 ,32
1973 133 210 :N4 307 1974 123 184 227 293 328 327
1974 176 120 158 263 287 NI 1975 122 163 215 278 304 326 333
1')75 134 1611 218 261 118 153 229 276 1'176 107 160 215 285 298 310
1976 113 173 216 105 15'1 253 291 318 1977 lib 151 199 260 280 287 314
1977 88 167 220 116 Ib2 224 267 298 1978 120 155 196 2.11; 288 298
1978 1118 14(, 121 171 221 275 297 302 1l)79 III 167 205 25b 278 2'18 313
1979 85 197 217 2.,5 116 183 226 261 281 19811 115 147 201 257 27') 290 296
1980 116 159 214 223 240 114 147 212 283 291 298 297 1981 112 15'1 191\ 237 284 295 304
1981 117 171 215 ~20 1m 159 204 1982 111\ 160 194 21b 21\8 297 296 317
1982 152 213 225 112 Ib2 222 254 276 296 1983 124 154 198 243 269 294 .lll() 329
1983 140 Ib3 221 229 119 151 218 266 277 313 1984 112 161 198 248 277 286 294
1984 113 152 213 246 110 144 225 272 279 286 299
18

Appendix Table 9Mean ",ei~ht (g) of Atlantic menhaden sampled from the Middle Atlantic area by quarter and age, 1972-84.
<.)uartcr I Quarter 2 Quarter 3
Age Iyrl Age Iyr) Age Iyr)
Y~ar 4 4 5 6 4
1972 558 582 583 205 316 632 686 753 210 427 607 685
1973 264 557 742 246 318 500 678
1974 186 176 236 442 188 294 450
1975 219 237 423 535 302 417 480
1976 83 147 427 131 223 422 531 129 247 498 730
1977 291 36b 465 12\ 222 320 407 395 694 103 248 342 437
1978 198 212 295 218 271 404 259 330 406
1979 150 229 303 365 193 287 358 397
1980 195 299 397 516 440 153 253 329 409
1981 127 168 208 214 231 3bO 372 140 255 295 379 537
1982 103 202 256 105 237 265
1983 98 89 160 223 125 237 293 387 444
1984 93 176 261 497 584 111 221 328 432
Appendix Table 10Mean ",ei~ht (g) of Atlantic menhaden sampled from the Chesapeake Bay area by quarter and age, 1972-84.
Quartt.:r I Quarter 2 Quarter 3 Quarter 4
Age (yrl Age Iyr) Age Iyrl Age (yrl
Year 4 0 4 0 4 0 4
1972 134 345 488 551 669 149 403 524 569 31 140 290
1973 100 189 375 480 40 178 235 542 35 182 275
1974 30 104 198 384 45 137 231 415 39 118
1975 67 153 308 465 35 93 160 377 25 78 146
1976 63 164 353 416 7X 142 350 321 36 77 167 76 166
1977 68 ISO 345 69 105 238 36 76 133 237 132 172 405 629
1978 48 109 170 78 129 214 38 95 160 252
1979 89 143 215 95 148 232 40 88 167 284
1980 127 174 84 134 172 198 34 83 158 221 233 31 68
1981 105 138 42 93 122 161 247 37 92 148 221 285
1982 74 105 128 83 129 156 53 113 168 242
1983 69 1111 130 91 126 155 149 35 116 161 172 261984 65 106 158 23 94 145 193 27 90 162 254
19

Appendix Table IIMean weigh I (g) of Allanlic menhaden sampled from the South Atlantic area by quarter and age, 1972-84.
Quarter I Quarler 2 Quarter 3 Quarter 4Age Iyr) Age Iyr) Age Iyr) Age (yr)
Yt:ar 4 4 6 U 4 5 0 4 6
1972 77 125 70 134 32X 94 158
1973 61 114 82 127 222 1'<) 18'1974 36 166 326 % 170 282 117 2111975 65 123 205 73 113 202 458 97 iSS
1'0176 65 99 56 i39 14 71 1691977 24 100 41 119 378 7'J 127
197X 32 X7 148 359 43 107 147 167 51 142 162
197'1 44 'J6 180 65 ill 151 II <)5 149 216
1980 30 9b 40 112 145 25 53 11i5 224 301
1981 62 X4 139 46 117 150 141 12 51> i44 203
1982 44 91 122 55 105 136 16X 293 13 60 134 104
1983 34 74 135 117 49 93 145 195 42 51> i 23 174 177 430 30 337 382 427 465 7001984 39 X5 08 112 150 16 8U 141 183 22 46
Appendix Table 12 Appendix Table 13Mean weight (g) of Allanlic menhaden sampled during the North Carolina Mean weight (g) of Allantic menhaden sampled coaslwide by age, t972-84.
fall fishery by quarter and age, 1972-84.Age Iyr)
Quarter 3 Quarter 4
Age Iyr) Age Iyr) Year 0 4 6
Year 0 4 0 4 6 1972 28 128 330 547 631 6881973 40 156 196 535 688 674
1972 liS 349 5.17 27 7X 342 545 1974 31 116 212 453 1i07 587
1973 41 168 457 581 1975 30 77 187 405 515 691 654
1974 92 2X 62 324 437 476 1976 20 69 194 445 518 569
1975 39 70 179 305 2X 59 224 376 1977 25 62 149 365 459 513 597
1976 25 87 176 IX 66 310 485 698 1'0178 28 1i8 142 260 467 513
1977 10 85 202 25 72 205 372 511 1979 21 84 167 326 420 504 708
1978 21 52 29 85 193 385 505 550 1980 25 57 152 351 441 484 542
1979 9 151 193 239 23 98 207 330 415 1981 23 6<) 140 265 443 490 498
1980 27 74 192 214 267 24 55 190 427 467 499 488 1982 28 79 138 200 388 487 461 549
1981 22 84 185 203 17 66 147 1983 33 61i 141 272 369 473 506 700
1982 68 194 222 23 74 217 344 420 49X 1984 24 78 149 288 405 450 4X8
1983 48 75 213 237 28 57 197 359 402 6U2
19R4 24 70 192 287 21 51 216 387 424 461 514
20

Appendix Table 14Coast wide estimated numbers of Atlantic menhaden (lOJ) caught by purse seine ,'essels by age, quarter, and year,
1965-84 (quarters were summed before roundin~ to thousands).
Age Iyr)
Quaner 0 4 6 8-10
1965I 24.594 36,482 4.981 1.527 59 I <I
2 2.044 472.773 249.551 49.657 6.896 1.238 897 470 26
3 85.009 223.273 88.296 17.099 3.167 514 318 276 394 162.066 24.566 47.068 6.018 579
Totals 249.119 745.206 421.397 77 .755 12.168 1.811 1.215 746 65
1966I 21.387 9.688 352 123
2 13.171 324.656 173.120 9.844 1.999 287 54 53 17
3 203.273 177.016 176.851 15.817 1.768 73 55 55 184 133.008 27.760 44,477 5.686
Totals 349,453 550.820 404.136 31.699 3.890 360 108 108 36
1967I 106.046 9.867
305.108 151.252 20.997 1.953 252 123 6.949 154.262 77.825 29,403 1.020 364 67.788 26.722 22.375 2.117 201
Totals 6.949 633.20.1 265.667 72.775 5.090 489 12
1968I 67.978 73.278 445
216 209,463 290,789 32,421 5.096 263 45
3 41.591 90.757 144.930 24.796 4.318 538 144 112,451 9.166 29.954 8,024 1.261 182
Totals 154.258 377.364 538.951 65.686 10.675 983 58
1969I 41.580 15,601
2 2.265 218,702 165,668 18,064 3.6lJ9 150 9
3 56.334 82,440 72.814 16,993 1,279
4 99.528 29.607 30.225 12.753 554
Totals 158.127 372.328 284.309 47.810 5,442 150 9
1970I 70.218 50.798 909
2 562.968 286.132 18,646 614
3 6.823 228,440 120.291 9,458 1,991 734 14.595 9.225 10.704 3,621 1,414 39
Totals 21,418 870.851 473,924 32.634 4,019 112
1971I 7.003 36.787 265 122 137,410 324.056 56.594 10,050 9473 41.781 113.963 153.849 30.050 7.370 1.5244 31.073 4.912 9,623 1,377 412 41
Totals 72.854 263.288 524.315 88.286 17.844 2.512
1972I 30.736 21.186 662 832 444.020 336.688 128.158 13,497 1.6753 454.230 127.993 43.010 5.541 1864 50.162 52.283 2.602 1.235
Totals 50.162 981.269 488,469 173.065 19.121 1.861
21
Appendix Table 14 (Cont'd)Coastwide estimated numbers of Atlantic menhaden (103) caught by purse seine vessels by age, quarter, and year,
1965-84 (quarters were summed before rounding to thousands).
Age lyr)
Quarter 0 4 8-10
1973I 20.392 34.267 I
129.110 '132.303 3U.15<) 5.4663 II.n3 370.298 182.392 8.453 1.538 3434 44.196 68.671 3.974 17
Totals 55.979 588.471 1.152.936 38.630 7.004 343
1974I 54.309 4'1.14'1 369
5.263 265.781 815.3QO 40.695 llill 1.1963 14.874 235.642 105.800 7.234 838 1494 295.415 30.946 15.720 288 46
Totals 315.552 636.678 985.969 48.586 2.4'15 U45
1975I 28.999 102.153 1.712
346.071 761.U03 35.817 5.508 200 1013 69.478 243.243 197.866 11.5'14 1.1204 229.162 101.650 25.505 1.122
Totals 298.640 719.963 1.086.527 50.245 6.628 200 101
1976
I 108.892 104.100 552 848.021 921.916 24.668 7.U50 277
3 33.481 594.779 297.570 17.306 7414 240.750 60.268 17.499 5.937 158
TOlals 274.231 1.611.960 1.341.085 47.966 7.94'1 277
1977I 123.384 231.520 15.203 4.9632 343.760 1.188.714 49.055 9.146 1.230 IIlI
3 4.341 394.103 620.469 14.608 3.473 16° 124 48U.282 143.291 41.062 4,594 220
Totals 484.623 1.004.538 2.018.765 83,460 17,802 1.405 113
1978I 30,019 124,086 22,954 376
250,559 1,209,137 180,411 18,159 2,281
3 131.037 270,301 295,198 42,611 5.721 6414 326,376 113,209 42,490 12,145 6.'130 555
Totals 457.413 664,088 1,670,911 258,121 31,186 3.477
1979I 15.628 144.138 5.877
2 1.223 141.879 1.075.501 71,567 12,619 1,325
3 15.012 385,538 339.901 42,980 6,671 145 93
4 1.476,227 80,091 43,745 7.5U2 2,408
Totals 1,492,462 623,136 1.603,285 127,926 21,758 1,470 93
1980I 127 ,442 84.282 13.128 205
2 349,624 1,020.059 145,881 36.675 6.817 574
3 7.967 738.873 323.598 47,392 22,431 4,998 3984 80,323 262.119 30.295 16.311 9,917 2,541 466
Totals 88,290 1,478.058 1.458,234 222,712 69,228 14,356 1.438
22

Appendix Table 14 (Cont'd)Coastwide estimaled numbers of Atlantic menhaden (103) caught by purse seine vessels by age, quarter, and year,
1965-84 (quarlers were summed before rounding to lhousands).
Age (yr)
Quarter 0 4 6 7 8-10
1981I R.180 141.578 42.447 1.822 596
2 558 208.558 1.192.587 139.655 40.144 13,444 1.047
3 19.1.442 308.693 426.211 40.099 5.505 1.333 2274 993.574 17.1.234 51.086
Totals 1.187.574 698.665 1.811.462 222.201 47.471 15.373 1.274
1982I 25.961 204.151 76.186 279 93
364.514 1.173.062 228.657 10.255 4.800 528 321
3 12,411 398.258 309.170 60.273 2.7414 101.697 130.704 53.167 14.549 3,053 886
TOlals 114.IOR 919.437 1.739.550 379.665 16.328 5,779 528 321
1983I 8.949 219.438 2.705 610
180.174 1.459.857 56.347 12,459 1.661 229
.1 222.732 141.717 553.845 20.111 6.874 2.0494 741.683 186.377 59.924 35.184 27 .426 1.298 462
Totals 964,415 517.217 2.293.064 114.347 47,369 5.008 229 462
1984I 12.656 59.083 8.249
2 5.652 339.075 539,480 165.027 19.369 5.707 140
3 279.864 21 1.382 278.884 65.177 7.599 2.330
4 1.008.707 461.052 14.642 33.048 23.371 7.170 372
Totals 1.294.223 1.024.165 892,089 271.501 50.339 15.207 512
GPO 591-131/8100423


![Population Characteristics ofGulfMenhaden, Brevoortia …Population Characteristics ofGulfMenhaden, Brevoortia patranus DOUGLAS S. VAUGHAN, ELDON]. LEVI, andJOSEPH W. SMITH National](https://static.fdocuments.us/doc/165x107/5ed924c36714ca7f47693a5d/population-characteristics-ofgulfmenhaden-brevoortia-population-characteristics.jpg)