Atlantic Canada Engineering Salary Survey 2015 Report Salary... · Atlantic Canada Engineering...
34
Atlantic Canada Engineering Salary Survey 2015 Report Prepared for: Engineers Nova Scotia Engineers and Geoscientists New Brunswick Professional Engineers and Geoscientists Newfoundland & Labrador Engineers PEI Prepared by: July 30, 2015
Transcript of Atlantic Canada Engineering Salary Survey 2015 Report Salary... · Atlantic Canada Engineering...
Atlantic Canada Engineering Salary Survey 2015 Report
Prepared for:
Engineers Nova Scotia
Engineers and Geoscientists New Brunswick
Professional Engineers and Geoscientists Newfoundland & Labrador
Engineers PEI
Prepared by:
July 30, 2015
Member Salary Survey 2015
2
Table of Contents
Survey Background ................................................................................................................. 3
Salary ....................................................................................................................................... 4
Salary by Membership Status .................................................................................................. 5
Salary by Membership Status: Comparison Between 2012 and 2015 ..................................... 6
Salary by Gender ...................................................................................................................... 7
Salary by Gender: Comparison Between 2012 and 2015 ......................................................... 8
Salary by Year of Graduation ............................................................................................... 9-10
Salary by Year of Graduation and Gender ......................................................................... 11-12
Salary by Post-Graduate Studies ............................................................................................. 13
Salary by Post-Graduate Degree.............................................................................................. 14
Salary by Discipline............................................................................................................. 15-17
Salary by Years of Experience Professional Engineers........................................................ 18-19
Salary by Months of Experience Engineers-in-Training............................................................ 20
Salary by Province or Territory................................................................................................. 21
Salary by Job Position............................................................................................................... 22
Salary by Sector of Employment ......................................................................................... 23-24
Salary by Sector of Employment: Comparison Between 2012 and 2015............................. 25-26
Vacation by Employment Sector ......................................................................................... 27-30
Overtime Compensation .......................................................................................................... 31
Benefits ................................................................................................................................ 32-33
Overall Satisfaction with Remuneration ................................................................................... 34
Member Salary Survey 2015
3
This year the Professional Engineers and Geoscientists of Newfoundland and
Labrador (PEGNL), Engineers Nova Scotia (ENS), the Association of Professional
Engineers and Geoscientists of New Brunswick (APEGNB), and Engineers PEI (EPEI)
agreed to jointly complete an engineering salary survey. Many members,
employers, and those considering a career in engineering have expressed an
interest in obtaining current statistics on engineering salaries in the Atlantic
region. It has been three years since members were asked to participate in the
last survey.
The 2015 salary survey was conducted and compiled by ClearPicture Corp. This
year 8978 members were asked to participate in the survey, with 3608
responding for a 40% participation rate. Only the aggregated data has been
presented in this report. Individual members data will be kept confidential and
ClearPicture Corp. will not share that data with anyone.
The mean, median, lower and upper quartiles were calculated using the midpoint
of each of the salary ranges. Where the mean is the average, median is the 50th
percentile, lower quartile is the 25th percentile and the upper quartile is the 75th
percentile.
Member Salary Survey 2015
4
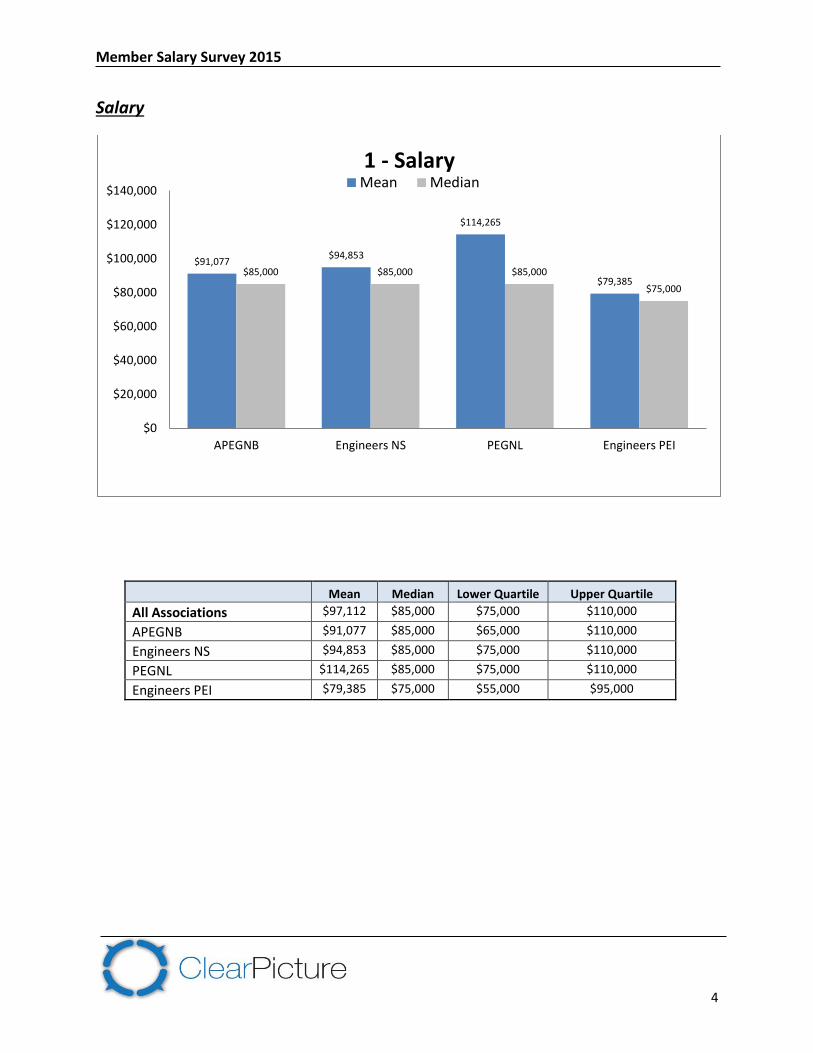
Salary
Mean Median Lower Quartile Upper Quartile
All Associations $97,112 $85,000 $75,000 $110,000
APEGNB $91,077 $85,000 $65,000 $110,000
Engineers NS $94,853 $85,000 $75,000 $110,000
PEGNL $114,265 $85,000 $75,000 $110,000
Engineers PEI $79,385 $75,000 $55,000 $95,000
$91,077$94,853
$114,265
$79,385$85,000 $85,000 $85,000
$75,000
$0
$20,000
$40,000
$60,000
$80,000
$100,000
$120,000
$140,000
APEGNB Engineers NS PEGNL Engineers PEI
1 - SalaryMean Median
Member Salary Survey 2015
5
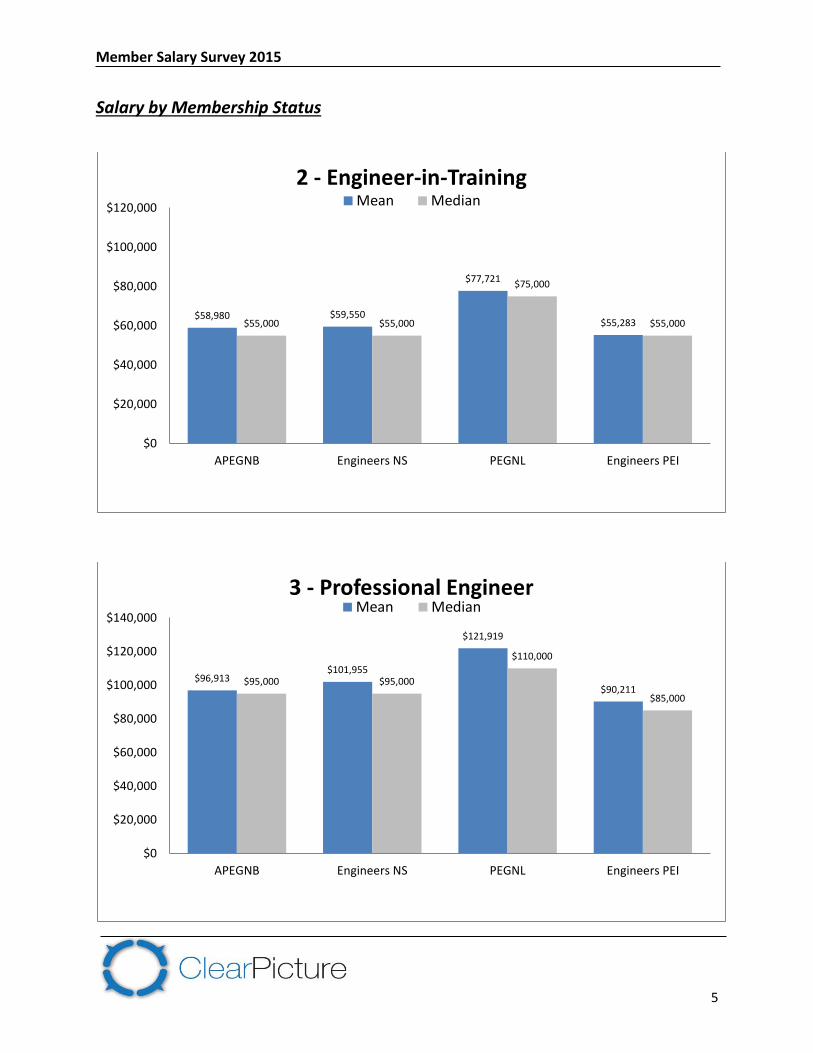
Salary by Membership Status
$58,980 $59,550
$77,721
$55,283$55,000 $55,000
$75,000
$55,000
$0
$20,000
$40,000
$60,000
$80,000
$100,000
$120,000
APEGNB Engineers NS PEGNL Engineers PEI
2 - Engineer-in-TrainingMean Median
$96,913$101,955
$121,919
$90,211$95,000 $95,000
$110,000
$85,000
$0
$20,000
$40,000
$60,000
$80,000
$100,000
$120,000
$140,000
APEGNB Engineers NS PEGNL Engineers PEI
3 - Professional Engineer Mean Median
Member Salary Survey 2015
6
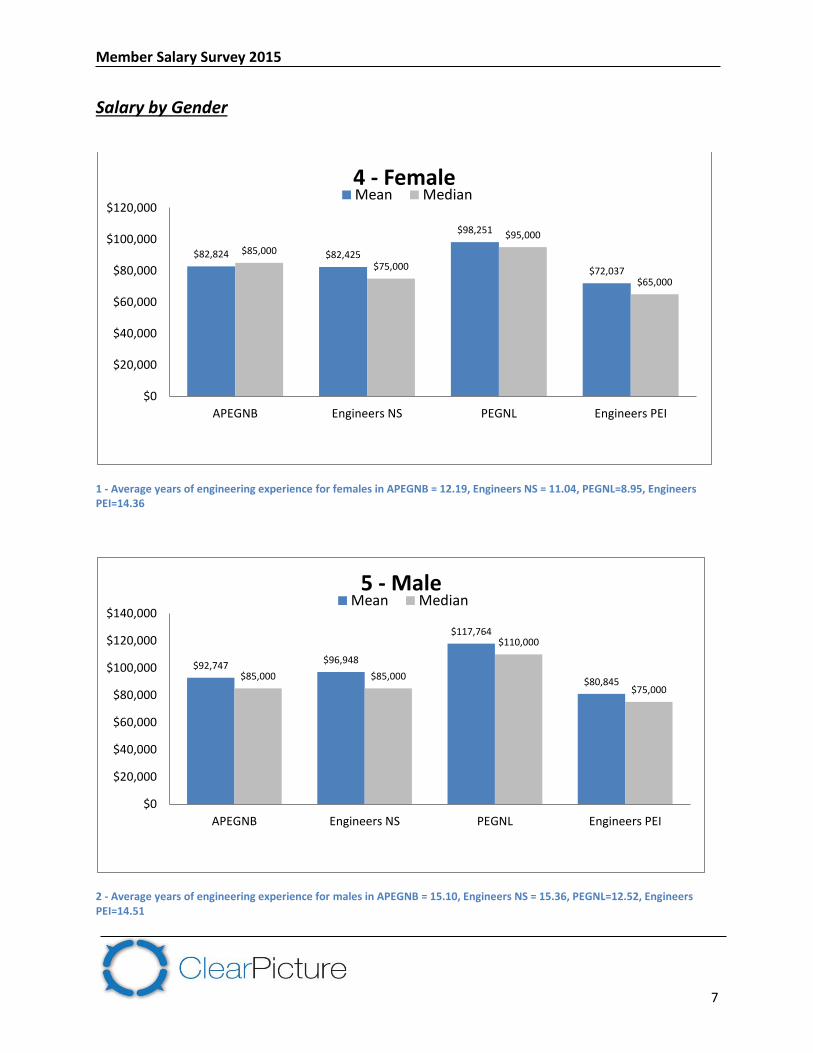
Salary by Membership Status: Comparison Between 2012 and 2015
2015 2012
# Mean Median Lower Quartile
Upper Quartile
# Mean Median Lower Quartile
Upper Quartile
Engineer-in-Training
All Associations 585 $62,867 $55,000 $55,000 $75,000 207 $60,509 $58,000 $51,000 $67,000
APEGNB 152 $58,980 $55,000 $45,000 $65,000 46 $60,761 $60,000 $50,978 $70,000
Engineers NS 256 $59,550 $55,000 $55,000 $65,000 55 $54,697 $54,000 $48,944 $59,584
PEGNL 124 $77,721 $75,000 $65,000 $85,000 62 $71,137 $65,225 $60,000 $80,000
Engineers PEI 53 $55,283 $55,000 $45,000 $55,000 44 $54,647 $50,695 $46,338 $62,383
Professional Engineer
All Associations 2804 $104,211 $95,000 $75,000 $110,000 1,128 $96,630 $92,000 $77,168 $110,000
APEGNB 836 $96,913 $95,000 $75,000 $110,000 337 $87,108 $85,000 $72,000 $100,000
Engineers NS 1259 $101,955 $95,000 $75,000 $110,000 373 $101,505 $100,000 $82,000 $116,776
PEGNL 590 $121,919 $110,000 $95,000 $130,000 312 $103,446 $100,000 $82,000 $120,000
Engineers PEI 118 $90,211 $85,000 $75,000 $110,000 106 $86,710 $81,072 $70,000 $99,192
Member Salary Survey 2015
7
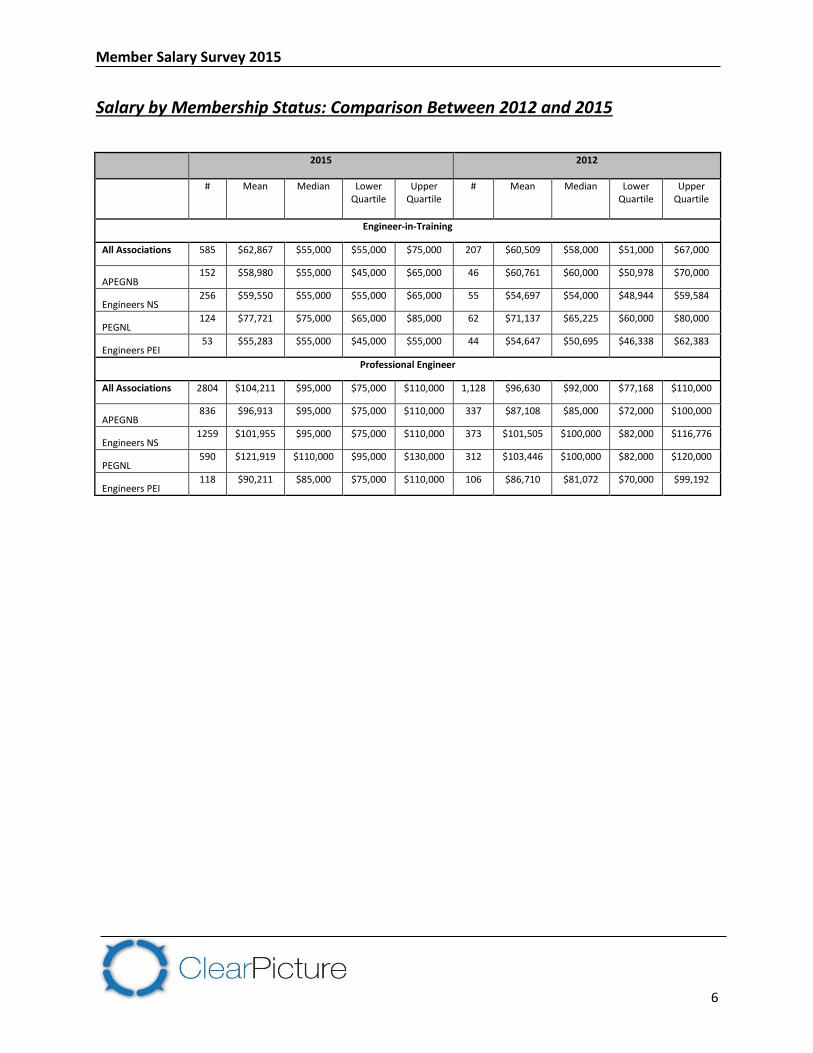
Salary by Gender
1 - Average years of engineering experience for females in APEGNB = 12.19, Engineers NS = 11.04, PEGNL=8.95, Engineers PEI=14.36
2 - Average years of engineering experience for males in APEGNB = 15.10, Engineers NS = 15.36, PEGNL=12.52, Engineers PEI=14.51
$82,824 $82,425
$98,251
$72,037
$85,000
$75,000
$95,000
$65,000
$0
$20,000
$40,000
$60,000
$80,000
$100,000
$120,000
APEGNB Engineers NS PEGNL Engineers PEI
4 - FemaleMean Median
$92,747$96,948
$117,764
$80,845$85,000 $85,000
$110,000
$75,000
$0
$20,000
$40,000
$60,000
$80,000
$100,000
$120,000
$140,000
APEGNB Engineers NS PEGNL Engineers PEI
5 - MaleMean Median
Member Salary Survey 2015
8
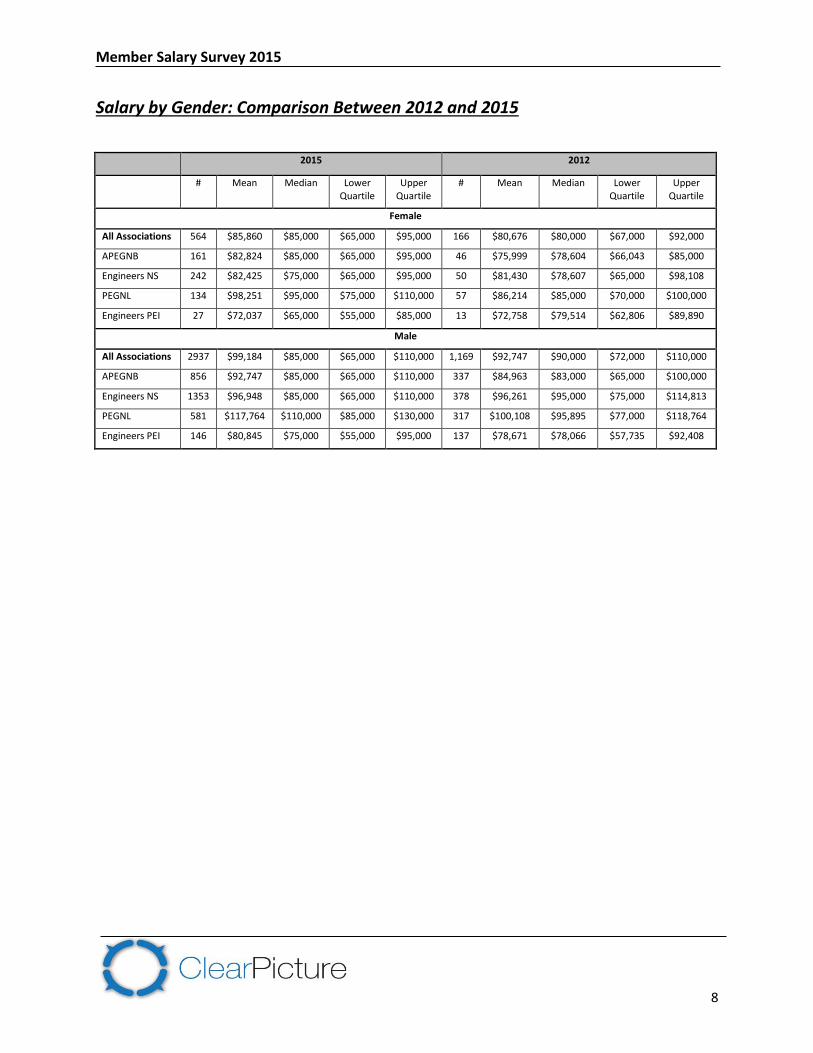
Salary by Gender: Comparison Between 2012 and 2015
2015 2012
# Mean Median Lower Quartile
Upper Quartile
# Mean Median Lower Quartile
Upper Quartile
Female
All Associations 564 $85,860 $85,000 $65,000 $95,000 166 $80,676 $80,000 $67,000 $92,000
APEGNB 161 $82,824 $85,000 $65,000 $95,000 46 $75,999 $78,604 $66,043 $85,000
Engineers NS 242 $82,425 $75,000 $65,000 $95,000 50 $81,430 $78,607 $65,000 $98,108
PEGNL 134 $98,251 $95,000 $75,000 $110,000 57 $86,214 $85,000 $70,000 $100,000
Engineers PEI 27 $72,037 $65,000 $55,000 $85,000 13 $72,758 $79,514 $62,806 $89,890
Male
All Associations 2937 $99,184 $85,000 $65,000 $110,000 1,169 $92,747 $90,000 $72,000 $110,000
APEGNB 856 $92,747 $85,000 $65,000 $110,000 337 $84,963 $83,000 $65,000 $100,000
Engineers NS 1353 $96,948 $85,000 $65,000 $110,000 378 $96,261 $95,000 $75,000 $114,813
PEGNL 581 $117,764 $110,000 $85,000 $130,000 317 $100,108 $95,895 $77,000 $118,764
Engineers PEI 146 $80,845 $75,000 $55,000 $95,000 137 $78,671 $78,066 $57,735 $92,408
Member Salary Survey 2015
9
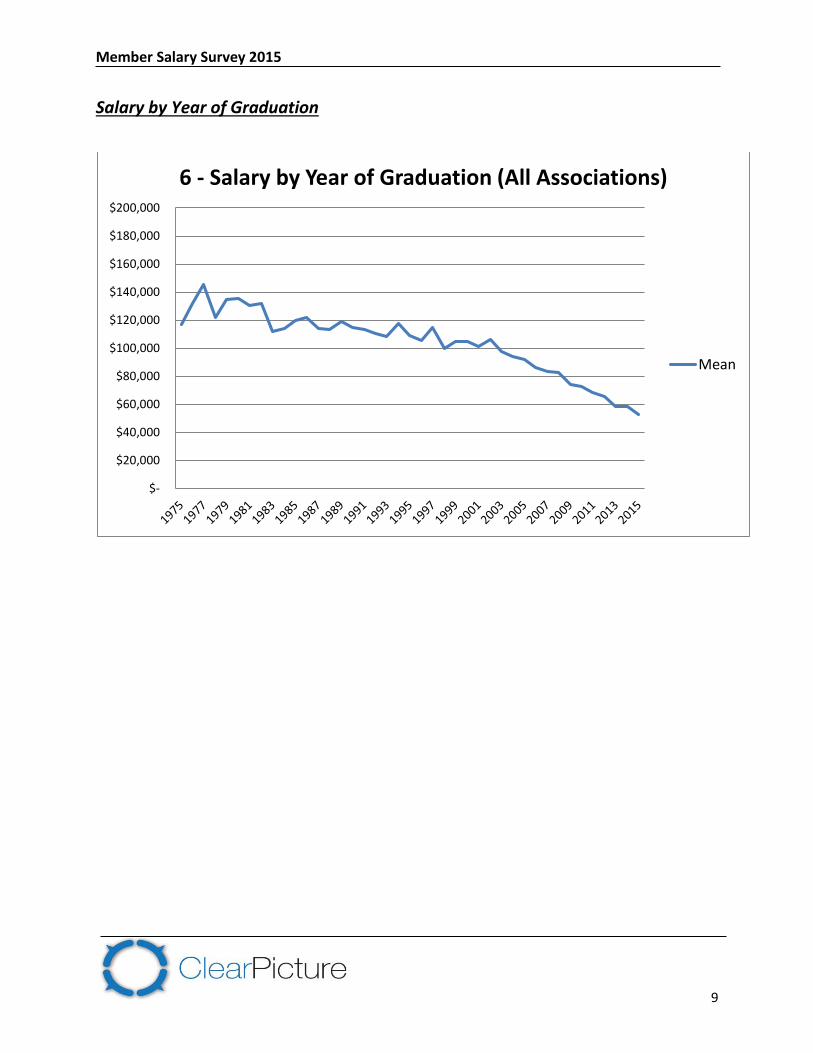
Salary by Year of Graduation
$-
$20,000
$40,000
$60,000
$80,000
$100,000
$120,000
$140,000
$160,000
$180,000
$200,000
6 - Salary by Year of Graduation (All Associations)
Mean
Member Salary Survey 2015
10
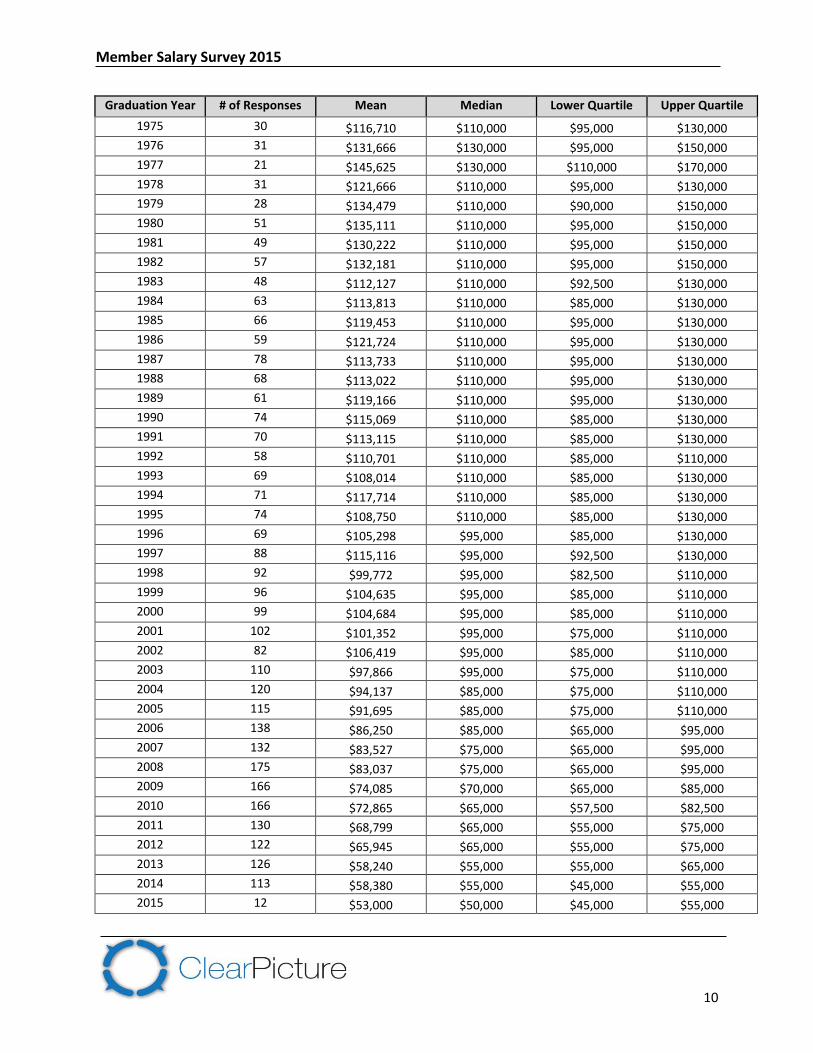
Graduation Year # of Responses Mean Median Lower Quartile Upper Quartile
1975 30 $116,710 $110,000 $95,000 $130,000
1976 31 $131,666 $130,000 $95,000 $150,000
1977 21 $145,625 $130,000 $110,000 $170,000
1978 31 $121,666 $110,000 $95,000 $130,000
1979 28 $134,479 $110,000 $90,000 $150,000
1980 51 $135,111 $110,000 $95,000 $150,000
1981 49 $130,222 $110,000 $95,000 $150,000
1982 57 $132,181 $110,000 $95,000 $150,000
1983 48 $112,127 $110,000 $92,500 $130,000
1984 63 $113,813 $110,000 $85,000 $130,000
1985 66 $119,453 $110,000 $95,000 $130,000
1986 59 $121,724 $110,000 $95,000 $130,000
1987 78 $113,733 $110,000 $95,000 $130,000
1988 68 $113,022 $110,000 $95,000 $130,000
1989 61 $119,166 $110,000 $95,000 $130,000
1990 74 $115,069 $110,000 $85,000 $130,000
1991 70 $113,115 $110,000 $85,000 $130,000
1992 58 $110,701 $110,000 $85,000 $110,000
1993 69 $108,014 $110,000 $85,000 $130,000
1994 71 $117,714 $110,000 $85,000 $130,000
1995 74 $108,750 $110,000 $85,000 $130,000
1996 69 $105,298 $95,000 $85,000 $130,000
1997 88 $115,116 $95,000 $92,500 $130,000
1998 92 $99,772 $95,000 $82,500 $110,000
1999 96 $104,635 $95,000 $85,000 $110,000
2000 99 $104,684 $95,000 $85,000 $110,000
2001 102 $101,352 $95,000 $75,000 $110,000
2002 82 $106,419 $95,000 $85,000 $110,000
2003 110 $97,866 $95,000 $75,000 $110,000
2004 120 $94,137 $85,000 $75,000 $110,000
2005 115 $91,695 $85,000 $75,000 $110,000
2006 138 $86,250 $85,000 $65,000 $95,000
2007 132 $83,527 $75,000 $65,000 $95,000
2008 175 $83,037 $75,000 $65,000 $95,000
2009 166 $74,085 $70,000 $65,000 $85,000
2010 166 $72,865 $65,000 $57,500 $82,500
2011 130 $68,799 $65,000 $55,000 $75,000
2012 122 $65,945 $65,000 $55,000 $75,000
2013 126 $58,240 $55,000 $55,000 $65,000
2014 113 $58,380 $55,000 $45,000 $55,000
2015 12 $53,000 $50,000 $45,000 $55,000
Member Salary Survey 2015
11
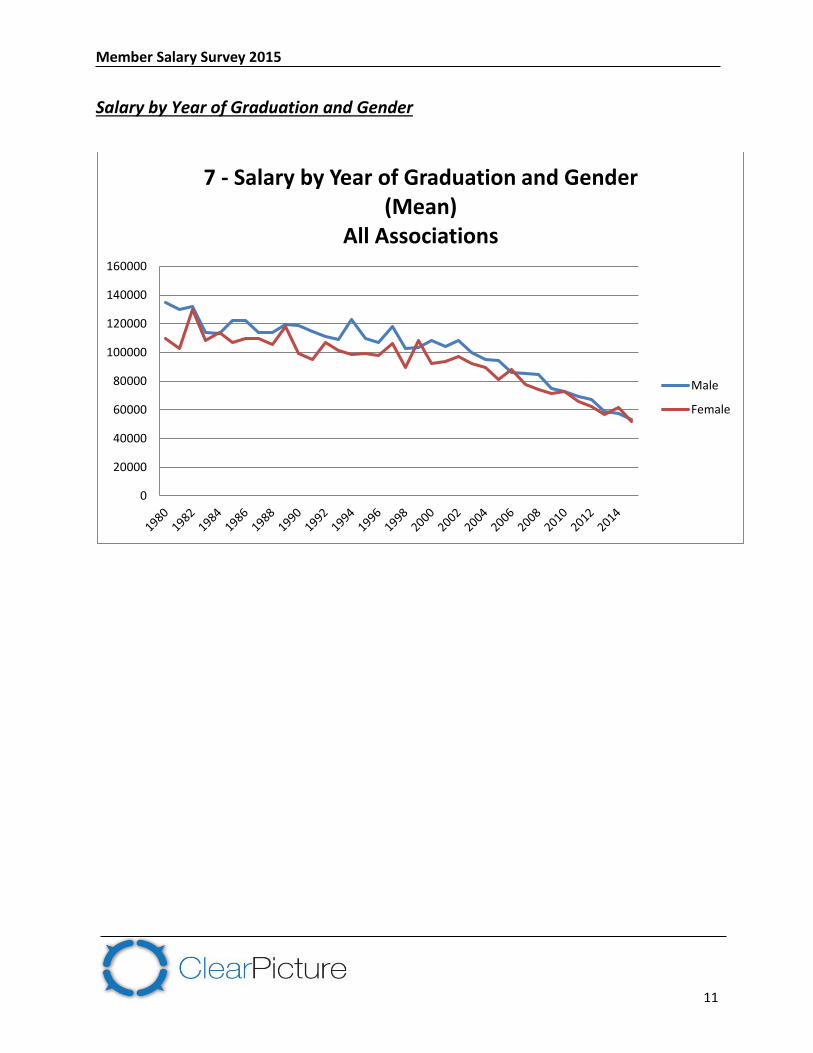
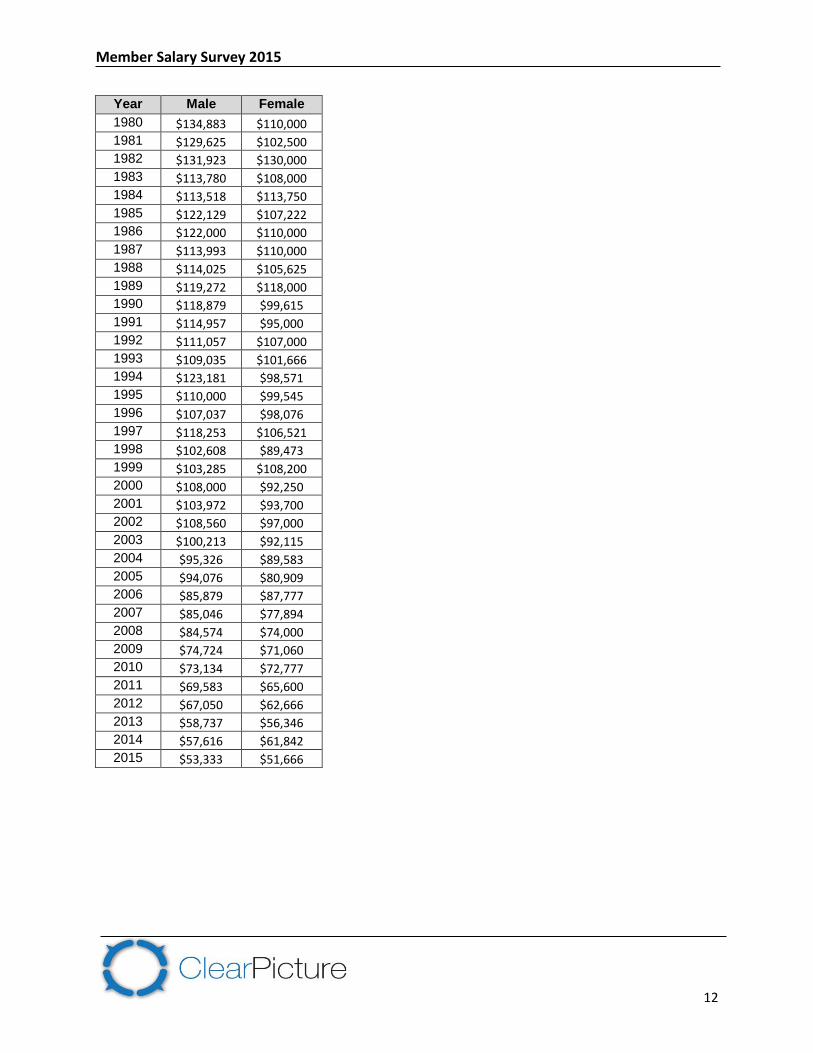
Salary by Year of Graduation and Gender
0
20000
40000
60000
80000
100000
120000
140000
160000
7 - Salary by Year of Graduation and Gender (Mean)
All Associations
Male
Female
Member Salary Survey 2015
12
Year Male Female
1980 $134,883 $110,000
1981 $129,625 $102,500 1982 $131,923 $130,000
1983 $113,780 $108,000
1984 $113,518 $113,750
1985 $122,129 $107,222 1986 $122,000 $110,000
1987 $113,993 $110,000
1988 $114,025 $105,625
1989 $119,272 $118,000 1990 $118,879 $99,615
1991 $114,957 $95,000
1992 $111,057 $107,000
1993 $109,035 $101,666 1994 $123,181 $98,571
1995 $110,000 $99,545
1996 $107,037 $98,076
1997 $118,253 $106,521 1998 $102,608 $89,473
1999 $103,285 $108,200
2000 $108,000 $92,250
2001 $103,972 $93,700 2002 $108,560 $97,000
2003 $100,213 $92,115
2004 $95,326 $89,583
2005 $94,076 $80,909 2006 $85,879 $87,777
2007 $85,046 $77,894
2008 $84,574 $74,000
2009 $74,724 $71,060
2010 $73,134 $72,777
2011 $69,583 $65,600
2012 $67,050 $62,666
2013 $58,737 $56,346
2014 $57,616 $61,842
2015 $53,333 $51,666
Member Salary Survey 2015
13
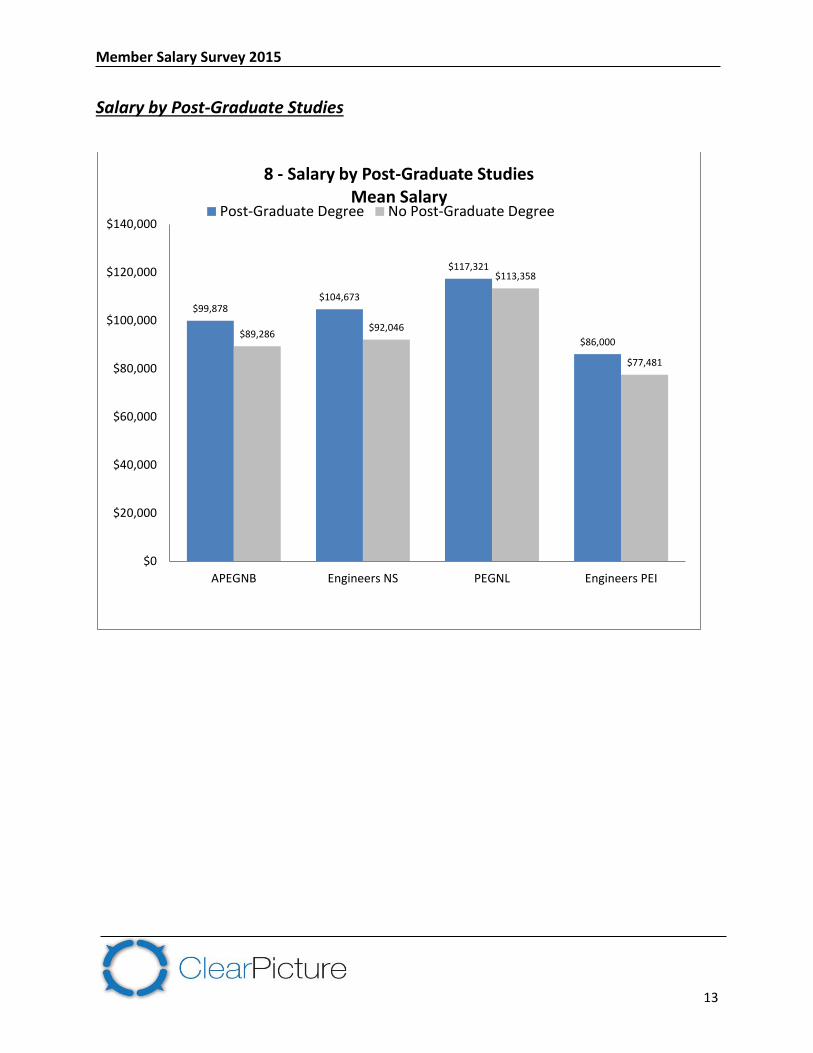
Salary by Post-Graduate Studies
$99,878$104,673
$117,321
$86,000$89,286
$92,046
$113,358
$77,481
$0
$20,000
$40,000
$60,000
$80,000
$100,000
$120,000
$140,000
APEGNB Engineers NS PEGNL Engineers PEI
8 - Salary by Post-Graduate StudiesMean Salary
Post-Graduate Degree No Post-Graduate Degree
Member Salary Survey 2015
14
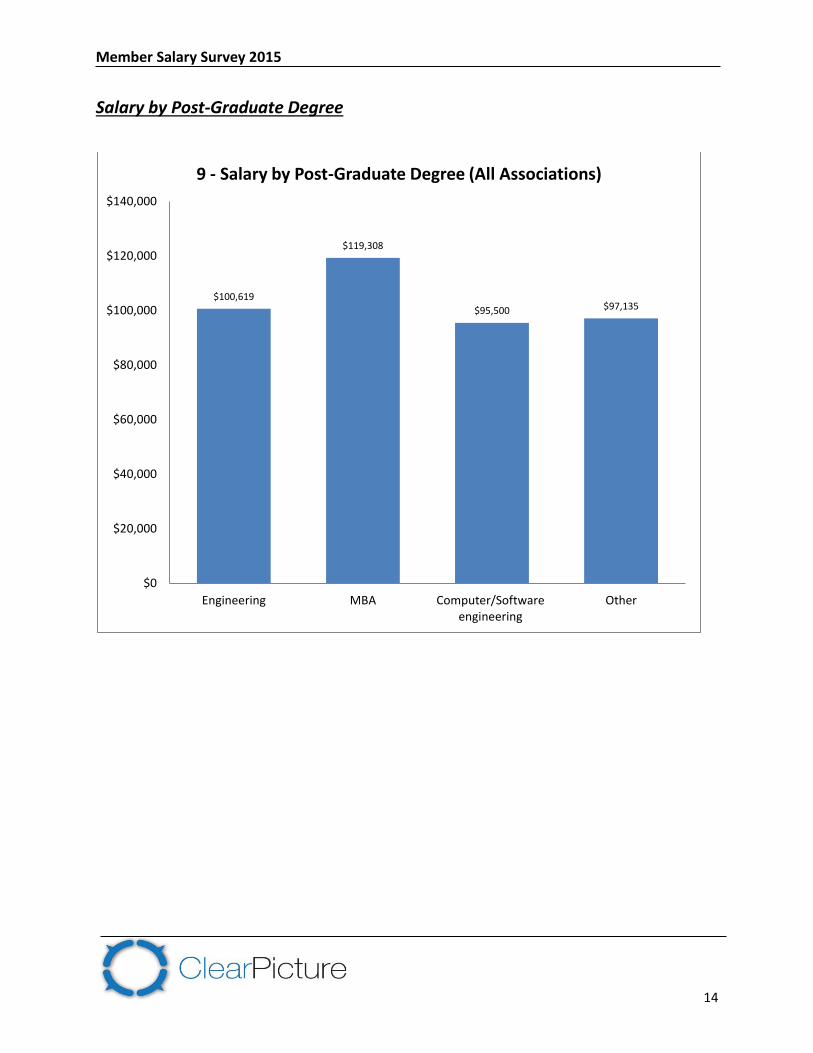
Salary by Post-Graduate Degree
$100,619
$119,308
$95,500 $97,135
$0
$20,000
$40,000
$60,000
$80,000
$100,000
$120,000
$140,000
Engineering MBA Computer/Softwareengineering
Other
9 - Salary by Post-Graduate Degree (All Associations)
Member Salary Survey 2015
15
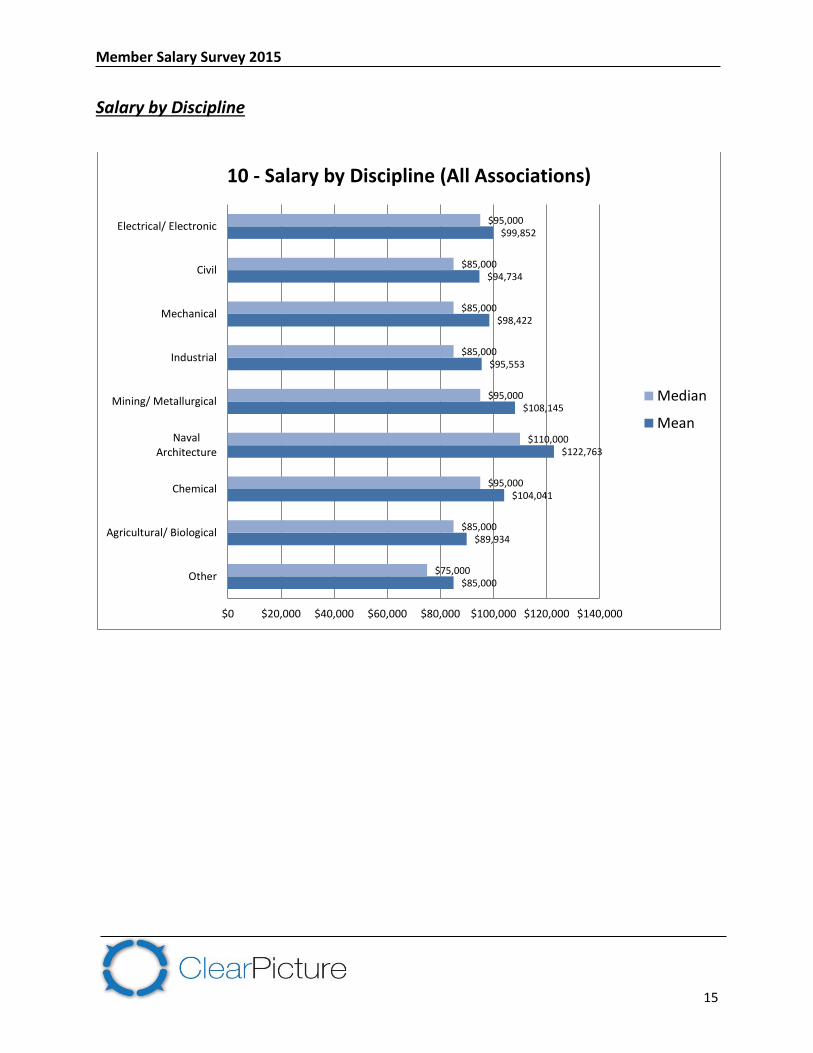
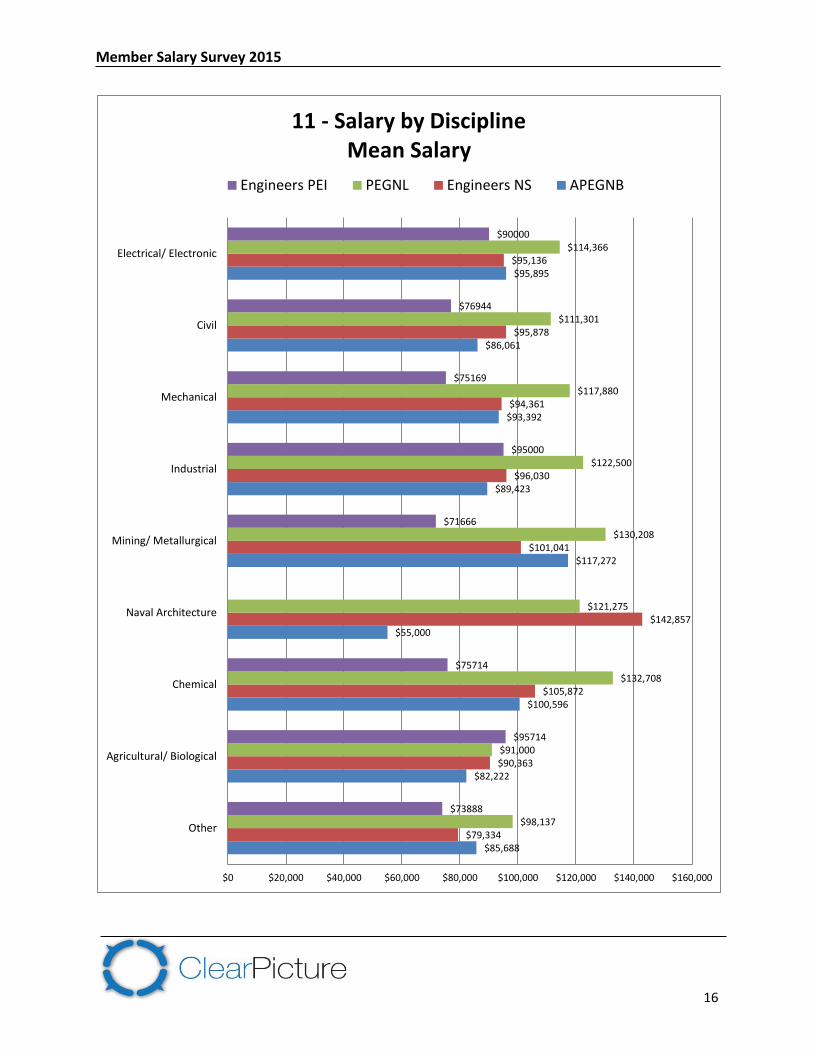
Salary by Discipline
$85,000
$89,934
$104,041
$122,763
$108,145
$95,553
$98,422
$94,734
$99,852
$75,000
$85,000
$95,000
$110,000
$95,000
$85,000
$85,000
$85,000
$95,000
$0 $20,000 $40,000 $60,000 $80,000 $100,000 $120,000 $140,000
Other
Agricultural/ Biological
Chemical
NavalArchitecture
Mining/ Metallurgical
Industrial
Mechanical
Civil
Electrical/ Electronic
10 - Salary by Discipline (All Associations)
Median
Mean
Member Salary Survey 2015
16
$85,688
$82,222
$100,596
$55,000
$117,272
$89,423
$93,392
$86,061
$95,895
$79,334
$90,363
$105,872
$142,857
$101,041
$96,030
$94,361
$95,878
$95,136
$98,137
$91,000
$132,708
$121,275
$130,208
$122,500
$117,880
$111,301
$114,366
$73888
$95714
$75714
$71666
$95000
$75169
$76944
$90000
$0 $20,000 $40,000 $60,000 $80,000 $100,000 $120,000 $140,000 $160,000
Other
Agricultural/ Biological
Chemical
Naval Architecture
Mining/ Metallurgical
Industrial
Mechanical
Civil
Electrical/ Electronic
11 - Salary by Discipline Mean Salary
Engineers PEI PEGNL Engineers NS APEGNB
Member Salary Survey 2015
17
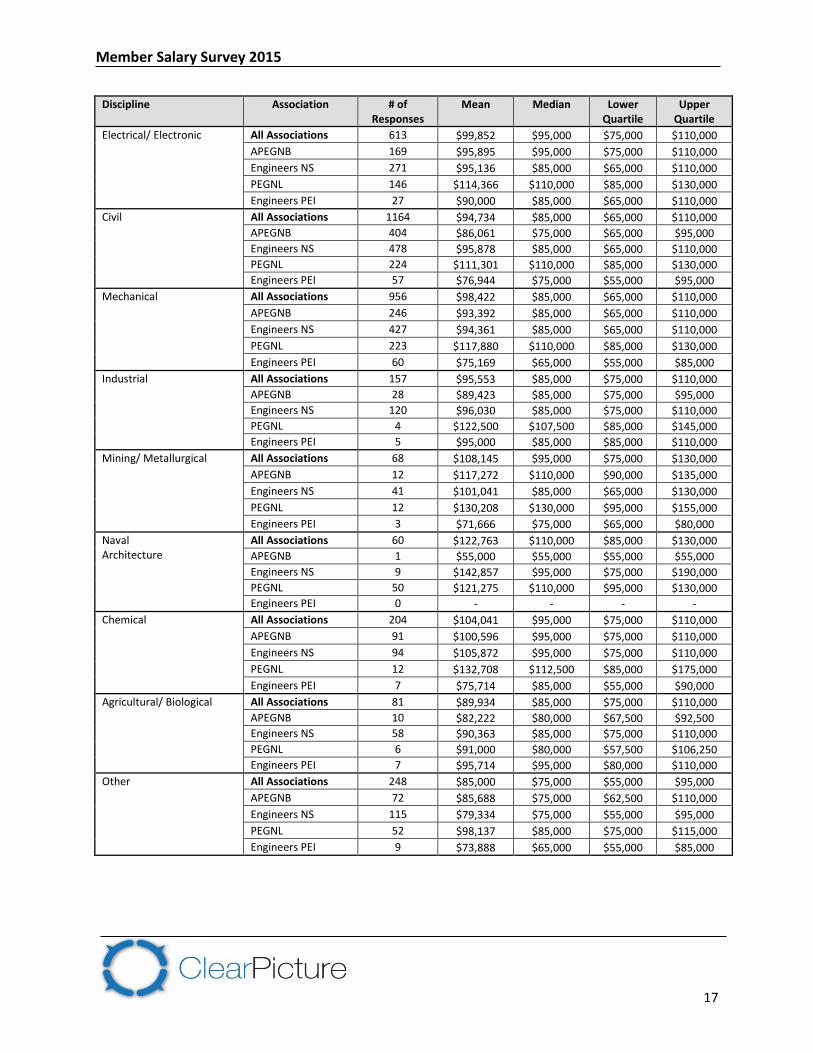
Discipline Association # of Responses
Mean Median Lower Quartile
Upper Quartile
Electrical/ Electronic All Associations 613 $99,852 $95,000 $75,000 $110,000
APEGNB 169 $95,895 $95,000 $75,000 $110,000
Engineers NS 271 $95,136 $85,000 $65,000 $110,000
PEGNL 146 $114,366 $110,000 $85,000 $130,000
Engineers PEI 27 $90,000 $85,000 $65,000 $110,000
Civil All Associations 1164 $94,734 $85,000 $65,000 $110,000
APEGNB 404 $86,061 $75,000 $65,000 $95,000
Engineers NS 478 $95,878 $85,000 $65,000 $110,000
PEGNL 224 $111,301 $110,000 $85,000 $130,000
Engineers PEI 57 $76,944 $75,000 $55,000 $95,000
Mechanical All Associations 956 $98,422 $85,000 $65,000 $110,000
APEGNB 246 $93,392 $85,000 $65,000 $110,000
Engineers NS 427 $94,361 $85,000 $65,000 $110,000
PEGNL 223 $117,880 $110,000 $85,000 $130,000
Engineers PEI 60 $75,169 $65,000 $55,000 $85,000
Industrial All Associations 157 $95,553 $85,000 $75,000 $110,000
APEGNB 28 $89,423 $85,000 $75,000 $95,000
Engineers NS 120 $96,030 $85,000 $75,000 $110,000
PEGNL 4 $122,500 $107,500 $85,000 $145,000
Engineers PEI 5 $95,000 $85,000 $85,000 $110,000
Mining/ Metallurgical All Associations 68 $108,145 $95,000 $75,000 $130,000
APEGNB 12 $117,272 $110,000 $90,000 $135,000
Engineers NS 41 $101,041 $85,000 $65,000 $130,000
PEGNL 12 $130,208 $130,000 $95,000 $155,000
Engineers PEI 3 $71,666 $75,000 $65,000 $80,000
Naval Architecture
All Associations 60 $122,763 $110,000 $85,000 $130,000
APEGNB 1 $55,000 $55,000 $55,000 $55,000
Engineers NS 9 $142,857 $95,000 $75,000 $190,000
PEGNL 50 $121,275 $110,000 $95,000 $130,000
Engineers PEI 0 - - - -
Chemical All Associations 204 $104,041 $95,000 $75,000 $110,000
APEGNB 91 $100,596 $95,000 $75,000 $110,000
Engineers NS 94 $105,872 $95,000 $75,000 $110,000
PEGNL 12 $132,708 $112,500 $85,000 $175,000
Engineers PEI 7 $75,714 $85,000 $55,000 $90,000
Agricultural/ Biological All Associations 81 $89,934 $85,000 $75,000 $110,000
APEGNB 10 $82,222 $80,000 $67,500 $92,500
Engineers NS 58 $90,363 $85,000 $75,000 $110,000
PEGNL 6 $91,000 $80,000 $57,500 $106,250
Engineers PEI 7 $95,714 $95,000 $80,000 $110,000
Other All Associations 248 $85,000 $75,000 $55,000 $95,000
APEGNB 72 $85,688 $75,000 $62,500 $110,000
Engineers NS 115 $79,334 $75,000 $55,000 $95,000
PEGNL 52 $98,137 $85,000 $75,000 $115,000
Engineers PEI 9 $73,888 $65,000 $55,000 $85,000
Member Salary Survey 2015
18
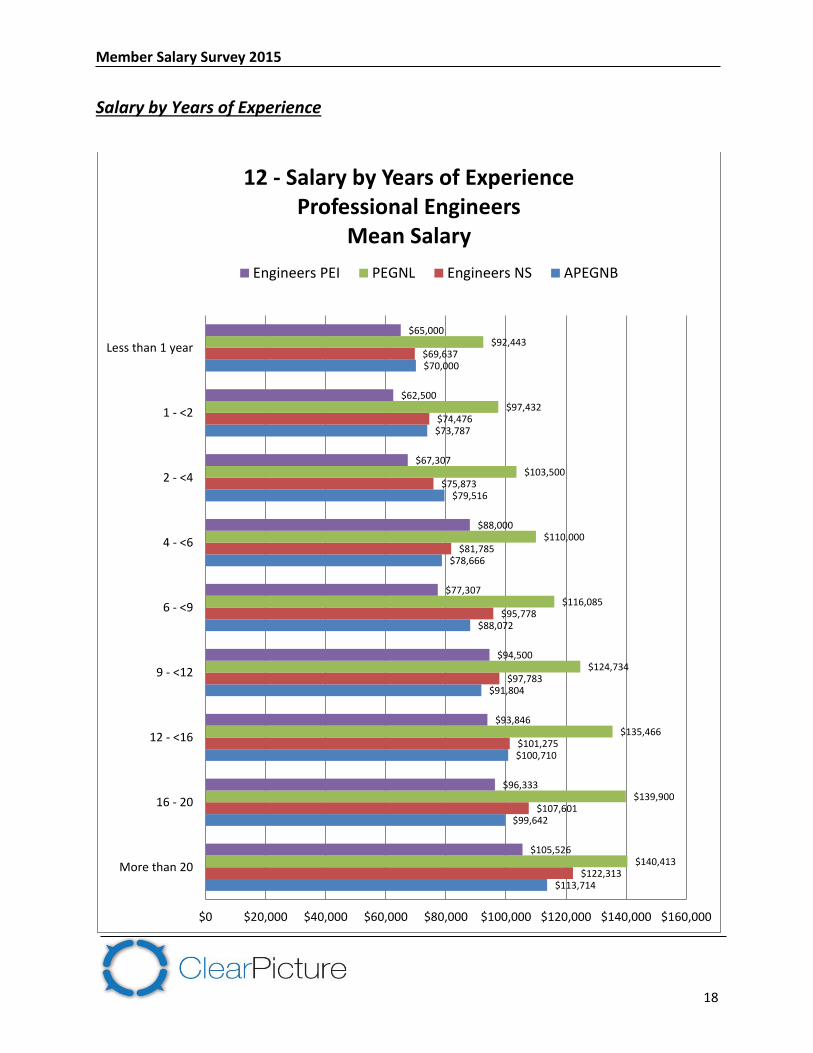
Salary by Years of Experience
$113,714
$99,642
$100,710
$91,804
$88,072
$78,666
$79,516
$73,787
$70,000
$122,313
$107,601
$101,275
$97,783
$95,778
$81,785
$75,873
$74,476
$69,637
$140,413
$139,900
$135,466
$124,734
$116,085
$110,000
$103,500
$97,432
$92,443
$105,526
$96,333
$93,846
$94,500
$77,307
$88,000
$67,307
$62,500
$65,000
$0 $20,000 $40,000 $60,000 $80,000 $100,000 $120,000 $140,000 $160,000
More than 20
16 - 20
12 - <16
9 - <12
6 - <9
4 - <6
2 - <4
1 - <2
Less than 1 year
12 - Salary by Years of ExperienceProfessional Engineers
Mean Salary
Engineers PEI PEGNL Engineers NS APEGNB
Member Salary Survey 2015
19
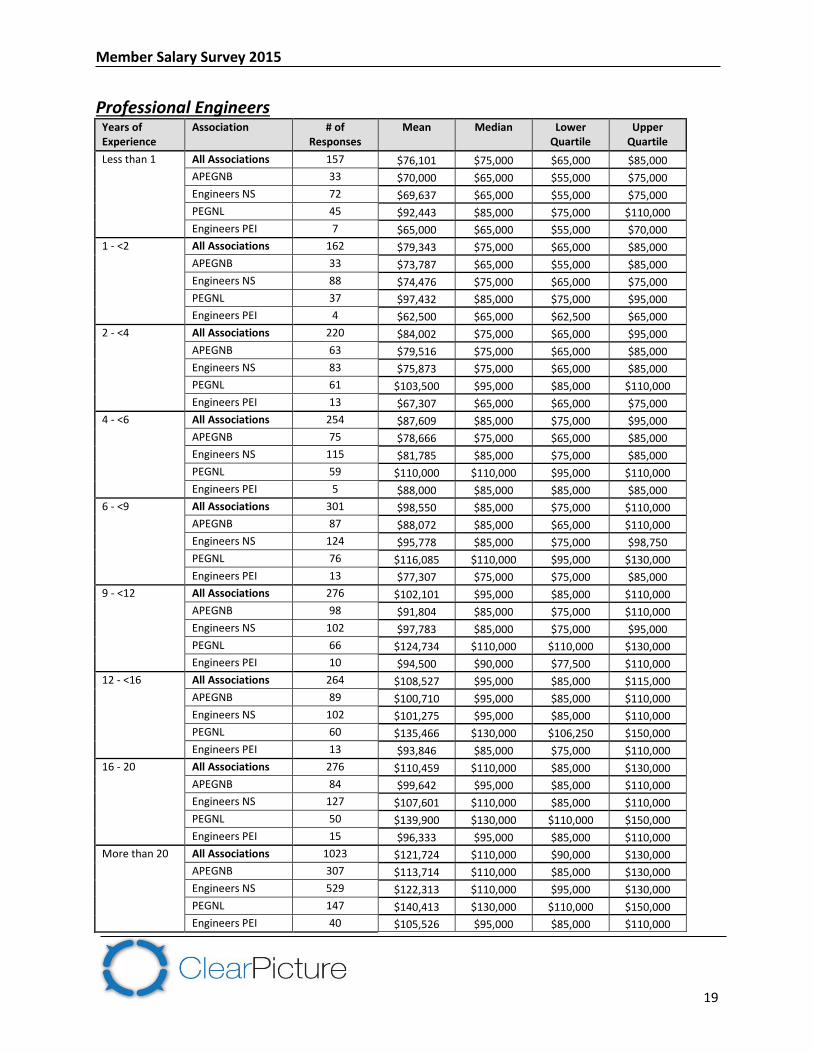
Professional Engineers Years of Experience
Association # of Responses
Mean Median Lower Quartile
Upper Quartile
Less than 1 All Associations 157 $76,101 $75,000 $65,000 $85,000
APEGNB 33 $70,000 $65,000 $55,000 $75,000
Engineers NS 72 $69,637 $65,000 $55,000 $75,000
PEGNL 45 $92,443 $85,000 $75,000 $110,000
Engineers PEI 7 $65,000 $65,000 $55,000 $70,000
1 - <2 All Associations 162 $79,343 $75,000 $65,000 $85,000
APEGNB 33 $73,787 $65,000 $55,000 $85,000
Engineers NS 88 $74,476 $75,000 $65,000 $75,000
PEGNL 37 $97,432 $85,000 $75,000 $95,000
Engineers PEI 4 $62,500 $65,000 $62,500 $65,000
2 - <4 All Associations 220 $84,002 $75,000 $65,000 $95,000
APEGNB 63 $79,516 $75,000 $65,000 $85,000
Engineers NS 83 $75,873 $75,000 $65,000 $85,000
PEGNL 61 $103,500 $95,000 $85,000 $110,000
Engineers PEI 13 $67,307 $65,000 $65,000 $75,000
4 - <6 All Associations 254 $87,609 $85,000 $75,000 $95,000
APEGNB 75 $78,666 $75,000 $65,000 $85,000
Engineers NS 115 $81,785 $85,000 $75,000 $85,000
PEGNL 59 $110,000 $110,000 $95,000 $110,000
Engineers PEI 5 $88,000 $85,000 $85,000 $85,000
6 - <9 All Associations 301 $98,550 $85,000 $75,000 $110,000
APEGNB 87 $88,072 $85,000 $65,000 $110,000
Engineers NS 124 $95,778 $85,000 $75,000 $98,750
PEGNL 76 $116,085 $110,000 $95,000 $130,000
Engineers PEI 13 $77,307 $75,000 $75,000 $85,000
9 - <12 All Associations 276 $102,101 $95,000 $85,000 $110,000
APEGNB 98 $91,804 $85,000 $75,000 $110,000
Engineers NS 102 $97,783 $85,000 $75,000 $95,000
PEGNL 66 $124,734 $110,000 $110,000 $130,000
Engineers PEI 10 $94,500 $90,000 $77,500 $110,000
12 - <16 All Associations 264 $108,527 $95,000 $85,000 $115,000
APEGNB 89 $100,710 $95,000 $85,000 $110,000
Engineers NS 102 $101,275 $95,000 $85,000 $110,000
PEGNL 60 $135,466 $130,000 $106,250 $150,000
Engineers PEI 13 $93,846 $85,000 $75,000 $110,000
16 - 20 All Associations 276 $110,459 $110,000 $85,000 $130,000
APEGNB 84 $99,642 $95,000 $85,000 $110,000
Engineers NS 127 $107,601 $110,000 $85,000 $110,000
PEGNL 50 $139,900 $130,000 $110,000 $150,000
Engineers PEI 15 $96,333 $95,000 $85,000 $110,000
More than 20 All Associations 1023 $121,724 $110,000 $90,000 $130,000
APEGNB 307 $113,714 $110,000 $85,000 $130,000
Engineers NS 529 $122,313 $110,000 $95,000 $130,000
PEGNL 147 $140,413 $130,000 $110,000 $150,000
Engineers PEI 40 $105,526 $95,000 $85,000 $110,000
Member Salary Survey 2015
20
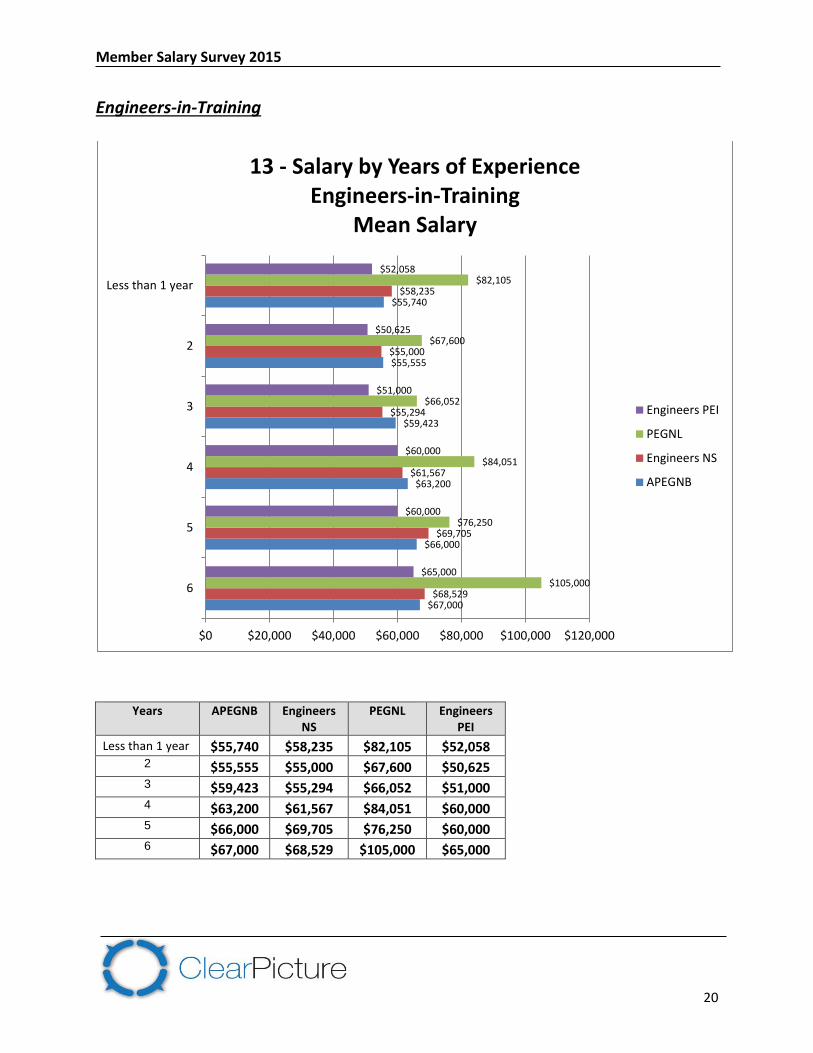
Engineers-in-Training
Years APEGNB Engineers NS
PEGNL Engineers PEI
Less than 1 year $55,740 $58,235 $82,105 $52,058 2 $55,555 $55,000 $67,600 $50,625 3 $59,423 $55,294 $66,052 $51,000 4 $63,200 $61,567 $84,051 $60,000 5 $66,000 $69,705 $76,250 $60,000 6 $67,000 $68,529 $105,000 $65,000
$67,000
$66,000
$63,200
$59,423
$55,555
$55,740
$68,529
$69,705
$61,567
$55,294
$55,000
$58,235
$105,000
$76,250
$84,051
$66,052
$67,600
$82,105
$65,000
$60,000
$60,000
$51,000
$50,625
$52,058
$0 $20,000 $40,000 $60,000 $80,000 $100,000 $120,000
6
5
4
3
2
Less than 1 year
13 - Salary by Years of Experience Engineers-in-Training
Mean Salary
Engineers PEI
PEGNL
Engineers NS
APEGNB
Member Salary Survey 2015
21
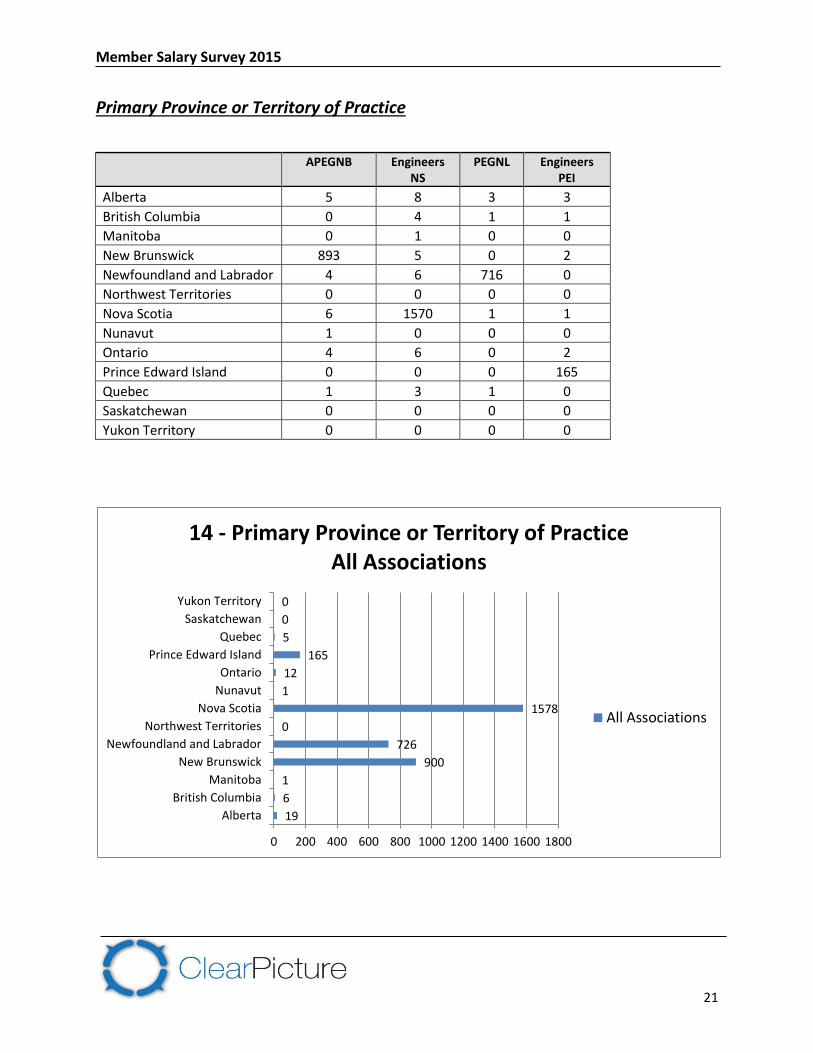
Primary Province or Territory of Practice
APEGNB Engineers NS
PEGNL Engineers PEI
Alberta 5 8 3 3
British Columbia 0 4 1 1
Manitoba 0 1 0 0
New Brunswick 893 5 0 2
Newfoundland and Labrador 4 6 716 0
Northwest Territories 0 0 0 0
Nova Scotia 6 1570 1 1
Nunavut 1 0 0 0
Ontario 4 6 0 2
Prince Edward Island 0 0 0 165
Quebec 1 3 1 0
Saskatchewan 0 0 0 0
Yukon Territory 0 0 0 0
19
6
1
900
726
0
1578
1
12
165
5
0
0
0 200 400 600 800 1000 1200 1400 1600 1800
Alberta
British Columbia
Manitoba
New Brunswick
Newfoundland and Labrador
Northwest Territories
Nova Scotia
Nunavut
Ontario
Prince Edward Island
Quebec
Saskatchewan
Yukon Territory
14 - Primary Province or Territory of PracticeAll Associations
All Associations
Member Salary Survey 2015
22
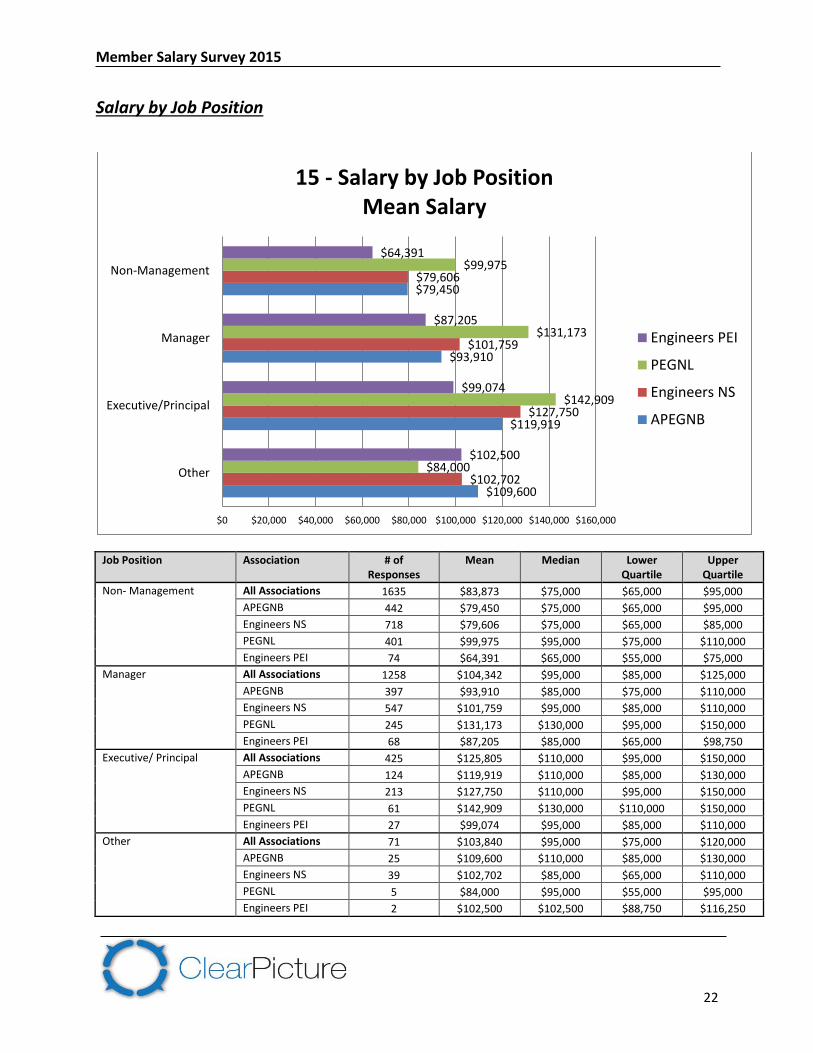
Salary by Job Position
Job Position Association # of Responses
Mean Median Lower Quartile
Upper Quartile
Non- Management All Associations 1635 $83,873 $75,000 $65,000 $95,000
APEGNB 442 $79,450 $75,000 $65,000 $95,000
Engineers NS 718 $79,606 $75,000 $65,000 $85,000
PEGNL 401 $99,975 $95,000 $75,000 $110,000
Engineers PEI 74 $64,391 $65,000 $55,000 $75,000
Manager All Associations 1258 $104,342 $95,000 $85,000 $125,000
APEGNB 397 $93,910 $85,000 $75,000 $110,000
Engineers NS 547 $101,759 $95,000 $85,000 $110,000
PEGNL 245 $131,173 $130,000 $95,000 $150,000
Engineers PEI 68 $87,205 $85,000 $65,000 $98,750
Executive/ Principal All Associations 425 $125,805 $110,000 $95,000 $150,000
APEGNB 124 $119,919 $110,000 $85,000 $130,000
Engineers NS 213 $127,750 $110,000 $95,000 $150,000
PEGNL 61 $142,909 $130,000 $110,000 $150,000
Engineers PEI 27 $99,074 $95,000 $85,000 $110,000
Other All Associations 71 $103,840 $95,000 $75,000 $120,000
APEGNB 25 $109,600 $110,000 $85,000 $130,000
Engineers NS 39 $102,702 $85,000 $65,000 $110,000
PEGNL 5 $84,000 $95,000 $55,000 $95,000
Engineers PEI 2 $102,500 $102,500 $88,750 $116,250
$109,600
$119,919
$93,910
$79,450
$102,702
$127,750
$101,759
$79,606
$84,000
$142,909
$131,173
$99,975
$102,500
$99,074
$87,205
$64,391
$0 $20,000 $40,000 $60,000 $80,000 $100,000 $120,000 $140,000 $160,000
Other
Executive/Principal
Manager
Non-Management
15 - Salary by Job PositionMean Salary
Engineers PEI
PEGNL
Engineers NS
APEGNB
Member Salary Survey 2015
23
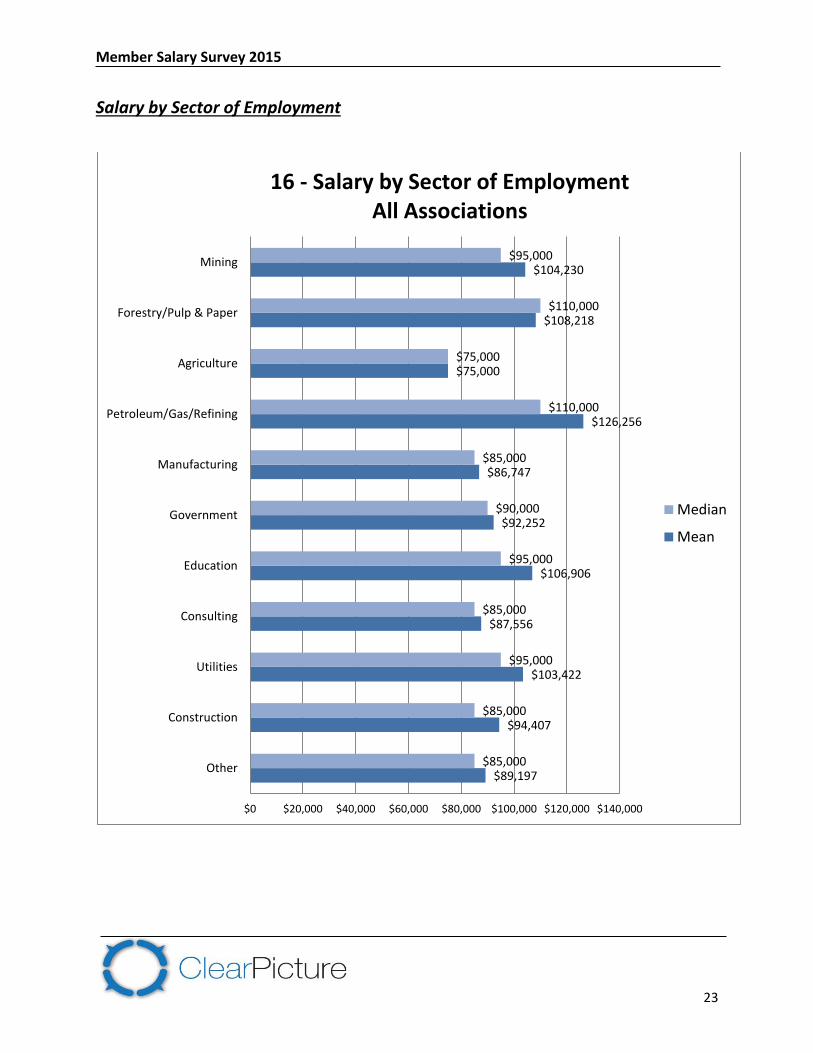
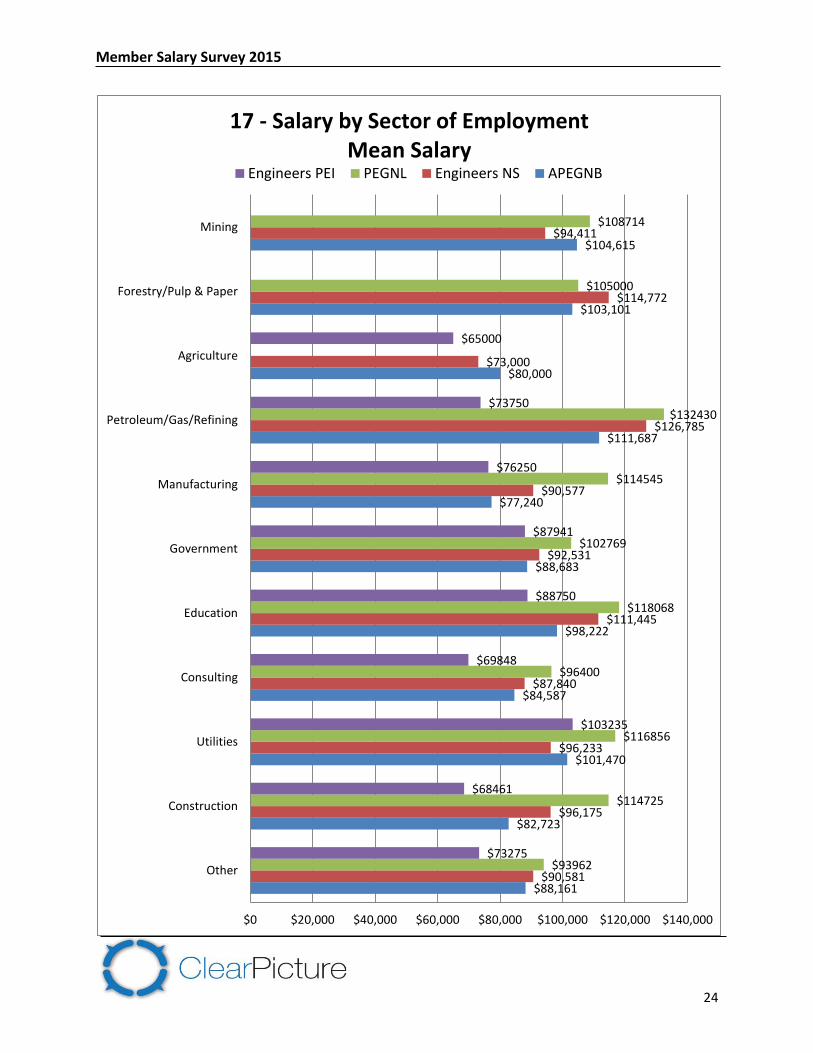
Salary by Sector of Employment
$89,197
$94,407
$103,422
$87,556
$106,906
$92,252
$86,747
$126,256
$75,000
$108,218
$104,230
$85,000
$85,000
$95,000
$85,000
$95,000
$90,000
$85,000
$110,000
$75,000
$110,000
$95,000
$0 $20,000 $40,000 $60,000 $80,000 $100,000 $120,000 $140,000
Other
Construction
Utilities
Consulting
Education
Government
Manufacturing
Petroleum/Gas/Refining
Agriculture
Forestry/Pulp & Paper
Mining
16 - Salary by Sector of EmploymentAll Associations
Median
Mean
Member Salary Survey 2015
24
$88,161
$82,723
$101,470
$84,587
$98,222
$88,683
$77,240
$111,687
$80,000
$103,101
$104,615
$90,581
$96,175
$96,233
$87,840
$111,445
$92,531
$90,577
$126,785
$73,000
$114,772
$94,411
$93962
$114725
$116856
$96400
$118068
$102769
$114545
$132430
$105000
$108714
$73275
$68461
$103235
$69848
$88750
$87941
$76250
$73750
$65000
$0 $20,000 $40,000 $60,000 $80,000 $100,000 $120,000 $140,000
Other
Construction
Utilities
Consulting
Education
Government
Manufacturing
Petroleum/Gas/Refining
Agriculture
Forestry/Pulp & Paper
Mining
17 - Salary by Sector of EmploymentMean Salary
Engineers PEI PEGNL Engineers NS APEGNB
Member Salary Survey 2015
25
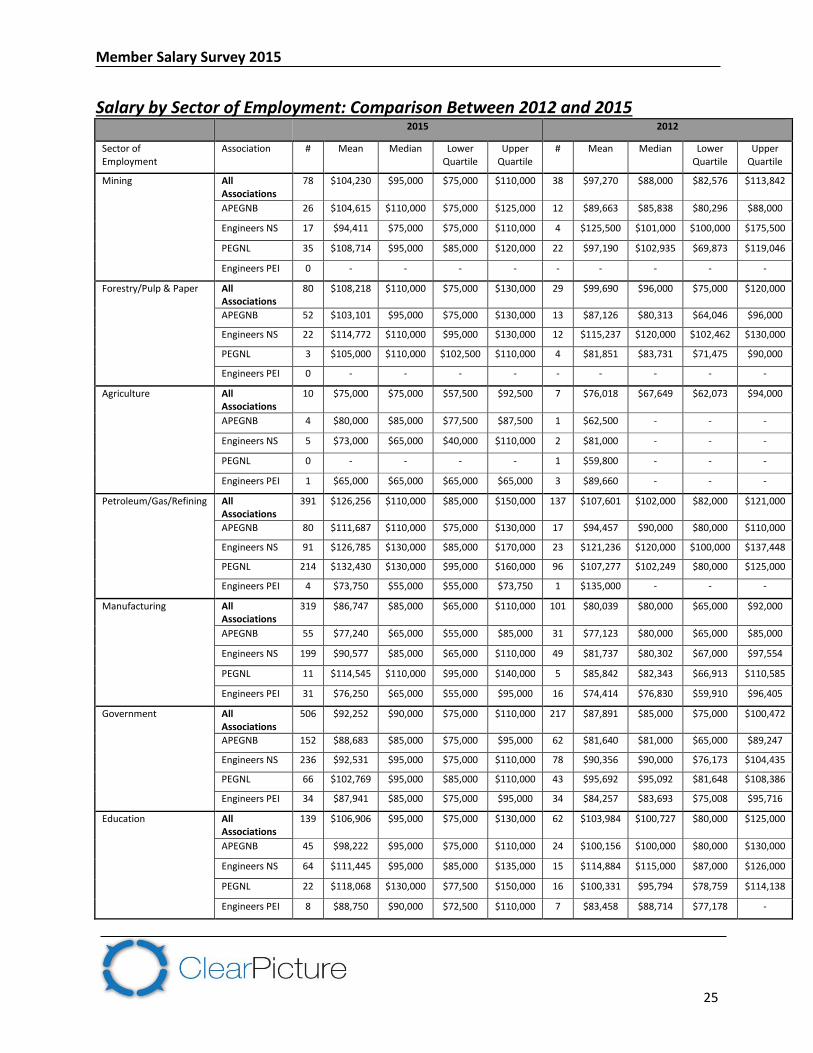
Salary by Sector of Employment: Comparison Between 2012 and 2015 2015 2012
Sector of Employment
Association # Mean Median Lower Quartile
Upper Quartile
# Mean Median Lower Quartile
Upper Quartile
Mining All Associations
78 $104,230 $95,000 $75,000 $110,000 38 $97,270 $88,000 $82,576 $113,842
APEGNB 26 $104,615 $110,000 $75,000 $125,000 12 $89,663 $85,838 $80,296 $88,000
Engineers NS 17 $94,411 $75,000 $75,000 $110,000 4 $125,500 $101,000 $100,000 $175,500
PEGNL 35 $108,714 $95,000 $85,000 $120,000 22 $97,190 $102,935 $69,873 $119,046
Engineers PEI 0 - - - - - - - - -
Forestry/Pulp & Paper All Associations
80 $108,218 $110,000 $75,000 $130,000 29 $99,690 $96,000 $75,000 $120,000
APEGNB 52 $103,101 $95,000 $75,000 $130,000 13 $87,126 $80,313 $64,046 $96,000
Engineers NS 22 $114,772 $110,000 $95,000 $130,000 12 $115,237 $120,000 $102,462 $130,000
PEGNL 3 $105,000 $110,000 $102,500 $110,000 4 $81,851 $83,731 $71,475 $90,000
Engineers PEI 0 - - - - - - - - -
Agriculture All Associations
10 $75,000 $75,000 $57,500 $92,500 7 $76,018 $67,649 $62,073 $94,000
APEGNB 4 $80,000 $85,000 $77,500 $87,500 1 $62,500 - - -
Engineers NS 5 $73,000 $65,000 $40,000 $110,000 2 $81,000 - - -
PEGNL 0 - - - - 1 $59,800 - - -
Engineers PEI 1 $65,000 $65,000 $65,000 $65,000 3 $89,660 - - -
Petroleum/Gas/Refining All Associations
391 $126,256 $110,000 $85,000 $150,000 137 $107,601 $102,000 $82,000 $121,000
APEGNB 80 $111,687 $110,000 $75,000 $130,000 17 $94,457 $90,000 $80,000 $110,000
Engineers NS 91 $126,785 $130,000 $85,000 $170,000 23 $121,236 $120,000 $100,000 $137,448
PEGNL 214 $132,430 $130,000 $95,000 $160,000 96 $107,277 $102,249 $80,000 $125,000
Engineers PEI 4 $73,750 $55,000 $55,000 $73,750 1 $135,000 - - -
Manufacturing All Associations
319 $86,747 $85,000 $65,000 $110,000 101 $80,039 $80,000 $65,000 $92,000
APEGNB 55 $77,240 $65,000 $55,000 $85,000 31 $77,123 $80,000 $65,000 $85,000
Engineers NS 199 $90,577 $85,000 $65,000 $110,000 49 $81,737 $80,302 $67,000 $97,554
PEGNL 11 $114,545 $110,000 $95,000 $140,000 5 $85,842 $82,343 $66,913 $110,585
Engineers PEI 31 $76,250 $65,000 $55,000 $95,000 16 $74,414 $76,830 $59,910 $96,405
Government All Associations
506 $92,252 $90,000 $75,000 $110,000 217 $87,891 $85,000 $75,000 $100,472
APEGNB 152 $88,683 $85,000 $75,000 $95,000 62 $81,640 $81,000 $65,000 $89,247
Engineers NS 236 $92,531 $95,000 $75,000 $110,000 78 $90,356 $90,000 $76,173 $104,435
PEGNL 66 $102,769 $95,000 $85,000 $110,000 43 $95,692 $95,092 $81,648 $108,386
Engineers PEI 34 $87,941 $85,000 $75,000 $95,000 34 $84,257 $83,693 $75,008 $95,716
Education All Associations
139 $106,906 $95,000 $75,000 $130,000 62 $103,984 $100,727 $80,000 $125,000
APEGNB 45 $98,222 $95,000 $75,000 $110,000 24 $100,156 $100,000 $80,000 $130,000
Engineers NS 64 $111,445 $95,000 $85,000 $135,000 15 $114,884 $115,000 $87,000 $126,000
PEGNL 22 $118,068 $130,000 $77,500 $150,000 16 $100,331 $95,794 $78,759 $114,138
Engineers PEI 8 $88,750 $90,000 $72,500 $110,000 7 $83,458 $88,714 $77,178 -
Member Salary Survey 2015
26
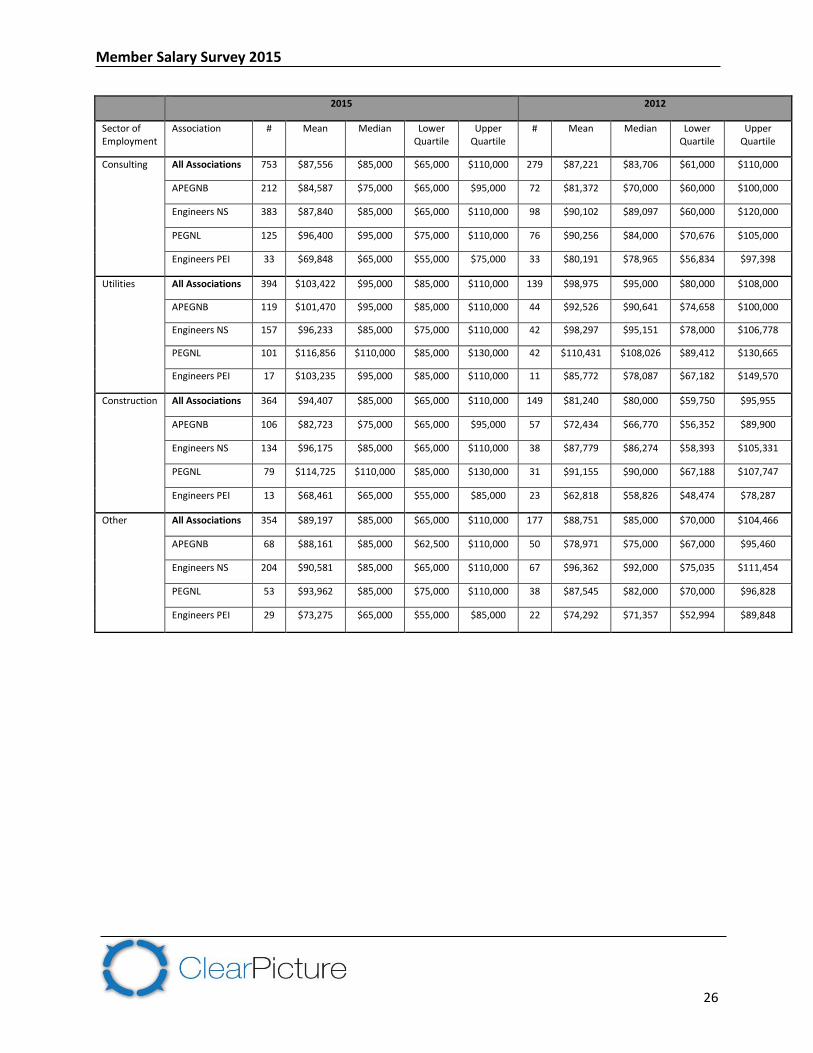
2015 2012
Sector of Employment
Association # Mean Median Lower Quartile
Upper Quartile
# Mean Median Lower Quartile
Upper Quartile
Consulting All Associations 753 $87,556 $85,000 $65,000 $110,000 279 $87,221 $83,706 $61,000 $110,000
APEGNB 212 $84,587 $75,000 $65,000 $95,000 72 $81,372 $70,000 $60,000 $100,000
Engineers NS 383 $87,840 $85,000 $65,000 $110,000 98 $90,102 $89,097 $60,000 $120,000
PEGNL 125 $96,400 $95,000 $75,000 $110,000 76 $90,256 $84,000 $70,676 $105,000
Engineers PEI 33 $69,848 $65,000 $55,000 $75,000 33 $80,191 $78,965 $56,834 $97,398
Utilities All Associations 394 $103,422 $95,000 $85,000 $110,000 139 $98,975 $95,000 $80,000 $108,000
APEGNB 119 $101,470 $95,000 $85,000 $110,000 44 $92,526 $90,641 $74,658 $100,000
Engineers NS 157 $96,233 $85,000 $75,000 $110,000 42 $98,297 $95,151 $78,000 $106,778
PEGNL 101 $116,856 $110,000 $85,000 $130,000 42 $110,431 $108,026 $89,412 $130,665
Engineers PEI 17 $103,235 $95,000 $85,000 $110,000 11 $85,772 $78,087 $67,182 $149,570
Construction All Associations 364 $94,407 $85,000 $65,000 $110,000 149 $81,240 $80,000 $59,750 $95,955
APEGNB 106 $82,723 $75,000 $65,000 $95,000 57 $72,434 $66,770 $56,352 $89,900
Engineers NS 134 $96,175 $85,000 $65,000 $110,000 38 $87,779 $86,274 $58,393 $105,331
PEGNL 79 $114,725 $110,000 $85,000 $130,000 31 $91,155 $90,000 $67,188 $107,747
Engineers PEI 13 $68,461 $65,000 $55,000 $85,000 23 $62,818 $58,826 $48,474 $78,287
Other All Associations 354 $89,197 $85,000 $65,000 $110,000 177 $88,751 $85,000 $70,000 $104,466
APEGNB 68 $88,161 $85,000 $62,500 $110,000 50 $78,971 $75,000 $67,000 $95,460
Engineers NS 204 $90,581 $85,000 $65,000 $110,000 67 $96,362 $92,000 $75,035 $111,454
PEGNL 53 $93,962 $85,000 $75,000 $110,000 38 $87,545 $82,000 $70,000 $96,828
Engineers PEI 29 $73,275 $65,000 $55,000 $85,000 22 $74,292 $71,357 $52,994 $89,848
Member Salary Survey 2015
27
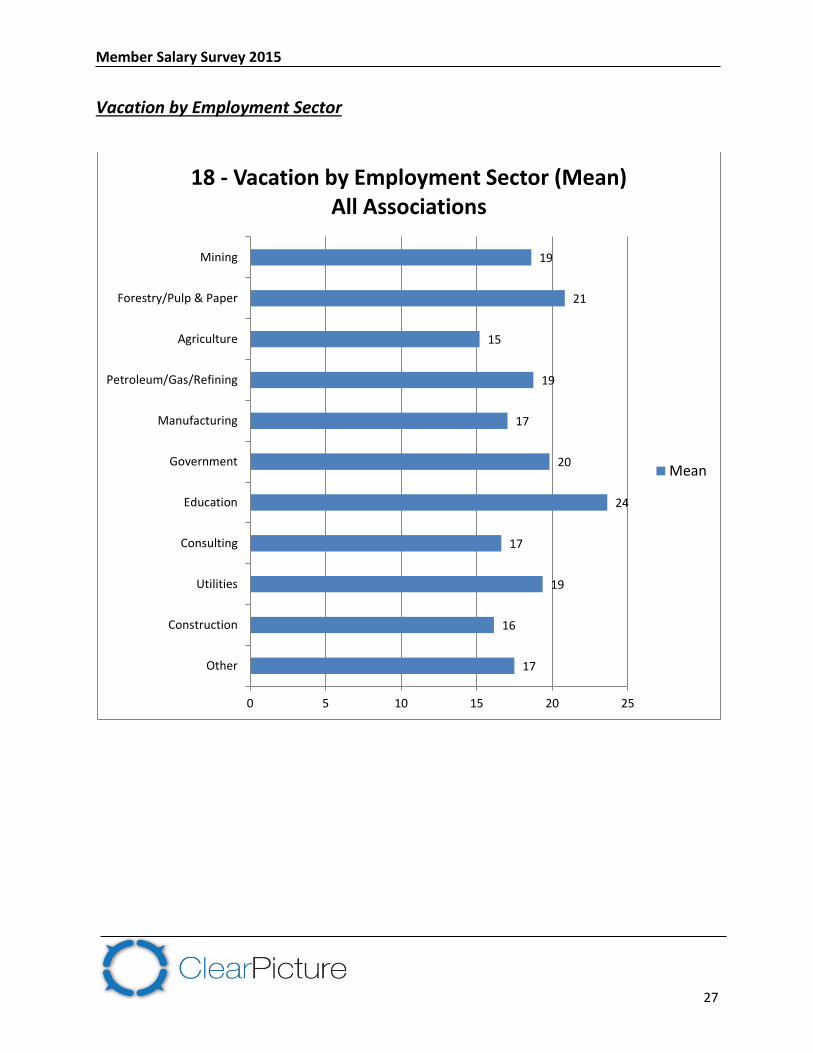
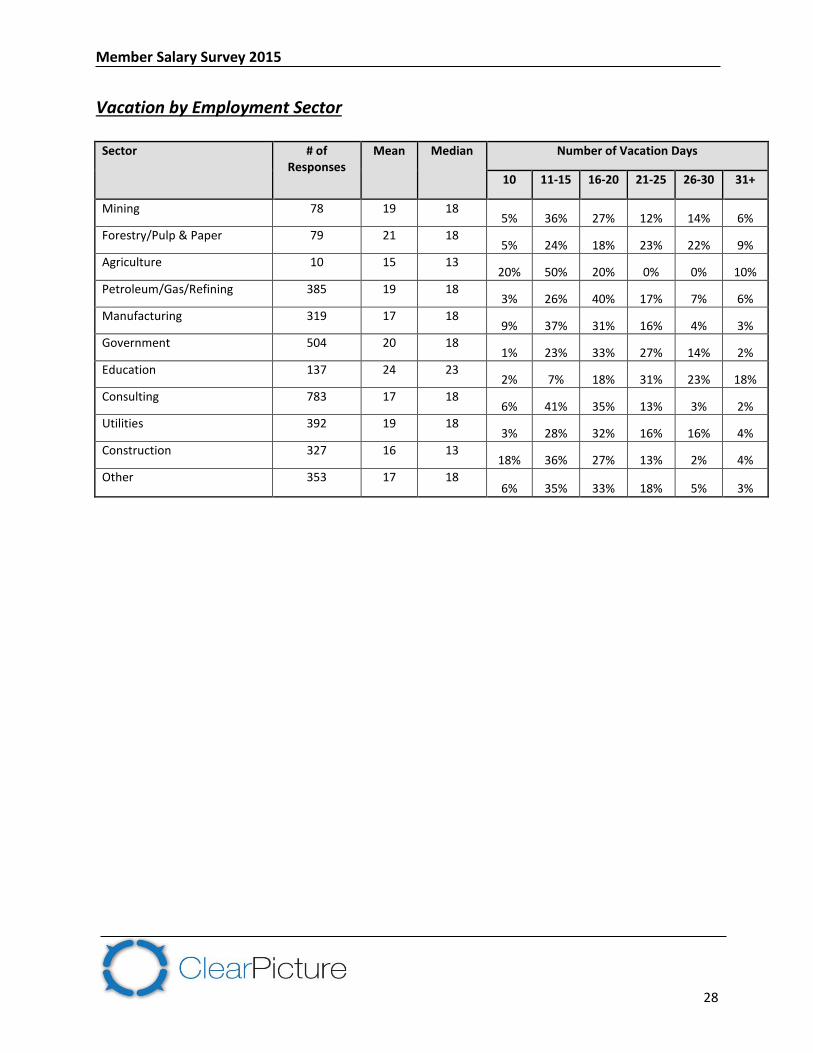
Vacation by Employment Sector
17
16
19
17
24
20
17
19
15
21
19
0 5 10 15 20 25
Other
Construction
Utilities
Consulting
Education
Government
Manufacturing
Petroleum/Gas/Refining
Agriculture
Forestry/Pulp & Paper
Mining
18 - Vacation by Employment Sector (Mean)All Associations
Mean
Member Salary Survey 2015
28
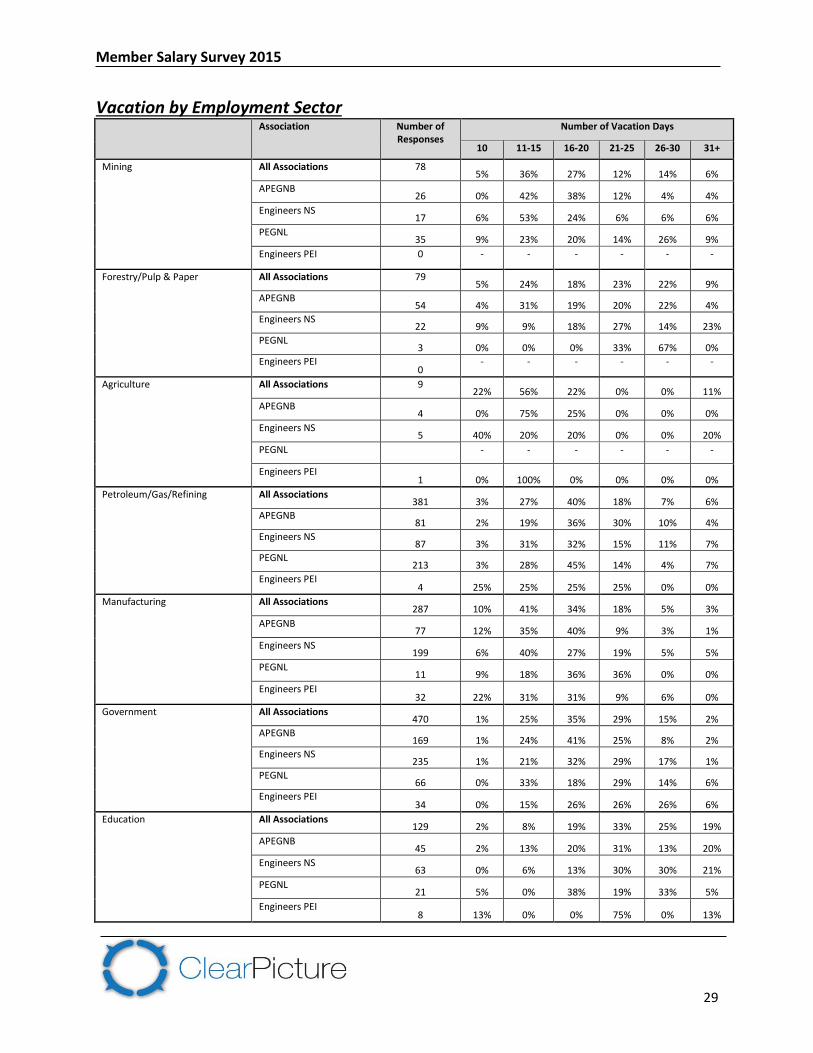
Vacation by Employment Sector
Sector # of Responses
Mean Median Number of Vacation Days
10 11-15 16-20 21-25 26-30 31+
Mining 78 19 18 5% 36% 27% 12% 14% 6%
Forestry/Pulp & Paper 79 21 18 5% 24% 18% 23% 22% 9%
Agriculture 10 15 13 20% 50% 20% 0% 0% 10%
Petroleum/Gas/Refining 385 19 18 3% 26% 40% 17% 7% 6%
Manufacturing 319 17 18 9% 37% 31% 16% 4% 3%
Government 504 20 18 1% 23% 33% 27% 14% 2%
Education 137 24 23 2% 7% 18% 31% 23% 18%
Consulting 783 17 18 6% 41% 35% 13% 3% 2%
Utilities 392 19 18 3% 28% 32% 16% 16% 4%
Construction 327 16 13 18% 36% 27% 13% 2% 4%
Other 353 17 18 6% 35% 33% 18% 5% 3%
Member Salary Survey 2015
29
Vacation by Employment Sector Association Number of
Responses Number of Vacation Days
10 11-15 16-20 21-25 26-30 31+
Mining All Associations 78 5% 36% 27% 12% 14% 6%
APEGNB 26 0% 42% 38% 12% 4% 4%
Engineers NS 17 6% 53% 24% 6% 6% 6%
PEGNL 35 9% 23% 20% 14% 26% 9%
Engineers PEI 0 - - - - - -
Forestry/Pulp & Paper All Associations 79 5% 24% 18% 23% 22% 9%
APEGNB 54 4% 31% 19% 20% 22% 4%
Engineers NS 22 9% 9% 18% 27% 14% 23%
PEGNL 3 0% 0% 0% 33% 67% 0%
Engineers PEI 0
- - - - - -
Agriculture All Associations 9 22% 56% 22% 0% 0% 11%
APEGNB 4 0% 75% 25% 0% 0% 0%
Engineers NS 5 40% 20% 20% 0% 0% 20%
PEGNL
- - - - - -
Engineers PEI 1 0% 100% 0% 0% 0% 0%
Petroleum/Gas/Refining All Associations 381 3% 27% 40% 18% 7% 6%
APEGNB 81 2% 19% 36% 30% 10% 4%
Engineers NS 87 3% 31% 32% 15% 11% 7%
PEGNL 213 3% 28% 45% 14% 4% 7%
Engineers PEI 4 25% 25% 25% 25% 0% 0%
Manufacturing All Associations 287 10% 41% 34% 18% 5% 3%
APEGNB 77 12% 35% 40% 9% 3% 1%
Engineers NS 199 6% 40% 27% 19% 5% 5%
PEGNL 11 9% 18% 36% 36% 0% 0%
Engineers PEI 32 22% 31% 31% 9% 6% 0%
Government All Associations 470 1% 25% 35% 29% 15% 2%
APEGNB 169 1% 24% 41% 25% 8% 2%
Engineers NS 235 1% 21% 32% 29% 17% 1%
PEGNL 66 0% 33% 18% 29% 14% 6%
Engineers PEI 34 0% 15% 26% 26% 26% 6%
Education All Associations 129 2% 8% 19% 33% 25% 19%
APEGNB 45 2% 13% 20% 31% 13% 20%
Engineers NS 63 0% 6% 13% 30% 30% 21%
PEGNL 21 5% 0% 38% 19% 33% 5%
Engineers PEI 8 13% 0% 0% 75% 0% 13%
Member Salary Survey 2015
30
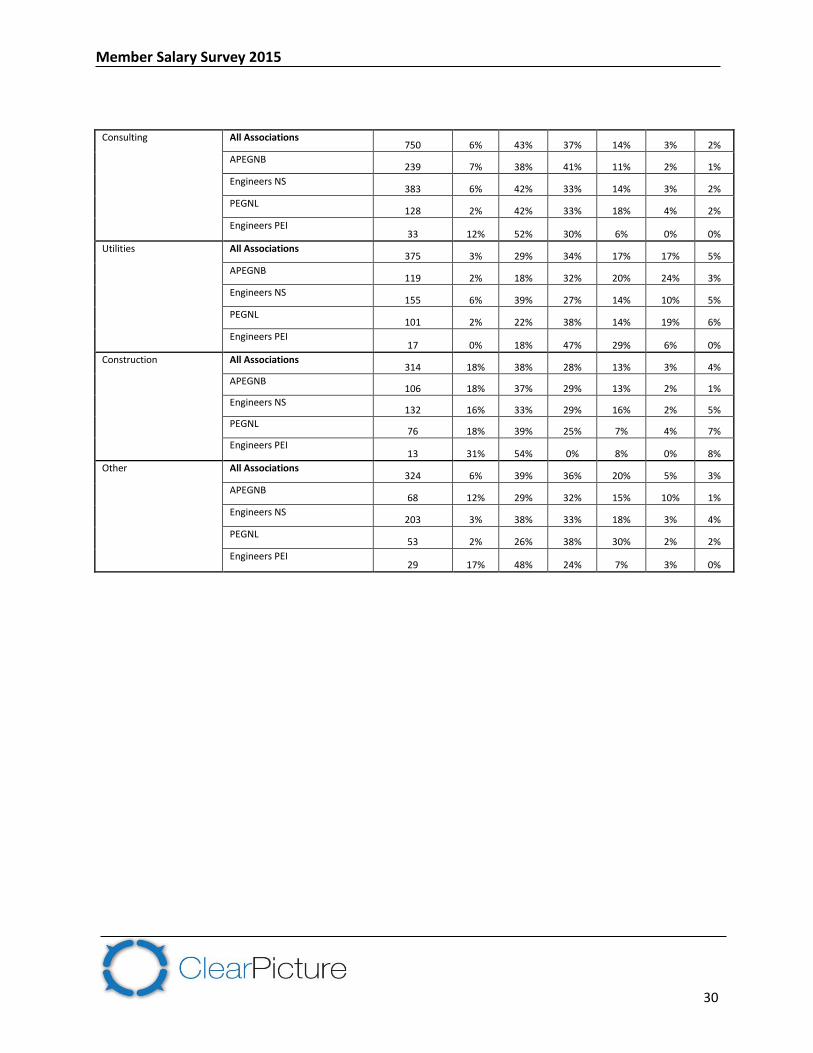
Consulting All Associations 750 6% 43% 37% 14% 3% 2%
APEGNB 239 7% 38% 41% 11% 2% 1%
Engineers NS 383 6% 42% 33% 14% 3% 2%
PEGNL 128 2% 42% 33% 18% 4% 2%
Engineers PEI 33 12% 52% 30% 6% 0% 0%
Utilities All Associations 375 3% 29% 34% 17% 17% 5%
APEGNB 119 2% 18% 32% 20% 24% 3%
Engineers NS 155 6% 39% 27% 14% 10% 5%
PEGNL 101 2% 22% 38% 14% 19% 6%
Engineers PEI 17 0% 18% 47% 29% 6% 0%
Construction All Associations 314 18% 38% 28% 13% 3% 4%
APEGNB 106 18% 37% 29% 13% 2% 1%
Engineers NS 132 16% 33% 29% 16% 2% 5%
PEGNL 76 18% 39% 25% 7% 4% 7%
Engineers PEI 13 31% 54% 0% 8% 0% 8%
Other All Associations 324 6% 39% 36% 20% 5% 3%
APEGNB 68 12% 29% 32% 15% 10% 1%
Engineers NS 203 3% 38% 33% 18% 3% 4%
PEGNL 53 2% 26% 38% 30% 2% 2%
Engineers PEI 29 17% 48% 24% 7% 3% 0%
Member Salary Survey 2015
31
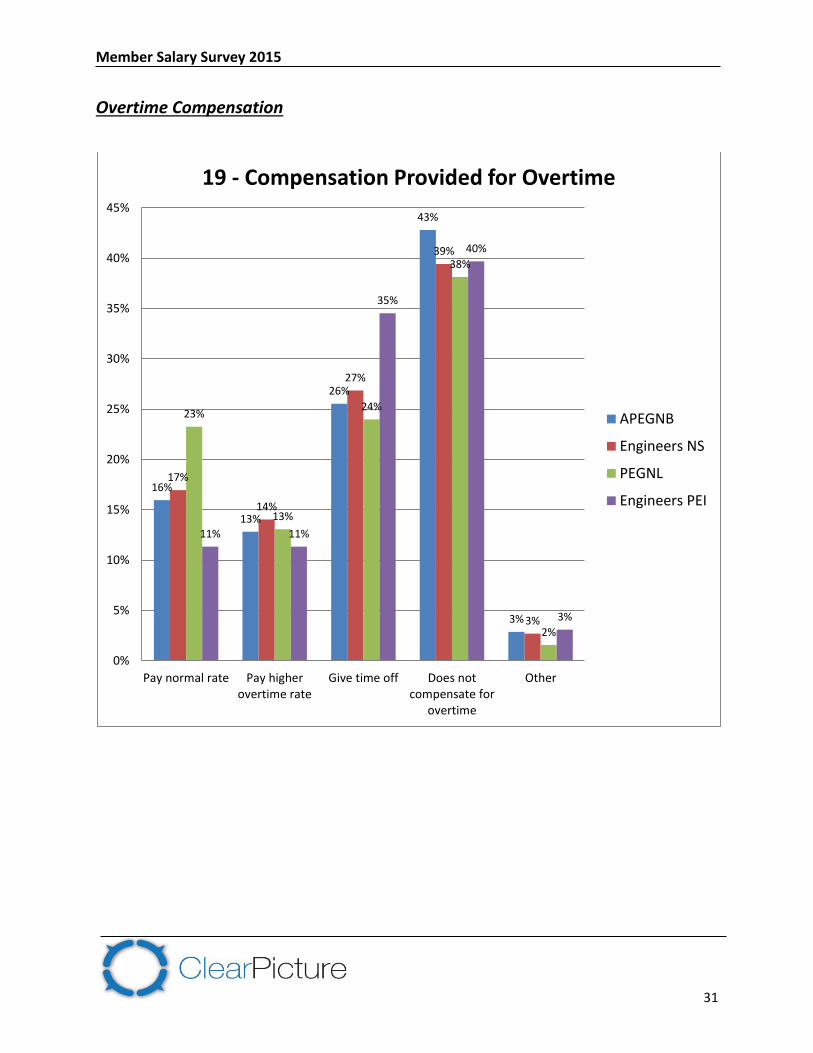
Overtime Compensation
16%
13%
26%
43%
3%
17%
14%
27%
39%
3%
23%
13%
24%
38%
2%
11% 11%
35%
40%
3%
0%
5%
10%
15%
20%
25%
30%
35%
40%
45%
Pay normal rate Pay higherovertime rate
Give time off Does notcompensate for
overtime
Other
19 - Compensation Provided for Overtime
APEGNB
Engineers NS
PEGNL
Engineers PEI
Member Salary Survey 2015
32
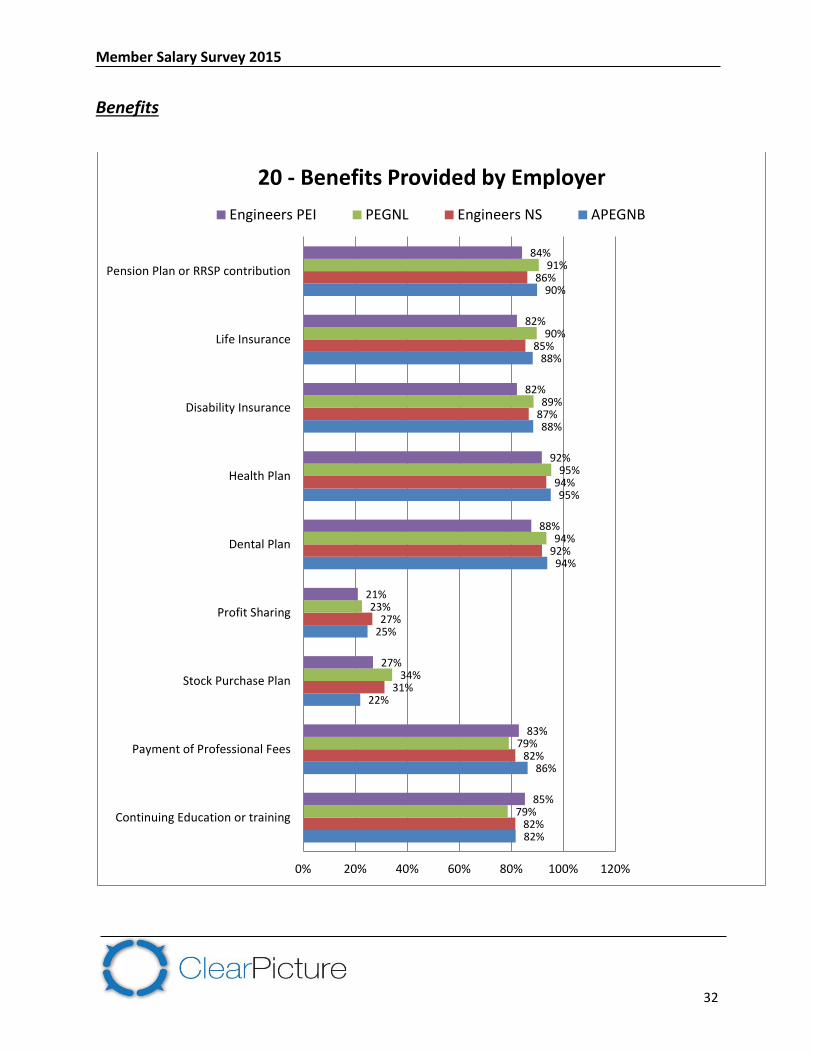
Benefits
82%
86%
22%
25%
94%
95%
88%
88%
90%
82%
82%
31%
27%
92%
94%
87%
85%
86%
79%
79%
34%
23%
94%
95%
89%
90%
91%
85%
83%
27%
21%
88%
92%
82%
82%
84%
0% 20% 40% 60% 80% 100% 120%
Continuing Education or training
Payment of Professional Fees
Stock Purchase Plan
Profit Sharing
Dental Plan
Health Plan
Disability Insurance
Life Insurance
Pension Plan or RRSP contribution
20 - Benefits Provided by Employer
Engineers PEI PEGNL Engineers NS APEGNB
Member Salary Survey 2015
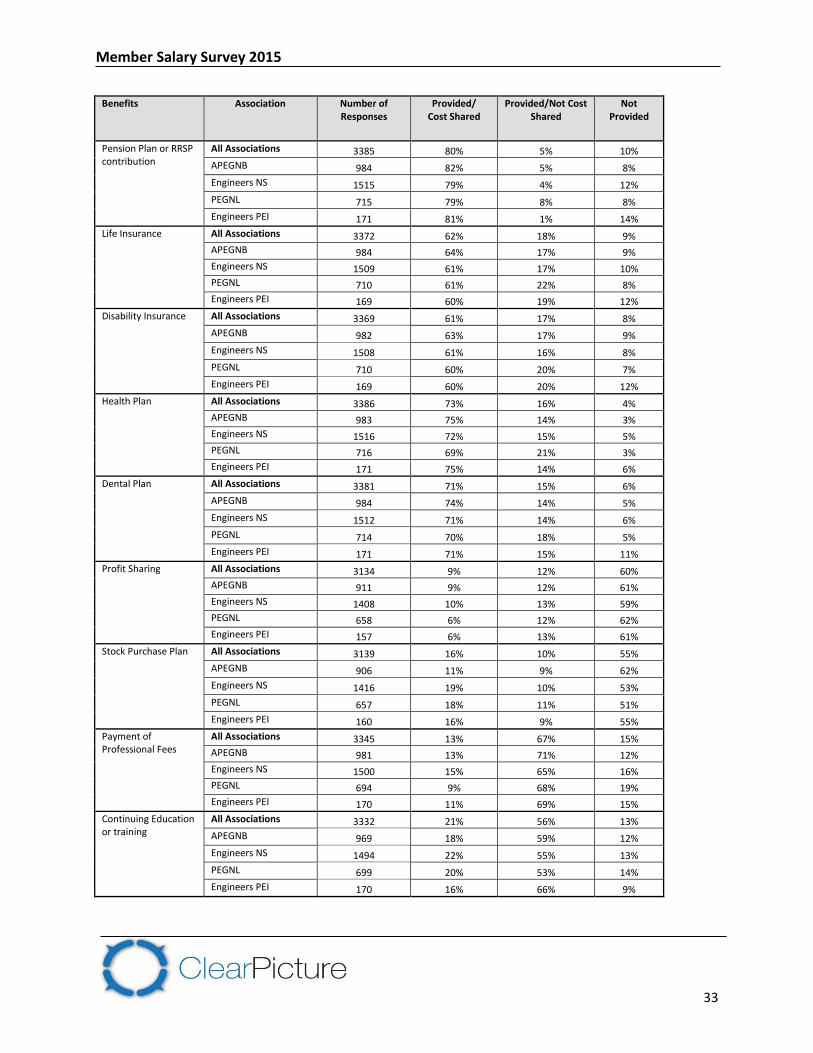
33
Benefits Association Number of Responses
Provided/ Cost Shared
Provided/Not Cost Shared
Not Provided
Pension Plan or RRSP contribution
All Associations 3385 80% 5% 10%
APEGNB 984 82% 5% 8%
Engineers NS 1515 79% 4% 12%
PEGNL 715 79% 8% 8%
Engineers PEI 171 81% 1% 14%
Life Insurance All Associations 3372 62% 18% 9%
APEGNB 984 64% 17% 9%
Engineers NS 1509 61% 17% 10%
PEGNL 710 61% 22% 8%
Engineers PEI 169 60% 19% 12%
Disability Insurance All Associations 3369 61% 17% 8%
APEGNB 982 63% 17% 9%
Engineers NS 1508 61% 16% 8%
PEGNL 710 60% 20% 7%
Engineers PEI 169 60% 20% 12%
Health Plan All Associations 3386 73% 16% 4%
APEGNB 983 75% 14% 3%
Engineers NS 1516 72% 15% 5%
PEGNL 716 69% 21% 3%
Engineers PEI 171 75% 14% 6%
Dental Plan All Associations 3381 71% 15% 6%
APEGNB 984 74% 14% 5%
Engineers NS 1512 71% 14% 6%
PEGNL 714 70% 18% 5%
Engineers PEI 171 71% 15% 11%
Profit Sharing All Associations 3134 9% 12% 60%
APEGNB 911 9% 12% 61%
Engineers NS 1408 10% 13% 59%
PEGNL 658 6% 12% 62%
Engineers PEI 157 6% 13% 61%
Stock Purchase Plan All Associations 3139 16% 10% 55%
APEGNB 906 11% 9% 62%
Engineers NS 1416 19% 10% 53%
PEGNL 657 18% 11% 51%
Engineers PEI 160 16% 9% 55%
Payment of Professional Fees
All Associations 3345 13% 67% 15%
APEGNB 981 13% 71% 12%
Engineers NS 1500 15% 65% 16%
PEGNL 694 9% 68% 19%
Engineers PEI 170 11% 69% 15%
Continuing Education or training
All Associations 3332 21% 56% 13%
APEGNB 969 18% 59% 12%
Engineers NS 1494 22% 55% 13%
PEGNL 699 20% 53% 14%
Engineers PEI 170 16% 66% 9%
Member Salary Survey 2015
34
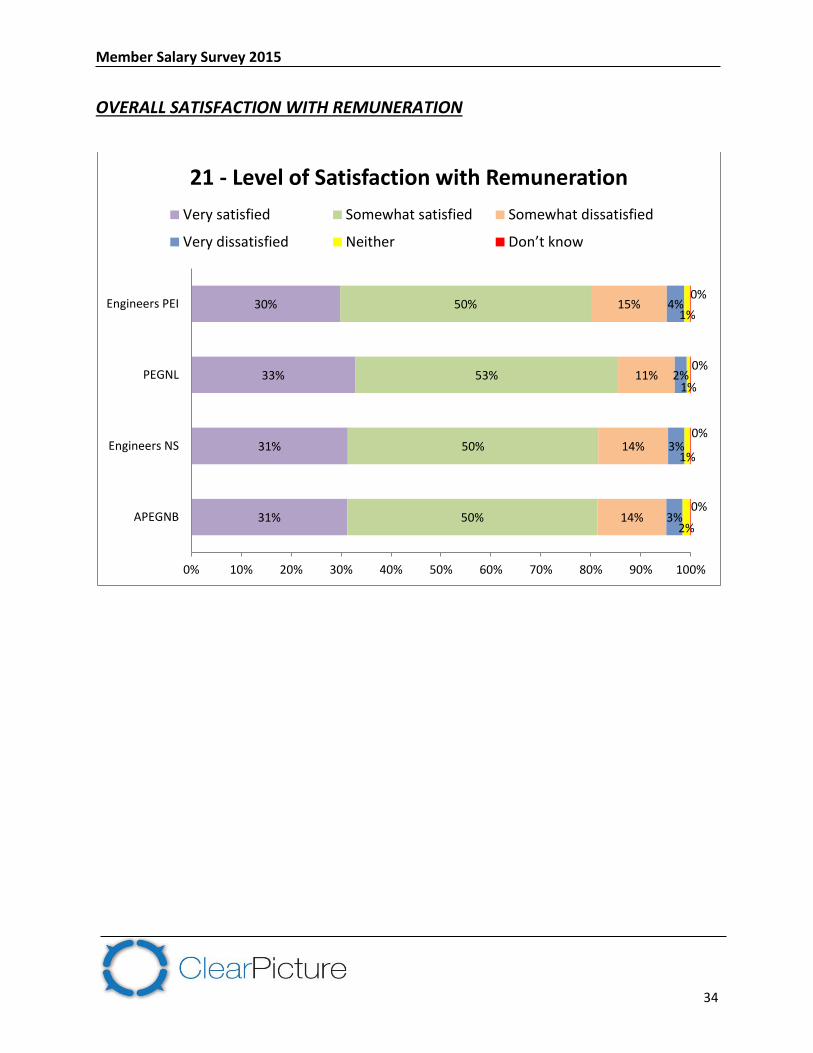
OVERALL SATISFACTION WITH REMUNERATION
31%
31%
33%
30%
50%
50%
53%
50%
14%
14%
11%
15%
3%
3%
2%
4%
2%
1%
1%
1%
0%
0%
0%
0%
0% 10% 20% 30% 40% 50% 60% 70% 80% 90% 100%
APEGNB
Engineers NS
PEGNL
Engineers PEI
21 - Level of Satisfaction with Remuneration
Very satisfied Somewhat satisfied Somewhat dissatisfied
Very dissatisfied Neither Don’t know