Atlant-KIS Audit Report September 2010
42
AUDIT REPORT Knowledge Intensive Services Supply and Demand in Portugal Agência de Inovação September 2010
-
Upload
jose-miguel-gameiro -
Category
Documents
-
view
226 -
download
0
Transcript of Atlant-KIS Audit Report September 2010

8/8/2019 Atlant-KIS Audit Report September 2010
http://slidepdf.com/reader/full/atlant-kis-audit-report-september-2010 1/42
AUDIT REPORT
Knowledge Intensive ServicesSupply and Demand in Portugal

8/8/2019 Atlant-KIS Audit Report September 2010
http://slidepdf.com/reader/full/atlant-kis-audit-report-september-2010 2/42
Index:
1. INTRODUCTION 4
CONTEXT 4
OBJECTIVES 5
PARTNERSHIP 5
INNOVATIVE ASPECTS OF THE PROJECT 6
2. REGIONAL SUPPLY - COMPANIES 8
2.1 Companies typology 8
2.2 Services Provided 10
2.3 Clients 11
2.4 Human Resources 13
2.5 Barriers 14
2.6 Supports 15
2.7 Networking and Internationalization 17
2.8 Future 18
REGIONAL SUPPLY - Universities 19
2.9 Universities typology 19
2.10 Services Provided 19
2.11 Clients 20

8/8/2019 Atlant-KIS Audit Report September 2010
http://slidepdf.com/reader/full/atlant-kis-audit-report-september-2010 3/42
A u d i t M ar k e t
3.1 Companies details 27
3.2 Innovation 29
3.3 KIS Service Requirements 30
3.4 Barriers 33
3.5 Supports 34
3.6 Future 35
4. CONCLUSIONS 36
4.1 MAIN RESULTS FROM THE AUDIT 36
Supply 36
Demand 36
4.2 MAIN RESULTS FROM MATRIX OF COMPETENCIES SUPPLY-DEMAND KIS SECTOR - Annex1 37
4.3 MAIN RESULTS FROM MATRIX OF SECTOR SPECIALISATION OF THE DEMAND ANDSERVICES REQUESTED – Annex 2 37
5. RECOMMENDATIONS 38
CREATION OF A NATIONAL STRATEGY FOR KIS SECTOR: 38
PROMOTE AND IMPROVE THE LINK BETWEEN COMPANIES AND UNIVERSITIES: 38
PROMOTE AN INNOVATION CULTURE: 38
SIMPLIFICATION OF THE PROCEDURES IN THE NATIONAL SUPPORT PROGRAMS: 39
6. ANNEXES 40
Annex 1 - MATRIX OF COMPETENCIES SUPPLY-DEMAND KIS SECTOR 41
Annex 2 - MATRIX OF SECTOR SPECIALISATION OF THE DEMAND AND SERVICES REQUESTED 42

8/8/2019 Atlant-KIS Audit Report September 2010
http://slidepdf.com/reader/full/atlant-kis-audit-report-september-2010 4/42
A u d i t M ar k e t
1.INTRODUCTION
CONTEXT
The achievement of the Lisbon Strategy Target Objectives demands the delivery of innovative efforts inorder to overcome the European paradox on terms of Technology and Knowledge Transfer (TKT), if
Europe is to become the most competitive economic area of the world.
Different cultural mindsets among Knowledge providers and SMEs hinder TKT at the EU level, andspecifically at the Atlantic Area, as pointed out in the Programme's SWOT analysis (pages 13 and 26).
Knowledge Intensive Services (KIS) such as ICT services, R&D services, management and strategicconsultancy services, business intelligence services,…might overcome these limitations to an effectiveTKT by the interfacing among SMEs and Knowledge providers, and supporting SME's on theirinnovation processes.
Thus, KIS are often considered to be one of the hallmarks of the Knowledge based Economy. Theperformance of KIS does affect the performance of those organizations that are their clients and thus thedynamisation of KIS sector impacts on the whole of the regional and EU economies. A KnowledgeEconomy demands an increase on the number of KIS providing high added value products and servicesto the EU and to the global economic players.
Moreover, KIS can be pointed out as a particularly dynamic and rapidly growing area within the Services
sector, and has recently been pointed out as one of the main priorities for innovation policy at the EUlevel, as stated in the EC Communication's "Putting knowledge into practice: a broad based innovationstrategy for the EU" and in the Commission’s Working Document "Towards a European Strategy insupport of innovation in services".
Notwithstanding, the development of KIS on the Atlantic Area regions is divergent, even though somecommon trends on their evolution can be identified: ongoing growth in demand and supply,concentration, convergence and specialization tendencies, internationalization imperative,…
Even if subject to private market trends, the promotion of such services from the public policy level isbecoming more and more a pressing issue, as the KIS impact on regional economies gets evident. Onthe other hand, even if demand on such services is rapidly increasing, there are some mistrust and lackof knowledge issues among SMEs on the potential benefits involved in the use of KIS, that might behindering the fully exploitation of available KIS services in order to fully reach the region’s potential.
Thus ATLANT KIS intends to provide some leverage to the KIS sector in the Atlantic Area proposing

8/8/2019 Atlant-KIS Audit Report September 2010
http://slidepdf.com/reader/full/atlant-kis-audit-report-september-2010 5/42
A u d i t M ar k e t
OBJECTIVES
The overall goal of ATLANT-KIS is to enhance the Knowledge and Technology Transfer and innovationprocesses on SMEs through the promotion and co-operation of Knowledge Intensive Services (KIS) atthe Atlantic Area.
Additionally, and as a longer term goal, it also aims to contribute to the development of Clusters of KISat the Atlantic Area, that might help identify the area as an excellent one in the supply of KIS.
Specific objectives of the project:
1) To design a methodology for the mapping of regional and transregional demand and supply of KIS,transferable to other regions.
2) To develop and disseminate 7 Audits on KIS demand and supply from involved regions.
3) To design a methodology for the identification and transfer of Best Practices at the regional policylevel, enabling the promotion and dynamisation of KIS.
4) To identify, exchange and disseminate to other EU regions Best Practices resulting from successfulregional experiences on the field of KIS promotion and dynamisation.
5) To transfer the Best Practices identified to the regional policies of involved regions, and to experimentnew models and approaches based upon the latter, aimed at the promotion and dynamisation of KIS.
6) To create stable communication links among KIS of involved regions, to foster their networking andcooperation by the development of a collaborative platform, open to all KIS from the Atlantic Area.
PARTNERSHIP
Partnership is made up of the following organizations, covering all the eligible countries of theProgramme: Spain, France, Portugal, UK and Ireland.
1. DG Enterprise, Department of Innovation, Business and Employment, Navarra Government,Spain.
2. Bretagne Innovation, Bretagne, France.3. Consellería de Innovación e Industria, Xunta de Galicia, Spain.4. Agência de Innovaçao, Portugal5. Devon and Cornwall Business Council, United Kingdom.6. South and Eastern Regional Assembly, Ireland.7. Westbic, Ireland.8 Borders Midlands and West Regional Assembly Ireland

8/8/2019 Atlant-KIS Audit Report September 2010
http://slidepdf.com/reader/full/atlant-kis-audit-report-september-2010 6/42
A u d i t M ar k e t
INNOVATIVE ASPECTS OF THE PROJECT
The overcome of the European Paradox demands innovative approaches in order to turn the excellentResearch and Development efforts of the EU into the global market in more rapid and end-usersconscious ways.
ATLANT-KIS deals with a priority issue for the EC, just recently pointed out as one of the mainchallenges for Europe. EC Communication "Putting knowledge into practice: a broad based innovationstrategy for the EU" specifically prioritizes the non technological innovation in the Services Sector,resulting on the Commission Staff Working Document "Towards a European Strategy in support ofinnovation in services".
The Innovation Policy Project in Services under the PRO-INNO Europe Initiative, also concludes thatthere is a need for broad-based transnational collaboration that would include policy, strategic andoperational level activities.
Recommendations arising from these initiatives comprise the following, all of them addressed byATLANT-KIS proposal, becoming thus the first transnational co-operation project at EU level addressingthis topic:
• Development of more balanced innovation policies promoting non technological innovation.• Development of policies with specific support mechanisms for innovative services with high
growth potential.
• Promoting trans-national cooperation on “better policies” in support of innovation services inEurope.
• Definition of broad-based innovation policies consisting of a balanced mix of supply and demandside measures.
• Support of service exports as drivers that policies need to reflect. Also publicprivate partnerships
are likely to play an important role in service innovation Policy.• Regional policies and cluster policies acting as platforms for effective innovation policy delivery
At present time, an analysis of National Reform Programmes shows that only a few Member Stateshave so far developed specific policies or measures in support of innovation in the services sector.
Member States from the North West of Europe like Finland, Germany, UK, Ireland and Netherlandsshow the more advanced policies in this field. The Atlantic Area of the EU lags in this approach, soATLANT-KIS might be the best chance to start assessing potentialities and synergies on the innovation
of the services sector field from a transnational perspective on the Atlantic Area.
The partnership of the project is composed of powerhouses on the promotion of innovation on theservices sector and on the promotion of KIS such as UK and Ireland, and regions like Galicia, Navarra,Bretagne or Portugal which might benefit from the experiences from the former. Ultimately the projectwill inform and benefit the development of specific Innovation Policies on involved regions, valorizing thet f f B t P ti id tifi d i t

8/8/2019 Atlant-KIS Audit Report September 2010
http://slidepdf.com/reader/full/atlant-kis-audit-report-september-2010 7/42
A u d i t M ar k e t
the KIS and Services sectors, delivering useful tools (audits, KIS Platform) for the promotion andco-operation of KIS at the regional and transregional level. To this end, the project will alsoinvolve KIS demanders and knowledge sources, providing practical outputs on their behalf.
• Horizontal approach: ATLANT-KIS is aware that other new complementary initiatives are beinglaunched at the EU level dealing on KIS and on innovation on the services sector, such as theKIS-Innovation Platform, described on section 4. From its inception the project has chosen toadopt an open and broad approach trying to gather momentum on the pulling of the KIS andServices Sector on the political innovation agendas, so actively seeks the co-ordination andsynergistic effects of matching the project with other such initiatives. To this end, a fluentcommunication will be established with the managers of KIS-Innovation Platform, activelyattending their meetings for the identification of specific areas of cooperation.
• Tools: Besides the more traditional methodologies for the identification of Best Practices, theproject proposes the use of more innovative tools, like Audits on KIS demand and supply thatwill imply a thorough assessment and involvement of the KIS sectors at the regional level andMappings on policy issues affecting KIS sector.
As an innovative and crucial tool completing the identification of Best Practices the delivery of BestPractices Transferability assessments is foreseen. These will assess all the economic, geographical and
societal drivers affecting or threatening the success on the transfer of a given policy Best Practice,allowing the development of a Best Practices Transfer Implementation Handbook. Finally the virtual KIS – Platform will also represent an innovative ICT based solution aimed at target groups highly proficienton the use of such technologies.

8/8/2019 Atlant-KIS Audit Report September 2010
http://slidepdf.com/reader/full/atlant-kis-audit-report-september-2010 8/42
A u d i t M ar k e
2. REGIONAL SUPPLY - Companies
For this study were contacted 1404 companies that offer Knowledge Intensie Services. Were received177 answers, 25 of which were responded by Universities and associations.
Chart 1 Percentage of employees working at thecompany
2.1 Companies typology
The majority of KIS companies that answered are microand small companies (89,5%), with less than 10 yearsof existence. Only 11% are medium and large
companies.
As can be seen on chart 2, in 2004, the number of KISproviders was 3665 and in 2006 there were 15485companies. This increase was more than triple, so it isnot surprising that most surveyed companies are lessthan 10 years old.1
Almost 90% are located in North, Centre and Lisbonregion of Portugal. About 45% of the companies have,in average, 1 or 2 branch offices mainly located inNorth and Lisbon regions.
13,8% of the companies have offices beyond nationalboundaries. The main countries chosen to createsubsidiaries are Spain, Angola and Brazil.
3194
3665
15485
2003 2004 2006
Chart 2 Evolution of the number of High-tech-
intensive services (KIS) from 2003 to 20061
56%33%
8%
3%
1 - 10
11-50
51 - 250
More than 250

8/8/2019 Atlant-KIS Audit Report September 2010
http://slidepdf.com/reader/full/atlant-kis-audit-report-september-2010 9/42
A u d i t M ar k e
HUMAN RESOURCES
Most of the surveyed companies have between 1-10employees. Only 11% are medium and largecompanies.
61% of companies have a specific R&D departmentand small companies, in average, have 4 persons infte2. working in this activities.
Although not having a specific department, 48,8% ofthe companies have human resources allocated toR&D activities. Noticing that 25% of micro companieshave between 4 and 6 employees assign to it.
TURNOVER
“In 2006, Portugal counted 15585 companies in high-tech knowledge intensive services with a total turnoverof 11455 million”.
3
Among the companies covered, about 30% have a
turnover less than 100 k€. This could be explain by thefact of the majority of the surveyed companies weremicro and young companies with less than 10 years.
The turnover coming from exports from the small,medium and large is respectively 16%, 26% and 58%of the total turnover.
The income evolution for the majority of the companiesthat answered has been progressive on the last threeyears.
There was a growth on the total turnover of thecompanies offering KIS in Portugal between 2004 and2006 progressing from 10292 million to 11455 million4
Chart 4 Turnover, %
Chart 5 Turnover evolution on the last three years, %
Chart 3 Companies with specific R&D service/ department, %
39%
61%
Without R&D dep. With R&D dep.
8%
20%
15%
13%
15%
30%
More than 5000 k€
1000 - 5000 k€
500 - 1000 k€
250 - 500 k€
100 - 250 k€
Less than 100 k€
6%
8%
11% Progression
Regression

8/8/2019 Atlant-KIS Audit Report September 2010
http://slidepdf.com/reader/full/atlant-kis-audit-report-september-2010 10/42
A u d i t M ar k e
2.2Services Provided
Most of the provided services are referred to R&Dactivities with 44,7% of the total services offered,followed by management and others with 32,3%. Theremaining 23% are referred to ICT services (chart 8).
10% of the total services offered are Project identification and management followed by Design and
development of engineering projects with 9% of thetotal.
Chart 6 Services provided by company size, %
8%
2%
6%
7%
10%
9%
3%
6%
7%
1%
1%
4%
3%
6%
5%
ICT Consultancy
Telecom Network Connections
Implementation of electronic data interchange systems
Others
Project identification and management
Design and development of engineering projects
Innovation diagnosis and management
Tecnology Transfer
Open innovation, dynamization of R&D
Assistance on intellectual and industrial property
Laboratories
Prototyping and design services
Others
Management and strategic consultancy services
Business intelligence serviçes, competitive intelligence
I C T S e r v i c e s
R & D
S e r v i c e s
23,0% 25,0%16,7%
44,2% 47,2%55,6%
32,8% 27,8% 27,8%
Small Medium Large
ICT R&D Management
Chart 7 Knowledge Intensive Services provided by the companies, %
8/8/2019 Atlant-KIS Audit Report September 2010
http://slidepdf.com/reader/full/atlant-kis-audit-report-september-2010 11/42
A u d i t M ar k e
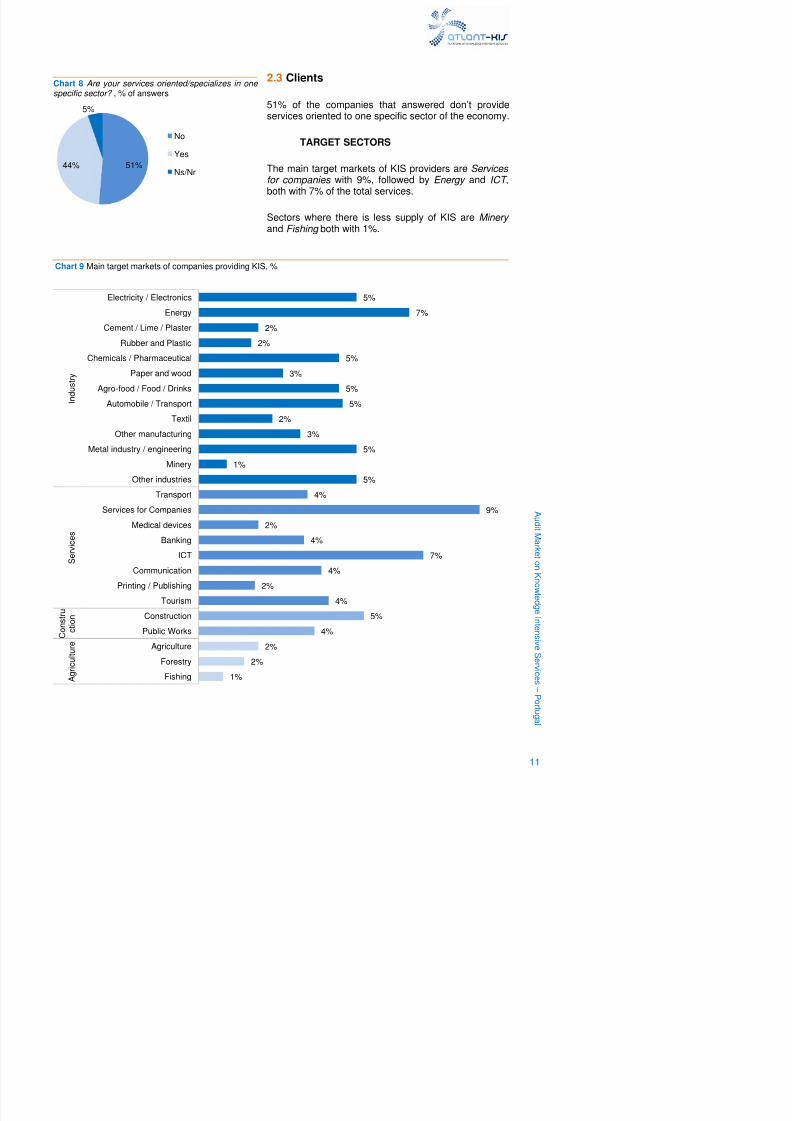
2.3 Clients
51% of the companies that answered don’t provideservices oriented to one specific sector of the economy.
TARGET SECTORS
The main target markets of KIS providers are Services for companies with 9%, followed by Energy and ICT ,both with 7% of the total services.
Sectors where there is less supply of KIS are Minery and Fishing both with 1%.
Chart 9 Main target markets of companies providing KIS, %
Chart 8 Are your services oriented/specializes in one specific sector? , % of answers
5%
7%
2%
2%
5%
3%
5%5%
2%
3%
5%
1%
5%
4%
9%
2%
4%
7%
Electricity / Electronics
Energy
Cement / Lime / Plaster
Rubber and Plastic
Chemicals / Pharmaceutical
Paper and wood
Agro-food / Food / DrinksAutomobile / Transport
Textil
Other manufacturing
Metal industry / engineering
Minery
Other industries
Transport
Services for Companies
Medical devices
Banking
ICT
I n d u s t r y
e r v i c e s
51%44%
5%
No
Yes
Ns/Nr

8/8/2019 Atlant-KIS Audit Report September 2010
http://slidepdf.com/reader/full/atlant-kis-audit-report-september-2010 12/42
A u d i t M ar k e
CLIENT´S LOCATION
75,7% of companies clients are located in North,
Centre and Lisbon regions.
Internationally, the main clients are located inEuropean Union and also in Portuguese speakingcountries like Brazil and Angola.
CLIENT’S TYPOLOGY
Clients of surveyed companies are distributed equallybetween large (31%), medium (28%), small (24%) andmicro (17%) enterprises.
TYPE OF INNOVATION PROMOTED
Regarding the type of innovation promoted with clients
over the last three years, more than a third has beenon product/service innovation (35,9%). 11,3% arerelated to development phase followed byimplementation and conception phase with 10% and9,3% respectively.
Process innovation comes in second with 23,8% of thetotal followed by Marketing innovation , 13,8%, andOrganizational or social innovation , 12,2%.
Chart 11 Type of innovation promoted with clients over the last three years by phase, %
Chart 10 Client’s location, in Portugal, %.
5,3%
3,8%
3,7%
9,3%
6,1%
3,1%
11,3%
7,2%
3,3%
10,0%
6,8%
3,7%
1,6%
2,7%
4,9%
0,0% 5,0% 10,0% 15,0% 20,0% 25,0% 30,0% 35,0% 40,0%
Product/Service Innovation
Process Innovation
Marketing Innovation
29%
20%27%
9%
7%8% North
Centre
Lisbon
Alentejo
Algarve
Others

8/8/2019 Atlant-KIS Audit Report September 2010
http://slidepdf.com/reader/full/atlant-kis-audit-report-september-2010 13/42
A u d i t M ar k e
RELATIONS WITH CLIENTS
The most common relation between clients and KIS
providers is Partnership (39,9%), followed bySubcontracting and Co-development with 35% and25,1% respectively.
2.4 Human Resources
In 2007, there were more than 144 million jobs in theEU-27, of which, half were in KIS.
About 23.5% of Portugal’s total employment in 2007
was linked to the KIS sector. Noticing that, for the sameyear, 58,7% of the total employment in Portugal was inthe in Services sector5.
Of the companies that responded, 82% of the totalemployees have Higher education, while only 13%have Elementary and Secondary education.
Most employees are allocated on the technicaldepartment followed by management andadministrative departments.
25,1%
39,9%
35,0%
2,8%
Co-development
Partnership
Subcontracting
Others
Chart 12 Type of relation established with clients, %
Chart 13 Qualification of Human Resources, %
4%
9%
6%
66%
16%
Basic
Intermediate
Professional course
Superior
MBA/Master/Phd

8/8/2019 Atlant-KIS Audit Report September 2010
http://slidepdf.com/reader/full/atlant-kis-audit-report-september-2010 14/42
A u d i t M ar k e
2.5 Barriers
The main barriers to access the KIS market pointed by
the surveyed companies are Ignorance of the demand side concerning the offered services (20,5%) followedby the Lack of visible added-value (18%) and the Price (10%).
The global crisis made consumers of KIS less receptiveto this kind of services because they are perceived as acost instead of an investment. As a result, these
services are not a priority to the companies.Most of the enterprises believe that the main difficultiesare also the result of the unfair competition ofUniversities, governmental entities and largecompanies that have advantages only accessible tothem. So, they practice lower prices that hinder marketaccess for SME’s.
SME’s also express that they have many difficulties to
market their services.Last but not least, all the bureaucracy involved is anextra work and it is very time consuming.
Chart 14 Barriers to access KIS market, % of the total barriers mentioned
10,0%
20,5%
2,1%
8,6%
4,6%
18,0%
Price
Ignorance of the demand side concerning the offeredservices
Mistrust on Industrial Property
Large companies competition
No short - term profitability of the service
Lack of visible added-value

8/8/2019 Atlant-KIS Audit Report September 2010
http://slidepdf.com/reader/full/atlant-kis-audit-report-september-2010 15/42
A u d i t M ar k e
2.6 Supports
STRATEGIC PLAN
A large proportion of the companies surveyed does notknow if there is a strategic plan for the services sector.Only 24,3% knew its existence but about 81% of thesedid not know what would be the impact for thecompanies.
MAIN CONTRIBUTIONS
The main strategic plan contributions mentioned by thecompanies are Sector integration (clusterization) with35,3% followed by Supply promotion with 31,4%. Theremaining 33,3% are from Qualification and training and financing for the demand .
EUROPEAN SUPPORT PROGRAMS
70,7% of the surveyed companies believe thatEuropean support programs contribute to thedevelopment of KIS.
The main EU Programs recognized are SeventhFramework Programme (FP7) with 57% followed byInterreg with 17%.
The major advantages, mentioned by the companiesthat answered, are the partnerships created betweennational and foreign companies as well as the fundingfrom the support programs.
These programs promote advantageous synergies
Chart 15 Existence of a strategic plan for services, %
Chart 16 Contributions of the strategic plan, %
Chart 17 Percentage of companies that weresupported by European support programs
67,8%
19,7%
0,7%
3,9%7,9%
No
Yes, but I don't know theimpactYes, negative impact
Yes, positive impact
Ns/Nr
13,7%
19,6%
35,3%
31,4%
Financing for thedemand
Qualification andtraining
Sector integration(Clusterization)
Supply promotion
57%
11%
17%
9%
6%
FP7
CIP
InterregEureka
Others

8/8/2019 Atlant-KIS Audit Report September 2010
http://slidepdf.com/reader/full/atlant-kis-audit-report-september-2010 16/42
A u d i t M ar k e
NATIONAL/REGIONAL SUPPORT PROGRAMS
Most of the responders indicate that National Strategic
Reference Framework (QREN) and Human PotentialOperational Programme (POPH) are the nationalprograms that more contribute for the development ofKIS.
These national/regional programs contribute to thedevelopment of SME’s by giving non-repayablefinancial support for innovation and R&D activities and
promoting the level of human resources of thecompanies through the program POPH.
However, there are strong restrictions of theseprograms to entities in the Lisbon region and to largecompanies. The complex bureaucracy is still an issuein this case.
SUPPORT RECEIVED
Over the last three years, 49% of the surveyedcompanies were beneficiary of European and/orNational/regional support programs.
The main support program was a national one, QREN,with 39,3%, followed by an international program, FP7with 9%.
42,6% of companies that answered use theseprograms to develop their innovation activities and25,7% to find and strengthen partnerships with externalentities and companies.
EVALUATION OF SUPPORT PROGRAMS
Of the companies that received support 35 5% rated
72%
19%
12%
4%
18%
QREN POPH POR SIFIDE Others
12,6%
42,6%
25,7%
12,0%
7,1%
Clusterization andNetworking
Innovation
Internationalization
Training
Others
Chart 18 Percentage of companies that weresupported by National/Regional support programs
Chart 19 Application of the support received, %
Chart 20 Evaluation of support programs, %

8/8/2019 Atlant-KIS Audit Report September 2010
http://slidepdf.com/reader/full/atlant-kis-audit-report-september-2010 17/42
A u d i t M ar k e
2.7 Networking and Internationalization
47% of the surveyed companies are associated to a
cluster/ network.The majority is associated to a national cluster, while31% are related to an European followed by regionalclusters/ networks with 18%.
COTEC, Health Cluster Portugal and TICE.PT are themain clusters/ networks that surveyed companies areinvolved.
COLLABORATION WITH ANOTHER KISPROVIDER
73,7% of the responders have already collaboratedwith another provider of KIS while 21,1% never neededsuch services.
75% of the companies have already collaborated withUniversities , 52% with ADI/COTEC/IAPMEI followed byother KIS companies with 51%.
The type of collaboration established between thesurveyed companies and the others KIS providers ismainly through partnerships, co-development andsubcontracting.
Chart 22 Collaborations with another KIS provider,%
52%
51%
75%
18%
37%
9%
Innovation agency /
Cotec / Iapmei
KIS company
University
Private research centres
Public technological
centres
Others
Chart 21 Percentage of companies associated to acluster/networking
31%
72%
11%18%
4%

8/8/2019 Atlant-KIS Audit Report September 2010
http://slidepdf.com/reader/full/atlant-kis-audit-report-september-2010 18/42
A u d i t M ar k e
2.8 Future
In the future, 77% of the companies expect to increase
investment in innovation while only 4% expect todecrease it.
However, there are many factors that have positiveand/or negative impact for the future development ofthe enterprises.
For the companies, the external factor that has more
negative impact is the financial situation of theeconomy. The Knowledge based economy ,Globalization and Policies to promote the sector arethose that have more positive impact.
One interesting fact is that unemployment showsalmost no impact in the development of the surveyedcompanies.
Regarding the internal factors, the Acquisition of new competencies , the Ability to communicate about the added value and the Financial resources are those withthe most positive impact to the companies.
Chart 23 Evolution of the investment in innovationfor the next three years, %.
42%
12%
76%
88%
53%
93%
30%
54%
32%
2%
5%
5%
1%
17%
4%
56%
22%
7%
43%
5%
53%
Financial situation
Unemployment
Policies to promote the sector
Globalization
Sustainable development / Climate change
Knowledge based economy
Others
Positive Negative No impact
77%
4%10%
9% Progression
Regression
Stagnation
Ns/Nr
Chart 24 Impact of the external factors for the development of the companies, %

8/8/2019 Atlant-KIS Audit Report September 2010
http://slidepdf.com/reader/full/atlant-kis-audit-report-september-2010 19/42
A u d i t M ar k e
REGIONAL SUPPLY - Universities
2.9
Universities typology
48% of the Universities/ associations have more than250 employees. 88% of the responders have a R&Ddepartment where, in average, are allocated 358employees.
TURNOVER
Almost one half of the surveyed Universities have aturnover higher than 1000 k€ and its evolution over thelast three years has been progressive to 44% of theresponders.
2.10 Services Provided
Most of the provided services are referred to R&Dactivities, with 52% of the total services offered,followed by management and others with 33%. Theremaining 15% are referred to ICT services (chart 29).
9% of the total services offered are Technology transfer , followed by Laboratories with 7%.
36%
12%
8%
4%
8%
32%
More than 5000 k€
1000 - 5000 k€
500 - 1000 k€
250 - 500 k€
100 - 250 k€
Less than 100 k€
16%
24%
12%
48%
1 - 10
11 - 50
51 - 250
More than 250
Chart 26 Employees working at the company, %
Chart 27 Turnover, %
5%
4%
3%
3%
6%
6%
5%
9%
ICT Consultancy
Telecom Network Connections
Implementation of electronic data interchange systems
Others
Project identification and management
Design and development of engineering projects
Innovation diagnosis and management
Tecnolog Transfer
I C T S e
r v i c e s
c e s
Chart 28 Services provided by Universities/ associations, % 1

8/8/2019 Atlant-KIS Audit Report September 2010
http://slidepdf.com/reader/full/atlant-kis-audit-report-september-2010 20/42
A u d i t M ar k e
2.11 Clients
56% of the surveyed Universities that answered don´t
provide services specialized in one specific sector ofthe economy.
TARGET SECTORS
The main target markets are Energy and Services for companies , both with 6,9%, followed by ICT with 6,4%of the total sectors.
Printing / publishing is the market where Universities/ associations offer less KIS.
4,7%
6,9%
2,1%
3,4%
4,7%
4,3%
5,2%
5,6%
2,6%
3,4%
5,2%
2,6%
4,3%
3,9%
Electricity / Electronics
Energy
Cement / Lime / Plaster
Rubber and Plastic
Chemicals / Pharmaceutical
Paper and wood
Agro-food / Food / Drinks
Automobile / Transport
Textil
Other manufacturing
Metal industry / engineering
Minery
Other industries
Transport
I n d u s t r y
27% 29%
44%
Large Medium Small
44%
56%
Yes
No
Chart 29 Are your services oriented/ specialized in one specific sector? , % of answers
Chart 30 Main target markets, %

8/8/2019 Atlant-KIS Audit Report September 2010
http://slidepdf.com/reader/full/atlant-kis-audit-report-september-2010 21/42
A u d i t M ar k e
CLIENT’S TYPOLOGY
73% of the clients are SME’s and only the remaining
27% are large companies.
39,7% of the relations established betweenUniversities/ associations and their clients is throughpartnerships. Followed by co-development andsubcontracting with 30,2% and 25,4%.
Regarding the type of innovation promoted with clients
over the last three years, 42,3% are referred toproduct/ service innovation; 16,1% are related todevelopment followed by conception andimplementation phase with 14,6% and 8,8%respectively.
Process innovation comes in second with 32,8%followed by Organizational or social innovation, 16,1%,and marketing innovation, 16,1%.
27% 29%
44%
Large Medium Small
30,2%
39,7%
25,4%
4,8%
Co-development
Partnership
Subcontracting
Others
Chart 31 Client's size, %
Chart 32 Type of relation promoted with clients, %
2,9%
1,5%
14,6%
10,2%
16,1%
13,1%
8,8%
8,0%
Product/Service Innovation
Process Innovation
Chart 33 Type of innovation promoted with clients over the last three years by phase, %

8/8/2019 Atlant-KIS Audit Report September 2010
http://slidepdf.com/reader/full/atlant-kis-audit-report-september-2010 22/42
A u d i t M ar k e
2.12 Human Resources
Concerning the human resources of Universities/
associations, 29,6% of the employees have a superioreducation and 51,6% have a MBA/Master or PhDeducation.
2.13 Barriers
The main barriers to access the KIS market pointed bythe surveyed Universities/ associations are Ignorance of the demand side concerning the offered services with 18,4% followed by Lack of visible added-value with16,3% and the Difficulties to find funding with 14,3% ofthe total barriers mentioned by them.
These barriers can be explained by the difficulty of thecompanies in discerning the advantages in medium
and long term of the offered services by Universities/ associations. Also due to the less favorable economicconditions, companies only tend to acquire serviceswith immediate returns thus minimizing the risk.
Furthermore there are still a significant number ofcompanies for which R&D services and industrialproperty is not a priority.
Finally, the support programs to find funding are still to
much time consuming and bureaucratic.
Chart 35 Barriers to access the market, % of the total barriers mentioned
4,2%
13,7%
1,0%
29,6%
51,6%
Basic
Intermediate
Professionalcourse
Superior
MBA/Master/Phd
Chart 34 Employees qualification, %
7,1%
18,4%
10,2%
3,1%
Price
Ignorance of the demand side concerning the offeredservices
Mistrust on Industrial Property
Large companies competition

8/8/2019 Atlant-KIS Audit Report September 2010
http://slidepdf.com/reader/full/atlant-kis-audit-report-september-2010 23/42
A u d i t M ar k e
2.14 Supports
72% of the surveyed Universities/ associations do not
know if there is a strategic plan for the services sector.Only 24% knew of its existence but about 83% of thesedid not know what would be the impact for theiractivities.
The main strategic plan contributions mentioned by theuniversities/ associations are Supply promotion with37,5% followed by Sector integration (clusterization)
with 25%, Financing for the demand and Qualification and training are last, both with 18,8% of the totalcontributions mentioned.
EUROPEAN AND NATIONAL SUPPORTPROGRAMS
For 64% of the Universities/ associations, the
European support programs have a positivecontribution for the KIS sector development. The mostrecognized programs are FP7 with 36% followed byInterreg and CIP with 24% and 12% respectively, of thetotal programs mentioned.
Regarding the national programs, 56% of thecompanies believe that they have a positive impact forthe development of KIS sector. The most mentionedprograms are QREN with 50% followed by POPH andPOVT, both with 16,7% of the total programs.
SUPPORT RECEIVED
76% of the Universities/ associations that answeredreceived financial support over the past three years.
52% of them have benefited from the program FP7,48% from QREN and 36% from Interreg.
92% of the surveyed Universities/ associations usethese support programs to develop their innovationactivities.
18,8%
18,8%
25,0%
37,5%
Financing for thedemand
Qualification andtraining
Sector integration(Clusterization)
Supply promotion
64%
8%
28%
56%
8%
36%
Yes No Ns/Nr
National support programs
European support programs
60%
92%
60%
44%
16%
Clusterization andNetworking
Innovation
Internationalization
Training
Others
Chart 36 Contributions of the strategic plan, %
Chart 37 Do Innovation support tools contribute to KIS development? %of the answers
Chart 38 Application of the support received, %
8/8/2019 Atlant-KIS Audit Report September 2010
http://slidepdf.com/reader/full/atlant-kis-audit-report-september-2010 24/42
A u d i t M ar k e
On the other hand, the support programs areinsufficient and the heavy bureaucracy leads to a delayin the responses.
There aren’t programs on a regular basis for certainactivities developed by technological entities.
Finally, the lack of promotion of this kind of supportsshows the need for a national strategy to create aninnovation development plan.
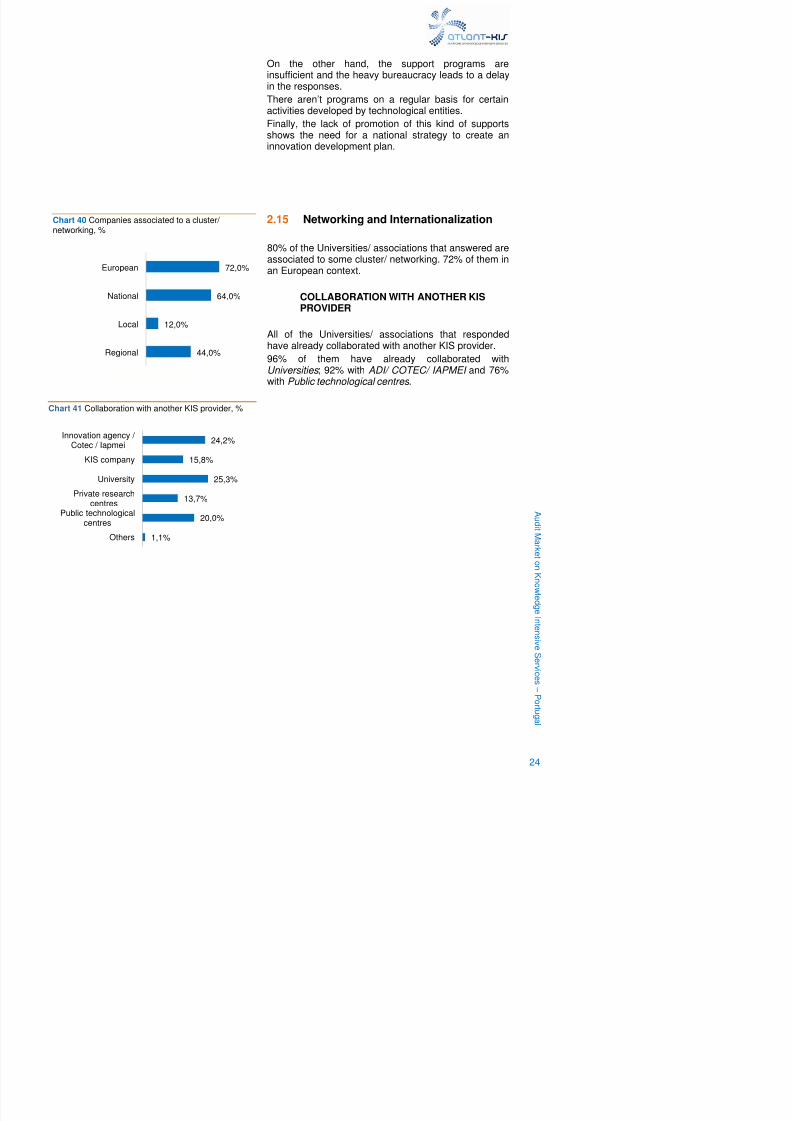
2.15 Networking and Internationalization
80% of the Universities/ associations that answered areassociated to some cluster/ networking. 72% of them inan European context.
COLLABORATION WITH ANOTHER KISPROVIDER
All of the Universities/ associations that respondedhave already collaborated with another KIS provider.
96% of them have already collaborated withUniversities ; 92% with ADI/ COTEC/ IAPMEI and 76%with Public technological centres .
72,0%
64,0%
12,0%
44,0%
European
National
Local
Regional
24,2%
15,8%
25,3%
13,7%
20,0%
1,1%
Innovation agency / Cotec / Iapmei
KIS company
University
Private researchcentres
Public technologicalcentres
Others
Chart 40 Companies associated to a cluster/ networking, %
Chart 41 Collaboration with another KIS provider, %

8/8/2019 Atlant-KIS Audit Report September 2010
http://slidepdf.com/reader/full/atlant-kis-audit-report-september-2010 25/42
A u d i t M ar k e
2.16 Future
72% of the Universities/ associations estimate that the
evolution of their investment in innovation will beprogressive.
For these, the external factors having more impact areKnowledge based economy followed by Policies to promote the sector and Globalization . On the otherhand, the financial situation has a negative impact on
their development.
When considering the internal factors, the Acquisition of new competencies , the Ability to communicate about the added value and the Ageing of the employees arethose with more significant impact for them.
33,3%
15,8%
81,0%
72,2%
68,4%
81,8%
61,9%
31,6%
9,5%
16,7%
5,3%
4,8%
52,6%
9,5%
11,1%
26,3%
18,2%
100,0%
Financial situation
Unemployment
Policies to promote the sector
Globalization
Sustainable development / Climate change
Knowledge based economy
Others
Positive Negative No impact
35% 65%Financial resources
Chart 44 Impact of the internal factors for the development of Universities/ associations, %
Chart 43 Impact of the external factors for the development of Universities/ associations, %
Chart 42 Evolution of the investment in innovation inthe next three years, %
72%
12%
8%8% Progression
Stagnation
Regression
Ns/Nr
8/8/2019 Atlant-KIS Audit Report September 2010
http://slidepdf.com/reader/full/atlant-kis-audit-report-september-2010 26/42
A u d i t M ar k e
REGIONAL DEMAND

8/8/2019 Atlant-KIS Audit Report September 2010
http://slidepdf.com/reader/full/atlant-kis-audit-report-september-2010 27/42
A u d i t M ar k e
64,0%
23,6% 12,4%0,0%
20,0%
40,0%
60,0%
80,0%
Small Medium Large
Audit PT (CIS 2006) EU-27 (CIS 2006)
3.REGIONAL DEMAND
1576 companies were contacted to give their opinion as clients of Knowledge Intensive services. Theaudit counts with 89 questionnaires.
Chart 46 Audit enterprises and innovative enterprisesin Portugal and EU by size class, %
3.1 Companies details
TYPOLOGY
The majority of the companies that answered are microor small companies with over 10 years existence.
They are based in the North, Centre and Lisbon
regions of Portugal, where 25% also have, in average,1 or 2 branch offices.
15,7% of the companies have offices beyond nationalboundaries. United Kingdom, Germany, Spain and Italyare the European preferential countries with 29% ofsubsidiaries. Portuguese speaking countries like Brazil,Angola and Mozambique are the non-EU countries
preferred to create subsidiaries abroad Europe (29%).
HUMAN RESOURCES
Two thirds of the responders are small companies, ofwhich, half are micro companies with less than 10employees.
In general, the SMEs surveyed have a specific R&Ddepartment that allocates, in average, 7 persons in fte.
43,6% of the companies without a specific R&Ddepartment, have between 5 and 10 employeesassigned to these activities It should be noted that
71,4%
81,8%
54 4%
Chart 45 Companies with specific R&D service/ department by size class, %

8/8/2019 Atlant-KIS Audit Report September 2010
http://slidepdf.com/reader/full/atlant-kis-audit-report-september-2010 28/42
A u d i t M ar k e
Chart 48 Evolution of the investment in innovation duringthe last three years, %
TURNOVER
The turnover is correlated with the company size: micro
and small companies have a turnover inferior to themedium and large companies (Chart3). The average ofthe Audit is between 1000 and 5000k€.
Following the trend of the Portuguese innovativecompanies reported in Eurostat Statistical Books-Science, technology and innovation in Europe 2010, ashaving increased their turnover by 4.8% between 2004and 2006, over 60% of the companies surveyedconfirmed a progressive evolution of turnover over thepast three years.
The turnover coming from exports accounted for 39,1%of the total turnover in Small companies, and 31,5%and 15,9% for medium and large companiesrespectively.
TURNOVER INVESTED IN INNOVATION
During the last three years 59,6% of the companiessurveyed had an increasing investment in innovationand, in average, they spend one third of the totalturnover in innovation related activities.
SECTOR OF ACTIVITY
Innovative companies are most represented inServices for Enterprises and ICT . More than half of thecompanies (52,6%) work in the Industry sector.
59,6%21,3%
11,2%
7,9% Progression
Stagnation
Regression
ns/nr
Chart 47 Turnover by company size class, includingmicro companies, %
15,7%
5,6%
5,6%
3,4%
1,1%
15,7%
5,6%
11,2%
1,1%
2,2%
3,4%
16,9%
1,1%
11,2%
<100 k€
100 - 250 k€
250 - 500 k€
500 - 1000 k€
1000 - 5000 k€
>5000 k€
0% 10% 20% 30%
Micro Small Medium Large
6,7%
8,1%
0,7%
0,7%
4,4%
1,5%
5 9%
Electricity / Electronics
Energy
Cement / Lime / Plaster
Rubber and Plastic
Chemical/ Pharmaceutical
Paper and wood
Agro food / Food / Drinksu s t r y
Chart 49 Sector of activity of the companies, %

8/8/2019 Atlant-KIS Audit Report September 2010
http://slidepdf.com/reader/full/atlant-kis-audit-report-september-2010 29/42
A u d i t M ar k e
3.2 Innovation
More than 80% of the innovative companies in Portugal
were involved in activities of innovation during theperiod between 2004 and 2006.
From the companies audited, the majority haveundertaken an innovation activity, even if notsuccessful, in the last three years. Most of it, was forthe conception or development of products/ services,with 13% and 10,5% respectively.
Regarding the projects that didn’t succeed, companiesthink that was due to:
• Lack of technical and commercial support
• Difficulty in marketing the developed innovations
• Difficulty in managing the partners
• Lack of human resources with experience andknow-how
• Lack of financial resources to invest in R&D• Inviability of the project
Reasons that encourage innovation Reasons that discourage innovation
Diversification and differentiation ofproducts / services
Human resources are poorly prepared with littleexperience and know-now
Market requirements Lack of time
It is part of the company strategy Poor economic situationInnovation is perceived as a critical factorfor the development and sustainability ofthe company
Lack of funding in the various phases of projects
To maintain a high level of internal know-how/ competitiveness
Bureaucratic process of public funding
13,0%
7,7%
4,3%
4,8%
10,5%
8,0%
4,1%
5,2%
4,8%
7,5%
6,4%
6,2%
5,0%
5,0%
4,8%
2,7%
Product/ Service
Process
Marketing
Organizational orsocial
Conception Development
Implementation Commercial ization
Chart 50 Innovative activities undertaken by phase,%
8/8/2019 Atlant-KIS Audit Report September 2010
http://slidepdf.com/reader/full/atlant-kis-audit-report-september-2010 30/42
A u d i t M ar k e
Chart 51 Type of services needed in the last threeyears, %
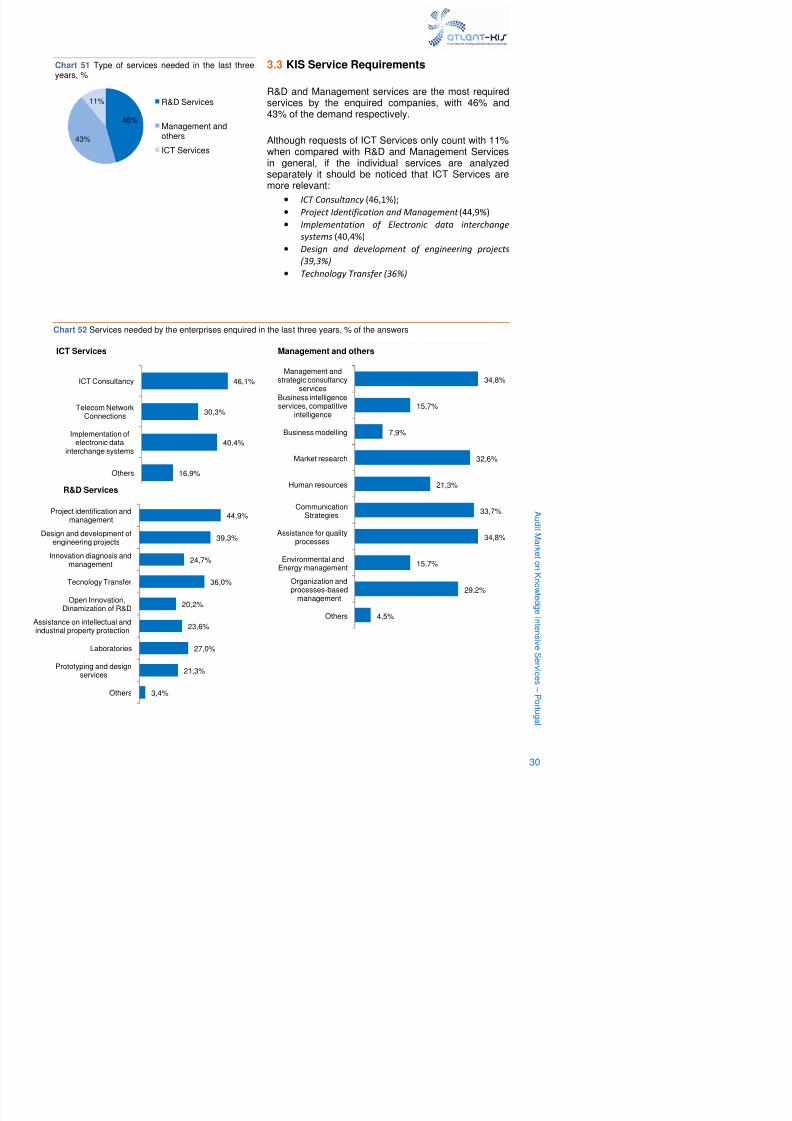
3.3 KIS Service Requirements
R&D and Management services are the most required
services by the enquired companies, with 46% and43% of the demand respectively.
Although requests of ICT Services only count with 11%when compared with R&D and Management Servicesin general, if the individual services are analyzedseparately it should be noticed that ICT Services aremore relevant:
• ICT Consultancy (46,1%);• Project Identification and Management (44,9%)
• Implementation of Electronic data interchange
systems (40,4%)
• Design and development of engineering projects
(39,3%)
• Technology Transfer (36%)
46%
43%
11% R&D Services
Management andothers
ICT Services
46,1%
30,3%
40,4%
16,9%
ICT Consultancy
Telecom NetworkConnections
Implementation ofelectronic data
interchange systems
Others
ICT Services
Chart 52 Services needed by the enterprises enquired in the last three years, % of the answers
44,9%
39,3%
Project identification andmanagement
Design and development ofengineering projects
Innovation diagnosis and
R&D Services
34,8%
15,7%
7,9%
32,6%
21,3%
33,7%
34,8%
Management andstrategic consultancy
services
Business intelligenceservices, compatitive
intelligence
Business modelling
Market research
Human resources
CommunicationStrategies
Assistance for qualityprocesses
Management and others

8/8/2019 Atlant-KIS Audit Report September 2010
http://slidepdf.com/reader/full/atlant-kis-audit-report-september-2010 31/42
A u d i t M ar k e
When questioned if they found or not a provider for therequested service, the majority of the companiesanswered affirmatively.
For ICT services, the companies generally contractentities from the Private sector. On the other hand, forManagement services, companies prefer to seek asolution internally. It is noted that he Public sector playsa major role in R&D services, with more than 50% ofthe companies contracting services from privateLaboratories or Technology Transfer centres.
Within the provider’s sector, in general, companiesresorted to a private enterprise (29,2%) or to its ownhuman resources (26,6%). Public Technologicalcentres were the providers of 13,3% of the servicesneeded (chart 9).
ICT Consultancy
Telecom NetworkConnections
Implementation ofelectronic data
interchange systems
Others
0% 20% 40% 60% 80% 100%
ICT Services
Project identification andmanagement
Design and developmentof engineering projects
0% 20% 40% 60% 80% 100%
R&D Services
Chart 54 Percentage of companies that found, or not, the service sought and from which sector it was provided
Management andstrategic consultancy
services
Business intelligenceservices, compatitive
intelligence
Business modelling
Market research
Human resources
Communication
Strategies
Assistance for qualityprocesses
Environmental andEnergy management
0% 20% 40% 60% 80% 100%
Management and others
26,6%
29,2%
9,8%
11,3%
6,6%
3,1%
13,3%
Qualified humanresources
Enterprises
Technological centre
TechnicalInstitutes/Organisms
Agencies
Administration
Technological centre
I n t e
r n a l
l y
P r i v a t e S e c t o r
P u b l i c S e c t o r
Chart 53 Sector and type of service provider, %

8/8/2019 Atlant-KIS Audit Report September 2010
http://slidepdf.com/reader/full/atlant-kis-audit-report-september-2010 32/42
A u d i t M ar k e
76% of the companies were satisfied with the servicedelivered.
RELATIONS WITH SERVICES PROVIDERS
Half of the companies surveyed establish partnerships
with their suppliers. Nevertheless, co-development andsubcontracting agreements are also usual.
These agreements are establish in order to developinnovative products/ services, to transfer technology orfor specific R&D services. Relationships withinCooperation Programs are also common.
SOURCES OF INFORMATION
57,3% of the companies used Networking to find a
service provider. Their Own staff and Meetings and conferences are also sources of information.
76%
14%
10% Satisfied
Non satisfied
ns/nr
Chart 55 Evaluation of the service provided, %
48,3%
37,1%
50,6%
1,1%
Chart 56 Type of relationship between demandingcompanies and providers
43,8%
22,5%
33,7%
10,1%
25,8%
36,0%
13,5%
23,6%
57,3%
6,7%
18,0%
2,2%
Own staff
Clients
Suppliers
Competitors
Associations
Meetings/conferences
Sector studies
Journals/Internet/Ne
Networking
Professional Directory
Technological Centres
Commerce Chambers
Chart 57 Sources of information used to find aprovider, %
8/8/2019 Atlant-KIS Audit Report September 2010
http://slidepdf.com/reader/full/atlant-kis-audit-report-september-2010 33/42
A u d i t M ar k e
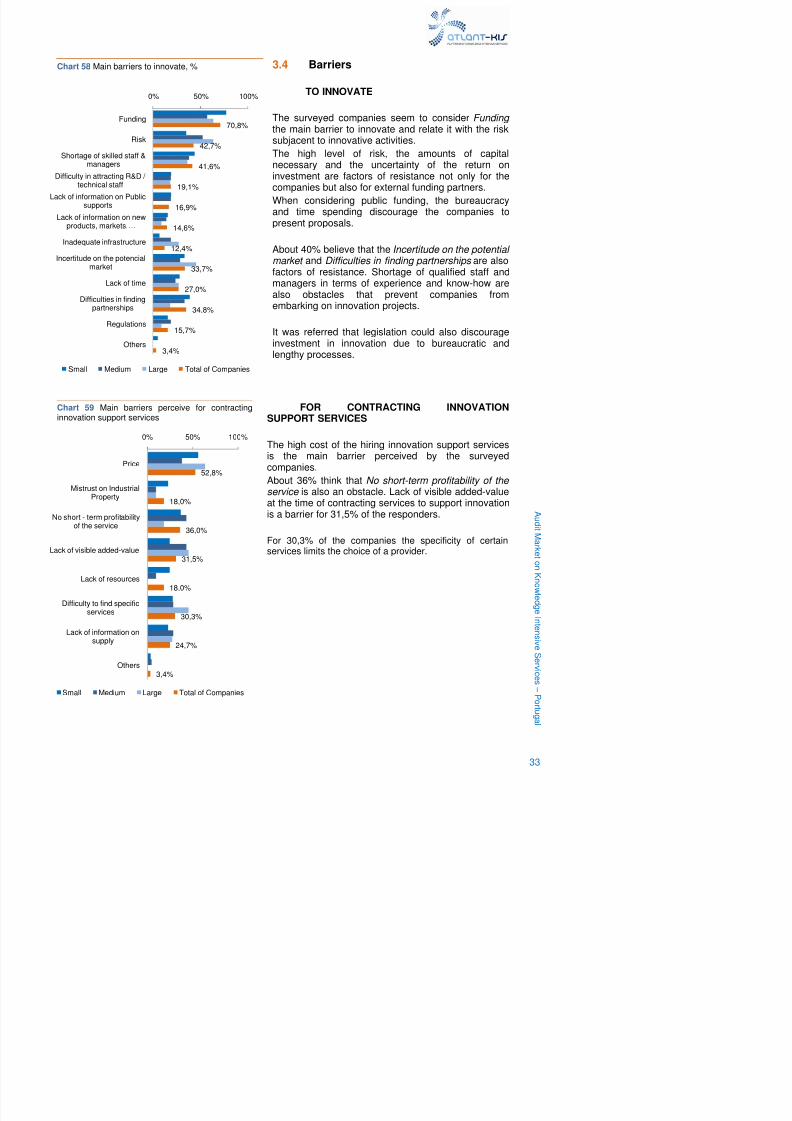
3.4 Barriers
TO INNOVATE
The surveyed companies seem to consider Funding the main barrier to innovate and relate it with the risksubjacent to innovative activities.
The high level of risk, the amounts of capitalnecessary and the uncertainty of the return oninvestment are factors of resistance not only for thecompanies but also for external funding partners.
When considering public funding, the bureaucracyand time spending discourage the companies topresent proposals.
About 40% believe that the Incertitude on the potential market and Difficulties in finding partnerships are alsofactors of resistance. Shortage of qualified staff andmanagers in terms of experience and know-how arealso obstacles that prevent companies fromembarking on innovation projects.
It was referred that legislation could also discourageinvestment in innovation due to bureaucratic andlengthy processes.
FOR CONTRACTING INNOVATIONSUPPORT SERVICES
The high cost of the hiring innovation support servicesis the main barrier perceived by the surveyedcompanies.
About 36% think that No short-term profitability of the
service is also an obstacle. Lack of visible added-value at the time of contracting services to support innovationis a barrier for 31,5% of the responders.
For 30,3% of the companies the specificity of certainservices limits the choice of a provider.
70,8%
42,7%
41,6%
19,1%
16,9%
14,6%
12,4%
33,7%
27,0%
34,8%
15,7%
3,4%
Funding
Risk
Shortage of skilled staff &managers
Difficulty in attracting R&D / technical staff
Lack of information on Publicsupports
Lack of information on newproducts, markets,…
Inadequate infrastructure
Incertitude on the potencialmarket
Lack of time
Difficulties in findingpartnerships
Regulations
Others
0% 50% 100%
Small Medium Large Total of Companies
52,8%
18,0%
36,0%
Price
Mistrust on Industrial
Property
No short - term profitabilityof the service
Lack of visible added-value
0% 50% 100%
Chart 58 Main barriers to innovate, %
Chart 59 Main barriers perceive for contractinginnovation support services

8/8/2019 Atlant-KIS Audit Report September 2010
http://slidepdf.com/reader/full/atlant-kis-audit-report-september-2010 34/42
A u d i t M ar k e
European Programmes
6th Framework Programme
7th Framework Programme
National Programmes
QREN - Quadro de Referência EstratégicoNacional
National Strategic Reference Framework
POPH - Programa Operacional TemáticoPotencial Humano
Human Potential Thematic Operational Programme
POR - Programas Operacionais RegionaisRegional Operational Programmes
Chart 60 Application of the support received from theinnovation support programs, %
Chart 61 Evaluation of the support received from theinnovation support program,%
3.5Supports
INNOVATION SUPPORT PROGRAMS
In Portugal in 2006, 11,9 % of the innovativecompanies have received some type of public funding.Central Government was the main source of funding,followed by the European Union. Funding from the 6 th Framework Program and from Local or regionalauthorities were also important sources of funding.6
In the Audit, 74 % of the companies have receivedfunding from innovation support programs during thelast three years.
The main European Programs were the 6 th and 7th Framework Programs. At a National level, the NationalStrategic Reference Framework (QREN) plays a majorrole, but also the Operational Programs are important
sources of support especially the Human PotentialThematic (POPH) and the Regional Program (POR).
SERVICE PROVIDER AND EVALUATION
Half of the surveyed companies had applied to the
innovation support programs directly and the other halfresorted to intermediaries.
Most of the companies contract consultants to deliverthe service. Nevertheless, some companies refer thatuniversities are also preferential partners for thepreparation of proposals.
The resource to intermediaries was justified by the
complexity of the application process, the added value instructuring and implementing the project and thesimplification of the administrative process.
From the companies that evaluated the supportprovided, 50% classified it as Good and 28% as
44%
29%
17%
7% 3% Innovation
Internationalization
Training
Clusterization andNetworkingOthers
11%
50%
28%
11%Excellent
Good
Sufficient
Insufficient
8/8/2019 Atlant-KIS Audit Report September 2010
http://slidepdf.com/reader/full/atlant-kis-audit-report-september-2010 35/42
A u d i t M ar k e
Positive aspectsGrants and Funding of innovationactivities
Enhancement of the companies' know-how, expertise and improvement of thehuman resources
New partnerships for the company
Follow-up and clarification of doubts
Negative aspects
Low rate of financial support
Bureaucratic and complex processes thatrequire time and allocation of humanresources
Delay in payments
Difficulties in the monitoring the project
Chart 62 Estimation for the evolution of the % ofturnover invested in innovation for the next threeyears, %
POSITIVE AND NEGATIVE ASPECTS ANDSUGGESTIONS FOR IMPROVEMENT
Suggestions for improvement
Service support to candidates withinformation and training sessions
Optimization of the online tools
Simplification of the innovation supportprograms
Celerity and rigor concerning the deadlinesfor submitting applications, publishing resultsand the payments
Better coordination of entities that supportinnovation activities
Implementation of an internal system toimprove the service
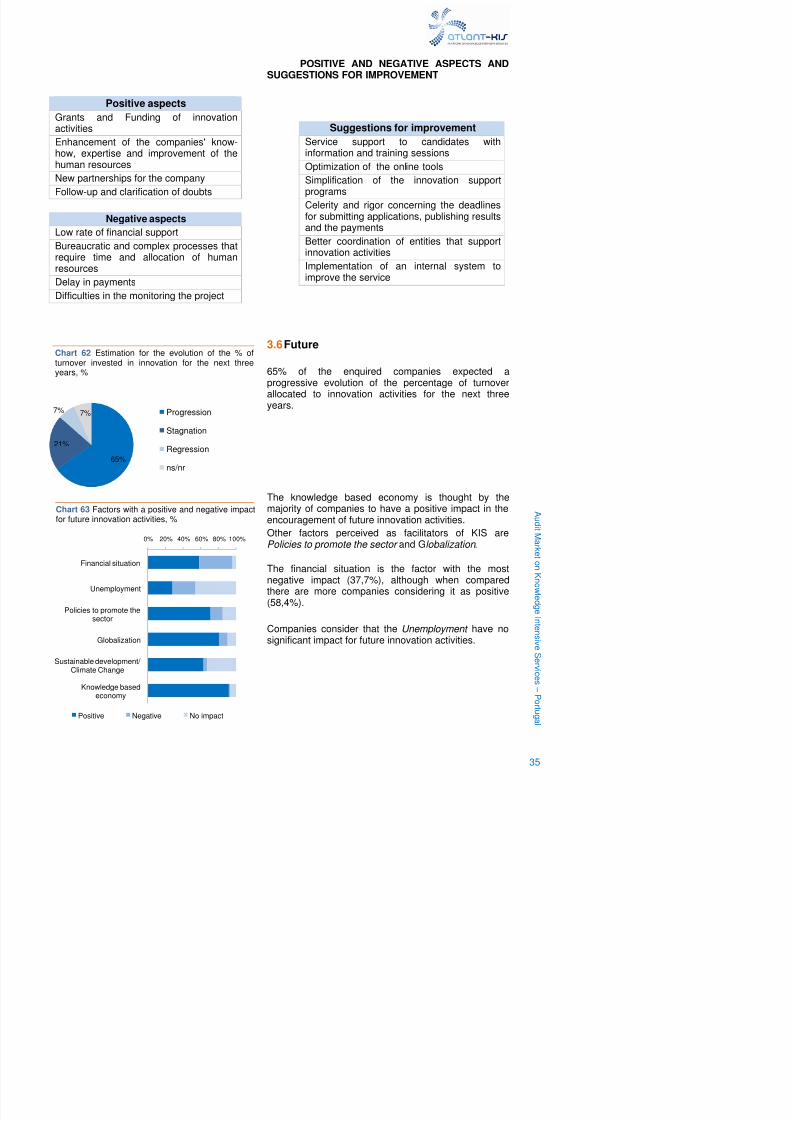
3.6Future
65% of the enquired companies expected aprogressive evolution of the percentage of turnover
allocated to innovation activities for the next threeyears.
The knowledge based economy is thought by themajority of companies to have a positive impact in theencouragement of future innovation activities.
Other factors perceived as facilitators of KIS arePolicies to promote the sector and Globalization .
Chart 63 Factors with a positive and negative impactfor future innovation activities, %
65%
21%
7% 7% Progression
Stagnation
Regression
ns/nr
0% 20% 40% 60% 80% 100%

8/8/2019 Atlant-KIS Audit Report September 2010
http://slidepdf.com/reader/full/atlant-kis-audit-report-september-2010 36/42
A u d i t M ar k e
4.CONCLUSIONS
4.1MAIN RESULTS FROM THE AUDIT
Supply
• The majority of KIS companies that answered are micro and small companies (89,5%). This canbe explained by the registered increase of the number of KIS providers in Portugal since 2004;
• 61% of companies have a specific R&D department;
• The income evolution for the majority of the companies has been progressive on the last threeyears;
• Most of the provided services are referred to Project identification and management, Design and development of engineering projects and ICT Consultancy. Universities provided services arerelated with Technology Transfer and Laboratories ;
• The main target markets of KIS companies and Universities are Services for companies, Energy and ICT ;
• Regarding the type of innovation promoted with clients over the last three years, more than athird has been on product/service innovation (35,9%);
• 82% of the total employees have Higher education;• The main barriers to access the KIS market pointed by the surveyed companies are Ignorance
of the demand side concerning the offered services, Lack of visible added-value and the Price ;
• The main EU Programs recognized are Seventh Framework Program (FP7) and Interreg.National Strategic Reference Framework (QREN) and Human Potential Operational Program(POPH) are the national programs that more contribute for the development of KIS;
• 42,6% of companies that answered use these programs to develop their innovation activities andto find and strengthen partnerships with external entities and companies;
• The majority of the companies have already collaborated with another KIS provider;
• 77% of the companies and 72% of the Universities expect to increase investment in innovationfor the next three years.
Demand
• Two thirds of the responders are small companies, of which, half are micro companies with lessthan 10 employees;
•
60% of the companies surveyed confirmed a progressive evolution of turnover over the pastthree years;
• 59,6% of the companies surveyed had an increasing investment in innovation over the last threeyears;
• 91,6% of the companies have undertaken an innovation activity, even if not successful, in thelast three years Most of it was for the conception or development of products/ services;

8/8/2019 Atlant-KIS Audit Report September 2010
http://slidepdf.com/reader/full/atlant-kis-audit-report-september-2010 37/42
A u d i t M ar k e
4.2 MAIN RESULTS FROM MATRIX OF COMPETENCIES SUPPLY-DEMAND KIS
SECTOR - Annex 1
Analyzing the Matrix of Competencies that confront the supplied with the demanded services, it can beconcluded that there are some sectors where the supply does not cover all the demand. On the otherhand, there are also services that are oversupply.
Supply < Demand Supply > Demand
Telecom Network Connections (1,77% / 5,02%)Open Innovation, Dynamisation of
R&D
(6,60% / 3,35%)
Laboratories (1,18% / 4,46%)Design and development ofengineering projects
(9,2% / 6,51%)
Assistance for quality processes (2,59% / 5,76%)Business Intelligence services,Competitive Intelligence
(4,95% / 2,60%)
Market Research (2,71% / 5,39%)Project identification andmanagement
(9,55% / 7,43%)
(% of provided services / % of demanded services)
Services related with Telecom Networks Connections and Laboratories have more demand than supply,so there is a market gap. Open Innovation, Dynamisation of R&D and Design and development ofengineering projects are oversupply.7
4.3 MAIN RESULTS FROM MATRIX OF SECTOR SPECIALISATION OF THE DEMANDAND SERVICES REQUESTED – Annex 2
This Matrix establishes the relationship between the provided and requested KIS. For that, it wascomputed the total number of the services provided by the KIS companies and Universities/ Associations and the total number of services requested by SME’s.
The ratio between the number of companies in a specific sector requesting KIS and the total of KISrequests provide the sectors that most required KIS.The most demanded services are given by the ratio between the number of companies requiring aspecific service and the total number of KIS requests.
Sectors that most required KIS Most demanded services ICT 13,3% Project identification and Management 10,6%
Services for enterprises 10,8% ICT consultancy 8,8%
Design and de elopment of engineering

8/8/2019 Atlant-KIS Audit Report September 2010
http://slidepdf.com/reader/full/atlant-kis-audit-report-september-2010 38/42
A u d i t M ar k e
5.RECOMMENDATIONS
This section will describe the recommendations from the enquiries regarding potential aspects that couldbe improve or create in order to promote the development of the KIS sector in Portugal.
CREATION OF A NATIONAL STRATEGY FOR KIS SECTOR:
The aim of this recommendation is to create policies to promote the development of the KIS sector. It issuggested a common coordination between all the entities in order to build a national strategy in whichshould be included programs and policies to:
• Promote the sector among potential clients;
• Promote the internationalization of the companies;
• Support the innovation projects in all stage of development, including during the transition to themarket, not only in financial terms but also with technical support (qualify human resources,informative and training sessions...);
• Increase the rate of experimentation of new innovative products/ services;• Create networks of companies, associations, universities and entities related with KIS with the
aim of exchange know-how and good practices.
• Enhance the relation between the knowledge providers/ producers and the companies/ entitiesthat can transfer the innovation to the market.
PROMOTE AND IMPROVE THE LINK BETWEEN COMPANIES AND UNIVERSITIES:
The link between companies and Universities is thought to be an important factor for the development ofthe KIS sector. Nevertheless, is not yet sufficiently developed in order to be a support to the innovationprocess.
Other aspect to be considered is the important role of Universities to qualify human resources.Companies felt difficulty to find employees to develop their innovation projects. Following that, it isrecommended the approach of the students during their studies to the companies through internships
and co-development of projects. This would lead to the acquisition of new competencies and awarenessof technical procedures.
PROMOTE AN INNOVATION CULTURE:

8/8/2019 Atlant-KIS Audit Report September 2010
http://slidepdf.com/reader/full/atlant-kis-audit-report-september-2010 39/42
A u d i t M ar k e
SIMPLIFICATION OF THE PROCEDURES IN THE NATIONAL SUPPORT PROGRAMS:
The support programmes are perceived as being too complex and bureaucratic which allocates many
human resources and are time consuming. One suggestion is its simplification through the optimizationof the online tools.
Another is the harmonization with the Community procedures and the implementation of an internalsystem to improve the service. It was also referred by the surveyed companies that a better coordinationof entities that support innovation activities would be helpful.
The candidates felt a lack of support and the information available is not sufficient to make a proper
application to the programmes. In this order, it was proposed as recommendations the creation of anonline platform to exchange experiences and knowledge.
Another suggestion was the effective dissemination of the support programs through newsletters,events, and publications … associated with training sessions for candidates.

8/8/2019 Atlant-KIS Audit Report September 2010
http://slidepdf.com/reader/full/atlant-kis-audit-report-september-2010 40/42
A u d i t M ar k e
6.Annexes

8/8/2019 Atlant-KIS Audit Report September 2010
http://slidepdf.com/reader/full/atlant-kis-audit-report-september-2010 41/42
Annex 2 MATRIX OF SECTOR SPECIALISATION OF THE DEMAND AND SERVICES REQUESTED

8/8/2019 Atlant-KIS Audit Report September 2010
http://slidepdf.com/reader/full/atlant-kis-audit-report-september-2010 42/42
A u d i t M ar k e t onK n owl e d
g eI n t en s i v e S er v i c e s –P o
r t u g al
Annex 2 - MATRIX OF SECTOR SPECIALISATION OF THE DEMAND AND SERVICES REQUESTED