Athletic Training Locations and Services (ATLAS) Project
55
ATLAS Project Report 2020 1 Athletic Training Locations and Services (ATLAS) Project 3 rd ANNUAL REPORT 2019-2020 AY Produced by The Korey Stringer Institute, University of Connecticut in association with the National Athletic Trainers’ Association https://ksi.uconn.edu/atlas/atlas-report-2/ Prepared by: Robert A. Huggins, Ph.D., LAT, ATC Kelly A. Coleman, MS, LAT, ATC Erica M. Filep, MSEd, LAT, ATC Ayami Yoshihara, MS, LAT, ATC Douglas J. Casa, Ph.D., FNATA, ATC June 17, 2020
Transcript of Athletic Training Locations and Services (ATLAS) Project

ATLAS Project Report 2020
1
Athletic Training Locations and Services (ATLAS) Project
3rd ANNUAL REPORT
2019-2020 AY
Produced by The Korey Stringer Institute, University of Connecticut in association with the National Athletic Trainers’ Association
https://ksi.uconn.edu/atlas/atlas-report-2/
Prepared by:
Robert A. Huggins, Ph.D., LAT, ATC Kelly A. Coleman, MS, LAT, ATC Erica M. Filep, MSEd, LAT, ATC Ayami Yoshihara, MS, LAT, ATC
Douglas J. Casa, Ph.D., FNATA, ATC
June 17, 2020

ATLAS Project Report 2020
2
Acknowledgments: We would like to acknowledge the late Korey Stringer whose death from exertional heatstroke led to the development of the Korey Stringer Institute (KSI) at the University of Connecticut. KSI’s mission from day one has been to prevent sudden death in sport and improve the health and safety of athletes, soldiers, laborers and the physically active. We would also like to thank Dr. Douglas Casa for his leadership, passion, insight and expertise that has enabled KSI to grow so rapidly. We know that the good work that we do at KSI helps so many helpless individuals and saves the lives of countless others. We would like to acknowledge the National Athletic Trainers’ Association (NATA) for having the foresight to fund the Korey Stringer Institute with the “Benchmark” or “CATCH-ON Study” that served as the launching pad for the ATLAS Project. We also acknowledge the directors of those studies, Riana R. Pryor and Alicia M. Pike for their passion to embark on this monumental, yet critical task for secondary school athletic trainers and the patients under their care. Furthermore, we would like to acknowledge the continued support from the past and present NATA Secondary School Athletic Trainers’ Committee Members for organizing the boots on the ground effort that was required to map every single high school and for their continued support and push for the ATLAS Project. We would like to acknowledge the corporate partners of KSI who have enabled KSI to continue to strive for excellence and to sustain us as a not-for-profit organization. A special thanks to our founding partners: The University of Connecticut and The UCONN Foundation, The National Football League (NFL) and Gatorade. To the NATA, MISSION, Camelbak, Kestrel, DeFibtech and Eagle Pharmaceuticals, thank you for you continued support of the mission of KSI. Without all of you none of these projects would be possible. To Larry Cooper, Ronnie Harper, and Robert Huggins who brainstormed the idea for the ATLAS project on March 26, 2015 at Dos Cominos Restaurant in New York City, NY on a bar napkin while attending the 1st Collaborative Solutions For Safety in Sport Meeting, thank you. And to the great state of Louisiana who introduced the KSI team to the Zeemaps software which allows for the interactive online mapping software for all 50 US states and DC upon which the ATLAS data is depicted. Lastly and most importantly, we would like to thank all those who have assisted with the collection of the data provided in this report. Whether as an employee, graduate student, independent study student, volunteer, or athletic trainer who participated/promoted/contacted/etc. in any way to assist with the mapping and/or in-depth questionnaire, we THANK YOU and the profession of athletic training THANKS YOU! FUNDING & DISCLOSURES: The Korey Stringer Institute is supported by the University of Connecticut, the UCONN Foundation, the NFL, Gatorade, the NATA, MISSION, Kestrel by NK, Camelbak, DeFibtech, and Eagle Pharmaceuticals. All rights reserved. This material may not be published, broadcast, rewritten or redistributed in whole or part without the express written consent of the Korey Stringer Institute and the National Athletic Trainers’ Association. Contact the Korey Stringer Institute and the ATLAS Project for all questions regarding this report at www.ksi.uconn.edu

ATLAS Project Report 2020
3
Table of Contents Introduction .................................................................................................................................................. 5
Methods ....................................................................................................................................................... 7 Participants .............................................................................................................................................................. 7 Figure 1. ATLAS DATA Acquisition Timeline and Exports ........................................................................................... 8 Figure 2. Example of Publicly Available Online Mapping ........................................................................................... 9 Analyses ................................................................................................................................................................. 12
Results ........................................................................................................................................................ 12
ATLAS Mapping Results ............................................................................................................................... 12 AT Services ............................................................................................................................................................. 12 AT Services by Locale .............................................................................................................................................. 16
ATLAS Questionnaire Results ....................................................................................................................... 19 AT Employment ...................................................................................................................................................... 19 AT Education .......................................................................................................................................................... 22
References .................................................................................................................................................. 23 Table 1. Athletic Training Services in US Secondary Schools, by State ..................................................................... 25 Figure 3. Access to Athletic Training Services by State and District .......................................................................... 26 Figure 4. Access to Full-time Athletic Training Services by State and District ........................................................... 27 Figure 5. Access to Part-time Athletic Training Services by State and District .......................................................... 28 Figure 6. Athletic Training Services in US Secondary Schools ................................................................................... 29 Table 2. Athletic Training Services in US Public Secondary Schools, by State ........................................................... 30 Table 3. Athletic Training Services in US Secondary Private Schools, by State ......................................................... 31 Table 4. Athletic Training Services in US Secondary Schools, Comparison ............................................................... 32
Athletic Training Services by NATA District .................................................................................................. 32 Table 5. Athletic Training Services in US Secondary Schools, by NATA District ......................................................... 32 Table 6. Athletic Training Services in US Public Secondary Schools, by NATA District .............................................. 33 Table 7. Athletic Training Services in US Private Secondary Schools, by NATA District ............................................. 33
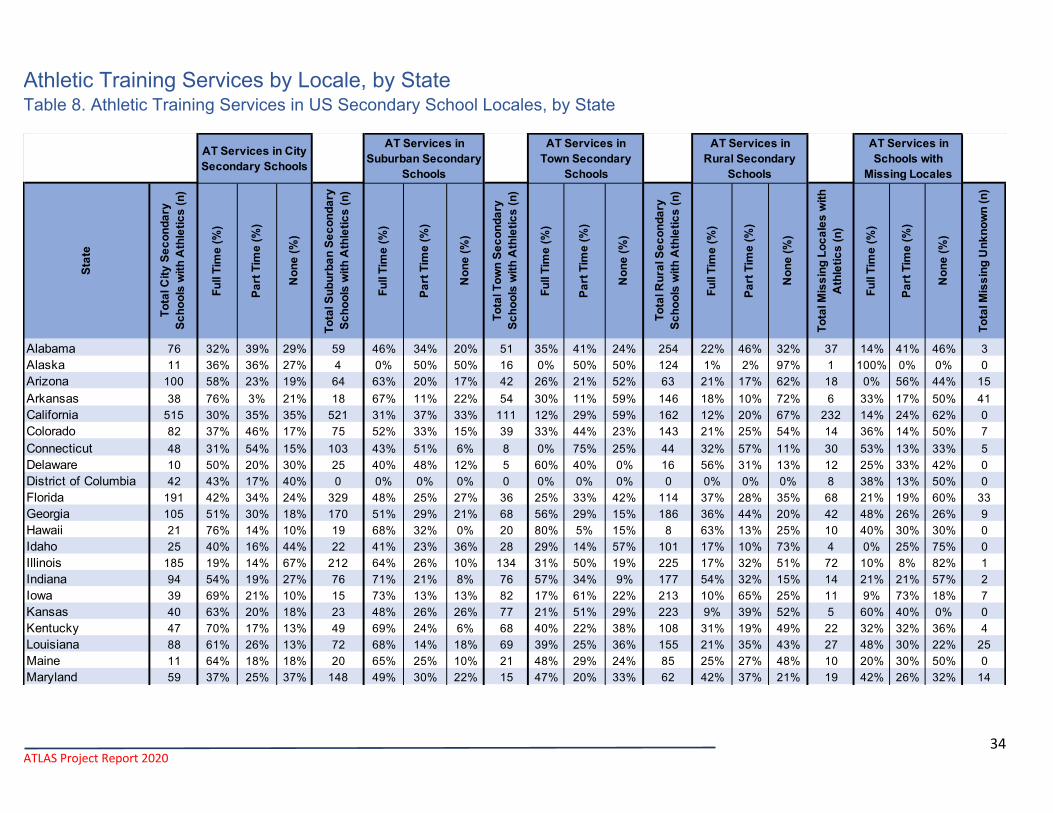
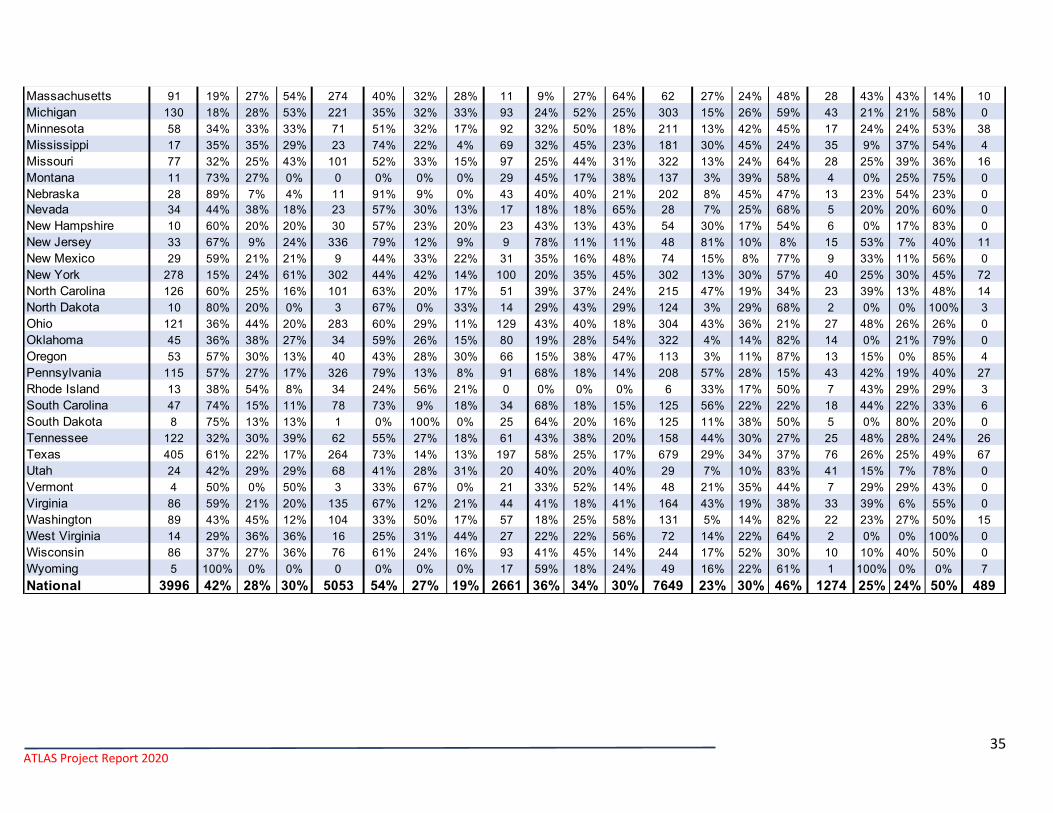
Athletic Training Services by Locale, by State .............................................................................................. 34 Table 8. Athletic Training Services in US Secondary School Locales, by State ........................................................... 34 Table 9. Athletic Training Services in US Public Secondary School Locale, by State .................................................. 36 Table 10. Athletic Training Services in US Private Secondary School Locale, by State .............................................. 38 Table 11. National Athletic Training Services in US Secondary School Locale Comparison ....................................... 40 Figure 7. AT Services by Locale ................................................................................................................................ 41
Athletic Training Services by Locale, by NATA District .................................................................................. 42

ATLAS Project Report 2020
4
Table 12. Athletic Training Services in US Secondary School Locales, by NATA District ............................................ 42 Table 13. Athletic Training Services in US Public Secondary School Locales, by NATA District .................................. 43 Table 14. Athletic Training Services in US Private Secondary School Locales, by NATA District ................................ 44 Table 15. Employment Model in US Secondary Schools, by State ............................................................................ 45 Table 16. Employment Model in US Public Secondary Schools, by State .................................................................. 46 Table 17. Employment Model in US Private Secondary Schools, by State ................................................................ 47 Table 18. Employment Model of Athletic Trainers in the United States Comparison ............................................... 48 Figure 8. Employment Type for AT Services in US Secondary Schools ...................................................................... 48
Athletic Training Services by Employment Model, by NATA District ............................................................. 49 Table 19. Employment Model in US Secondary Schools, by NATA District ............................................................... 49 Table 20. Employment Model in US Secondary Public Schools, by NATA District ..................................................... 49 Table 21. Employment Model in US Secondary Private Schools, by NATA District ................................................... 50
Athletic Training Services by Education Level, by State ................................................................................ 51 Table 22. AT Education Level in US Secondary Schools, by State ............................................................................. 51 Table 23. AT Education Level in US Public Secondary Schools, by State ................................................................... 52 Table 24. AT Education Level in US Private Secondary Schools, by State ................................................................. 53 Table 25. Secondary School AT Education Level in the United States Comparison ................................................... 54
Athletic Training Services by Education Level, by NATA District ................................................................... 54 Table 26. AT Education Level in US Secondary Schools, by NATA District ................................................................ 54 Table 27. AT Education Level in US Public Secondary Schools, by NATA District ...................................................... 54 Table 28. AT Education Level in US Private Secondary Schools, by NATA District ..................................................... 55
ATLAS Project Report 2020
5
Introduction Prior to 2010 the National Athletic Trainers’ (NATA) Secondary School Athletic Trainers’
Committee (SSATC) was continually working with the leadership from member states within
each of the 10 NATA districts to quantify the extent of secondary schools in the United States
that received care from Athletic Trainers (ATs). In some states, this information was routinely
maintained by the state athletic training leadership or a member(s) of the SSATC who were
connected and well-known within that state at the secondary school level. The NATA Office
assisted through the provision of membership records for secondary school athletic trainers
(SSATs); however, keeping up with the ever-changing landscape, coupled with the fact that
not all SSATs were members of the NATA, proved challenging. Furthermore, detailed
information of the NATA membership was not available for dissemination by the NATA due to
privacy considerations for its members. Thus, prior to 2010 there was no formal or
comprehensive structure in place on a national scale to monitor and track the extent of athletic
trainer services in all 50 states and the District of Columbia. Outside of funded research
studies, key information pertaining to national employment trends, education level, extent of
Athletic training services or care, best practice policies, physician oversight, insurance claims,
and the ability to understand the needs of the profession in the secondary school setting were
difficult to readily ascertain and report. While some states were quite successful in reaching
out to all SSATs within their state and were able to capture valuable information regarding the
address, sport class size, county, division, and even employment model, a cohesive
mechanism to provide continuous updating and long-term prospective sustainability was not
present.
Recognizing the importance of this information to secondary schools and the magnitude
of this task, the NATA and the NATA SSATC Committee tasked the Korey Stringer Institute
(KSI) with establishing a benchmark of the AT services in the US. With funding from the NATA

ATLAS Project Report 2020
6
in addition to using its own funding KSI opened a research calling center with the goal of
reaching out via phone to every high school, public (PUB) and private (PVT), in the US to
determine if they have an athletics program, an AT (and if so to what extent), high-risk sports
and the number of students and student-athletes enrolled at the school. This project has been
commonly referred to as the “NATA Benchmark Study” and took over 4 years to complete.1
The results of which were published in three parts (PUB,1 PVT,2 and PUB+PVT combined).3
The first was entitled “Athletic Training Services in Public Secondary Schools: A Benchmark
Study”,1 the second was “Athletic Trainer Services in US Private Secondary Schools”,2 and the
third was Athletic Trainer Services in Public and Private Secondary Schools3 all of which were
published in the Journal of Athletic Training between 2015-2017. Following these landmark
studies, which included an overall response rate of 52% (n=10,553) of secondary schools,
findings revealed that 67% of the respondents in this sample had access to on-site AT
services. Of those that had access to on-site AT services, 35% had full-time, 30% had part-
time, and 3% were per diem. (See Table 1 below)
While not directly reported in these publications, calculations suggest that the remaining 33%
of respondents reported no access to on-site AT services.3 Findings from these studies also
determined that overall student enrollment plays a role in the level of services. Schools with

ATLAS Project Report 2020
7
enrollment <600 students more frequently reported part-time services while schools with ≥600
students more frequently had full-time AT services.1 Additionally, qualitative findings from Pike
et. al note that, school representatives deemed lack of funding, lack of knowledge of ATs, and
rural locale as key social determinants hindering the hiring of AT services in PUB and PVT
schools.3 Perhaps of greatest note is this research was a snapshot with limited plans for future
analysis, integration, and applicability for the AT profession. Following completion of this
project, the KSI saw an opportunity to create the Athletic Training Locations and Services
(ATLAS) Project4 whose purposes include:
1. Creating a real-time database of athletic training services in secondary schools
2. Creating a directory for each state’s athletic training association and high school
athletics association
3. Assisting states in moving toward full-time athletic training services
4. Providing useful data to each state’s athletic training association and high school
athletic association
5. Identifying common factors associated with increased athletic training services across
the country
6. Improving the delivery of healthcare services via improved communication between
secondary schools
Methods Participants
Information related to PUB (n=16,683) and PVT (n= 4,435) secondary schools from all
50 states and District of Columbia are obtained and included in the ATLAS database. PUB and
PVT secondary schools throughout the United States with a school-sanctioned interscholastic
athletics program who offered at least one grade between 9-12 are included. All school types

ATLAS Project Report 2020
8
(PUB, PVT, alternative, charter, magnet preparatory, technical and vocational schools) were
included as long as they reported having school-sanctioned interscholastic athletics. For
secondary schools with athletics programs that co-op with other local area schools, the
secondary school housing the athletics program was used while the secondary school without
was removed from the analyses. If both schools reported athletics programs, both were
included in the database.
The ATLAS database contains information from various data sources and consisted of two
major phases; phase I was the “mapping phase” and phase II was the “questionnaire phase”.
These phases began simultaneously in January of 2016. The timeline of this process is
depicted in the publication by Huggins et al.4 in the Journal of Athletic Training (reprinted
below)
Figure 1. ATLAS DATA Acquisition Timeline and Exports
ATLAS Project Report 2020
9
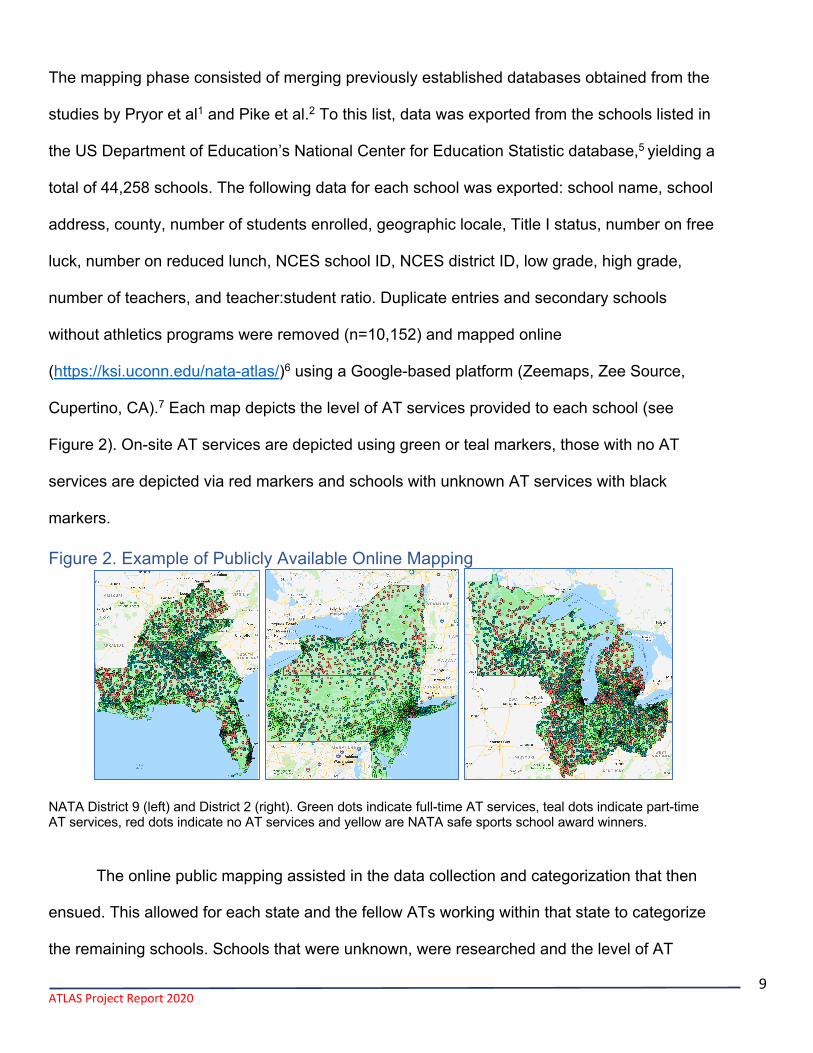
The mapping phase consisted of merging previously established databases obtained from the
studies by Pryor et al1 and Pike et al.2 To this list, data was exported from the schools listed in
the US Department of Education’s National Center for Education Statistic database,5 yielding a
total of 44,258 schools. The following data for each school was exported: school name, school
address, county, number of students enrolled, geographic locale, Title I status, number on free
luck, number on reduced lunch, NCES school ID, NCES district ID, low grade, high grade,
number of teachers, and teacher:student ratio. Duplicate entries and secondary schools
without athletics programs were removed (n=10,152) and mapped online
(https://ksi.uconn.edu/nata-atlas/)6 using a Google-based platform (Zeemaps, Zee Source,
Cupertino, CA).7 Each map depicts the level of AT services provided to each school (see
Figure 2). On-site AT services are depicted using green or teal markers, those with no AT
services are depicted via red markers and schools with unknown AT services with black
markers.
Figure 2. Example of Publicly Available Online Mapping
NATA District 9 (left) and District 2 (right). Green dots indicate full-time AT services, teal dots indicate part-time AT services, red dots indicate no AT services and yellow are NATA safe sports school award winners.
The online public mapping assisted in the data collection and categorization that then
ensued. This allowed for each state and the fellow ATs working within that state to categorize
the remaining schools. Schools that were unknown, were researched and the level of AT

ATLAS Project Report 2020
10
services was confirmed by researchers, NATA staff, the NATA SSATC Chairs and each state
AT association's secondary school committee or AT association state president. A list of
schools with unknown AT services status was provided to each of these groups. They were
asked to reach out to schools via e-mail, phone, personal means, or other forms with a set of
questions to ask of the school representative. (1) “Does the school have an athletics
program?”; (2) “Does the school receive healthcare services from an AT?” If the school
answered yes to AT services then the next questions were; (3) “How many ATs provide these
services?” and (4) “Can you provide us with the AT’s contact information or email so that we
may call or send them a questionnaire recruitment email?” If the school answered no to having
athletics, the school was removed from the database. If they answered yes to having athletics,
but no regarding the provision of healthcare services in the form of an AT, they were listed in
the database as no AT services and the questioning was complete. In circumstances where a
school representative provided the responses, in an effort to reduce the inaccuracy of
reporting, every attempt was made to garner a response from the secondary school AT who
provided care to that school’s athletes. If no AT was identified, then responses to the questions
were gathered from the athletic director, principal or assistant principal, sport coach or school
office assistant. In the event that a school representative answered the questions and the AT
also answered (either via phone, email or online questionnaire), the response of the AT
superseded that of the school official. If both a school representative and the AT answered the
questions, the response of the AT was used over the response of school official. Throughout
the categorization process, the state lists that were shared with the NATA Secondary School
Athletic Training Committee Chairs and each state association’s secondary school committee
were cross-referenced by the researchers and the online maps were updated to reflect the
changes to help expedite and track the progress being made in each state. Next, the online
maps were updated, and revised lists of unknown secondary schools were provided to each

ATLAS Project Report 2020
11
NATA SSATC Chair and/or to state athletic training association leaders/liaisons actively
working with KSI until the national mapping was completed on February 21, 2018.
In addition to these aforementioned methods, another means of data acquisition was
used. The KSI and NATA utilized various national marketing efforts including social media
such as Facebook and Twitter, e-blasts, NATA and KSI blog posts, advertisements at national,
district, and state AT meetings, articles in the NATA News and embedded links on websites to
direct ATs to the maps and asked them to participate in the ATLAS questionnaire.8
The ATLAS questionnaire was developed by the researchers with assistance from the
NATA SSATC. Two content area research experts, one with experience in secondary school
athletic training research and one with leadership experience in the secondary school AT
setting, and an AT graduate assistant researcher determined the content examined in the
descriptive items of the questionnaire and judged the appropriateness of the items. After the
questionnaire was completed and uploaded to the online platform, four content area experts,
two members of the NATA SSATC Committee and two content area researchers with
expertise in the development and administration of online questionnaires, reviewed the
questionnaire for face and content validity. After establishing face and content validity, one
state was selected to pilot the questionnaire and provide feedback. Their responses were
analyzed, and multiple-choice options were expanded to include all potential responses. Given
that all items in this questionnaire are descriptive in nature, centered around a singular
construct of availability of AT services in secondary schools, the instrument did not necessitate
criterion or construct validity. The questionnaire was then made publicly available via an open-
access link. Annually in the month of August, additional questions were added to enhance the
description of various items based on request from the NATA and future research interests;
however, the original questions remained unchanged. The additional items underwent the
same face and content validation process as previously described. In the event that more than
ATLAS Project Report 2020
12
one AT from a school completed the questionnaire or if an individual responded to the
questionnaire more than once, the most recent and complete questionnaire was utilized.
Analyses The management of the ATLAS data files for each state were managed using Microsoft
Excel (Version 16.14.1, Microsoft Corporation, Redmond, WA). Descriptive statistics including
counts, ranges, and percentages for FT, PT and no AT services for PUB, PVT, and PUB+PVT
combined by state by employment, by locale,9 by education level and by NATA district are
included in this report. Although not reported, mean ± standard deviation (SD), as well as
+2SD and -2SD were calculated and mentioned in the analyses. Full-time AT services were
operationally defined as a school who receives AT services for ≥ 30 hours per week, ≥ 5 days
per week, ≥ 10 months per year. Part-time AT services were defined as, anything less than
full-time, and no AT services meant that at no time does the school receive any services from
an AT. The highest (top 5 with the highest relative percentages) and lowest (bottom 5 lowest
percentage) were also reported.
Results The overall response rate for the ATLAS mapping in 2019AY was 98%
(n=20,629/21,118). Two percent of schools (n=489) and the extent of their AT services are
unknown. For the ATLAS questionnaire phase, of the secondary schools with AT services
(n=13,506), an overall response rate of 63% (n=8,514) as of June 6, 2020 are included in this
report. This is a 9.2% (n=717) increase in questionnaires completed from the previous
academic year (AY 2018).
ATLAS Mapping Results AT Services
Of total PUB and PVT secondary schools combined with athletics programs (n=21,118),
64% (n=13,506) receive AT services while 34% (n=7,127) have no AT services (see Table 1).

ATLAS Project Report 2020
13
Of those secondary schools with AT services, 35% (n=7,478) receive full-time services and
29% (n=6,028) receive part-time. The range of access to AT services is from 15% (Alaska) to
87% (Hawaii and New Jersey). The national map (Figure 3) depicts AT services in each state
as well as by NATA district. The range of full-time, part-time and no AT services are 4-76%, 8-
56% and 11-85%, respectively. The top states with the highest percentage of access to AT
services are Hawaii, New Jersey, Connecticut, Pennsylvania, Indiana, and Ohio while the top 5
for percentage of full-time services are New Jersey, Hawaii, Pennsylvania, South Carolina, and
Indiana. Figure 4 presents the percentages of full-time AT services by state and by NATA
district. The top states with part-time services are Iowa, Connecticut, Rhode Island,
Mississippi, Wisconsin, and Alabama. Figure 5 presents the percentage of part-time AT
services by state and by NATA district. The states with the highest percentage of secondary
schools without AT services are Alaska, Oklahoma, Idaho, North Dakota, and West Virginia.
When examining the total number of secondary schools with AT access in the states of Texas,
California, Ohio, Pennsylvania, and New York combined, they comprise 30% (n=4,037) of the
secondary schools with AT access nationwide. Interestingly, three of these states, Texas,
Ohio, and Pennsylvania, exceed the national AT access average of 64%.
Table 2 depicts the AT services nationally for PUB secondary schools. Compared to
PUB+PVT secondary schools combined, in the PUB secondary school setting, 67% of
secondary schools have access to AT services while 31% are without AT services of any kind.
Of those PUB secondary schools with AT services (n=11,174), 37% are employed full-time
while 29% are part-time. Visually these findings are presented in Figure 6. The ranges for
access (full-time, part-time and no AT services) in the PUB secondary school setting is 14-
96%, 3-87%, 8-58%, and 4-86%, respectively. The top states with access to AT services in the
PUB secondary school setting are Hawaii, New Jersey, Delaware, Pennsylvania, and
Connecticut. Of note, when examining full-time services, three states (Hawaii, New Jersey,

ATLAS Project Report 2020
14
and South Carolina) meet or exceeded 73% which coincides with two standard deviations
above the mean, and Pennsylvania and Virginia round out the top 5 states with the highest
percentage of full-time services. Part-time services are highest in Connecticut, Iowa, Rhode
Island, Vermont, and Wisconsin. AT services appear to be most needed in PUB secondary
schools with athletics in Alaska, Oklahoma, Idaho, North Dakota, West Virginia, and New
Mexico.
Athletic Training services in PVT secondary schools (Table 3) demonstrate on average
a 14% reduction compared to the PUB secondary schools in access to AT services (53%),
~9% reduction in full-time and ~5% reduction in part-time services. Of those PVT secondary
schools with AT services (n=2,332), there is nearly an even split of 28% of ATs employed full-
time and 25% employed part-time. States with the highest access to AT services in PVT
secondary schools are Rhode Island, South Dakota, Nebraska, Connecticut, and Hawaii. Full-
time services are highest in Rhode Island, Connecticut, District of Columbia, New Jersey, and
Hawaii. Notably, the full-time services rates in Rhode Island, Connecticut and the District of
Columbia are outliers compared to the rest of those with full-time services. The state of North
Dakota demonstrated the highest level of part-time services, followed by South Dakota, Iowa,
Mississippi, and Nebraska. The states with the largest percentage of PVT secondary schools
without AT services are Utah, Alaska, Idaho, Oregon, and Michigan. However, it is important to
note that these states only have 265 PVT secondary schools with athletics combined;
furthermore, three states have less than 10 PVT secondary schools with athletics in the entire
state (Wyoming n=5, North Dakota n=8, and Alaska n=9).
In summary, the overall comparison of AT services in PUB, PVT, and PUB+PVT
secondary schools combined are presented in Table 4, with summary data from the past two
ATLAS Reports (2017AY and 2018AY). There are nearly 4X the amount of PUB secondary
schools than PVT secondary schools with athletics in the United States. PUB secondary

ATLAS Project Report 2020
15
schools have increased access to AT services (+14%), which appears to be due to a greater
percentage of full-time services (+9%). In comparison to the ATLAS Reports from 2018 and
2019, there was a 2% reduction in access to AT services in PUB+PVT, PUB, and PVT
schools. This is likely due to the addition of 489 unknown schools to the ATLAS Database as
well as the clarification of the services that the secondary schools receive through the
information provided in the ATLAS Questionnaire. From a safety perspective, of greatest
concern is that 45% of PVT secondary schools do not have appropriate medical care yet they
have athletics and when we combine PUB and PVT schools, 34% (n=7,127) of secondary
schools nationwide do not have appropriate health care in the form of AT services during
school-sponsored athletics.
AT services in US secondary schools (PUB and PVT combined) by NATA District are
presented in Table 5. Districts 2, 3, and 9 have the highest percentage of secondary schools
with access to AT services (70%), with Districts 3, 2, and 6 having the highest percentage of
full-time services (49%, 47%, and 43%, respectively). Districts 10 and 5 have the highest
percentage of secondary schools without AT services (55% and 45%, respectively).
Interestingly, the current largest District (D4; n= 3918) has the 4th highest percentage of access
to AT services (68%). These data are likely to change next year as the NATA District 4 is split
in two and NATA District 11 is added. Additionally, in comparison to the 2018AY report, access
to AT services has decreased by -8% in District 2, -4% in District 9. Districts that have seen
larger increases compared to the previous year report are Districts 1 and 6 (+3%, +4%),
respectively.
Public secondary school AT services data by NATA District are presented in Table 6.
Identical to the combined data, Districts 9, 3, and 2 have the highest percentage of schools
with access to AT services (76%, 76%, and 73%, respectively). This is a change from 2018AY
by -5% in District 9, -5% in District 3, and -8% in District 2. Districts 3, 2, and 6 have the

ATLAS Project Report 2020
16
highest PUB school percentage of full-time services, while Districts 1, 4, 5, and 9 have the
highest PUB school percentage of part-time services. Districts 10, 5, and 8 have the highest
percent of no AT services.
Table 7 depicts the PVT secondary school AT services by NATA District. In this table,
Districts 1, 2, and 5 have the highest percentage of AT access (64%, 59%, and 57%,
respectively). However, it is important to note that while they have the highest, this is a change
from 2018AY by +8% in District 1, +8% in District 2, and -1% in District 5. Districts 1, 2, and 3
have the highest percentage of full-time services (40%, 35%, and 33%). In comparison to PUB
secondary schools, PVT secondary schools in Districts 1 and 5 have increased percentages of
full-time services (8% and 3%, respectively), which is dissimilar to all other districts.
Furthermore, in Districts 3, 6, and 7 between 25-27% more PVT schools are without AT
services than PUB secondary schools.
AT Services by Locale Locale data from NCES were present for 94% (n=21,118) of the secondary schools with
athletics programs included in the ATLAS database. Locales were not provided by NCES for a
total of 1,274 secondary schools for PUB (n=380) and PVT (n=893), respectively. The
percentage of AT services at PUB+PVT secondary schools combined in individual states are
described in Table 8. Regarding full-time AT coverage, Wyoming is the only state with 100%
full-time AT coverage in city schools. No state has full-time AT services in 100% of suburban
secondary schools however, the states of Nebraska, New Jersey, Pennsylvania, and South
Carolina have full-time AT services in over 75% of suburban secondary schools. Furthermore,
the states of South Dakota and Alaska are outliers with <5%, or >2 SD from the mean, of ATs
employed full-time in suburban locales. Similar to the suburban secondary schools, there are
no full-time AT services in 100% of town secondary schools. Additionally, the only state with
full-time AT services in >80% of rural secondary schools is New Jersey. New Jersey and

ATLAS Project Report 2020
17
Hawaii are outliers for full-time AT services in rural secondary schools with both >61% or 2SD
above the mean. Regarding AT access, the states of Montana, North Dakota, and Wyoming
have AT access in 100% of city secondary schools. The states of Hawaii, Montana, Nebraska,
South Dakota, and Vermont have AT access in 100% of suburban secondary schools.
Regarding secondary schools with no AT services there are two states who were outliers,
(>2SD or >55%) Illinois and New York. Data confirm that 67% of Illinois city secondary schools
(n=124) while 61% of New York city secondary schools (n=186), do not have access to AT
services. Of particular importance here is that the NYC public schools are in the Public School
Athletic League (PSAL) that do not have AT service and thus represent the large majority of
these schools. Further in suburban schools with no AT services, West Virginia and Alaska
were outliers, (>2SD or >40%). In town schools with no AT services there were no outliers,
however in rural schools there was 1 outlier (>2SD or >93%) in the state of Alaska.
The percentage of AT services by locale in PUB secondary schools are listed in Table
9. All of the city PUB secondary schools in 2 states have full-time AT services (North Dakota
and Wyoming). Ten states (Alaska, Hawaii, Iowa, Montana, Nebraska, New Hampshire, North
Dakota, Rhode Island, South Dakota, and Wyoming) have AT access provided to all city PUB
secondary schools. In 9 states, all suburban PUB schools have AT access (Hawaii, Iowa,
Kentucky, Mississippi, Nebraska, New Mexico, South Carolina, South Dakota and Vermont).
Two states (Delaware and Hawaii) have AT access in all town PUB secondary schools. Lastly,
only two states (Delaware and New Jersey) have AT access in all rural PUB secondary
schools. When examining the percentage of PUB secondary schools in city locales without AT
services, the states of Illinois and New York are outliers (>2SD or >59%) compared to all other
states. For PUB secondary schools without AT services in the suburban locale, West Virginia,
North Dakota, and Alaska were outliers (>2SD or >28%) while in the town locale Nevada and
Massachusetts were outliers (>2SD or >63%) of schools without AT services. In the rural

ATLAS Project Report 2020
18
locale, Alaska is an outlier with 97% of the 123 PUB secondary schools are without AT
services. The next highest state without AT services in rural locales is Oregon with 87%.
The percentages of AT services by locale in PVT schools are listed in Table 10. There
are 3 states where all PVT city secondary schools have 100% access to AT services
(Delaware, Montana, and North Dakota). All PVT suburban secondary schools in the states of
Hawaii and Nebraska have 100% AT access. In the states of Colorado, Delaware, and
Massachusetts all PVT secondary schools located in towns have AT access. Similarly, all PVT
rural secondary schools in state of Colorado (n=4) have access to AT services.
Table 11 and Figure 7 depict the locales of AT services of PUB, PVT, and PUB+PVT
secondary schools combined from the past 3 ATLAS reports (2017, 2018, and the current
report 2019). For PUB+PVT secondary schools combined on a national scale, the percentage
of full-time services is 42% in city secondary schools, peaks in the suburban locale with 54% of
schools and then is reduced in towns (36%) and rural locales (23%). Similarly, AT access in
PUB+PVT secondary schools combined is slightly lower in the city locale (70%) than the
suburban locale (81%) and is again reduced in towns (70%) and rural locales (54%). In PUB
secondary schools (city, suburban, town, rural) the percentage of schools with AT access is
73%, 89%, 74%, 55% and in PVT secondary schools the access is 63%, 55%, 39%, 41%,
respectively. When examining the locales with the highest percentage without AT services,
PUB+PVT secondary schools combined for city, suburban, town and rural locales are 30%,
19%, 30%, 46%, while PUB secondary schools are 27%, 11%, 26% and 45%, and PVT
secondary schools are 37%, 45%, 61% and 59%, respectively. PUB secondary schools
located in the suburban locales have the highest percentage of AT access across all locales
while PVT secondary schools located in towns have the lowest. PVT secondary schools
located in towns and rural locales have the highest percentage of secondary schools without

ATLAS Project Report 2020
19
AT services while PUB secondary schools located in cities and the suburbs have the lowest
percentage.
Table 12 describes the locales of AT services in PUB+PVT secondary schools
combined by NATA District. District 4 has highest percentage of secondary schools without AT
services in city schools (40%) followed by District 7 (32%). District 7 has the highest
percentage of secondary schools with AT services in suburban locales (87%) while District 5
has the highest percentage of secondary schools with AT services in towns (80%). In the PUB
secondary school setting (Table 13), District 1 is an outlier with the highest percentage of part-
time AT services in suburban secondary schools (49%) while District 2 is an outlier for full-time
AT services in both the town (59%) and rural (59%) locales. The only NATA district outlier in
the PVT setting by locale is District 8 (Table 14) with a higher percentage of part-time AT
services in the suburban (53%) locale and full-time AT services in the rural (55%) locale.
ATLAS Questionnaire Results AT Employment
The following results pertain to the 2019 AY ATLAS questionnaire. The topics examined in
these results are related to AT employment model in secondary schools with athletics. Of the 13,506
secondary schools with access to AT services, 63% of secondary schools have completed the
ATLAS questionnaire (Table 15). Of the 8,514 secondary school ATs who completed the ATLAS
questionnaire, 84% (n=7,112) of respondents are employed in U.S. PUB Secondary Schools and
16% (n=1,402) are employed in US PVT secondary schools. Most ATs are employed by a Medical or
University Facility (MUF; 57%), while 36% are employed by the School District (24% without teaching
responsibilities, 12% with teaching responsibilities), 4% are employed as Independent Contractors
(IC) and 3% are unknown. In PUB and PVT secondary schools combined (Table 15), four states are
outliers that have ≥82% of respondents providing AT services that are employed by the School

ATLAS Project Report 2020
20
District (New Mexico, District of Columbia, New Jersey, and Texas). Nevada has the largest
employment of Independent Contractors (17%) providing AT services in national secondary schools,
with two other states being outliers at ≥12% of AT services (South Dakota and California).
In the PUB secondary school setting alone, (Table 16) five states (District of Columbia, Hawaii,
New Jersey, New Mexico and Texas) are outliers in having ≥84% of respondents providing AT
services employed by the School District (with and without teaching responsibilities), while seven
states (Indiana, Iowa, Minnesota, North Dakota, Ohio, South Dakota, and Wisconsin) have ≥85% of
respondents providing AT services employed by Medical or University Facilities. Additionally, five
states (Rhode Island, California, Nevada, Delaware, and Alaska) are outliers with ≥13% of
respondents providing AT services employed as Independent Contractors in the PUB secondary
school setting.
In the PVT setting (Table 17), The District of Columbia is the only state with ≥85% of ATs
employed by the School District (with and without teaching responsibilities). Seven states have ≥85%
of respondents providing AT services to PVT secondary schools employed by a Medical or University
Facility (Alaska, North Dakota, Indiana, Mississippi, Wisconsin, Minnesota, and Ohio). While there
were no outliers for respondents employed by the School District or Medical or University Facility,
there were three states (Idaho, Kansas, and Nevada) that were outliers with ≥30% of respondents
employed as Independent Contractors. Compared to PUB secondary school employment from the
2018 AY Report, PVT secondary schools with ATs have decreased employment percentage for
School District employment (42% vs. 41%), decreased employment by Medical or University Facilities
(51% vs. 50%), and employment as an Independent Contractor remained the same (5%) (see Table
18). Examining the changes from AY 2018, in AY 2019 (Table 18) there were no changes in the
employment of AT services by School District overall (SD and SD+T) or by Medical or University
Facilities.

ATLAS Project Report 2020
21
The employment data by NATA District are presented in Tables 19. For PUB+PVT secondary
schools combined, District 3 and District 10 have the highest percentage of ATLAS Questionnaire
completion (78% and 77%), respectively. District 6 has the highest percentage of respondents
employed by the School District (60%), followed closely by District 8 (55%) and District 7 (54%).
District 4 has the lowest percentage (9%) of school district employee questionnaire completion.
Districts 4, 5, and 9 have the highest percentages of respondents employed by Medical or University
Facilities (86%, 77%, and 71%, respectively), whereas Districts 6, 7, and 8 have the lowest
percentages (36%, 41%, and 33%, respectively). Notably, in Districts 3 and 7, a 4% increase in the
percentage of Medical University Facility employed ATs from the 2018AY report.
An examination of PUB secondary schools by NATA District only (Table 16) reveals that
District 3 and District 10 have the highest percentage of ATLAS questionnaire completion (80% and
76%) which is an increase of +9% and 5%, respectively, in the past year. In the same regard, District
8 had the second highest increase in ATLAS questionnaire completion with +6% from the previous
year. Districts 6, 7, and 8 have the highest percentage of respondents employed by the School
District (62%, 54%, and 58%), while District 4 has the lowest percentage (8%). Districts 4, 5, and 9
have the highest percentages of respondents employed by Medical or University Facilities (86%,
76%, and 72%), whereas Districts 6, 7, and 8 have the lowest percentages of MUF employment
(34%, 42%, and 30%), respectively.
PVT secondary school data by district (Table 17) demonstrates that Districts 1, 3, and 10 have
the highest percentage of ATLAS Questionnaire completion (69%, 73% and 79%), respectively.
Districts 1, 3, and 8 have the highest percentage of respondents in the PVT setting employed by the
School District (69%, 56%, and 57%), while District 10 has the lowest percentage (9%). Furthermore,
Districts 4, 5, and 10 have the highest percentages of PVT secondary school respondents employed
by Medical or University Facilities (81%, 75%, and 74%, respectively), whereas Districts 1 and 7 have
the lowest percentages (23% and 17%).

ATLAS Project Report 2020
22
AT Education Tables 22-24 examine the level of education of the ATs providing services in all 50
states. As previously noted, we observed a 63% response rate nationally (n=8,514/13,506). In
the PUB+PVT setting combined, a majority (54%) of the secondary schools receive services
from an AT who holds a master’s degree while 44% hold a bachelor’s degree. Only 1% of
secondary schools (n=109) with athletics receive services from an AT who holds a doctorate.
Of note, there are 50 individuals who completed the ATLAS questionnaire who did not
complete the education level question. In the PUB secondary school setting (Table 23), of the
7,112 respondents, 54% (n=3,819) hold a masters, while 45% (n=3,177) hold a bachelors and
1% (n=75) hold a doctorate. Similarly, in the PVT setting, (Table 24) of the 1,402 respondents,
55% (n=775) hold a masters, 42% (n=584) hold a bachelors, and 2% (n=34) hold a doctorate.
Interestingly, regarding the PVT secondary school setting, >50% of the respondents hold a
masters in 37 states, which is greater than the PUB secondary school setting where in 33
states, > 50% of the respondents hold a masters. There are large discrepancies present in 11
states between the percentage of secondary schools who receive AT services from an
individual who holds a masters versus a bachelor’s degree. This difference is likely explained
by the increased questionnaire response rate compared to last year, improving the accuracy of
the data, however due to the transition of the athletic training profession to a master’s level
degree we may also be observing these early effects. In 8 states (District of Columbia,
Montana, Wyoming, Oklahoma, Missouri, Virginia, Kentucky, and Idaho), there is a
discrepancy of ≥25% between the number of ATs who hold a masters and those with a
bachelors with more holding a master’s degree. In contrast, 3 states, (Maine, Alaska, and New
Hampshire), have ≥25% more ATs who hold a bachelors than those with a master’s degree.
When comparing respondents with a master’s degree who provide AT services, the
percentage of respondents in Idaho with a masters increased by 13%, while Delaware and

ATLAS Project Report 2020
23
West Virginia increased by 9%. Interestingly, there was a 10% increase in respondents from
Nevada who provide AT services and hold a bachelor’s degree.
Tables 26-28 depict the education level of AT services provided to PUB+PVT combined,
PUB, and PVT secondary schools by district. District 5 and District 6 have the highest
percentage of secondary schools who receive care from an AT who holds a masters (both
59%) while District 1 has the highest percentage of schools who receive care from an AT with
a bachelors (59%). District 5 has 20 schools or 3% who receive AT services from an AT with a
doctorate while District 3 has 15 schools and District 10 has 10 schools, both 2% of the total
schools. Similar to the combined data, in PUB secondary schools (Table 27) District 5 has the
largest percentage of secondary schools who receive care from an AT with their masters
(60%), District 1 with their bachelors (62%), and Districts 5 and 10 with their doctorate (3%, 2%
respectively). District 6 and District 2 have the highest percentage of PVT secondary school
ATs who hold a masters’ degree (63%, 60%) and lowest with a bachelors (32%, 37%) while
Districts 4 and District 1 have the lowest with a masters (46%, 48%) and the highest
percentage with a bachelors (51%, 50%). In comparison to the 2018-2019AY data, District 10
had the lowest percentage of respondents who hold a master’s degree (47%) however, this
years’ respondent pool for this district shows a higher percentage of masters than bachelors
(54%). In 8 out of 10 districts, the majority of questionnaire respondents (≥50%) hold a
masters’ degree (Table 28).
References
1. Pryor RR, Casa DJ, Vandermark LW, et al. Athletic training services in public secondary schools: a benchmark study. J Athl Train. 2015;50(2):156-162. doi:10.4085/1062-6050-50.2.03
2. Pike A, Pryor RR, Mazerolle SM, Stearns RL, Casa DJ. Athletic trainer services in US private secondary schools. J Athl Train. 2016;51(9):717-726. doi:10.4085/1062-6050-51.11.04

ATLAS Project Report 2020
24
3. Pike AM, Pryor RR, Vandermark LW, Mazerolle SM, Casa DJ. Athletic trainer services in public and private secondary schools. J Athl Train. 2017;52(1):5-11. doi:10.4085/1062-6050-51.11.15
4. Huggins RA, Coleman KA, Attanasio SM, Cooper GL, Endres BD, Harper RC, Huemme
KL, Morris RF, Pike Lacy AM, Peterson BC, Pryor RR, Casa DJ. Athletic Trainer Services in the Secondary School Setting: The Athletic Training Locations and Services Project. J Athl Train. 2019;54(11):1129-1139. doi:10.4085/1062-6050-12-19
5. Korey Stringer Institute. NATA ATLAS | Korey Stringer Institute. http://ksi.uconn.edu/nata-atlas/.
6. National Center for Education Statistics (NCES) Home Page, part of the U.S. Department of Education. https://nces.ed.gov/.
7. Map creator online to make a map with multiple locations and regions - ZeeMaps. https://www.zeemaps.com/.
8. Geographic. https://nces.ed.gov/programs/edge/Geographic/LocaleBoundaries.
9. Athletic Training Locations and Services (ATLAS) Questionnaire. https://uconn.co1.qualtrics.com/jfe/form/SV_enPMxrKzIqlYRnL.

ATLAS Project Report 2020
25
Table 1. Athletic Training Services in US Secondary Schools, by State
Unknown
State (n)Alabama 480 332 129 203 145 3 69% 27% 42% 30% 1%Alaska 156 23 6 17 133 0 15% 4% 11% 85% 0%Arizona 302 188 122 66 99 15 62% 40% 22% 33% 5%Arkansas 303 110 86 24 152 41 36% 28% 8% 50% 14%California 1541 869 376 493 672 0 56% 24% 32% 44% 0%Colorado 360 235 117 118 118 7 65% 33% 33% 33% 2%Connecticut 238 203 89 114 30 5 85% 37% 48% 13% 2%Delaware 68 55 30 25 13 0 81% 44% 37% 19% 0%District of Columbia 50 29 21 8 21 0 58% 42% 16% 42% 0%Florida 771 508 303 205 230 33 66% 39% 27% 30% 4%Georgia 580 458 265 193 113 9 79% 46% 33% 19% 2%Hawaii 78 68 54 14 10 0 87% 69% 18% 13% 0%Idaho 180 68 44 24 112 0 38% 24% 13% 62% 0%Illinois 829 483 259 224 345 1 58% 31% 27% 42% 0%Indiana 439 365 246 119 72 2 83% 56% 27% 16% 0%Iowa 367 281 74 207 79 7 77% 20% 56% 22% 2%Kansas 368 216 75 141 152 0 59% 20% 38% 41% 0%Kentucky 298 198 135 63 96 4 66% 45% 21% 32% 1%Louisiana 436 289 176 113 122 25 66% 40% 26% 28% 6%Maine 147 92 53 39 55 0 63% 36% 27% 37% 0%Maryland 317 225 135 90 78 14 71% 43% 28% 25% 4%Massachusetts 476 300 157 143 166 10 63% 33% 30% 35% 2%Michigan 790 421 178 243 369 0 53% 23% 31% 47% 0%Minnesota 487 297 116 181 152 38 61% 24% 37% 31% 8%Mississippi 329 240 103 137 85 4 73% 31% 42% 26% 1%Missouri 641 332 150 182 293 16 52% 23% 28% 46% 2%Montana 181 88 25 63 93 0 49% 14% 35% 51% 0%Nebraska 297 189 71 118 108 0 64% 24% 40% 36% 0%Nevada 107 65 34 31 42 0 61% 32% 29% 39% 0%New Hampshire 123 71 49 22 52 0 58% 40% 18% 42% 0%New Jersey 452 393 343 50 48 11 87% 76% 11% 11% 2%New Mexico 152 67 46 21 85 0 44% 30% 14% 56% 0%New York 1091 577 245 332 445 72 53% 22% 30% 41% 7%North Carolina 530 383 269 114 133 14 72% 51% 22% 25% 3%North Dakota 156 62 18 44 91 3 40% 12% 28% 58% 2%Ohio 864 714 411 303 150 0 83% 48% 35% 17% 0%Oklahoma 495 160 64 96 335 0 32% 13% 19% 68% 0%Oregon 289 126 62 64 159 4 44% 21% 22% 55% 1%Pennsylvania 810 677 521 156 106 27 84% 64% 19% 13% 3%Rhode Island 63 47 18 29 13 3 75% 29% 46% 21% 5%South Carolina 308 245 193 52 57 6 80% 63% 17% 19% 2%South Dakota 164 95 36 59 69 0 58% 22% 36% 42% 0%Tennessee 453 310 180 130 118 26 68% 40% 29% 26% 6%Texas 1688 1200 776 424 421 67 71% 46% 25% 25% 4%Utah 182 90 54 36 92 0 49% 30% 20% 51% 0%Vermont 83 54 22 32 29 0 65% 27% 39% 35% 0%Virginia 462 317 242 75 145 0 69% 52% 16% 31% 0%Washington 418 223 93 130 180 15 53% 22% 31% 43% 4%West Virginia 131 56 24 32 75 0 43% 18% 24% 57% 0%Wisconsin 509 374 159 215 135 0 73% 31% 42% 27% 0%Wyoming 79 38 24 14 34 7 48% 30% 18% 43% 9%National 21118 13506 7478 6028 7127 489 64% 35% 29% 34% 2%
AT Services
(%)Full Time
(%)Part Time
(%)Unknown
(%)
No AT Services
(%)
Public and Private Schools CombinedTotal
Schools (n)
AT Services
(n)Full Time
(n)Part Time
(n)
No AT Services
(n)

ATLAS Project Report 2020
26
Figure 3. Access to Athletic Training Services by State and District

ATLAS Project Report 2020
27
Figure 4. Access to Full-time Athletic Training Services by State and District

ATLAS Project Report 2020
28
Figure 5. Access to Part-time Athletic Training Services by State and District

ATLAS Project Report 2020
29
Figure 6. Athletic Training Services in US Secondary Schools
35%
29%
34%
2%AT Services In US Secondary Schools
Full Time (%) Part Time (%) No AT Services (%) Unknown (%)
37%
29%
31%
2%AT Services In US Secondary Public Schools
Full Time (%) Part Time (%) No AT Services (%) Unknown (%)
28%
25%
45%
2%AT Services In US Secondary Private Schools
Full Time (%) Part Time (%) No AT Services (%) Unknown (%)

ATLAS Project Report 2020
30
Table 2. Athletic Training Services in US Public Secondary Schools, by State
Unknown
State (n)Alabama 365 273 107 166 92 0 75% 29% 45% 25% 0%Alaska 147 21 4 17 126 0 14% 3% 12% 86% 0%Arizona 248 168 113 55 67 13 68% 46% 22% 27% 5%Arkansas 269 97 75 22 132 40 36% 28% 8% 49% 15%California 1077 630 277 353 447 0 58% 26% 33% 42% 0%Colorado 319 211 103 108 102 6 66% 32% 34% 32% 2%Connecticut 171 152 53 99 14 5 89% 31% 58% 8% 3%Delaware 41 37 20 17 4 0 90% 49% 41% 10% 0%District of Columbia 33 18 12 6 15 0 55% 36% 18% 45% 0%Florida 490 383 234 149 81 26 78% 48% 30% 17% 5%Georgia 406 357 207 150 42 7 88% 51% 37% 10% 2%Hawaii 45 43 39 4 2 0 96% 87% 9% 4% 0%Idaho 157 61 42 19 96 0 39% 27% 12% 61% 0%Illinois 678 408 223 185 269 1 60% 33% 27% 40% 0%Indiana 360 319 223 96 39 2 89% 62% 27% 11% 1%Iowa 324 254 67 187 66 4 78% 21% 58% 20% 1%Kansas 330 201 69 132 129 0 61% 21% 40% 39% 0%Kentucky 236 168 114 54 66 2 71% 48% 23% 28% 1%Louisiana 317 223 129 94 76 18 70% 41% 30% 24% 6%Maine 117 74 41 33 43 0 63% 35% 28% 37% 0%Maryland 202 152 85 67 36 14 75% 42% 33% 18% 7%Massachusetts 351 219 113 106 126 6 62% 32% 30% 36% 2%Michigan 656 373 159 214 283 0 57% 24% 33% 43% 0%Minnesota 411 264 102 162 124 23 64% 25% 39% 30% 6%Mississippi 246 188 87 101 54 4 76% 35% 41% 22% 2%Missouri 527 270 127 143 244 13 51% 24% 27% 46% 2%Montana 168 83 23 60 85 0 49% 14% 36% 51% 0%Nebraska 260 160 56 104 100 0 62% 22% 40% 38% 0%Nevada 92 59 30 29 33 0 64% 33% 32% 36% 0%New Hampshire 80 54 36 18 26 0 68% 45% 23% 33% 0%New Jersey 352 332 297 35 13 7 94% 84% 10% 4% 2%New Mexico 128 55 39 16 73 0 43% 30% 13% 57% 0%New York 897 479 204 275 363 55 53% 23% 31% 40% 6%North Carolina 424 324 240 84 86 14 76% 57% 20% 20% 3%North Dakota 148 56 17 39 89 3 38% 11% 26% 60% 2%Ohio 712 610 351 259 102 0 86% 49% 36% 14% 0%Oklahoma 456 144 57 87 312 0 32% 13% 19% 68% 0%Oregon 237 113 54 59 124 0 48% 23% 25% 52% 0%Pennsylvania 613 550 436 114 41 22 90% 71% 19% 7% 4%Rhode Island 45 31 8 23 11 3 69% 18% 51% 24% 7%South Carolina 216 192 157 35 18 6 89% 73% 16% 8% 3%South Dakota 149 83 31 52 66 0 56% 21% 35% 44% 0%Tennessee 341 243 141 102 80 18 71% 41% 30% 23% 5%Texas 1383 1047 710 337 269 67 76% 51% 24% 19% 5%Utah 135 85 51 34 50 0 63% 38% 25% 37% 0%Vermont 60 42 14 28 18 0 70% 23% 47% 30% 0%Virginia 317 259 207 52 58 0 82% 65% 16% 18% 0%Washington 342 192 82 110 137 13 56% 24% 32% 40% 4%West Virginia 116 50 23 27 66 0 43% 20% 23% 57% 0%Wisconsin 415 329 142 187 86 0 79% 34% 45% 21% 0%Wyoming 74 38 24 14 32 4 51% 32% 19% 43% 5%National 16683 11174 6255 4919 5113 396 67% 37% 29% 31% 2%
No AT Services
(%)Unknown
(%)Part Time
(%)
Total Schools
(n)
AT Services
(n)Full Time
(n)Part Time
(n)
No AT Services
(n)
AT Services
(%)Full Time
(%)
Public Schools

ATLAS Project Report 2020
31
Table 3. Athletic Training Services in US Secondary Private Schools, by State
Unknown
State (n)Alabama 115 59 22 37 53 3 51% 19% 32% 46% 3%Alaska 9 2 2 0 7 0 22% 22% 0% 78% 0%Arizona 54 20 9 11 32 2 37% 17% 20% 59% 4%Arkansas 34 13 11 2 20 1 38% 32% 6% 59% 3%California 464 239 99 140 225 0 52% 21% 30% 48% 0%Colorado 41 24 14 10 16 1 59% 34% 24% 39% 2%Connecticut 67 51 36 15 16 0 76% 54% 22% 24% 0%Delaware 27 18 10 8 9 0 67% 37% 30% 33% 0%District of Columbia 17 11 9 2 6 0 65% 53% 12% 35% 0%Florida 281 125 69 56 149 7 44% 25% 20% 53% 2%Georgia 174 101 58 43 71 2 58% 33% 25% 41% 1%Hawaii 33 25 15 10 8 0 76% 45% 30% 24% 0%Idaho 23 7 2 5 16 0 30% 9% 22% 70% 0%Illinois 151 75 36 39 76 0 50% 24% 26% 50% 0%Indiana 79 46 23 23 33 0 58% 29% 29% 42% 0%Iowa 43 27 7 20 13 3 63% 16% 47% 30% 7%Kansas 38 15 6 9 23 0 39% 16% 24% 61% 0%Kentucky 62 30 21 9 30 2 48% 34% 15% 48% 3%Louisiana 119 66 47 19 46 7 55% 39% 16% 39% 6%Maine 30 18 12 6 12 0 60% 40% 20% 40% 0%Maryland 115 73 50 23 42 0 63% 43% 20% 37% 0%Massachusetts 125 81 44 37 40 4 65% 35% 30% 32% 3%Michigan 134 48 19 29 86 0 36% 14% 22% 64% 0%Minnesota 76 33 14 19 28 15 43% 18% 25% 37% 20%Mississippi 83 52 16 36 31 0 63% 19% 43% 37% 0%Missouri 114 62 23 39 49 3 54% 20% 34% 43% 3%Montana 13 5 2 3 8 0 38% 15% 23% 62% 0%Nebraska 37 29 15 14 8 0 78% 41% 38% 22% 0%Nevada 15 6 4 2 9 0 40% 27% 13% 60% 0%New Hampshire 43 17 13 4 26 0 40% 30% 9% 60% 0%New Jersey 100 61 46 15 35 4 61% 46% 15% 35% 4%New Mexico 24 12 7 5 12 0 50% 29% 21% 50% 0%New York 194 98 41 57 79 17 51% 21% 29% 41% 9%North Carolina 106 59 29 30 47 0 56% 27% 28% 44% 0%North Dakota 8 6 1 5 2 0 75% 13% 63% 25% 0%Ohio 152 104 60 44 48 0 68% 39% 29% 32% 0%Oklahoma 39 16 7 9 23 0 41% 18% 23% 59% 0%Oregon 52 13 8 5 35 4 25% 15% 10% 67% 8%Pennsylvania 197 127 85 42 65 5 64% 43% 21% 33% 3%Rhode Island 18 16 10 6 2 0 89% 56% 33% 11% 0%South Carolina 92 53 36 17 39 0 58% 39% 18% 42% 0%South Dakota 15 12 5 7 3 0 80% 33% 47% 20% 0%Tennessee 112 67 39 28 37 8 60% 35% 25% 33% 7%Texas 305 153 66 87 152 0 50% 22% 29% 50% 0%Utah 47 5 3 2 42 0 11% 6% 4% 89% 0%Vermont 23 12 8 4 11 0 52% 35% 17% 48% 0%Virginia 145 58 35 23 87 0 40% 24% 16% 60% 0%Washington 76 31 11 20 43 2 41% 14% 26% 57% 3%West Virginia 15 6 1 5 9 0 40% 7% 33% 60% 0%Wisconsin 94 45 17 28 49 0 48% 18% 30% 52% 0%Wyoming 5 0 0 0 2 3 0% 0% 0% 40% 60%National 4435 2332 1223 1109 2010 93 53% 28% 25% 45% 2%
No AT Services
(%)
AT Services
(%)Full Time
(%)Part Time
(%)Unknown
(%)
Total Schools
(n)
AT Services
(n)Full Time
(n)Part Time
(n)
No AT Services
(n)
Private Schools

ATLAS Project Report 2020
32
Table 4. Athletic Training Services in US Secondary Schools, Comparison
Athletic Training Services by NATA District Table 5. Athletic Training Services in US Secondary Schools, by NATA District
Unknown
School Type Year (AY) (n)Public 2019 16683 11174 6255 4919 5113 396 67% 37% 29% 31% 2%Public 2018 16104 11135 6187 4948 4867 0 69% 38% 31% 31% 0%Public 2017 16076 11171 5990 5181 4905 0 69% 37% 32% 31% 0%Private 2019 4435 2332 1223 1109 2010 93 53% 28% 25% 45% 2%Private 2018 4310 2353 1230 1123 1956 0 55% 29% 26% 45% 0%Private 2017 4196 2302 1129 1173 1894 0 55% 27% 28% 58% 0%Public + Private 2019 21118 13506 7478 6028 7127 489 64% 35% 29% 34% 2%Public + Private 2018 20414 13488 7417 6071 6923 0 66% 36% 30% 34% 0%Public + Private 2017 20272 13473 7119 6354 6799 0 66% 35% 31% 315% 0%
No AT Services
(%)Full Time
(%)Part Time
(%)Unknown
(%)
AT Services By YearTotal
Schools (n)
AT Services
(n)Full Time
(n)Part Time
(n)
No AT Services
(n)
AT Services
(%)
NATA DistrictTotal
Schools (n)
AT Services
(n)
Full Time (n)
Part Time (n)
No AT Services
(n)
Unknown (n)
AT Services
(%)
Full Time (%)
Part Time (%)
No AT Services
(%)
Unknown (%)
District 1 1130 767 388 379 345 18 68% 34% 34% 31% 2%District 2 2421 1702 1139 563 612 110 70% 47% 23% 25% 5%District 3 1798 1255 884 371 509 34 70% 49% 21% 28% 2%District 4 3918 2654 1369 1285 1223 41 68% 35% 33% 31% 1%District 5 2488 1335 488 847 1127 26 54% 20% 34% 45% 1%District 6 1991 1310 862 448 573 108 66% 43% 23% 29% 5%District 7 1075 618 363 255 428 29 57% 34% 24% 40% 3%District 8 1726 1002 464 538 724 0 58% 27% 31% 42% 0%District 9 3347 2335 1291 1044 909 104 70% 39% 31% 27% 3%District 10 1224 528 230 298 677 19 43% 19% 24% 55% 2%National 21118 13506 7478 6028 7127 489 64% 35% 29% 34% 2%
Public and Private Schools

ATLAS Project Report 2020
33
Table 6. Athletic Training Services in US Public Secondary Schools, by NATA District
Table 7. Athletic Training Services in US Private Secondary Schools, by NATA District
NATA DistrictTotal
Schools (n)
AT Services
(n)
Full Time (n)
Part Time (n)
No AT Services
(n)
Unknown (n)
AT Services
(%)
Full Time (%)
Part Time (%)
No AT Services
(%)
Unknown (%)
District 1 824 572 265 307 238 14 69% 32% 37% 29% 2%District 2 1903 1398 957 441 421 84 73% 50% 23% 22% 4%District 3 1308 995 724 271 279 34 76% 55% 21% 21% 3%District 4 3232 2303 1200 1103 903 26 71% 37% 34% 28% 1%District 5 2194 1168 424 744 1006 20 53% 19% 34% 46% 1%District 6 1652 1144 785 359 401 107 69% 48% 22% 24% 6%District 7 904 557 330 227 324 23 62% 37% 25% 36% 3%District 8 1214 732 346 386 482 0 60% 29% 32% 40% 0%District 9 2401 1835 1019 816 491 75 76% 42% 34% 20% 3%District 10 1051 470 205 265 568 13 45% 20% 25% 54% 1%National 16683 11174 6255 4919 5113 396 67% 37% 29% 31% 2%
Public Schools
NATA DistrictTotal
Schools (n)
AT Services
(n)
Full Time (n)
Part Time (n)
No AT Services
(n)
Unknown (n)
AT Services
(%)
Full Time (%)
Part Time (%)
No AT Services
(%)
Unknown (%)
District 1 306 195 123 72 107 4 64% 40% 24% 35% 1%District 2 518 304 182 122 188 26 59% 35% 24% 36% 5%District 3 490 260 160 100 230 0 53% 33% 20% 47% 0%District 4 686 351 169 182 320 15 51% 25% 27% 47% 2%District 5 294 167 64 103 121 6 57% 22% 35% 41% 2%District 6 339 166 77 89 172 1 49% 23% 26% 51% 0%District 7 171 61 33 28 104 6 36% 19% 16% 61% 4%District 8 512 270 118 152 242 0 53% 23% 30% 47% 0%District 9 946 500 272 228 417 29 53% 29% 24% 44% 3%District 10 173 58 25 33 109 6 34% 14% 19% 63% 3%National 4435 2332 1223 1109 2010 93 53% 28% 25% 45% 2%
Private Schools
ATLAS Project Report 2020
34
Athletic Training Services by Locale, by State Table 8. Athletic Training Services in US Secondary School Locales, by State
Stat
e
Tota
l City
Sec
onda
ry
Scho
ols
with
Ath
letic
s (n
)
Full
Tim
e (%
)
Part
Tim
e (%
)
Non
e (%
)
Tota
l Sub
urba
n Se
cond
ary
Scho
ols
with
Ath
letic
s (n
)
Full
Tim
e (%
)
Part
Tim
e (%
)
Non
e (%
)
Tota
l Tow
n Se
cond
ary
Scho
ols
with
Ath
letic
s (n
)
Full
Tim
e (%
)
Part
Tim
e (%
)
Non
e (%
)
Tota
l Rur
al S
econ
dary
Sc
hool
s w
ith A
thle
tics
(n)
Full
Tim
e (%
)
Part
Tim
e (%
)
Non
e (%
)
Tota
l Mis
sing
Loc
ales
with
A
thle
tics
(n)
Full
Tim
e (%
)
Part
Tim
e (%
)
Non
e (%
)
Tota
l Mis
sing
Unk
now
n (n
)
Alabama 76 32% 39% 29% 59 46% 34% 20% 51 35% 41% 24% 254 22% 46% 32% 37 14% 41% 46% 3Alaska 11 36% 36% 27% 4 0% 50% 50% 16 0% 50% 50% 124 1% 2% 97% 1 100% 0% 0% 0Arizona 100 58% 23% 19% 64 63% 20% 17% 42 26% 21% 52% 63 21% 17% 62% 18 0% 56% 44% 15Arkansas 38 76% 3% 21% 18 67% 11% 22% 54 30% 11% 59% 146 18% 10% 72% 6 33% 17% 50% 41California 515 30% 35% 35% 521 31% 37% 33% 111 12% 29% 59% 162 12% 20% 67% 232 14% 24% 62% 0Colorado 82 37% 46% 17% 75 52% 33% 15% 39 33% 44% 23% 143 21% 25% 54% 14 36% 14% 50% 7Connecticut 48 31% 54% 15% 103 43% 51% 6% 8 0% 75% 25% 44 32% 57% 11% 30 53% 13% 33% 5Delaware 10 50% 20% 30% 25 40% 48% 12% 5 60% 40% 0% 16 56% 31% 13% 12 25% 33% 42% 0District of Columbia 42 43% 17% 40% 0 0% 0% 0% 0 0% 0% 0% 0 0% 0% 0% 8 38% 13% 50% 0Florida 191 42% 34% 24% 329 48% 25% 27% 36 25% 33% 42% 114 37% 28% 35% 68 21% 19% 60% 33Georgia 105 51% 30% 18% 170 51% 29% 21% 68 56% 29% 15% 186 36% 44% 20% 42 48% 26% 26% 9Hawaii 21 76% 14% 10% 19 68% 32% 0% 20 80% 5% 15% 8 63% 13% 25% 10 40% 30% 30% 0Idaho 25 40% 16% 44% 22 41% 23% 36% 28 29% 14% 57% 101 17% 10% 73% 4 0% 25% 75% 0Illinois 185 19% 14% 67% 212 64% 26% 10% 134 31% 50% 19% 225 17% 32% 51% 72 10% 8% 82% 1Indiana 94 54% 19% 27% 76 71% 21% 8% 76 57% 34% 9% 177 54% 32% 15% 14 21% 21% 57% 2Iowa 39 69% 21% 10% 15 73% 13% 13% 82 17% 61% 22% 213 10% 65% 25% 11 9% 73% 18% 7Kansas 40 63% 20% 18% 23 48% 26% 26% 77 21% 51% 29% 223 9% 39% 52% 5 60% 40% 0% 0Kentucky 47 70% 17% 13% 49 69% 24% 6% 68 40% 22% 38% 108 31% 19% 49% 22 32% 32% 36% 4Louisiana 88 61% 26% 13% 72 68% 14% 18% 69 39% 25% 36% 155 21% 35% 43% 27 48% 30% 22% 25Maine 11 64% 18% 18% 20 65% 25% 10% 21 48% 29% 24% 85 25% 27% 48% 10 20% 30% 50% 0Maryland 59 37% 25% 37% 148 49% 30% 22% 15 47% 20% 33% 62 42% 37% 21% 19 42% 26% 32% 14
AT Services in City Secondary Schools
AT Services in Suburban Secondary
Schools
AT Services in Town Secondary
Schools
AT Services in Rural Secondary
Schools
AT Services in Schools with
Missing Locales
ATLAS Project Report 2020
35
Massachusetts 91 19% 27% 54% 274 40% 32% 28% 11 9% 27% 64% 62 27% 24% 48% 28 43% 43% 14% 10Michigan 130 18% 28% 53% 221 35% 32% 33% 93 24% 52% 25% 303 15% 26% 59% 43 21% 21% 58% 0Minnesota 58 34% 33% 33% 71 51% 32% 17% 92 32% 50% 18% 211 13% 42% 45% 17 24% 24% 53% 38Mississippi 17 35% 35% 29% 23 74% 22% 4% 69 32% 45% 23% 181 30% 45% 24% 35 9% 37% 54% 4Missouri 77 32% 25% 43% 101 52% 33% 15% 97 25% 44% 31% 322 13% 24% 64% 28 25% 39% 36% 16Montana 11 73% 27% 0% 0 0% 0% 0% 29 45% 17% 38% 137 3% 39% 58% 4 0% 25% 75% 0Nebraska 28 89% 7% 4% 11 91% 9% 0% 43 40% 40% 21% 202 8% 45% 47% 13 23% 54% 23% 0Nevada 34 44% 38% 18% 23 57% 30% 13% 17 18% 18% 65% 28 7% 25% 68% 5 20% 20% 60% 0New Hampshire 10 60% 20% 20% 30 57% 23% 20% 23 43% 13% 43% 54 30% 17% 54% 6 0% 17% 83% 0New Jersey 33 67% 9% 24% 336 79% 12% 9% 9 78% 11% 11% 48 81% 10% 8% 15 53% 7% 40% 11New Mexico 29 59% 21% 21% 9 44% 33% 22% 31 35% 16% 48% 74 15% 8% 77% 9 33% 11% 56% 0New York 278 15% 24% 61% 302 44% 42% 14% 100 20% 35% 45% 302 13% 30% 57% 40 25% 30% 45% 72North Carolina 126 60% 25% 16% 101 63% 20% 17% 51 39% 37% 24% 215 47% 19% 34% 23 39% 13% 48% 14North Dakota 10 80% 20% 0% 3 67% 0% 33% 14 29% 43% 29% 124 3% 29% 68% 2 0% 0% 100% 3Ohio 121 36% 44% 20% 283 60% 29% 11% 129 43% 40% 18% 304 43% 36% 21% 27 48% 26% 26% 0Oklahoma 45 36% 38% 27% 34 59% 26% 15% 80 19% 28% 54% 322 4% 14% 82% 14 0% 21% 79% 0Oregon 53 57% 30% 13% 40 43% 28% 30% 66 15% 38% 47% 113 3% 11% 87% 13 15% 0% 85% 4Pennsylvania 115 57% 27% 17% 326 79% 13% 8% 91 68% 18% 14% 208 57% 28% 15% 43 42% 19% 40% 27Rhode Island 13 38% 54% 8% 34 24% 56% 21% 0 0% 0% 0% 6 33% 17% 50% 7 43% 29% 29% 3South Carolina 47 74% 15% 11% 78 73% 9% 18% 34 68% 18% 15% 125 56% 22% 22% 18 44% 22% 33% 6South Dakota 8 75% 13% 13% 1 0% 100% 0% 25 64% 20% 16% 125 11% 38% 50% 5 0% 80% 20% 0Tennessee 122 32% 30% 39% 62 55% 27% 18% 61 43% 38% 20% 158 44% 30% 27% 25 48% 28% 24% 26Texas 405 61% 22% 17% 264 73% 14% 13% 197 58% 25% 17% 679 29% 34% 37% 76 26% 25% 49% 67Utah 24 42% 29% 29% 68 41% 28% 31% 20 40% 20% 40% 29 7% 10% 83% 41 15% 7% 78% 0Vermont 4 50% 0% 50% 3 33% 67% 0% 21 33% 52% 14% 48 21% 35% 44% 7 29% 29% 43% 0Virginia 86 59% 21% 20% 135 67% 12% 21% 44 41% 18% 41% 164 43% 19% 38% 33 39% 6% 55% 0Washington 89 43% 45% 12% 104 33% 50% 17% 57 18% 25% 58% 131 5% 14% 82% 22 23% 27% 50% 15West Virginia 14 29% 36% 36% 16 25% 31% 44% 27 22% 22% 56% 72 14% 22% 64% 2 0% 0% 100% 0Wisconsin 86 37% 27% 36% 76 61% 24% 16% 93 41% 45% 14% 244 17% 52% 30% 10 10% 40% 50% 0Wyoming 5 100% 0% 0% 0 0% 0% 0% 17 59% 18% 24% 49 16% 22% 61% 1 100% 0% 0% 7National 3996 42% 28% 30% 5053 54% 27% 19% 2661 36% 34% 30% 7649 23% 30% 46% 1274 25% 24% 50% 489

ATLAS Project Report 2020
36
Table 9. Athletic Training Services in US Public Secondary School Locale, by State
Stat
e
Tota
l Pub
lic C
ity S
econ
dary
Sc
hool
s w
ith A
thle
tics
(n)
Full
Tim
e (%
)
Part
Tim
e (%
)
Non
e (%
)
Tota
l Pub
lic S
ubur
ban
Seco
ndar
y Sc
hool
s w
ith
Ath
letic
s (n
)
Full
Tim
e (%
)
Part
Tim
e (%
)
Non
e (%
)
Tota
l Pub
lic T
own
Seco
ndar
y Sc
hool
s w
ith
Ath
letic
s (n
)
Full
Tim
e (%
)
Part
Tim
e (%
)
Non
e (%
)
Tota
l Pub
lic R
ural
Se
cond
ary
Scho
ols
with
A
thle
tics
(n)
Full
Tim
e (%
)
Part
Tim
e (%
)
Non
e (%
)
Tota
l Pub
lic M
issi
ng
Seco
ndar
y Sc
hool
s w
ith
Ath
letic
s (n
)
Full
Tim
e (%
)
Part
Tim
e (%
)
Non
e (%
)
Tota
l Mis
sing
Unk
now
n (n
)
Alabama 42 36% 43% 21% 46 54% 35% 11% 45 38% 44% 18% 221 23% 48% 29% 11 0% 55% 45% 0Alaska 7 43% 57% 0% 3 0% 67% 33% 14 0% 57% 43% 123 1% 2% 97% 0 0% 0% 0% 0Arizona 77 68% 23% 9% 56 68% 21% 11% 39 28% 23% 49% 55 22% 18% 60% 8 0% 75% 25% 13Arkansas 23 96% 0% 4% 15 80% 13% 7% 50 30% 12% 58% 137 18% 9% 72% 4 25% 25% 50% 40California 343 31% 38% 31% 394 34% 38% 27% 100 13% 31% 56% 137 12% 21% 67% 103 7% 10% 83% 0Colorado 69 36% 51% 13% 64 56% 34% 9% 38 34% 42% 24% 139 20% 24% 55% 3 33% 33% 33% 6Connecticut 36 22% 64% 14% 89 43% 52% 6% 8 0% 75% 25% 31 19% 74% 6% 2 50% 50% 0% 5Delaware 6 33% 17% 50% 19 37% 58% 5% 4 75% 25% 0% 12 67% 33% 0% 0 0% 0% 0% 0District of Columbia 32 38% 19% 44% 0 0% 0% 0% 0 0% 0% 0% 0 0% 0% 0% 1 0% 0% 100% 0Florida 112 50% 38% 13% 221 57% 29% 14% 31 29% 39% 32% 92 41% 32% 27% 8 50% 25% 25% 26Georgia 61 51% 31% 18% 130 58% 33% 9% 58 62% 33% 5% 145 43% 46% 11% 5 60% 40% 0% 7Hawaii 9 89% 11% 0% 15 87% 13% 0% 13 100% 0% 0% 8 63% 13% 25% 0 0% 0% 0% 0Idaho 22 41% 18% 41% 15 60% 13% 27% 25 32% 16% 52% 94 17% 10% 73% 1 0% 0% 100% 0Illinois 137 18% 9% 74% 168 73% 24% 3% 123 31% 51% 18% 215 18% 33% 50% 34 0% 0% 100% 1Indiana 61 61% 15% 25% 63 79% 21% 0% 67 63% 31% 6% 165 56% 32% 12% 2 50% 0% 50% 2Iowa 28 86% 14% 0% 12 92% 8% 0% 72 18% 64% 18% 204 9% 66% 25% 4 25% 50% 25% 4Kansas 27 81% 15% 4% 16 63% 31% 6% 65 23% 54% 23% 218 9% 39% 51% 4 50% 50% 0% 0Kentucky 29 76% 21% 3% 36 78% 22% 0% 62 44% 24% 32% 96 33% 22% 45% 11 45% 36% 18% 2Louisiana 53 60% 30% 9% 46 80% 15% 4% 53 43% 26% 30% 138 22% 40% 38% 9 67% 22% 11% 18Maine 7 71% 14% 14% 16 69% 25% 6% 17 53% 29% 18% 70 21% 30% 49% 7 14% 29% 57% 0Maryland 38 26% 32% 42% 94 51% 34% 15% 10 60% 30% 10% 43 47% 47% 7% 3 33% 0% 67% 14
AT Services in City Secondary Schools
AT Services in Suburban Secondary
AT Services in Town Secondary
AT Services in Rural Secondary
AT Services in Schools with

ATLAS Project Report 2020
37
Massachusetts 64 17% 23% 59% 220 40% 35% 25% 10 10% 20% 70% 49 27% 20% 53% 2 50% 50% 0% 6Michigan 100 19% 24% 57% 179 40% 36% 24% 86 26% 53% 21% 280 16% 28% 56% 11 18% 9% 73% 0Minnesota 41 37% 39% 24% 56 57% 32% 11% 83 33% 49% 18% 201 13% 42% 44% 7 14% 29% 57% 23Mississippi 12 42% 42% 17% 15 80% 20% 0% 56 38% 43% 20% 147 33% 44% 23% 12 8% 33% 58% 4Missouri 51 37% 22% 41% 69 68% 28% 4% 89 26% 45% 29% 303 13% 24% 64% 2 0% 50% 50% 13Montana 8 88% 13% 0% 0 0% 0% 0% 26 46% 19% 35% 132 3% 40% 57% 2 0% 50% 50% 0Nebraska 18 94% 6% 0% 9 100% 0% 0% 35 43% 37% 20% 194 8% 45% 47% 4 0% 50% 50% 0Nevada 29 52% 41% 7% 18 61% 33% 6% 17 18% 18% 65% 26 4% 27% 69% 2 0% 50% 50% 0New Hampshire 5 60% 40% 0% 25 60% 24% 16% 14 57% 14% 29% 36 28% 22% 50% 0 0% 0% 0% 0New Jersey 27 70% 7% 22% 271 87% 10% 2% 9 78% 11% 11% 37 89% 11% 0% 1 100% 0% 0% 7New Mexico 19 63% 21% 16% 6 67% 33% 0% 29 38% 17% 45% 71 15% 7% 77% 3 33% 0% 67% 0New York 201 12% 19% 68% 256 46% 44% 10% 93 22% 37% 42% 285 13% 31% 56% 7 29% 29% 43% 55North Carolina 79 73% 15% 11% 80 73% 19% 9% 50 40% 38% 22% 194 52% 19% 30% 7 57% 29% 14% 14North Dakota 7 100% 0% 0% 3 67% 0% 33% 9 44% 33% 22% 124 3% 29% 68% 2 0% 0% 100% 3Ohio 79 32% 47% 22% 226 64% 30% 7% 115 46% 43% 11% 288 44% 36% 19% 4 50% 25% 25% 0Oklahoma 30 33% 50% 17% 29 69% 24% 7% 78 19% 28% 53% 313 4% 14% 82% 6 0% 0% 100% 0Oregon 39 64% 33% 3% 28 54% 39% 7% 61 16% 39% 44% 105 3% 10% 87% 4 25% 0% 75% 0Pennsylvania 78 54% 31% 15% 240 90% 8% 2% 79 76% 15% 9% 183 61% 30% 9% 11 64% 27% 9% 22Rhode Island 7 14% 86% 0% 27 19% 59% 22% 0 0% 0% 0% 6 33% 17% 50% 2 0% 0% 100% 3South Carolina 30 93% 3% 3% 53 87% 13% 0% 25 80% 16% 4% 95 64% 21% 15% 7 29% 43% 29% 6South Dakota 5 80% 20% 0% 1 0% 100% 0% 21 67% 19% 14% 120 11% 38% 52% 2 0% 50% 50% 0Tennessee 83 29% 29% 42% 46 63% 28% 9% 53 49% 42% 9% 140 44% 31% 26% 1 100% 0% 0% 18Texas 267 79% 16% 5% 207 86% 11% 3% 186 61% 26% 12% 644 31% 34% 35% 12 67% 17% 17% 67Utah 16 56% 31% 13% 52 50% 37% 13% 18 44% 22% 33% 17 12% 18% 71% 32 19% 9% 72% 0Vermont 2 50% 0% 50% 3 33% 67% 0% 17 35% 59% 6% 37 16% 43% 41% 1 0% 0% 100% 0Virginia 52 79% 19% 2% 102 83% 13% 4% 38 45% 18% 37% 118 51% 19% 31% 7 57% 0% 43% 0Washington 69 48% 45% 7% 83 39% 54% 7% 50 18% 28% 54% 121 5% 13% 82% 6 33% 67% 0% 13West Virginia 8 38% 38% 25% 14 29% 36% 36% 25 24% 20% 56% 69 14% 20% 65% 0 0% 0% 0% 0Wisconsin 47 53% 23% 23% 62 69% 21% 10% 79 44% 47% 9% 225 17% 56% 27% 2 0% 0% 100% 0Wyoming 5 100% 0% 0% 0 0% 0% 0% 16 63% 19% 19% 48 17% 23% 60% 1 100% 0% 0% 4National 2697 46% 27% 27% 3898 61% 28% 11% 2361 38% 35% 26% 6951 24% 31% 45% 380 21% 20% 59% 396

ATLAS Project Report 2020
38
Table 10. Athletic Training Services in US Private Secondary School Locale, by State
Stat
e
Tota
l Priv
ate
City
Se
cond
ary
Scho
ols
with
A
thle
tics
(n)
Full
Tim
e (%
)
Part
Tim
e (%
)
Non
e (%
)
Tota
l Priv
ate
Subu
rban
Se
cond
ary
Scho
ols
with
A
thle
tics
(n)
Full
Tim
e (%
)
Part
Tim
e (%
)
Non
e (%
)
Tota
l Priv
ate
Tow
n Se
cond
ary
Scho
ols
with
A
thle
tics
(n)
Full
Tim
e (%
)
Part
Tim
e (%
)
Non
e (%
)
Tota
l Priv
ate
Rur
al
Seco
ndar
y Sc
hool
s w
ith
Ath
letic
s (n
)
Full
Tim
e (%
)
Part
Tim
e (%
)
Non
e (%
)
Tota
l Priv
ate
Mis
sing
Se
cond
ary
Scho
ols
with
A
thle
tics
(n)
Full
Tim
e (%
)
Part
Tim
e (%
)
Non
e (%
)
Tota
l Mis
sing
Unk
now
n (n
)
Alabama 34 26% 35% 38% 13 15% 31% 54% 6 17% 17% 67% 33 15% 33% 52% 26 19% 35% 46% 3Alaska 4 25% 0% 75% 1 0% 0% 100% 2 0% 0% 100% 1 0% 0% 100% 1 100% 0% 0% 0Arizona 23 26% 22% 52% 8 25% 13% 63% 3 0% 0% 100% 8 13% 13% 75% 10 0% 40% 60% 2Arkansas 15 47% 7% 47% 3 0% 0% 100% 4 25% 0% 75% 9 22% 11% 67% 2 50% 0% 50% 1California 172 27% 28% 45% 127 19% 31% 50% 11 0% 9% 91% 25 16% 16% 68% 129 19% 36% 45% 0Colorado 13 38% 23% 38% 11 27% 27% 45% 1 0% 100% 0% 4 50% 50% 0% 11 36% 9% 55% 1Connecticut 12 58% 25% 17% 14 43% 50% 7% 0 0% 0% 0% 13 62% 15% 23% 28 54% 11% 36% 0Delaware 4 75% 25% 0% 6 50% 17% 33% 1 0% 100% 0% 4 25% 25% 50% 12 25% 33% 42% 0District of Columbia 10 60% 10% 30% 0 0% 0% 0% 0 0% 0% 0% 0 0% 0% 0% 7 43% 14% 43% 0Florida 79 32% 29% 39% 108 28% 18% 55% 5 0% 0% 100% 22 18% 14% 68% 60 17% 18% 65% 7Georgia 44 52% 30% 18% 40 28% 15% 58% 10 20% 10% 70% 41 12% 34% 54% 37 46% 24% 30% 2Hawaii 12 67% 17% 17% 4 0% 100% 0% 7 43% 14% 43% 0 0% 0% 0% 10 40% 30% 30% 0Idaho 3 33% 0% 67% 7 0% 43% 57% 3 0% 0% 100% 7 14% 14% 71% 3 0% 33% 67% 0Illinois 48 25% 27% 48% 44 27% 34% 39% 11 36% 36% 27% 10 10% 10% 80% 38 18% 16% 66% 0Indiana 33 42% 27% 30% 13 31% 23% 46% 9 11% 56% 33% 12 17% 25% 58% 12 17% 25% 58% 0Iowa 11 27% 36% 36% 3 0% 33% 67% 10 10% 40% 50% 9 33% 56% 11% 7 0% 86% 14% 3Kansas 13 23% 31% 46% 7 14% 14% 71% 12 8% 33% 58% 5 0% 0% 100% 1 100% 0% 0% 0Kentucky 18 61% 11% 28% 13 46% 31% 23% 6 0% 0% 100% 12 17% 0% 83% 11 18% 27% 55% 2Louisiana 35 63% 20% 17% 26 46% 12% 42% 16 25% 19% 56% 17 12% 0% 88% 18 39% 33% 28% 7Maine 4 50% 25% 25% 4 50% 25% 25% 4 25% 25% 50% 15 40% 13% 47% 3 33% 33% 33% 0Maryland 21 57% 14% 29% 54 44% 22% 33% 5 20% 0% 80% 19 32% 16% 53% 16 44% 31% 25% 0
AT Services in City Secondary Schools
AT Services in Suburban Secondary
Schools
AT Services in Town Secondary
Schools
AT Services in Rural Secondary
Schools
AT Services in Schools with
Missing Locales

ATLAS Project Report 2020
39
Massachusetts 27 22% 37% 41% 54 43% 19% 39% 1 0% 100% 0% 13 31% 38% 31% 26 42% 42% 15% 4Michigan 30 17% 43% 40% 42 14% 14% 71% 7 0% 29% 71% 23 4% 0% 96% 32 22% 25% 53% 0Minnesota 17 29% 18% 53% 15 27% 33% 40% 9 22% 56% 22% 10 0% 40% 60% 10 30% 20% 50% 15Mississippi 5 20% 20% 60% 8 63% 25% 13% 13 8% 54% 38% 34 21% 50% 29% 23 9% 39% 52% 0Missouri 26 23% 31% 46% 32 19% 44% 38% 8 13% 38% 50% 19 16% 21% 63% 26 27% 38% 35% 3Montana 3 33% 67% 0% 0 0% 0% 0% 3 33% 0% 67% 5 0% 20% 80% 2 0% 0% 100% 0Nebraska 10 80% 10% 10% 2 50% 50% 0% 8 25% 50% 25% 8 13% 38% 50% 9 33% 56% 11% 0Nevada 5 0% 20% 80% 5 40% 20% 40% 0 0% 0% 0% 2 50% 0% 50% 3 33% 0% 67% 0New Hampshire 5 60% 0% 40% 5 40% 20% 40% 9 22% 11% 67% 18 33% 6% 61% 6 0% 17% 83% 0New Jersey 6 50% 17% 33% 65 46% 18% 35% 0 0% 0% 0% 11 55% 9% 36% 14 50% 7% 43% 4New Mexico 10 50% 20% 30% 3 0% 33% 67% 2 0% 0% 100% 3 0% 33% 67% 6 33% 17% 50% 0New York 74 24% 36% 39% 46 28% 35% 37% 7 0% 14% 86% 17 12% 18% 71% 33 24% 30% 45% 17North Carolina 47 36% 40% 23% 21 29% 24% 48% 1 0% 0% 100% 21 5% 24% 71% 16 31% 6% 63% 0North Dakota 3 33% 67% 0% 0 0% 0% 0% 5 0% 60% 40% 0 0% 0% 0% 0 0% 0% 0% 0Ohio 42 45% 38% 17% 57 44% 28% 28% 14 14% 14% 71% 16 19% 25% 56% 23 48% 26% 26% 0Oklahoma 15 40% 13% 47% 5 0% 40% 60% 2 0% 0% 100% 9 11% 22% 67% 8 0% 38% 63% 0Oregon 14 36% 21% 43% 12 17% 0% 83% 5 0% 20% 80% 8 0% 13% 88% 9 11% 0% 89% 4Pennsylvania 37 62% 19% 19% 86 49% 27% 24% 12 17% 33% 50% 25 28% 12% 60% 32 34% 16% 50% 5Rhode Island 6 67% 17% 17% 7 43% 43% 14% 0 0% 0% 0% 0 0% 0% 0% 5 60% 40% 0% 0South Carolina 17 41% 35% 24% 25 44% 0% 56% 9 33% 22% 44% 30 30% 27% 43% 11 55% 9% 36% 0South Dakota 3 67% 0% 33% 0 0% 0% 0% 4 50% 25% 25% 5 20% 60% 20% 3 0% 100% 0% 0Tennessee 39 38% 31% 31% 16 31% 25% 44% 8 0% 13% 88% 18 44% 22% 33% 23 48% 30% 22% 8Texas 138 27% 34% 39% 57 26% 25% 49% 11 9% 0% 91% 35 3% 26% 71% 64 19% 27% 55% 0Utah 8 13% 25% 63% 16 13% 0% 88% 2 0% 0% 100% 12 0% 0% 100% 9 0% 0% 100% 0Vermont 2 50% 0% 50% 0 0% 0% 0% 4 25% 25% 50% 11 36% 9% 55% 6 33% 33% 33% 0Virginia 34 29% 24% 47% 33 15% 9% 76% 6 17% 17% 67% 46 22% 20% 59% 26 35% 8% 58% 0Washington 20 25% 45% 30% 21 10% 33% 57% 7 14% 0% 86% 10 0% 20% 80% 16 19% 13% 69% 2West Virginia 6 17% 33% 50% 2 0% 0% 100% 2 0% 50% 50% 3 0% 67% 33% 2 0% 0% 100% 0Wisconsin 39 18% 31% 51% 14 21% 36% 43% 14 21% 36% 43% 19 16% 11% 74% 8 13% 50% 38% 0Wyoming 0 0% 0% 0% 0 0% 0% 0% 1 0% 0% 100% 1 0% 0% 100% 0 0% 0% 0% 3National 1296 35% 29% 37% 1155 31% 24% 45% 300 15% 24% 61% 698 19% 21% 59% 893 27% 26% 47% 93

ATLAS Project Report 2020
40
Table 11. National Athletic Training Services in US Secondary School Locale Comparison
Scho
ol T
ype
Year
(AY)
Tota
l City
Sec
onda
ry
Scho
ols
with
Ath
letic
s (n
)
Full
Tim
e (%
)
Part
Tim
e (%
)
Non
e (%
)
Tota
l Sub
urba
n Se
cond
ary
Scho
ols
with
Ath
letic
s (n
)
Full
Tim
e (%
)
Part
Tim
e (%
)
Non
e (%
)
Tota
l Tow
n Se
cond
ary
Scho
ols
with
Ath
letic
s (n
)
Full
Tim
e (%
)
Part
Tim
e (%
)
Non
e (%
)
Tota
l Rur
al S
econ
dary
Sc
hool
s w
ith A
thle
tics
(n)
Full
Tim
e (%
)
Part
Tim
e (%
)
Non
e (%
)
Tota
l Mis
sing
Loc
ales
Se
cond
ary
Scho
ols
with
A
thle
tics
(n)
Full
Tim
e (%
)
Part
Tim
e (%
)
Non
e (%
)
Public 2019 2697 46% 27% 27% 3898 61% 28% 11% 2361 38% 35% 26% 6951 24% 31% 45% 380 21% 20% 59%Public 2018 2609 43% 29% 29% 3874 60% 28% 12% 2372 37% 36% 27% 6832 23% 32% 45% 423 37% 22% 42%Public 2017 2575 53% 31% 16% 3889 55% 29% 10% 2394 36% 33% 26% 6847 24% 30% 44% 372 36% 23% 25%Private 2019 1296 35% 29% 37% 1155 31% 24% 45% 300 15% 24% 61% 698 19% 21% 59% 893 27% 26% 47%Private 2018 1456 34% 29% 37% 1388 31% 26% 44% 360 14% 26% 60% 800 18% 21% 61% 299 38% 26% 36%Private 2017 1437 36% 26% 36% 1360 22% 26% 40% 359 13% 22% 56% 799 16% 23% 55% 241 39% 22% 23%Public + Private 2019 3996 42% 28% 30% 5053 54% 27% 19% 2661 36% 34% 30% 7649 23% 30% 46% 1274 25% 24% 50%Public + Private 2018 4065 43% 29% 29% 5262 52% 28% 20% 2732 34% 35% 31% 7632 23% 31% 47% 722 37% 24% 39%Public + Private 2017 4012 48% 28% 24% 5249 47% 29% 19% 2753 33% 32% 31% 7646 22% 29% 47% 613 40% 27% 27%
AT Services in Suburban Secondary
Schools
AT Services in Town Secondary Schools
AT Services in Rural Secondary Schools
AT Services in Schools with Missing
Locales
AT Services in City Secondary Schools

ATLAS Project Report 2020
41
Figure 7. AT Services by Locale
42%
28%
30%
AT Services By Locale In US City Secondary Schools
Full Time (%) Part Time (%) None (%)
54%27%
19%
AT Services By Locale In US Suburban Secondary Schools
Full Time (%) Part Time (%) None (%)
36%
34%
30%
AT Services By Locale In US Town Secondary Schools
Full Time (%) Part Time (%) None (%)
23%
30%
46%
AT Services By Locale In US Rural Secondary Schools
Full Time (%) Part Time (%) None (%)

ATLAS Project Report 2020
42
Athletic Training Services by Locale, by NATA District Table 12. Athletic Training Services in US Secondary School Locales, by NATA District
NA
TA D
istr
ict
Tota
l City
Sec
onda
ry
Scho
ols
with
Ath
letic
s (n
)
Full
Tim
e (%
)
Part
Tim
e (%
)
Non
e (%
)
Tota
l Sub
urba
n Se
cond
ary
Scho
ols
with
A
thle
tics
(n)
Full
Tim
e (%
)
Part
Tim
e (%
)
Non
e (%
)
Tota
l Tow
n Se
cond
ary
Scho
ols
with
Ath
letic
s (n
)
Full
Tim
e (%
)
Part
Tim
e (%
)
Non
e (%
)
Tota
l Rur
al S
econ
dary
Sc
hool
s w
ith A
thle
tics
(n)
Full
Tim
e (%
)
Part
Tim
e (%
)
Non
e (%
)
Tota
l Mis
sing
Loc
ales
Se
cond
ary
Scho
ols
with
A
thle
tics
(n)
Full
Tim
e (%
)
Part
Tim
e (%
)
Non
e (%
)
Tota
l Mis
sing
Unk
now
n (n
)
District 1 177 44% 29% 27% 464 44% 42% 14% 84 22% 33% 28% 299 28% 29% 43% 88 31% 27% 42% 3District 2 436 51% 20% 29% 989 57% 24% 19% 205 53% 26% 21% 574 49% 24% 27% 110 38% 19% 43% 0District 3 374 45% 26% 29% 478 28% 41% 14% 171 26% 23% 34% 638 12% 21% 50% 103 27% 33% 40% 2District 4 674 29% 31% 40% 939 47% 30% 23% 617 28% 37% 35% 1464 26% 30% 44% 183 21% 23% 57% 1District 5 247 46% 27% 27% 188 58% 25% 16% 418 42% 39% 20% 1531 26% 36% 38% 78 29% 28% 44% 0District 6 443 68% 21% 11% 282 42% 14% 11% 251 47% 25% 28% 825 20% 27% 53% 82 27% 17% 56% 1District 7 240 48% 20% 32% 216 55% 31% 13% 149 34% 37% 29% 358 21% 30% 49% 83 25% 33% 42% 0District 8 570 47% 27% 26% 563 49% 20% 13% 148 31% 27% 41% 198 16% 26% 57% 247 16% 18% 66% 0District 9 646 54% 22% 15% 764 53% 25% 14% 422 32% 28% 33% 1156 19% 22% 51% 256 17% 23% 54% 0District 10 189 47% 22% 17% 170 52% 17% 14% 196 34% 22% 28% 606 28% 25% 30% 44 21% 20% 43% 7National 3996 42% 28% 30% 5053 54% 27% 19% 2661 36% 34% 30% 7649 23% 30% 46% 1274 25% 24% 50% 14
AT Services in Schools with
Missing Locales
AT Services in City Secondary Schools
AT Services in Suburban Secondary
Schools
AT Services in Town Secondary
Schools
AT Services in Rural Secondary
Schools
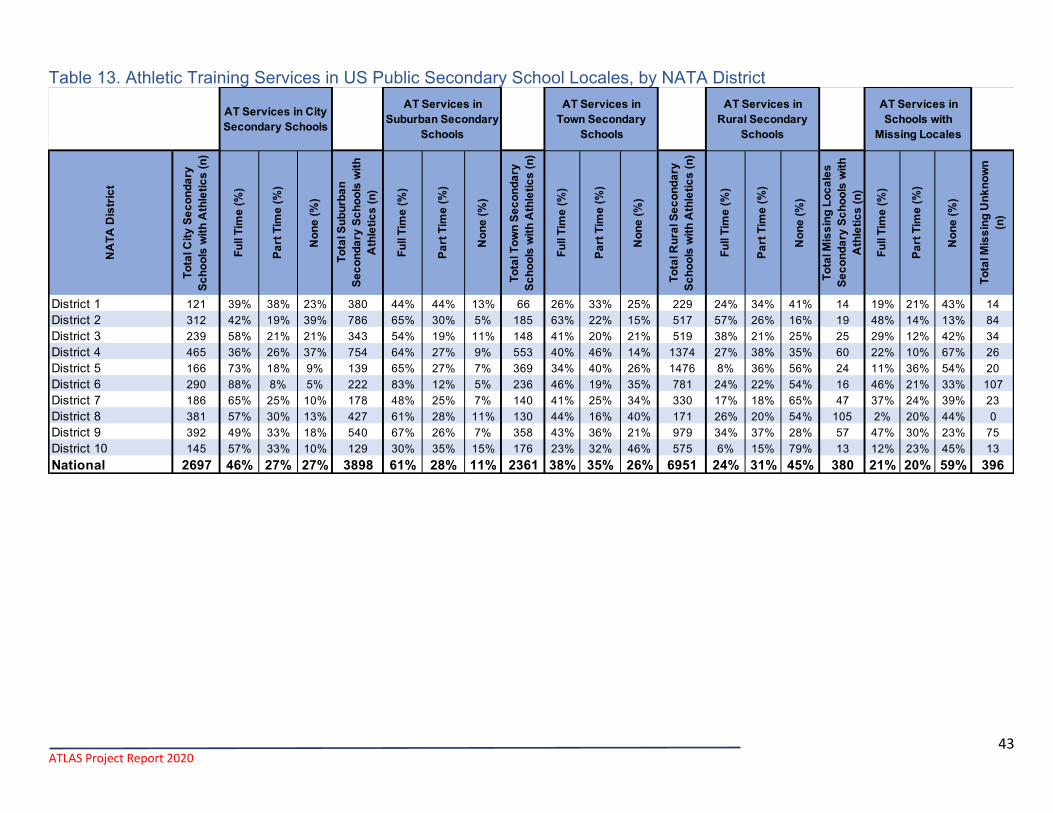
ATLAS Project Report 2020
43
Table 13. Athletic Training Services in US Public Secondary School Locales, by NATA District
NA
TA D
istr
ict
Tota
l City
Sec
onda
ry
Scho
ols
with
Ath
letic
s (n
)
Full
Tim
e (%
)
Part
Tim
e (%
)
Non
e (%
)
Tota
l Sub
urba
n Se
cond
ary
Scho
ols
with
A
thle
tics
(n)
Full
Tim
e (%
)
Part
Tim
e (%
)
Non
e (%
)
Tota
l Tow
n Se
cond
ary
Scho
ols
with
Ath
letic
s (n
)
Full
Tim
e (%
)
Part
Tim
e (%
)
Non
e (%
)
Tota
l Rur
al S
econ
dary
Sc
hool
s w
ith A
thle
tics
(n)
Full
Tim
e (%
)
Part
Tim
e (%
)
Non
e (%
)
Tota
l Mis
sing
Loc
ales
Se
cond
ary
Scho
ols
with
A
thle
tics
(n)
Full
Tim
e (%
)
Part
Tim
e (%
)
Non
e (%
)
Tota
l Mis
sing
Unk
now
n (n
)
District 1 121 39% 38% 23% 380 44% 44% 13% 66 26% 33% 25% 229 24% 34% 41% 14 19% 21% 43% 14District 2 312 42% 19% 39% 786 65% 30% 5% 185 63% 22% 15% 517 57% 26% 16% 19 48% 14% 13% 84District 3 239 58% 21% 21% 343 54% 19% 11% 148 41% 20% 21% 519 38% 21% 25% 25 29% 12% 42% 34District 4 465 36% 26% 37% 754 64% 27% 9% 553 40% 46% 14% 1374 27% 38% 35% 60 22% 10% 67% 26District 5 166 73% 18% 9% 139 65% 27% 7% 369 34% 40% 26% 1476 8% 36% 56% 24 11% 36% 54% 20District 6 290 88% 8% 5% 222 83% 12% 5% 236 46% 19% 35% 781 24% 22% 54% 16 46% 21% 33% 107District 7 186 65% 25% 10% 178 48% 25% 7% 140 41% 25% 34% 330 17% 18% 65% 47 37% 24% 39% 23District 8 381 57% 30% 13% 427 61% 28% 11% 130 44% 16% 40% 171 26% 20% 54% 105 2% 20% 44% 0District 9 392 49% 33% 18% 540 67% 26% 7% 358 43% 36% 21% 979 34% 37% 28% 57 47% 30% 23% 75District 10 145 57% 33% 10% 129 30% 35% 15% 176 23% 32% 46% 575 6% 15% 79% 13 12% 23% 45% 13National 2697 46% 27% 27% 3898 61% 28% 11% 2361 38% 35% 26% 6951 24% 31% 45% 380 21% 20% 59% 396
AT Services in City Secondary Schools
AT Services in Suburban Secondary
Schools
AT Services in Town Secondary
Schools
AT Services in Rural Secondary
Schools
AT Services in Schools with
Missing Locales

ATLAS Project Report 2020
44
Table 14. Athletic Training Services in US Private Secondary School Locales, by NATA District
NA
TA D
istr
ict
Tota
l City
Sec
onda
ry
Scho
ols
with
Ath
letic
s (n
)
Full
Tim
e (%
)
Part
Tim
e (%
)
Non
e (%
)
Tota
l Sub
urba
n Se
cond
ary
Scho
ols
with
Ath
letic
s (n
)
Full
Tim
e (%
)
Part
Tim
e (%
)
Non
e (%
)
Tota
l Tow
n Se
cond
ary
Scho
ols
with
Ath
letic
s (n
)
Full
Tim
e (%
)
Part
Tim
e (%
)
Non
e (%
)
Tota
l Rur
al S
econ
dary
Sc
hool
s w
ith A
thle
tics
(n)
Full
Tim
e (%
)
Part
Tim
e (%
)
Non
e (%
)
Tota
l Mis
sing
Loc
ales
Se
cond
ary
Scho
ols
with
Ath
letic
s (n
)
Full
Tim
e (%
)
Part
Tim
e (%
)
Non
e (%
)
Tota
l Mis
sing
U
nkno
wn
(n)
District 1 56 51% 17% 32% 84 36% 26% 21% 18 12% 27% 28% 70 34% 14% 36% 74 37% 29% 34% 4District 2 121 53% 24% 23% 203 43% 24% 33% 20 4% 37% 34% 57 30% 16% 54% 91 33% 22% 45% 26District 3 135 40% 26% 34% 135 22% 9% 52% 23 12% 15% 57% 119 15% 25% 43% 78 35% 11% 54% 0District 4 209 29% 31% 40% 185 27% 28% 45% 64 18% 38% 45% 90 11% 18% 71% 123 25% 27% 48% 15District 5 81 42% 27% 31% 49 12% 26% 34% 49 15% 35% 50% 55 13% 28% 44% 54 23% 45% 18% 6District 6 153 37% 20% 43% 60 13% 12% 75% 15 17% 0% 83% 44 13% 18% 69% 66 34% 13% 52% 1District 7 54 25% 18% 37% 38 13% 15% 52% 9 0% 20% 80% 28 13% 19% 68% 36 14% 13% 53% 6District 8 189 31% 22% 47% 136 20% 50% 30% 18 14% 8% 45% 27 22% 5% 39% 142 31% 22% 47% 0District 9 254 42% 25% 33% 224 37% 22% 41% 64 10% 16% 74% 177 20% 22% 58% 198 28% 30% 42% 29District 10 44 30% 27% 43% 41 5% 15% 60% 20 10% 4% 86% 31 3% 13% 84% 31 26% 9% 65% 6National 1296 35% 29% 37% 1155 31% 24% 45% 300 15% 24% 61% 698 19% 21% 59% 893 27% 26% 47% 93
AT Services in Schools with
Missing Locales
AT Services in City Secondary Schools
AT Services in Suburban Secondary
Schools
AT Services in Town Secondary
Schools
AT Services in Rural Secondary
Schools

ATLAS Project Report 2020
45
Table 15. Employment Model in US Secondary Schools, by State
StateSchools with
Access to AT Services
% ATLAS Survey
Complete
# Completed ATLAS
Surveys
School District
Employee
School District Teacher
Medical or University
Facility
Independent Contractor
Employment Unknown
Alabama 332 37% 122 6% 8% 75% 8% 3%Alaska 23 43% 10 0% 0% 90% 10% 0%Arizona 188 69% 130 37% 32% 25% 5% 1%Arkansas 110 85% 94 17% 20% 60% 0% 3%California 869 50% 435 43% 17% 25% 12% 3%Colorado 235 58% 136 31% 10% 54% 1% 3%Connecticut 203 63% 128 29% 5% 60% 5% 2%Delaware 55 78% 43 16% 14% 51% 9% 9%District of Columbia 29 93% 27 85% 7% 0% 4% 4%Florida 508 89% 450 26% 15% 43% 7% 9%Georgia 458 59% 271 14% 6% 68% 7% 4%Hawaii 68 66% 45 78% 0% 18% 0% 4%Idaho 68 68% 46 7% 20% 67% 2% 4%Illinois 483 59% 283 15% 6% 73% 3% 3%Indiana 365 78% 285 6% 4% 86% 3% 1%Iowa 281 41% 116 11% 0% 84% 3% 2%Kansas 216 43% 93 13% 1% 77% 8% 1%Kentucky 198 65% 128 11% 2% 82% 2% 3%Louisiana 289 83% 241 8% 15% 71% 4% 2%Maine 92 100% 92 27% 8% 52% 10% 3%Maryland 225 79% 178 23% 9% 58% 6% 4%Massachusetts 300 57% 172 55% 9% 30% 2% 3%Michigan 421 70% 294 10% 2% 78% 5% 6%Minnesota 297 65% 193 2% 1% 92% 2% 4%Mississippi 240 43% 104 4% 6% 84% 4% 3%Missouri 332 62% 205 12% 3% 75% 6% 4%Montana 88 78% 69 3% 7% 83% 7% 0%Nebraska 189 49% 93 24% 3% 68% 4% 1%Nevada 65 65% 42 19% 7% 57% 17% 0%New Hampshire 71 96% 68 31% 6% 54% 4% 4%New Jersey 393 66% 258 84% 4% 3% 2% 7%New Mexico 67 57% 38 55% 42% 0% 3% 0%New York 577 46% 268 34% 7% 49% 6% 4%North Carolina 383 80% 305 9% 22% 63% 4% 2%North Dakota 62 68% 42 2% 2% 95% 0% 0%Ohio 714 53% 381 3% 3% 90% 1% 3%Oklahoma 160 79% 127 26% 14% 53% 6% 1%Oregon 126 73% 92 29% 3% 57% 9% 2%Pennsylvania 677 70% 471 21% 4% 68% 4% 3%Rhode Island 47 70% 33 18% 12% 58% 9% 3%South Carolina 245 81% 199 10% 19% 61% 6% 4%South Dakota 95 71% 67 1% 0% 84% 12% 3%Tennessee 310 64% 198 12% 4% 77% 3% 4%Texas 1200 55% 656 49% 34% 12% 2% 2%Utah 90 84% 76 4% 21% 68% 5% 1%Vermont 54 100% 54 39% 7% 39% 11% 4%Virginia 317 76% 240 41% 23% 32% 1% 3%Washington 223 84% 188 12% 27% 55% 4% 1%West Virginia 56 57% 32 22% 6% 66% 3% 3%Wisconsin 374 44% 166 1% 1% 95% 0% 4%Wyoming 38 79% 30 10% 27% 57% 0% 7%National 13506 63% 8514 24% 12% 57% 5% 3%
Employment Provider

ATLAS Project Report 2020
46
Table 16. Employment Model in US Public Secondary Schools, by State
StateSchools with
Access to AT Services
% ATLAS Survey
Complete
# Completed ATLAS
Surveys
School District
Employee
School District Teacher
Medical or University
Facility
Independent Contractor
Employment Unknown
Alabama 273 38% 104 7% 9% 74% 9% 2%Alaska 21 38% 8 0% 0% 88% 13% 0%Arizona 168 71% 119 37% 32% 26% 4% 1%Arkansas 97 86% 83 18% 20% 59% 0% 2%California 630 53% 331 39% 15% 29% 14% 3%Colorado 211 60% 126 31% 10% 55% 2% 3%Connecticut 152 61% 93 18% 0% 73% 6% 2%Delaware 37 81% 30 17% 13% 47% 13% 10%District of Columbia 18 94% 17 94% 0% 0% 0% 6%Florida 383 92% 351 23% 17% 45% 6% 9%Georgia 357 58% 206 10% 7% 71% 7% 4%Hawaii 43 63% 27 96% 0% 0% 0% 4%Idaho 61 72% 44 7% 20% 68% 0% 5%Illinois 408 61% 248 15% 5% 73% 4% 4%Indiana 319 79% 253 6% 4% 86% 3% 1%Iowa 254 39% 99 10% 0% 86% 2% 2%Kansas 201 44% 88 14% 1% 78% 6% 1%Kentucky 168 65% 109 11% 3% 82% 2% 3%Louisiana 223 83% 184 8% 17% 72% 2% 2%Maine 74 100% 74 24% 3% 61% 8% 4%Maryland 152 80% 122 9% 3% 76% 7% 5%Massachusetts 219 61% 133 51% 9% 35% 2% 4%Michigan 373 72% 268 9% 2% 79% 5% 5%Minnesota 264 65% 172 1% 0% 93% 2% 4%Mississippi 188 39% 74 4% 7% 81% 4% 4%Missouri 270 61% 165 9% 4% 75% 7% 5%Montana 83 77% 64 3% 8% 83% 6% 0%Nebraska 160 46% 74 24% 4% 65% 5% 1%Nevada 59 63% 37 19% 5% 62% 14% 0%New Hampshire 54 94% 51 24% 4% 65% 4% 4%New Jersey 332 65% 216 86% 4% 2% 1% 6%New Mexico 55 60% 33 55% 45% 0% 0% 0%New York 479 48% 229 31% 6% 52% 6% 5%North Carolina 324 81% 264 6% 23% 64% 4% 2%North Dakota 56 66% 37 3% 3% 95% 0% 0%Ohio 610 53% 322 3% 3% 91% 1% 2%Oklahoma 144 78% 112 26% 14% 52% 7% 1%Oregon 113 73% 83 30% 4% 55% 8% 2%Pennsylvania 550 71% 392 20% 3% 70% 3% 3%Rhode Island 31 61% 19 0% 0% 79% 16% 5%South Carolina 192 83% 159 9% 23% 58% 6% 4%South Dakota 83 71% 59 2% 0% 85% 10% 3%Tennessee 243 63% 154 12% 4% 77% 3% 5%Texas 1047 57% 596 49% 37% 10% 2% 2%Utah 85 85% 72 4% 19% 71% 4% 1%Vermont 42 100% 42 38% 5% 40% 12% 5%Virginia 259 77% 200 39% 26% 33% 1% 3%Washington 192 83% 160 13% 29% 52% 5% 1%West Virginia 50 60% 30 23% 3% 67% 3% 3%Wisconsin 329 45% 149 1% 1% 95% 0% 3%Wyoming 38 79% 30 10% 27% 57% 0% 7%National 11174 64% 7112 22% 12% 58% 4% 3%
Employment Provider
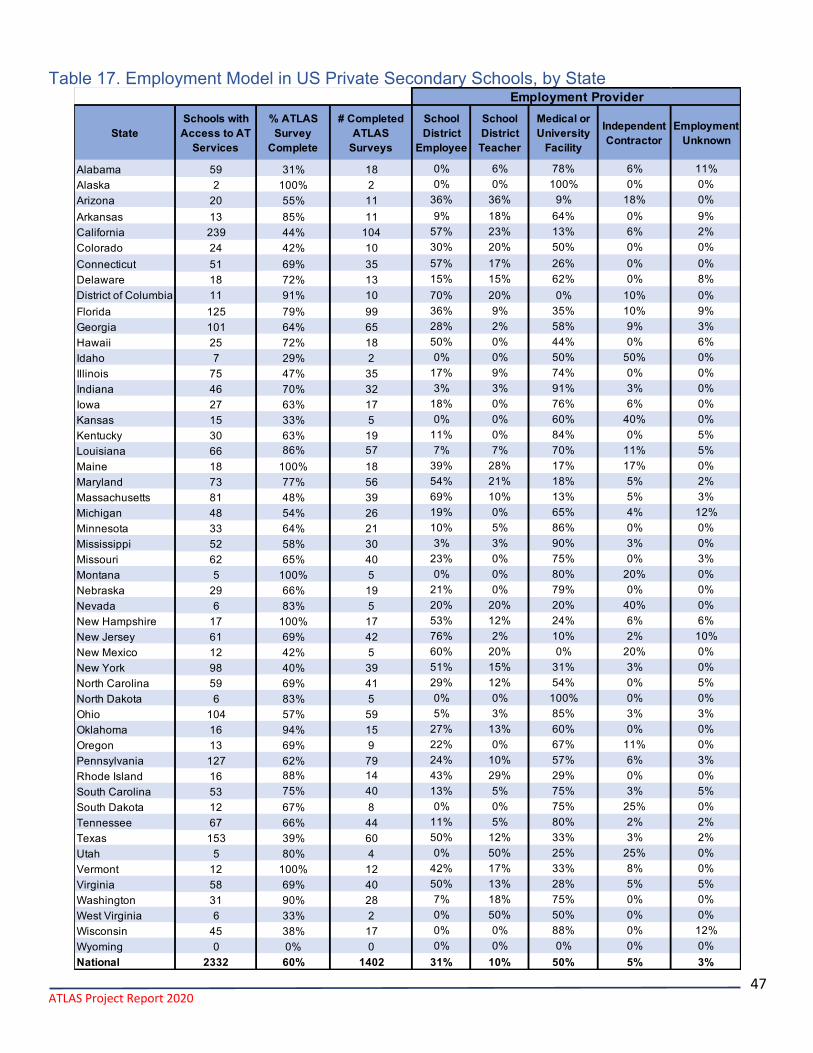
ATLAS Project Report 2020
47
Table 17. Employment Model in US Private Secondary Schools, by State
StateSchools with Access to AT
Services
% ATLAS Survey
Complete
# Completed ATLAS
Surveys
School District
Employee
School District Teacher
Medical or University
Facility
Independent Contractor
Employment Unknown
Alabama 59 31% 18 0% 6% 78% 6% 11%Alaska 2 100% 2 0% 0% 100% 0% 0%Arizona 20 55% 11 36% 36% 9% 18% 0%Arkansas 13 85% 11 9% 18% 64% 0% 9%California 239 44% 104 57% 23% 13% 6% 2%Colorado 24 42% 10 30% 20% 50% 0% 0%Connecticut 51 69% 35 57% 17% 26% 0% 0%Delaware 18 72% 13 15% 15% 62% 0% 8%District of Columbia 11 91% 10 70% 20% 0% 10% 0%Florida 125 79% 99 36% 9% 35% 10% 9%Georgia 101 64% 65 28% 2% 58% 9% 3%Hawaii 25 72% 18 50% 0% 44% 0% 6%Idaho 7 29% 2 0% 0% 50% 50% 0%Illinois 75 47% 35 17% 9% 74% 0% 0%Indiana 46 70% 32 3% 3% 91% 3% 0%Iowa 27 63% 17 18% 0% 76% 6% 0%Kansas 15 33% 5 0% 0% 60% 40% 0%Kentucky 30 63% 19 11% 0% 84% 0% 5%Louisiana 66 86% 57 7% 7% 70% 11% 5%Maine 18 100% 18 39% 28% 17% 17% 0%Maryland 73 77% 56 54% 21% 18% 5% 2%Massachusetts 81 48% 39 69% 10% 13% 5% 3%Michigan 48 54% 26 19% 0% 65% 4% 12%Minnesota 33 64% 21 10% 5% 86% 0% 0%Mississippi 52 58% 30 3% 3% 90% 3% 0%Missouri 62 65% 40 23% 0% 75% 0% 3%Montana 5 100% 5 0% 0% 80% 20% 0%Nebraska 29 66% 19 21% 0% 79% 0% 0%Nevada 6 83% 5 20% 20% 20% 40% 0%New Hampshire 17 100% 17 53% 12% 24% 6% 6%New Jersey 61 69% 42 76% 2% 10% 2% 10%New Mexico 12 42% 5 60% 20% 0% 20% 0%New York 98 40% 39 51% 15% 31% 3% 0%North Carolina 59 69% 41 29% 12% 54% 0% 5%North Dakota 6 83% 5 0% 0% 100% 0% 0%Ohio 104 57% 59 5% 3% 85% 3% 3%Oklahoma 16 94% 15 27% 13% 60% 0% 0%Oregon 13 69% 9 22% 0% 67% 11% 0%Pennsylvania 127 62% 79 24% 10% 57% 6% 3%Rhode Island 16 88% 14 43% 29% 29% 0% 0%South Carolina 53 75% 40 13% 5% 75% 3% 5%South Dakota 12 67% 8 0% 0% 75% 25% 0%Tennessee 67 66% 44 11% 5% 80% 2% 2%Texas 153 39% 60 50% 12% 33% 3% 2%Utah 5 80% 4 0% 50% 25% 25% 0%Vermont 12 100% 12 42% 17% 33% 8% 0%Virginia 58 69% 40 50% 13% 28% 5% 5%Washington 31 90% 28 7% 18% 75% 0% 0%West Virginia 6 33% 2 0% 50% 50% 0% 0%Wisconsin 45 38% 17 0% 0% 88% 0% 12%Wyoming 0 0% 0 0% 0% 0% 0% 0%National 2332 60% 1402 31% 10% 50% 5% 3%
Employment Provider

ATLAS Project Report 2020
48
Table 18. Employment Model of Athletic Trainers in the United States Comparison
Figure 8. Employment Type for AT Services in US Secondary Schools
School Type Year (AY)Schools with Access to AT
Services
% ATLAS Survey
Complete
# Completed ATLAS
Surveys
School District
Employee
School District Teacher
Medical or University
Facility
Independent Contractor
Employment Unknown
Public 2019 11174 64% 7112 22% 12% 58% 4% 3%Public 2018 11135 59% 6529 24% 11% 59% 4% 3%Public 2017 11171 51% 5676 22% 12% 60% 6% -Private 2019 2332 60% 1402 31% 10% 50% 5% 3%Private 2018 2353 55% 1288 33% 9% 51% 5% 3%Private 2017 2302 47% 1078 27% 10% 52% 9% -Public + Private 2019 13506 63% 8514 24% 12% 57% 5% 3%Public + Private 2018 13488 58% 7817 25% 11% 57% 4% 3%Public + Private 2017 13474 50% 6754 23% 13% 59% 6% -
Employment Provider
24%
12%57%
5%3%
Employment Type For AT Services In US Secondary Schools
School District Employee School District Teacher Medical or University FacilityIndependent Contractor Employment Unknown

ATLAS Project Report 2020
49
Athletic Training Services by Employment Model, by NATA District Table 19. Employment Model in US Secondary Schools, by NATA District
Table 20. Employment Model in US Secondary Public Schools, by NATA District
NATA DistrictSchools with
Access to AT Services
% ATLAS Survey
Completion
# Completed ATLAS
Surveys
School District
Employee (%)
School District Teacher
Medical or University
Facility
Independent Contractor
Employment Unknown
District 1 767 71% 547 33% 8% 49% 7% 3%District 2 1702 61% 1040 39% 7% 43% 5% 6%District 3 1255 78% 981 32% 15% 47% 4% 3%District 4 2654 60% 1602 6% 3% 86% 2% 3%District 5 1335 56% 743 13% 3% 77% 6% 2%District 6 1310 57% 750 33% 27% 36% 1% 3%District 7 618 66% 410 27% 26% 41% 3% 2%District 8 1002 52% 522 47% 8% 33% 9% 2%District 9 2335 65% 1514 12% 8% 71% 5% 4%District 10 528 77% 405 10% 11% 70% 6% 2%National 13506 63% 8514 24% 12% 57% 5% 3%
Employment Provider
NATA DistrictSchools with
Access to AT Services
Public % ATLAS Survey
Completion
Public # Completed
ATLAS Surveys
School District
Employee
School District Teacher
Medical or University
Facility
Independent Contractor
Employment Unknown
District 1 572 72% 412 26% 3% 59% 8% 4%District 2 1398 62% 867 39% 7% 43% 6% 6%District 3 995 80% 792 30% 13% 50% 3% 4%District 4 2303 61% 1412 6% 2% 86% 2% 3%District 5 1168 54% 634 12% 4% 76% 5% 2%District 6 1144 59% 679 33% 29% 34% 1% 2%District 7 557 68% 380 27% 27% 42% 2% 2%District 8 732 54% 395 51% 7% 30% 9% 2%District 9 1835 64% 1182 11% 9% 72% 5% 4%District 10 470 76% 359 11% 12% 69% 6% 2%National 11174 64% 7112 22% 12% 58% 4% 3%
Employment Provider
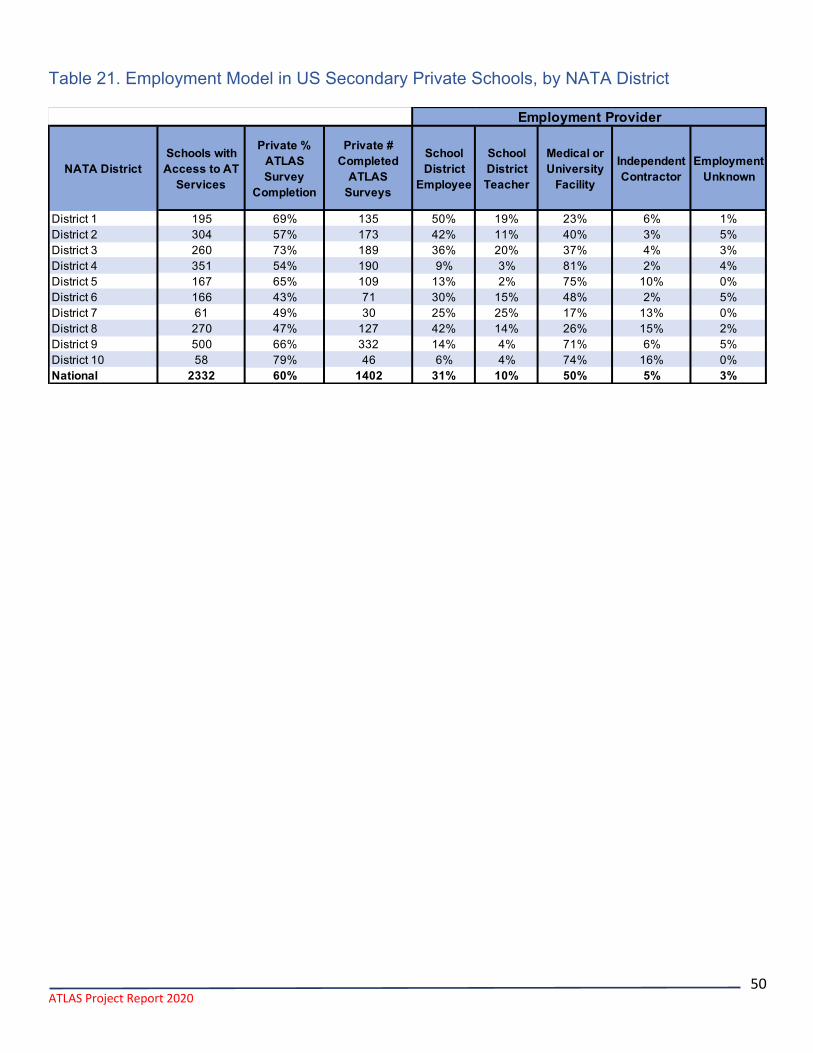
ATLAS Project Report 2020
50
Table 21. Employment Model in US Secondary Private Schools, by NATA District
NATA DistrictSchools with Access to AT
Services
Private % ATLAS Survey
Completion
Private # Completed
ATLAS Surveys
School District
Employee
School District Teacher
Medical or University
Facility
Independent Contractor
Employment Unknown
District 1 195 69% 135 50% 19% 23% 6% 1%District 2 304 57% 173 42% 11% 40% 3% 5%District 3 260 73% 189 36% 20% 37% 4% 3%District 4 351 54% 190 9% 3% 81% 2% 4%District 5 167 65% 109 13% 2% 75% 10% 0%District 6 166 43% 71 30% 15% 48% 2% 5%District 7 61 49% 30 25% 25% 17% 13% 0%District 8 270 47% 127 42% 14% 26% 15% 2%District 9 500 66% 332 14% 4% 71% 6% 5%District 10 58 79% 46 6% 4% 74% 16% 0%National 2332 60% 1402 31% 10% 50% 5% 3%
Employment Provider

ATLAS Project Report 2020
51
Athletic Training Services by Education Level, by State Table 22. AT Education Level in US Secondary Schools, by State
State Schools with Access to AT Services
% ATLAS Survey Complete
# Completed ATLAS Surveys PhD MS BS Unknown
Alabama 332 37% 122 1 74 45 2Alaska 23 43% 10 0 3 6 1Arizona 188 69% 130 1 66 63 0Arkansas 110 85% 94 1 46 46 1California 869 50% 435 4 249 182 0Colorado 235 58% 136 4 67 65 0Connecticut 203 63% 128 0 50 77 1Delaware 55 78% 43 1 19 23 0District of Columbia 29 93% 27 1 22 4 0Florida 508 89% 450 6 233 210 1Georgia 458 59% 271 2 156 112 1Hawaii 68 66% 45 0 23 20 2Idaho 68 68% 46 1 28 16 1Illinois 483 59% 283 1 135 147 0Indiana 365 78% 285 2 146 136 1Iowa 281 41% 116 9 52 55 0Kansas 216 43% 93 2 53 38 0Kentucky 198 65% 128 2 82 40 4Louisiana 289 83% 241 5 128 108 0Maine 92 100% 92 2 22 68 0Maryland 225 79% 178 4 100 74 0Massachusetts 300 57% 172 5 80 87 0Michigan 421 70% 294 0 130 164 0Minnesota 297 65% 193 1 90 102 0Mississippi 240 43% 104 2 63 39 0Missouri 332 62% 205 4 137 62 2Montana 88 78% 69 3 49 17 0Nebraska 189 49% 93 2 53 38 0Nevada 65 65% 42 0 19 9 14New Hampshire 71 96% 68 0 24 44 0New Jersey 393 66% 258 3 157 97 1New Mexico 67 57% 38 1 17 20 0New York 577 46% 268 2 156 110 0North Carolina 383 80% 305 2 155 140 8North Dakota 62 68% 42 1 16 25 0Ohio 714 53% 381 4 188 187 2Oklahoma 160 79% 127 0 88 38 1Oregon 126 73% 92 1 53 37 1Pennsylvania 677 70% 471 4 254 213 0Rhode Island 47 70% 33 0 15 18 0South Carolina 245 81% 199 6 112 80 1South Dakota 95 71% 67 2 40 25 0Tennessee 310 64% 198 1 106 91 0Texas 1200 55% 656 6 395 255 0Utah 90 84% 76 0 45 30 1Vermont 54 100% 54 0 25 29 0Virginia 317 76% 240 2 160 77 1Washington 223 84% 188 5 102 80 1West Virginia 56 57% 32 0 16 16 0Wisconsin 374 44% 166 3 74 87 2Wyoming 38 79% 30 0 21 9 0National 13506 63% 8514 109 4594 3761 50
Education Level

ATLAS Project Report 2020
52
Table 23. AT Education Level in US Public Secondary Schools, by State
State Schools with Access to AT Services
% ATLAS Survey Complete
# Completed ATLAS Surveys PhD MS BS Unknown
Alabama 273 38% 104 1 60 41 2Alaska 21 38% 8 0 2 5 1Arizona 168 71% 119 1 60 58 0Arkansas 97 86% 83 1 41 40 1California 630 53% 331 2 190 139 0Colorado 211 60% 126 3 62 61 0Connecticut 152 61% 93 0 30 63 0Delaware 37 81% 30 0 14 16 0District of Columbia 18 94% 17 1 15 1 0Florida 383 92% 351 3 176 172 0Georgia 357 58% 206 2 117 87 0Hawaii 43 63% 27 0 14 13 0Idaho 61 72% 44 1 28 14 1Illinois 408 61% 248 0 126 122 0Indiana 319 79% 253 2 128 122 1Iowa 254 39% 99 7 47 45 0Kansas 201 44% 88 2 51 35 0Kentucky 168 65% 109 2 68 35 4Louisiana 223 83% 184 4 100 80 0Maine 74 100% 74 2 16 56 0Maryland 152 80% 122 1 69 52 0Massachusetts 219 61% 133 4 62 67 0Michigan 373 72% 268 0 115 153 0Minnesota 264 65% 172 1 79 92 0Mississippi 188 39% 74 1 48 25 0Missouri 270 61% 165 3 113 47 2Montana 83 77% 64 3 46 15 0Nebraska 160 46% 74 1 42 31 0Nevada 59 63% 37 0 16 8 13New Hampshire 54 94% 51 0 18 33 0New Jersey 332 65% 216 3 129 84 0New Mexico 55 60% 33 0 15 18 0New York 479 48% 229 1 133 95 0North Carolina 324 81% 264 2 134 120 8North Dakota 56 66% 37 1 13 23 0Ohio 610 53% 322 2 162 156 2Oklahoma 144 78% 112 0 76 36 0Oregon 113 73% 83 1 49 32 1Pennsylvania 550 71% 392 2 206 184 0Rhode Island 31 61% 19 0 6 13 0South Carolina 192 83% 159 4 90 64 1South Dakota 83 71% 59 2 36 21 0Tennessee 243 63% 154 0 84 70 0Texas 1047 57% 596 3 355 238 0Utah 85 85% 72 0 41 30 1Vermont 42 100% 42 0 19 23 0Virginia 259 77% 200 1 133 65 1Washington 192 83% 160 3 85 71 1West Virginia 50 60% 30 0 14 16 0Wisconsin 329 45% 149 2 65 81 1Wyoming 38 79% 30 0 21 9 0National 11174 64% 7112 75 3819 3177 41
Education Level

ATLAS Project Report 2020
53
Table 24. AT Education Level in US Private Secondary Schools, by State
StateSchools with Access
to AT Services% ATLAS Survey
Complete# Completed ATLAS
SurveysPhD MS BS Unknown
Alabama 59 31% 18 0 14 4 0Alaska 2 100% 2 0 1 1 0Arizona 20 55% 11 0 6 5 0Arkansas 13 85% 11 0 5 6 0California 239 44% 104 2 59 43 0Colorado 24 42% 10 1 5 4 0Connecticut 51 69% 35 0 20 14 1Delaware 18 72% 13 1 5 7 0District of Columbia 11 91% 10 0 7 3 0Florida 125 79% 99 3 57 38 1Georgia 101 64% 65 0 39 25 1Hawaii 25 72% 18 0 9 7 2Idaho 7 29% 2 0 0 2 0Illinois 75 47% 35 1 9 25 0Indiana 46 70% 32 0 18 14 0Iowa 27 63% 17 2 5 10 0Kansas 15 33% 5 0 2 3 0Kentucky 30 63% 19 0 14 5 0Louisiana 66 86% 57 1 28 28 0Maine 18 100% 18 0 6 12 0Maryland 73 77% 56 3 31 22 0Massachusetts 81 48% 39 1 18 20 0Michigan 48 54% 26 0 15 11 0Minnesota 33 64% 21 0 11 10 0Mississippi 52 58% 30 1 15 14 0Missouri 62 65% 40 1 24 15 0Montana 5 100% 5 0 3 2 0Nebraska 29 66% 19 1 11 7 0Nevada 6 83% 5 0 3 1 1New Hampshire 17 100% 17 0 6 11 0New Jersey 61 69% 42 0 28 13 1New Mexico 12 42% 5 1 2 2 0New York 98 40% 39 1 23 15 0North Carolina 59 69% 41 0 21 20 0North Dakota 6 83% 5 0 3 2 0Ohio 104 57% 59 2 26 31 0Oklahoma 16 94% 15 0 12 2 1Oregon 13 69% 9 0 4 5 0Pennsylvania 127 62% 79 2 48 29 0Rhode Island 16 88% 14 0 9 5 0South Carolina 53 75% 40 2 22 16 0South Dakota 12 67% 8 0 4 4 0Tennessee 67 66% 44 1 22 21 0Texas 153 39% 60 3 40 17 0Utah 5 80% 4 0 4 0 0Vermont 12 100% 12 0 6 6 0Virginia 58 69% 40 1 27 12 0Washington 31 90% 28 2 17 9 0West Virginia 6 33% 2 0 2 0 0Wisconsin 45 38% 17 1 9 6 1Wyoming 0 0% 0 0 0 0 0National 2332 60% 1402 34 775 584 9
Education Level

ATLAS Project Report 2020
54
Table 25. Secondary School AT Education Level in the United States Comparison
Athletic Training Services by Education Level, by NATA District Table 26. AT Education Level in US Secondary Schools, by NATA District
Table 27. AT Education Level in US Public Secondary Schools, by NATA District
School Type Year
Schools with Access to AT Services
% ATLAS Survey Complete
# Completed ATLAS Surveys PhD MS BS Unknown
Public 2019 11174 64% 7112 75 3819 3177 41Public 2018 11135 59% 6529 59 3504 2957 9Public 2017 11171 51% 5676 54 3029 2593 0Private 2019 2332 60% 1402 34 775 584 9Private 2018 2353 55% 1288 25 706 550 7Private 2017 2302 47% 1078 19 588 471 0Public + Private 2019 13506 63% 8514 109 4594 3761 50Public + Private 2018 13488 58% 7817 84 4210 3507 16Public + Private 2017 13474 50% 6754 73 3617 3064 0
Education Level By Years
NATA District Schools with Access to AT Services
% ATLAS Survey Completion
# Completed ATLAS Surveys PhD MS BS Unknown
District 1 767 71% 547 7 216 323 1District 2 1702 61% 1040 10 586 443 1District 3 1255 78% 981 15 565 391 10District 4 2654 60% 1602 11 763 823 5District 5 1335 56% 743 20 439 281 3District 6 1310 57% 750 7 441 301 1District 7 618 66% 410 6 216 187 1District 8 1002 52% 522 4 291 211 16District 9 2335 65% 1514 19 842 645 8District 10 528 77% 405 10 235 156 4National 13506 63% 8514 109 4594 3761 50
Education Level
NATA DistrictSchools with Access
to AT Services
Public % ATLAS Survey
Completion
Public # Completed
ATLAS SurveysPhD MS BS Unknown
District 1 572 72% 412 6 151 255 0District 2 1398 62% 867 6 482 379 0District 3 995 80% 792 9 455 318 10District 4 2303 61% 1412 7 675 726 4District 5 1168 54% 634 16 378 238 2District 6 1144 59% 679 4 396 278 1District 7 557 68% 380 4 199 176 1District 8 732 54% 395 2 220 160 13District 9 1835 64% 1182 13 653 510 6District 10 470 76% 359 8 210 137 4National 11174 64% 7112 75 3819 3177 41
Education Level

ATLAS Project Report 2020
55
Table 28. AT Education Level in US Private Secondary Schools, by NATA District
NATA DistrictSchools with Access
to AT Services% ATLAS Survey
Complete# Completed ATLAS
SurveysPhD MS BS Unknown
District 1 195 69% 135 1 65 68 1District 2 304 57% 173 4 104 64 1District 3 260 73% 189 6 110 73 0District 4 351 54% 190 4 88 97 1District 5 167 65% 109 4 61 43 1District 6 166 43% 71 3 45 23 0District 7 61 49% 30 2 17 11 0District 8 270 47% 127 2 71 51 3District 9 500 66% 332 6 189 135 2District 10 58 79% 46 2 25 19 0National 2332 60% 1402 34 775 584 9
Education Level