ATHENS UNIVERSITY OF ECONOMICS AND BUSINESS · PDF fileprovided at the end of this document in...
27
WORKING PAPER SERIES 16-2014 76 Patission Str., Athens 104 34, Greece Tel. (++30) 210-8203911 - Fax: (++30) 210-8203301 www.econ.aueb.gr Greek Economic Growth since 1960 Nicholas Leounakis and Plutarchos Sakellaris ATHENS UNIVERSITY OF ECONOMICS AND BUSINESS DEPARTMENT OF ECONOMICS
Transcript of ATHENS UNIVERSITY OF ECONOMICS AND BUSINESS · PDF fileprovided at the end of this document in...

WORKING PAPER SERIES 16-2014
76 Patission Str., Athens 104 34, Greece
Tel. (++30) 210-8203911 - Fax: (++30) 210-8203301
www.econ.aueb.gr
Greek Economic Growth since 1960
Nicholas Leounakis and Plutarchos Sakellaris
ATHENS UNIVERSITY OF ECONOMICS AND BUSINESS
DEPARTMENT OF ECONOMICS

1
Greek Economic Growth since 1960
by
Nicholas Leounakis1 and Plutarchos Sakellaris2*
(December 2014)
Abstract
We provide consistent annual data on Greek economic growth and its decomposition into the
contributions of capital, labor and Total Factor Productivity (TFP) for the years 1960 to 2013.
Alternatively, we decompose growth for a subset of that period into the contributions of TFP, and capital
and labor services. Recent Greek economic history is a succession of long periods of boom with long
periods of stagnation or depression. The decisive factor of influence on economic growth during the last
fifty-three years has been TFP. Contrary to widespread belief that the credit boom in the eurozone
periphery was used to finance unproductive sectors and investments, we show that TFP growth was very
healthy before the crisis that started in 2008. Furthermore, the performance of TFP proves to have been
the main culprit for the fourteen-year recession from 1980 to 1993 as well as for the current depression.
JEL classification: E32, N10, O40
Keywords: Greek economic growth; Growth accounting; Financial crisis; Total Factor Productivity
1. Summary of results
Economic performance in Greece since 2008 has been dismal. This period is unique
when compared to anything that happened in the Greek economy all the way back to 1960.
However, as Figure 1 aptly shows, it may be considered a dramatic episode of economic
depression in a 50- year history of very volatile growth. This history is a succession of long
periods of boom with long periods of stagnation or depression. This highly volatile
macroeconomic environment has been generated by unsustainable policies that led to two boom-
bust cycles since 1960.
1 Athens University of Economics and Business, Department of Economics, Patission 76, Athens, 104 34, Greece.
E – mail address: [email protected] 2 Athens University of Economics and Business, Department of Economics, Patission 76, Athens, 104 34, Greece.
E – mail address: [email protected] * Corresponding author Tel.: +30 210 8203353; fax: +30 210 8203383.

2
Source: Authors’ calculations
In this paper, we aim at four goals. First, we provide consistent annual data on Greek
economic growth and its decomposition into the contributions of capital, labor and Total Factor
Productivity (TFP) for the years 1960 to 2013. We employ the standard growth accounting
framework using capital stocks and total hours worked as the capital and labor factors
respectively. Second, we augment our analysis using capital and labor services as productive
inputs. This framework is theoretically more appropriate. However, data limitations confine the
analysis to the years 1997 to 2013. Third, we contrast the two methodologies to uncover any
differences in the implied decomposition of growth. Fourth, we classify different periods of
economic growth using the “eyeball metric” (as in Figure 1) and statistical techniques.
Starting with the fourth goal, our statistical tests indicate two structural breaks in the time
series for GDP per Capita: 1974 and 2008. Visual inspection of the time series, however,
indicates that 1994 may be considered a third break point. Given the (relatively) short time
series and the power of the statistical test, we argue for considering four separate episodes in
Greek economic growth since 1960: 1) the Great Expansion (1960 – 1973), 2) the Long
Stagnation (1974 – 1993), 3) the Recovery (1994 – 2007), and 4) the Great Depression (2008-
2013). Regarding the “Long Stagnation” period, one might subdivide it further into a) the
Moderate Expansion (1974 – 1979) and b) the Great Recession (1980 – 1993)3.
How does this economic performance decompose into the contributions of TFP, capital
stock and total hours worked? We find that the stunning average GDP growth rate of 8.08% over
the period 1960-1973 was due to TFP and capital input contributing by 5.71% and 2.51%
respectively. The “Great Expansion” was mostly a phenomenon of rapid catch-up in economic
3 Gogos et al (2014) also provide evidence of a slowdown after 1974 and a great recession until
1994, followed by a recovery. They do not test statistically for breaks. They rely on a dynamic general
equilibrium model and find that TFP is crucial in accounting for growth patterns.

3
efficiency and secondarily of unusually high capital accumulation. Of course, the latter was to a
large extent driven by the former4.
From 1974 to 1979 GDP growth slowed down to 3.38%, a good performance compared
to later periods but markedly worse than the preceding fourteen years and a prelude to the future.
This was a result of TFP growing at the lower pace of 1.11%, 4.6 percentage points lower than in
the “Great Expansion” period. Despite the dramatic drop in TFP growth, capital accumulation
continued surprisingly strong. In both of these periods, labor input’s influence was practically
minimal (-0.13% and -0.07%). Over the period 1980-1993 the Greek economy sank into a
fourteen year-long recession, as the GDP rate of change plunged to 0.71%. Capital accumulation
slowed down dramatically, now contributing 0.83% to GDP growth while TFP subtracted from
growth (-0.58%). The situation was partially offset by an improvement in labor input (0.47%).
During the period 1994-2007 the economy recovered partially. The growth rate of output
averaged 3.62% as all three inputs improved (0.65%, 1.11% and 1.85% for labor, capital and
TFP respectively). Beginning in 2008, the combined effect of financial and sovereign crises took
its toll on the Greek economy. During the “Great Depression” of 2008-2013, GDP dropped at
an annual rate of 4.37% on average. This was due to labor input decreases (-2.31% per annum)
and TFP decreases (-2.44% per annum), while net capital formation dropped to the lowest
average level of all periods since 1960 (+0.38% per annum).
Our results indicate that the decisive factor of influence on economic growth during the
last fifty three years has been TFP. Its contribution to growth in output varies from 33% to 71%
over the periods 1961-1973, 1974-1979 and 1994-2007. Furthermore, the performance of TFP
proves to have been the main culprit for the fourteen-year recession from 1980 to1993 as well as
for the current depression. Contrary to widespread belief that the credit boom in the eurozone
periphery was used to finance unproductive sectors and investments, we show that TFP growth
was very healthy before the crisis that started in 2008. During 1997 to 2007, annual TFP growth
averaged 1.92% (standard methodology) or 1.63% (alternative methodology mentioned in the
following paragraph). Annual results are contained in Appendix A.
We repeated the growth accounting exercise using capital and labor services as
productive inputs instead. This methodology is theoretically superior to the one using stocks. As
a result of accounting for changes in the quality of labor and capital, TFP growth is now
measured to be slower. The empirical results point to some differences but not large ones.
Depending on the period, TFP growth is lower by 15.10% to 18.85% when quality changes are
accounted for. The qualitative conclusions do not change.
In section 2, we outline the standard growth accounting methodology and discuss the
data. In section 3, we present the results using capital stock and hours worked, while in section 4
we decompose output growth into capital and labor services and TFP growth. In Appendix A,
we elaborate on the methodology and present annual results. In Appendix B, we provide some
sensitivity tests and in Appendix C, we list the data sources.
4 For an insightful analysis of the political and economic forces behind the periods of “Great Expansion”
and “Long Stagnation” in Greece, see Alogoskoufis (1995).

4
2. Methodology and Data
Growth accounting decomposes the growth of gross domestic product into components
related to the accumulation of productive inputs and a residual term called Total Factor
Productivity or Solow residual, in honor of Nobel laureate Robert Solow, who developed this
idea (1957). Growth accounting decomposition does not explain but can help in understanding
the forces that drive growth, such as institutions, the rule of law, and sound policies. The
framework employs a standard neoclassical production function:
, (1)
where aggregate output Y is a function of capital input K, labor input L and total factor
productivity, A. Differentiating with respect to time and then dividing by Y we get the growth
rate of total output as:
, (2)
where FK and FL are the marginal products of capital and labor respectively and g =
is
the Solow residual. This is the part of economic growth that cannot be explained by the
contributions of production inputs, and is interpreted as growth of total factor productivity.
Assuming perfect competition in output and factor markets, the price of capital (UK) is equal to
the marginal product of capital and the wage (W) is equal to that of labor. It then follows that:
SK =
and SL =
are the respective shares of each factor’s remuneration in total
product. The growth of output then equals the weighted sum of the growth rates of production
inputs and that of the Solow residual:
(3)
The data we use was drawn mainly from the OECD and Eurostat. Detailed sources are
provided at the end of this document in Appendix C. We note that 2005 was chosen as the base
year and our calculations and results are in year-average prices.
Series on total investment were taken from the OECD and were available from 1960
onwards. Data on GDP were also available from 1960 and we extended it back to 1951 using
data from the Penn World Table. Assuming that the flow of investment is equally distributed
over the period, we calculate net capital stock and consumption of fixed capital in base-year
average prices using the following equations:

5
Net Capital Stock (end of period):
(4)
Consumption of Fixed Capital:
(5)
In equation (4) we apply the perpetual inventory method, which denotes that at the end of
the period, the net capital stock equals the stock at the beginning of that period plus investment
minus the consumption of fixed capital. The aggregate depreciation rate (δ) was assumed to be
constant and chosen to match the capital and labor services analysis5.
The input of labor is measured by total hours worked, i.e. total employment times
average hours actually worked in a year. As for the labor share we used the compensation of
labor divided by gross value added, after accounting for the income of self-employed. The share
of capital is computed as 1 minus that of labor.
3. Results
Figure 1 above depicts the evolution of GDP per capita since 1960. One can discern four
distinct periods of growth. A period of explosive growth spans the years 1960-1973, during
which GDP per capita grew at an average rate of 7.51%. We call this the “Long Expansion.”
Then came the period of the “Long Stagnation,” when GDP per capita grew at 0.70%. This
period lasted from 1974 to 1993. Beginning in 1994 the economy recovered, and until 2007 per
capita GDP grew at 3.12% annually. This was a “Recovery” period. Finally, in 2008, Greece
entered a “Great Depression” period during which per capita GDP declined at a dramatic rate of
-4.62%.
We will now use equation (3) to decompose the rate of change of output into the
respective contributions of TFP and the other inputs. The results are shown in Table 1:
5 Details are provided in section 4.

6
Source: Authors’ calculations
During the 60s and until 1973 GDP growth averaged 8.08% annually thanks to strong
TFP growth and capital accumulation. After the first oil shock started a period of tapered growth
for the following 6 years, during which growth slowed down to 3.38%. The main culprit was the
drastic reduction in TFP growth (averaging 1.1% annually). In 1980, Greece entered a
prolonged recession that lasted for fourteen years. Capital accumulation rates fell dramatically to
0.83% on average, and TFP was substantially lower at the end of the period than in the
beginning. The situation was partially offset by an improvement in the labor factor which for the
first time has a positive, though small, contribution of 0.47%. During the period 1994-2007 the
economy recovered as GDP grew at 3.62% per year. All three inputs contributed to this recovery
and TFP grew annually at a rate of 1.85%, the highest in 20 years. Finally, in 2008, after 14
consecutive years of growth, the Greek economy went on a long downward slide as a result of
the global financial crisis and its own sovereign debt crisis. GDP fell by an average of 4.37%
annually until 2013. Unemployment rose and total employment and TFP fell dramatically.
Figure 2 tells the same story from a different perspective. It contains the decomposition
of labor productivity into the contributions of capital deepening6 and TFP, the results of which
are included in Table 2. It is clear that TFP growth in 1961-1973 is what sustained the rapid
growth of labor productivity at 8.40%, while on the other hand, the slowdown that followed
during 1974-1979 can be ascribed to a deterioration of TFP, as it dropped from 5.71% to 1.11%.
The 14-year recession that ensued saw labor productivity decline at 0.10% each year as a
result of TFP and capital deepening contributing by -0.58% and 0.49% respectively. During the
6 Labor productivity is computed as the ratio of total product to total hours worked. Capital deepening is
the ratio of capital stock to total hours worked.
GDP Labour Input Total Employment
Average Hours
Worked
Net Capital
Stock TFP
1961-1973 8.08% -0.13% 0.13% -0.26% 2.51% 5.71%
1974-1979 3.38% -0.07% 0.35% -0.42% 2.33% 1.11%
1980-1993 0.71% 0.47% 0.47% 0.00% 0.83% -0.58%
1994-2007 3.62% 0.65% 0.89% -0.24% 1.11% 1.85%
2008-2013 -4.37% -2.31% -2.24% -0.07% 0.38% -2.44%
Table 1
Growth Decomposition With Capital Stocks and Total Hours Worked
Labour Input breaks into:

7
recovery period that started in 1994, labor productivity rose at 2.61% as capital deepening and
TFP improved (0.75% and 1.85% respectively). Finally, from 2008 to 2013 labor productivity
declined at a rate of -0.60% and TFP plunged at the rate of -2.44%. Capital, however, deepened
as a result of total hours worked decreasing. It is sensible to claim that a large part of the drop in
TFP is a measurement error due to lack of correction for capital and labor utilization, which,
undoubtedly, fell sharply during the period. Unfortunately, we do not have utilization data.
Our breakdown of the data into separate growth periods was motivated by casual
inspection of the figures and results presented above. Using a formal statistical test of break
points in the time series of growth rates of GDP per capita, we arrive at a similar classification.
We use procedures developed by Bai and Perron in a series of papers (1998, 2000, 2003) to
determine the number and dates of possible structural breaks. Their methodology has the
1961-1973 1974-1979 1980-1993 1994-2007 2008-2013
Labor
Productivity8.40% 3.51% -0.10% 2.61% -0.60%
Capital
Deepening 2.69% 2.40% 0.49% 0.75% 1.84%
TFP
5.71% 1.11% -0.58% 1.85% -2.44%
Table 2
Labor Productivity Decomposition

8
advantage of allowing multiple break points to be determined endogenously. The Bai-Perron test
determined only two breakpoints for the growth rate of GDP per capita: in 1974 and 2007. Table
3 contains the results of the same test for the growth rates of labor productivity and TFP. We
first investigated the stationarity of these series using a typical ADF test and the Perron (1997)
test, which allows for the possibility of one structural break. Interestingly, under the constraint
of only one possible break in the time series of growth of GDP per capita, the Perron (1997) test
picks the year 1993. For more details on these tests, see section 5 of Appendix A.
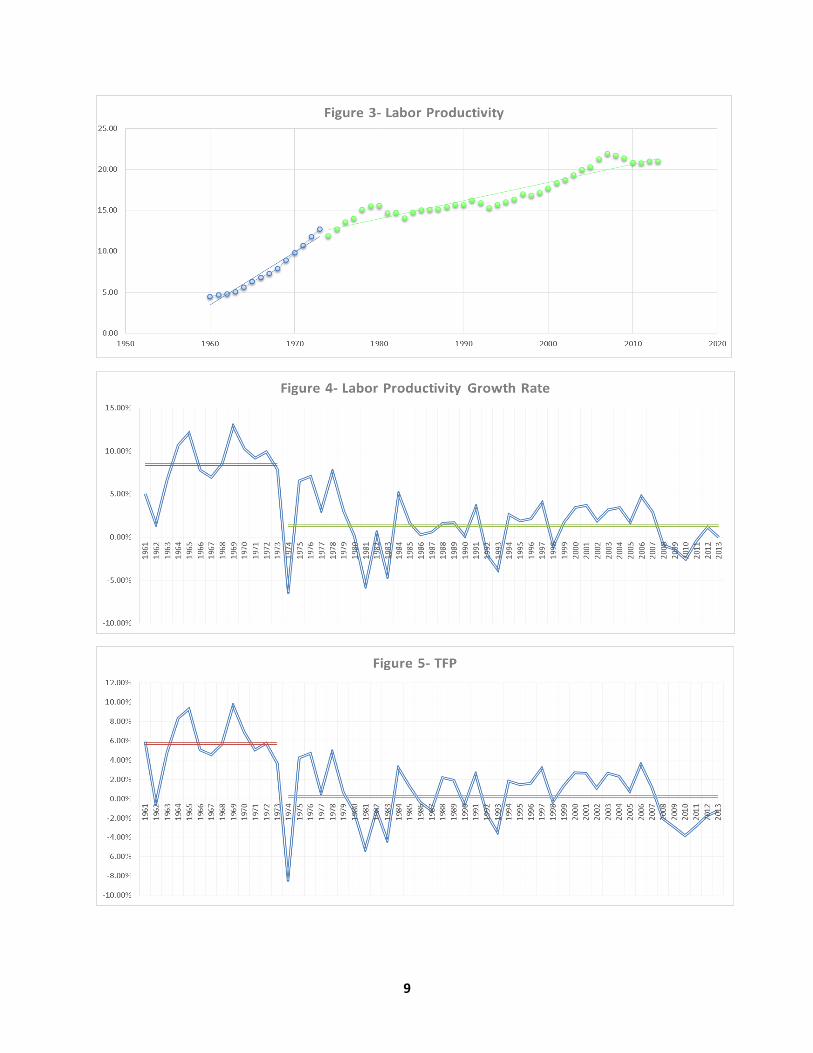
Based on these results, figures 3, 4 and 5 depict labor productivity (levels and growth
rates) and TFP growth rates, each with a structural break in 1974 and the corresponding trend
lines.
ADF TestSchwarz
Criterion Perron (97)
sequential global
information
criteria
Labor
Productivity
growth rate Stationarity
stationarity
with break in
1973 break in 1974
rejects the null of
no breaks, global
optimizers for one
break: 1974 one break
GDP per Capita
growth rate Stationarity
stationarity
with break in
1993 break in 1974
rejects the null of
no breaks, global
optimizers for two
breaks: 1974, 2007 two breaks
TFP growth rate Stationarity
stationarity
with break in
1974 break in 1974
rejects the null of
no breaks, global
optimizers for one
break: 1974 one break
Bai-Perron
Table 3Breakpoint Test
9

10
4. Capital and Labor Services
From a theoretical point of view, capital and labor services are considered more
appropriate for productivity analysis as they take into account compositional changes in
employment and stock of capital. In this section we perform the growth accounting exercise
using capital and labor services as inputs. Eurostat and the OECD provide us with enough data
to perform such a task for the years 1997-20137. This is, admittedly, a very limited time period.
Still, comparing the results from the two methods during the years 1997 -2013 is a good check of
robustness.
Capital stock is not considered the best proxy to account for the contribution of the
existing capital assets to aggregate production. There are three main problems with using the
(net) capital stock as the capital input. The first problem is that, as a stock, it is inconsistent with
other variables, such as total hours worked, that enter the production function as flows. Another
problem when using capital stock is that it does not account for heterogeneity in capital assets.
The third problem is that capital stock does not capture correctly the contribution of more
productive assets which may have short asset lives and low price, since assets are weighted by
their market value when computing the capital stock and therefore expensive assets with longer
service lives are assumed to contribute more. One should keep in mind that the problem of
heterogeneity of labor inputs arises also when measuring labor input by total hours. Specifically,
using total hours worked as the labor input does not take into account important compositional
changes, such as those in education level and the participation of women.
The modern approach is to consider the flow of productive services which originate from
the stock of physical assets in a given time period. These are considered more appropriate to
enter the production function as capital input. The same holds for labor services. The theory of
measuring capital services was developed by Dale Jorgenson (1963, 1967, 1969 etc.) and other
authors in the 1960s and since then, the literature has grown and detailed guidelines have been
published. The methodology we follow and that we describe in detail in Appendix A is the one
outlined by the OECD (2009).
Table 4 contains the results split in two separate periods: 1997-2007 (which is a subset of
the “Recovery”) and 2008-2013. Looking at this new data we can observe that, over both
examined periods, compositional changes in the amount of total hours worked have had a small,
positive influence on growth (0.21% and 0.37%). Any quality changes, however, in the
productive capital stock seem to have had a barely noticeable effect. As a result, when we
compare these findings with those in Table 1 (which, for convenience, are also given in Table 5
below, averaged over corresponding periods) we notice that, moving from capital and
7 We concluded that no reliable data could be used to decompose growth before 1997.

11
labor services to capital stocks and total hours worked overestimates the contribution of TFP by
15.10% in the first period and underestimates it by 18.85% in the second period. In other words,
the two methodologies do not result in substantially different decompositions.
Source: Authors’ calculations
Table 5
Growth Decomposition with Capital Stocks and Total Hours Worked
GDP Labour Input
Total Employment
Average Hours
Worked
Net Capital Stock TFP
Average 1997-2007 4.02% 0.83% 0.92% -0.09% 1.27% 1.92%
Average 2008-2013 -4.37% -2.31% -2.24% -0.07% 0.38% -2.44%
Source: Authors’ calculations
Average
1997-2007 4.02% 1.04% 0.92% -0.09% 0.21% 1.35% 1.28% 0.07% 1.63%
Average
2008-2013 -4.37% -1.94% -2.24% -0.07% 0.37% 0.47% 0.51% -0.04% -2.90%
Labor
Composition
Capital
Services
Net/Productive
capital Stock
Quality
EffectTFPGDP Labour Input
Total
Employment
Average Hours
Worked
Growth Decomposition with Capital and Labor Services
Table 4
Labour Input breaks into: Capital Services break into:
Labor Input breaks into:

12
References
Alogoskoufis, G. (1995), “The Two Faces of Janus: Institutions, Policy Regimes and
Macroeconomic Performance in Greece”, Economic Policy, Vol. 10, Issue 20, pp. 149-192
Bai, J. and Perron, P. (1998): "Estimating and Testing Linear Models with Multiple
Structural Changes", Econometrica, Vol. 66, pp. 47-78
Bai, J. and Perron, P. (2000): “Multiple Structural Changes: A Simulation Analysis”,
Boston University, Working Paper.
Bai, J. and Perron, P. (2003): “Computation and Analysis of Multiple Structural Change
Models”, Journal of Applied Econometrics, Vol. 18, pp. 1-22
Bosworth B. and Kollintzas T., (2001): “Economic Growth in Greece: Past Performance
and Future Prospects”, in R.C. Bryant, N.G. Garganas, and G.S. Tavlas (editors), Greece’s
Economic Performance and Prospects, Bank of Greece and The Brookings Institution.
Gogos S. G., Mylonidis N., Papageorgiou D. and Vassilatos V., (2014), “1979–2001: A
Greek great depression through the lens of neoclassical growth theory”, Economic
Modelling, Vol. 36, pp. 316–331.
Jorgenson, D. (1963), “Capital theory and investment behavior”, American Economic
Review 3, 247–59
Jorgenson, D. and Griliches, Z. (1967), “The explanation of productivity change”, Review
of Economic Studies 34, 349–83
Jorgenson, D. and Christensen, L. (1969), “The measurement of U.S. real capital input”,
Review of Income and Wealth 15, 293–320
Kehoe, T. and Prescott, E. (2007), “Great depressions of the twentieth century’’, Review of
Economic Dynamics, vol. 5
Nelson, C.R. and Plosser, C.I. (1982), “Trends and Random Walks in Macro-Economic
Time Series”, Journal of Monetary Economics, 10, 139-162
OECD (2009), “Measuring Capital- OECD Manual”, Second Edition
Perron, P. (1989), “The Great Crash, the Oil Price Shock and the Unit Root Hypothesis”,
Econometrica, Vol.57, pp 1361-1401
Perron, P. (1997), “Further Evidence on Breaking Trend Functions in Macroeconomic
Variables”, Journal of Econometrics, 80 (2), pp. 355-385

13
Scarpetta, S., Bassanini, A., Pilat, D. and Schreyer, P. (2000), “Economic Growth in the
OECD Area: Recent Trends at the Aggregate and Sectoral Level”, OECD, Working Papers
No. 248
Schreyer, P. (2003), “Capital Stocks, Capital Services and Multi-Factor Productivity
Measures”, OECD Economic Studies, No. 37, 2003/2
Solow, R. (1957) “Technical Change and the Aggregate Production Function”, Review of
Economics and Statistics, vol.39.
The Conference Board, Total Economy Database™, January 2014, http://www.conference-
board.org/data/economydatabase/, Methodological Notes
Timmer, M., van Moergastel, T., Stuivenwold, E., Ypma, G., O’Mahony M. and
Kangasniemi, M. (2007),”EU KLEMS GROWTH AND PRODUCTIVITY ACCOUNTS,
Version 1.0 PART I Methodology”, EU KLEMS
Timmer, M. (2012), "The World Input-Output Database (WIOD): Contents, Sources and
Methods", WIOD Working Paper Number 10

14
Appendix A
We present here the basic methodology followed for decomposing economic growth. First, we
discuss the theory that underlies our calculations and then we provide annual results.
A.1 Capital Stocks
Our estimation begins by computing the gross fixed capital stock. This is the accumulated stock
of past investments corrected for retirement using an age-retirement pattern. It is called gross
because consumption of fixed capital has not yet been deducted, thus ignoring asset decay. Once
the gross fixed capital stock is computed, we can estimate the net fixed capital stock by applying
an age-price profile that depicts an asset’s loss in value over time. So the net capital stock is the
stock of assets surviving from past periods that is corrected for depreciation, i.e. consumption of
fixed capital. When a geometric age-price profile is used, i.e. a constant rate of depreciation is
assumed, it can be shown that this can act as a good approximation to a combined age-
price/retirement profile (OECD 2009). What this means is that we can derive the net capital
stock without first having to estimate the gross capital stock.
Equation (4) of section 2 is the perpetual inventory identity which allows us to construct time
series on net capital stock. However, in the absence of full time series of investment, we need to
estimate the initial capital stock in year 1951. We do so by following a methodology similar to
that of Kehoe and Prescott (2007). According to that, the initial value of the capital stock
must satisfy that:
∑
, (6)
where Yt is the value of real output in time t, so the ratio of capital stock to the initial product
should equal the average of that ratio over the next fifteen years8. It is important to note that our
investment series from the OECD go as back as 1960 only, so for the years 1951-1959 we
assume that investment grew at the rate of real GDP.
8 Various methods exist in the literature, like for example the steady-state approach. In general, each
method comes with advantages and disadvantages, but choosing one over the other becomes less
important when the initial year is chosen to be as far back in time as possible. It can then be shown that
the resulting series from all methods over the examined period converge. This is the reason why we chose
1951 as our initial year, which is sufficiently long before the period we want to examine.

15
Before moving on to calculating capital services, we make one final remark: the stock series
generated by equation 4 is expressed in units of new assets. This means that the capital stock is
measured in new asset prices that are observable in the market. This is important when
calculating the rate of change of the stock of capital: with investment series by type of asset, it
can be shown that the rate of change of total capital stock equals the sum of rates of change of all
asset stocks, each weighted with relative market prices. This is different from the aggregation
scheme that we use for the rate of change of capital services, in which relative rental prices are
required instead. We will see that this also makes a difference for the shares of capital input in
total product used in equation (3), when these are calculated in the case of capital stocks and in
the case of capital services.
A.2 Capital Services
We proceed by identifying 6 groups of assets. These are: dwellings, other buildings and
structures, transport equipment, other machinery and equipment, intangible fixed assets and
cultivated assets. The intermediate step towards calculating the flow of capital services from
these assets is the estimation of the productive stock. This is derived similarly to the net capital
stock, when one applies an age-efficiency profile in the place of the age-price profile described
earlier. The age-efficiency profile depicts an asset’s loss in productive efficiency over time and
thus the productive stock is the stock of assets surviving from past periods that is corrected for its
loss in productive efficiency. The flow of capital services for a group of assets is considered to
be proportional to the productive stock of that group of assets. Again, in the case of geometric
rates the age-efficiency profile can be used as an approximation to a combined age-
efficiency/retirement profile. Using geometric rates also comes with the advantage that the age-
efficiency and age-price profiles are identical and as a result the productive stock is the same as
the net capital stock. We can therefore use equations 4, 5 and 6 to calculate the end-of-period, net
capital stock for each asset group and this will also be equal to that asset’s productive stock.
The depreciation rates for each type of asset are collected from the EUKLEMS (Timmer et al,
2007), which in turn bases its calculations to BEA depreciation rates by Fraumeni (1997). Across
all industries, EUKLEMS uses a range of depreciation rates for each type of asset. We made sure
that the rates we used did not exceed those ranges. The aggregate depreciation rate used in the
case of capital stocks earlier was derived using the formula:
∑
, where:
∑
∑
(7)
As explained in footnote 5, we want the generated stock series to depend as little as possible on
the initial capital stock and, consequently, on the method with which that was calculated. This is

16
the reason why we did not take into account the first few observations generated by equation 4.
However, skipping years like that is not possible in the present case due to limited data. We
therefore decided to choose the depreciation rates so that the total initial capital stock in 1995 is
as close as possible to the 1995 capital stock calculated in section 2 where the aggregate
depreciation rate was used. So, although capital stock series from 1997 onwards remain highly
dependent on the value of the initial stock, we can be sure that the target value we set for the
1995 capital stock is “correct” given the depreciation rates and the analysis with capital stocks
discussed above.
The next step is to calculate the price of capital services or rental price. This is done using
information on the real rate of return to capital, the depreciation rate and the rate of revaluation.
We opted for the endogenous, ex post approach with regard to the real rate of return. According
to that, internal rates of return are computed by imposing the condition that the estimated value
of capital services exactly corresponds to gross operating surplus plus the capital element of
gross mixed income. The total user costs for a particular asset type are then computed as the
productive stock of that asset times its rental price.
Assuming that the flow of capital services from capital asset i moves in proportion with the
corresponding, mid-year productive stock, we can compute the rate of change of capital services
ΔLnBt as a Törnqvist index:
∑ , (8)
where
and
∑
We use Ui,t to denote the rental price of asset type i in time t and Ki,t is the corresponding
productive stock, so that Ui,t * Ki,t are the user costs for that asset. Equation (8) tells us that the
rate of change of capital services equals the weighted sum of rates of change of the productive
stocks for each asset group, where the weights are the shares in user costs.
A.3 Labor Services
Labor input should take into account changes in total employment and average hours actually
worked as well as compositional changes, such as those in education level and participation of
women. For the period 1997-2013, we divide total employment by gender and three levels of
educational attainment: a) pre-primary, primary and lower secondary education (levels 0-2

17
according to ISCED), b) upper secondary and post-secondary non-tertiary education (levels 3
and 4) and c) first and second stage of tertiary education (levels 5 and 6). That gives us a total of
6 groups of workers and our input will be the total hours worked by each group. Aggregating
across hours worked by each group to get a measure of labor input change is similar to
aggregating across assets like we did in the previous section. Assigning weights, however,
should be somewhat easier since the price of labor is observable in the market in the form of
wages, unlike rental price of capital which we had to compute. Similarly as in equation (6), the
rate of change labor input is given by:
∑ , (9)
where:
and
∑
.
We express mean hourly earnings of workers’ group j in time t relative to the average earnings
for each gender in time t with
and total hours worked by the same group with . Due to
data limitations we use relative wages which are assumed constant over periods of time9. This
doesn’t change that expresses the compensation of workers’ group j in time t so that
equation (7) denotes that the rate of change of total labor input is given by the weighted sum of
the rates of change of total hours worked by each group, with shares in total labor compensation
acting as weights.
Regarding the data needed to construct labor services, we resorted to Eurostat. However, no data
of hours worked by educational attainment was available, so we had to cross-classify between
data on full-time/part-time employment by educational attainment and sex and data on average
number of weekly hours actually worked by full-time/part-time type of employment and sex. In
essence, this type of “concordance” makes the simplifying assumption that, on average, all
persons working part-time (full-time respectively) worked the same amount of hours regardless
of their educational level. This enables us to acquire series of total weekly hours worked by men
and women of different educational level (which in this exercise is a proxy for skill). Finally,
EUROSTAT time series on average working hours begin in 1983, so for the years 1970-1982 we
complement with data from the OECD database. The rate of change for the total, skill-adjusted
amount of weekly hours worked that serves as our labor input is constructed through the
weighting scheme of equation (9). The required data on earnings by sex and educational
attainment is provided by Eurostat for the years 2006 and 2010.
9 This kind of assumption is not new. See Scarpetta et al. (2000) and Schreyer et al (2003) who also hold earnings
relative-to-average constant and Timmer (WIOD 2012) who holds earnings relative to those of medium-skill
workers constant.

18
A.4 Input Shares
We saw in equation (3) that when perfect competition is assumed, then each factor is paid with
its marginal product. So the marginal product of labor will be equal to the labor wage and the
marginal product of capital will be equal to the rental price of capital. We can then calculate the
respective shares of labor and capital in time t as:
(
∑
∑
) (10)
(
∑
∑
∑
∑
) , (11)
where is the total remuneration of labor in time t, which includes the compensation of
both employees and self-employed) and are the total user costs of capital in time t.
The sum of the remuneration of capital and labor should equal gross value added10
.
A.5 Structural break analysis
Structural change occurs in many time series for any number of reasons, including economic
crises, changes in institutional arrangements, policy changes and regime shifts. Several
methodologies have been developed over the last 20 years as the literature has progressed from a
priori assumptions for the occurrence of a break to endogenously calculating its place in time. In
this section, we explain our estimations based primarily on the Bai-Perron technique.
Research on determining structural breaks has been closely related with unit root testing. In time
series analysis an important test called the Augmented Dickey- Fuller (ADF) test has been
widely used to check for the existence of unit root. Nelson and Plosser (1982), using the ADF
test on 14 macroeconomic variables of the American economy, argued that most macroeconomic
time series contain a unit root. However, Perron (1989) challenged their results and showed that
when a structural break which has not been accounted for is present, then the ADF test is biased
towards non-rejection of the null hypothesis of the existence of unit root. Perron deals with this
problem by introducing a single, exogenous structural break in the ADF test, in both the null and
10
The reader is reminded that the endogenous, ex-post rate of return for every period was computed by
equating gross operating surplus plus capital related taxes on production to the total user costs of capital

19
the alternative hypothesis. Since then the literature has moved on to consider multiple structural
breaks and estimating them endogenously.
In addition to the ADF test, we also carry out the Perron (1997) test. This test checks for
stationarity and at the same time investigates the existence of one single structural break
endogenously. Breaks can be sought in the intercept, the trend or both. Typically, this test has
been criticized as being biased towards rejecting the null hypothesis of a unit root to the
alternative of (trend) stationarity with breaks because the former does not allow for a break.
As our primary tool to detect breaks we use procedures developed by Bai and Perron. Their
methodology has the advantage of allowing multiple break points to be determined
endogenously, however it “precludes integrated variables (with an auto-regressive unit root)”
(2000, p.10). Consequently, we look for a break in growth rates of variables that are found to be
stationary. We carry out the following three procedures: i) a sequential test of L+1 breaks vs the
alternative of L breaks, ii) a test of globally optimized breaks against the null of no breaks and
iii) global information criteria to select the number of breaks.

20
A.6 Annual Results
GDP Labour Input Total Employment
Average Hours
Worked Net Capital Stock TFP
1961 13,20% 5,90% 6,22% -0,31% 1,39% 5,91%
1962 0,36% -0,82% -0,53% -0,29% 1,68% -0,50%
1963 5,40% -0,82% -0,53% -0,29% 1,40% 4,81%
1964 9,41% -0,79% -0,52% -0,28% 1,87% 9,61%
1965 10,77% -0,78% -0,51% -0,27% 2,23% 9,32%
1966 6,49% -0,78% -0,51% -0,27% 2,21% 5,07%
1967 5,67% -0,80% -0,52% -0,27% 1,90% 4,57%
1968 7,20% -0,82% -0,54% -0,28% 2,35% 5,67%
1969 11,56% -0,81% -0,53% -0,28% 2,72% 9,65%
1970 8,93% -0,73% -0,48% -0,25% 2,77% 6,89%
1971 7,84% -0,66% -0,44% -0,22% 3,41% 5,09%
1972 10,16% 0,12% 0,34% -0,22% 4,31% 5,73%
1973 8,09% 0,11% 0,32% -0,21% 4,34% 3,65%
1974 -6,44% -0,08% 0,30% -0,38% 1,98% -8,34%
1975 6,37% -0,09% 0,31% -0,39% 2,23% 4,23%
1976 6,85% -0,09% 0,32% -0,40% 2,26% 4,68%
1977 2,94% -0,10% 0,33% -0,42% 2,45% 0,59%
1978 7,25% -0,20% 0,24% -0,44% 2,59% 4,86%
1979 3,28% 0,16% 0,61% -0,45% 2,47% 0,65%
1980 0,68% 0,32% 0,76% -0,44% 1,66% -1,30%
1981 -1,55% 2,47% 2,91% -0,44% 1,22% -5,25%
1982 -1,13% -0,93% -0,47% -0,46% 1,01% -1,21%
1983 -1,08% 2,13% 0,64% 1,48% 1,07% -4,27%
1984 2,01% -1,74% 0,22% -1,96% 0,57% 3,18%
1985 2,51% 0,50% 0,59% -0,08% 0,74% 1,26%
1986 0,52% 0,14% 0,21% -0,07% 0,72% -0,34%
1987 -2,26% -1,62% -0,05% -1,57% 0,57% -1,21%
1988 4,29% 1,49% 0,93% 0,56% 0,60% 2,20%
1989 3,80% 1,20% 0,22% 0,98% 0,69% 1,91%
1990 0,00% -0,08% 0,79% -0,87% 0,72% -0,63%
1991 3,10% -0,24% -1,38% 1,14% 0,80% 2,54%
1992 0,70% 1,60% 0,83% 0,77% 0,70% -1,60%
1993 -1,60% 1,27% 0,35% 0,92% 0,58% -3,45%
1994 2,00% -0,32% 1,06% -1,37% 0,49% 1,83%
1995 2,10% 0,14% 0,53% -0,40% 0,52% 1,45%
1996 2,36% 0,14% 0,76% -0,62% 0,62% 1,60%
1997 3,64% -0,24% -0,20% -0,04% 0,70% 3,17%
1998 3,36% 2,81% 2,84% -0,03% 0,86% -0,30%
1999 3,42% 1,07% 0,29% 0,78% 1,03% 1,32%
2000 4,48% 0,66% 0,96% -0,30% 1,14% 2,68%
2001 4,20% 0,32% 0,09% 0,23% 1,22% 2,66%
2002 3,44% 0,99% 1,34% -0,35% 1,34% 1,11%
2003 5,94% 1,75% 1,49% 0,25% 1,53% 2,67%
2004 4,37% 0,56% 0,65% -0,09% 1,48% 2,33%
2005 2,28% 0,35% 0,58% -0,23% 1,17% 0,76%
2006 5,51% 0,48% 1,21% -0,73% 1,46% 3,57%
2007 3,54% 0,39% 0,81% -0,43% 2,02% 1,13%
2008 -0,21% 0,45% 0,68% -0,23% 1,37% -2,03%
2009 -3,14% -1,12% -0,72% -0,40% 0,88% -2,90%
2010 -4,94% -1,59% -1,75% 0,15% 0,48% -3,83%
2011 -7,10% -4,33% -4,38% 0,06% 0,10% -2,88%
2012 -6,98% -5,02% -4,94% -0,08% -0,20% -1,76%
2013 -3,86% -2,25% -2,32% 0,06% -0,38% -1,22%
Table 6
Growth Decomposition With Capital Stocks and Total Hours Worked
Labour Input breaks into:

21
We note at this point that in Table 7 we decompose the rate of change of labor input into the rate
of change of total hours and that of labor composition (ΔLnFt) using:
(12)
Equation 12 tells us that the rate of change of labor composition equals the rate of change of
labor input minus that of total hours worked. In the same way, we decompose the growth of
capital services into the growth of productive stock (which in our case is the same as net capital
stock) and that of quality of capital (Q):
(13)
1997 3,64% -0,10% -0,20% -0,04% 0,14% 0,11% 0,74% -0,64% 3,63%
1998 3,36% 3,20% 2,84% -0,03% 0,39% 0,50% 0,90% -0,39% -0,34%
1999 3,42% 1,22% 0,29% 0,78% 0,14% 0,94% 1,08% -0,14% 1,26%
2000 4,48% 0,66% 0,96% -0,30% 0,01% 1,31% 1,23% 0,08% 2,50%
2001 4,20% 0,40% 0,09% 0,23% 0,08% 1,44% 1,33% 0,11% 2,36%
2002 3,44% 1,26% 1,34% -0,35% 0,28% 1,62% 1,38% 0,25% 0,56%
2003 5,94% 1,90% 1,49% 0,25% 0,15% 1,89% 1,51% 0,39% 2,15%
2004 4,37% 1,38% 0,65% -0,09% 0,82% 1,91% 1,57% 0,33% 1,08%
2005 2,28% 0,32% 0,58% -0,23% -0,02% 1,52% 1,32% 0,20% 0,44%
2006 5,51% 0,65% 1,21% -0,73% 0,18% 1,48% 1,32% 0,17% 3,38%
2007 3,54% 0,52% 0,81% -0,43% 0,14% 2,12% 1,74% 0,38% 0,90%
2008 -0,21% 0,62% 0,68% -0,23% 0,17% 2,06% 1,64% 0,42% -2,89%
2009 -3,14% -1,13% -0,72% -0,40% -0,01% 1,23% 1,03% 0,20% -3,24%
2010 -4,94% -1,25% -1,75% 0,15% 0,35% 0,59% 0,58% 0,01% -4,29%
2011 -7,10% -3,76% -4,38% 0,06% 0,57% 0,04% 0,22% -0,17% -3,39%
2012 -6,98% -4,54% -4,94% -0,08% 0,48% -0,42% -0,10% -0,32% -2,02%
2013 -3,86% -1,59% -2,32% 0,06% 0,67% -0,67% -0,32% -0,35% -1,60%
TFP
Growth Decomposition with Capital and Labor Services
Table 7
GDPLabour
Input
Total
Employment
Labour
Composition
Capital
ServicesAverage Hours
Net/Productive
capital StockQuality Effect
Labour Input breaks into: Capital Services break into:

22
Appendix B
In this section we examine the robustness of our constructed measures of capital and labor
services by repeating the calculations based on some alternative assumptions.
We begin by examining the effect on the growth rates of capital services by an increase in initial
capital stocks. We raise the initial stocks of all assets by 50% and the results are depicted in the
following figure:
Raising the capital stocks of all assets results in an increase in capital services growth rates by
1.62% on average in comparison with our initial findings. The distance between the two curves
is larger at the beginning and narrows towards the end of the period we examine.
Next, we consider the effects of a 25% increase on the depreciation rates of all assets. The results
are shown in the next figure:
-0,04
-0,02
0,00
0,02
0,04
0,06
0,08
1997 1998 1999 2000 2001 2002 2003 2004 2005 2006 2007 2008 2009 2010 2011 2012 2013
Capital services growth rates before and after a 50% increase in initial stocks
before after

23
The increased depreciation rates cause our estimates to deviate by 0.69% on average.
We will now present the results of estimating capital services when different approaches in the
estimation of rates of return to capital are used. In section 2.1 we explained the assumption of the
endogenous, ex post approach that we followed. We now consider two more: the endogenous,
simplified approach and the exogenous, ex ante approach. The endogenous, simplified approach
rests on the assumption that real holding gains or losses are zero for each type of asset. Such an
assumption will be reasonable if the asset price changes are not too far from general price
changes. According to the exogenous, ex-ante approach the rate of return is chosen from
financial market data so as best to express economic agents’ expectations about the required
return from investment. In this case equality between the value of capital services and gross
operating surplus plus the capital element of gross mixed is not expected. Following the
methodology of the Conference Board, the exogenous rate of return is computed as the
maximum between the Central Bank’s Discount Window, the Government Bond Yield and the
Lending Rate. Series on the last two components are collected from the Bank of Greece
Statistical Database, while for the Discount Window we resorted to the ECB. The results, shown
below, indicate that our measures are robust to these considerations:
-0,04
-0,02
0,00
0,02
0,04
0,06
0,08
1997 1998 1999 2000 2001 2002 2003 2004 2005 2006 2007 2008 2009 2010 2011 2012 2013
Capital services rate of change before and after a 25% decrease in all depreciation rates
before after

24
Finally, we consider the case where labor services are computed with an alternative set of data.
For that purpose we make use of the shares in total labor compensation provided by the 2012,
February release of the World Input-Output Database (WIOD). The shares concern three types of
workers: low skilled, medium skilled and high skilled workers. These three correspond to the
three categories of educational attainment in which we divided workers in section 2.2 and cover
the years 1995-2009. We computed the shares for the years 2010-2013 by holding constant the
implied relative wages of each group in 2009. A comparison of our findings below reveals very
small differences.
-0,03
-0,02
-0,01
0,00
0,01
0,02
0,03
0,04
0,05
0,06
0,07
Tornqvist Indices
Ex post, endogenous
Simplifies ex post, endogenous
Ex ante, exogenous
-0,08
-0,06
-0,04
-0,02
0,00
0,02
0,04
0,06
0,08
1996 1997 1998 1999 2000 2001 2002 2003 2004 2005 2006 2007 2008 2009 2010 2011 2012 2013
Labor services, Tornqvist indices
initial series series based on WIOD

25
Appendix C
Code Variable
A1 Gross domestic product (nominal)
A2 GDP deflator
A3 Gross operating surplus and gross mixed
income
A4 Consumer price index
A5 Total dependent employment
A6 Total self-employed
A7 Total employment, Full-time, Part-time
employment
A8 Earnings
A9 Compensation of employees
A10 Gross value added
A11 Other taxes less other subsidies on
production
A12 Gross fixed capital formation by type of
asset
A13 Gross fixed capital formation, deflators
A14 WIOD Shares in Total Labor
Compensation
A15 Average Hours Actually Worked
The data was collected from:
A1, Α2, Α3, Α9, A10, A11, A12, A13 : http://www.oecd-ilibrary.org/ Statistics Databases
OECD National Accounts Statistics Aggregate National Accounts Gross Domestic
Product Access Database
A5, A6, A7: http://www.oecd-ilibrary.org/ Statistics Databases OECD Economic
Outlook: Statistics and Projections OECD Economic Outlook No. 94 Access Database
A4: http://www.oecd-ilibrary.org/ Statistics Databases OECD Factbook Statistics
OECD Factbook Access Database
A8: http://epp.eurostat.ec.europa.eu/portal/page/portal/eurostat/home/ Statistics Database
Population and Social Conditions Labor Market Earnings Structure of Earnings Survey
2006, 2010
A7: http://epp.eurostat.ec.europa.eu/portal/page/portal/eurostat/home/ Statistics Database

26
Population and Social Conditions Labor Market Employment and Unemployment LFS
series - Detailed annual survey results Full-time and part-time employment - LFS series
Full-time and part-time employment by sex, age and highest level of education attained
A14: http://www.wiod.org/new_site/database/seas.htm Data Socio Economic Accounts
Greece
A15: : http://epp.eurostat.ec.europa.eu/portal/page/portal/eurostat/home/ Statistics Database
Population and Social Conditions Labor Market LFS series - Detailed annual survey
results Working time - LFS series Average number of actual weekly hours of work in main
job, by sex, professional status, full-time/part-time and economic activity