Atheist Messages Reduce Religiosity and Subjective...
31
Atheist Messages Reduce Religiosity and Subjective Wellbeing * Johannes Haushofer † , James Reisinger ‡ March 1, 2017 Abstract In recent years, atheism has grown in popularity, partly inspired by the rise to prominence of a group of public intellectuals called the “New Atheists” who argue against religion in public fora. What are the social consequences of this development? We test in a laboratory study in Kenya whether exposure to atheist arguments affects self-reported and implicit religiosity, subjective wellbeing, and self-reported tolerance of different social groups. We find a significant negative effect of emotional arguments against religion on both self-reported and implicit measures of religiosity, especially among men, but no effect of scientific appeals. Subjective wellbeing is strongly reduced after emotional atheist messages, again especially among men, suggesting that reductions in religiosity through emotional atheist arguments may have a wellbeing cost. We find no effects of atheism messages on self-reported tolerance. Together, these results suggest that emotional atheist arguments reduce religiosity and subjective wellbeing, especially among men. Keywords: Atheism, well-being, laboratory experiment, priming JEL codes: Z12, I31, C91 * We are grateful to the study participants for generously giving their time, and to Ara Norenzayan, Azim Shariff, and conference participants at NEUDC for comments and discussion. † Corresponding author. Peretsman Scully Hall 427, Princeton University, Princeton, NJ 08544, and Busara Center for Behavioral Economics, Nairobi, Kenya. [email protected] ‡ Harvard University, Cambridge, MA 02138, and Busara Center for Behavioral Economics, Nairobi, Kenya. [email protected] 1
Transcript of Atheist Messages Reduce Religiosity and Subjective...
Atheist Messages Reduce Religiosity and Subjective Wellbeing∗
Johannes Haushofer†, James Reisinger‡
March 1, 2017
Abstract
In recent years, atheism has grown in popularity, partly inspired by the rise to prominence ofa group of public intellectuals called the “New Atheists” who argue against religion in public fora.What are the social consequences of this development? We test in a laboratory study in Kenyawhether exposure to atheist arguments affects self-reported and implicit religiosity, subjectivewellbeing, and self-reported tolerance of different social groups. We find a significant negativeeffect of emotional arguments against religion on both self-reported and implicit measures ofreligiosity, especially among men, but no effect of scientific appeals. Subjective wellbeing isstrongly reduced after emotional atheist messages, again especially among men, suggesting thatreductions in religiosity through emotional atheist arguments may have a wellbeing cost. Wefind no effects of atheism messages on self-reported tolerance. Together, these results suggestthat emotional atheist arguments reduce religiosity and subjective wellbeing, especially amongmen.
Keywords: Atheism, well-being, laboratory experiment, primingJEL codes: Z12, I31, C91
∗We are grateful to the study participants for generously giving their time, and to Ara Norenzayan, Azim Shariff,and conference participants at NEUDC for comments and discussion.†Corresponding author. Peretsman Scully Hall 427, Princeton University, Princeton, NJ 08544, and Busara Center
for Behavioral Economics, Nairobi, Kenya. [email protected]‡Harvard University, Cambridge, MA 02138, and Busara Center for Behavioral Economics, Nairobi, Kenya.
1
1 Introduction
Public intellectuals (e.g. “New Atheists” such as Richard Dawkins, Christopher Hitchens, SamHarris, and Daniel Dennett) have long and vigorously argued that religion is not only factually in-accurate, but also socially and personally harmful. However, is unclear whether such arguments canactually influence an individual’s religiosity. In addition, it is unknown whether such advocacy, andatheism in general, has beneficial or detrimental social effects. For instance, cross-sectional evidencesuggests that that religiosity is positively correlated with subjective wellbeing (for a discussion, seeDeaton and Stone 2013 or Diener, Tay, and Myers 2011) and pro-social behavior (Shariff et al.2015). If these relationships are at least partly reflective of a positive causal effect of religion onthese outcomes, one might expect a negative effect of exposure to atheism on these outcomes. Inthe present study, we examine whether exposure to arguments against religion can in fact influencean individual’s religiosity, wellbeing, and tolerance of others. We report the results of an experimentconducted among university students in Nairobi, Kenya in which we expose participants to explicitAtheist messages. Participants watch short videos presenting either scientific or emotional argu-ments against the existence of God. We then measure both self-reported and implicit religiosity, aswell as subjective wellbeing and tolerance of others.
In recent years, researchers have begun to use primes to manipulate religion in laboratory settings,often finding that implicit and explicit religious primes lead to an increase in pro-social behavior andcooperation, especially towards the in-group (see Shariff et al. 2015, for a review). Norenzayan andShariff (2008) suggest that these results are due to the activation of in-group reputational concernsby the belief that one is being “watched” by a deity, implying that priming effects on prosociality arelikely only present in relation to one’s in-group. Indeed, several studies find that religious primeslead to more negative attitudes towards both racial and religious out-groups (Johnson, Rowatt, andLaBouff 2010; LaBouff et al. 2012; Ramsay et al. 2014). Other studies have shown that religiousprimes increase honesty (Randolph-Seng 2007), punishment of unfairness (McKay et al. 2010), self-control (Laurin, Kay, and Fitzsimons 2012; Rounding et al. 2012), and risk-taking (Kupor, Laurin,and Levav 2015; Chan, Tong, and Tan 2014).
These findings suggest that religiosity may directly affect economic behaviors, but all of thesestudies shock religiosity solely in the ‘positive’ direction. In contrast, in the present study, weare specifically interested in the consequences of a decrease in religiosity. To date, only Shariff etal.(2008) has used primes to reduce religiosity, finding evidence that rational, scientific argumentsdiminished self-reported and implicit religiosity in a Western setting. The present study extendsthese previous findings in several ways. First, we measure exposure both to rational argumentationand to emotional appeals, whereas Shariff et al. (2008) only evaluate the impact of exposure torational argumentation. Second, our target population is university students in Kenya, while Shariffet al.(2008) drew on a population of university students in Canada. While our participant pool isnot entirely ignorant of atheist arguments, we generally find qualitatively that individuals havehad relatively little exposure to, and typically show less acceptance of, these arguments compared
2
to students in North America. Finally, we extend the study by Shariff et al. by adding outcomemeasures beyond religiosity, in particular, subjective wellbeing and tolerance of others.
Because of the number of outcome variables, we are careful to avoid data-mining and to controlfor multiple inference. We employ two strategies to this end. First, the study design and all analysismethods were pre-registered before data analysis began (https://www.socialscienceregistry.org/trials/766);our analysis follows this plan strictly, and we point out any additions and deviations below. Second,we control for multiple inference using i. index variables for subgroups of outcomes, ii. seeminglyunrelated regression (SUR) to test for the joint significance of the treatment coefficients across alloutcomes or indices, and iii. family-wise error rate (FWER) to test for the significance of individualcoefficients while controlling for multiple testing.
We find that exposure to emotional arguments against religion decreases religiosity. We examinethe effect of exposure to anti-religious arguments on religiosity both through self-reported measuresand through a single-target implicit associations task (ST-IAT) measuring the degree to whichindividuals associate religious concepts with the concepts “real” vs. “imaginary.” We detect a strongnegative effect of the emotional message on self-reported religiosity of about 0.40 standard deviations(SD). Additionally, when restricting only to males in the sample (a pre-specified subgroup analysis),we find that the emotional message has a strong negative effect on both self-reported (0.43 SD) andimplicit religiosity (0.20 SD). This finding might be understood in light of the fact that womentypically show higher levels of religiosity than men (WVS 2015), and thus might be more resistantto Atheist messages. However, unlike Shariff et al. (2008), we find no effect of the rational, scientificmessage on self-reported or implicit measures of religiosity.
The effects of the atheism messages on self-reported wellbeing are bi-directional: while the emotionalatheism message strongly decreases psychological wellbeing among men (0.38 SD), the scientificatheism message strongly increases wellbeing among both men and women by a similar magnitude(0.35 SD). Thus, different arguments for atheism may differentially affect psychological wellbeing,and these effects may be heterogeneous by gender; future work should test the robustness of thisfinding. Finally, we find no evidence of changes in tolerance.
The paper proceeds as follows: Section 2 describes the design of the experiment; Section 3 discussesour econometric approach; Section 4 presents our findings; and Section 5 concludes.
2 Study design
2.1 Recruitment and experimental structure
The study was conducted at the Busara Center for Behavioral Economics (Busara) in Nairobi,Kenya, a laboratory facility for social science studies. Busara maintains an active participant poolof more than 11,000 Nairobi residents. For the present study, 318 participants who had previouslysigned-up to be part of the Busara subjet pool were recruited fusing SMS and phone calls and were
3

informed that they would be paid KES 300 (USD 7.20 PPP)1 for participation. Participants weretold that they were invited to participate in a study about their behavior and preferences.
Recruitment was limited to university students to ensure comprehension of the arguments containedin messages, and to ensure that all participants could participate in the writing task after the mes-sages. In addition, we controlled for heterogeneity in religious background by omitting individualsidentified as ethnically Nubian from recruitment. Since most Muslims in the Busara participantpool belong to this ethnicity, we believed this to be the best way to restrict the sample to Christianswhile avoiding any issues of self-selection that might arise by asking individuals their religion beforeparticipation.
Participants came to the Busara lab for experimental sessions lasting approximately one and halfhours. Each session included up to 25 participants. Sessions were administered by two femaleKenyan research assistants, who spoke English and Swahili fluently and were trained in helpingparticipants with comprehension. The experiment was conducted in English.2
Upon arriving at the lab, participants were briefed and then randomly assigned to one of 25 computerworkstations with partitions on three sides, so that they were unable to see or speak with the otherparticipants. Within each session, individuals were randomly assigned to one of the three conditions.All of the treatments and measures were implemented on HP TouchSmart 310 desktop computersrunning Windows 7. Each participant wore headphones and watched the video message on his orher own computer. Participants used the touch screen exclusively to mitigate effects of individualdifferences in experiences using a mouse and keyboard. All treatments were implemented using z-Tree software (Fischbacher 2007). The order of questionnaires, tasks, and messages was as follows;detailed descriptions of all items are given in subsequent sections.
1. Practice IAT
2. Validity ST-IAT (cartoon characters and nature names)
3. Video Message (4 minutes)
4. Writing task and comprehension questions
5. Self-reported religiosity questionnaire
6. Practice IAT
7. Religion ST-IAT
8. Cantril ladder1USD values are calculated at purchasing power parity, using the 2014 World Bank PPP estimate for private
consumption in Kenya: 0.0242Restricting participation to university students ensured English comprehension. Although Kenyan universities
do not typically require an official test of English proficiency, matriculating students are expected to be proficient inwritten and spoken English, and much of the instruction is in English. Additionally, Busara has confirmed throughprevious studies that the vast majority of Kenyan university students are highly proficient in English.
4
9. WVS tolerance questionnaire
10. PANAS questionnaire
11. Demographics survey
At the conclusion of the final questionnaire, participants were debriefed and paid KES 300 in cash.
2.2 Manipulations
The priming literature distinguishes between four types of primes: explicit, implicit, subliminal,and contextual (Shariff et al. 2015). Our study uses explicit primes, as we are most interestedin controlling the content of the prime. Such control is more difficult with implicit or subliminalprimes, which rely on an individual’s automatic associations with the concepts presented in theprime. In our case, participants have had little prior exposure to atheism, and thus implicit orsubliminal primes would be unlikely to produce strong effects.
The main weakness of explicit priming is its potential to introduce demand effects into the study.By necessity, individuals are more cognizant of the nature of the material they are viewing andare thus more likely to grasp the overall purpose of the experiment. It is therefore possible thatindividuals would respond by providing the answers they believe the experimenter “wants”. In orderto minimize the possibility of this effect, we use an IAT to measure implicit religiosity, which ismuch less vulnerable to manipulation by the participant (more details below).
The messages used for the study consist of short video presentations (in English) and a writing taskin which participants are asked to summarize the main point of the messages. Each participantwas randomized into one of three conditions: emotional anti-religious argument, scientific anti-religious argument, and control. Each message is approximately 4 minutes long and consists of aspeaker making arguments against religion, or in the case of the control, speaking about vegetables.The speaker is the same Kenyan narrator in all three videos. Bullet points summarizing the mainarguments appear on the screen, accompanying the auditory presentation by the speaker. In theemotional condition, the speaker argues that any God must be very cruel if he allows so many peoplein the world to suffer, concluding that it is unlikely that God exists. In the scientific condition, thespeaker argues that the existence of God is unnecessary to explain the universe given our scientificknowledge. In the control condition, the same speaker argues that it is important to eat vegetablesevery day. The exact text of the messages is provided in Appendix A.1. After viewing the messages,participants are asked to summarize the main arguments in their own words by typing into a textbox on their screen and then asked a series of questions to ensure comprehension.
The messages were randomly assigned to conditions within each session, with equal probability foreach condition. The setup of the lab included dividers between computers so that participantswere unaware of the images shown on the screens of others. Additionally, all participants wore
5

headphones, so they were unaware of what other participants were hearing. All images used in theimplicit religiosity measure (described below) were vetted for comprehension by the experimentersand were further validated through debriefing after several pilot sessions.
2.3 Outcome measures
Self-reported religiosity Our primary outcomes were self-reported and implicit measures ofreligiosity. Following Shariff et al. (2008), we measure self-reported religiosity with a series of 6questions in which participants rate different aspects of their religiosity (belief in God, importanceof beliefs and religious traditions) on a scale of one to five. As a primary outcome measure, weanalyze a weighted-average index of these responses based on the methodology in Anderson (2008).In the Appendix, we also report the results for each of the questions individually and test for jointsignificance using Seemingly Unrelated Regression (SUR). We also present the results for the firstlatent factor identified using factor analysis on the responses to the six questions.
Implicit religiosity To control for the possibility of demand effects, we employ a single-targetImplicit Association Test (ST-IAT) adapted from (but not identical to) the design used by Shariffet al.(2008). The ST-IAT is a computer-based sorting task that uses response time to measureunconscious associations with a target concept. In each block of the ST-IAT, participants sort threecategories of words to the left- and right-hand sides of the screen: synonyms of “real”, synonymsof “imaginary”, and words associated with religion. All language used in the task was vetted forcomprehension with the sample population during several pilot sessions.
In one block, the participants sort the religious words and synonyms of “real” to the same side.In a second block, the participants sort religious words and synonyms of “imaginary” to the sameside. The order in which these two blocks occur is randomized. The ST-IAT design assumes thatparticipants will more quickly sort target words to the side that represents their implicit associationwith the target.
As a validity check for the ST-IAT, we also administer ST-IATs using alternatively the namesof cartoon characters familiar to most Kenyans, and the names of natural landmarks in Kenya.We hypothesize that individuals should be relatively faster to associate cartoons with the conceptimaginary, and faster to associate natural landmarks with the concept real.
Using the result of the ST-IAT described above, for each individual we calculate a D-score as
D-Score =[Mean
(latencyreal
)−Mean
(latencyimaginary
)]/SDboth
where latencyreal is the reaction time when associating the concept of interest (religion) with theconcept real, and latencyimaginary is the reaction time when associating the concept of interest withthe concept imaginary. Latency (response time) is recorded in milliseconds; shorter latency indicates
6

a stronger implicit association. Following from the equation above, a lower D-score represents astronger belief in religious concepts.
Following the recommendations in Greenwald et al. (2003), we exclude participants for whom morethan 10% of responses are below 300 ms, as well as all responses over 10,000 ms. Individuals whoinitially respond incorrectly in a trial are required to press the correct response before proceedingto the next trial. We measure latency as the total time from beginning the trial to the entry of acorrect response, effectively penalizing incorrect responses with longer latencies (Greenwald, Nosek,and Banaji 2003).
Validity ST-IAT (cartoon characters and nature names) To determine whether the implicitassociation test operates as desired in this population, we administered a “Cartoon Character” and“Nature Name” ST-IAT at the very beginning of each experimental session that asks participants toassociate cartoon characters and names of animals with “real” and “imaginary”. We reason that allparticipants should have “imaginary” associations with cartoon characters, and “real” associationswith nature names. If this ST-IAT successfully measures these associations, we can be confidentthat it is an effective tool for measuring other implicit attitudes.
Other outcomes We also include a questionnaire on tolerance from the World Values Survey;the Cantril ladder to gauge current social status, and expected social status in 5 years; the negativeaffect questions from the Positive and Negative Affect Scale (PANAS); and basic demographicsquestions. Details on these questionnaires are provided in Appendix A.
3 Econometric specifications
3.1 Basic specification
Our specification for assessing the effect of the messages on outcomes is
yi = β0 + β1TR,i + β2TE,i + εi (1)
where yi is the outcome of interest measured at the level of the individual respondent i. TR,i is anindicator taking a value of 1 if individual i was assigned to the scientific priming condition, and0 otherwise. TE,i is an indicator taking a value of 1 if individual i was assigned to the emotionalpriming condition, and 0 otherwise. The omitted category is participants assigned to the controlcondition. εi is an idiosyncratic error term. We report heteroskedasticity-robust standard errors.Note that standard errors are not clustered at the session level because randomization occurredwithin sessions.
7
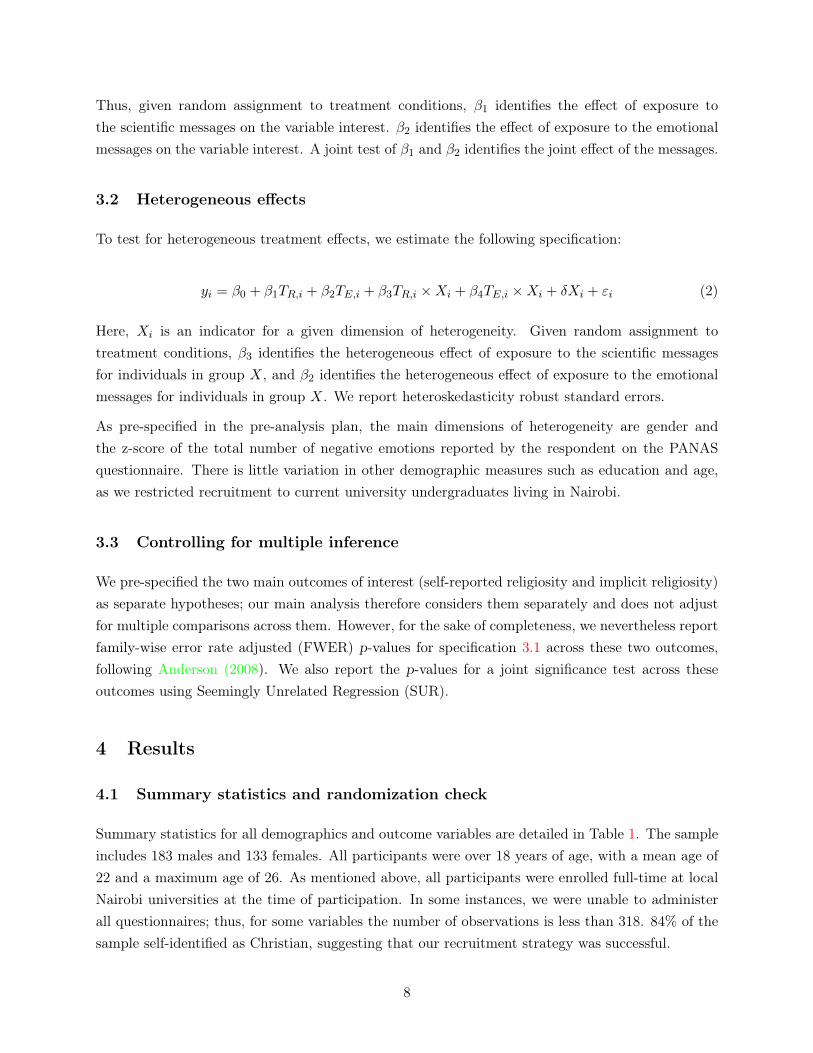
Thus, given random assignment to treatment conditions, β1 identifies the effect of exposure tothe scientific messages on the variable interest. β2 identifies the effect of exposure to the emotionalmessages on the variable interest. A joint test of β1 and β2 identifies the joint effect of the messages.
3.2 Heterogeneous effects
To test for heterogeneous treatment effects, we estimate the following specification:
yi = β0 + β1TR,i + β2TE,i + β3TR,i ×Xi + β4TE,i ×Xi + δXi + εi (2)
Here, Xi is an indicator for a given dimension of heterogeneity. Given random assignment totreatment conditions, β3 identifies the heterogeneous effect of exposure to the scientific messagesfor individuals in group X, and β2 identifies the heterogeneous effect of exposure to the emotionalmessages for individuals in group X. We report heteroskedasticity robust standard errors.
As pre-specified in the pre-analysis plan, the main dimensions of heterogeneity are gender andthe z-score of the total number of negative emotions reported by the respondent on the PANASquestionnaire. There is little variation in other demographic measures such as education and age,as we restricted recruitment to current university undergraduates living in Nairobi.
3.3 Controlling for multiple inference
We pre-specified the two main outcomes of interest (self-reported religiosity and implicit religiosity)as separate hypotheses; our main analysis therefore considers them separately and does not adjustfor multiple comparisons across them. However, for the sake of completeness, we nevertheless reportfamily-wise error rate adjusted (FWER) p-values for specification 3.1 across these two outcomes,following Anderson (2008). We also report the p-values for a joint significance test across theseoutcomes using Seemingly Unrelated Regression (SUR).
4 Results
4.1 Summary statistics and randomization check
Summary statistics for all demographics and outcome variables are detailed in Table 1. The sampleincludes 183 males and 133 females. All participants were over 18 years of age, with a mean age of22 and a maximum age of 26. As mentioned above, all participants were enrolled full-time at localNairobi universities at the time of participation. In some instances, we were unable to administerall questionnaires; thus, for some variables the number of observations is less than 318. 84% of thesample self-identified as Christian, suggesting that our recruitment strategy was successful.
8

Table 2 reports the results of a balance check of key variables across treatment categories: demo-graphics and the results of the two practice IATs that were given before priming. We detect nosignificant difference in these variables across treatment groups, suggesting that randomization wassuccessful.
4.2 Validity IAT
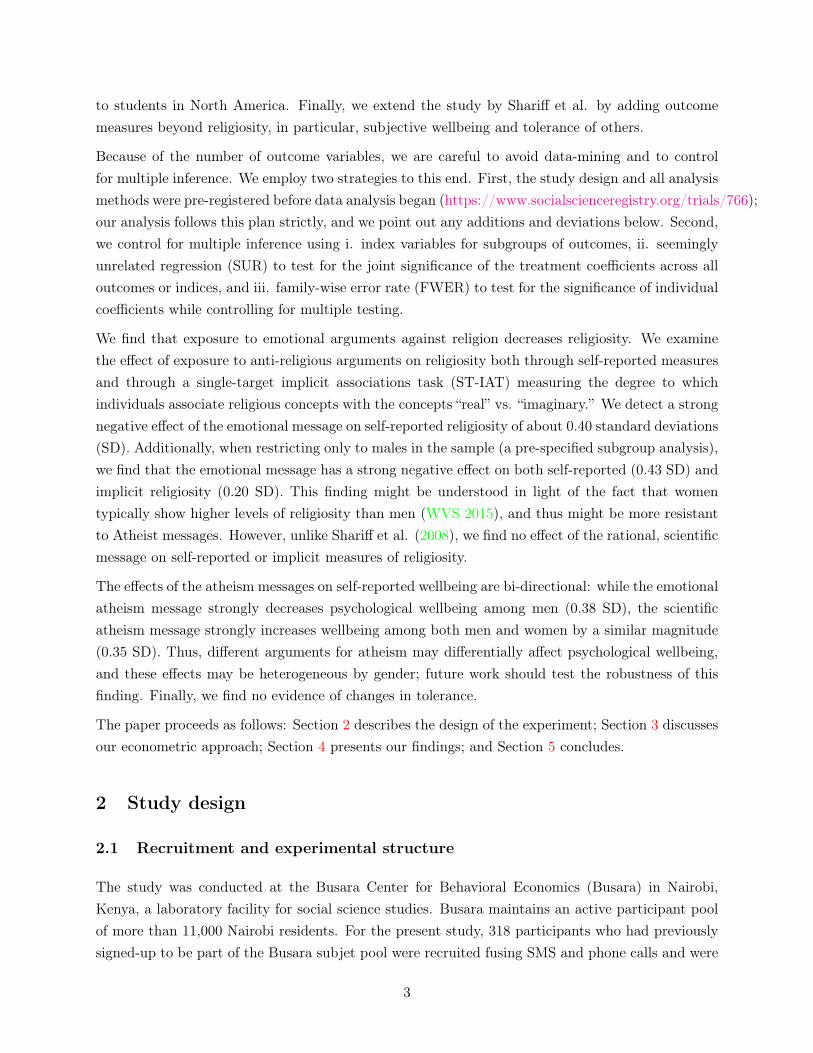
Before presenting the messages, we test the validity of our ST-IAT setup by running versions withconcepts we expect to be more quickly associated with “Real” and concepts we expect to be morequickly associated with “Imaginary.” We use well-known animal and plant names and well-knowncartoon characters, respectively. Figure 1 depicts the results of this analysis compared to the full-sample results for the religion ST-IAT. As expected, individuals more quickly associated naturenames with the concept “real” than with the concept “imaginary”, and associated cartoon charactersmore quickly with the concept “imaginary” than with the concept “real”. The p-value of test ofequality between the d-scores is < 0.01. This finding is in line with the hypothesis that participantsassociate items they consider to be real more quickly with the concept “real”, and items they considerto be imaginary more quickly with the concept “imaginary”, suggesting that our ST-IAT is valid.
Figure 1 also shows the results for the ST-IAT for religious words across the entire sample. Thecorresponding d-score was significantly greater than 0 (one-sided t-test, p < .001), suggesting thaton average participants were more likely to associate religious words with the concept “real” than“imaginary”. This result is consistent with the fact that our sample is largely Christian.
4.3 Treatment effects
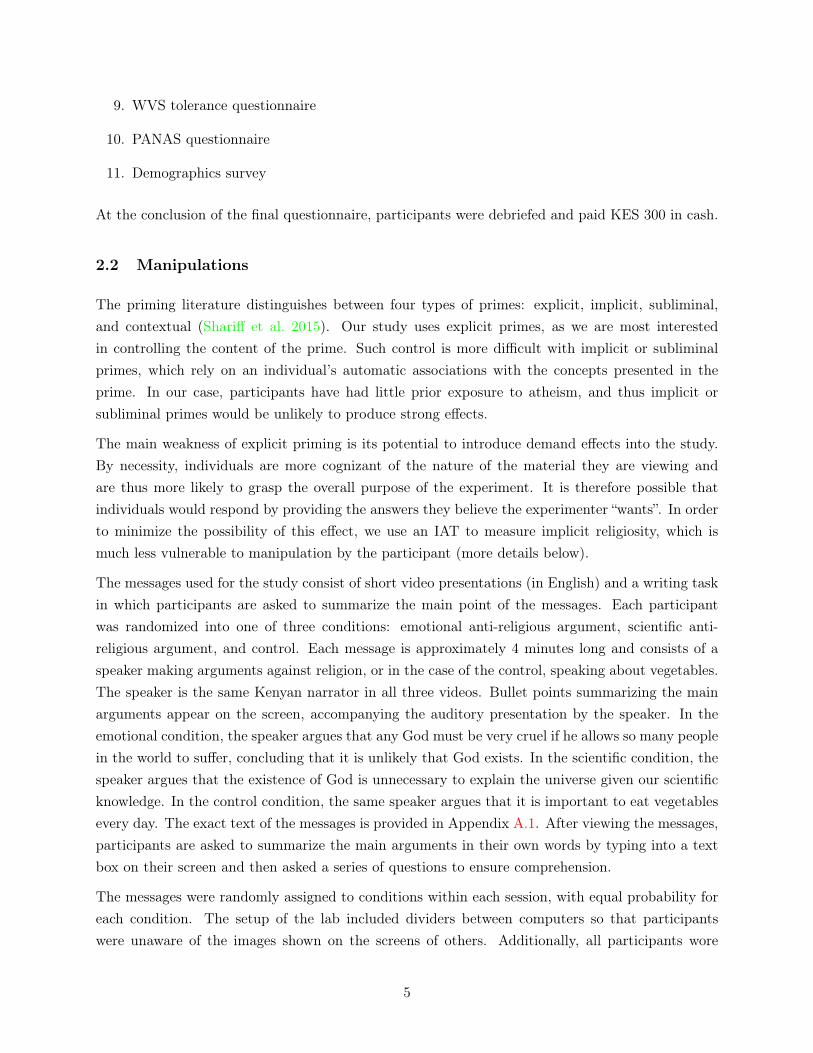
Figure 2 displays the effect of treatment of our main self-reported and implicit measures of religiosityin both our full population and when restricting men only, and Table 3 reports the results of theregressions described in Section 3. Overall, we detect a strong negative effect of exposure to theemotional message on religiosity, especially among men. In the full sample, we detect a decreaseof 0.40 SD in self-reported religiosity caused by the emotional message, significant at the 95% levelusing unadjusted p-values and the 90% level after adjusting for multiple inference. The coefficienton the IAT measure is similarly negative but insignificant. For both measures, there is no significanteffect of the scientific message, and the difference between the two messages is not significant. Thescientific message does not produce a treatment effect even when restricting to the sample to thoseindividuals who passed all comprehension checks, as shown in Appendix Table A.2.
Note also that the joint test using SUR is significant for the science message, but not the emotionalmessage; this finding results from the insensitivity of SUR to the direction of treatment effects anddilution of the strong effects of the emotional message on self-reported religiosity by small effectson other outcomes.
9

Our pre-analysis plan pre-specified a heterogeneous analysis by gender. This analysis reveals thatthe effects among men are stronger than in the sample as a whole: when restricting the sampleto male respondents among male participants, we detect a decrease of 0.30 SD in self-reportedreligiosity caused by the emotional message, significant at the 95% level using unadjusted p-values,and a decrease in implicit religiosity 0.20 points as measured by the religiosity ST-IAT, significantat the 95% level using unadjusted p-values and the 90% level after adjusting for multiple inference.These results suggest men in our sample responded to the anti-religious message, especially when itattacked religion as harmful rather than just untrue. Results for women, and the difference betweenmen and women, are shown in Appendix Table ??. Columns (1) and (3) report the treatment effectsfor women and show that there are no significant effects on religiosity, and the treatment effect ofthe emotional message on implicit religiosity is significantly larger in men than in women.
Turning to subjective wellbeing, we find that, among men, the emotional message induces a 0.38SD reduction in self-reported subjective wellbeing as measured by the Cantril ladder, significantat the 95% level. This finding is in line with previous studies showing that subjective wellbeing ishigher among more religious individuals (Deaton and Stone 2013), and suggests that a decrease inreligious belief caused by atheist arguments may reduce subjective wellbeing. We find no evidencethat this pattern extends to individual’s expectations of their future wellbeing, as the effects onthe 5-year Cantril ladder are not significant. Appendix Table ?? shows that the effect on currentwellbeing effect is significantly larger in men than in women, consistent with the finding that theemotional message reduced religiosity in men but not in women. One possible mechanism underlyingthis finding is that the emotional message reminds participants of the suffering in the world, andthat this reminder negatively affects wellbeing. The fact that this effect is observed in men butnot women may arise from the finding that the message does not affect religiosity in women, butdoes affect it in men. Thus, women’s religiosity, unaffected by the message, may buffer againstthe negative effect of the emotional message on wellbeing. In contrast, men’s religiosity has beenreduced by the message and can therefore not protect against the negative wellbeing effects of themessage. A caveat to these results is that we observe no overall effect of either message on negativeaffect, as reported in Appendix Table A.7; they point in the same general direction as the Cantrilresults, but do not reach significance.
Intriguingly, the science message actually has the opposite effect on subjective wellbeing in thefull population. We detect at 0.35 SD increase in subjective wellbeing as measured by the Cantrilladder, significant at the 99% level, and a 0.25 SD increase in expected future subjective wellbeing,significant at the 90% level. This effect is driven mainly by women, who show a significant 0.60SD increase in wellbeing after the scientific message. Thus, it appears that the emotional atheismmessage reduces subjective wellbeing among men, while the scientific message increases it in thewhole sample (although only significant in women). A possible mechanism underlying the positivewellbeing affect of the science message may be that it makes respondents feel liberated, while stillproviding an explanation for events in the world; however, this explanation is at odds with the factthat the scientific message does not in fact reduce religiosity. An alternative account is that the
10
increase in wellbeing induced by the scientific message may increase participants’ perceived controlof events in the world and thereby raise wellbeing even in the absence of changes in religiosity.Future work might test these hypotheses.
Finally, we detect no significant effect on tolerance, suggesting no change in social preferences dueto decreases in religiosity.
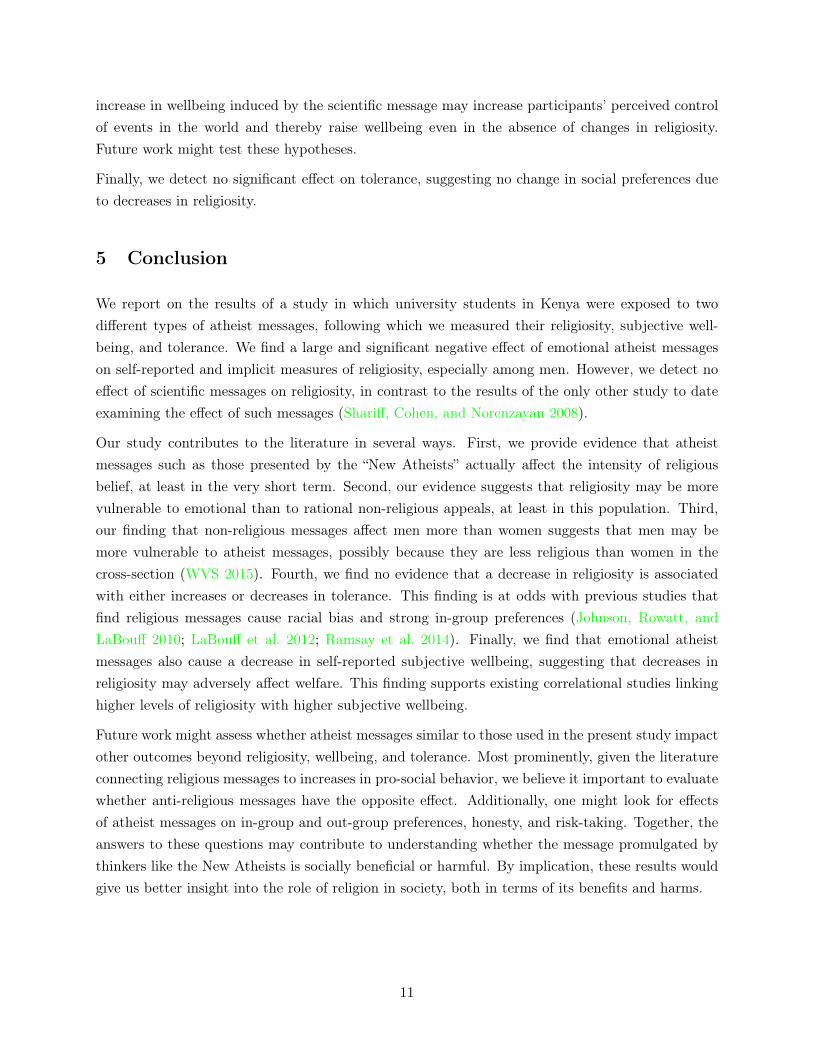
5 Conclusion
We report on the results of a study in which university students in Kenya were exposed to twodifferent types of atheist messages, following which we measured their religiosity, subjective well-being, and tolerance. We find a large and significant negative effect of emotional atheist messageson self-reported and implicit measures of religiosity, especially among men. However, we detect noeffect of scientific messages on religiosity, in contrast to the results of the only other study to dateexamining the effect of such messages (Shariff, Cohen, and Norenzayan 2008).
Our study contributes to the literature in several ways. First, we provide evidence that atheistmessages such as those presented by the “New Atheists” actually affect the intensity of religiousbelief, at least in the very short term. Second, our evidence suggests that religiosity may be morevulnerable to emotional than to rational non-religious appeals, at least in this population. Third,our finding that non-religious messages affect men more than women suggests that men may bemore vulnerable to atheist messages, possibly because they are less religious than women in thecross-section (WVS 2015). Fourth, we find no evidence that a decrease in religiosity is associatedwith either increases or decreases in tolerance. This finding is at odds with previous studies thatfind religious messages cause racial bias and strong in-group preferences (Johnson, Rowatt, andLaBouff 2010; LaBouff et al. 2012; Ramsay et al. 2014). Finally, we find that emotional atheistmessages also cause a decrease in self-reported subjective wellbeing, suggesting that decreases inreligiosity may adversely affect welfare. This finding supports existing correlational studies linkinghigher levels of religiosity with higher subjective wellbeing.
Future work might assess whether atheist messages similar to those used in the present study impactother outcomes beyond religiosity, wellbeing, and tolerance. Most prominently, given the literatureconnecting religious messages to increases in pro-social behavior, we believe it important to evaluatewhether anti-religious messages have the opposite effect. Additionally, one might look for effectsof atheist messages on in-group and out-group preferences, honesty, and risk-taking. Together, theanswers to these questions may contribute to understanding whether the message promulgated bythinkers like the New Atheists is socially beneficial or harmful. By implication, these results wouldgive us better insight into the role of religion in society, both in terms of its benefits and harms.
11

References
Ahmed, Ali, and Mats Hammarstedt. 2011. “The effect of subtle religiousrepresentations on cooperation.” International Journal of Social Economics 38(11): 900–910 (September).
Ahmed, Ali M., and Osvaldo Salas. 2011. “Implicit influences of Christian religiousrepresentations on dictator and prisoner’s dilemma game decisions.” The Journalof Socio-Economics 40 (3): 242–246 (May).
Anderson, Michael L. 2008. “Multiple Inference and Gender Differences in the Effectsof Early Intervention: A Reevaluation of the Abecedarian, Perry Preschool, andEarly Training Projects.” Journal of the American Statistical Association 103(484): 1481–1495.
Campante, F., and D. Yanagizawa-Drott. 2015. “Does Religion Affect EconomicGrowth and Happiness? Evidence from Ramadan.” The Quarterly Journal ofEconomics 130 (2): 615–658 (May).
Chan, K. Q., E. M. W. Tong, and Y. L. Tan. 2014. “Taking a Leap of Faith:Reminders of God Lead to Greater Risk Taking.” Social Psychological andPersonality Science 5 (8): 901–909 (November).
Deaton, Angus, and Arthur A Stone. 2013. “Two Happiness Puzzles.” AmericanEconomic Review 103 (3): 591–597 (May).
Diener, Ed, Louis Tay, and David G. Myers. 2011. “The religion paradox: If religionmakes people happy, why are so many dropping out?” Journal of Personality andSocial Psychology 101 (6): 1278–1290.
Dijksterhuis, Ap, Jesse Preston, Daniel M. Wegner, and Henk Aarts. 2008. “Effects ofsubliminal priming of self and God on self-attribution of authorship for events.”Journal of Experimental Social Psychology 44 (1): 2–9 (January).
Fischbacher, Urs. 2007. “z-Tree: Zurich toolbox for ready-made economicexperiments.” Experimental Economics 10 (2): 171–178 (June).
Galen, Luke W. 2012. “Does religious belief promote prosociality? A criticalexamination.” Psychological Bulletin 138 (5): 876–906.
Gervais, Will M., Azim F. Shariff, and Ara Norenzayan. 2011. “Do you believe inatheists? Distrust is central to anti-atheist prejudice.” Journal of Personality andSocial Psychology 101 (6): 1189–1206 (December).
Greenwald, Anthony G., Brian A. Nosek, and Mahzarin R. Banaji. 2003.“Understanding and using the Implicit Association Test: I. An improved scoringalgorithm.” Journal of Personality and Social Psychology 85 (2): 197–216.
12

Hackney, Charles H., and Glenn S. Sanders. 2003. “Religiosity and Mental Health: AMeta-Analysis of Recent Studies.” Journal for the Scientific Study of Religion 42(1): 43–55 (March).
Johnson, Megan, Wade Rowatt, and Jordan P. LaBouff. 2010. “Priming ChristianReligious Concepts Increases Racial Prejudice.” Social Psychological andPersonality Science 1 (2): 119–126.
Kupor, D. M., K. Laurin, and J. Levav. 2015. “Anticipating Divine Protection?Reminders of God Can Increase Nonmoral Risk Taking.” Psychological Science 26(4): 374–384 (April).
LaBouff, Jordan P., Wade C. Rowatt, Megan K. Johnson, and Callie Finkle. 2012.“Differences in Attitudes Toward Outgroups in Religious and NonreligiousContexts in a Multinational Sample: A Situational Context Priming Study.” TheInternational Journal for the Psychology of Religion 22 (1): 1–9 (January).
Laurin, Kristin, Aaron C. Kay, and Gráinne M. Fitzsimons. 2012. “Divergent effectsof activating thoughts of God on self-regulation.” Journal of Personality andSocial Psychology 102 (1): 4–21.
McClendon, Gwyneth, and Rachel Beatty Riedl. 2015. “Religion as a Stimulant ofPolitical Participation: Experimental Evidence from Nairobi, Kenya.” TheJournal of Politics 77 (4): 1045–1057 (October).
McKay, Ryan, Charles Efferson, Harvey Whitehouse, and Ernst Fehr. 2010. “Wrathof God: religious primes and punishment.” Proceedings of the Royal Society ofLondon B: Biological Sciences.
Norenzayan, Ara, and Azim F. Shariff. 2008. “The Origin and Evolution of ReligiousProsociality.” Science 322 (5898): 58–62 (October).
Norenzayan, Ara, Azim F. Shariff, and Will M. Gervais. 2009. “The evolution ofreligious misbelief.” Behavioral and Brain Sciences 32 (06): 531–532.
Nunn, Nathan, James A. Robinson, Sara Lowes, and Jonathan Weigel. 2015.“Understanding Ethnic Identity in Africa: Evidence from the Implicit AssociationTest (IAT).” American Economic Review Papers and Proceedings.
Pew. 2008. “U.S.Religious Landscape Survey Religious Affiliation: Diverse andDynamic.” The Pew Forum on Religion and Public Life.
Pichon, Isabelle, Giulio Boccato, and Vassilis Saroglou. 2007. “Nonconsciousinfluences of religion on prosociality: a priming study.” European Journal of SocialPsychology 37 (5): 1032–1045 (September).
Preston, J. L., and R. S. Ritter. 2013. “Different Effects of Religion and God onProsociality With the Ingroup and Outgroup.” Personality and Social PsychologyBulletin 39 (11): 1471–1483 (November).
Ramsay, Jonathan E., Joyce S. Pang, Megan Johnson Shen, and Wade C. Rowatt.
13

2014. “Rethinking Value Violation: Priming Religion Increases Prejudice inSingaporean Christians and Buddhists.” The International Journal for thePsychology of Religion 24 (1): 1–15 (January).
Rand, David G., Anna Dreber, Omar S. Haque, Rob J. Kane, Martin A. Nowak, andSarah Coakley. 2013. “Religious motivations for cooperation: an experimentalinvestigation using explicit primes.” Religion, Brain & Behavior 4 (1): 31–48(April).
Randolph-Seng, Brandon. 2007. “Honesty: One Effect of Primed ReligiousRepresentations.” International Journal for The Psychology of Religion 1 (1):303–315.
Rounding, K., A. Lee, J. A. Jacobson, and L.-J. Ji. 2012. “Religion ReplenishesSelf-Control.” Psychological Science 23 (6): 635–642 (June).
Sedikides, C., and J. E. Gebauer. 2010a. “Religiosity as Self-Enhancement: AMeta-Analysis of the Relation Between Socially Desirable Responding andReligiosity.” Personality and Social Psychology Review 14 (1): 17–36 (February).
Sedikides, Constantine, and Jochen E. Gebauer. 2010b. “Religiosity asSelf-Enhancement: A Meta-Analysis of the Relation Between Socially DesirableResponding and Religiosity.” Personality and Social Psychology Review 14 (1):17–36 (February).
Shariff, A. F., A. K. Willard, T. Andersen, and A. Norenzayan. 2015. “ReligiousPriming: A Meta-Analysis With a Focus on Prosociality.” Personality and SocialPsychology Review, February.
Shariff, Azim, Adam Cohen, and Ara Norenzayan. 2008. “The Devil’s Advocate:Secular Arguments Diminish both Implict and Explicity Religious Belieft.”Journal of Cognition and Culture 8:417–423.
Shariff, Azim F., and Ara Norenzayan. 2007. “God Is Watching You: Priming GodConcepts Increases Prosocial Behavior in an Anonymous Economic Game.”Psychological Science 18 (9): 803–809 (September).
Shariff, Azim F., Jared Piazza, and Stephanie R. Kramer. “Morality and the religiousmind: why theists and nontheists differ.” Trends in Cognitive Sciences 18 (9):439–441.
. 2014. “Morality and the religious mind: why theists and nontheists differ.”Trends in Cognitive Sciences 18 (9): 439–441 (September).
WVS. 2015. Wave 6 2010-2014 OFFICIAL AGGREGATE. v.20150418. World ValuesSurvey Association Aggregate. www.worldvaluessurvey.org. File Producer:Asep/JDS, Madrid SPAIN.
14
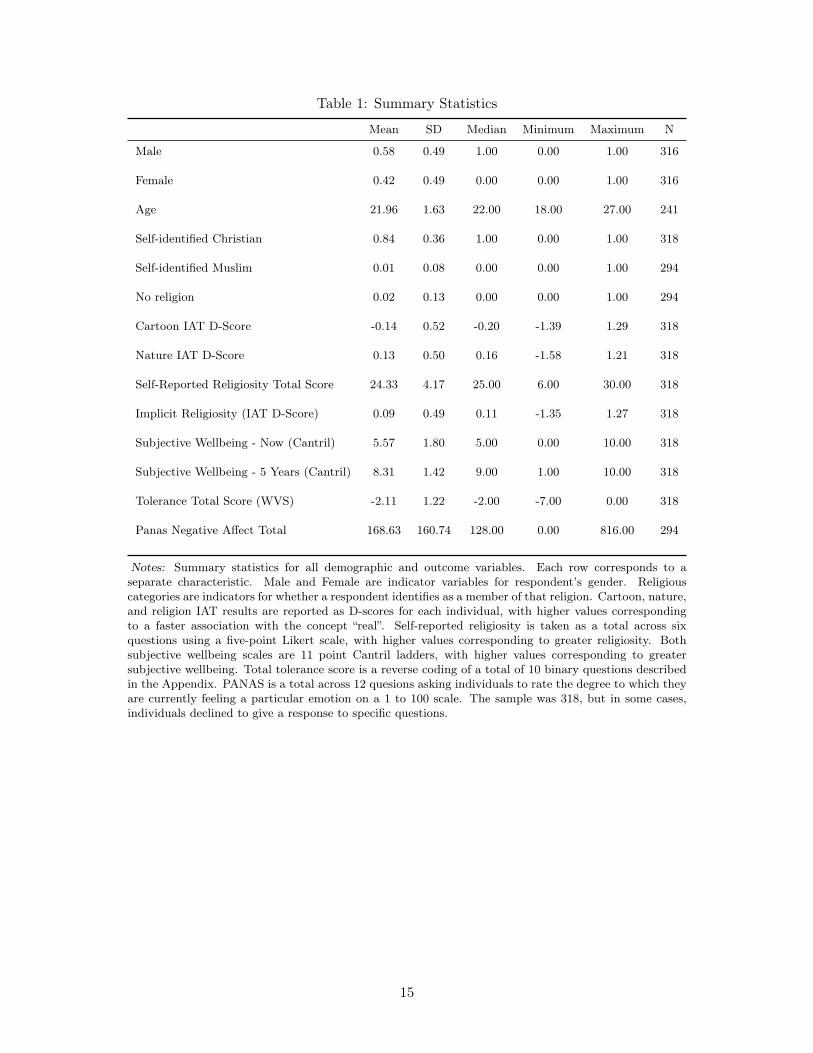
Table 1: Summary Statistics
Mean SD Median Minimum Maximum N
Male 0.58 0.49 1.00 0.00 1.00 316
Female 0.42 0.49 0.00 0.00 1.00 316
Age 21.96 1.63 22.00 18.00 27.00 241
Self-identified Christian 0.84 0.36 1.00 0.00 1.00 318
Self-identified Muslim 0.01 0.08 0.00 0.00 1.00 294
No religion 0.02 0.13 0.00 0.00 1.00 294
Cartoon IAT D-Score -0.14 0.52 -0.20 -1.39 1.29 318
Nature IAT D-Score 0.13 0.50 0.16 -1.58 1.21 318
Self-Reported Religiosity Total Score 24.33 4.17 25.00 6.00 30.00 318
Implicit Religiosity (IAT D-Score) 0.09 0.49 0.11 -1.35 1.27 318
Subjective Wellbeing - Now (Cantril) 5.57 1.80 5.00 0.00 10.00 318
Subjective Wellbeing - 5 Years (Cantril) 8.31 1.42 9.00 1.00 10.00 318
Tolerance Total Score (WVS) -2.11 1.22 -2.00 -7.00 0.00 318
Panas Negative Affect Total 168.63 160.74 128.00 0.00 816.00 294
Notes: Summary statistics for all demographic and outcome variables. Each row corresponds to aseparate characteristic. Male and Female are indicator variables for respondent’s gender. Religiouscategories are indicators for whether a respondent identifies as a member of that religion. Cartoon, nature,and religion IAT results are reported as D-scores for each individual, with higher values correspondingto a faster association with the concept “real”. Self-reported religiosity is taken as a total across sixquestions using a five-point Likert scale, with higher values corresponding to greater religiosity. Bothsubjective wellbeing scales are 11 point Cantril ladders, with higher values corresponding to greatersubjective wellbeing. Total tolerance score is a reverse coding of a total of 10 binary questions describedin the Appendix. PANAS is a total across 12 quesions asking individuals to rate the degree to which theyare currently feeling a particular emotion on a 1 to 100 scale. The sample was 318, but in some cases,individuals declined to give a response to specific questions.
15

Table 2: Randomization Check
ControlMean (SD)
SciencePrime
EmotionsPrime
Male 0.58 0.06 −0.06(0.50) (0.07) (0.07)
Female 0.42 −0.06 0.06(0.50) (0.07) (0.07)
Age 21.99 −0.09 −0.01(1.68) (0.26) (0.25)
Self-identified Christian 0.81 0.07 0.04(0.39) (0.05) (0.05)
Self-identified Muslim 0.01 −0.01 −0.00(0.10) (0.01) (0.01)
No religion 0.03 −0.02 −0.02(0.17) (0.02) (0.02)
Cartoon IAT D-Score −0.10 0.00 −0.12(0.55) (0.07) (0.07)
Nature IAT D-Score 0.07 0.10 0.08(0.49) (0.07) (0.06)
Total Observations 110 91 117
Notes: Results are coefficients and standard errors for OLSregressions of various demographics on indicators for treatmentstatus. Characteristics of interest are listed on the left. Column(1) reports the mean and SD of the control group. Column(2) and (3) report the coefficients and standard errors from theregression of the characteristic of interest on indicators for thescience and emotions message, respectively. The last line reportsthe total number of observations in each condition. * denotessignificance at 10 pct., ** at 5 pct., and *** at 1 pct. level.
16

Figure 1: IAT Validity Check: Cartoon vs. Nature Names
Fa
ste
r to
wa
rd ’Im
ag
ina
ry’
Fa
ste
r to
wa
rd ’R
ea
l’−
.2−
.10
.1.2
D−
Score
Nature IAT Cartoon IAT Religion IAT
Notes: Bar graphs showing means and 1 standard error of the mean (SEM) of individual d-scores for the cartoon vs.nature single-target IAT. Higher values indicate a faster association between target concept and the concept “Real”,while lower values indicate a faster association between target concept and the concept “Imaginary”.
17

Figure 2: Treatment Effects
−.3
−.2
−.1
0.1
.2.3
IAT
D−
Sco
re
Control Science Emotional
Implicit Religosity − Full Sample
−.3
−.2
−.1
0.1
.2.3
IAT
D−
Sco
re
Control Science Emotional
Implicit Religosity − Male
−.8
−.6
−.4
−.2
0.2
Se
lf−
Re
po
rte
d I
nd
ex
Control Science Emotional
Self−Reported Religosity − Full Sample
−.8
−.6
−.4
−.2
0.2
Se
lf−
Re
po
rte
d I
nd
ex
Control Science Emotional
Self−Reported Religosity − Male
Notes: Top panels: Bar graphs showing means and 1 SEM of individual d-scores for the religiosity single-targetIAT. Higher values indicate a faster association between target concept and the concept “Real”, while lower valuesindicate a faster association between target concept and the concept “Imaginary”. Bottom panels: means and 1 SEMfor self-reported religiosity.
18

Table 3: Treatment Effect Regressions
All Respondents Male Respondents
(1) (2) (3) (4) (5) (6) (7) (8) (9) (10)ControlMean
SciencePrime
EmotionsPrime Difference N Control
MeanSciencePrime
EmotionsPrime Difference N
Self-Reported Religiosity Index (Anderson) 0.00 −0.26 −0.40∗∗ 0.14 318 −0.07 −0.25 −0.43∗∗ 0.17 185(1.00) (0.17) (0.16) (0.19) (1.03) (0.21) (0.20) (0.22)
[0.42] [0.07]∗ [0.69] [0.73] [0.15] [0.69]Implicit Religiosity (IAT D-Score) 0.11 0.00 −0.08 0.08 318 0.21 −0.09 −0.20∗∗ 0.11 185
(0.49) (0.07) (0.06) (0.07) (0.45) (0.09) (0.08) (0.09)[0.97] [0.60] [0.56] [0.73] [0.06]∗ [0.50]
Subjective Wellbeing - Now (Cantril) 0.00 0.35∗∗ −0.03 0.38∗∗ 318 0.07 0.19 −0.38∗∗ 0.57∗∗∗ 185(1.00) (0.15) (0.13) (0.15) (1.17) (0.22) (0.19) (0.19)
[0.14] [0.94] [0.10]∗ [0.76] [0.16] [0.03]∗∗
Subjective Wellbeing - 5 Years (Cantril) −0.00 0.25∗ −0.04 0.29∗∗ 318 −0.16 0.31 0.06 0.25 185(1.00) (0.14) (0.13) (0.14) (1.12) (0.20) (0.17) (0.17)
[0.29] [0.94] [0.16] [0.56] [0.83] [0.50]Tolerance Score (WVS) 0.00 0.23 0.14 0.09 318 0.18 0.10 0.09 0.00 185
(1.00) (0.15) (0.13) (0.15) (0.98) (0.19) (0.17) (0.19)[0.42] [0.67] [0.69] [0.84] [0.83] [0.99]
Panas Negative Affect Total 0.00 −0.06 0.21 −0.27∗ 294 0.00 −0.09 0.23 −0.32∗ 175(1.00) (0.14) (0.15) (0.16) (1.07) (0.17) (0.19) (0.17)
[0.88] [0.60] [0.34] [0.84] [0.52] [0.29]
Joint test (p-value) 0.08∗ 0.15 0.37 0.02∗∗
Notes: OLS estimates of the effects of priming on outcome variables. Outcome variables are listed on the left and reported in z-score units with the exceptionof the IAT results which report individual d-scores. For each outcome variable, we report the coefficients of interest with heteroskedasticity robust standarderrors in parentheses and FWER-adjusted p-values in brackets. Columns (1) through (5) report the results for the full sample. Columns (6) through (10)report the results when restricting to males. Columns (1) and (6) report the mean of the outcome variable among the control group. Columns (2) and (7)report the effect of viewing the science message. Columsn (3) and (8) report the effect of viewing the emotional message. Columns (4) and (9) report thedifference between the effects of the two messages. Columns (5) and (10) report the sample size. * denotes significance at 10 pct., ** at 5 pct., and *** at 1pct. level.
19

A Experiment details
A.1 Messages
A.1.1 Scientific atheism message
• Most people think that you need God to explain the existence of life, but they are wrong.
• Science offers us an explanation of how the complexity of life arose out of simplicity withoutGod.
• The theory that God exists does not offer a good explanation for anything.
• The origin of life was a chemical event, whereby a simple molecule able to replicate itself andpass down its structure (such as DNA) came into existence.
• This strikes many people as improbable, but scientists invoke large numbers to explain howlife arose despite the unlikeliness.
• With so many planets in the universe, life still would have emerged on one billion planets.
• Once life came into existence, Charles Darwin’s theory of evolution by natural selection ex-plains how complex life forms arose step by step without a God.
• Millions of mutations happen in life forms all the time, but only those that make an organismbetter able to survive are passed down.
• Over millions of years, these beneficial mutations add up, and organisms become more andmore complex and well suited to their environment.
• The alternative that life was designed by God is unnecessary, and it is also highly improbable.
• Any designer like God capable of designing something really complex like life, has to be reallycomplex himself.
• The existence of God would raise a bigger mystery than it solves because it does not tell uswhere God came from, so God is not a good explanation for the universe.
A.1.2 Emotional atheism message
• The widespread pain and suffering in the world is very strong evidence that God does notexist.
• 9,000,000 children die every year before they reach the age of five. That is 24,000 children aday, 1,000 per hour, 17 per minute.
20

• Any God that would allow children by the millions to suffer and die in this way and for theirparents to grieve in this way is either powerless or evil.
• According to many Christians, millions of people will go to Hell simply because they wereborn into the wrong religion.
• If God created these people, then he is responsible for the fact that they were brought up witha different religion and are ignorant of Christianity
• God created a world in which they would not be Christians, and then he created a penaltyfor this ignorance that he created, so he must be evil.
• In the Christian viewpoint, any murderer can spend his life raping and torturing children, butwill be forgiven by God if he converts to Christianity.
• Christians use a double standard to exonerate their vision of God.
• Given everything that God does not do to help people, believing in God is morally reprehen-sible.
• If God exists and is good, he would not have given us a book (the Bible) that defends slaveryand tells us to kill people for imaginary crimes like witchcraft.
• However it is not just the Christian God that is immoral and evil – any religion that justifiesthis killing is immoral and evil.
• It is clear that either God does not exist or he is evil.
A.1.3 Control message
• You need to eat vegetables everyday because you simply cannot find another food group thatis as perfectly matched to our everyday human needs.
• The nature of vegetables and the nature of human health are matched up in a way that simplycannot be duplicated by other food groups.
• To begin with, vegetables as a group are so low in calories that it is very difficult to gainweight even if you overeat them.
• On average, there are only 50 calories or less per cup from most of the healthiest vegetables.
• That amount is astonishingly low, even when you compare it to other food groups.
• The uniquely low-calorie nature of vegetables as a group means that you can eat a lot of themand not have to worry about the calories.
21

• Optimal nutrition is another reason that vegetables are important on a daily basis becauseyou need a supply of vitamins every day.
• When considered as a group, vegetables are unusually rich sources for a full mixture of water-soluble vitamins.
• When it comes to vegetables, there is also their abundance of phytonutrients to consider.
• Finally is the pleasure of chewing and amazing digestive benefits that come from the high-fibercontent of vegetables.
• Food cannot move through our digestive tract in a healthy way unless it is fiber-rich, andvegetables are some of the very richest sources of fiber that exist.
• It is clear that you should eat a lot of vegetables every day.
A.2 Additional outcome measures
A.2.1 Cantril Ladder
To assess how religion may influence an individual’s sense of status, we present participants witha Cantril ladder, which asks participants where they would rate their current life compared to thebest possible life they can imagine for themselves, both now and in five years by indicating wherethey stand (will stand) on a picture of a ladder with steps labeled 0 to 10.
We calculate z-scores for responses to both the present-date and 5-year Cantril ladder question.
Tolerance We adapt a series of questions from the World Values Survey asking participants “Ofthe following groups of people, which would you not like to have as neighbors?”
• Drug addicts
• People of a different race
• People who have AIDS
• Immigrants / foreign workers
• Homosexuals
• People of a different religion
• Atheists/people with no religion
• Heavy drinkers
22

• Unmarried couples living together
• People who speak a different language
We analyze individual responses and test joint significant with SUR regression; in addition, wecalculate both aggregate and weighted average indexes across all responses.
A.2.2 Positive and Negative Affect Schedule (PANAS)
To assess the possible effect of the messages on affect, individuals complete questions from thePANAS evaluating negative affect after viewing the messages. On a scale of 1 (not at all) to 100(very much), participants are asked “How much do you feel...”
• “Distressed, at this moment?”
• “Upset, at this moment?”
• “Guilty, at this moment?”
• “Ashamed, at this moment?’
• “Hostile, at this moment?”
• “Irritable, at this moment?”
• “Nervous, at this moment?”
• “Jittery, at this moment?”
• “Scared, at this moment?”
• “Afraid, at this moment?”
• “Frustrated, at this moment?”
• “Stressed, at this moment?”
We evaluate whether priming impacted affect by analyzing individual responses and testing for jointsignificance with SUR regression; in addition, we analyze the summary indices of this measure.
A.2.3 Demographics
We ask individuals to report their gender, age and religious affiliation.
23

B Detailed results
Table A.1: Overall Treatment Effects - Detailed Findings
(1) (2) (3) (4)ControlMean
SciencePrime
EmotionsPrime N
Religiosity Self-Report Index 0.00 −0.26 −0.40∗∗ 318(1.00) (0.17) (0.16)
Religiosity Factor Index −0.00 −0.43∗∗ −0.48∗∗∗ 318(1.00) (0.18) (0.17)
Religion IAT D-Score 0.11 0.00 −0.08 318(0.49) (0.07) (0.06)
Religion IAT D-Score (Alt Algorithm) 0.11 −0.00 −0.07 318(0.51) (0.08) (0.06)
Panas Negative Affect Total 0.00 −0.06 0.21 294(1.00) (0.14) (0.15)
WVS Tolerance Total −0.00 −0.23 −0.14 318(1.00) (0.15) (0.13)
Cantril (Now) 0.00 0.35∗∗ −0.03 318(1.00) (0.15) (0.13)
Cantril (5 Yrs) −0.00 0.25∗ −0.04 318(1.00) (0.14) (0.13)
Joint test (p-value) 0.08∗ 0.13
Notes: OLS estimates of the effects of priming on outcome variables. Outcome vari-ables are listed on the left and reported in z-score units with the exception of the IATresults which report individual d-scores. For each outcome variable, we report the coeffi-cients of interest and heteroskedasticity robust standard errors in parentheses. * denotessignificance at 10 pct., ** at 5 pct., and *** at 1 pct. level.
24

Table A.2: Overall Treatment Effects - Passed Comprehension Checks
(1) (2) (3) (4) (5)ControlMean
SciencePrime
EmotionsPrime
Joint Testp-value N
Self-Reported Religiosity Index (Anderson) 0.01 −0.29 −0.38∗∗ 0.06∗ 244(0.93) (0.20) (0.17)
Self-Reported Religiosity Index (Factor) 0.04 −0.59∗∗∗ −0.41∗∗ 0.01∗∗∗ 244(0.94) (0.21) (0.19)
Implicit Religiosity (IAT D-Score) 0.08 0.09 −0.03 0.32 244(0.50) (0.08) (0.07)
Implicit Religiosity (IAT D-Score Alt Algorithm) 0.08 0.09 −0.02 0.43 244(0.53) (0.09) (0.08)
Subjective Wellbeing - Now (Cantril) −0.06 0.41∗∗ −0.06 0.01∗∗ 244(1.00) (0.17) (0.15)
Subjective Wellbeing - 5 Years (Cantril) −0.06 0.41∗∗∗ −0.08 0.00∗∗∗ 244(1.00) (0.15) (0.15)
Tolerance Score (WVS) −0.01 0.18 0.04 0.55 244(0.99) (0.17) (0.16)
Panas Negative Affect Total 0.00 −0.02 0.30 0.20 226(1.01) (0.16) (0.19)
Joint test (p-value) 0.02∗∗ 0.30
Notes: OLS estimates of the effects of priming on outcome variables. The sample is restricted to individualswho passed the comprehension checks at the beginning of the study. Outcome variables are listed on the left andreported in z-score units with the exception of the IAT results which report individual d-scores. For each outcomevariable, we report the coefficients of interest and heteroskedasticity robust standard errors in parentheses. *denotes significance at 10 pct., ** at 5 pct., and *** at 1 pct. level.
25

Table A.3: Overall Treatment Effects - Christian
(1) (2) (3) (4) (5)ControlMean
SciencePrime
EmotionsPrime
Joint Testp-value N
Self-Reported Religiosity Index (Anderson) 0.11 −0.30∗ −0.36∗∗ 0.04∗∗ 268(0.85) (0.18) (0.15)
Self-Reported Religiosity Index (Factor) −0.02 −0.39∗∗ −0.30∗ 0.07∗ 268(1.02) (0.19) (0.17)
Implicit Religiosity (IAT D-Score) 0.10 0.01 −0.03 0.80 268(0.49) (0.08) (0.07)
Implicit Religiosity (IAT D-Score Alt Algorithm) 0.10 0.02 −0.02 0.85 268(0.51) (0.08) (0.07)
Subjective Wellbeing - Now (Cantril) −0.05 0.46∗∗∗ 0.06 0.01∗∗ 268(1.01) (0.16) (0.15)
Subjective Wellbeing - 5 Years (Cantril) −0.10 0.36∗∗ 0.05 0.03∗∗ 268(1.00) (0.15) (0.14)
Tolerance Score (WVS) −0.02 0.15 0.10 0.62 268(0.99) (0.16) (0.15)
Panas Negative Affect Total 0.02 −0.07 0.20 0.23 268(1.00) (0.15) (0.16)
Joint test (p-value) 0.08∗ 0.47
Notes: OLS estimates of the effects of priming on outcome variables. Outcome variables are listed on theleft and reported in z-score units with the exception of the IAT results which report individual d-scores. Thesample is restricted to individuals who self-identify as being of Christian faith. For each outcome variable,we report the coefficients of interest and heteroskedasticity robust standard errors in parentheses. * denotessignificance at 10 pct., ** at 5 pct., and *** at 1 pct. level.
26

Table A.4: Heterogeneous Treatment Effects by Gender - Detailed Findings
(1) (2) (3) (4) (5) (6) (7)SciencePrime
Science PrimeX Male
EmotionsPrime
Emotions PrimeX Male
F-test (1)+(2)=0(p-value)
F-test (3)+(4)=0(p-value) N
Self-Reported Religiosity Index (Anderson) −0.24 −0.01 −0.40 −0.05 0.24 0.03∗∗ 316(0.31) (0.37) (0.25) (0.32)
Self-Reported Religiosity Index (Factor) −0.29 −0.24 −0.44 −0.09 0.02∗∗ 0.02∗∗ 316(0.28) (0.36) (0.28) (0.35)
Implicit Religiosity (IAT D-Score) 0.14 −0.23 0.09 −0.28∗∗ 0.28 0.02∗∗ 316(0.13) (0.15) (0.10) (0.13)
Implicit Religiosity (IAT D-Score Alt Algorithm) 0.14 −0.24 0.08 −0.26∗∗ 0.30 0.03∗∗ 316(0.13) (0.16) (0.10) (0.13)
Subjective Wellbeing - Now (Cantril) 0.60∗∗∗ −0.39 0.37∗∗ −0.76∗∗∗ 0.35 0.04∗∗ 316(0.21) (0.30) (0.17) (0.25)
Subjective Wellbeing - 5 Years (Cantril) 0.23 0.08 −0.19 0.25 0.12 0.74 316(0.17) (0.26) (0.19) (0.26)
Tolerance Score (WVS) 0.38∗ −0.30 0.23 −0.13 0.66 0.59 316(0.23) (0.30) (0.20) (0.27)
Panas Negative Affect Total −0.02 −0.06 0.18 0.07 0.64 0.20 292(0.27) (0.32) (0.24) (0.31)
Notes: OLS estimates of the effects of priming on outcome variables, with interaction terms by gender. Outcome variables are listed on the left and reportedin z-score units with the exception of the IAT results which report individual d-scores. For each outcome variable, we report the coefficients of interest andheteroskedasticity-robust standard errors in parentheses. Columns (1) and (3) report the effect of the science and emotion messages for female respondents.Columns (2) and (4) report the difference in the treatment effects between male and female respondents. Columns (5) and (6) test the joint significance of themain and interaction effects for each message. * denotes significance at 10 pct., ** at 5 pct., and *** at 1 pct. level.
27

Table A.5: Self-reported Religiosity Detailed Treatment Effects
(1) (2) (3) (4) (5)ControlMean
SciencePrime
EmotionsPrime
Joint Testp-value N
My personal religious beliefs are very important to me. −0.00 −0.39∗∗ −0.50∗∗∗ 0.01∗∗∗ 318(1.00) (0.18) (0.17)
My religion or faith is an important part of my identity. 0.00 0.11 −0.21 0.11 318(1.00) (0.14) (0.15)
Religion important to understand me. −0.00 −0.02 −0.04 0.95 318(1.00) (0.15) (0.14)
I believe strongly in the teachings of my religion or faith. −0.00 0.08 −0.08 0.58 318(1.00) (0.15) (0.15)
I believe in God. 0.00 −0.23 −0.21 0.22 318(1.00) (0.18) (0.14)
I consider myself a religious person. 0.00 −0.03 −0.13 0.63 318(1.00) (0.15) (0.14)
Self-Reported Religiosity Index (Anderson) 0.00 −0.26 −0.40∗∗ 0.03∗∗ 318(1.00) (0.17) (0.16)
Joint test (p-value) 0.07∗ 0.08∗
Notes: OLS estimates of the effects of priming on outcome variables. Outcome variables are dummies, except forthe index, which is reported in z-score units. For each outcome variable, we report the coefficients of interest andheteroskedasticity robust standard errors in parentheses. * denotes significance at 10 pct., ** at 5 pct., and *** at 1 pct.level.
28

Table A.6: Tolerance Detailed Treatment Effects
(1) (2) (3) (4) (5)ControlMean
SciencePrime
EmotionsPrime
Joint Testp-value N
Drug Addicts 0.59 −0.14∗∗ 0.01 0.07∗ 318(0.49) (0.07) (0.07)
People of Different Race 0.08 0.05 0.04 0.45 318(0.28) (0.04) (0.04)
People with AIDS 0.04 0.04 0.02 0.43 318(0.19) (0.03) (0.03)
Immigrants 0.03 −0.01 0.02 0.50 318(0.16) (0.02) (0.03)
Homosexuals 0.58 −0.05 −0.12∗ 0.19 318(0.50) (0.07) (0.07)
Different Religions 0.06 0.00 0.01 0.92 318(0.25) (0.04) (0.03)
Atheists 0.17 0.01 −0.00 0.95 318(0.38) (0.05) (0.05)
Heavy Drinkers 0.48 −0.13∗ −0.08 0.17 318(0.50) (0.07) (0.07)
Unmarried Couples Cohabitating 0.10 −0.07∗ −0.03 0.13 318(0.30) (0.03) (0.04)
People who Speak Other Languages 0.11 0.02 −0.03 0.42 318(0.31) (0.05) (0.04)
Tolerance Score (WVS) 0.00 0.23 0.14 0.29 318(1.00) (0.15) (0.13)
Joint test (p-value) 0.20 0.44
Notes: OLS estimates of the effects of priming on outcome variables. Outcome variables aredummies and represent responses to the question: “Of the following groups of people, whichwould you not like to have as neighbors?” Total tolerance score is a reverse coding of the totalof the 10 binary questions. For each outcome variable, we report the coefficients of interest andheteroskedasticity robust standard errors in parentheses. * denotes significance at 10 pct., **at 5 pct., and *** at 1 pct. level.
29
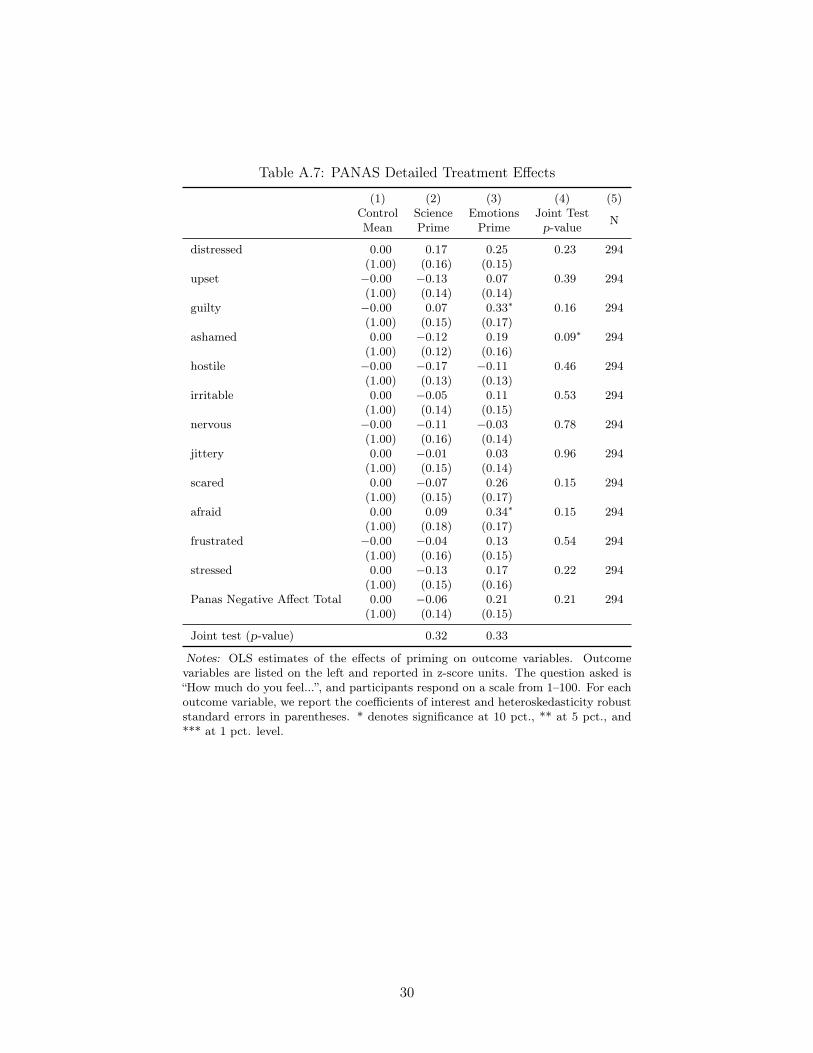
Table A.7: PANAS Detailed Treatment Effects
(1) (2) (3) (4) (5)ControlMean
SciencePrime
EmotionsPrime
Joint Testp-value N
distressed 0.00 0.17 0.25 0.23 294(1.00) (0.16) (0.15)
upset −0.00 −0.13 0.07 0.39 294(1.00) (0.14) (0.14)
guilty −0.00 0.07 0.33∗ 0.16 294(1.00) (0.15) (0.17)
ashamed 0.00 −0.12 0.19 0.09∗ 294(1.00) (0.12) (0.16)
hostile −0.00 −0.17 −0.11 0.46 294(1.00) (0.13) (0.13)
irritable 0.00 −0.05 0.11 0.53 294(1.00) (0.14) (0.15)
nervous −0.00 −0.11 −0.03 0.78 294(1.00) (0.16) (0.14)
jittery 0.00 −0.01 0.03 0.96 294(1.00) (0.15) (0.14)
scared 0.00 −0.07 0.26 0.15 294(1.00) (0.15) (0.17)
afraid 0.00 0.09 0.34∗ 0.15 294(1.00) (0.18) (0.17)
frustrated −0.00 −0.04 0.13 0.54 294(1.00) (0.16) (0.15)
stressed 0.00 −0.13 0.17 0.22 294(1.00) (0.15) (0.16)
Panas Negative Affect Total 0.00 −0.06 0.21 0.21 294(1.00) (0.14) (0.15)
Joint test (p-value) 0.32 0.33
Notes: OLS estimates of the effects of priming on outcome variables. Outcomevariables are listed on the left and reported in z-score units. The question asked is“How much do you feel...”, and participants respond on a scale from 1–100. For eachoutcome variable, we report the coefficients of interest and heteroskedasticity robuststandard errors in parentheses. * denotes significance at 10 pct., ** at 5 pct., and*** at 1 pct. level.
30

Table A.8: PANAS Detailed Treatment Effects - Male
(1) (2) (3) (4) (5)ControlMean
SciencePrime
EmotionsPrime
Joint Testp-value N
distressed 0.06 0.28 0.22 0.30 175(0.98) (0.20) (0.19)
upset 0.05 −0.19 0.12 0.20 175(0.94) (0.16) (0.18)
guilty 0.08 −0.04 0.17 0.60 175(1.16) (0.19) (0.22)
ashamed 0.10 −0.26 0.02 0.06∗ 175(1.23) (0.16) (0.20)
hostile −0.08 −0.22∗∗ 0.03 0.03∗∗ 175(0.74) (0.11) (0.14)
irritable −0.03 −0.10 0.06 0.52 175(1.01) (0.15) (0.17)
nervous 0.06 −0.19 0.11 0.32 175(1.02) (0.19) (0.20)
jittery 0.10 −0.01 −0.11 0.78 175(0.93) (0.20) (0.17)
scared 0.00 −0.13 0.18 0.32 175(1.11) (0.19) (0.21)
afraid −0.01 0.03 0.32 0.29 175(0.99) (0.20) (0.21)
frustrated −0.12 0.05 0.31∗ 0.18 175(0.88) (0.18) (0.17)
stressed −0.15 −0.05 0.32∗ 0.15 175(0.94) (0.18) (0.19)
Panas Negative Affect Total 0.00 −0.09 0.23 0.18 175(1.07) (0.17) (0.19)
Joint test (p-value) 0.06∗ 0.50
Notes: OLS estimates of the effects of priming on outcome variables. Outcome variablesare listed on the left and reported in z-score units. The question asked is “How much doyou feel...”, and participants respond on a scale from 1–100. For each outcome variable,we report the coefficients of interest and heteroskedasticity robust standard errors inparentheses. * denotes significance at 10 pct., ** at 5 pct., and *** at 1 pct. level.
31