ATC-PSQUAL scale: A proposal to measure perceived quality ... · 169 marketing ATC-PSQUAL scale: A...
18
169 marketing ATC-PSQUAL scale: A proposal to measure perceived quality of the Air Traffic Control Service Edison Jair Duque-Oliva Associate Professor, Escuela de Administración y Contaduría Pública, Universidad Nacional de Colombia, sede Bogotá. E-mail: [email protected] Manuel Mercado-Barboza Universidad Nacional de Colombia, Mechanical Engineering, Universidad del Norte, Specialist in Industrial Electronics, Universidad Nacional de Colombia, Master in Administration. E-mail: [email protected] ABSTRACT: This paper describes the development of the construction of a 21-item instrument, called ATC-PSQUAL, to measure the perceived quality of the Air Traffic Control service (ATC-Air Traffic Con- trol). It begins with the conceptualization and operationalization of the service quality, the concep- tualization of the ATS service and the methodology used in the development of the research; continu- ing with the procedure used in the construction and refinement of a multi-item scale to measure the construct referenced. Subsequently, evidence of the reliability and construct validity of the proposed instrument, based on surveys applied to customers of the ATC service –aircrafts pilots– who have used, in the last three months, the service provided by La Unidad Administrativa Especial de Aeronautica Civil (the Colom- The paper concludes with the important contribution of the ATC-PSQUAL instrument for the improve- ment of ATC service, not only for civil aviation in Colombia but also globally, becoming a pioneering study in the aeronautical sector, based on the discipline of service marketing, leaving the proposal open for future studies on the subject. KEYWORDS: Measuring the quality, service quality, perceived service quality, air traffic services, ATS, quality of air traffic control services, air traffic control service, ATC, quality of air traffic control, quality measurement for air traffic control, measureament of the quality of air traffic control service. Introduction Aviation is remarkable for the giant technological leaps it has made over the last century. This progress would not have been possible without parallel achievements in the control and reduction of aviation´s safety hazards. Given the many ways that aviation can result in injury or harm, those involved with aviation have been preoccupied with prevenying accidents since the earliest days of flying. Through the disciplined application of best safety manage- ment practices, the frequency and severity of aviation occurrences have de- clines significantly (ICAO, 2006). Phenomena such as globalization, mergers of airlines, tourism, open skies policies among nations, technological advances in the aviation industry and the speed of air transportation, have increased the number of air opera- tions worldwide, causing many aircrafts to use the same routes simultane- ously, consistent with its high speed performance, making it difficult for the pilots to take overall control traffic in areas where they are flying, these situations increase the risk on air navigation, the possibility of collisions and near misses between aircrafts. These environmental conditions have in- MEDICIÓN DE LA CALIDAD PERCIBIDA DEL SERVICIO DE CONTROL DE TRÁNSITO AÉREO RESUMEN: Este trabajo describe el desarrollo de la construcción de un instrumento de 21 ítems, llamado ATC-PSQUAL, para medir la calidad per- cibida del servicio de Control de Tránsito Aéreo (ATC- Air Traffic Control ). Inicia con la conceptualización y operativización de la calidad del servicio, la conceptualización de los servicios ATS y la metodología empleada en el desarrollo de la investigación, continuando con el procedimiento utiliza- do en la construcción y refinación de la escala multi-ítems para medir el constructo referenciado. Posteriormente, se presentan las evidencias de la fiabilidad y validez de constructo del instrumento propuesto, basados en observaciones (encues- tas) efectuadas a clientes del servicio ATC (pilotos de aeronaves) que han usado en los últimos tres meses el servicio prestado por la Unidad Adminis- trativa Especial de Aeronáutica Civil (Autoridad aeronáutica colombiana) El trabajo concluye con el importante aporte del instrumento ATC-PSQUAL para el mejoramiento del servicio ATC, no solo para la aviación civil en Colombia sino también a nivel mundial, constituyéndose en un estudio pionero en el sector aeronáutico, basado en la disciplina del marketing de servicio, que deja abierta la discusión para futuros estudios sobre el tema. PALABRAS CLAVE: calidad percibida del servicio, servicios de transito aereo - ATS, servicio de control de transito aereo - ATC, medición de la calidad del control de transito aéreo, medición de la calidad del servicio de tránsito aéreo. MESURE DE LA PERCEPTION DE LA QUALITE DU SERVICE DE CONTROLE DU TRAFIC AERIEN RÉSUMÉ : Cet article décrit le développement de la construction d’un ins- trument de 21 ítems, ATC-PSQUAL, pour mesurer la qualité de service per- çue du Contrôle du Trafic Aérien (ATC - Air Traffic Control). L’article commence par la conceptualisation et le caractère opération- nel de la qualité de service, la conceptualisation des services ATS et la méthodologie utilisée pour le développement de l’investigation, détermi- nant ensuite la procédure utilisée pour la construction er le perfection- nement de l’échelle multi-items pour la mesure du modèle de référence. Il présente les évidences de fiabilité et de validité de construction de l’instrument proposé, sur base d’observations (enquêtes) effectuées au- près de clients du service ATC (pilotes d'aéronef) ayant utilisé, durant les trois derniers mois, les services de l’Unité Administrative Spéciale d’Aéronautique Civile (Autorité aéronautique colombienne) dans l’espace En conclusion, cette étude fournit l’instrument ATC-PSQUAL pour l’amélioration du service ATC, non seulement pour l’aviation civile colom- bienne mais aussi au niveau mondial, constituant ainsi une étude pionniè- re du secteur aéronautique, basée sur la discipline du marketing de service, laissant la discussion ouverte pour de futures études sur ce thème. MOTS-CLEFS : qualité de service perçue, services du trafic aérien - ATS, service du contrôle du trafic aérien - ATC, mesure de la qualité du contrôle du trafic aérien, mesure de la qualité du service du trafic aérien. MEDIÇÃO DA QUALIDADE PERCEBIDA DO SERVIÇO DE CONTROLE DE TRÂNSITO AÉREO RESUMO: Este trabalho descreve o desenvolvimento da construção de um instrumento de 21 itens, chamado ATC-PSQUAL, para medir a qua- lidade percebida do serviço de Controle de Tráfego Aéreo (ATC- Air Tra- ffic Control). Inicia com a conceituação e operatividade da qualidade do serviço, a conceituação dos serviços ATS e a metodologia empregada no desenvolvimento da pesquisa, continuando com o procedimento utilizado na construção e refinação da escala multi-itens para medir o constructo referenciado. Posteriormente, apresentam-se as evidências da fiabilidade e validade do constructo do instrumento proposto, baseados em observações (enquetes) efetuadas a clientes do serviço ATC (pilotos de aeronaves) que usaram, nos últimos três meses, o serviço prestado pela Unidade Administrativa Espe- cial de Aeronáutica Civil (Autoridade aeronáutica colombiana) no espaço O trabalho é concluído com a importante contribuição do instrumento ATC-PSQUAL para o melhoramento do serviço ATC, não só para a aviação civil na Colômbia, como também em nível mundial, constituindo-se em um estudo pioneiro no setor aeronáutico, baseado na disciplina do mar- keting de serviço, que deixa aberta a discussão para futuros estudos so- bre o tema. PALAVRAS CHAVE: qualidade percebida do serviço, serviços de trânsito aéreo –ATS, serviço de controle de tráfego aéreo– ATC, medição da qua- lidade do controle do tráfego aéreo, medição da qualidade do serviço de tráfego aéreo. CLASIFICACIÓN JEL: M31 RECIBIDO: diciembre de 2010 APROBADO: abril de 2011. CORRESPONDENCIA: Jair Duque, Edificio 311 (oficina de asistencia de profesores, tercer piso), Facultad de Ciencias Económicas, Univer- sidad Nacional de Colombia, Cra. 30, no. 45-03, Bogotá, Colombia. CITACIÓN: Duque-Oliva, E.J. & Mercado-Barboza, M. (2011). ATC- PSQUAL scale: A proposal to measure perceived quality of the Air Traf- fic Control service. INNOVAR, 21(41), 169-185.
Transcript of ATC-PSQUAL scale: A proposal to measure perceived quality ... · 169 marketing ATC-PSQUAL scale: A...

169
marketing
ATC-PSQUAL scale: A proposal to measure perceived quality of the Air
Traffic Control Service
Edison Jair Duque-OlivaAssociate Professor, Escuela de Administración y Contaduría Pública, Universidad Nacional de Colombia, sede Bogotá. E-mail: [email protected]
Manuel Mercado-BarbozaUniversidad Nacional de Colombia, Mechanical Engineering, Universidad del Norte, Specialist in Industrial Electronics, Universidad Nacional de Colombia, Master in Administration. E-mail: [email protected]
ABSTRACT: This paper describes the development of the construction of a 21-item instrument, called ATC-PSQUAL, to measure the perceived quality of the Air Traffic Control service (ATC-Air Traffic Con-trol). It begins with the conceptualization and operationalization of the service quality, the concep-tualization of the ATS service and the methodology used in the development of the research; continu-ing with the procedure used in the construction and refinement of a multi-item scale to measure the construct referenced.
Subsequently, evidence of the reliability and construct validity of the proposed instrument, based on surveys applied to customers of the ATC service –aircrafts pilots– who have used, in the last three months, the service provided by La Unidad Administrativa Especial de Aeronautica Civil (the Colom-������������������� ������������������������������������������� ������������������������!
The paper concludes with the important contribution of the ATC-PSQUAL instrument for the improve-ment of ATC service, not only for civil aviation in Colombia but also globally, becoming a pioneering study in the aeronautical sector, based on the discipline of service marketing, leaving the proposal open for future studies on the subject.
KEYWORDS: Measuring the quality, service quality, perceived service quality, air traffic services, ATS, quality of air traffic control services, air traffic control service, ATC, quality of air traffic control, quality measurement for air traffic control, measureament of the quality of air traffic control service.
Introduction
Aviation is remarkable for the giant technological leaps it has made over the last century. This progress would not have been possible without parallel achievements in the control and reduction of aviation s safety hazards. Given the many ways that aviation can result in injury or harm, those involved with aviation have been preoccupied with prevenying accidents since the earliest days of flying. Through the disciplined application of best safety manage-ment practices, the frequency and severity of aviation occurrences have de-clines significantly (ICAO, 2006).
Phenomena such as globalization, mergers of airlines, tourism, open skies policies among nations, technological advances in the aviation industry and the speed of air transportation, have increased the number of air opera-tions worldwide, causing many aircrafts to use the same routes simultane-ously, consistent with its high speed performance, making it difficult for the pilots to take overall control traffic in areas where they are flying, these situations increase the risk on air navigation, the possibility of collisions and near misses between aircrafts. These environmental conditions have in-
MEDICIÓN DE LA CALIDAD PERCIBIDA DEL SERVICIO DE CONTROL DE TRÁNSITO AÉREO
RESUMEN: Este trabajo describe el desarrollo de la construcción de un instrumento de 21 ítems, llamado ATC-PSQUAL, para medir la calidad per-cibida del servicio de Control de Tránsito Aéreo (ATC- Air Traffic Control). Inicia con la conceptualización y operativización de la calidad del servicio, la conceptualización de los servicios ATS y la metodología empleada en el desarrollo de la investigación, continuando con el procedimiento utiliza-do en la construcción y refinación de la escala multi-ítems para medir el constructo referenciado.
Posteriormente, se presentan las evidencias de la fiabilidad y validez de constructo del instrumento propuesto, basados en observaciones (encues-tas) efectuadas a clientes del servicio ATC (pilotos de aeronaves) que han usado en los últimos tres meses el servicio prestado por la Unidad Adminis-trativa Especial de Aeronáutica Civil (Autoridad aeronáutica colombiana) ��������������"����������������#����������������� ��!
El trabajo concluye con el importante aporte del instrumento ATC-PSQUAL para el mejoramiento del servicio ATC, no solo para la aviación civil en Colombia sino también a nivel mundial, constituyéndose en un estudio pionero en el sector aeronáutico, basado en la disciplina del marketing de servicio, que deja abierta la discusión para futuros estudios sobre el tema.
PALABRAS CLAVE: calidad percibida del servicio, servicios de transito aereo - ATS, servicio de control de transito aereo - ATC, medición de la calidad del control de transito aéreo, medición de la calidad del servicio de tránsito aéreo.
MESURE DE LA PERCEPTION DE LA QUALITE DU SERVICE DE CONTROLE DU TRAFIC AERIEN
RÉSUMÉ : Cet article décrit le développement de la construction d’un ins-trument de 21 ítems, ATC-PSQUAL, pour mesurer la qualité de service per-çue du Contrôle du Trafic Aérien (ATC - Air Traffic Control).
L’article commence par la conceptualisation et le caractère opération-nel de la qualité de service, la conceptualisation des services ATS et la méthodologie utilisée pour le développement de l’investigation, détermi-nant ensuite la procédure utilisée pour la construction er le perfection-nement de l’échelle multi-items pour la mesure du modèle de référence.
Il présente les évidences de fiabilité et de validité de construction de l’instrument proposé, sur base d’observations (enquêtes) effectuées au-près de clients du service ATC (pilotes d'aéronef) ayant utilisé, durant les trois derniers mois, les services de l’Unité Administrative Spéciale d’Aéronautique Civile (Autorité aéronautique colombienne) dans l’espace �"������"����"���������������� ��!
En conclusion, cette étude fournit l’instrument ATC-PSQUAL pour l’amélioration du service ATC, non seulement pour l’aviation civile colom-bienne mais aussi au niveau mondial, constituant ainsi une étude pionniè-re du secteur aéronautique, basée sur la discipline du marketing de service, laissant la discussion ouverte pour de futures études sur ce thème.
MOTS-CLEFS : qualité de service perçue, services du trafic aérien - ATS, service du contrôle du trafic aérien - ATC, mesure de la qualité du contrôle du trafic aérien, mesure de la qualité du service du trafic aérien.
MEDIÇÃO DA QUALIDADE PERCEBIDA DO SERVIÇO DE CONTROLE DE TRÂNSITO AÉREO
RESUMO: Este trabalho descreve o desenvolvimento da construção de um instrumento de 21 itens, chamado ATC-PSQUAL, para medir a qua-lidade percebida do serviço de Controle de Tráfego Aéreo (ATC- Air Tra-ffic Control). Inicia com a conceituação e operatividade da qualidade do serviço, a conceituação dos serviços ATS e a metodologia empregada no desenvolvimento da pesquisa, continuando com o procedimento utilizado na construção e refinação da escala multi-itens para medir o constructo referenciado.
Posteriormente, apresentam-se as evidências da fiabilidade e validade do constructo do instrumento proposto, baseados em observações (enquetes) efetuadas a clientes do serviço ATC (pilotos de aeronaves) que usaram, nos últimos três meses, o serviço prestado pela Unidade Administrativa Espe-cial de Aeronáutica Civil (Autoridade aeronáutica colombiana) no espaço �"����������������#����������������� ��!
O trabalho é concluído com a importante contribuição do instrumento ATC-PSQUAL para o melhoramento do serviço ATC, não só para a aviação civil na Colômbia, como também em nível mundial, constituindo-se em um estudo pioneiro no setor aeronáutico, baseado na disciplina do mar-keting de serviço, que deixa aberta a discussão para futuros estudos so-bre o tema.
PALAVRAS CHAVE: qualidade percebida do serviço, serviços de trânsito aéreo –ATS, serviço de controle de tráfego aéreo– ATC, medição da qua-lidade do controle do tráfego aéreo, medição da qualidade do serviço de tráfego aéreo.
CLASIFICACIÓN JEL: M31
RECIBIDO: diciembre de 2010 APROBADO: abril de 2011.
CORRESPONDENCIA: Jair Duque, Edificio 311 (oficina de asistencia de profesores, tercer piso), Facultad de Ciencias Económicas, Univer-sidad Nacional de Colombia, Cra. 30, no. 45-03, Bogotá, Colombia.
CITACIÓN: Duque-Oliva, E.J. & Mercado-Barboza, M. (2011). ATC-PSQUAL scale: A proposal to measure perceived quality of the Air Traf-fic Control service. INNOVAR, 21(41), 169-185.

170 REV. INNOVAR VOL. 21, NÚM. 41, JULIO-SEPTIEMBRE DE 2011
marketing
creased the need for an external service to aircrafts to en-sure safety; The service is called Air Traffic Service (ATS), maintaining and providing standard separation guides the aircraft from the ground, supported in aeronautical infrastructure such as communication, radar, radio navi-gation, and meteorology systems, among others. These services are classified as Air Traffic Control (ATC) service, the flight information service, and alerting service. The present study is focused on the ATC service provided in the Barranquilla FIR.
Aerial accidents and incidents are disastrous, causing loss of human lives, moral effects, and high economic costs, while having insurance can distribute the costs of an accident over time, accidents are not a good busi-ness. While insurance may cover specific risks, there are many uninsured costs. In addition, there are less tangible costs (but no less important) such as loss of confidence of the traveling public. Understanding the total cost of an accident is critical to understanding the need for high quality indicators in the various services provided to civil aviation.
Statistically speaking, few aircraft accidents are caused by a fault of ATC service, but less serious incidents still occur with a moderate frequency, those are signs that suggest safety issues underlying. Ignoring these underlying risks to safety could pave the way for an increase of more serious incidents. This is the reason why any ATC service provider worldwide should strive to understand the flaws in service delivery and the needs, desires and expectations of its cus-tomers or users.
Therefore, it is essential to have measurement tools to as-sess the quality of the ATC service, which will allow the ATC service provider to set the required strategy within the organization to minimize the occurrence of failures in the ATC service delivery ensuring optimal safety conditions and continuous improvement of its processes with custom-er focus, given the impact of the service on human life.
Since aviation accidents are rare events, accident rates are not good indicators of safety performance. They may be of limited value at the global, regional or national level. However, the absence of accidents may belie many unsafe conditions in the system, creating situation “ripe for acci-dent”. Accident rates are even less useful as an indicator of safety when applied to individual aerodromes or flight information regions (FIRs). For any given FIR, for example, the expected time between en-route accidents could be in excess of 100 years (ICAO, 2006).
Given the importance of providing excellent service and considering ATC strong impact on safety is why the need
to examine how to measure the quality of the services pro-vided was originated. In the exploration phase of this re-search was found that the agencies providers of this service compile quantitative data to provide indicators to measure quality, such as frequency of occurrence and aircraft prox-imity in flight near misses, runway incursions, loss required separation techniques, delays, notification of proximity of aircraft in flight, warning messages and alerts TCAS, loss of radar coverage and communications, among oth-ers; however it was found that there is not an instrument to measure the perceived quality of ATC services based on the discipline of marketing the service. This result originat-ed the overall objective of this study: measuring perceived ATC service quality.
By the above considerations, it is intended to make a con-tribution to aviation, not only in Colombia but worldwide, building a measuring instrument with empirical validity and reliability to evaluate perceived quality of the ATC ser-vice, which allows, together with other quantitative mea-sures established by any aviation authority, the continuous improvement of these services, and structure of the cus-tomer-oriented service.
This article is divided into four sections: The first section focuses in the conceptualization of perceived service qual-ity and the ATC service (ATS – Air Traffic Service), in ac-cordance with the provisions of the International Civil Aviation Organization (ICAO); the second section refers to the methodology used for the development of the work, the third section deals with the analysis of the scale and the results obtained, and ending in the fourth section with an analysis of the results or conclusions.
Conceptualization of perceived service quality and Air Traffic Service
The concept of quality of service: Any product, service or good, consists of one or more attributes that characterize it; all those attributes or properties that allow the consum-er to assign value to that product are considered its qual-ity. The single most researched area in services marketing to date is service quality. The interest in service quality parallels the focus on quality, total quality management, and satisfaction in business. (Fisk et al., 1993, p. 77). As a starting point, it should be noted that the quality, whether in tangible products or services, is what customers perceive (Grönroos, 1994, p. 35); The very intangibility of the ser-vices causes that they are largely perceived in a subjective way (Grönroos, 1994, p. 37); Unlike goods quality, which can be measured objectively by such indicators as dura-bility and number of defects (Crosby,1979; Garvin, 1983),

J O U R N A L
R E V I S T A
INNOVAR
171REV. INNOVAR VOL. 21, NÚM. 41, JULIO-SEPTIEMBRE DE 2011
service quality is an abstract and elusive construct because of three features unique to services: intangibility, hetero-geneity, and inseparability of production and consumption (Parasuramant et al., 1985), and finally it is worth men-tioning that “Knowledge about goods quality, however, is insufficient to understand service quality” (Parasuraman et al., 1985: p. 42).
As defined by Parasuraman et al. (1985: p. 41), referring to the importance of quality of services, “while the substance and determinants of quality may be undefined, its impor-tance to firms and consumers is unequivocal.” Research-ers have demonstrated the strategic benefits of quality in contributing to expand the market share and return on in-vestment (Anderson & Zeithaml, 1984; Phillips, Chang, & Buzzell, 1983), as well as in reducing manufacturing costs and improving productivity (Garvin, 1983). Service quality is an elusive (indefinable) and abstract term hard to define and measure. (Brown & Swartz, 1989; Carman, 1990; Cros-by, 1979; Garvin, 1983; Parasuraman et al., 1985, 1988; Rathmell, 1966). In marketing literature we find definitions associated with this concept; we could classify the two per-spectives, one from the customer’s perception and other from the perspective of the expectations and perceptions of customers, then highlighting the following:
Approach from the customer’s perception:
– The consumer s judgment about an entity s overall ex-cellence or superiority (Zeithaml, 1987).
– A high quality service is the one that satisfies the client in a given situation (Eiglier & Langeard, 1989).
– Overall customer judgment about service excellence or superiority (Casino, 1999).
– It is what the consumer perceives it is (Llorens & Fuen-tes, 2005).
Approach from the expectations and perceptions of cus-tomers:
– Comparison of customer expectations with the actu-al result of the service received (Parasuraman et al., 1985).
– It is the result of comparing the expectations and per-ceptions (Zeithaml, 1992).
– Results of the consumer-perceived difference between their expectations and perception of the outcome (Rust & Oliver, 1994).
– Comparison of expectations and actual service perfor-mance (Grönroos, 1984).
In classical literature related to the concept of quality, there are two approaches: The Objective quality and the Subjective quality. Authors as Reeves & Bednar (1994) dis-tinguished four trends for the analysis of the quality con-cept, based on: Quality as an experience, quality as value perceived, quality as in being able to conform to specifi-cations, and quality as meeting customer’s expectations.
The Objective quality is related to compliance with speci-fications or compliance of a good or service with the tech-nical standards. According to Vázquez et al. (1996), the Objective quality is an inside view of quality since it is a

172 REV. INNOVAR VOL. 21, NÚM. 41, JULIO-SEPTIEMBRE DE 2011
marketing
view from a production standpoint. Statistical Process Control could be considered as the basic tool of the Objec-tive quality.
On the other hand, the Subjective quality is focused on the consumer or client perspective and relates to the extent of their perception or to the difference between expectation and perception of a product or a service. Vazquez et al. (1996) talk about subjective quality as an external view, as this quality is obtained through the determination and fulfillment of needs, desires and expectations of custom-ers, since service activities are highly related to the contact with customers (Duque, 2006).
With all this, the service quality construct as it is concep-tualized in the service marketing literature refers to the perceived quality. Perceived quality is the opinion of con-sumers about an entity’s superiority or overall excellence (Zeithaml, 1987). Parasuraman et al. (1988), contrasting the perceived quality versus objective quality, state that: Researchers (Garvin, 1983; Dodds & Monroe, 1984; Hol-brook & Corfman, 1985; Zeithaml, 1987) have emphasized the difference between objective quality and perceived quality.
Assessment of Quality of Service
Referring to the intrinsic characteristics of services (intan-gibility, heterogeneity, inseparability, and expiration), Cris-tóbal (2002) states that these distinguishing features of the services are the ones needed to determine its quality; they help to know which are the aspects that customers use to evaluate the service and what is the perception about them (Grönroos, 1994, p. 35), directing the assessment to the process rather than to the result. This perspective im-plies admitting that the determination of the quality of services should be based primarily on the perception that customers have on services (Grönroos, 1994; Parasuraman et al., 1985; Steenkamp, 1990) –the fundament that opens the door to introduce the concept of perceived quality of services, which has been the way of conceptualizing the quality, predominantly in the field of services.
The service marketing literature provides the multidimen-sional nature of perceived service quality construct. The di-mensions are elements of comparison that individuals use to evaluate the various objects (Bou, 1997) and in many cases are not directly observable, but are abstractions which the subject perceives from service attributes; from the results of these studies can be inferred that there is not an unified approach about the dimensions that character-ize the services.
The multidimensional nature of service quality has always been accepted with both practical and theoretical ap-proaches. Being the point of divergence the determinants of this “quality of service identity”. The different classifi-cations of dimensions that are given to the construct are highly variable and heterogeneous, but for now there is no consensus (Duque, 2006).
Based on the multidimensional nature of the construct “service quality”, many authors in the field of service mar-keting have proposed abstract models in order to estab-lish what are the determining dimensions or attributes that characterize services and to make its assessment. The assessment of quality of service in the traditional atmo-sphere is studied through concepts such as perceived qual-ity, satisfaction and value (Gil et al., 2004, p. 4).
Being the main point the disconfirmation process, the comparison of expectations, and actual service perfor-mance (Duque, 2006), based on the disconfirmation paradigm of Oliver (1980), which states that the client evaluates the quality making a comparison (divergence) between expectation and perception of service received, a trend that originated among others the Nordic model (Grönroos, 1984), the model of the five gaps developed by Parasuraman et al. (1985), and the SERVQUAL scale (Parasuraman et al., 1988, 1994a, 1994b); likewise there is another trend oriented to recognize only the percep-tion as a determinant for assessing the quality of any service. This trend is considered unnecessary to compare perceptions with expectations; taking into account the latter, in most cases is above the perception of service performance by the client; this concept originated the SERVPERF scale (Cronin & Taylor, 1992) and model RSQS – Retail Service Quality Scale (Dabholkar et al., 1996), among others.
Measuring the perceived quality of service is developed from the research conducted by Parasuraman, Zeithaml, and Berry, who created the model of the five discrepancies (gaps) and the SERVQUAL measuring instrument.
SERVQUAL is a concise multi-item scale with good reli-ability and validity, which service companies can use to improve the understanding of the perceptions and expec-tations of service and as a result to improve the service. The instrument has been designed to be applied to a wide range of services. As it is, provide a basic skeleton through the expectations and perceptions formats covering items for each of the five dimensions of service quality. The mod-el can be adapted or supplemented to fit the characteris-tics or specific research needs of a particular organization (Parasuraman et al., 1988).

J O U R N A L
R E V I S T A
INNOVAR
173REV. INNOVAR VOL. 21, NÚM. 41, JULIO-SEPTIEMBRE DE 2011
The SERVQUAL scale, being one of the pioneering re-searches in measuring the scale of services–and perhaps the most consulted–has faced many criticisms, which may be summarized as shown by Buttle (1996, p. 10): “Not-withstanding its growing popularity and widespread ap-plication, SERVQUAL has been subjected to a number of theoretical and operational criticisms”
Due to the criticisms and limitations of the scale, pro-posed alternative were presented as follows the revised SERVQUAL scale (Parasuraman et al., 1991a; 1991b), the SERVPERF scale (Cronin & Taylor, 1992), and the Evaluated Performance Model (Teas, 1993).
The concept “ATS (Air Traffic Service)”
The conceptualization of the service ATS (Air Traffic Service) is a large and very technical topic; we will ap-proach some specific aspects of it, beginning with the rationale for providing this service, its definition, objec-tives, classification, regulation, how the aerospace is dis-tributed in Colombia, finishing with the issue of quality in the provision of ATS according to the suggestions or guidelines of the International Civil Aviation Organiza-tion (ICAO).
With the spectacular growth of civil aviation after World War II, the need for an international organization that reg-ulates the aviation activity increased, so as to allow the transport of people and goods safely. The organization mandated international standardization of facilities and services, among others, the services that allow manage-ment and control of aerospace, to prevent each state in-dependently establishing standards and procedures for air navigation, making difficult the usage of their aerospace for international aviation.
As a result of the meetings and talks led by U.S., Allied and neutral countries, in order to normalize international civil aviation, was successfully concluded on December 7, 1944, in Chicago – USA, an agreement on international civil aviation, called the Chicago Convention, giving rise to the International Civil Aviation Organization (ICAO), specialized agency of the United Nations responsible for administering the principles established in the agree-ment, setting rules on aviation safety and its efficiency, consistency and ensuring environmental protection and aviation.
Phenomena such as globalization, technological advanc-es in the aviation industry, and the speed of air trans-portation, have increased the number of air operations worldwide, causing many aircrafts to use the same routes simultaneously, consistent with its high speed perfor-
mance, making it difficult for the pilot to take overall con-trol traffic in areas where he is flying. These situations increase the risk of air navigation, the possibility of colli-sions and near misses between aircrafts. Hence the need for an external service called ATC offered to the crews to ensure safety, maintaining and providing standardized separation of aircrafts, and guidance from the ground, supported by an aviation infrastructure, including commu-nications systems, radars, radio aids, and meteorology ser-vices, among others.
International civil aviation from its beginnings was linked to efforts of many states to standardize their operations and enable peaceful use; finally, with the Chicago Con-vention (1944), the international regulation begins, set-ting standards for safety aviation, as well as efficiency, consistency, and ensuring environmental and aviation pro-tection. Later in the year of 1947 the International Civ-il Aviation Organization (ICAO) emerged as a specialized agency of the United Nations, responsible for administer-ing the principles established in the agreement.
For the specific case of ATS, the ICAO has issued an-nexes and documents in order to regulate the provision of these services; it is important to clarify that both doc-uments and annexes are constantly updated through amendments in accordance with the accelerated evolu-tion of aviation; in the case of our country, the Colom-bian aviation authority grounded in the Annexes to the ICAO established the Colombian Aeronautical Regula-tions –RAC.
ICAO (1984, p. 1) Air Traffic Services has been defined in Annex 11, as being “a generic term meaning various-ly flight information service, alerting service, air traffic advisory service, air traffic control service, area control service, approach control service or aerodrome control service”.
In accordance with paragraph 2.2 of Annex 11 (ICAO, 2001), the objectives of air traffic services are in summa-ry the following: To prevent aircraft collisions; accelerate and maintain an orderly flow of air traffic and provide use-ful advice for safe and effective operation of the flights, notifying the relevant authorities about aircrafts needing search and rescue aid and assist such agencies as needed.
In accordance with paragraph 2.3 of Annex 11 (ICAO, 2001), air traffic services comprise three services, with the following names: 1. Service Air Traffic Control (ATC) to meet the objectives of: Preventing collisions between air-craft; prevent collisions between aircraft on the maneuver-ing area and between them and the obstacles they have in that area, and expediting and maintaining an orderly
174 REV. INNOVAR VOL. 21, NÚM. 41, JULIO-SEPTIEMBRE DE 2011
marketing
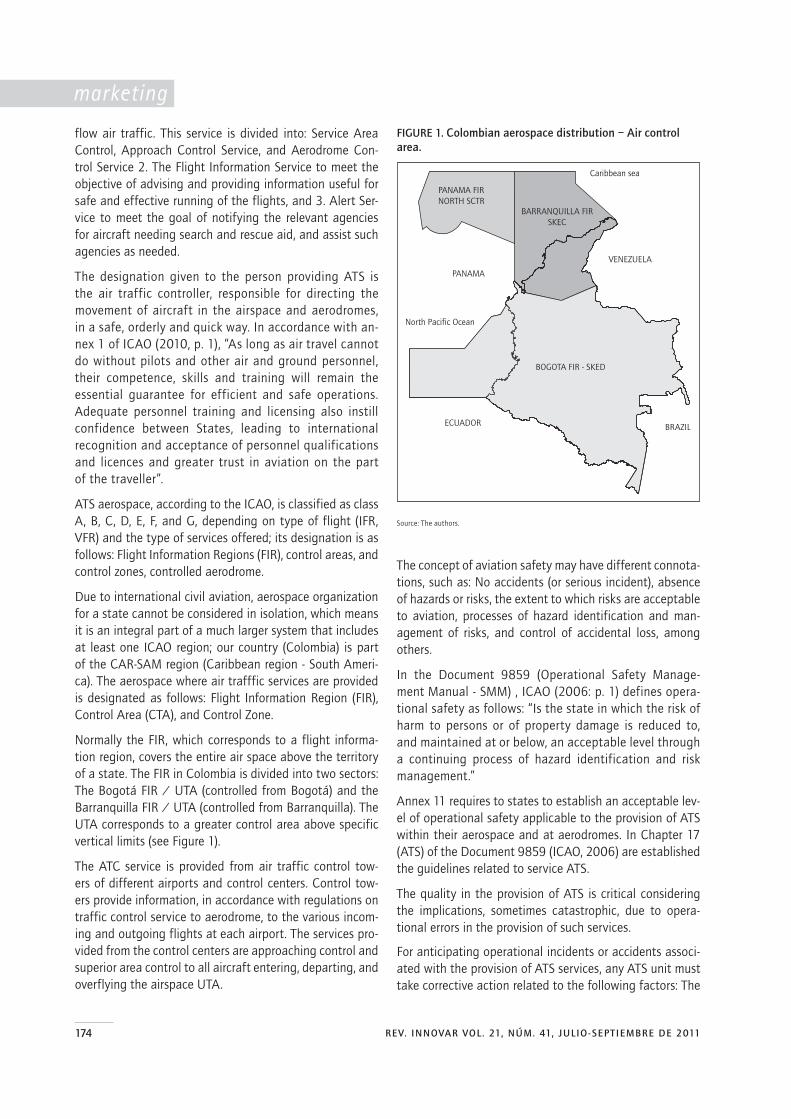
flow air traffic. This service is divided into: Service Area Control, Approach Control Service, and Aerodrome Con-trol Service 2. The Flight Information Service to meet the objective of advising and providing information useful for safe and effective running of the flights, and 3. Alert Ser-vice to meet the goal of notifying the relevant agencies for aircraft needing search and rescue aid, and assist such agencies as needed.
The designation given to the person providing ATS is the air traffic controller, responsible for directing the movement of aircraft in the airspace and aerodromes, in a safe, orderly and quick way. In accordance with an-nex 1 of ICAO (2010, p. 1), “As long as air travel cannot do without pilots and other air and ground personnel, their competence, skills and training will remain the essential guarantee for efficient and safe operations. Adequate personnel training and licensing also instill confidence between States, leading to international recognition and acceptance of personnel qualifications and licences and greater trust in aviation on the part of the traveller”.
ATS aerospace, according to the ICAO, is classified as class A, B, C, D, E, F, and G, depending on type of flight (IFR, VFR) and the type of services offered; its designation is as follows: Flight Information Regions (FIR), control areas, and control zones, controlled aerodrome.
Due to international civil aviation, aerospace organization for a state cannot be considered in isolation, which means it is an integral part of a much larger system that includes at least one ICAO region; our country (Colombia) is part of the CAR-SAM region (Caribbean region - South Ameri-ca). The aerospace where air trafffic services are provided is designated as follows: Flight Information Region (FIR), Control Area (CTA), and Control Zone.
Normally the FIR, which corresponds to a flight informa-tion region, covers the entire air space above the territory of a state. The FIR in Colombia is divided into two sectors: ��������$�����������%��������*��#�����$���������������� �������������%��������*��#�������� ���!�����UTA corresponds to a greater control area above specific vertical limits (see Figure 1).
The ATC service is provided from air traffic control tow-ers of different airports and control centers. Control tow-ers provide information, in accordance with regulations on traffic control service to aerodrome, to the various incom-ing and outgoing flights at each airport. The services pro-vided from the control centers are approaching control and superior area control to all aircraft entering, departing, and overflying the airspace UTA.
FIGURE 1. Colombian aerospace distribution – Air control area.
Source: The authors.
The concept of aviation safety may have different connota-tions, such as: No accidents (or serious incident), absence of hazards or risks, the extent to which risks are acceptable to aviation, processes of hazard identification and man-agement of risks, and control of accidental loss, among others.
In the Document 9859 (Operational Safety Manage-ment Manual - SMM) , ICAO (2006: p. 1) defines opera-tional safety as follows: “Is the state in which the risk of harm to persons or of property damage is reduced to, and maintained at or below, an acceptable level through a continuing process of hazard identification and risk management.”
Annex 11 requires to states to establish an acceptable lev-el of operational safety applicable to the provision of ATS within their aerospace and at aerodromes. In Chapter 17 (ATS) of the Document 9859 (ICAO, 2006) are established the guidelines related to service ATS.
The quality in the provision of ATS is critical considering the implications, sometimes catastrophic, due to opera-tional errors in the provision of such services.
For anticipating operational incidents or accidents associ-ated with the provision of ATS services, any ATS unit must take corrective action related to the following factors: The
Caribbean sea
PANAMA FIRNORTH SCTR
BARRANQUILLA FIRSKEC
PANAMA
VENEZUELA
North Pacific Ocean
BOGOTA FIR - SKED
ECUADOR BRAZIL

J O U R N A L
R E V I S T A
INNOVAR
175REV. INNOVAR VOL. 21, NÚM. 41, JULIO-SEPTIEMBRE DE 2011
training of human resources (improvement of aeronautical phraseology, English language proficiency, training simula-tor, improvement of staff communications, etc.), teamwork, and customer service feedback.
According to ICAO (2002), Quality Assurance is a dynamic process used to continually improve an ATS. Although the quality of service continue to be measured by any method of historical data, such as the number of ATS incidents, delays, feedback from employees and customers, we also must recognize factors that cannot be measured so quick-ly. The success of the quality assurance effort depends on �������+�����������/�����������������������/�<=�����-pendently and collectively, must strive to provide the best possible service.
In order to identify and correct deficiencies in the ATS provision, before the occurrence of an incident or ac-cident, in the Third Regional Air Navigation Caribbe-�����/� ���#������� %����/�<�>������ ���� �����Aires, Argentina (October 1999) was addressed the issue of quality assurance programs in ATS. As a re-sult, ICAO (2001) developed a regional guidance ma-�����������/�<�*���� ������� ������������#��*���ATS.
Methodology
The methodology applied consist of the applications of techniques to collect information from primary sources: Ex-ploratory interviews with experienced personnel–air traf-fic controllers and pilots–and secondary sources such as books, journals, ICAO publications, magazines, and Inter-net, among others.
For the specific case of marketing of the service, revisions to several journals such as Journal of Marketing, Journal of Marketing Research, European Journal of Marketing, Journal of Consumer Marketing, Journal of Service Mar-keting, European Journal of Information Systems, among others, were made; searches were performed under the following parameters: Quality measure, Service Quality, Perceived Service Quality, Measure Service, and Service Quality performance. The usage of databases such as: Em-����=�?/�@�=�/�������X����=�Y�����/�����=������[[[���IEE Electronic Library, among others. Likewise the librar-ies of the following universities: Fundación Universidad del Norte (Barranquilla), and National University of Co-lombia at its headquarters in Bogota and Medellin were researched.
For the specific case of ATS, revisions were made to various publications of the ICAO in the 2010 catalog of publica-tions and on its website (www.icao.int).
ICAO documents and the Colombian aviation authority documents were consulted also in the library of the Centro de Estudios Aeronáuticos (CEA) of the Unidad Administra-tiva Especial de la Aeronáutica Civil in the city of Bogota and on its website (www.aerocivil.gov.co).
Likewise, the following databases: Emerald, JSTOR, Sci-ence Direct, Google Scholar, Academic Search Compete, Business Source Complete were searched using the follow-ing parameters: Air Traffic Service (ATS), Air Traffic Service Quality, Air Traffic Service Measurement, Air Traffic Con-trol (ATC), Air Quality Traffic Control, Air Traffic Control Measurement.
After performing all the searches and consultations men-tioned it was found that there is not a measurement in-strument or scale to measure the perceived quality of ATC services, based on the discipline of marketing the service.
Through the process of measurement we can obtain some quantifiable knowledge about the characteristics of a con-cept, a construct or latent variable (which is not directly observable in a given time)1, such as market trends, the quality of a product or behavior of organizational design variables in response to the conditions imposed by contex-tual factors. Thus, measuring a phenomenon is essential for any scientific activity because numbers (values) are as-signed to the observed objects in a way that adequately represents the characteristics they have (Nunally & Bern-stein, 1995).
Considering the criticism and alternative scales to SERVQUAL and the high levels of standardization of ATC services, we will use as the basis for the construction of the instrument to measure the perceived quality of these ser-vices, the scale SERVPERF proposed by Cronin and Taylor (1992), which confirms the dimensionality of service quali-ty proposed by Parasuraman et al. (1988), given the conve-nience and methodological aspects of operationalization of this scale, and the fact that the concept of perceived service quality is considered by many authors even by the same authors of the SERVQUAL scale, as an attitude.
The methodology for the construction of the instrument used to measure the perceived quality of ATC services and the stage of empirical testing of its reliability and con-struct validity is presented in Table 1, based on the rec-ommendations suggested by Churchill (1979) and used by Parasuraman, Zeithaml, and Berry in the construction of the SERVQUAL scale.
In general, the methodology is summarized in two main stages: The structure, culminating in the development of
1 Our parethesis.

176 REV. INNOVAR VOL. 21, NÚM. 41, JULIO-SEPTIEMBRE DE 2011
marketing
the questionnaire for data processing, and verification, which aims to show empirical evidence of reliability and validity of the scale proposed.
The structure of the Analysis Model
Whereas this study is a quantitative research, the goal of this phase of the methodology is to determine the dimen-sions that characterize the service of air traffic control and attributes through which we can quantify the perceived quality of the service (items’ generation) and the develop-ment of the questionnaire for data collection; this stage is key to the construction of the instrument or measurement scale.
Generate sample of items. In general, in theoretical models a set of relationships between variables not directly ob-servable and measurable of reality is posed, but they can be presented through a set of manifest variables, items or indicators. Thus “a measurement scale is a set of items, phrases or questions to measure the level reached by a particular attribute or concept is not directly observable in an object” (Vila et al., 2000: p. 1).
As suggested by Hayes (1999, p. 10), there are “two meth-ods designed to identify important dimensions of quality of products or services. The first method is the establish-ment of quality dimensions, an approach that requires the supplier to set the dimensions of the quality of your service or product. The second method is based on critical inci-dents (Flanagan, 1954) and involves clients in determin-ing the dimensions of quality.” It is also stated, consistent with the above, that “we consider the needs of the client as the characteristics of the product or service that repre-sent important dimensions.” On his side, Quivy (2006, P. 117) argues that “there are two ways of structuring a con-cept, each corresponding to a different level of conceptua-lization, one is inductive and produce ‘operational concept
isolated’, the other is deductive and make ‘systematic con-cepts’ ”. Defining the concept isolated operating as a struc-tured concept empirically from direct observations or other information collected. Through readings and interviews from the exploration phase meet the necessary elements for such structuring; and the system concept as a concept is not induced by experience; it is structured by abstract reasoning: deduction, analogy, opposition, involvement, etc., although necessarily inspire the behavior of real ob-jects and previously acquired knowledge on these objects.
Hayes (1999) recommends group interviews or individual interviews to obtain indicators; for individual interviews suggests a number of 10 to 20 people, recommending a higher number to compensate for deficiencies in each ap-proach that really needs to characterize the service and to achieve a correct dimensionality of the service.
The generation of samples of items was based on concep-tualizing perceived service quality, in the conceptualization and ATS regulations, and in the open exploratory interviews conducted in the preliminary design stage, accepting the arguments presented by Hayes (1999) and Quivy (2006). Gorden (1975), comparing interviews with questionnaires, shows the following advantages of the interview: Provides more opportunity to motivate the respondent to supply a complete and accurate information immediately, offering greater flexibility in the formulation of questions and more opportunity to assess the validity of the information, ob-serving non-verbal expressions of the interviewee.
Specifically for this study we used a semi-structured type interview, which is the method used to discern a person’s knowledge about a specific aspect of his daily life. It takes the form of a conversation that revolves around an open questionnaire related to a precise field of research –often the questionnaire only contains the topics addressed (Lé-tourneau, 2007).
TABLE 1. Methodology for the construction of the measurement instrument.
Structure 1The structure of the Analysis Model
1.1 Generate sample of items
1.2 Determination of dimensions
1.3 Content validity
1.4 Preparation of questionnaire for data collection
Verification
2 Observation2.1 Design of the population and sample
2.2 Data collection
3 Data analysis and Results
3.1 Diagram design PATH
3.2
Scale Purification: Calculations of reliability and construct validity, elimination of items with low correlation and whose suppresion increase the Alpha coefficient, verification of the dimensionality of the scale through factorial analysis
3.3 Final adjustment of the scale

J O U R N A L
R E V I S T A
INNOVAR
177REV. INNOVAR VOL. 21, NÚM. 41, JULIO-SEPTIEMBRE DE 2011
In this way, semi-structured interviews were conducted with ten pilots of commercial aircrafts and ten air traffic con-trollers with more than ten years of experience in their re-spective professions. The purpose of the interviews was to determine the perception and needs of the service by drivers –such as direct customers of the service air traffic control, customers using the ATC service provided in the Barranquil-la FIR and the opinion of air traffic controllers of this same aerospace, about the characteristics that an air traffic con-trol service with excellent quality should have, because they are the direct suppliers of the service and also they under-stand the purpose and function of the service itself.
To ensure the quality of the interviews, for reliability and validity of the information collected, suggestions of Létour-neau (2007) related to ethical issues in conexion with the respect to respondents and the characteristics of a good interviewer (listening capacity, ability to engage in harmo-nious conversation, etc.) were implemented. The interview research objectives were revealed to each of the inter-viewees and their approvals were obtained by recording in magnetic media at the beginning of the interview.
Determination of Dimensions. With the participation of an air traffic controller with more than 15 years of expertise the analysis of the 20 interviews was performed. 410 rel-evant prepositions or sentences, some of them with the same meaning, were obtained. These prepositions were categorized or grouped deductively, in the five dimensions of service quality (tangibility, reliability, responsiveness, assurance, and empathy) established by Parasuraman et al. (1985 & 1991a) (SERVQUAL scale). Following the sug-gestion of Hayes (1999), the key to classify the preposi-tions was based on personal discernment and selection of relevant adjectives and verbs that they contain. Later–af-ter having categorized the different prepositions–phrases were written constituting the most representative indica-tors of the category or dimension, with the assistance of the expert air traffic controller.
On the other hand, considering the statements made by Parasuraman et al. (1988) that the SERVQUAL instrument is a multi-item scale concise with good reliability and va-lidity, and that despite being designed for use in a wide range of services, adaptation or supplementation is re-quired to suit the characteristics of a particular service, the revised SERVQUAL scale with each of the 22 items that form it were review and evaluated, eliminating those items that did not apply due to lack of coherence and relevance to the ATC service. In that way, questions (Q) (1, 2, 3, 4, 5, 7, 8,10,13,18, 19, and 20) were eliminated of the scale. The items that really applied to the service were included with-out modifications to the scale construction process; they
were added to the indicators obtained from the inductive process of analysis of the preliminary interviews, giving a list of 27 indicators and 5 dimensions2.
Content validity. Content validity seeks–according to what Devlin et al. (1993) point–that the measuring scale or questionnaire complies with the following characteristics: a) induces a minimal response bias, b) easy to understand and interpret, c) is easily administered or applied in the field, and d) has ability to discriminate (Zapata, 2008). By estimating the content validity we are looking to identify if what is being measured is actually the variable or la-tent construct we are looking to measure (Vila et al., 2000; Martinez & Hernandez, 2006).
Once collected and grouped the attributes in the above dimensions, we proceeded by using the Delphi Method to check the validity of its content; in that way, we developed a format in which the 27 statements were related, propos-ing a Likert-type scale from 1 and 5 to value with a score of 1 meaning “Strongly Disagree” and 5 meaning “Strongly agree” making these statements part of the scale or instru-ment to measure the quality of ATC services, also keeping in mind to have an opening for suggested modifications and ����� ��� ������*���\����#�!����\���� ��� ����##����-tions of Hayes (1999) in the header of the questionnaire we asked the respondents to indicate the degree to which they agree or disagree with the assertions of the questionnaire.
For the development of this exercise 20 experts (commer-cial pilots) were contacted. From those, 17 returned the filled out forms; the forms came with a unanimous score agreeing with the inclusion of the proposed statements in the measuring instrument; for that reason it was not neces-sary to make amendments to the initial set of statements or sending the format (iteration) back to the experts.
Preparation of questionnaire for data collection. As a result of the above, an instrument was developed to measure the perceived quality of ATC services in the Barranquilla FIR, which included the 27 initial claims for assessment, as per-ceived by pilots, proposing a Likert scale from 1 through 7, where a score of 1 is equivalent to “Strongly disagree” and 7 is equivalent to “Strongly Agree” with the statements listed.
At the conclusion of the structuration phase the following hypothesis was proposed:
The proposed scale, based upon the concepts of per-ceived quality of the service and the ATS, has the valid-ity and reliability to measure the perceived quality of the ATC Service.
2 Please contact the authors to get a more detailed description of the instruments employed.
178 REV. INNOVAR VOL. 21, NÚM. 41, JULIO-SEPTIEMBRE DE 2011
marketing
Observation
Design of the population and sample. The sample size in a random sample depends on the behavior of the popula-tion variables measured. To calculate were analyzed three probability distributions: Rectangular Distribution, Normal Distribution, and the Bimodal Distribution. For a categori-cal variable (1 to 7) we have the following results for each set of distributions:
Rectangular Distribution: Assuming a 5% error (e); 95% reliability (�=5% meaning a Z=1.96), the sample size will be 171.
Normal Distribution: Assuming a 5% error (e); 95% reli-ability (�=5% namely Z=1.96), the sample size will be 100.
Bimodal Distribution: Assuming a 5% error (e); 95% reli-ability (�=5% namely Z=1.96), the sample size will be 385.
Considering that there are no previous studies that allow us to asumme a definite behavior of the variable evaluat-ed–and with the purpose of supporting the study in a solid way–we will use as a reference the most critical case (max-imum variance), that will maximixe the size of the sample. In this case scenario the error will be inferior to 5% in the case the variable behaves in a different way.
Under the above premise, we asumme that the population variable has a Bimodal Distribution, meaning that one half of the population is in the lower end of the scale and the other half is at the top.
Data collection. With the support of the Colombian avia-tion authority, the FAC – Colombian Air Force (CACOM 3) and the Caribbean Naval Air Group of the Navy in their air base located in the airport Ernesto Cortissoz of the city of Barranquilla and Air Transport Association of Colombia (ATAC)–which currently has 18 members: ADA, Aerorepúbli-ca, Air France, Aires, Avianca, American Airlines, Continen-tal, COPA, EasyFly, Helicol, Iberia, LAN, Martin, Satin, TACA, Tampa, Delta Airlines, and Aerolineas Argentinas–403 sur-veys were conducted in general with pilots that currently use the ATC services in the Barranquilla FIR. The answers received surpassed the initial calculated sample of 385 sur-veys . Data were analyzed by generating a matrix of 27 x 403 (27 variables and 403 pilots) (See Table 2).
Data analysis and Results
For data analysis software was used Statistical Package for the Social Sciences (SPSS) version 15.0 for Windows, con-sidered the most widely used computerized statistical pro-gram in the social sciences and business market research. Other software used were SAS Version 9 and AMOS ver-
sion 16, through which the psychometric calculations of the reliability scale and construct validity were performed.
TABLE 2. Data collection.
Universe Pilots that use the Air Traffic Control Service in the Barranquilla FIR.
Country Colombia - Costa Norte
Sample size 403
Sample error 5%
Confidence level 95% (�= 5 % namely Z=1.96)
Data collection Structured questionnaire
Date November 22 - 26, 2010
Diagram design PATH: PATH diagram is the most common form of representing the relationships between different items of the scale and the concept that you are seeking to quantify. (Vila et al., 2000). The proposed model to mea-sure the perceived quality of the Air Traffic control service (ATC) is shown in Figure 2.
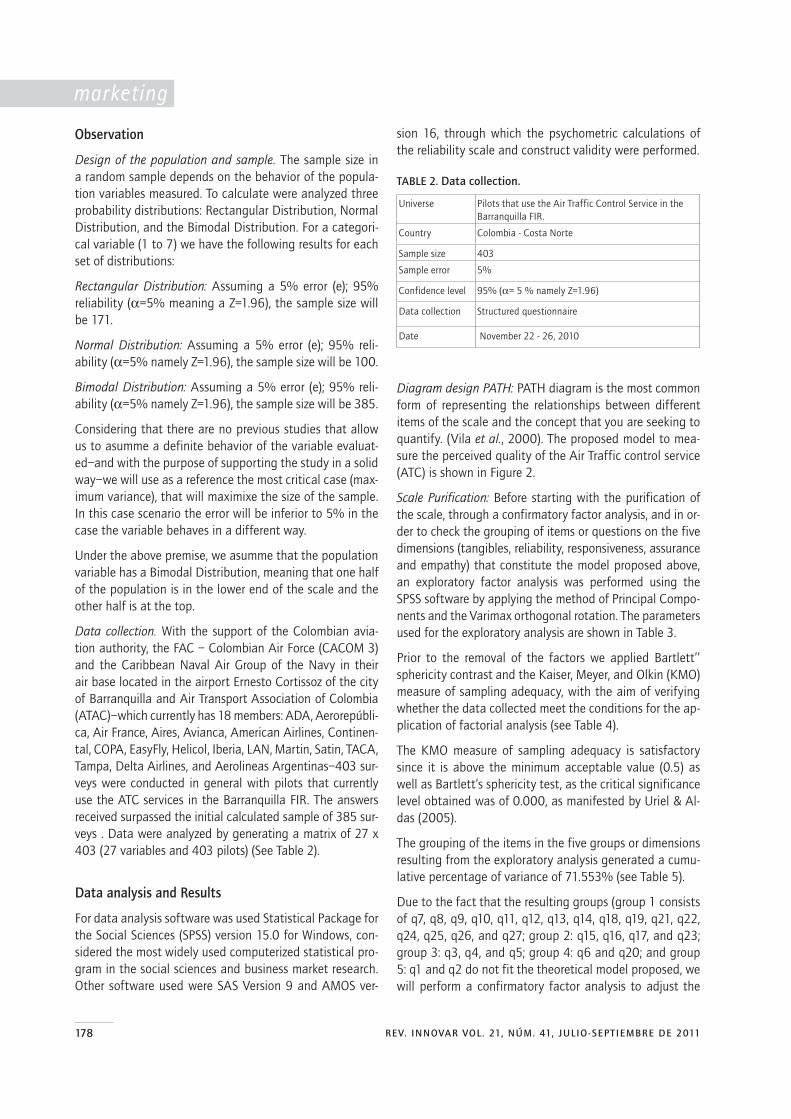
Scale Purification: Before starting with the purification of the scale, through a confirmatory factor analysis, and in or-der to check the grouping of items or questions on the five dimensions (tangibles, reliability, responsiveness, assurance and empathy) that constitute the model proposed above, an exploratory factor analysis was performed using the SPSS software by applying the method of Principal Compo-nents and the Varimax orthogonal rotation. The parameters used for the exploratory analysis are shown in Table 3.
Prior to the removal of the factors we applied Bartlett’’ sphericity contrast and the Kaiser, Meyer, and Olkin (KMO) measure of sampling adequacy, with the aim of verifying whether the data collected meet the conditions for the ap-plication of factorial analysis (see Table 4).
The KMO measure of sampling adequacy is satisfactory since it is above the minimum acceptable value (0.5) as well as Bartlett’s sphericity test, as the critical significance level obtained was of 0.000, as manifested by Uriel & Al-das (2005).
The grouping of the items in the five groups or dimensions resulting from the exploratory analysis generated a cumu-lative percentage of variance of 71.553% (see Table 5).
Due to the fact that the resulting groups (group 1 consists of q7, q8, q9, q10, q11, q12, q13, q14, q18, q19, q21, q22, q24, q25, q26, and q27; group 2: q15, q16, q17, and q23; group 3: q3, q4, and q5; group 4: q6 and q20; and group 5: q1 and q2 do not fit the theoretical model proposed, we will perform a confirmatory factor analysis to adjust the

J O U R N A L
R E V I S T A
INNOVAR
179REV. INNOVAR VOL. 21, NÚM. 41, JULIO-SEPTIEMBRE DE 2011
data model proposed collected in the observation stage of this research.
We start from a model composed by 27 questions classi-fied as follows:
Tangibility: Q1, Q2, and Q3.
Reliability: Q4, Q5, Q6, Q7, Q8, Q9, Q10, Q11, and Q12.
Responsiveness: Q13, Q14, Q15, Q16, and Q17.
Assurance: Q18, Q19, Q20, Q21, Q22, Q23, and Q24.
Empathy: Q25, Q26, and Q27.
Reliability of each one of the dimensions of the scale was calculated, in accordance with Cronbach (1951); the re-sults obtained through the SPSS are shown in the Table 6.
From the results obtained a satisfactory internal consisten-cy is inferred because the indices calculated are above 0.7 as stated by Hair et al. (1999).
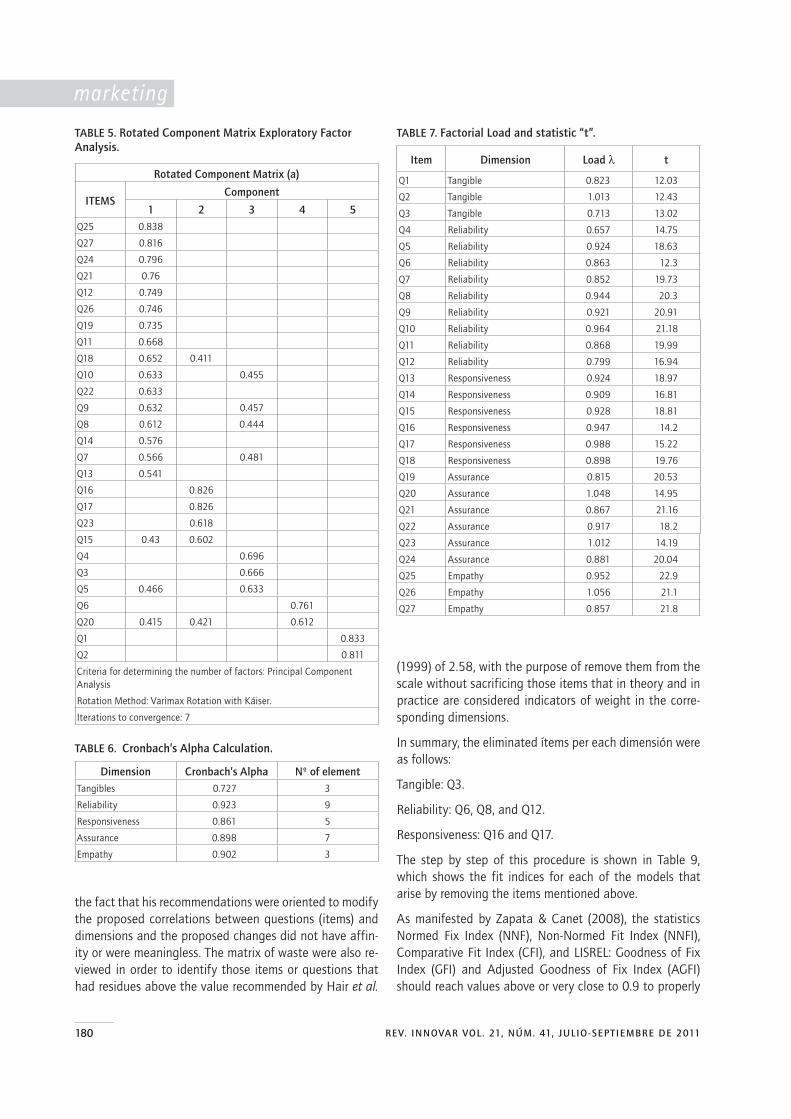
In order to test the construct validity, we conducted a con-firmatory factor analysis via AMOS V16 software with the purpose of check the fit of the proposed model; the factor loadings of each of the items and the value of the statistic “t” are shown in Table 7 and values of the adjustment indi-ces are shown in Table 8.
In conducting the t test of the factor loadings of the items that measure each of the latent variables or constructs, it appears that they are loaded positively and significantly on the construct and its value is greater than 0.4 as recom-mended by Hair et al. (1999); however, signs of adjustment are below the values considered acceptable –this is the reason why we did not consider them satisfactory for the convergent validity of the scale.
With the object of improve the fit indices, we proceeded to evaluate the recommendations given by the statistical packages, through Lagrange multipliers, but ultimately we did not take into account their recommendations to modi-fy the theoretical structure of the proposed model, due to
FIGURE 2. Proposed model to measure the perceived quality of the Air Traffic Control Service (ATC).
Source: The authors.
TABLE 3. Parameteres used for the exploratory analysis.
Input
Data E:\Tabulated surveysample403.sav
Active data set Active data1
Number of rows of the working file
403
_�����`[/�{|}}}!!�{~���{�����������`�X[���<@���_�[�������@���@����@���/�@�[
Sintaxis ��@�<���/@����`����%!��
�����[��������@�/�%����[���[�%~��
�[�������@��{�
�����[������[���[�%~��
��@����@��_���<��
�<[��@X��@��[`���@�!
TABLE 4. KMO indicator and Bartlett test results.
KMO and Bartlett test
Kaiser, Meyer, and Olkin measure of sampling adequacy 0.964
Bartlett’s spherici-ty test
Chi-cuadrado aproximado 8.648.692
Gl 351
Sig. 0
Tangibles ReliabilityRespon-siveness
Assurance Empathy
Q1 Q2 Q3 Q4 Q5 Q6 Q7 Q8 Q9 Q10 Q11 Q12 Q13 Q14 Q15 Q16 Q17 Q18 Q19 Q20 Q21 Q22 Q23 Q24 Q25 Q26 Q27
E1 E2 E3 E4 E5 E6 E7 E8 E9 E10 E11 E12 E13 E14 E15 E16 E17 E18 E19 E20 E21 E22 E23 E24 E25 E26 E27
180 REV. INNOVAR VOL. 21, NÚM. 41, JULIO-SEPTIEMBRE DE 2011
marketing
the fact that his recommendations were oriented to modify the proposed correlations between questions (items) and dimensions and the proposed changes did not have affin-ity or were meaningless. The matrix of waste were also re-viewed in order to identify those items or questions that had residues above the value recommended by Hair et al.
(1999) of 2.58, with the purpose of remove them from the scale without sacrificing those items that in theory and in practice are considered indicators of weight in the corre-sponding dimensions.
In summary, the eliminated ítems per each dimensión were as follows:
Tangible: Q3.
Reliability: Q6, Q8, and Q12.
Responsiveness: Q16 and Q17.
The step by step of this procedure is shown in Table 9, which shows the fit indices for each of the models that arise by removing the items mentioned above.
As manifested by Zapata & Canet (2008), the statistics Normed Fix Index (NNF), Non-Normed Fit Index (NNFI), Comparative Fit Index (CFI), and LISREL: Goodness of Fix Index (GFI) and Adjusted Goodness of Fix Index (AGFI) should reach values above or very close to 0.9 to properly
TABLE 5. Rotated Component Matrix Exploratory Factor Analysis.
Rotated Component Matrix (a)
ITEMSComponent
1 2 3 4 5Q25 0.838
Q27 0.816
Q24 0.796
Q21 0.76
Q12 0.749
Q26 0.746
Q19 0.735
Q11 0.668
Q18 0.652 0.411
Q10 0.633 0.455
Q22 0.633
Q9 0.632 0.457
Q8 0.612 0.444
Q14 0.576
Q7 0.566 0.481
Q13 0.541
Q16 0.826
Q17 0.826
Q23 0.618
Q15 0.43 0.602
Q4 0.696
Q3 0.666
Q5 0.466 0.633
Q6 0.761
Q20 0.415 0.421 0.612
Q1 0.833
Q2 0.811
Criteria for determining the number of factors: Principal Component Analysis
Rotation Method: Varimax Rotation with Káiser.
Iterations to convergence: 7
TABLE 6. Cronbach’s Alpha Calculation.
Dimension Cronbach’s Alpha Nº of elementTangibles 0.727 3
Reliability 0.923 9
Responsiveness 0.861 5
Assurance 0.898 7
Empathy 0.902 3
TABLE 7. Factorial Load and statistic “t”.
Item Dimension Load � t
Q1 Tangible 0.823 12.03
Q2 Tangible 1.013 12.43
Q3 Tangible 0.713 13.02
Q4 Reliability 0.657 14.75
Q5 Reliability 0.924 18.63
Q6 Reliability 0.863 12.3
Q7 Reliability 0.852 19.73
Q8 Reliability 0.944 20.3
Q9 Reliability 0.921 20.91
Q10 Reliability 0.964 21.18
Q11 Reliability 0.868 19.99
Q12 Reliability 0.799 16.94
Q13 Responsiveness 0.924 18.97
Q14 Responsiveness 0.909 16.81
Q15 Responsiveness 0.928 18.81
Q16 Responsiveness 0.947 14.2
Q17 Responsiveness 0.988 15.22
Q18 Responsiveness 0.898 19.76
Q19 Assurance 0.815 20.53
Q20 Assurance 1.048 14.95
Q21 Assurance 0.867 21.16
Q22 Assurance 0.917 18.2
Q23 Assurance 1.012 14.19
Q24 Assurance 0.881 20.04
Q25 Empathy 0.952 22.9
Q26 Empathy 1.056 21.1
Q27 Empathy 0.857 21.8
J O U R N A L
R E V I S T A
INNOVAR
181REV. INNOVAR VOL. 21, NÚM. 41, JULIO-SEPTIEMBRE DE 2011
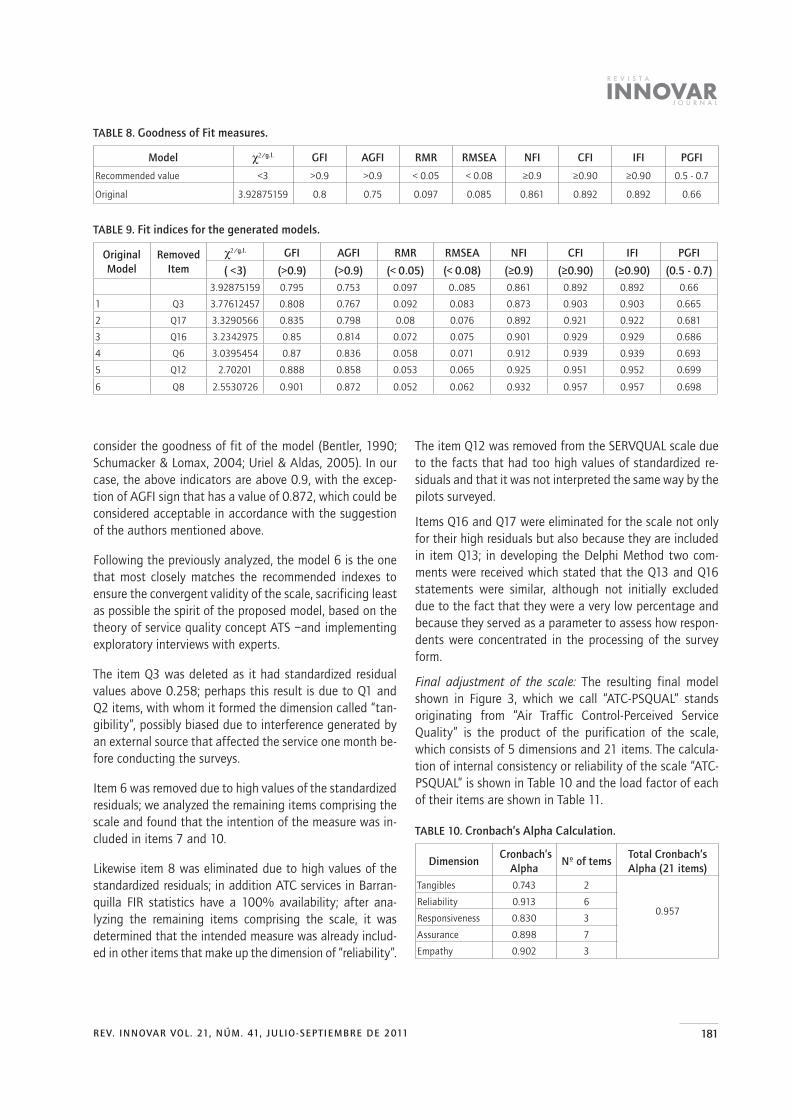
consider the goodness of fit of the model (Bentler, 1990; Schumacker & Lomax, 2004; Uriel & Aldas, 2005). In our case, the above indicators are above 0.9, with the excep-tion of AGFI sign that has a value of 0.872, which could be considered acceptable in accordance with the suggestion of the authors mentioned above.
Following the previously analyzed, the model 6 is the one that most closely matches the recommended indexes to ensure the convergent validity of the scale, sacrificing least as possible the spirit of the proposed model, based on the theory of service quality concept ATS –and implementing exploratory interviews with experts.
The item Q3 was deleted as it had standardized residual values above 0.258; perhaps this result is due to Q1 and Q2 items, with whom it formed the dimension called “tan-gibility”, possibly biased due to interference generated by an external source that affected the service one month be-fore conducting the surveys.
Item 6 was removed due to high values of the standardized residuals; we analyzed the remaining items comprising the scale and found that the intention of the measure was in-cluded in items 7 and 10.
Likewise item 8 was eliminated due to high values of the standardized residuals; in addition ATC services in Barran-quilla FIR statistics have a 100% availability; after ana-lyzing the remaining items comprising the scale, it was determined that the intended measure was already includ-ed in other items that make up the dimension of “reliability”.
The item Q12 was removed from the SERVQUAL scale due to the facts that had too high values of standardized re-siduals and that it was not interpreted the same way by the pilots surveyed.
Items Q16 and Q17 were eliminated for the scale not only for their high residuals but also because they are included in item Q13; in developing the Delphi Method two com-ments were received which stated that the Q13 and Q16 statements were similar, although not initially excluded due to the fact that they were a very low percentage and because they served as a parameter to assess how respon-dents were concentrated in the processing of the survey form.
Final adjustment of the scale: The resulting final model shown in Figure 3, which we call “ATC-PSQUAL” stands originating from “Air Traffic Control-Perceived Service Quality” is the product of the purification of the scale, which consists of 5 dimensions and 21 items. The calcula-tion of internal consistency or reliability of the scale “ATC-PSQUAL” is shown in Table 10 and the load factor of each of their items are shown in Table 11.
TABLE 10. Cronbach’s Alpha Calculation.
Dimension Cronbach’s
AlphaNº of tems
Total Cronbach’s Alpha (21 items)
Tangibles 0.743 2
0.957Reliability 0.913 6
Responsiveness 0.830 3
Assurance 0.898 7
Empathy 0.902 3
TABLE 8. Goodness of Fit measures.
Model �2/g.l. GFI AGFI RMR RMSEA NFI CFI IFI PGFI
Recommended value <3 >0.9 >0.9 < 0.05 < 0.08 ��!� ��!�� ��!�� 0.5 - 0.7
Original 3.92875159 0.8 0.75 0.097 0.085 0.861 0.892 0.892 0.66
TABLE 9. Fit indices for the generated models.
Original Model
Removed Item
�2/g.l. GFI AGFI RMR RMSEA NFI CFI IFI PGFI
( <3) (>0.9) (>0.9) (< 0.05) (< 0.08) ������ ������� ������� (0.5 - 0.7) 3.92875159 0.795 0.753 0.097 0..085 0.861 0.892 0.892 0.66
1 Q3 3.77612457 0.808 0.767 0.092 0.083 0.873 0.903 0.903 0.665
2 Q17 3.3290566 0.835 0.798 0.08 0.076 0.892 0.921 0.922 0.681
3 Q16 3.2342975 0.85 0.814 0.072 0.075 0.901 0.929 0.929 0.686
4 Q6 3.0395454 0.87 0.836 0.058 0.071 0.912 0.939 0.939 0.693
5 Q12 2.70201 0.888 0.858 0.053 0.065 0.925 0.951 0.952 0.699
6 Q8 2.5530726 0.901 0.872 0.052 0.062 0.932 0.957 0.957 0.698

182 REV. INNOVAR VOL. 21, NÚM. 41, JULIO-SEPTIEMBRE DE 2011
marketing
TABLE 11. Load Factorial and statistic “t” (adjusted model).
Ítem Dimensión Carga � t
Q1 Tangibles 0.957 14.257
Q2 Tangibles 1.139 14.203
Q4 Reliability 0.661 14.814
Q5 Reliability 0.928 18.676
Q7 Reliability 0.835 19.087
Q9 Reliability 0.915 20.631
Q10 Reliability 0.976 21.510
Q11 Reliability 0.868 19.898
Q13 Responsiviness 0.950 19.671
Q14 Responsiviness 0.943 17.683
Q15 Responsiviness 0.885 17.524
Q18 Responsiviness 0.894 19.631
Q19 Assurance 0.816 20.587
Q20 Assurance 1.043 14.873
Q21 Assurance 0.871 21.319
Q22 Assurance 0.917 18.183
Q23 Assurance 0.999 13.973
Q24 Assurance 0.884 20.146
Q25 Empathy 0.956 23.067
Q26 Empathy 1.055 21.070
Q27 Empathy 0.854 21.676
The Cronbach reliability indices of the scale ATC-PSQUAL are met in a satisfactory manner, which allows us to in-fer that the scale has sufficient reliability to measure per-ceived service quality of air traffic control; for the above mentioned there was not necessary to remove items from the scale, using as parameters the correlation item – total items suggested by Churchill and applied by Parasuraman et al. (1988). Although the tangibility dimension has two items, internal consistency is satisfactory, indicating that Q1 and Q2 items are strongly correlated.
Conclusions
In general aviation is characterized by its high standards of quality, from the manufacture of components, instrumen-tation, aircraft, telecommunications systems, etc., includ-ing the processes involved in the diversity of services that make up this transport sector. The quality with which the ATS is provided is no exception, playing a leading role in safety, making it necessary to have measurement tools to evaluate not only quantitative parameters, such as delays, number of incidents per period, availability, and reliability of aircraft equipment, but also qualitative parameters such as the quality of the service expected or perceived by the different users of this service.
Given the importance of providing excellent ATC service due to its strong impact on operational safety, develop-ing a way to evaluate how to measure the quality of how these services are provided became necessary. The explo-ration phase of this research proved that an instrument based on the marketing of the service to measure the perceived quality of ATC service did not exist. This result confirms the need to undertake this study whose main ob-jective was:
To measure the perceived quality of the ATC Service.
The methodology used for the construction of the measur-ing instrument and empirical testing of its reliability and validity was based on the recommendations suggested by Churchill (1979) and used by Parasuraman, Zeithaml, & Berry in the construction of the SERVQUAL scale.
As a result of the structuring stage came a model for mea-suring perceived quality of ATC service based on the the-ory of marketing the service, the ATS concept and content validity of the concepts supported by experts (pilots and
FIGURE 3. ATC-PSQUAL scale.
Source: The authors.
Tangibles ReliabilityRespon-siveness
Assurance Empathy
Q1 Q2 Q4 Q5 Q7 Q9 Q10 Q11 Q13 Q14 Q15 Q18 Q19 Q20 Q21 Q22 Q23 Q24 Q25 Q26 Q27
E1 E2 E4 E5 E7 E9 E10 E11 E13 E14 E15 E18 E19 E20 E21 E22 E23 E24 E25 E26 E27

J O U R N A L
R E V I S T A
INNOVAR
183REV. INNOVAR VOL. 21, NÚM. 41, JULIO-SEPTIEMBRE DE 2011
air traffic controllers). The attributes or items that make up the proposed model were grouped into five (5) dimen-sions (tangibility, reliability, responsiveness, assurance and empathy) empirically supported by Parasuraman et al., (1998) and Cronin & Taylor (1992). Considering the criti-cisms made of the SERVQUAL scale and before the highly suspected of standardization of ATC services, was used as the basis for the construction of the instrument to measure perceived quality, the scale SERVPERF of Cronin and Taylor (1992), given its convenience and methodological aspects of operationalization, based on the fact that the perceived service quality concept is considered by many authors, even by the authors of the SERVQUAL scale, as an attitude.
In the observation phase of data collection was conduct-ed through the diligence of 403 questionnaires (proposed model, the product of methodological structuring phase), by pilots who use the ATC service in the Barranquilla FIR.
The reliability and construct validity of the proposed model was calculated with the AMOS statistical package SPSS version 16 and version 15. Although the internal consis-tency or reliability of the proposed model was successful, achieving Cronbach’s Alpha values above recommended values (tangibility: 0727; reliability: 0923; responsiveness: 0861; assurance : 0898 and empathy: 0902), the explor-atory factor analysis did not conform to the theoretical model, hence the need to run a confirmatory factor analy-sis using AMOS v16 to adjust the theoretical model to the data collected in the observation stage. The goodness of fit indices resulting from the confirmatory analysis of the theoretical model were below recommended levels, still not satisfactory for the convergent validity of the scale. Then, in order to improve the fit indices, we proceeded to eval-uate the recommendations given by the statistical pack-ages, through Lagrange multipliers, but ultimately did not take into account his recommendations and modified the theoretical structure of the proposed model; the proposed correlations between questions (items) and dimensions had no affinity or no sense, so we had to rely in the use of the matrix of the residues to identify those items or ques-tions that had residues above the value recommended by Hair et al. (1999), to remove them from the scale, as long as those items are not sacrificed in the theory and practice, and are considered indicators of weight in the dimensions that make up the perceived quality of service. The result of this process was the removal of items Q3, Q6, Q8, Q12, Q16 and Q17, reaching a model whose fit indices are sat-isfactory, implying a construct validity (�~��!!: 2.5530726; GFI: 0.901; AGFI: 0.872; RMR: 0.052; RMSEA: 0.062; NFI: 0.932; CFI: 0.957; IFI: 0.957; PGFI: 0.698). Then we made the calculation of the reliability of the model (Cronbach’s
Alpha coefficient) for each of the five dimensions giving the following satisfactory results (tangibility: 0743; Reli-ability: 0.913; Responsiveness: 0.830; Assurance: 0.898; Empathy: 0.902).
After the psychometric calculations were completed in the research of the present study, we concluded that the scale of the proposed instrument, which we called “ATC-PSQUAL,” has reliability and the validity of the construct with empirical evidence, corroborating the hypothesis stat-ed: “The proposed scale, based on the concepts of per-ceived quality of service and the ATS, has the reliability and validity for measuring perceived service quality of air traffic control in the Barranquilla FIR” in compliance with our overall objective. Additionally, as an aggregate contri-bution of the research, the dimensions that characterize the service were determined –and we also verified that the per-ceived service quality is a multidimensional construct.
To improve the quality of the air traffic control service pro-vided for any global ATC, it is necessary to measure not only the quantitative results of this service, but to measure the qualitative aspects too; the ATC-PSQUAL scale creat-ed allow to measure the perceived quality of ATC services from point of view of the customers; this scale is a valuable contribution to aviation because allow researchers to get knowledge from the customer’s perspective in each of the dimensions that make up the scale. The information ob-tained from the scale provide valuable information to de-termine the strengths, weaknesses and critical conditions of service, and can be used as a tool to develop strate-gies aimed at strengthening aviation safety through hu-man talent (groups of air traffic controllers), investments in technology, improving relationships with customers (pilots, airlines, associations, etc.), and maintenance of aviation in-frastructure, among others.
Under the consideration that this study is pioneering in the aviation sector in Colombia and possibly worldwide, this work becomes a benchmark for future research, within which we might suggest, creating scales to measure the perceived quality of services flight information and alert-ing services, tools that might allow, together with ATC-PSQUAL scale, measuring the perceived overall quality of ATS.
ReferencesAnderson, Carl, R. & Zeithaml, V. (1984). Stage of the Product Life Cycle,
Business Strategy and Business Performance. Academy of Man-agement Journal, 27 (1), 5-24.
Bentler, P. (1990). Comparative Fit Indexes in Structural Models. Psy-chological Bulletin, 107 (2), 238-246.

184 REV. INNOVAR VOL. 21, NÚM. 41, JULIO-SEPTIEMBRE DE 2011
marketingBou, J.C. (1997). Influencia de la calidad percibida sobre la competitivi-
dad: analisis de los efectos via “demanda”. Tesis Doctoral no pub-licada, Dpto. de Administración de Empresas y Marketing, Univer-sitat Jaume I, Castellón.
Brown, S.W. & Swartz, T.A. (1989). A gap analysis of the professional service quality. Journal of Marketing, 53, 92-98.
Buttle, F. (1996). SERVQUAL: Review, critique, research agenda. Euro-pean Journal of Marketing, 30 (1), 8-32.
Casino, A. (1999). Medición de calidad de servicio. Una aplicación a los establecimientos de alojamiento turístico. En Turismo. Orga-nización administrativa, calidad de servicios y competitividad em-presarial, Blanquer D. (Dtor.). I Congreso Universitario de Turismo: Tirant Lo Blanch, Valencia.
Carman, J.M. (1990). Consumer perceptions of service quality: An as-sessment of the servqual dimensions. Journal of Retailing, 69, 127-139.
Churchill, G.A. (1979). A paradigm for developing better measures of marketing constructs. Journal of Marketing Research, XVI, 64- 73.
Cristobal, E. (2002). Conceptualizacion de la calidad de servicio al cliente percibida en el comercio electrónico. Evaluación y apli-cación en el establecimiento virtual. Tesis Doctoral, Universidad de Lleida.
Cronbach, L. (1951). Coefficient alpha and the internal structure of tests. Psycometrika, 16, 297-334.
Cronin, J. & Taylor, S.A. (1992). Measuring service quality: A reexamina-tion and extension. Journal of Marketing, 56, 55-68.
Crosby, P. (1979). Quality is Free: The Art of Making Quality Certain, New York: New American Library.
Dabholkar, P., Thorpe, D., & Rentz, J. (1996). A measure of service qual-ity for retail stores: Scale development and validation. Journal of the Academy of Marketing Science, 24 (1), 3-16.
Dodds, W.B. & Monroe, K.B. (1985). The Effect of Brand and Price Infor-mation on Subjective Product Evaluations. Advances in Consumer Research, 12, pp. 85-90.
Duque, E. J. (2006). Revisión del concepto de calidad percibida del ser-vicio en internet. Trabajo de Investigación. Universidad de Valen-cia, Facultad de Ciencias Económicas y Administrativas.
Eiglier, P. & Langeard, E.(1989). Servuccion. El marketing de servicios. Ed. Mc-Graw Hill, Madrid.
Fisk, R.P., Brown, S.W., & Bitner, M.J. (1993). Tracking the evolution of the services marketing literature. Journal of Retailing, 69, 61-103.
Flanagan, J. C. (1954). The critical incident technique. Psychological Bulletin, 51, 327-358.
Garvin, D.A. (1983) . Quality on the Line. Harvard Business Review, 61,4, p.65-75.
Gil, I., Berenguer, G., Gallarza, M. & Moliner, B. (2004). Calidad, sat-isfaccion y valor del servicio, una revision. Quaderns de treball, #152.
Gorden, R.L. (1975). Interviewing Strategy, techniques and tactics. Il-linois, Dorsey press.
Grönroos, C. (1984). A service quality model and its marketing implica-tions. European Journal of Marketing, 18 (4).
Grönroos, C. (1994). Marketing y gestión de servicios: la gestión de los momentos de la verdad y la competencia en los servicios. Madrid, Editorial Díaz de Santos.
Hair, J., Anderson, R., Tatham, R. & Black, W. (1999). Análisis Multivari-ante. Madrid: Prentice Hall.
Hayes, B. E. (1999). Cómo medir la satisfacción del cliente. Oxford Uni-versity Press. México.
Holbrook, M. & Corfman, K. (1985). Quality and value in the consump-tion experience: Phaedrus rides again. In J.Jacoby and J. Olson (Eds.) Perceived Quality. Lexington, MA: Lexington Books, 31-51.
���@!�%|����!�������**�������������������#�� �!�X�����~������~�!�International civil aviation organization, Montreal.
ICAO. (2001). Annex 11. Air traffic services. International civil aviation organization, Montreal.
���@!� %~��|�!� <������ ��� ����������� �������� ����/�<� ����� ���-gramas de garantía de calidad de servicio de tránsito aéreo. Inter-national civil aviation organization, Montreal.
ICAO. (2002). Primera Reunion de Directores de Aviacion Civil de la Re-������������%����X���|�!�������������������������������+�-tion. Gran Caimán, Islas Caimanes 8 al 11 de octubre del 2002
���@!�%~����!�/�*���#�����#���#�� ��%/<<�!�X��������������!�International civil aviation organization, Montreal.
ICAO. (2010). The Convention on International Civil Aviation. Annexes 1 to 18. International civil aviation organization, Montreal.
Létourneau, J. (2007). La caja de herramientas del joven investigador – Guia de iniciacion al trabajo intelectual, La carreta editors E.U.
Lloréns, F. J. & Fuentes, M. M. (2005). Gestión de la calidad empresarial. Fundamentos e implantación. Editorial Pirámide, Madrid.
Martínez, L., Ángel & Hernández, E. M. (2006). La Fiabilidad y la Validez en las Escalas de Medida de Modelos de Dirección de Operacio-nes. XVI Congreso Nacional de ACED, Valencia, España.
Nunnally, J.C. & Bernstein, I.J. (1995). Teoría psicométrica. México: Mc-Graw Hill
Oliver, R.L. (1980). A cognitive model of the antecedents and conse-quences of satisfaction decisions. Journal of Marketing Research, 17, 460-69.
Parasuraman, A., Berry, L., & Zeithaml, V. (1991a). Refinement and re-assessment of the SERVQUAL scale. Journal of Retailing, 67, (4), 420-450.
Parasuraman, A., Berry, L., & Zeithaml, V. (1991b). Understanding cus-tomer expectations of service. Sloan Management Review, 32, 39-48.
Parasuraman, A., Zeithaml, V., & Berry, L. (1985). A conceptual model of service quality and its implications for future research. Journal of Marketing, 49 (4), 41-50.
Parasuraman, A., Zeithaml, V., & Berry, L. (1988). SERVQUAL: A mul-tiple-item scale for measuring consumer perceptions of services quality. Journal of Retailing, 64 (1), 12-40.
Parasuraman, A., Zeithaml, V.A., & Berry, L.L. (1994a). Reassessment of expectations as a comparison standard in measuring service quality: Implications for further research. Journal of Marketing, 58, 111-124.
Parasuraman, A., Zeithaml, V.A., & Berry, L.L. (1994b). Alternative scales for measuring service quality: A comparative assessment based on psychometric and diagnostic criteria. Journal of Retail-ing, 70, 201-230.
Phillips, L. W., Dae R. C. & Buzzell, R. (1983), Product Quality, Cost Posi-tion and Business Performance: A Test of Some Key Hypotheses. Journal of Marketing, 47 (Spring), 26-43.
Quivy, R. (2006). Manual de investigacion en ciencias sociales. Edito-rial Limusa.
Rathmell J.M. (1966). What is Meant by Services?, Journal of Market-ing, 30, 32 -36.
Reeves, C. A. & Bednar, C. A. (1994). Defining quality: Alternatives and implications. Academy of Management Review, 19(pp. 419-445).
Rust, R. & Oliver, R. (1994). Service quality. New directions in the the-ory y practice.

J O U R N A L
R E V I S T A
INNOVAR
185REV. INNOVAR VOL. 21, NÚM. 41, JULIO-SEPTIEMBRE DE 2011
Schumacker, R. & Lomax, R. (2004). A Beginner’s Guide to Structur-al Equation Modeling. Nueva Jersey: Lawrence Erbaum Associ-ates, Inc.
Steenkamp, J.B (1990). Comceptual Model of the Quality Perception Process. Journal of Business Research, Vol 21, 309-333.
Teas, R.K. (1993). Expectations, performance evaluation and customers perceptions of quality. Journal of Marketing, 57, 18-34.
Uriel, E. & Aldas, J. (2005). Análisis Multivariante Aplicado. México: Editorial Thomson.
Vila, N., Kuster, I. & y Aldás, J. (2000). Desarrollo y Validación de Es-calas de
Medidas en Marketing. Quaderns de Treball, 104.
Vázquez, R., Rodríguez, I. & Díaz, A. M. (1996). Estructura multidimen-sional de la calidad de servicio en cadenas de supermercados: desarrollo y validación de la escala Calsuper Oviedo: Facultad de Ciencias Económicas y Empresariales. Universidad de Oviedo. X�� #��������������||����!�
Zapata, R., Canet & Giner, M. (2008). Propuesta metodologica para la construccion de escalas de medicion a partir de una aplicación empirica. Revista electrónica actualidades investigativas en edu-cación, Mayo-Agosto, 1-26.
Zeithaml, V. (1988). Consumer perceptions of price, quality and value: a means-end model and síntesis of evidence. Journal of Marketing, Volumen 52, Número 3, Julio.
Zeithaml, V. (1992). Calidad total en la gestión de los servicios. Editorial Díaz de Santos: Madrid.
Zeithaml, V. (1987). Defining and Relating Price, Perceived Quality, and Perceived Value. Report N. 87-101, Cambridge, MA: Marketing Science Institute.
Zeithaml, V., Berry, L.L., & Parasuraman, A.(1988). Communication and control processes in delivery of service quality. Journal of Market-ing, 52, 35-48.
Relevant ReferenceICAO. (1944). Convenio sobre aviación civil internacional. Doc 7300.
International civil aviation organization, Chicago.
ICAO. (1995). Manual de planificación de servicios de tránsito aéreo. Doc 9426. International civil aviation organization, Montreal.
ICAO. (1995). Plan mundial de navegación aérea para los sistemas ��/���<���X�������!�������������������������������+����=�Montreal.
���@!� %~��|�!� {��/���<� Y������ ��� �$����� �"���!� X�� #����4444. International civil aviation organization, Montreal.
ICAO. (2005). Anexo 2. Reglamento del aire. International civil aviation organization, Montreal.