BEARING CAPACITY OF SHALLOW FOUNDATIONS of Shallow Foundation.
HAWAQ-S-94-002 C2
COMMUNITY STRUCTURE OF FISH AND MACROBENTHOSAT SELECTED SHALLOW-WATER SITES IN RELATION
TO THE BARBERS POINT OCEAN OUTFALL, 1993
Richard E. Brock
PROJECT REPORT PR-94-16
March 1994
'WATER RESOURCES RESEARCH CENTER
UMVERSITY OF HAWAI'I AT MANOAHonolulu, Haggai'i 96822
AUTHOR:
Dr. Richard E. BrockAssociate Researcher and Fisheries SpecialistSea Grant Extension ServiceMarine Science Building 204University of Hawai'i at ManoaHonolulu, Hawai'i 96822Tel.: 8G8/956-2859FAX: 8G8/956-2858
$5.00/copy
Please make remittance in U.S. dollars from a U,S. bankor international money order to:Research Corporation, University of Hawai'i
Mail to: Water Resources Research CenterUniversity of Hawai'i at Manoa2540 Dole St., Holmes Hall 283Honolulu, Hawai'i 96822 ~ U.S.A.Attn: Publications Office
NOTE Please indicate PR-94-16 on check or money order for our reference.

COMMUNITY STRUCTURE OF FISH AND MACROBENTHOSAT SELECTED SHALLOW-WATER SITES IN RELATION
TO THE BARBERS POINT OCEAN OUTFALL, 1993
Richard E. Brock
Project Report PR-94-16
March 1994
PREPARED FOR
City and County of HonoluluDepartment of Wastewater Management
Project Reportfor
"The Assessment of the Impact of Ocean Sewer Outfallson the Marine Environment off Oahu, Hawaii"
Project No.: CS9390Project Period: 21 February 1990-31 December 1994
Principal Investigator: Roger S. Fujioka
WATER RESOURCES RESEARCH CENTERUniversity of Hawai'i at Manoa
Honolulu, Hawai'i 96822

ABSTRACT
This report provides the results of the second year of an annual quantitative monitoring ofshallow marine communities inshore of the Barbers Point Ocean Outfall located in 61 m of
water offshore of 'Ewa Beach, 0'ahu, Hawai'i. The monitoring effort focuses on benthic and
fish community structure and is designed to detect changes in these communities. Fieldsampling was first carried out in August 1991 when three study stations were established:Station BP-1, a control station 2.2 km inshore and east of the outfall terminus; Station BP-2,
an experimental station about 1.6 km inshore of the terminus; and Station BP-3, anexperimental station about 2.9 km west and inshore of the terminus. The second field effort,completed in May and September 1993, resurveyed the above stations as well as established afourth station BP-4! on and adjacent to the basalt armor caprock protecting the discharge pipe
in 13 m of water and directly inshore of the outfall terminus. These stations are sited to
capitalize on presumed gradients of impact that may be created by the discharge and movementof treated sewage effluent toward the shore and the coral reef communities. Data from the firstsurvey suggested that marine communities offshore of 'Ewa Beach receive disturbance from anumber of possible sources, with the largest perturbation probably coming from naturaldisturbance caused by occasional wave impact. This was most evident at the station directlyinshore of the outfall. Data from Station BP-4 showed that benthic communities situated on
armor rock which rises above the flat limestone substratum are not subjected to the same sand
scour as those situated on limestone; thus the coral communities on the elevated caprock are
better developed on this substrate. A comparison of the data from the two surveys �991 and1993! indicated that no statistically significant change has taken place at these permanent
stations, despite the imposition of a major hurricane on these marine communities in September1992. Thus the data to date support the contention that the operation of the Barbers Point deepocean outfall is not having a quantifiable impact on the coral reef resources situated inshore of
the outfall terminus.

CONTENTS
INTRODUCTION.
Purpose
Strategy
MATERIALS AND METHODS ..
RESULTS
Station BP-1 .
Station BP-2
Station BP-3 .
Station BP-4 .
31DISCUSSION .
35CONCLUSION
35REFERENCES CITED .
37APPENDIX
Tables
11
13
Physical Measurements and Biological Parameters
Green Sea Turtle Observations
Figures1. General locations of four permanent stations sampled in this
coral reef survey at the Barbers Point Ocean Outfall, 0'ahu, Hawai'i .2. Locations of the 14 photographic quadrats each on
Transects BP-1-A and BP-1-B located at the eastern stationoffshore of 'Ewa Beach, 0'ahu, Hawai'i.
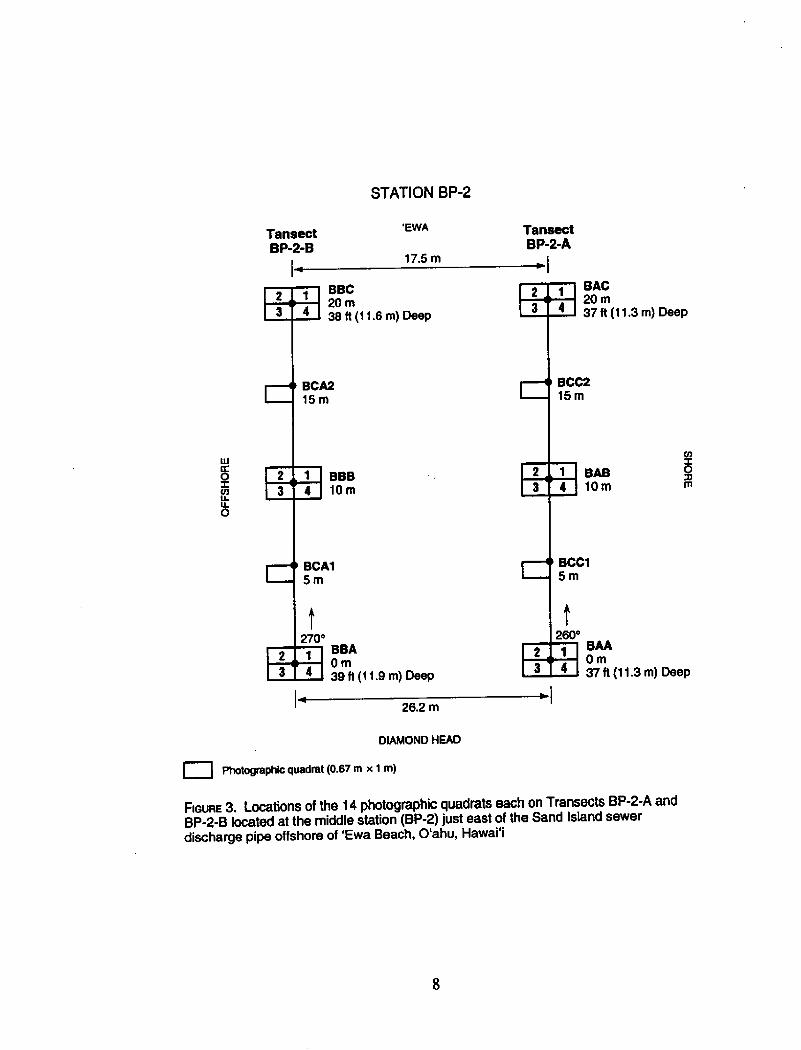
3. Locations of the 14 photographic quadrats each on Transects BP-2-Aand BP-2-B located at the middle station just east of the Sand Islandsewer discharge pipe offshore of 'Ewa Beach, 0'ahu, Hawai'i
4. Locations of the 14 photographic quadrats each onTransect BP-3-A and BP-3-B located at the western stationoffshore of 'Ewa Beach, 0'ahu, Hawai'i ..
1. Summary of biological observations made at Transect BP-1-A,2.2 km inshore and northeast of Barbers Point deep oceanoutfall terminus, May 1993.
2. Summary of results of the photographic quadrat survey, 1993 .3. Summary of biological observations made at Transect BP-1-B,
2,2 km inshore and northeast of Barbers Point deep oceanoutfall terminus, May 1993.
6
10
18
21
25
29
31
4. Summary of biological observations made at Transect BP-2-A,250 m east of the discharge pipe and 1.5 km inshore and northeastof Barbers Point deep ocean outfall terminus, May 1993
5. Summary of biological observations made at Transect BP-2-B,250 rn east of the discharge pipe and 1.5 km inshore and northeastof Barbers Point deep ocean outfall terminus, May 1993
6, Summary of biological observations made at Transect BP-3-A,3.3 km west and inshore of Barbers Point deep ocean outfallterminus, May 1993 ..
7. Summary of biological observations made at Transect BP-3-B,3.3 km west and inshore of Barbers Point deep ocean outfallterminus, May 1993 ..
8. Summary of biological observations made at Transect BP-4-A,situated on the basalt caprock of the Barbers Point discharge pipe,approximately 1.4 km inshore of Barbers Point deep oceanoutfall terminus, September 1993
9. Summary of biological observations made at Transect BP-4-8, situatedon the smooth limestone substratums 15 m east of the basalt caprockof the Honouliuli discharge pipe, approximately 1.4 km inshore ofBarbers Point deep ocean outfall terminus, September 1993
10. Summary of physical measurements made at each station in thevicinity of transect pairs, 2 October 1991 and 16 September 1993.
11. Summary of the biological parameters measured at station transectssampled in August 1991 and May and September 1993 .
19
20
23
24
26
28
30
30

INTRODUCTION
Purpose
The Honouliuli Wastewater Treatment Plant WWTP! located in 'Ewa, 0'ahu, Hawai'i,
has been in operation since 1982. It releases approximately 22 mgd �.96 m3/s! of primarytreated sewage through a 2670-m pipe at a depth of 61 rn offshore of 'Ewa Beach, 0'ahu. Inrecent years controversy has arisen regarding the impact that sewage effluent from theHonouliuli WWTP may have on inshore coral reef species. Accordingly, beginning in 1991,this study was undertaken in an attempt to quantitatively ascertain the impacts that may beoccurring. This report presents the results of the second survey carried out on 25 � 26 May and10 September 1993.
Strategy
Marine environmental surveys are usually performed to evaluate the feasibility of andecosystem response to specific proposed activities. Appropriate survey methodologies reflectthe nature of the proposed action s!. An action that may have an acute impact such as channeldredging! requires a survey designed to determine the route of least harm and the projected rateand degree of ecosystem recovery. Impacts that are more chronic or progressive requiredifferent strategies for measurement. Management of chronic stress to a marine ecosystemrequires identification of system perturbations that exceed boundaries of natural fluctuations.Thus a thorough understanding of normal ecosystem variability is required in order to separatethe impact signal from background "noise."
The impacts occurring to the marine ecosystem offshore of 'Ewa Beach are mostprobably those associated with chronic or progressive stresses. Because of the proximity of thepopulation center and industry to the east, marine communities fronting 'Ewa Beach areprobably subjected to a wide array of impacts. Thus a sampling strategy must attempt toseparate impacts due to wastewater treatment plant effluent on coral reef communities located atsome distance shoreward from a host of other possible perturbations originating in the
Honolulu and Pearl Harbor areas.
The waters fronting 'Ewa Beach, into which the deep ocean outfall discharges, can beconsidered in terms of gradients. There are numerous "gradients" due to point {such as stormdrains and streams! and nonpoint source inputs that are occurring to the east. Because many ofthese inputs have probably been occurring for a considerable period of time, the speciescomposition and functional relationships of the benthic and fish communities at any givenlocation in the waters offshore of 'Ewa Beach are those that have evolved under the influence
of these ongoing perturbations.

As noted above, if impacts are occurring in the shallow marine communities off 'Ewa
Beach because of effluent discharged from the deep ocean outfall, they are probably chronic innature and would probably manifest themselves as a slow decline in the communities so
impacted. Gradients of "stress" or "impact" should be evident with distance from impactsource s!. Thus, to quantitatively define these impacts, one should monitor these communities
through time in areas suspected of being impacted as well as in similar communities at varyingdistances away from the suspected source s!. This rationale has been used in developing thesampling strategy for this study.
MATERIALS AND METHODS
The quantitative sampling of macrofauna of marine communities presents a number ofproblems, many of which are related to the scale on which one wishes to quantitativelyenumerate organism abundance. Marine communities in the waters offshore of 'Ewa Beach
may be spatially defmed in a range of a few hundred square centimeters such as thecommunity residing in a Pocillopora meandrina coral head! to many hectares such as areaswhich are covered by major biotopes!. Because considerable interest focuses on visuallydominant corals, diurnally exposed macroinvertebrates, and fishes, we designed a samplingprogram to delineate changes that may be occurring in communities at this scale.
Four permanently marked stations were selected for the monitoring of benthic and fishcommunity response to possible sewage impacts. The approximate locations of these stationsare shown in Figure 1. The first three stations BP-1, BP-2, and BP-3! were established in1991 and the fourth BP-4! in 1993. The stations and the rationale for their selection are givenbelow:
Station BP-1 Located about 2.2 km inshore and to the east northeast! of the deep oceanoutfall terminus. This station, which is utilized as a control site, is located
in water ranging from 14.9 to 1S.8 m in depth Figure 1!. Althoughcomplex, prevailing currents move in an inshore and westerly directionapproximately parallel to the shoreline figure 34 in Laevastu et al. 1964!.Thus this station is probably outside to the east! of any shoreward-moving sewage plume. The substratum at this station is primarilylimestone, with corals having a "patchy" distribution across it. Coral
coverage may locally exceed 70%. Occasionally shallow sand areaslocated in depressions are found.

Che cc!
0ee~ c'�
e � e
OQ3 e Lu~<n e=
c e InD CItn
c» e,c»Oecn
eLc-po,e e~~»
«~CCCCCCwe-~a-~e~'g! «ecchl Co o' eg!c
e ~C L gecRco-
ec--~Ce0» I CRO- � C p
u ee e~ c~,H
rh~ C e~Lc E< v!ce
$'=cQ. Cg-CO In
co Q!cC I eCLOZN uCL~
eC>+e � Oy!c< c<
U LC
E Co c c
C ~O.O g +c c cp t Cu PJ
«oeeea ~
g» Oc �4c«~g!o o e e g~» CL C CL cg cC e ec c o
e uo
gC O CLe»«Peep
n: e -c<
tL Pn '6
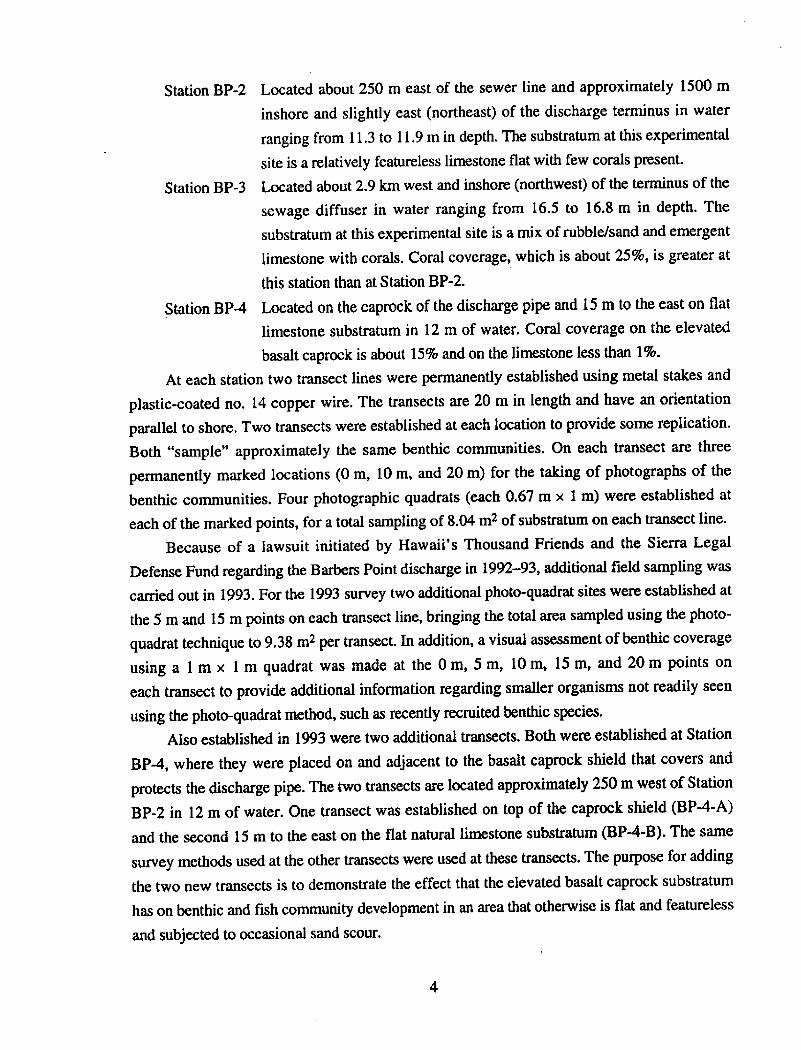
Station BP-2 Located about 250 m east of the sewer line and approximately 1500 minshore and slightly east northeast! of the discharge terminus in waterranging from 11.3 to 11.9 m in depth. The substratum at this experimentalsite is a relatively featureless limestone flat with few corals present.
Station BP-3 Located about 2.9 km west and inshore northwest! of the terminus of thesewage diffuser in water ranging from 16.5 to 16.8 m in depth. Thesubstratum at this experimental site is a mix of rubble/sand and emergentlimestone with corals. Coral coverage, which is about 25%, is greater at
this station than at Station BP-2.
Station BP-4 Located on the caprock of the discharge pipe and 15 m to the east on flatlimestone substratum in 12 m of water. Coral coverage on the elevated
basalt caprock is about 15% and on the limestone less than 1%.At each station two transect lines were permanently established using metal stakes and
plastic-coated no. 14 copper wire. The transects are 20 m in length and have an orientationparallel to shore. Two transects were established at each location to provide some replication.Both "sample" approximately the same benthic communities. On each transect are threepermanently marked locations � m, 10 m, and 20 m! for the taking of photographs of thebenthic communities. Four photographic quadrats each 0.67 m x 1 m! were established ateach of the marked points, for a total sampling of 8.04 m~ of substratum on each transect line.
Because of a lawsuit initiated by Hawaii's Thousand Friends and the Sierra LegalDefense Fund regarding the Barbers Point discharge in 1992-93, additional field sampling wascarried out in 1993. For the 1993 survey two additional photo-quadrat sites were established atthe 5 in and 15 m points on each transect line, bringing the total area sampled using the photo-quadrat technique to 9.38 m~ per transect. In addition, a visual assessment of benthic coverageusing a 1 m x 1 m quadrat was made at the 0 m, 5 m, 10 m, 15 m, and 20 m points oneach transect to provide additional information regarding smaller organisms not readily seenusing the photo-quadrat method, such as recently recruited benthic species.
Also established in 1993 were two additional transects. Both were established at StationBP-4, where they were placed on and adjacent to the basalt caprock shield that covers andprotects the discharge pipe. The two transects are located approximately 250 m west of StationBP-2 in 12 m of water. One transect was established on top of the caprock shield BP-4-A!and the second 15 m to the east on the flat natural limestone substratum BP-4-B!. The samesurvey methods used at the other transects were used at these transects. The purpose for addingthe two new transects is to demonstrate the effect that the elevated basalt caprock substratumhas on benthic and fish community development in an area that otherwise is flat and featurelessand subjected to occasional sand scour.
Fish abundance and diversity are often related to small-scale topographical relief over
short linear distances. A long transect may bisect a number of topographical features e.g.,
coral mounds, sand flats, and algal beds!, thus sampling more than one community and
obscuring distinctive features of individual communities. To alleviate this problem, a short
transect �0 m in length!, which has proved adequate for sampling many Hawaiian benthic
communities see Brock 1982; Brock and Norris 1989!, was used.
Information is collected at each transect location using methods including a visual
assessment of fishes, benthic photo-quadrats and quadrats for field appraisals of cover
estimates by sessile forms e.g., algae, corals, and colonial invertebrates!, and counting of
diurnally exposed motile macroinvertebrates along the transect line. Fish censuses are
conducted over a 20 m x 4 m corridor the permanent transect line!. All fishes within this area
to the water's surface are counted. A single diver equipped with scuba, slate, and pencil enters
the water, then counts and records all fishes in the prescribed area method modified from
Brock 1954!. Besides counting the individuals of all fishes seen, the length of each is estimated
for later use in the estimation of fish standing crop using linear regression techniques Ricker
1975!. Species-specific regression coefficients have been developed over the last 30 years bythe author and others at the University of Hawai'i, the Naval Undersea Center see Evans
1974!, and the Hawaii Division of Aquatic Resources from weight and body measurements of
captured fishes; for many species, the coefficients have been developed using sample sizes inexcess of a hundred individuals. The same individual the author! performs all fish censuses to
keep any bias relatively constant between counts and stations.
Besides frightening wary fishes, other problems with the visual census technique include
the underestimation of cryptic species such as moray eels family Muraenidae! and nocturnal
species such as squirrelfishes family Holocentridae! and bigeyes or 'aweoweo familyPriacanthidae!. This problem is compounded in areas of high relief and coral coverage that
affords numerous shelter sites. Species lists and abundance estimates are more accurate for
areas of low relief, although some fishes with cryptic habits or protective coloration, such as
scorpionfishes or nohu family Scorpaenidae! and flatfishes family Bothidae!, might still bemissed. Another problem is the reduced effectiveness of the visual census technique in turbidwater. This is compounded by the difficulty of counting fishes that move quickly or are very
numerous. Additionally, bias related to the experience of the census taker should be considered
in making comparisons between surveys. Despite these problems, the visual census techniquecarried out by divers is probably the most accurate nondestructive assessment method currently
available for counting diurnally active fishes Brock 1982!.
A number of methods are utilized to quantitatively assess benthic communities at each
station, including the taking of photographs at locations marked for repeated sampling through
time each covering 0.67 m2!. Photographs provide a permanent record from which coverageof corals and other sessile forms can be estimated. Cover estimates from photographs are
recorded as percent cover. Additionally, to help with later analysis in the laboratory of thecoverage recorded in photographs, a visual appraisal of each quadrat is made in the field, andnotes are taken on the species present. Beginning with the 1993 survey, supplementary
information on benthic coverage was obtained using 1 m x 1 m quadrats at the 0 m, 5 m,
10 m, 15 m, and 20 m points on each transect line. In these quadrats a visual assessment of
cover was made for each species present. Diurnally exposed motile macroinvertebrates greater
than 2 cm in some dimension are censused in the same 4 m x 20 m corridor used for the fish
counts.
If macrothalloid algae were encountered in the quadrats, they were quantitatively recordedas percent cover. Emphasis was placed on those species that were visually dominant, and noattempt was made to quantitatively assess the multitude of microalgal species that constitute the"algal turf" so characteristic of many coral reef habitats.
As requested by permit agencies, divers made simple physical measurements at the three
stations. Measurements of percent oxygen concentration and temperature were made with a
YSI Model 57 Oxygen meter, salinity was taken with a hand-held refractometer, and waterclarity was determined using a 12-inch secchi disk. Oxygen measurements were takenapproximately 1 m below the water surface and 1 m above the bottom.
Data were subjected to simple nonparametric statistical procedures provided in the SASInstitute statistical package SAS Institute 19S5!. Nonparametric methods were used to avoidmeeting requirements of normal distribution and homogeneity of variance in the data. Datawere analyzed using the Wilcoxon two-sample test to discern statistically significant differencesamong ranked means for each transect site and sample period; this procedure is outlined inSiegel �956! and Sokal and Rohlf �9S1!.
During fieldwork, an effort was made to note the presence of any green sea turtles a
threatened species! within or near the study sites.
RESULTS
Field sampling was undertaken at Stations BP-1, BP-2, and BP-3 on 25 � 26 May 1993.The two new transects located on and directly adjacent to the discharge pipe at Station BP-4were sampled on 10 September 1993. Figure 1 shows the approximate locations of the fourstations. Figures 2, 3, and 4 show the orientation of the permanent photographic quadrats oneach transect line for the first three stations. The photographic data were collected by members

STAT ON BP-1
'EWA
29m
AAC20m49 ft �4.9 m! Deep
4-0
AAAOm49 ft �4.9 m! Deep
27.3 m
DIAMOND HEAD
I'hotogra phk: quadrat �,67 m x t m!
FIGURE 2. Locations of the 14 photographic quadrats each on Transects BP-1-A andBP-1-B iocated at the eastern station BP-1! offshore of 'Ewa Beach, 0'ahu, Hawai'i
TansectBP-1-8
ABC20m52 ft �5,8 m! Deep
ABB10m
ABAOm52 ft �5.8 m! Deep
Tan sectBP-1-A
AAB10m
orZ0
STATION BP-2
'EWA
17.5 m
BAG20m37 ft �1.3 m! Deep
BAAOm37 ft�1.3 m! Deep
26.2 m
DIAMOND ItEAD
~ Photographtc quadrat �.67 m x 1 m!
FtouRE 3. Locations of the 14 photographic quadrats each on Transects BP-2-A andBP-2-B located at the middle station BP-2! just east of the Sand Island sewerdischarge pipe offshore of 'Ewa Beach, 0'ahu, Hawai'i
0T Ch4.0
TansectBP-2-B
BBC20m38 ft �1.6 m! Deep
BBB10m
BBAOm39 ft �1.9 m! Deep
TansectBP-2-A
BaB10m
COX033m

STATION BP-3
'EWA TansectBP-3-A
TansectBP-3-B
38.1 m
CAB10m
CBB10m
39.9 m
D1AMOND HEAD
Photographic quadrat �.67 m x t m!
FiGURE 4. Locations of the 14 photographic quadrats each on Transects BP-3-A andBP-3-B located at the western station BP-3! offshore of 'Ewa Beach, 0'ahu, Hawai'i
a.0
Z 0
CBC20m54 ft �6.5 m! Deep
CBAOm54 ft�6.5 m! Deep
CAC20m55 ft �6.8 m! Deep
CAAOm54 ft �6.5 m! Deep
of the Oceanographic Team, Department of Wastewater Management, City and County ofHonolulu.
The results are presented below by station. All transects other than those at Station BP-4have an orientation that is parallel to the shoreline. The orientation of the transects at StationBP-4 is approximately perpendicular to the shoreline parallel to the discharge pipe!.
Station Bp-1
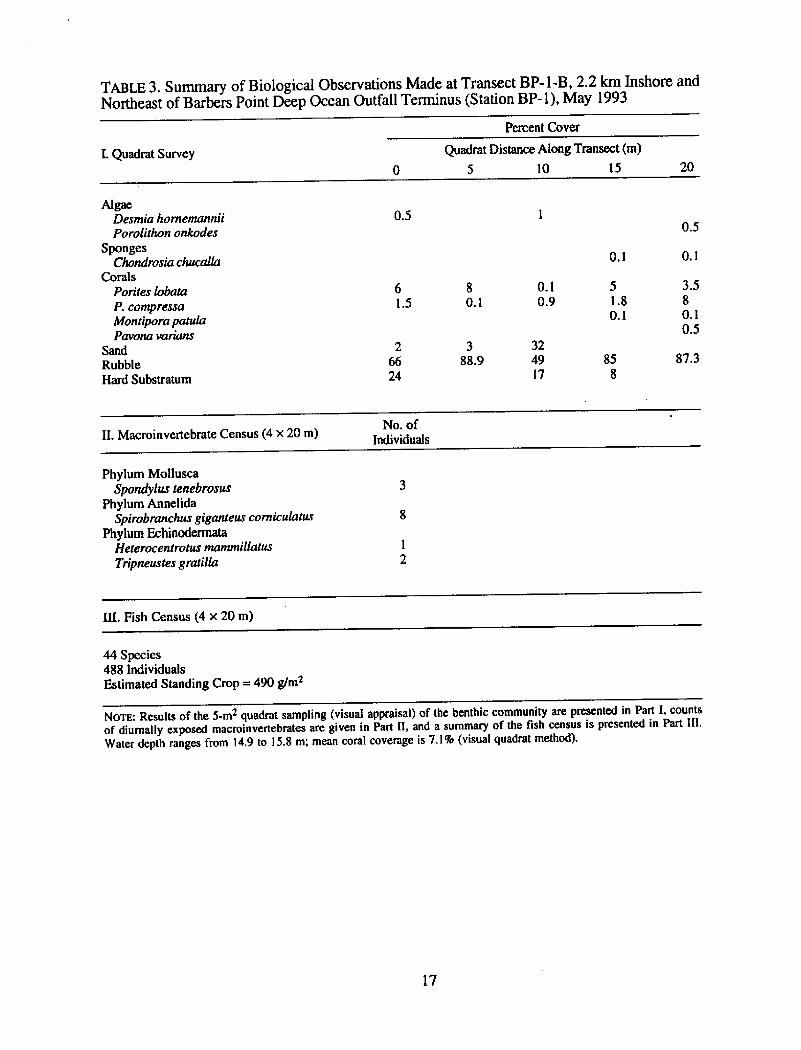
As noted earlier, Station BP-1 is utilized as a control site situated about 2.2 km inshoreand to the east northeast! of the deep ocean outfall terminus Figure 1!. This station is locatedin water ranging from 14.9 to 15.8 m in depth. The substratum at this station is limestone,with corals overlaying it; coverage may locally exceed 70%, and the dominant species arePorites lobata and P. compressa. The corals form low ridges "spurs and grooves"! that havean orientation which is perpendicular to the shoreline. These ridges are 2 to 15 m wide and 4to 50 m long and are spaced 2 to 20 m apart. In the open areas between the ridges thesubstratum has a veneer of rubble and sand. The physical damage from Hurricane Iniki, whichreduced coral cover at all stations, was greatest at Station BP-3, but Station BP-1 also suffereddamage to the coral community, which is evident in the coverage data below.
The two permanently marked transects BP-1-A and BP-1-B! that sample this stationhave an orientation that is parallel to the shoreline, are located from 27 to 29 m apart, and areout of visual range of one another see Figure 2!. Water clarity at this station usually rangesfrom 10 to 15 m.
Transect BP-1-A
A summary of the data collected at Transect BP-1-A in May 1993 is presented in Table 1,In the quadrat survey one coralline algal species Porolithon onkodes!, one soft coral species Anthelia edmondsoni!, and five coral species Porites lobata, P. compressa, Montiporaverrucosa, M. patula, and Pocillopora meandrina! were encountered. Porites lobata was thedominant coral at this transect, where mean coral coverage for all species combined was15.5%. In the macroinvertebrate census the rock oyster Spondylus tenebrosus, the terebellidpolychaete Loimia medusa, and two sea urchin species Heterocentrotus mammillatus andEchinometra mathaei! were noted.
The results of the fish census are presented in the Appendix. Forty-one fish speciesrepresenting 375 individuals were seen at Transect BP-1-A. The most abundant speciesincluded the brick soldierfish or mempachi Myripristes amaenus!, two damselfish species Chromis ovalis and Dascyllus albisella!, the brown surgeonfish or ma'i'i'i Acanthurusnigrofuscus!, the goldring surgeonfish or kole Ctenochaetus strigosus!, and the sleek
10

Percent Cover
Quadrat Distance Along Transect m!5 10 15
I. Quadrat Survey20
AlgaePoroli thon onkodes
Soft CoralsAnthelia edmondsoni
CoralsPorites lobataP. compressaPocilloporrt rneandrinaMontipora verrucosaM. patuia
SandRubbleHard Substratum
0.5
1.2
2319 274.51
0.50.10.1
0.11
1262.8
287.8
859.48
592356
No. ofIndividualsH. Macroinvertebrate Census � x 20 m!
Phylum MolluscaSpondylus tenebrosus
Phylum AnnelidaLoimia medusa
Phylum EchinodermataHeterocentrotus mammi llatusZchinometra ntathaei
HI. Fish Census � x 20 m!
41 Species375 IndividualsEstimated Standing Crop = 249 g/m2
NOTa: Results of the 5-m2 quadrat sampling visual appraisal! of the benthic community are presented in Part 1, countsof diurnally exposed macroinvertebrates are given in Part ll, and a summary of the fish census is presented in Part ill.Water depth ranges from l4,9 to 15.8 m; mean coral coverage is 15.5% visual quadrat method!.
11
TABLE 1..Summary of Biologica1 Observations Made at Transect BP-1-A, 2.2 km Inshore andNortheast of Barbers Point Deep Ocean Outfall Terminus Station BP-1!, May 1993

unicornfish or kala holo Naso hexacanthus!, The standing crop of fishes was estimated at
249 g/m>, with the largest contributors including Naso hexacanthus �1% of the total!, theemperor or mu Monotaxis grandoculis � 22% of the total!, and a single grey snapper or uku Aprion virescens � 7% of the total!.
The results of the photo-quadrat survey conducted at Transect BP-1-A are presented inTable 2. Five corA species having a mean coverage of 20.9% were recorded. Also recordedwere two algal species Porolithon onkodes and Hydrolithon rienboldii! having a meancoverage of 6.4%. Other benthic species present included two sponge species and the soft coralAnthelia edmondsoni.
Transect BP- j-B
Transect BP-1-B is situated 27 to 29 m seaward of Transect BP-1-A. The results of the
quantitative survey carried out on this transect are presented in Table 3. The quadrat surveynoted two algal species Desmia hornernannii and Porolithon onkodes!, one sponge species Chondrosia chucalla!, and four coral species Porites lobata, P. compressa, Montipora patula,and Pavona varians!. The dominant coral species was Porites lobata, and mean coral coveragewas 7.1%. In the 4 m x 20 m census area four macroinvertebrate species were seen: the rock
oyster Spondylus tenebrosus, the Christmas tree worm Spirobranchus giganteus corniculatus,and two sea urchin species Tripneustes gratilla and Heterocentrotus nuvnmillatus!.
The results of the photo-quadrat survey for Transect BP-1-B are given in Table 2. Threecoral species Porites lobata, P. compressa, and Pocillopora meandrina! having a meancoverage of 27.2% were noted. Also encountered were two algal species Porolithon onkodesand Hydrolithon rienboldii! and two encrusting sponge species Chondrosia chucalla andSpirastrella coccinea!.
The results of the fish census are presented in the Appendix, Forty-four fish speciesrepresenting 488 individuals were noted in the census area, with the most common speciespresent being the mackeral scad or opelu Decapterus macarellus!, the damselfish Chromisovalis, the brown surgeonfish or ma'i'i'i Acanthurus nigrofuscus!, the goldring surgeonfishor kole Ctenochaetus strigosus!, and the sleek unicornfish or kala holo Naso hexacanthus!.The standing crop of fish at Transect BP-1-8 was estimated at 490 g/m>, and the speciesresponsible for much of this were Decapterus macarellus �9% of the total!, the emperor or mu Monotaxis grandoculis � 7% of the total!, and Naso hexacanthus �1% of the total!.
Station observations
In the vicinity of Station BP-1 were seen the corals Pocillopora meandrina, Pavonavarians, P. duerdeni, and Montipora jlabellata, as well as the undulated moray eel or puhilaumilo Gymnothorax eurostus!.
12

TABLE 2. Summary of Results of the Photographic Quadrat Survey, 1993Percent Cover
Transect BP-1-A
5.30,1
10.64.2
10,51.1 0.2
0.10.1
0.1
0.1 0.4
0.30.10.1
38.74.8
381,5
17,5
0.40.3
17.173.3
8.8
3.439.733.4
1.495.87
34.72
46.1
Mean Coral Coverage = 20.9%
Percent Cover
Transect BP-1-B
6,8 1.4 6,11.62,5
0.20.1
0.30.1
0.30.1
0,1
10.53,416 1.713.2
4.7
17.9 53.7101 45
0.41.7
20.548.4 33.6
0.6
34.8
1.621.451.9
0.753.231.9
Mean Coral Coverage = 27.2%
13
AlgaeHydrolithon rienboldiiPoroli thon onkodes
SpongesSpirastrella coccineaChondrosia chucalla
Soft CoralsAnthelia edmondsoni
CoralsPorites lobataP. compressaPocillopora meandrinaMontipora verrucosaM. patakt
SandRubbleHard Subslratum
AlgaeHydroli thon ri enboldiiPoroli thon onkodes
SpongesSpirastrella coccineaChondrosia chacalla
CoralsPorites lobataP. compressaPocNopora meandrina
SandRubbleHard Substratum
Photographic QuadratAAA ACC1 AAB ACC2 AAC� m! � m! �0 m! �5 m! �0 m!
Photographic QuadratABA ACA1 ABB ACA2 ABC� m! � m! �0 m! �5 m! �0 m!

TABLE 2 � Continued
Percent Cover
Transect BP-2-A
0.10,2
0.10.1
0.70.3
0.10.3
0.1O. I
2.5 0,32 0.39.2 16.3
85.3 82,8
0.30.1
49,949.4
3,1
29.470.4
48.348
Percent Cover
Transect BP-2-BBBA� m!
0.1 0.10.6
0.10.1 0.1
0.70.2
50.848.2
0.3 O. I5.3
46.453.2
11.288.1
30.564.2
71.128.4
14
SpongesSpirastrella coccineaChondrosia chucalla
Soft CoralsAnthelia edmondsoni
CoralsPori tes lobataPocillopora meandrina
SandHard Substratum
Mean Coral Coverage = 1.8%
SpongesSpirastrella coccineaChondrosia chucalla
CoralsPorites lobataPocillopora meandrina
SandHard Substratum
Mean Coral Coverage = 1.3%
Photographic QuadratBAA BCC1 BAB BCC2 BAC� m! � m! �0 m! �5 m! �0 m!
Photographic QuadratBCA1 BBB BCA2 BBC� m! �0 m! �5 m! �0 m!
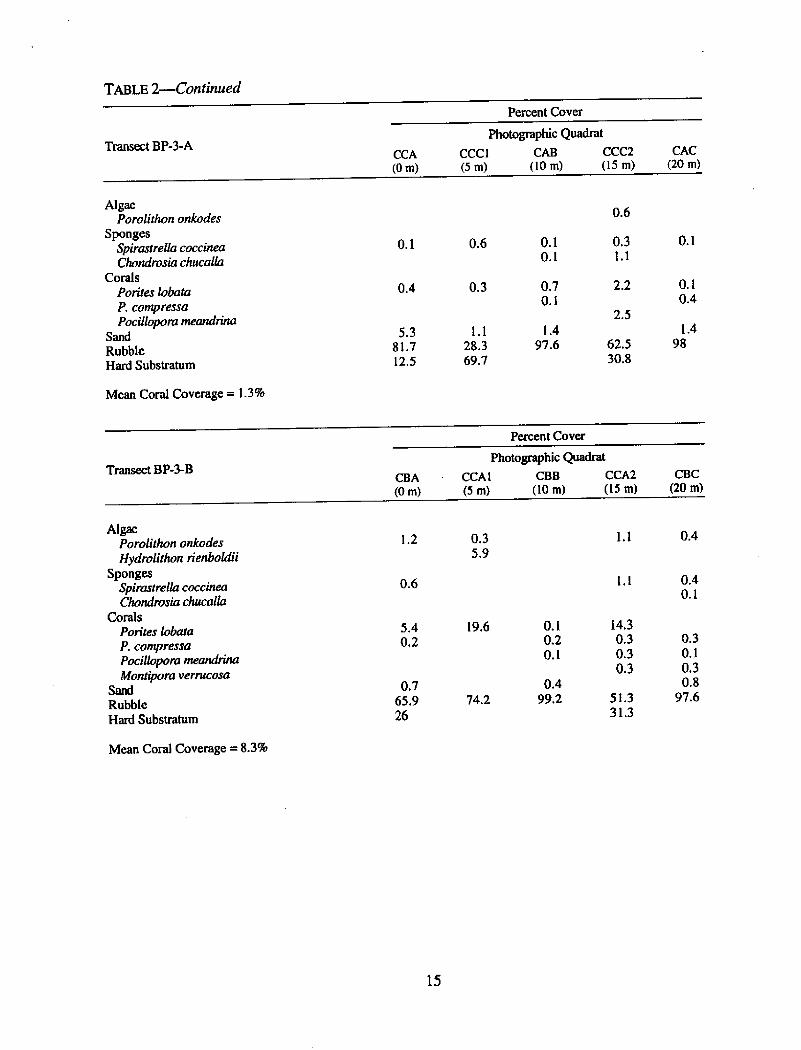
TABLE 2 � Continued
Percent Cover
Transect BP-3-ACCA� m!
0.6
0.10.31.1
0.10.1
0.60.1
0.70.1
0.3 2.2 0.10.4
2.51,4
62.5 9830.8
0.4
l497.6
1.128.369.7
5.381.712,5
Percent Cover
Transect BP-3-B
0.35.9
1,2 0.4
0.6 0.40,1
14.30,30.30.3
19.6 0.10.20.1
5,40.2 0.3
0.10.30.8
97.60.4
99.20.7
65.926
51.331.3
74.2
15
AlgaePoroli thon onkodes
SpongesSpirastrella coccineaChondrosia chttcalla
CoralsPorites lobataP, contpressaPocillopora nteandrina
SandRubbleHard Substratum
Mean Coral Coverage = 1.3%
AlgaePoroli thon onkodesHydrolithon rienboldii
SpongesSpirostrella coccineaChondrosia chucalla
CoralsPorites tobataP. cornpressaPocillopora nteandrinaMontipora verrucosa
SandRubbleHard Substratum
Mean Coral Coverage = 8.3%
Photographic QuadratCCC1 CAB CCC2 CAC� m! �0 m! �5 m! �0 m!
Photographic QuadratCBA CCA1 CBB CCA2 CBC� m! � m! �0 m! �5 m! �0 m!

TABLE 2 � Continued
Percent Cover
Transect BP-4A
0.60.30.7
0.30.8
6.70.8
8.12.5
18.215,44,8
34.5 554.9 86.6
2159.7
21,357,8
Mean Coral Coverage = 17.9%
Percent Cover
Transect BPWB
0.62.8 0.3
0.10.10.1
0.30.30.10.12.81.7
95.2
0.3
96.1 93.33.6 6.4
0.80,6
97.6
2.80.8
93.2
Mean Coral Coverage = 0.2%
NOTE: Presented in the body of the table are the percent cover of species and substrate types for each transect. Note thatfor Stations BP- 1, BP-2, and BP-3 the 5 m and 15 m data are based on one 0.67-m2 photo-quadrat and the 0 m, 10 rn,and 20 m data on the mean from four 0,67-m2 quadrats at each location. Data for Station BP-4 are based on one quadratat each 5-m stop i.e., 0 m, 5 m, 10 m, 15 m, and 20 m!,
16
AlgaePorolithon onkodes
SpongesSpirastrella coccinea
CoralsPorites lobataPocillopora nteandri naP. eydouxi
SandRubbleHard Substratum
AlgaeSphacelaria fiueigera
SpongesSpirastrella coccinea
CoralsPorites lobataPoci llopora nteandrina
SandRubbleHard Substratum
Photographic QuadratAAA1 AAA2 AAA3 AAA4 AAB1� m! � m! �0 m! �5 m! �0 m!
27.50.64.80.64.2
62.3
Photograpluc QuadratBBB1 BBB2 BBB3 BBB4 BBA1� m! � m! �0 m! �5 m! �0 m!
Percent Cover
Quadrat Distance Along Transect m!5 10 15
I. Quadrat Survey20
AlgaeDesmi a hornemanniiPorolithon onkodes
SpongesChondrosia chucalla
CoralsPorites lobataP. compressaMontipora patuktPavona varians
SandRubbleHard Substratum
0.50.5
0.1
0.10.9
80.1
61.5
3.580,10.5
51.8O.I
324917
388,9
26624
87.3
No, ofIndividualsH. Macroi nvertebrate Census � x 20 m!
Phylum MolluscaSpondylus tenebrosus
Phylum AnnelidaSpi robranchus giganteus corniculatus
Phylum EchinodermataHeterocentrotus mammi llatusTri pneustes grati lla
III. Fish Census � x 20 m!
44 Species488 IndividualsEstimated Standing Crop = 490 glms
NoTn: Results of the 5-m~ quadrat sampling visual appraisai! of the benthic community are presented in Part I, countsof diurnally exposed macroinvertebrates are given in Part Il, and a summary of the fish census is presented in Part III.Water depth ranges from l4,9 to l 5.8 m; mean coral coverage is 7.1% visual quadrat method!.
17
TABLE 3. Summary of Biological Observations Made at Transect BP-1-B, 2.2 km Inshore andNortheast of Barbers Point Deep Ocean Outfall Terminus Station BP-1!, May 1993

Station BP-2
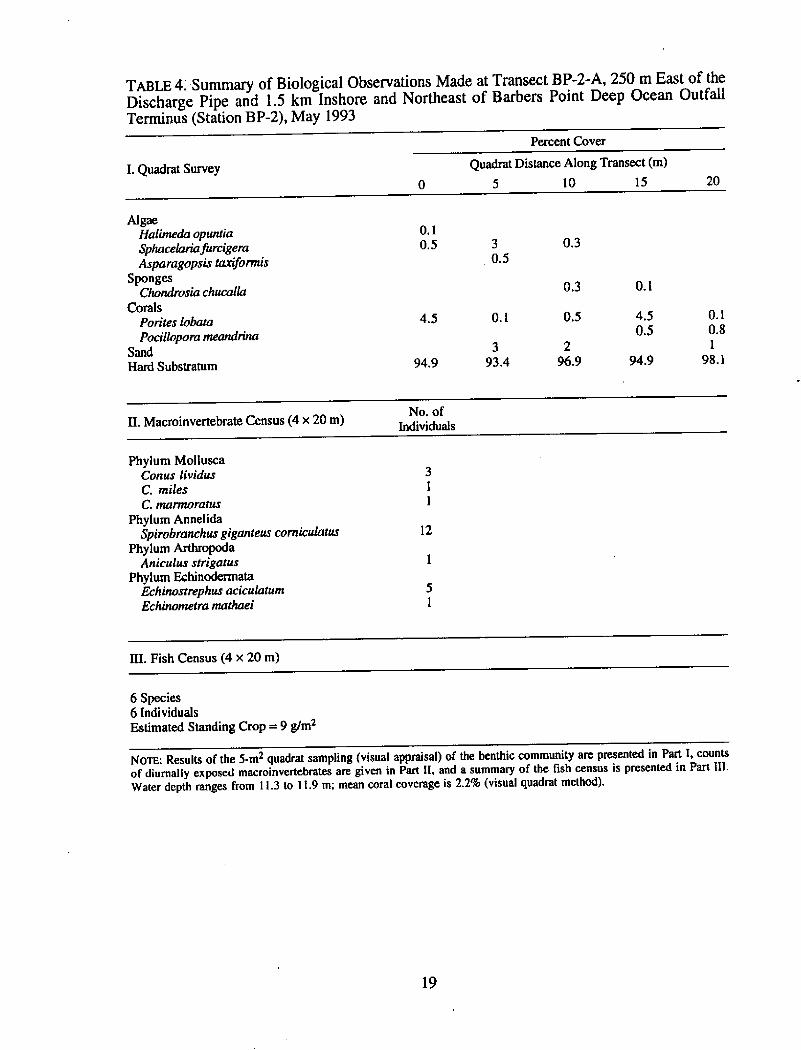
Station BP-2 is located about 1.4 km from shore in water ranging from 11.3 to 11.9 m
in depth Figure 1!. The substratum at this location is a relatively flat and featureless limestonewith little relief. Common corals seen included Pocillopora meandrina and Porites lobata; other
species seen included Montipora verrilli and M. verrucosa. Two of the common algal species inthe area were limu kohu or Asparagopsis tauformis and the alga Sphacelaria furci gera.
Two transects were established at Station BP-2 to sample the benthic and fish
communities adjacent to the shallow portion of the Barbers Point deep ocean outfall pipe. Thetwo permanently marked transect lines have an orientation that is approximately parallel to theshoreline, with the shoreward transect BP-2-A! situated at a depth of 11.3 m and the seawardtransect BP-2-B! at a depth of 11.6 to 11.9 m Figure 3!.
Transect BP-2-A
Table 4 presents a summary of the quantitative study made at Transect BP-2-A. Thevisual quadrat survey noted three algal species Halimeda opuntia, Sphacelaria furcigera, andAsparagopsis taxiformis!, one sponge species Chondrosia chucalla!, and two coral species Porites lobata and Pocillopora meandrina!. Mean coral coverage at this station was estimated at2.2%, and the dominant species was Porites lobata. The macroinvertebrate census carried outover the 4 m x 20 m area noted seven species: the cone shell species Conus li vidus, C. miles,and C. marmoratus!, the Christmas tree worm Spirobranchus giganteus corniculatus, thebrown hermit crab Aniculus strigatus, and two sea urchin species the rock boring urchinEchinostrephus aciculaturn and the green urchin Echinometra mathaei!.
The photo-quadrat survey noted two sponge species Spirastrella coccinea andChondrosia chucalla!, the soft coral Anthelia edmondsoni, and two coral species Porites lobataand Pocillopora meandrina!. Coral coverage was estimated at 1.8%.
The results of the fish census are presented in the Appendix. In total six fish speciesrepresenting six individuals were censused at Transect BP-2-A. The biomass of fishes on thistransect was estimated at 9 g/m>, with the largest contributor being a singe-barred filefish or'o'ili Cantherhines dumeri lii � 62% of the total}.
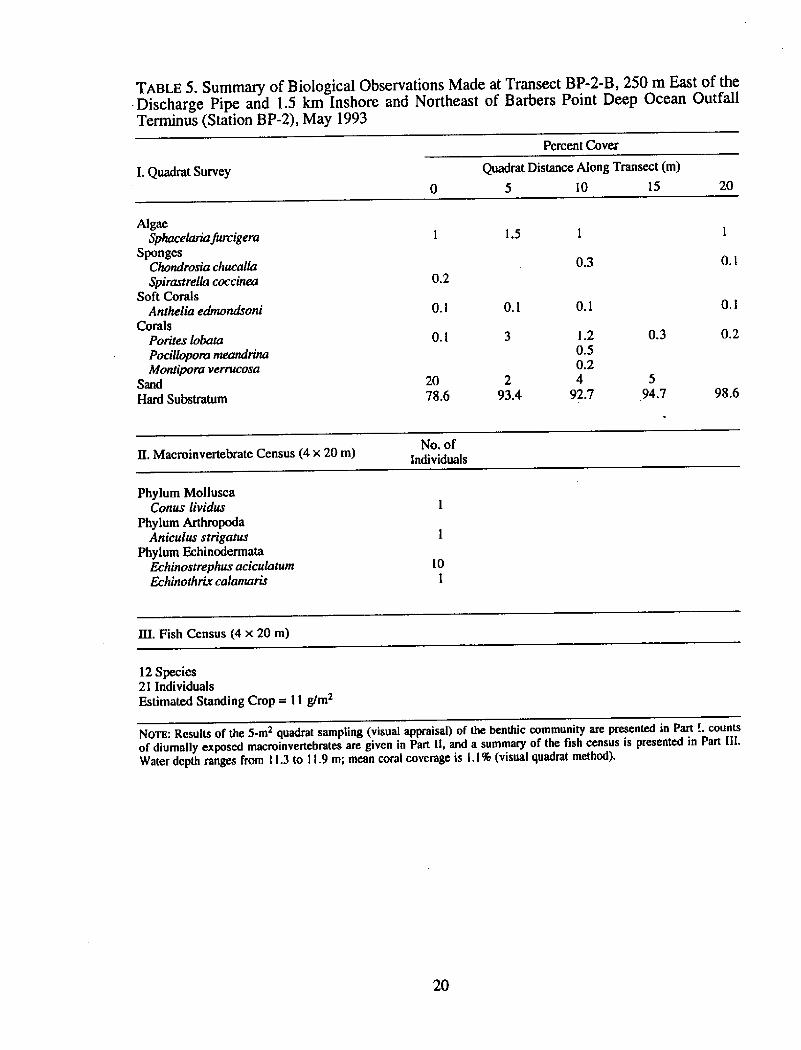
Transect BP-2-B
Transect BP-2-B was established at a distance varying from 17.5 to 26 m seaward ofTransect BP-2-A Figure 3!. Table 5 presents the results of the visual quadrat survey quadratlocations given in Figure 3! carried out at Transect BP-2-B. One algal species Sphacelariafurcigera!, two encrusting sponge species Spi rastrella coccinea and Chondrosia chucalla!, andthree coral species Porites lobata, Pocillopora meandrina, and Montipora verrucosa! werenoted. Corals were not an important component of the benthos at this location; mean coverage
18
Percent Cover
Quadrat Distance Along Transect m!5 10 15
I. Quadrat Survey20
AlgaeHali meda opuntiaSphacelrzna furcigeraAsparagopsis taxiformis
SpongesChondrosia chucalla
CoralsPorites lobataPocillopora meandrina
SandHard Substratum
0.10,5 0,33
0.5
0.3 0.1
0.10.81
98,1
4.50.5
0.50.14.5
296.9
393.4 94.994.9
No. ofIndividualsII. Macroinvertebrate Census � x 20 m!
Phylum MolluscaConus lividusC, milesC. marmoratus
Phylum AnnelidaSpirobranchus giganteus corniculatus
Phylum ArthropodaAniculus strigatus
Phylum EchinodermataEchinostrephus aciculatumEchinometra mathaei
12
III. Fish Census � x 20 m!
6 Species6 IndividualsEstimated Standing Crop = 9 g/m~
hfoTE: Results of the 5-m~ quadrat sampling {visual appraisal! of the benthic community are presented in Part I, countsof diurnally exposed macroinvertebrates are given in Part II, and a summary of the fish census is presented in Part III.Water depth ranges from I l.3 to I l.9 m; mean coral coverage is 2.2% {visual quadrat method!,
19
TABLE 4; Summary of Biological Observations Made at Transect BP-2-A, 250 m East of theDischarge Pipe and 1.5 km Inshore and Northeast of Barbers Point Deep Ocean OutfallTerminus Station BP-2!, May 1993
Percent Cover
Quadrat Distance Along Transect m!
5 10 15I. Quadrat Survey
20
AlgaeSphacelaria furcigera
SpongesChondrosia chucallaSpi rastrella coccinea
Soft CoralsAnthelia edmondsoni
CoralsPorites lobataPociliopora rneandrinaMontipora verrucosa
SandHard Substratum
1.5
O.l0.3
0.2
O.l0.1O.l0,1
0.31.20,50.24
92.7
0.20.1
293.4
2078.6
594.7 98,6
No. ofIndividualsH. Macroinvertebrate Census � x 20 m!
Phylutn MolluscaConus lividus
Phylum ArthropodaAniculus stri gatus
Phylum EchinodermataEchinostrephus aciculaturnEchinothrix calamaris
101
III. Fish Census � x 20 m!
12 Species21 IndividualsEstimated Standing Crop = 11 g/m2
NOTa: Results of the 5-m2 quadrat sampling visual appraisa/! of the benthic community are presented in Part!, countsof diurnally exposed macroinvertebrates are given in Part ll, and a summary of the fish census is presented in Part ill.Water depth ranges from l l.3 to I l,9 m; mean coral coverage is 1,1% visual quadrat method!.
20
TABLE 5. Summary of Biological Observations Made at Transect BP-2-8, 250 m East of theDischarge Pipe and 1.5 km Inshore and Northeast of Barbers Point Deep Ocean OutfallTerminus Station BP-2!, May 1993

was estimated at 1.1% visual quadrat method!. Noncolonial macroinvertebrates censused inthe 4 m x 20 m transect included the cone shell Conus lividus, the brown hermit crab
Aniculus strigatus, and two sea urchin species the rock boring urchin Echinostrephusaciculatum and the banded urchin Echinothrix calamaris!.
The results of the photo-quadrat survey for Transect BP-2-B are given in Table 2. Twosponge species Chondrosia chucalla and Spirastrella coccinea! provided a mean coverage of0.2%, and two coral species Porites lobata and Pocillopora meandrina! contributed a mean
coverage of 1.3% at this transect.The results of the fish census at Transect BP-2-B are presented in the Appendix. Twelve
fish species representing 21 individuals were censused. The most common fish seen on thistransect was the saddleback wrasse or hinalea lauwili Thalassoma duperrey!. Fish standing
crop was estimated at 11 g/m2, with a single barred filefish or 'o'ili Cantherhines dumerilii!contributing 34% of the total and Thalassoma duperrey 26% of the total.
Station observations
The low numbers and standing crop of fishes present at Transects BP-2-A and BP-2-Bare probably related to the lack of local topographical relief that affords shelter for fishes. Therelatively higher abundance of noncolonial macroinvertebrates is also probably related to thelack of shelter, thus making their detection easier.
In the vicinity of Station BP-2 were seen the coral Pavona varians, the abbreviated coneshell Conus miliaris, the reef crab Thalamita edvvardsi, the octopus or he'e Octopus cyanea!,
and the belted wrasse or 'omaka Stethoj ulis balteata!,
Station BP-3
Station BP-3 is located about 2.9 km west and inshore of the Barbers Point outfall
terminus Figure 1!. This western station is situated approximately 1.6 km offshore of theBarbers Point Naval Air Station at a depth of 16.5 to 16.8 m. The substratum at this location isa mix of coral and rubble mounds or ridges with sand or flat limestone substratum betweenthem. The ridges have an orientation that is approximately perpendicular to the shoreline andare 2 to 15 m in width, 4 to 40 m in length, and up to 0.75 m in height. The ridges are spacedfrom 3 to 10 m apart; sand in depressions may occur on a scale from 3 to 10 m in width andup to about 30 m in length. Transect BP-3-A, established in water ranging from 16.5 to16.8 m in depth, is approximately parallel to the shoreline; Transect BP-3-B was establishedabout 38 m seaward of Transect BP-3-A at a depth of 16.5 m Figure 4!. At the time ofsampling, water clarity was between 12 and 15 m, which is the usual measurement for thislocation.
21

Transect BP-3-A
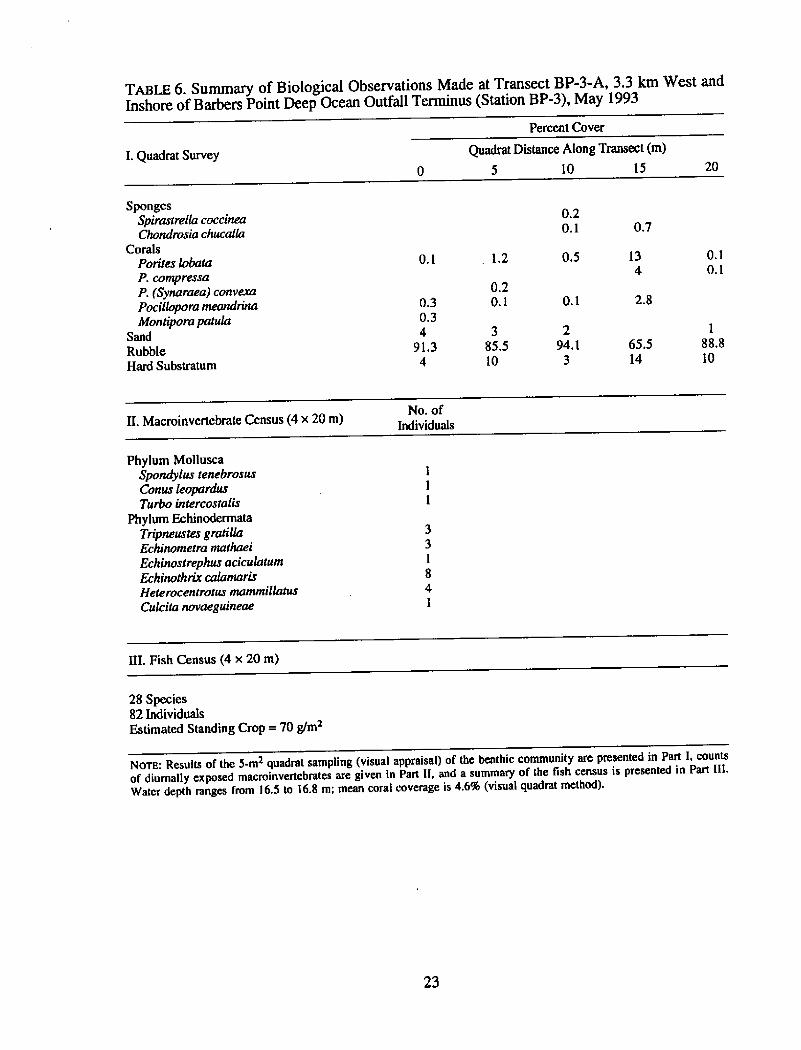
Table 6 presents the results of the quantitative survey carried out at Transect BP-3-A. Thevisual quadrat survey quadrat locations given in Figure 4! noted two encrusting spongespecies Spirastrella coccinea and Chondrosia chucalla! and five coral species Porites lobata,P. compressa, P. Synaraea 1 convexa, Pocillopora meandrina, and Montipora patula!. Poriteslobata was the dominant species seen, and mean coral coverage at this location was estimated at4.6% visual quadrat method!. Nine macroinvertebrate species were seen, including the rockoyster Spondylus tenebrosus, the leopard cone Conus leopardus, the top shell Turbointercostalis, the cushion starfish Culcita novaeguineae, the banded sea urchin Echinothrixcalamaris, the rock boring urchin Echinostrephus aciculatum, the green sea urchin Echinometramath'aei, the black sea urchin Tripneustes gratilla, and the slate pencil sea urchinHeterocentrotus nuxmmi llatus.
The results of the photo-quadrat survey for Transect BP-3-A are presented in Table 2.Noted were one coralline algal species Poroli thon onkodes! having a mean coverage of 0.1%,two sponge species Chondrosia chucalla and Spirastrella coccinea! having a mean coverage of0.5%, and three coral species Porites lobata, P. compressa, and Pocillopora meandrina!having a mean coverage of 1.3%.
The results of the fish census at Transect BP-3-A are presented in the Appendix. Twenty-
eight fish species representing 82 individuals were censused. The most abundant fish specieswere the brown surgeonfish or ma'i'i'i Acanthurus nigrofuscus! and the damselfish Chromisvanderbilti. The standing crop of fishes was estimated at 70 g/m>, and the species contributingmost heavily included a single black triggerfish or humuhumu ele'ele Melichthys niger � 9%of the total!, a single barred filefish or 'o'ili Cantherhines dumerilii � 11% of the total!, andthree orangebar surgeonfish or na'ena'e Acanthurus olivaceus � 19% of the total!.
Transect BP-3-B
Transect BP-3-B is located approximately 38 m seaward of Transect BP-3-A Figure 4!.It has an orientation that is parallel to Transect BP-3-A and has a water depth of 16.5 m.Table 7 presents the results of the quantitative survey carried out at this transect. One spongespecies Spirastrella coccinea! and four coral species Porites lobata, P. compressa, Pocilloporameandrina, and Montipora verrucosa! were noted. Coral coverage at this transect was estimatedat 3.2% visual quadrat method!. Six species of macroinvertebrates were censused in the 4 mx 20 m area, including the rock oyster Spondylus tenebrosus, the slate pencil sea urchinHeterocentrotus mammillatus, the black sea urchin Tripneustes gratilla, the banded sea urchinEchinothrix calamaris, the long-spined black sea urchin or wana Echinothrix di adema!, andthe green sea urchin Echinometra mathaei. The most abundant macroinvertebrate present wasthe black sea urchin.
22
Percent Cover
Quadrat Distance Along Transect m!5 10 15
I. Quadrat Survey20
SpongesSpirastrella coccineaChondrosia chucalla
CoralsPorites lobataP. compressaP, Synarrtea! convexaPocillopora meandrinaMontipora patula
SandRubbleHard Substratum
0.20.1 0.7
130.51.2O.l 0.10.1
0.20.1 0.10.3
0,3
91.34
2.8
294.1
3
385,510
188.810
65.514
No. ofIndividualsII. Macroinvertebrate Census � x 20 m!
Phylum MolluscaSpondylus tenebrosusConus leopardusTurbo intercostalis
Phylum EchinodermataTripneustes gratillaEchinornetra mathaeiEchinostrephus aci culatumEchinothrix calamarisHeterocentrotus mammi llatusCulcita novaeguineae
III. Fish Census � x 20 rn!
28 Species82 IndividualsEstimated Standing Crop = 70 g/m~
NoTH: Results of the 5-m~ quadrat sampling visual appraisal! of the benthic community are presented in Part I. countsof diurnally exposed macroinvertebrates are given in Part II. and a summary of the fish census is presented in Part III.Water depth ranges from I6.5 to i 6,8 m; mean coral coverage is 4.6% visual quadrat method!.
23
TABLE 6. Summary of Biological Observations Made at Transect BP-3-A, 3.3 km West andInshore of Barbers Point Deep Ocean Outfall Terminus Station BP-3!, May 1993

TABLE 7. Summary of Biological Observations Made at Transect BP-3-B, 3.3 km West andInshore of Barbers Point Deep Ocean Otttfall TerminUs Station BP-3!, May 1993
Percent Cover
Quadrat Distance Along Transect m!
5 10 15
I. Quadrat Survey20
SpongesSpi rustre' coccinea
CoralsPorites iobataP. cornpressaPocilfopora rneandrinaMontipora verrucosa
SandRubbleHard Substratum
0.11,5
3.52.30.81.3
0.722.50.30.5
0.70.5
78.718
284.1
8
57217
76.321
99.7
No. ofIndividualsII. Macroinvertebrate Census � x 20 m!
Phylum MoliuscaSpondyius tenebrosus
Phylum EchinodermataTripneustes gratilfaEchinothrix crdamaris
K diademaEchi nometra mathaeiHeterocentrotus mammi lfatus
13113
6 1
III. Fish Census � x 20 m!
17 Species161 IndividualsEstimated Standing Crop = 311 g/mt
24
NoTtt: Results of the 5-ma quadrat sampling visual appraisal! of the benthic community are presented in Part 1, countsof diurnally exposed macromvertebrates are given in Part 11, and a summary of the fish census is presented in Part 111.Water depth ranges from 16,5 to 16.$ m; mean coral coverage is 3,2% visual quadrat method!.

Table 2 presents the results of the photo-quadrat survey carried out at Transect BP-3-B.Noted were two coralline algal species Poroli thon onkodes and Hydrolithon rienboldit! havinga mean coverage of 1.8%, two sponge species Chondrosia chucalla and Spirastrella cocci nea!with a mean coverage of 0.4%, and four coral species Montipora verrucosa, Pocilloporameandrina, Porites compressa, and P. lobata! having a mean coverage of 8.3%.
The results of the fish census carried out at Transect BP-3-B are presented in the
Appendix. In total 17 species representing 161 individuals were counted, with the mostabundant fishes being the mackeral scad or opelu Decapterus macarellus!, the damselfishChromis vanderbilti, and the orangebar surgeonfish or na'ena'e Acanthurus olivaceus!. Thestanding crop of fish on Transect BP-3-B was estimated at 311 g/m>, with the largestcontributors being Decapterus macarellus �8% of the total!, Acanthurus oli vaceus �7% of thetotal!, and a single grey snapper or uku Aprion vi rescens � 5% of the total!.
Station observations
In the vicinity of Station BP-3 were seen the corals Fungia scutaria and Pavona varians,as well as the yellowmargin moray eel or puhi paka Gymnothorax flavimarginatus! and thespiny lobster or 'ula Panulirus marginatus!.
Station BP-4
Station BP-4 was established on 10 September 1993 with two transects BP-4-A and BP-4-B! placed on and adjacent to the basalt caprock shield that covers and protects the dischargepipe approximately 250 m west of Station BP-2 in 12 to 13 m of. water. Station BP-4 islocated approximately 1.4 km shoreward northeast! of the outfall terminus Figure 1!.Transect BP-4-A was established on top of the caprock shield, and Transect BP-4-8 is locatedapproximately 15 m to the east on the adjacent flat natural limestone substratum.
Transect BP-4-A
Transect BP-4-A was established on the basalt caprock that serve to protect the dischargepipe from storm damage. The caprock at this site range from 0.5 m to more than 1 m indimension and are spaced from overlapping contact with one another to about 2 m apart. Theopen areas between caprock are comprised of sand and loose coral rubble. Water depth to thetop of the caprock is 12.2 m. This transect has an orientation that follows the discharge pipeand thus is roughly perpendicular to the shoreline.
The results of the quantitative survey carried out at Transect BP-4-A are given inTable 8. The visual quadrat survey noted one sponge species Spirastrella coccinea! with amean coverage of 0.2% and four coral species Porites lobata, Pocillopora meandrina,P. eydouxi, and Montipora verrucosa! having a mean coverage of 19.7%. The census of
25

Percent Cover
Quadrat Distance Along Transect m!5 10 15
I. Quadrat Survey20
SpongesSpirastrella cocci nea
CoralsPorites lobataPoci7lopora meandrinaP. eydouxiMontipora verrucosa
SandRubbleHard Substratum
56 0.1130.8
150.2
1.50.13
3257.4
61070.2
31278
156
63.841.9
No. ofIndividualsII. Macroinvertebrate Census � x 20 m!
Phylum MolluscaConus miles
Phylum ArthropodaParibaccus antarcti cus
Phylum EchinodermataTripneustes grati llaZchinothrix caiamarisK diademaHolothuria atra
1114
16 2
III. Fish Census � x 20 m!
49 Species537 IndividualsEstimated Standing Crop = 374 g/m2
Nova: Results of the 5-m~ quadrat sampling visual appraisal! of the benthic community are presented in Part I, countsof diurnally exposed macroinvertebrates are given in Part II, and a summary of the fish census is presented in Part III.Water depth is l2.2 m; mean coral coverage is 19,7% visual quadrat method!.
26
TABLE 8. Summary of Biological Observations Made at Transect BP-4-A, Situated on theBasalt Caprock of the Barbers Point Discharge Pipe, Approximately 1,4 km Inshore North! ofBarbers Point Deep Ocean Outfall Terminus Station BP-4!, September 1993

macroinvertebrates noted six species: the cone shell Conus miles, a slipper lobster or ulapapa
Paribaccus antarcticus!, the black sea cucumber Holothuria atra, and three sea urchin species
Tripneustes grati lla, Echinothrix diadema, and E. calamaris!.The results of the photo-quadrat survey are given in Table 2. Noted were one coralline
algal species Porolithon onkodes! having a mean coverage of 0.3%, one encrusting spongespecies Spirastrella coccinea! having a mean coverage of 0.2%, and three coral species Porites lobata, Pocillopora meandrina, and P. eydoux~! having a mean coverage of 17.9%.
The results of the fish census carried out at Transect BP-4-A are presented in the
Appendix. Forty-nine fish species representing 537 individuals having an estimated biomass of374 g/m> were censused. The most abundant fish species included the cardinalfish or 'upapalu Apogon kallopterus!, the sidespot goatfish or malu Parupeneus pleurostigma!, the blackdamselfish or 'alo'ilo'i Dascyllus albisella!, the saddleback wrasse or hinalea lauwili Thalassoma duperrey!, the spectacled parrotfish or uhu 'ahu'ula Scarus perspicillatus!, thebulletnose parrotfish or uhu Scarus sordidus!, and the brown surgeonfish or ma'i'i'i Acanthurus nigrofuscus!. Species contributing most to the estimated standing crop at TransectBP-4-A included two yellowmargin moray eels or puhi paka Gymnothorax flavimarginatus�21% of the total!, the orangebar surgeonfish or na'ena'e Acanthurus olivaceus � 22% of thetotal!, and the orangespine unicomfish or umaumalei Naso lituratus � 7% of the total!.
Transect BP-4-B
Transect BP-4-B was established approximately 15 m to the east of Transect BP-4-A in
13.1 to 13.4 m of water Figure 4!. This transect has an orientation that is parallel to TransectBP-4-A as well as perpendicular to the shoreline. The substratum at this transect is flatlimestone with very little relief; over portions of this are areas of a sand/coral rubble veneeroverlying the limestone that does not usually exceed 2 cm in thickness and may cover up to50 m>. These patches of sand are spaced from 5 to 50 m apart.
Table 9 presents the results of the quantitative assessment carried out at Transect BP-4-B.The visual quadrat survey noted one algal species Sphacelaria furcigera! with a mean coverageof 0.7%, the encrusting red sponge Spirastrella coccinea having a mean coverage of 0.2%, thesoft coral Anthelia edmondsoni having a mean coverage of 0.06%, and two coral species Porites lobata and Pocillopora meandrina! having a mean coverage of 0.1%. Themacroinvertebrate census noted the presence of the cone shell Conus miles and the rock boringurchin Echinostrephus aciculatum.
The results of the photo-quadrat survey carried out at Transect BP-4-8 are given inTable 2. Noted were the alga Sphacelaria furcigera with a mean coverage of 0.7%, the spongeSpirastrella coccinea with a mean coverage of 0.06%, and two coral species Pocilloporameandrina and Porites lobata! with a mean coverage of 0.2%.
27
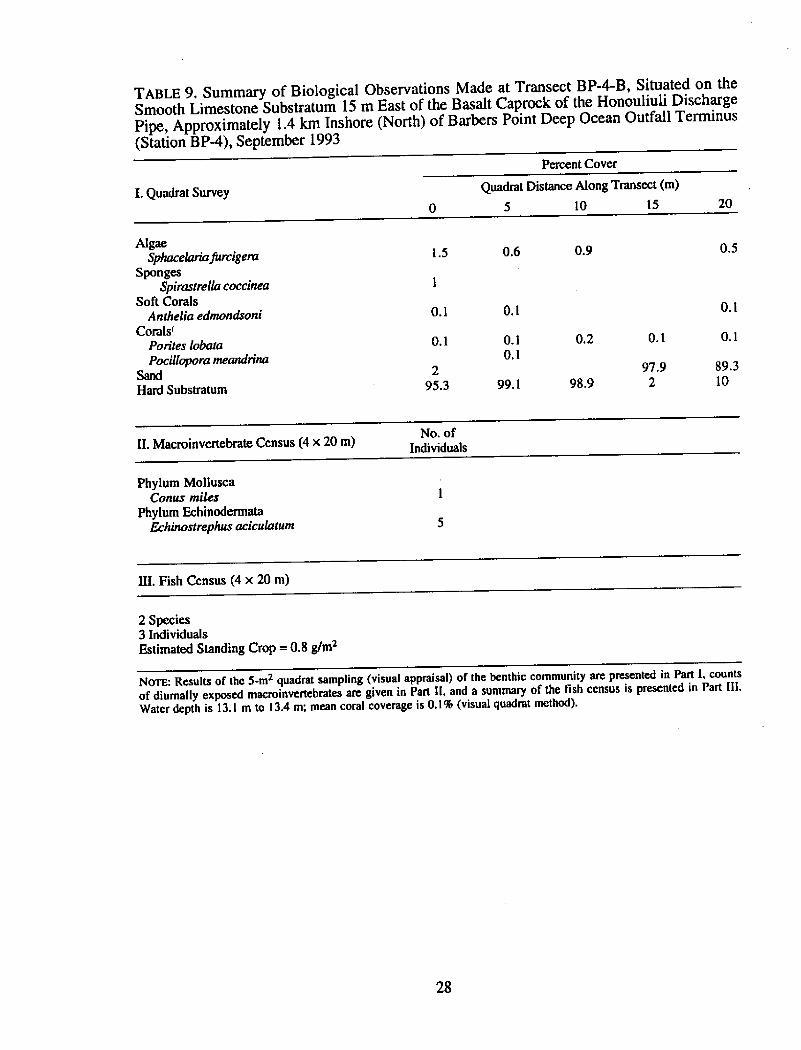
TABLE 9, Summary of Biological Observations Made at Transect BP-4-B, Situated on theSmooth Limestone Substratum 15 m East of the Basalt Caprock of the Honouliuli DischargePipe, Approximately l.4 km Inshore North! of Barbers Point Deep Ocean Outfall Terminus Station BP-4!, September 1993
Percent Cover
Quadrat Distance Along Transect m!5 10 15
I. Quadrat Survey20
AlgaeSphacelaria fu rcigera
SpongesSpi rastrella cocci nea
Soft CoralsAnthelia edmondsoni
Corals'Porites lobataPoci llopora meandrina
SandHard Substratum
0.50.90.61.5
O.l 0.1O.l
0.10.20.10.1
0,10.1
89.310
97.92
295.3 98.999.1
No. ofIndividualsII. Macroinvertebrate Census � x 20 m!
Phylum MolluscaConus miles
Phylum EchinodermataEchinostrephus aciculaturn
HI. Fish Census � x 20 m!
2 Species3 IndividualsEstimated Standing Crop = 0.8 g/ms
28
NoTa: Results of the 5-ms quadrat sampling visual appraisal! of the benthic community are presented in Part 1, countsof diurnally exposed macroinvertebrates are given in Part 11, and a summary of the fish census is presented in Part 111.Water depth is 13. l m to 13.4 m; mean coral coverage is 0.1% visual quadrat method!.

The results of the fish census carried out at Transect BP-4-B are presented in the
Appendix. Two fish species representing three individuals having an estimated standing cropof 0.8 g/m> were encountered at this transect.
Physical Measurements and Biological Parameters
Physical measurements made on the morning of 16 September 1993 are summarized inTable 10. Little variation was noted in temperature �5.1' to 25.7'C!, percent oxygen saturation�00% to 103%!, and salinity all 34%o! despite the fact that measurements for oxygen andtemperature were made both at 1 m below the water surface and about 1 m above the bottom.In all cases the secchi disk measurements did not yield an extinction value; water clarity wassuch that from the surface the disk was still visible on the bottom. Probably a better method ofdetermining water clarity would be to collect water samples and measure turbidity with anephalometer in the laboratory.
The biological data for both the 1991 and 1993 surveys are summarized as means foreach transect in Table 11. The means of all biological parameters measured in this survey i.e.,percent algal and coral cover; number of coral, other macroinvertebrate, and fish species;number of individual fish; and biomass of fishes! declined or reinained unchanged! from 1991to 1993. These changes may be related to impacts created by Hurricane Iniki in September1992 discussed below!. The Wilcoxon two-sample test applied to the annual mean data combining all transects during an annual sample period for each parameter, see Table 11!showed that there have been no statistically significant changes where significance is given atp 5 0.05! in the mean percent cover by algae p > 0.40, not significant! and by coral p > 0.33,not significant!; in the mean number of coral species p > 0.30, not significant!,inacroinvertebrate species p > 0.89, not significant!, and fish species p ! 0.80, notsignificant!; in the mean number of individual fish p ! 0.61, not significant!; and in the meanstanding crop of fish expressed in g/m> p > 0.90, not significant!.
In general, the topographic complexity of the substratum is much greater at Transects BP-1-A and -B, BP-3-A and -B, and BP-4-A than at the other transects i.e., BP-2-A and -B andBP-4-B! surveyed in this study. The low diversity of fishes at the latter transects is notsurprising in view of the little topographical relief present at those transect sites.
From a commercial fisheries standpoint, a number of important species have beenencountered at several of the transect sites, including the brick soldierfish or mempacbi Myripristes amaenus!, the mackeral scad or opelu Decapterus macarellus!, the manybargoatfish or moano Parupeneus multifasciatus!, the grey snapper or uku Aprion virescens!,the emperor or mu Monotmis grandoculis!, the octopus or he'e Octopus cyanea!, and thespiny lobster or 'ula Panuli rus marginatus!.
29
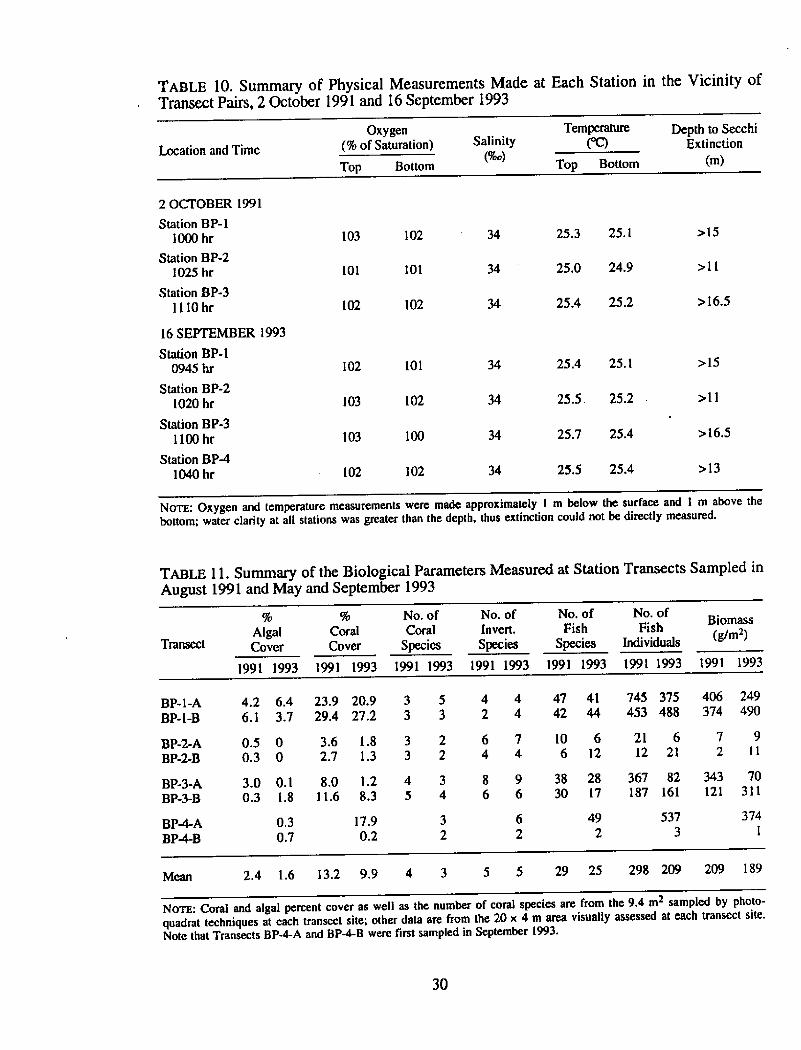
TABLE 10. Summary of Physical Measurements Made at Each Station in the Vicinity ofTransect Pairs, 2 October 1991 and 16 September 1993
Oxygen % of Saturation!
TemperaturePC!
Depth to SecchiExtinction
m!
Salinity %a!Location and Time
Top Bottom Top Bottom
25.3 25.1
25.0 24.9
25.4 25.2
>1534102103
101101
>16.5102102
25.4 25,1
25.5 25.2
25.7 25.4
25.5 25.4
>15101102
34102103
34103 >16.5
34102102 >13
NOTE: Oxygen and temperature measurements were made approximately l m below the surface and 1 m above thebottom; water clarity at all stations was greater than the depth, thus extinction could not be directly measured.
TABLE 11. Summary of the Biological Parameters Measured at Station Transects Sampled inAugust 1991 and May and September 1993
No. of No. of No. ofInvert. Fish FishSpecies Species Individuals
1991 1993 1991 1993 1991 1993 1991 1993
No. of
Algal Coral CoralCover Cover Species
1991 1993 1991 1993 1991 1993
Transect
BP-1-ABP-1-B
BP-2-ABP-2-B
BP-3-ABP-3-B
3741
5373
6 492 2
BP4-ABP-4B
2.4 1.6 13.2 9,9 4 3 5 5 29 25 298 209 209 189
NoTE: Coral and algal percent cover as well as the number of coral species are from the 9.4 m2 sampled by photo-quadrat techniques at each transect site; other data are from the 20 x 4 m area visually assessed at each transect site,Note that Transects BP-4-A and BPMB were first sampled in September l993.
30
2 OCTOBER 1991
Station BP-11000 hr
Station BP-21025 hr
Station BP-31110 hr
16 SEPTEMBER 1993
Station BP-10945 hr
Station BP-21020 hr
Station BP-31100 hr
Station BP-41040 hr
4.2 6.4 23,9 20.9 36.1 3.7 29.4 27,2 3
0.5 0 3.6 1.8 30.3 0 2.7 1.3 3
3.0 0.1 8.0 1.2 40.3 1.8 1 1.6 8,3 5
0.3 17.90.7 0.2
5 4 4 47 413 2 4 42 44
2 6 7 10 62 4 4 6 12
3 8 9 38 284 6 6 30 17
745 375453 488
21 612 21
367 82187 161
406 249374 490
7 92 ll
343 70121 3 l 1

Green Sea Turtle Observations
No green sea turtles Chelonia mydas! were encountered at any of the transect sites;however, individual turtles are commonly seen surfacing for air while transiting from Honolulu
Harbor to 'Ewa Beach. Most individuals seen are juveniles i.e., they are less than 80 cm in
straight line carapace length!.
DISCUSSION
On 11 September 1992 the Hawaiian islands were struck by Hurricane Iniki. Thehurricane passed directly over Kaua'i, with sustained winds of 144 mph and gusts to 172 mphresulting in considerable damage to improvements and forests on that island and the west leeward! coast of 0'ahu. To a lesser extent, high surf caused damage to marine communitiesalong the southern, eastern, and western shores of 0'ahu, Kaua'i, Maui, Lana'i, and Hawai'i;this damage was primarily to coral communities. In many areas a large amount of sand andother loose material was moved and/or advected out of the shallow areas i.e., depths of less
than 27 m! into deeper waters. On 0'ahu, storm waves emanating from the southeast were
estimated to exceed 7 m in height and were breaking in water at least 20 m deep personal
observations!.
Storm damage to benthic and fish communities is frequently patchy, resulting in a mosaicof destruction personal observations; Connell 1978; Walsh 1983!, and the occasional stormevent generating high surf is one of the most important parameters that determine the structureof Hawaiian coral communities Dollar 1982!. Because Hawaiian corals are relatively slow
growing, storm events need only to occur infrequently ca. every 20 to 50 years! to be a majorstructuring force Grigg 1983!. Corals may provide the topographical relief and shelternecessary for fish community development. Numerous studies have shown that storm-generated surf may keep coral reefs in a nonequilibrium or subclimactic state Grigg andMaragos 1974; Connell 1978; Woodley et al. 1981; Grigg 1983!, The large expanses of near-featureless lava or limestone substratum present around much of the Hawaiian islands at lessthan 30 m depths attest to the force and frequency of these events Brock and Norris 1989!.The wave forces also impinge upon and impact fish communities Walsh 1983!.
Hurricane Iniki caused damage to coral communities at all four study sites. The greatestimpact occurred to the benthic communities at Station BP-3, where many coral coloniescompletely disappeared or were reduced to rubble. Other sites were entirely covered with coralrubble at scales from 10 m2 to over 30 m2. In some cases a "blanket" up to 0.5 m of rubble
buried coral colonies or killed the lower portions of larger colonies. The hurricane broke many
31

coral colonies into pieces; some of these have survived where they have been lodged into thesubstratum. These live fragments are responsible for local increases in the diversity of species,
and this fragmentation serves as a viable means of reproduction and dispersal for some coral
species Highsmith 1982!. Coral rubble and live fragments fill in depressions and holes that
otherwise serve as shelter for cryptic fish and invertebrates, thus reducing the complexity of the
habitat. This usually results in a decrease in the diversity of species present and may explain
some of the declines seen between the 1991 and 1993 surveys. Despite the large changes that
occurred in the coral communities of the Barbers Point region, inany of the benthic components
have survived and the communities are recovering, as evidenced by the new coral recruits seen
at all'stations. However, since Hawaiian corals are relatively slow growing, it will be years
before the impact of Hurricane Iniki will no longer be evident in the benthic communities at the
study sites.
The results from the 1991 and 1993 surveys showed that the coral and fish communities
are better developed at the eastern BP-1! and western BP-3! stations relative to the middle
station BP-2!. The relatively scoured appearance of the substratum and poor coral
development at Station BP-2 suggest that this area receives occasional wave impact, which
curtails the development of the coral community. The poor coral development results in a lack
of topographical complexity. This lack of appropriate shelter translates into poor development
of the fish community at that location. From the shoreline to a depth of about 20 m, the
Barbers Point discharge pipe is buried in a trench and covered with armor rock. This rock
cover is very incomplete from the shoreline to a depth of about 12 m; from that point seaward,
it forms low mounds up to 1 m above the surrounding substratum! that overlie the buried
pipe. If the movement of sand over the relatively flat and featureless limestone substratum is
causing sand scour that retards the development of the coral community, it follows that corals
should be common on the armor rock that rises above the substratum. In this setting, benthic
species such as corals! settling on this rock would be elevated above and out of the influence
of the abrasion and scour that otherwise occurs on the surrounding substratum. Similarly, if
sewage effluent continues to play a role in eliminating corals from the limestone and armor
rock, then corals should be rare or absent from both locations.
To test these hypotheses, Station BP-4 was established, with Transect BP-4-A on the
basalt armor rock of the discharge alignment and Transect BP-4-B approximately 15 m to the
east on the flat limestone substratum. As noted in the Results section, the survey data show that
the benthic and fish communities are well developed on the elevated armor rock and poorly
developed on the adjacent limestone flat that is subjected to periodic scouring. Also apparent is
the fact that the corals at Transect BP-4-A show a considerable range in size on the armor rock;
the largest corals are no older than the time of outfall construction when the armor rock was
32
placed, and the smaller corals represent more recent recruitment events. Thus the range in sizesof corals shows that their recruitment has continued despite the operation of the outfall.
The working hypothesis is that all four study sites, being situated in relatively shallowwater, are outside the zone of influence of the present Barbers Point deep water outfall.However, if impacts from the present outfall are occurring to the shallow-water coral reef areasshoreward of the outfall, our monitoring should be able to quantitatively discern these impacts.Because of bottom time constraints, potential dangers with deep diving, and the fact that coralcommunity development is usually greatest in water less than 30 m deep, the placement ofbiological monitoring stations was restricted to waters less than 20 m deep in this study.
Much of the geographical area of concern in this study has probably been impacted byboth point and nonpoint sources of pollution for years. In general, the nearshore currentsparallel the shoreline and have a net westerly movement along the coastline Laevastu et al.1964!; thus stream and industrial inputs from Honolulu Harbor, Keehi Lagoon, and PearlHarbor situated to the east would be carried in a westerly direction toward the area offshore of'Ewa Beach. Also, from 1955 to 1977 the old Honolulu sewer outfall located 15 km to theeast of the present study area! released 62 mgd � m>/s! of raw sewage in 10 m of wateroffshore of Sand Island. This material was undoubtedly diluted but probably advected
primarily in a west-southwest direction.Presumably the present Barbers Point outfall releases sewage well offshore at a 61 m
depth, and little interaction occurs with the inshore biota. However, if the material was carriedinto inshore waters, impacts would probably occur to shallow marine communities situatedprimarily to the west of the outfall � if the information on nearshore currents is correct seeLaevastu et al. 1964; Bathen 1978!. Thus the eastern station BP-1! is viewed as a control site,and the station inshore and adjacent to the discharge pipe BP-2! as well as the station to thewest BP-3! serve as experimental sites. The spatial separation of the stations precludes directcomparison of data among stations. Comparison of the biological data for each station showedthat there were no statistical changes between the 1991 and 1993 sampling periods, suggestingthat the operation of the outfall has not resulted in measurable negative impacts.
Relative to many other locations in the Hawaiian islands, the fish communities are welldeveloped at the eastern BP-1!, western BP-3!, and pipe � armor rock BP-4-A! stations. Thehigh-standing crop estimates are much greater than found on most coral reefs; the maximumfish standing crop encountered on natural coral reefs is about 200 g/m> Goldman and Talbot1975; Brock et al. 1979!. Two explanations for the high biomass of fishes censused at thestudy stations are �! the shelter created by the natural topographical relief serves to attractmany fishes, thus locally enhancing the fish community, and �! chance encounters with
33
roving predators or planktivorous schooling species during censuses serve to increase the
biomass estimates.
Space and cover are important agents governing the distribution of coral reef fishes Risk1972; Sale 1977; Gladfelter and Gladfelter 1978; Brock et al. 1979; Ogden and Ebersole 1981;
Anderson et al. 1981; Shulman et al. 1983; Shulman 1984; Eckert 1985; Walsh 1985; Alevizon
et al. 1985!. Similarly, the standing crop of fishes on a reef is correlated with the degree of
vertical relief of the substratum. Thus Brock �954!, using visual techniques on Hawaiian
reefs, estimated the standing crop of fishes to range from 4 g/m2 on sand flats to 186 g/m2 in
an area of considerable vertical relief. If structural complexity or topographical relief is
important to coral reef fish communities, then the addition of materials to increase this relief in
otherwise barren areas may serve to locally enhance the biomass of fish. Such manipulations
are well known and usually take the form of artificial reefs. Artificial reefs in Hawaiian waters
may serve to increase fish standing crops to more than 1 kg/m~ Brock and Norris 1989!.Chance encounters with large roving predators such as the emperor or mu [Monotaxis
grandoculis] and the grey snapper or uku [Aprion virescens]! or schools of planktivorous
fishes such as the mackeral scad or opelu [Decapterus macarellus], the sleek unicornfish or
kala bolo [Naso hexacanthus], the milletseed butterfly fish or lauwiliwili [Chaetodon miliaris],
and the sergeant major or mamo [Abudefduf abdominalis]! may greatly increase the counts and
biomass on a particular transect. The presence of natural topographical relief in the vicinity of
Stations BP-1 and BP-3 as well as Transect BP-4-A serves to focus numerous predators and
planktivorous fishes near these locations. Many of these species have home ranges that are
considerably larger than the area covered by our transects, making encounters during a census
a haphazard event. The inclusion of these fishes in a census will result in higher biomass
estimates.
Schooling species such as Naso hexacanthus, Monotaxis grandoculis, Decapterus
macarellus, and the orangebar surgeonfish or na'ena'e Acanthurus olivaceus! all contributed
substantially to the standing crop at several transects. At Transect BP-1-A Monotaxis
grandoculis contributed 22% of the biomass and Naso hexacanthus accounted for 31%. At
Transect BP-1-B Decapterus macarellus comprised 59% of the standing crop, at Transect BP-3-A Acanthurus olivaceus made up 19%, and at Transect BP-3-B Decapterus macarellus
contributed 58% owing to a chance encounter with a school. Interestingly, other than two
yellowmargin moral eels or puhi paka Gymnothorax flavimarginatus!, none of the fish speciescensused at Transect BP-4-A contributed more than 5% to the estimated biomass present.
Relatively large solitary predators often contributed to the estimated standing crop at a location;
a single grey snapper or uku Aprion virescens! made up 7% of the biomass at Transect BP-1-A, 32% at Transect BP-3-A, and 5% at Transect BP-3-B.
34
CONCLUSION
The siting of the permanent stations near the Barbers Point Ocean Outfall to capitalize onpresumed gradient s! of impact that may be created by the discharge and movement of treatedsewage effluent toward shore and the annual quantitative survey of these stations should allowa delineation of the changes that may be caused by the effluent. In the 1991 and 1993 surveysno statistically significant change was detected at the permanent survey stations, despite theimposition of a major hurricane on the marine communities in September 1992. Thus the datato date support the contention that the operation of the Barbers Point deep ocean outfall is nothaving a quantifiable impact on the coral reef resources situated inshore of the discharge.
REFERENCES CITED
Alevizon, W., R. Richardson, P. Pitts, and G. Serviss. 1985. Coral zonation and patterns ofcommunity structure in Bahamian reef fishes. Bull. Mar. Sci. 36:304-318.
Anderson, G.R.V., A.H. Ehrlich, P.R, Ehrlich, J.D. Roughgarden, B.C. Russell, and F.H.Talbot. 1981. The community structure of coral reef fishes. Am. Nat. 117:476-495.
Bathen, K.H. 1978. Circulation atlas for Oahu, Hawaii. Sea Grant Misc. Rep. UNIHI-SEAGRANT-MR-78-05, University of Hawaii Sea Grant College Program, Honolulu.94 pp.
Brock, R.E. 1982. A critique on the visual census method for assessing coral reef fishpopulations. Bull. Mar. Sci. 32:269-276.
Brock, R.E., C. Lewis, and R.C. Wass. 1979. Stability and structure of a fish community ona coral patch reef in Hawaii. Mar. Biol. 54:281-292.
Brock, R.E., and J.E. Norris. 1989. An analysis of the efficacy of four artificial reef designsin tropical waters. Bull. Mar. Sci. 44:934-941.
Brock, V.E. 1954. A preliminary report on a method of estimating reef fish populations. JWildlife Mgrnt. 18:297 � 308.
Connell, J. 1978. Diversity in tropical rain forests and coral reefs. Science 199:1302-1310.
Dollar, S.J. 1982. Wave stress and coral community structure in Hawaii. Coral Reefs 1:71�81.
Eckert, G.J. 1985. Settlement of coral reef fishes to different natural substrata and at differentdepths. Proc. 5th Int. Coral Reef Congr. 5:385-390.
Evans, E.C. editor!. 1974. Pearl Harbor biological survey - final report. Report No. NUC-TN-1128, Naval Undersea Center, Hawaii Laboratory.
35
Gladfelter, W.B., and E.H. Gladfelter. 1978. Fish community structure as a function ofhabitat structure on West Indian patch reefs. Rev. Biol. Trop. 26 Supplement I!:65-84.
Goldman, B., and F.H. Talbot. 1975. Aspects of the ecology of coral reef fishes. In Biologyand geology of coral reefs. Vol, III, Biology 2, ed. O.A. Jones and R. Endean, 124-154. New York: Academic Press.
Grigg, R. 1983. Community structure, succession and development of coral reefs in Hawaii.Mar. Ecol. Prog. Ser. 11:1 � 14.
Grigg, R., and J. Maragos. 1974. Recolonization of hermatypic corals on submerged lavaflows in Hawaii. Ecology 55:387-395.
Highsmith, R.C. 1982. Reproduction by fragmentation in corals; Mar;-Ecol. Prog. Ser.7:207-226.
Laevastu, T., D.E. Avery, and D.C. Cox. 1964. Coastal currents and sewage disposal in theHawaiian Islands. HIG-64-1, Hawaii Institute of Geophysics, University of Hawaii,Honolulu. 101 pp.
Ogden, J.C., and J.P. Ebersole. 1981. Scale and community structure of coral reef fishes: Along-term study of a large artificial reef. Mar. Ecol. Prog. Ser. 4:97-104.
Ricker, W.E. 1975. Computation and interpretation of biological statistics of fish populations.Bull. Fish. Res. Bd. Canada 191. 382 pp.
Risk, M.J. 1972. Fish diversity on a coral reef in the Virgin Islands. Atoll Res. BulL 153:1-6.
Sale, P.J. 1977. Maintenance of high diversity in coral reef fish communities. AIn. Nat.111:337-359.
SAS Institute, Inc. 1985. SAS user's guide: Basics, version 5 edition. SAS Institute Inc.,Cary, N.C. 1,290 pp.
Shulman, M.J. 1984. Resource limitation and recruitment patterns in a coral reef fishassemblage. J. Exp. Mar. Biol. Ecol. 74:85-109.
Shulman, M.J., J.C. Ogden, J.P. Ebersole, W.N. McFarland, S.L. Miller, and N.G. Wolf.1983. Priority effects in the recruitment of juvenile coral reef fishes. Ecology 64:1508-1513.
Siegel, S. 1956. Nonparametric statistics for the behavioral sciences. New York: McGraw-HillBook Co. 312 pp.
Sokal, R.R., and F.J. Rohlf. 1981. Biometry. 2nd ed. New York: W.H. Freeman. 855 pp.
Walsh, W.J. 1983. Stability of a coral reef fish community following a catastrophic storm.Coral Reefs 2:49-63.
Walsh, W.J. 1985. Reef fish community dynamics on small artificial reefs: The influence ofisolation, habitat structure, and biogeography. Bull. Mar. Sci. 36:357-376.
Woodley, J.D., and 19 others. 1981. Hurricane Allen's impact on Jamaican coral reefs.Science 214:749-755.
APPENDIX

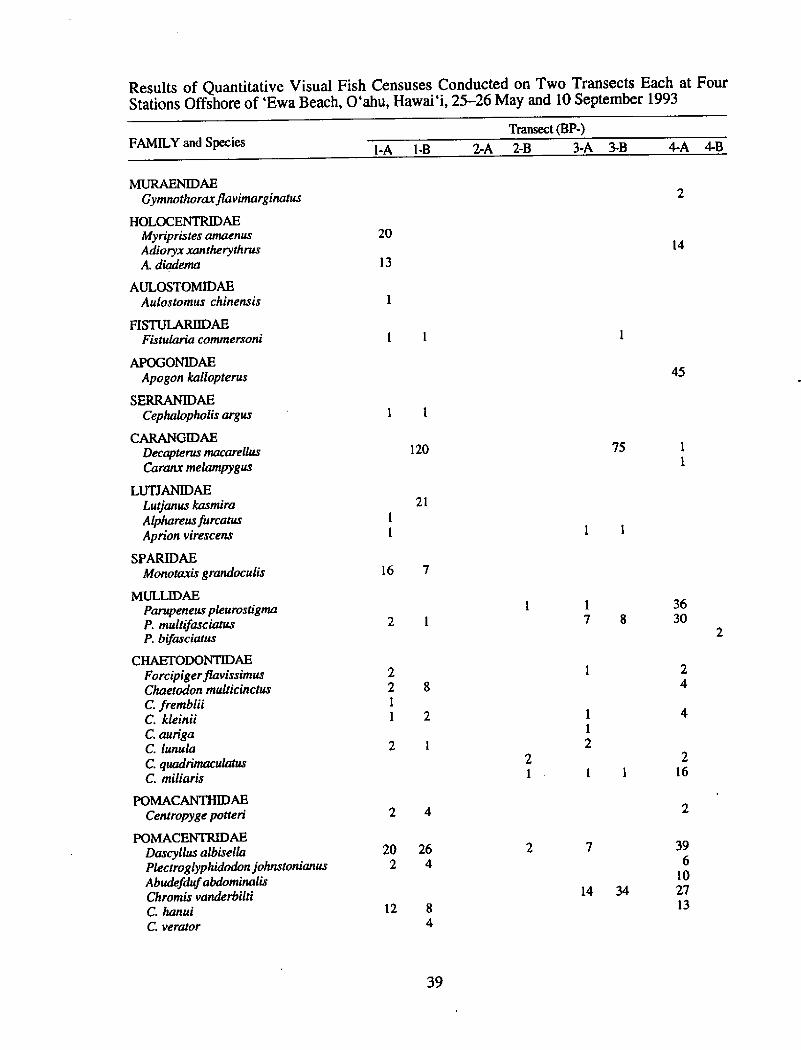
Transect BP-!FAMILY and Species I-A I-B 2-A 2-B 3-A 3-B 4-A 4-B
MURAENIDAEGymnothorax flavimarginatus
HOLOCENTRIDAEMyripristes amaenusAdioryx xanthery thrusA, diadema
2014
13
AULOSTOMIDAEAulostomus chinensis
FISTULARIIDAEFistularia commersoni I I
APOGONIDAEApogon kallopterus
SERRANIDAECephalopholis argus
CARANGIDAEDecapterus macarellusCaranx melampygus
LUTJANIDAELutj'anus kasmi raAlphareus furcatusApri on vi rescens
45
I I
75120
I I
SPARIDAEMonotaxis grandoculis
MULLIDAEParupeneus pleurostigmaP. multifasciatusP. bifasciatus
CHAETODONTIDAEForcipiger flavissimusChaetodon multicinctusC. frembliiC. kleiniiC aurigaC. lunulaC. quadrimaculatusC. miliaris
16 7
3630
I7 82 I
22 8II 2
2 12
16
POMACM4THIDAECentropyge potteri
POMACENTRIDAEDascyllus albisellaPlectroglyphidodon j ohnstonianusAbudefduf abdominalisChromis vanderbiltiC. hanuiC. verator
2 4
39 6102713
20 262 4
14 34
12 84
39
Results of Quantitative Visual Fish Censuses Conducted on Two Transects Each at FourStations Offshore of 'Ewa Beach, 0'ahu, Hawai'i, 25-26 May and 10 September 1993
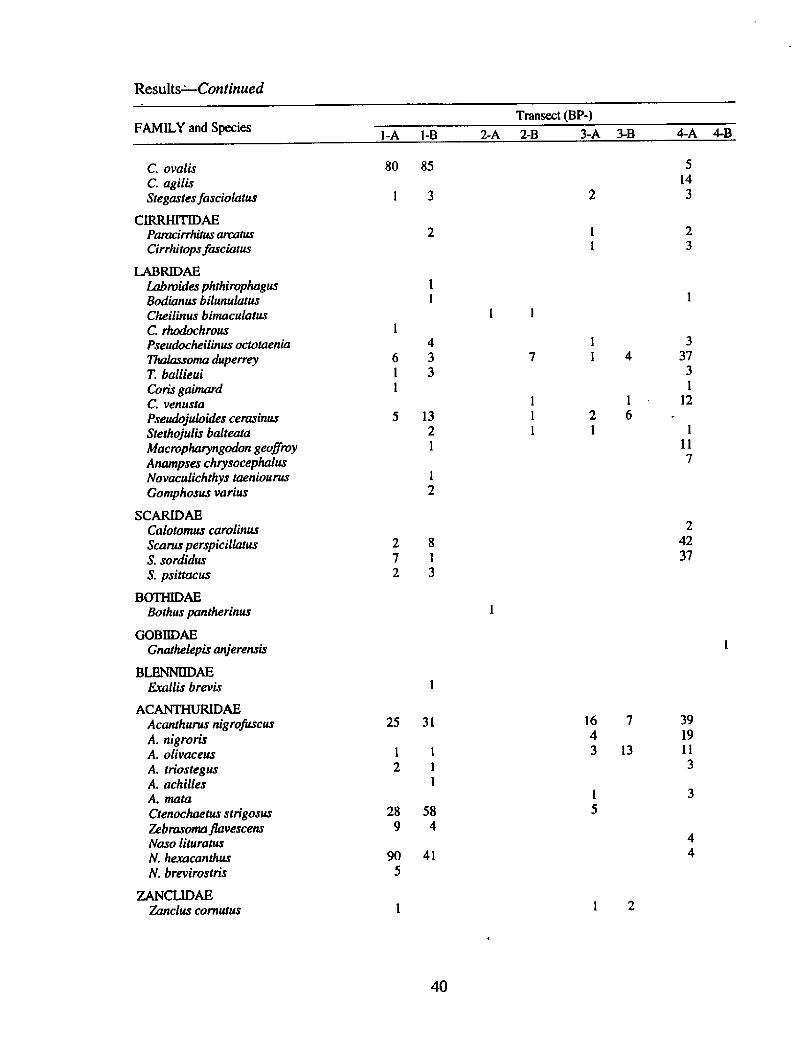
Transect BP-!FAMILY and Species
1-A 1-B
5
14 380 85
1 3
1 1
46 31 31
3
37 3 1121
2 61
5 1321
I117
SCARIDAECalotomus carolinusScarus perspici llatusS. sordidusS, psittacus
24237
2 872 3
BOTHIDAEBothus pantherinus
8LENNIIDAEZrallis brevis
16 7
4 3 133919113
25 31
1 12 1
1
28 589 4
90 415
ZANCUDAEZanclus cornutus
40
Results � 'Continued
C. ovalisC. agilisStegastes fasciolatus
CIRRHITIDAEParaci rrhitus arcatusCirrhi tops fasciatus
LAB RIDAELab roides phthirophagusBodianus bilunulatusChei linus bi maculatusC. rhodochrousPseudocheilinus octotaeniaThalassoma duperreyT. ballieuiCoris gaimardC. venustaPseudoj uloides cerasinusStethoj ulis balteataMacropharyngodon geo+royAnampses chrysocephalusNovaculichthys taeniourusGomphosus vari us
GOB HDAEGnathelepis anj erensis
ACPZZTMAUDAEAcanthurus nigrofuscusA. nigrorisA. oli vaceusA. triostegusA. achillesA, mataCtenochaetus strigosusZebrrtsoma flavescensNaso lituratusN. hexacanthusN. brevirostris
2-A 2-8 3-A 3-B 4-A 4-B
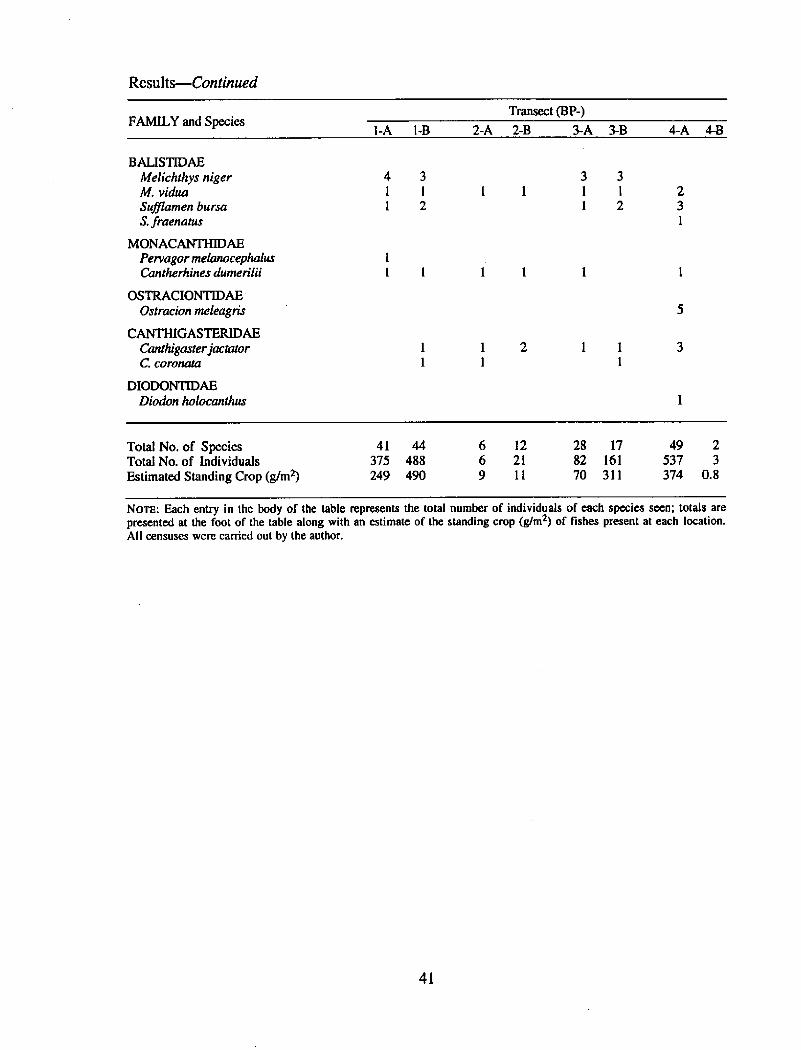
Results � Continued
Transect BP-!FAMILY and Species
2-A 2-B 3-A 3-BI-A I-B 4-A 4B
1 1
MONACANTHIDAEPervagor melanocephalusCantherhines dumerilii
11 1 1 1
1 21
1 11
DIODONTIDAEDiodon holocanthus
NOTE: Each entry in the body of the table represents the total number of individuals of each species seen; totals arepresented at the foot of the table along with an estimate of the standing crop g/m~! of fishes present at each location.All censuses were carried out by the author,
41
8ALISTIDAEMelichthys nigerM. viduaSufUamen bursaS. fraenatus
OSTRACIONTIDAEOstracion meleagris
CANTHIGASTERIDAECanthi gaster j aeratorC, coronata
Total No. of SpeciesTotal No. of IndividualsEstimated Standing Crop g/m~!
4 31 11 2
41 44375 488249 490
6 126 219 11
3 31 11 2
28 17 49 282 161 537 370 311 374 0.8