Asynchronous Signaling in Global Equity Markets Based on ...
19
International Business Research; Vol. 10, No. 8; 2017 ISSN 1913-9004 E-ISSN 1913-9012 Published by Canadian Center of Science and Education 173 Asynchronous Signaling in Global Equity Markets: Based on Opening Times Huijian Dong 1 1 College of Business, 2043 College Way, Forest Grove, OR 97116, USA Correspondence: Huijian Dong, College of Business, 2043 College Way, Forest Grove, OR 97116, USA. Received: May 12, 2017 Accepted: July 14, 2017 Online Published: July 14, 2017 doi:10.5539/ibr.v10n8p173 URL: https://doi.org/10.5539/ibr.v10n8p173 Abstract This paper employs cointegration tests to identify the impacts of sequential opens of global equity market among the equity indices. We use the daily data of 31 major equity markets and explore the comovement relationship according to the sequence of the market open. This study also examines the impact of the 2008 global financial crisis to such comovement relationship. Our results indicate that the markets in Europe-Middle East, Asia-Pacific and Latin America, are less affected by the levels of earlier opens of other markets. After the end of 2007, the global equity market comovement pattern changed significantly, yet the interdependence of markets was not unanimously strengthened. The size of an equity market does not dictate its range and power of impact, as we find that a large size market can still be cointegrated with small size markets, while a small size market is almost always cointegrated with large size markets. Keywords: global equity market, cointegration, comovement, financial crisis JEL codes: C32. G01, G15 1. Introduction The transmission of information and values among international stock markets refers to two systems of relationships: comovement of stock market prices, and contagion of market trends. This research studies the interdependence in the first system. In the past two decades the degree of the global equity market price interdependence and contagion had increased significantly. Masih and Masih (2001), Jeon and Von Furstenberg (1990) and Arshanaoalli and Doukas (1993) documented a significant change in international stock market linkages after the 1987 financial crash. This violates a series of asset pricing theories, including the well-known Capital Asset Pricing Model and Fama-French three-factor model, which suggest that stock prices are related by a relative risk premium to a single market portfolio, but little support can be found for the proposition that all market portfolios in the various global markets share risk premium. Considering the different fundamentals in each of the major economies, their market portfolios, which are usually regarded as weighted averages of all the assets in the markets, vary greatly in the levels of returns and their variances across regions and economies. Therefore, the motivation for this study is to explain the contradiction between the observed comovements of global security markets and the existing asset pricing theory. This study has two important implications for understanding global equity markets. First, the tests of stock market synchronism can offer an evaluation of the efficiency of the investment strategy of diversifying portfolios globally. If markets are asynchronous, global diversification strategies are more robust and the risk premium of portfolios can be diluted by allocating portfolio across country borders. Several issues in financial economics cannot be addressed without an assumption about whether asset markets are cointegrated or segmented internationally. For instance, the measure of the weighted average capital cost needs to consider where capital should be raised if the markets are segmented and thus present asynchronous price fluctuation. Second, tests of correlation and comovement relationships shed light on the Efficient Market Hypothesis (EMH). If indexes are cointegrated and the movements of some stock markets have a causality relationship with others, the weak form of market efficiency is violated since historical data can be used to forecast the index return in the future. Previous studies suggest alternative definitions of several related concepts including contagion, spillover, interdependence, interaction, linkages, correlation, comovement, integration, and cointegration. Dong, Bowers,
Transcript of Asynchronous Signaling in Global Equity Markets Based on ...

International Business Research; Vol. 10, No. 8; 2017
ISSN 1913-9004 E-ISSN 1913-9012
Published by Canadian Center of Science and Education
173
Asynchronous Signaling in Global Equity Markets:
Based on Opening Times
Huijian Dong1
1College of Business, 2043 College Way, Forest Grove, OR 97116, USA
Correspondence: Huijian Dong, College of Business, 2043 College Way, Forest Grove, OR 97116, USA.
Received: May 12, 2017 Accepted: July 14, 2017 Online Published: July 14, 2017
doi:10.5539/ibr.v10n8p173 URL: https://doi.org/10.5539/ibr.v10n8p173
Abstract
This paper employs cointegration tests to identify the impacts of sequential opens of global equity market among
the equity indices. We use the daily data of 31 major equity markets and explore the comovement relationship
according to the sequence of the market open. This study also examines the impact of the 2008 global financial
crisis to such comovement relationship. Our results indicate that the markets in Europe-Middle East, Asia-Pacific
and Latin America, are less affected by the levels of earlier opens of other markets. After the end of 2007, the
global equity market comovement pattern changed significantly, yet the interdependence of markets was not
unanimously strengthened. The size of an equity market does not dictate its range and power of impact, as we
find that a large size market can still be cointegrated with small size markets, while a small size market is almost always cointegrated with large size markets.
Keywords: global equity market, cointegration, comovement, financial crisis
JEL codes: C32. G01, G15
1. Introduction
The transmission of information and values among international stock markets refers to two systems of
relationships: comovement of stock market prices, and contagion of market trends. This research studies the interdependence in the first system.
In the past two decades the degree of the global equity market price interdependence and contagion had
increased significantly. Masih and Masih (2001), Jeon and Von Furstenberg (1990) and Arshanaoalli and Doukas
(1993) documented a significant change in international stock market linkages after the 1987 financial crash.
This violates a series of asset pricing theories, including the well-known Capital Asset Pricing Model and
Fama-French three-factor model, which suggest that stock prices are related by a relative risk premium to a
single market portfolio, but little support can be found for the proposition that all market portfolios in the various
global markets share risk premium. Considering the different fundamentals in each of the major economies, their
market portfolios, which are usually regarded as weighted averages of all the assets in the markets, vary greatly
in the levels of returns and their variances across regions and economies. Therefore, the motivation for this s tudy
is to explain the contradiction between the observed comovements of global security markets and the existing asset pricing theory.
This study has two important implications for understanding global equity markets. First, the tests of stock
market synchronism can offer an evaluation of the efficiency of the investment strategy of diversifying portfolios
globally. If markets are asynchronous, global diversification strategies are more robust and the risk premium of
portfolios can be diluted by allocating portfolio across country borders. Several issues in financial economics
cannot be addressed without an assumption about whether asset markets are cointegrated or segmented
internationally. For instance, the measure of the weighted average capital cost needs to consider where capital should be raised if the markets are segmented and thus present asynchronous price fluctuation.
Second, tests of correlation and comovement relationships shed light on the Efficient Market Hypothesis (EMH). If
indexes are cointegrated and the movements of some stock markets have a causality relationship with others, the weak form of market efficiency is violated since historical data can be used to forecast the index return in the future.
Previous studies suggest alternative definitions of several related concepts including contagion, spillover,
interdependence, interaction, linkages, correlation, comovement, integration, and cointegration. Dong, Bowers,

http://ibr.ccsenet.org International Business Research Vol. 10, No. 8; 2017
174
and Latham (2013) and Dong (2011) summarizes the previous methods and suggests using cointegration to
measure two equivalent terms, interdependence and comovement. If two or more time series of global stock
markets indexes are individually integrated at the same order and certain linear combinations of them have a
lower order of integration, then the series are considered to be cointegrated. To sum up, the definitions used in
this study, interdependence, comovement, or cointegration of stock returns all refer to the phenomenon of stock markets indexes moving toward similar trends.
While this study distinguishes interdependence and contagion, with the former refers to the cointegration and the
latter refers to the causality, the phenomena of price comovement and causality transmission are closely related.
Obviously, a higher level of interdependence in the stock price level results from a causality in which one equity
market index moves after another index. Dalkir (2009) offers evidences that comovement levels of stock market
indexes increase during volatile periods and stay persistently when the crisis has passed. The belief that
interdependence between markets is high during the volatile period turns into reality by correlated actions of traders in different markets preventing correlation from falling to its previous level.
Compared with the previous studies, the results of this paper cover the most recent financial crises for the a large
sample set of 31 indices, including the global recession from 2007 to 2009. Most previous literatures suggest that
the major past crises are the 1997 Asian financial crisis, the 1987 financial crash, and the 2000 dot-com bubble
crisis. Therefore we include these suggested breakpoints in the cointegration tests. Allowing structural breaks in
this study can capture the interdependence effects more precisely in both long run and short run. Jong and Roon
(2005) and Pesaran, Pettenuzzo and Timmermann (2006) suggest that failure to allow for structural breaks will bias volatility tests.
The literature related to this study can be viewed from two opposite empirical findings and their implications for the
efficient market hypothesis (EMH) and the market asynchronous phenomenon (MAP). If the historical data of a
market index can effectively forecast its future level, then the efficient market hypothesis is violated. If the returns
and risks across different markets in the world are the heterogeneous, so that allocating assets across countries can effectively reduce portfolio risk and increase returns, then the market asynchronous phenomenon is detected.
A comparison of past studies reveals that different methodologies do not lead to opposite conclusions on
international integration. Both the studies that support and do not support the EMH and MAP use cointegration
models and GARCH models. The comparison also reveals that the frequency of data is irrelevant in leading to
different conclusions. In both the studies that are consistent with the EMH and MAP and those that are inconsistent,
all types of data frequencies are observed, from hourly to quarterly. However, differences in the particular datasets
being used in the two groups of studies are the reason for the different conclusions, and this underscores the importance of employing a wide range of world indices and applying appropriate structural breaks in this paper.
Specifically, Eryigit and Eryigit (2009) uses daily data from June 1995 to February 2008 from 143 market indices
and concludes that there is an increasing integration of the international markets and it is mostly geography based
clustering behavior, especially for the daily return data. Syriopoulos and Roumpis (2009) uses cointegration test
and daily data from January 1997 to September 2003 from five European countries and the United States to
conclude that market comovements towards a stationary long-run equilibrium path. Central European markets tend
to display stronger linkages with their mature counterparts, whereas the USA market holds a world leading
influential role. Chancharat (2008) uses GARCH model and monthly data from December 1987 to April 2007
from 15 world major countries sand concludes that first moment interdependence is not persistent in the long run; while in a shorter period, Hong Kong market influences Thailand market without feedback.
On the other hand, Karunanayake, Valadkhani and O'Brien (2010) uses MGARCH model and weekly data from
January 1992 to June 2009 from the Australian, Singapore, U.S, and U.K markets and conclude that the recent two
financial crises do not cause break in the first moment interdependence, but increase the second moment contagion,
which is unidirectional from the bigger markets to smaller ones. Elfakhani, Arayssi, and Smahta (2008) uses
cointegration test and monthly data from May 1997 to September 2002 from 27 emerging market country indexes
and 11 Arab countries indexes and concludes that the length of the dataset is insufficient and the frequency of data
is not high enough to capture the volatility contagion. Mylonidis and Kollias (2010) uses daily data from January
1999 to July 2009 from Germany, France, Spain, and Italy and concludes that there are some significant differences in the pattern of convergence before and after late 1990s.
Recently, researchers have extended their study range and have included more markets, sometimes more than 30
markets are considered. Even though there are arguments about the impact of regional versus industry sector
effect on the market comovement, a majority of the studies believe that the sector effect has a lesser influence, for example, Eun and Lee (2010).

http://ibr.ccsenet.org International Business Research Vol. 10, No. 8; 2017
175
While most past studies utilize common trading hours among few sample economies or a single point of time in
a day to test interdependence, this study considers the open and close sequences of the 31 economies. In addition,
some studies relate the issue of international equity market contagion to the issue of foreign exchange rates. For
example, Heimonen (2002) finds that the U.K and Germany markets are integrated with the U.S. market, but the
Japan and Finland markets are independent. Exchange rate fluctuations may lead to the benefit of international
portfolio diversification being overestimated. Our paper, however, measures and verifies international stock
market aggregate cointegration as a phenomenon instead of its reason; therefore we do not specify the components of the comovement.
The study by Bae, Karolyi, and Stulz (2003), consistent with our results, concludes that contagion is more
significant in Latin America than in Asia and is also more powerful across regions. However, they find the U.S.
market is free from Asian contagion but we observe a bidirectional contagion. Specifically, our results show that
many Asia markets, including India and Singapore, have the feedback causality to the U.S. market. But this relation disappears after the 2007 crisis.
Our results are mostly consistent with the study by Bessler and Yang (2003). They conclude that the Japan market
is independent, compared with the CAN and FRA markets. The USA market is largely affected by its historical
innovations, and it is also the unique market to have a long time impact on other markets. However, we find the
Dow Jones index has a unit root almost significantly and historical data within the ten day window is not useful in predicting future movements.
Different from our conclusions, the study by Li (2007) concludes that the cointegration between CHN and USA is
insignificant, but the CHN and HGK markets are cointegrated. However, our results imply weak link between the
China and the U.S. markets. The study by Morana and Beltratti (2008) concludes that the USA, GBR, DEU, and
JPN stock markets are having a high level of cointegration and causality. This link is stronger for the USA and
Europe markets, but not for the JPN market. Consistent with their conclusion, we only find a significant causality from the USA market to the JPN market in the first subsample period in our study.
The study by Baharumshah, Sarmidi and Tan (2003) concludes that market cointegration between the Asian
emerging markets and the USA increased since the Asian crisis. Our study, however, does not conclude a higher
price spillover between the United States market and the Asia market after the 1997 crisis. In addition, we find the
U.S. market dominates the global markets all the time and Japan market is much less influential. The increasing
correlation between MYS and TWN is confirmed but the MYS and KOR markets are still isolated. The different
results seem to be generated by different dataset. Their dataset is from 1988 to 1999 and the frequency of data is weekly.
Berben, Robert-Paul, and Jansen (2005) conclude that Correlations among the USA, DEU and GBR stock markets
have increased while the JPN correlation is constant. Nevertheless, our results are mixed: the Germany and the
United Kingdom markets are cointegrated with the U.S. market in the long run but not after the 2007 crisis, and there is no feedback.
Furthermore, our study reveals opposite findings against Dungey, Fry, and Martin (2008), which employs data for
6 years. We suggest that the Australia market is not cointegrated with most of the Asia markets: in the long run,
only Japan and New Zealand markets, and in the short run Hong Kong and New Zealand. Second, contagion between Australia and the rest of the world is significant bi-directionally.
Inconsistent with the study by Eryigit and Eryigit (2009), which concludes an increasing integration of the
international markets and it is mostly geography based clustering behavior, especially for the daily return data, we
find that the integration of international markets decreases after the 2007 financial crisis and our results strongly
rejects the regional effect. This different result is caused by different method. They use minimum spanning trees
(MST) and planar maximally filtered graphs (PMFG) methods but these are not strict statistical tests with hypothesis and explicit critical intervals.
In addition, we do not find explicit cointegration from the U.S. market to the European markets but confirm such
relation for the opposite directions in some countries, including Germany, Denmark, the United Kingdom, and
Sweden. This contrasts with the study by Savva (2009) which concludes that price spillover effect from USA to Europe is unidirectional.
The rest of the paper is organized as follows: Section 2 presents the key facts of data and explains the rationale of
the construction of sample; Section 3 discusses the methods used and presents the daily open orders of markets;
Section 4 organizes the main comovement results from Figure 2 to Figure 9; Section 5 suggests the undiscussed issues and possible future path of this research.
http://ibr.ccsenet.org International Business Research Vol. 10, No. 8; 2017
176
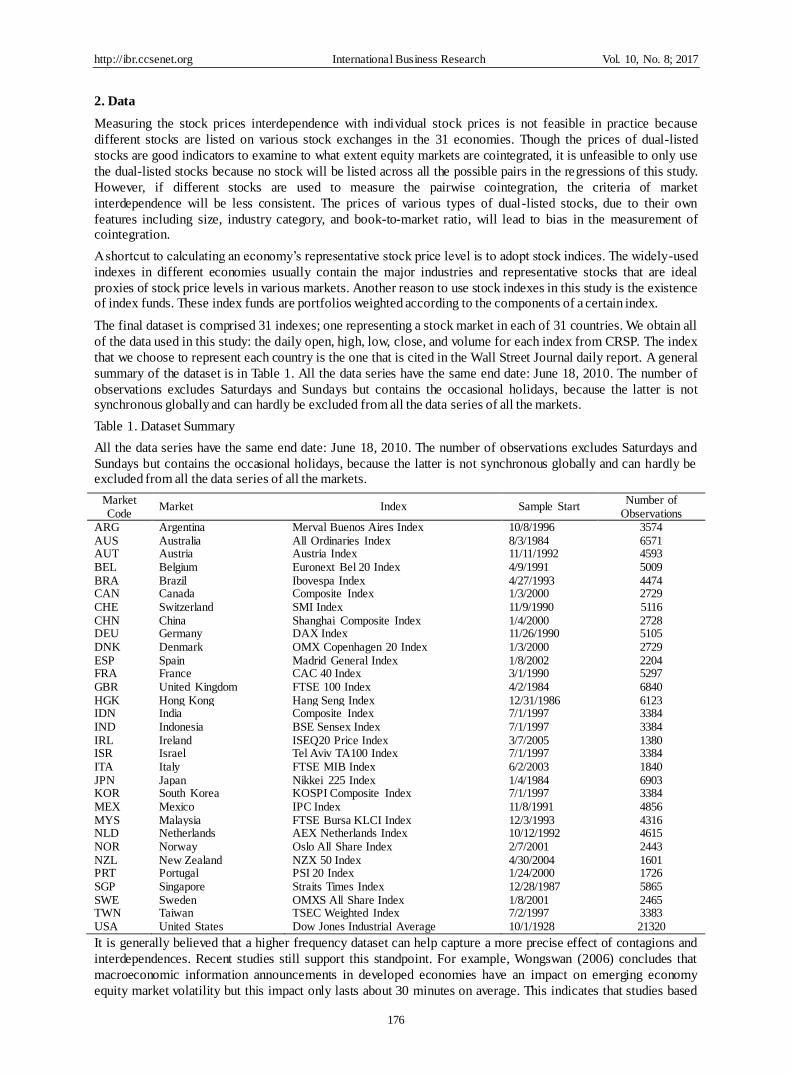
2. Data
Measuring the stock prices interdependence with individual stock prices is not feasible in practice because
different stocks are listed on various stock exchanges in the 31 economies. Though the prices of dual-listed
stocks are good indicators to examine to what extent equity markets are cointegrated, it is unfeasible to only use
the dual-listed stocks because no stock will be listed across all the possible pairs in the regressions of this study.
However, if different stocks are used to measure the pairwise cointegration, the criteria of market
interdependence will be less consistent. The prices of various types of dual-listed stocks, due to their own
features including size, industry category, and book-to-market ratio, will lead to bias in the measurement of cointegration.
A shortcut to calculating an economy’s representative stock price level is to adopt stock indices. The widely-used
indexes in different economies usually contain the major industries and representative stocks that are ideal
proxies of stock price levels in various markets. Another reason to use stock indexes in this study is the existence of index funds. These index funds are portfolios weighted according to the components of a certain index.
The final dataset is comprised 31 indexes; one representing a stock market in each of 31 countries. We obtain all
of the data used in this study: the daily open, high, low, close, and volume for each index from CRSP. The index
that we choose to represent each country is the one that is cited in the Wall Street Journal daily report. A general
summary of the dataset is in Table 1. All the data series have the same end date: June 18, 2010. The number of
observations excludes Saturdays and Sundays but contains the occasional holidays, because the latter is not synchronous globally and can hardly be excluded from all the data series of all the markets.
Table 1. Dataset Summary
All the data series have the same end date: June 18, 2010. The number of observations excludes Saturdays and
Sundays but contains the occasional holidays, because the latter is not synchronous globally and can hardly be excluded from all the data series of all the markets.
Market
Code Market Index Sample Start
Number of
Observations ARG Argentina Merval Buenos Aires Index 10/8/1996 3574 AUS Australia All Ordinaries Index 8/3/1984 6571 AUT Austria Austria Index 11/11/1992 4593 BEL Belgium Euronext Bel 20 Index 4/9/1991 5009 BRA Brazil Ibovespa Index 4/27/1993 4474 CAN Canada Composite Index 1/3/2000 2729
CHE Switzerland SMI Index 11/9/1990 5116 CHN China Shanghai Composite Index 1/4/2000 2728 DEU Germany DAX Index 11/26/1990 5105 DNK Denmark OMX Copenhagen 20 Index 1/3/2000 2729 ESP Spain Madrid General Index 1/8/2002 2204 FRA France CAC 40 Index 3/1/1990 5297 GBR United Kingdom FTSE 100 Index 4/2/1984 6840
HGK Hong Kong Hang Seng Index 12/31/1986 6123 IDN India Composite Index 7/1/1997 3384 IND Indonesia BSE Sensex Index 7/1/1997 3384 IRL Ireland ISEQ20 Price Index 3/7/2005 1380 ISR Israel Tel Aviv TA100 Index 7/1/1997 3384 ITA Italy FTSE MIB Index 6/2/2003 1840 JPN Japan Nikkei 225 Index 1/4/1984 6903 KOR South Korea KOSPI Composite Index 7/1/1997 3384 MEX Mexico IPC Index 11/8/1991 4856 MYS Malaysia FTSE Bursa KLCI Index 12/3/1993 4316 NLD Netherlands AEX Netherlands Index 10/12/1992 4615 NOR Norway Oslo All Share Index 2/7/2001 2443 NZL New Zealand NZX 50 Index 4/30/2004 1601 PRT Portugal PSI 20 Index 1/24/2000 1726 SGP Singapore Straits Times Index 12/28/1987 5865 SWE Sweden OMXS All Share Index 1/8/2001 2465 TWN Taiwan TSEC Weighted Index 7/2/1997 3383 USA United States Dow Jones Industrial Average 10/1/1928 21320
It is generally believed that a higher frequency dataset can help capture a more precise effect of contagions and
interdependences. Recent studies still support this standpoint. For example, Wongswan (2006) concludes that
macroeconomic information announcements in developed economies have an impact on emerging economy
equity market volatility but this impact only lasts about 30 minutes on average. This indicates that studies based
http://ibr.ccsenet.org International Business Research Vol. 10, No. 8; 2017
177
on lower-frequency data will fail to capture the correlations. However, at an earlier time, Hakkio and Rush (1991)
proved that, although increasing the frequency of data when testing the cointegration relationship among stock
markets can add degrees of freedom, this is less important to increase the frequency of data from daily to
intraday. They suggest that cointegration is essentially a long-run concept and hence the test of contagion requires long spans of data.
Arguments against the above conclusions are based on the belief that using high-frequency, intraday data will
introduce unnecessary noise. Morana (2008), Baharumshah (2003) and Worthington and Higgs (2004) support
this standpoint and they also claim that the influence of some economic shocks will only be exhibited after a
longer period of time. Neutral opinions also exist: Morana and Beltratti (2008) document that daily or weekly returns are not affected by observed noise. For this reason, our study employs daily data.
The literature suggests that three financial crises have had significant impacts on the extent of price
interdependence. Arshanaoalli and Doukas (1993) argue that the degree of international comovements in stock
price indexes has changed significantly since the crash of October 1987. Also, Corsetti, Pericoli, and Sbracia
(2005) record a similar result for the 1997 Asian crisis. This study employs the structural breaks of the 1987
crash, the 1997 Asian financial crisis, and the 2007 global crises and focuses on five sample periods: the full
sample periods and four sub-sample periods: from the sample starting date to October 18, 1987; October 19, 1987 to July 1, 1997; July 2, 1997 to November 30, 2007; and December 1, 2007 to June 18, 2010.
3. Methodology
Large numbers of studies examine the first moment international market integration using the unit root test,
VAR/VECM model and cointegration test. Some widely-cited studies on this field include Beine and Vermeulen
(2010), Mylonidis and Kollias (2010), Panchenko and Wu (2009), and Syriopoulos and Roumpis (2009). On the
other hand, ARCH series tests are employed to test the second moment contagions. Some well-known studies on
this field include Karunanayake, Valadkhani and O'Brien (2010), Kim, Moshirian and Wu (2006), Phylaktis and
Xia (2009), Wongswan (2006), to name a few. Our paper focuses on the first moment price comovement and therefore adopts the cointegration method.
To test the cointegration hypothesis of the stock indexes, we first perform the unit root test to determine the
integration order of each time series data. If the orders are equal for the data series, there will be a potential that the markets are cointegrated and international portfolio diversification cannot diversify the risk.
Generally, the augmented Dickey-Fuller unit root tests (ADF test in the following) use the following procedure: consider an AR (1) process:
𝑦𝑡 = 𝜌𝑦𝑡−1 + 𝑥𝑡′𝛿 + 𝜖𝑡 (1)
where 𝑥𝑡, an exogenous regressor, is a constant in this case. We do not include time trend in the following tests
because a graphic observation did not reveal any time trend in the indexes. 𝜌 and 𝛿 are parameters to be estimated and 𝜖𝑡 is assumed to be the white noise. 𝑦𝑡 can be any time series variables in the dataset.
We test the null hypothesis H0: 𝜌=1 against the alternativeH1:𝜌<1. If 𝜌=1, then y is a nonstationary variable and
if 𝜌<1, y is a trend stationary variable. Subtracting 𝑦𝑡−1 from both sides of Equation (1), the regression function changes into:
∆𝑦𝑡 = 𝛼𝑦𝑡−1 + 𝑥𝑡′𝛿 + 𝜖𝑡 (2)
And the test hypotheses are:
H0: 𝛼 = 0 against the alternative Ha: 𝛼 < 0
The critical value of this test is given by an asymptotic t-distribution and it is offered by Dickey and Fuller
(1979). For each of the variables, we perform the ADF test and if the null hypothesis cannot be rejected at a 5%
level, the higher order difference of this variable is tested continuously until the null hypothesis is rejected. The
similar DF-GLS test is used to be a robustness check of the conclusion. This study uses the Schwarz Information Criterion and the maximum lag is 30 in the ADF test.
We also use the ADF test to construct a parametric correction for higher-order correlation by assuming that the
series follow an AR(4) process and adding lagged difference terms of the dependent variable to the right-hand-side of the test regression:
∆𝑦𝑡 = 𝛼𝑦𝑡−1 + 𝛽1∆𝑦𝑡−1 + 𝛽2∆𝑦𝑡−2 + ⋯ + 𝛽4∆𝑦𝑡−4 + 𝑥𝑡′𝛿 + 𝑣𝑡 (3)
This specification is consistent with the existing literatures and it is a balance of precision and amount of computation.

http://ibr.ccsenet.org International Business Research Vol. 10, No. 8; 2017
178
The cointegration tests are used to examine the MAP, which implies there are borders of markets. Moving across
these borders will bring investors different levels of returns or various risk levels. If MAP holds, allocating
portfolio across markets will benefit investors by reducing the portfolio risks s ince markets are not perfectly
correlated. On the other side, if MAP is violated, comovement of the index trends should be observed. Strictly defined, the hypothesis is stated as:
{H0: Markets are asynchronous, and returns and risks across markets vary. Ha : Market indexes are synchronous,and their price trends comove.
Specifically, we test the MAP by breaking this hypothesis into two subcategories. First, we test the semi-strong
form of MAP, which is the regional effect, is examined. The regional MAP is the hypothesis that stock markets
in the same region, e.g., Europe, or NAFTA, all move towards the similar trend and this trend is different from
other markets. The concept of semi-strong MAP is defined as: beyond a certain country’s border, comovement
can be observed, while beyond a certain region’s border, comovement trends disappear. Consistently, the strong
form of MAP is defined as: market comovement trend cannot be observed among any countries. The weak form
of the MAP is defined as: market comovement trend cannot be observed beyond a country combination, which
might be outside a common region but have strong economic ties, for example, Hong Kong and the United Kingdom. Strictly defined, the test hypothesis of the semi-strong form MAP is stated as:
{H0: Markets are only synchronous in a region. Ha : Markets are synchronous in the global financial context.
Second, we test the linkage transfer effect. This effect is based on our observation through the regression output.
After the recent financial crisis started from the end of 2007, some index cointegration relationships changed and
switched to link with other markets located in other continents. Strictly defined, the test hypothesis of the semi-strong form MAP is stated as:
{H0: Financial crisis alters the pattern of synchronization in global financial markets. Ha : Crisis cannot change the existing comovement pattern.
We perform the causality test and the cointegration test in pairwise samples. In the pairwise tests, we examine all
possible pairs and the interaction between open and close. All the tests are designed based on the opening sequence of the 31 markets. The sequence is exhibited in Figure 1.
Figure 1. International Stock Market Trading Hours, Ranked by Open Hour
0900
0930
1000
1030
1100
1130
1200
1230
1300
1330
1400
1430
1500
1530
1600
1630
1700
1730
1800
1830
1900
1930
2000
2030
2100
2130
2200
2230
2300
2330
0000
0030
0100
0130
0200
0230
0300
0330
0400
0430
0500
0530
0600
0630
0700
0730
0800
0830
0900
0930
1000
1030
1100
1130
1200
1230
1300
1330
1400
1430
1500
1530
1600
1630
1700
1730
1800
1830
1900
1930
2000
2030
2100
2130
2200
2230
2300
2330
0000
0030
0100
0130
0200
0230
0300
0330
0400
0430
0500
0530
0600
0630
0700
0730
0800
0830
0900
0930
1000
1030
1100
1130
1200
1230
1300
1330
1400
1430
1500
1530
1600
1630
1700
1730
1800
1830
0900
0930
1000
1030
1100
1130
1200
1230
1300
1330
1400
1430
1500
1530
1600
1630
1700
1730
1800
1830
1900
1930
2000
2030
2100
2130
2200
2230
2300
2330
0000
0030
0100
0130
0200
0230
0300
0330
0400
0430
0500
0530
0600
0630
0700
0730
0800
0830
0900
0930
1000
1030
1100
1130
1200
1230
1300
1330
1400
1430
1500
1530
1600
1630
1700
1730
1800
1830
1900
1930
2000
2030
2100
2130
2200
2230
2300
2330
0000
0030
0100
0130
0200
0230
0300
0330
0400
0430
0500
0530
0600
0630
0700
0730
0800
0830
0900
0930
1000
1030
1100
1130
1200
1230
1300
1330
1400
1430
1500
1530
1600
1630
1700
1730
1800
1830
KOR
…January 18, 2011 closes Within one calendar trading day, e.g., January 19, 2011 January 20, 2011 opens…
...USANZL
CHE
JPNAUS
SGPMYS
TWNCHN
HGKIDN
INDISR
FRA
AUT
BELDEU
DNKESPGBRIRLNLDNORPRTSWEITA
ARGBRAMEXCANUSA
NZL…

http://ibr.ccsenet.org International Business Research Vol. 10, No. 8; 2017
179
The first time axis in the head is the Greenwich Standard Time, and the second time axis is the Eastern Standard
Time, without the United States daylight saving time. The foot time axes are the same with the head. The time
indicated in the axes is in a 30 minute frequency, and each time marked in the axes is the starting time. The bars in the graph stand for the trading hour of a specific stock market of an economy.
According to Figure 1, we rank the markets open time within a calendar day and place the earlier open market at
the front to perform the cointegration test. The cointegration test follows the results of the unit root tests and for the pairwise cointegration test, the procedure is: for a VAR of order p:
𝑦𝑡 = 𝐴1𝑦𝑡−1 + ⋯ + 𝐴𝑝𝑦𝑡−𝑝 + 𝐵𝑥𝑡 + 𝜖𝑡 (4)
Here 𝑦𝑡 is a k-vector of non-stationary I(1) variables, 𝑥𝑡 is a d-vector of deterministic variable, and the error term is a vector of innovations. Using the first-order difference form, the VAR can be rewritten as:
∆𝑦𝑡 = Πyt−1 + ∑ ΓiΔyt−i + Bxt + 𝜖𝑡p−1i=1 (5)
Where Π = ∑ 𝐴𝑖 − 𝐼, 𝑎𝑛𝑑 Γ𝑖 = − ∑ 𝐴𝑗𝑝𝑗=𝑖+1
𝑝𝑖=1 (6)
If the coefficient matrix Π has reduced rank r<k, then there exists 𝑘 × 𝑟 matrices 𝛼 and 𝛽 each with rank r
such that Π = 𝛼𝛽′ 𝑎𝑛𝑑 𝛽′𝑦𝑡 is I(0). r is the number of cointegrating relations, or the rank. The r value of each economy pair is available by request.
4. Results and Discussions
The order of integration is determined by the ADF unit root test and the DF-GLS test is used to check the
robustness of the results. We use the Bayesian information criterion to determine the correlation of the error
terms. The results of unit root procedure are available by request. Because the total number of tests is too
voluminous to report here, only the results of the cointegration tests between the one-day lag and the current day
market open levels are shown in the following Figures 2 to 9. The entire test results of all the cointegration tests are available by request.
This study reveals that the recent financial crisis has significantly changed international equity markets’
cointegration patterns. The markets which were initially cointegrated within a region seemed to change to be
more independent from this region, while originally irrelevant markets located in another region are more
cointegrated. We define this change in linkages as the "linkage transfer effect". For example, the equity market in
the United Kingdom was cointegrated with many European markets in the long run; however, this market is
much less cointegrated with the European markets in the short run after the recent financial crisis, but more cointegrated with the Asian markets.
Intuitively, a market with a large amount of publicly traded stocks is more independent, while the markets with
small capitalization will be more easily affected. We define the effect of large capitalization markets being more
independent as the "too-big-to-drift" effect, and the parallel term "small-and-drift" effect, refers to the
phenomenon that markets with small capitalization are more cointegrated with other markets, since a smaller
mass leads to a less inertia to keep its independence. In addition, the regional effect in the following analysis
refers to the hypothesis that equity markets located in the same region, for example, Latin America, are cointegrated.
The following Figures 2 to 9 show the cointegration test results for the one-day-lag market open value of a
certain market and the current-day open levels of all the other major markets in the world. Our study does not
test the cointegration relation among the current-day open level of a market and the current-day open level of all
the other markets. This is because on the same calendar day, some markets open before the others open, therefore
the cointegration tests are not all feasible. For each of the markets, we present the cointegration outputs in the long run, which is the full sample, and the short run, which is from December 1, 2007 to June 18, 2010.
Specifically, both in the long run and the short run, which is exhibited in Figure 2, investors in the Argentinean
market have a wide range of markets into which they can safely diversify their portfolios and efficiently reduce
risk. Consistent with the general belief, the Argentinean market is linked with the Brazilian market in both long
and short term. However, the insignificant cointegration relation with the Mexican market rejects the regional
effect. The recent financial crisis did not change the cointegration pattern dramatically and this is rare in other
markets. This can be explained by the function of the immunization system of the financial market established in
the 1999-2002 Argentinean financial crises, which had helped Argentinean’s investors to strengthen the
regulation of domestic investment and be more prepared for the recent financial crisis that or iginated in the United States.
In the long run, the Australian market is independent from most of the other markets as shown in Figure 2. The

http://ibr.ccsenet.org International Business Research Vol. 10, No. 8; 2017
180
test result is consistent with the general belief that the Australian market should be closely linked with the New
Zealand market. The regional effect, however, is not significant enough because most of other markets
geographically close, for instance, the Southeast Asian market, are not linked with the Australian market. This
conclusion still holds in the short run, when the markets that have strengthened their links are mainly located in Europe and Latin America. The linkage transfer effect is insignificant in the short run for Australia.
As shown in the following Figure 2, in the long term, the Austrian equity market is very independent from the
other global markets and the only markets that are cointegrated with the Austrian market are the New Zealand
and Ireland markets. The European market regional effect is not significant and therefore in the long run,
allocating assets across international markets for the investors in the Austria market is safe and efficient.
However, in the short run, the risk cannot be reduced when investors allocating assets that are originated from
Austria to Germany, Sweden, Japan, Singapore, Taiwan, Brazil, and Mexico. The implications are: first, the
recent financial crisis has strengthened the linkages with international equity markets. Second, the regional effect
is still not significant: except for two European markets, most of the other markets cointegrated are located in Asia and Latin America.
Similar with the Austrian market, the Belgium market, also indicated in Figure 2 is again very independent from
the other international markets in the long run, and only two European markets are cointegrated with it: Italy and
Norway. The regional effect is still insignificant, though the two markets linked are from the same area. This is
because the markets close to Belgium are independent, including France and Germany. In the short run, the
recent financial crisis merely changed the cointegrated markets but maintained the independent feature of the Belgium market. The linkage transfer effect is insignificant in the short run.
This study cannot conclude that the linkage transfer effect is related to the market capitalization, normally known
as “size” (Fama and French, 1992), because we observe both small and big capitalization markets have
significant linkage transfer effect, for example: the Austria market and the United Kingdom market, respectively;
and we also observe both small and big capitalization markets have insignificant linkage transfer effect, for
example: the Belgium market and the Germany market, respectively. This can be explained by the individual economy financial market regime and the different authority actions after the recent financial crisis occurred.
In the long run, as shown in Figure 3, the Brazilian market is not related to all the European markets, but is
related to some of the Asian markets. Although it is consistent with the general belief that it is linked with the
Latin America markets, the Brazil market is isolated from the North American markets. In the short run, the
Brazilian market is unique compared with the Argentina, Australia, Austria, and Belgium markets, as the recent
financial crisis did not strengthen its cointegration relation with the global markets. After the crisis, only
Singapore, Taiwan and Argentina markets are linked. The regional effect and the linkage transfer effect are not
significant, and asset allocation is efficient in the European market for the Brazil investors both in the long run and the short run.
Both in the long run and the short run, as shown in Figure 3, the Canadian market is isolated from the global
market and the only linkage is the Norway market. Considering its neighborhood which has the largest market
capitalization in the world equity market, the Canadian market does not support the "small-and-drift" hypothesis.
Regional effect and the linkage effect are not consistent with the practice in Canadian market, and investors from Toronto have plenty of opportunities to diversify their portfolio and efficiently reduce the equity risk.
The equity market in Switzerland, as shown in Figure 3, is relatively independent in the long run, with only
two European markets and two Asian markets cointegrated with it but on Latin America market. In the short run,
the recent financial crisis changed the linkages significantly. The two European markets that are cointegrated in
the long run are isolated, while the Switzerland market turned to be related with the Germany. Several Asian
markets and the Brazil market are also linked with it in the short run. This helps to draw the conclusion that the linkage transfer effect is somewhat significant.
The small-and-drift effect is also significant, because in the long run, the Switzerland market is linked with the
United Kingdom market and the Germany market in the short run, with both markets have the largest market
capitalization in the world. An interesting phenomenon is: the Taiwan market and the India market linkages with
the Switzerland market are very stable both in the long run and the short run. Further studies are necessary to identify the reasons of such firm connection.
The equity market in China, as shown in Figure 3, is frequently considered as an asset allocation destination by
the hedge and index fund managers because of its identity as the representative of the emerging markets. This is
efficient in the long run but not in the short term. Investigated in the full data sample, the China equity market is
cointegrated with the Switzerland, Sweden, Japan and the Brazil market. However, in the short run the China
http://ibr.ccsenet.org International Business Research Vol. 10, No. 8; 2017
181
market is cointegrated with significantly more global markets. This can be explained by the large amount of portfolio allocation across the world include Chinese stocks.
The linkage transfer effect is significant while the regional effect is not supported. As one of the markets with the
largest market capitalization in the world, the too-big-to-drift hypothesis cannot be proved. The reason is in the
long run, the China market is cointegrated with Japan and in the short run, with 11 markets, even some of which
has a small capitalization, for instance, Belgium, Ireland, and Mexico. For European market investors, allocating part of the assets to the China market will not help reduce the risk.
The equity market in Germany, as shown in Figure 4, in the long run is cointegrated with ten markets: four from
Europe, five from Asia and the United States. Regional effect is not strongly supported because ten European
markets are not related. In addition, the too-big-to-drift effect is also not proved because of the existing
cointegration relation with the United Kingdom and the United States market. It is rare that the US market is cointegrated with any other markets.
The recent financial crisis significantly changed the linkage pattern. Recently, only one European market is
linked with the Germany market, while the linkage with the Asian market is still stable and even strengthened.
This supports the linkage transfer effect and highlights the power of the 2007 financial crisis. Again the
too-big-to-drift effect is not supported because even the Malaysia market is cointegrated with the Germany market.
As shown in Figure 4, the Denmark equity market is relatively isolated in the long run, with only three European
markets and the United States market cointegrated with it. It is a very typical market that is consistent with
majority of the hypotheses in this study. The regional effect and the small-and-drift effect are significant since
the Denmark equity market is linked with the United Kingdom and the United States market. In addition, we
observe the linkage transfer effect after the recent financial crisis. The linkage with the European markets is
weakened but two new cointegrated markets are observed in Asia. The small-and-drift effect still exists but the
market turns to be the Frankfurt stock exchange. Overall, the Denmark market is relatively isolated and global portfolio allocation strategy is generally efficient.
The stock markets in Europe are diversified to a great extent. Figure 4 shows that the Spain equity market is very
isolated from the other markets in the world. In the long run, only the India market is cointegrated with it, and in
the short run, the China and Malaysia markets are cointegrated. The regional effect does not hold in this case
because it is efficient to allocate portfolio across the Europe countries. This is inconsistent with what investors
and institutions generally expect: as least the Spain market should be cointegrated with markets nearby, and the
big markets in Europe such as Germany and the United Kingdom. Similar with the France market discussed
below, the Spain market has no markets connected with it firmly: the market connections in the short run and the long run are different.
The France stock market is similar with the Germany market to some extent, except for it is more independent in
the international stock markets, as shown in Figure 4. In the long run, the France market is cointegrated with
markets with large capitalization such as the United Kingdom and Japan, and therefore the too-big-to-drift effect
does not hold. In the long term, the regional effect is not obvious, and in the short run this effect diminishes
completely. Unlike most of the markets investigated in this study in which the recent financial crisis typically
increases the amount of cointegration relationships, the 2007 crisis in fact decreases the linkages with France market.
An obvious linkage transfer effect is detected because in the short run, all the relations with the European
markets are broken down while new cointegration relationships are built up with some Asia markets. Although
the France market has a relatively large capitalization and it is widely agreed that this market is influential to other stock exchanges, empirical tests does not support such common sense.
In the long run, the United Kingdom market, as shown in Figure 5, is cointegrated with a considerable amount of
the European markets, three Asian markets and the United States. Therefore it is not independent and this causes
difficulty for the investors to efficiently allocate assets. The regional effect is observed but cannot be confirmed
because markets not in the same region are also connected. In the long term, the too-big-to-drift hypothesis is not
significant since the Germany and the United States markets are cointegrated. In the short run, we capture a linkage
transfer effect as all the cointegrated markets in Europe are isolated and only four Asian markets are connected with
the UK market. This proves that the recent financial crisis is influential not only in terms of the number of markets
cointegrated, but also the specific market linked. Compared with the long term, in the short run the only market that
maintains a stable and firm cointegration relationship is the India market. Finally, the recent financial crisis made the linkages to the UK market reduced and this is consistent with the too-big-to-drift effect in the short run.

http://ibr.ccsenet.org International Business Research Vol. 10, No. 8; 2017
182
Similar with the European stock exchanges, the Asian markets are highly diversified. Almost no consistent
effects can be observed across the Asian markets. For the Hong Kong market in Figure 5, in the long run it is
highly independent with only the Sweden market cointegrated. The regional effect is strongly rejected. This is
dramatically changed by the recent financial crisis after which some of the European markets have strengthened
the cointegration relations with Hong Kong. The too-big-to-drift effect does not exist in the short run because the
Germany market and Australia markets are linked with the Heng Seng Index. The Malaysia market, also located
in Southeast Asia, started to move together with the Hong Kong market after the 2007 crisis. The comparison
between the tests output in the long run and short run supports the linkage transfer effect. However, further study
is needed to explain the reason why even though Hong Kong is the Economic and Financial center of Asia, few Asian markets will follow the trend of the Hong Kong security market.
In Figure 5 allocating assets in the Indonesia market is almost always efficient in the long run and perfectly
efficient in the short run after the financial crisis started from the end of 2007. In the long term, regional effect
somewhat exists in the domestic market because consistent with investors' prediction, Malaysia stock exchange
is cointegrated with the Indonesia market. However, the fact that two markets from Latin America are also
connected rejects the exclusive conclusion of the effective regional effect. In the short run, this market is not
cointegrated with any of the other 30 markets and this is unique. After the financial crisis, the investors in
Indonesia can safely and efficiently allocate part of their assets in the domestic market and the other part in any of the major markets in the world.
The India market is special in the global market because in the long run it is cointegrated with a very wide range
of markets from all the regions in the world: six from Europe, four from Asia and two from Latin America.
Therefore the regional effect does not exist in the long run, and the efficient asset allocation for the India
investors is difficult, even though they choose the markets that are not cointegrated with the domestic marke t
superficially. This is because the markets not linked with India stock exchange can be related with the markets
that are cointegrated with India and therefore cause the cross-border allocation less efficient to decrease the
portfolio variance. In the short run, linkages proportionally shrink and the linkage transfer hypothesis does not hold.
In Figure 6, the security markets in Ireland, Israel and Italy are similar in terms of the amount of markets that are
cointegrated and the comparison between the full sample tests and the last subsample tests. Few markets are
linked with these three markets both in the long run and in the short run. The recent financial crisis also changed
the distribution of markets that are related. The linkage transfer effect, the regional effect and the small-and-drift
effect are all significant in the Ireland and Italy market in the long run. In the short run, the cointegration
relations detected in the Israel market is somewhat odd because rather than the United States New York Security
Exchange as widely expected. All these three markets, as well as the equity markets in Denmark, Spain and
Switzerland, are the typical European small capitalization markets which share common features: few markets cointegrated and structural break sensitive.
The output of the cointegration tests for Japan shown in Figure 6 fails to support Japan's Asian leader role. In the
long run, Japan is cointegrated with very few markets and the too-big-to-drift hypothesis is strongly rejected
because the domestic market is linked with the France and China market, both have large capitalization. The last
structural break did not add more markets cointegrated, but changed the country. Overall, a plausible explanation
regard to the amount of markets cointegrated can be to what extent the market is popular in the pool of the hedge
fund and index fund managers. Most of the top performing emerging markets and mature stable markets in this
research are obtaining more cointegrated markets than other markets. Even though Japan is a mature market and
there is a long history that the Nikkei 225 index is widely cited, the poor performance of the Japanese economy in the past three decades prevent investors from considering to add Japan based stocks in their portfolios.
As shown in Figure 7, in the long run and short run, the South Korea market does not exhibit regional effect and
linkage transfer effect and as a relatively isolated market, South Korea investors can almost freely allocate asset
internationally, even though in Japan and China which are two big markets nearby. This is different with the
Malaysia market for which in the long run most of the Asian markets are linked and the recent financial crisis
transfers the link to a more evenly distributed style. The regional effect finds rare support in Malaysia in the long
run. Consistent with the typical features of the small capitalization equity market: few markets cointegrated and
structural break sensitive, in Figure 7 the Netherlands market has only four markets cointegrated with it in the
long run, and two of them are not located in Europe. The regional effect is not supported both in the long run and
the short run. In addition, it rejects the small-and-drift hypothesis as it is only cointegrated with the Hong Kong market in the short run.
http://ibr.ccsenet.org International Business Research Vol. 10, No. 8; 2017
183
Mexico is one of the equity markets that are not typical, as shown in Figure 7. In the long run, two European,
two Asian and Brazil markets are cointegrated and therefore a strong regional effect cannot be support. In the
short run, the Mexico market has the largest number of markets cointegrated with it after the crisis in 2007.
Surprisingly most of them are from the European countries. Another interesting fact is that the Mexico and Canada markets are independent from the United States market.
In Figure 8, the Norway market is not a typical small size European market in the long run, because it has a wide
range of markets cointegrated. Though the regional effect is rejected, an obvious small-and-drift effect is
observed from its linkages with the Germany, the United Kingdom and the Hong Kong market. The recent
financial crisis significantly changed this with five of the markets no longer have the cointegration relation. It is also rare that Norway has an exclusive tie with Latin America markets.
The Portugal equity market in the short run exhibits a unique counter-linkage transfer effect. Generally the 2007
crisis will reduce the relation between a market and other markets that belongs to the same region with it.
However in the last subsample, the Portugal market increases such relation with other European markets, and
also the Latin America markets. This implies the effectiveness of the regional effect. The New Zealand market is
consistent with the small-and-drift hypothesis in both the long and short term. After the end of 2007, the number
of markets linked increased and this implies the increasing attention from the global investors to New Zealand
after the crisis. Consistent with the common belief, this market is cointegrated with the Australia market in both long and short term.
In the long run, even though the small-and-drift effect is observed for the Singapore market as shown in Figure 8,
the regional effect does not exist at all. After the last structural break, more markets cointegrated appear
including some geographically close markets, for instance, Indonesia and Taiwan. This reflects a low weight in
the portfolio destination pool of the asset managers, because with a considerable amount of dual-listed stocks in the Singapore market, it should be highly combined with other markets in the Asia-Pacific area.
In Figure 9, the Taiwan market is highly independent in the long run with other Asian markets, but more closely
related with the European market. This simultaneously rejects the regional effect and the linkage transfer effect.
The small-and-drift effect is significant since it is related with the Germany market in both long run and short
run. In the long run, the Sweden stock market has the largest amount of markets cointegrated with it: eight from
Europe, seven from Asia and the United States. This rejects the regional effect and implies the difficulty in allocating assets across the global markets.
The latest structural break reduced the amount of markets cointegrated proportionally and therefore the regional
effect is still insignificant. In the tests with both full sample and the last subsample, the Sweden market is
cointegrated with the United States, Germany and the United Kingdom markets which are all large size markets. Thus both in the long and short term, the small-and-drift effects exist in a robust manner.
As the market with the largest capitalization in the world, the New York Security Exchange has only one market
cointegrated with it in the long run: the Sweden market. In Figure 9, the test result makes the frequently appeared
media reports questionable, such as "Following by the US stock fluctuation, the domestic market open with a 2%
lower following yesterday's close". This however proved the too-big-to-drift hypothesis on the other side with a
less strong and robust manner because there is no market with an even larger size in the world for New York to
follow with. In the short run, a limited number of markets are cointegrated with the US market, not including
Canada and Mexico. This result implies a failure of using international trade volume as a factor to explain the
cointegration relationship, because the well-known NAFTA frame is not influential to determine the markets linked with the United States market.

http://ibr.ccsenet.org International Business Research Vol. 10, No. 8; 2017
184
Figure 2. Cointegration Test Results for the Argentina, Australia, Austria, and Belgium Market Open Levels
The abbreviations for each equity market are shown in the list before the Table of Contents. For each market, the
left figure is the cointegration test of the one-day-lagged open level of the market in the center and the current
day open level of the market on the circle in the full sample period, which is from October 1, 1928 to June 18,
2010; the right figure is the cointegration test of the one-day-lagged open level of the market in the center and
the current day open level of the market on the circle in the last subsample period, from December 1, 2007 to
June 18, 2010. The left circle indicates the long term cointegration relationship, and the right circle indicates the
short term cointegration relationship. Solid line linkages imply the existence of a statistically significant
cointegration relationship (at the 5% level), while dashed lines imply no such relationship. On the circles, the
global markets are ranked by their locations in a clockwise sequence: the European markets, the Asian markets
and the American markets. These markets are distinguished by the line type of the circles, thin for Europe, bold for Asia and dashed for American.
Figure 3. Cointegration Test Results of the Brazil, Canada, Switzerland, and China Market Open Levels

http://ibr.ccsenet.org International Business Research Vol. 10, No. 8; 2017
185
The abbreviations for each equity market are shown in the list before the Table of Contents. For each market, the
left figure is the cointegration test of the one-day-lagged open level of the market in the center and the current
day open level of the market on the circle in the full sample period, which is from October 1, 1928 to June 18,
2010; the right figure is the cointegration test of the one-day-lagged open level of the market in the center and
the current day open level of the market on the circle in the last subsample period, from December 1, 2007 to
June 18, 2010. The left circle indicates the long term cointegration relationship, and the right circle indicates the
short term cointegration relationship. Solid line linkages imply the existence of a statistically significant
cointegration relationship (at the 5% level), while dashed lines imply no such relationship. On the circles, the
global markets are ranked by their locations in a clockwise sequence: the European markets, the Asian markets
and the American markets. These markets are distinguished by the line type of the circles, thin for Europe, bold for Asia and dashed for American.
Figure 4. Cointegration Test Results of the Germany, Denmark, Spain, and France Market Open Levels
The abbreviations for each equity market are shown in the list before the Table of Contents. For each market, the
left figure is the cointegration test of the one-day-lagged open level of the market in the center and the current
day open level of the market on the circle in the full sample period, which is from October 1, 1928 to June 18,
2010; the right figure is the cointegration test of the one-day-lagged open level of the market in the center and
the current day open level of the market on the circle in the last subsample period, from December 1, 2007 to
June 18, 2010. The left circle indicates the long term cointegration relationship, and the right circle indicates the
short term cointegration relationship. Solid line linkages imply the existence of a statistically significant
cointegration relationship (at the 5% level), while dashed lines imply no such relationship. On the circles, the
global markets are ranked by their locations in a clockwise sequence: the European markets, the Asian markets
and the American markets. These markets are distinguished by the line type of the circles, thin for Europe, bold for Asia and dashed for American.

http://ibr.ccsenet.org International Business Research Vol. 10, No. 8; 2017
186
Figure 5. Cointegration Test Results of the United Kingdom, Hong Kong, Indonesia, and India Market Open Levels
The abbreviations for each equity market are shown in the list before the Table of Contents. For each market, the
left figure is the cointegration test of the one-day-lagged open level of the market in the center and the current
day open level of the market on the circle in the full sample period, which is from October 1, 1928 to June 18,
2010; the right figure is the cointegration test of the one-day-lagged open level of the market in the center and
the current day open level of the market on the circle in the last subsample period, from December 1, 2007 to
June 18, 2010. The left circle indicates the long term cointegration relationship, and the right circle indicates the
short term cointegration relationship. Solid line linkages imply the existence of a statistically significant
cointegration relationship (at the 5% level), while dashed lines imply no such relationship. On the circles, the
global markets are ranked by their locations in a clockwise sequence: the European markets, the Asian markets
and the American markets. These markets are distinguished by the line type of the circles, thin for Europe, bold for Asia and dashed for American.
Figure 6. Cointegration Test Results of the Ireland, Israel, Italy, and Japan Market Open Levels

http://ibr.ccsenet.org International Business Research Vol. 10, No. 8; 2017
187
The abbreviations for each equity market are shown in the list before the Table of Contents. For each market, the
left figure is the cointegration test of the one-day-lagged open level of the market in the center and the current
day open level of the market on the circle in the full sample period, which is from October 1, 1928 to June 18,
2010; the right figure is the cointegration test of the one-day-lagged open level of the market in the center and
the current day open level of the market on the circle in the last subsample period, from December 1, 2007 to
June 18, 2010. The left circle indicates the long term cointegration relationship, and the right circle indicates the
short term cointegration relationship. Solid line linkages imply the existence of a statistically significant
cointegration relationship (at the 5% level), while dashed lines imply no such relationship. On the circles, the
global markets are ranked by their locations in a clockwise sequence: the European markets, the Asian markets
and the American markets. These markets are distinguished by the line type of the circles, thin for Europe, bold for Asia and dashed for American.
Figure 7. Cointegration Test Results of the South Korea, Mexico, Malaysia, and the Netherlands Market Open Levels
The abbreviations for each equity market are shown in the list before the Table of Contents. For each market, the
left figure is the cointegration test of the one-day-lagged open level of the market in the center and the current
day open level of the market on the circle in the full sample period, which is from October 1, 1928 to June 18,
2010; the right figure is the cointegration test of the one-day-lagged open level of the market in the center and
the current day open level of the market on the circle in the last subsample period, from December 1, 2007 to
June 18, 2010. The left circle indicates the long term cointegration relationship, and the right circle indicates the
short term cointegration relationship. Solid line linkages imply the existence of a statistically significant
cointegration relationship (at the 5% level), while dashed lines imply no such relationship. On the circles, the
global markets are ranked by their locations in a clockwise sequence: the European markets, the Asian markets
and the American markets. These markets are distinguished by the line type of the circles, thin for Europe, bold for Asia and dashed for American.

http://ibr.ccsenet.org International Business Research Vol. 10, No. 8; 2017
188
Figure 8. Cointegration Test Results of the Norway, New Zealand, Portugal, and Singapore Market Open Levels
The abbreviations for each equity market are shown in the list before the Table of Contents. For each market, the
left figure is the cointegration test of the one-day-lagged open level of the market in the center and the current
day open level of the market on the circle in the full sample period, which is from October 1, 1928 to June 18,
2010; the right figure is the cointegration test of the one-day-lagged open level of the market in the center and
the current day open level of the market on the circle in the last subsample period, from December 1, 2007 to
June 18, 2010. The left circle indicates the long term cointegration relationship, and the right circle indicates the
short term cointegration relationship. Solid line linkages imply the existence of a statistically significant
cointegration relationship (at the 5% level), while dashed lines imply no such relationship. On the circles, the
global markets are ranked by their locations in a clockwise sequence: the European markets, the Asian markets
and the American markets. These markets are distinguished by the line type of the circles, thin for Europe, bold for Asia and dashed for American.
Figure 9. Cointegration Test Results of the Sweden, Taiwan, and the United States Market Open Levels

http://ibr.ccsenet.org International Business Research Vol. 10, No. 8; 2017
189
The abbreviations for each equity market are shown in the list before the Table of Contents. For each market, the
left figure is the cointegration test of the one-day-lagged open level of the market in the center and the current
day open level of the market on the circle in the full sample period, which is from October 1, 1928 to June 18,
2010; the right figure is the cointegration test of the one-day-lagged open level of the market in the center and
the current day open level of the market on the circle in the last subsample period, from December 1, 2007 to
June 18, 2010. The left circle indicates the long term cointegration relationship, and the right circle indicates the
short term cointegration relationship. Solid line linkages imply the existence of a statistically significant
cointegration relationship (at the 5% level), while dashed lines imply no such relationship. On the circles, the
global markets are ranked by their locations in a clockwise sequence: the European markets, the Asian markets
and the American markets. These markets are distinguished by the line type of the circles, thin for Europe, bold for Asia and dashed for American.
5. Concluding Remarks
This paper employs cointegration tests to identify the impacts of sequential opens of global equity market among
the equity indices. We use the daily data of 31 major equity markets and explore the comovement relationship
according to the sequence of the market open. This study also examines the impact of the 2008 global financial crisis to such comovement relationship. The major findings are:
The markets in the three major regions investigated in this study, Europe-Middle East, Asia-Pacific and Latin
America, are highly diversified, with no consistent pattern captured. The results of the verification to the
common investor belief are mixed. The regional effect is not general and most of the 31 markets have the
cointegration linkages outside its own region. This conclusion is robust across markets and time. This conclusion
implies that the region identification is not a major feature to be considered when making the portfolio diversification decision.
The “too-big-to-drift” and the “small-and-drift” effect will function in most of the markets in different ways. A
large market can still be cointegrated with small size markets, i.e., the “too-big-to-drift” hypothesis does not hold,
while a small size market is almost always cointegrated with large size markets, i.e., the “small-and-drift” hypothesis holds.
The financial crisis started from the end of 2007 had changed the cointegration relationships among the markets
greatly, while the number of newly added cointegration linkages is approximately equal to the number of
diminishing of such linkages. The linkage transfer effect generally holds for most of the markets. The markets
which were initially cointegrated within a region seemed to change to be more independent from this region, while originally irrelevant markets located in another region are more cointegrated.
These conclusions jointly answer two questions: what is the current pattern of the linkages among the
international equity markets, and which factors determine this situation. However, there are still some interesting
questions not solved. Future studies may include the test of regional effect versus an industrial structure effect;
the interdependence style change after a given crisis; the cointegration of the international equity markets with
bond and futures markets; the regional leader in international equity markets; and identification of the factors that may affect interdependence style.
References
___________. (1995). EViews 5 User’s Guide. Quantitative Micro Software, LLC.
Arshanaoalli, B., & John, D. (1993). International Stock Market Linkages: Evidence from the pre- and post-
October 1987 Period. Journal of Banking and Finance, 17, 193-208. https://doi.org/10.1016/0378-4266(93)90088-U
Bae, Kee-Hong, G., Andrew, K., & Rene, M. S. (2003). A New Approach to Measuring Financial Contagion. The Review of Financial Studies, 16(3), 717-763. https://doi.org/10.1093/rfs/hhg012
Baharumshah, A. Z., Tamat, S., & Hui, B. T. (2003). Dynamic Linkages of Asian Stock Markets: An Analysis of
Pre-liberalization and Post-liberalization eras. Journal of the Asia Pacific Economy, 8(2), 180-209. https://doi.org/10.1080/1354786032000074730
Beine, M., Antonio, C., & Robert, V. (2010). The Dark Side of Global Integration: Increasing Tail Dependence. Journal of Banking and Finance, 34, 184-192. https://doi.org/10.1016/j.jbankfin.2009.07.014
Berben, R. P., & Jansen, W. J. (2005). Comovement in International Equity Markets: A Sectorial View. Journal of International Money and Finance, 24, 832-857. https://doi.org/10.1016/j.jimonfin.2005.04.001
Bessler, D. A., & Jian, Y. (2003). The Structure of Interdependence on International Stock Markets. Journal of
http://ibr.ccsenet.org International Business Research Vol. 10, No. 8; 2017
190
International Money and Finance, 22, 261-287. https://doi.org/10.1016/S0261-5606(02)00076-1
Chancharat, S. 2008. An Econometric Study in Thailand Stock Price Transmission. University of Wollongong Thesis Collection.
Corsetti, G., Marcello, P., & Massimo, S. (2005). Some Contagion, Some Interdependence: More Pitfalls in Tests
of Financial Contagion. Journal of International Money and Finance, 24, 1177-1199. https://doi.org/10.1016/j.jimonfin.2005.08.012
Dalkir, M. (2009). Revisiting Stock Market Index Correlations. Finance Research Letters, 6, 23-33. https://doi.org/10.1016/j.frl.2008.11.004
Dong, H., Helen, M. B., & William, R. L. (2013). Evidence on the Efficient Market Hypothesis from 44 Global Financial Market Indexes. Economics Research International, 1-11. https://doi.org/10.1155/2013/238253
Dong, H. J. (2011). International Financial Markets Contagion: Determinants and Consequences. Doctorial Dissertation, University of Delaware, USA.
Dungey, M., Renee, F., & Vance, L. M. (2003). Equity Transmission Mechanisms from Asia to Australia:
Interdependence or Contagion. Australian Journal of Management, 28(2), 157-182. https://doi.org/10.1177/031289620302800203
Elfakhani, S., Mahmoud, A., & Hanin, A. S. (2008). Globalization and Investment Opportunities: A
Cointegration Study of Arab, U.S., and Emerging Stock Markets. The Financial Review, 43, 591-611. https://doi.org/10.1111/j.1540-6288.2008.00204.x
Eryigit, M., & Resul, E. (2009). Network Structure of Cross-correlations among the World Market Indices. Physica A, 388, 3551-3562. https://doi.org/10.1016/j.physa.2009.04.028
Eun, C. S., & Jinsoo, L. (2010). Mean-Variance Convergence around the World. Journal of Banking and Finance, 34, 856-870. https://doi.org/10.1016/j.jbankfin.2009.09.016
Fama, F. E., & Kenneth, R. F. (1992). The Cross-Section of Expected Stock Returns. The Journal of Finance, 47(2), 427-465. https://doi.org/10.1111/j.1540-6261.1992.tb04398.x
Hakkio, C. S., & Mark, R. (1991). Cointegration: How Short Is the Long Run. Journal of International Money and Finance, 10, 571-581. https://doi.org/10.1016/0261-5606(91)90008-8
Heimonen, K. (2002). Stock Market Integration: Evidence on Price Integration and Return convergence. Applied Financial Economics, 12, 415-429. https://doi.org/10.1080/09603100010001108
Jeon, B. N., & George, M. V. F. (1990). Growing International Comovement in Market Indices. Quarterly Review of Economics and Business, 30, 15.
Jong, F., & Frans, A. D. R. (2005). Time-varying Market Integration and Expected Returns in Emerging Markets. Journal of Financial Economics, 78, 583-613. https://doi.org/10.1016/j.jfineco.2004.10.010
Karunanayake, I., Abbas, V., & Martin, O. (2010). Financial Crises and International Stock Market Volatility Transmission. Australian Economic Papers, 209-221. https://doi.org/10.1111/j.1467-8454.2010.00397.x
Kim, S. J., Fariborz, M., & Eliza, W. (2006). Evolution of International Stock and Bond Market Integration:
Influence of the European Monetary Union. Journal of Banking and Finance, 30, 1507-1534. https://doi.org/10.1016/j.jbankfin.2005.05.007
Li, H. (2007). International Linkages of the Chinese Stock Exchanges: a Multivariate GARCH Analysis. Applied Financial Economics, 17(4), 285-297. https://doi.org/10.1080/09603100600675557
Masih, R., & Abul, M. M. M. (2001). Long and Short Term Dynamic Causal Transmission amongst International
Stock Markets. Journal of International Money and Finance, 20, 563-587. https://doi.org/10.1016/S0261-5606(01)00012-2
Morana, C., & Andrea, B. (2008). Comovements in International Stock Markets. Journal of International Financial Markets Institutions and Money, 18, 31-45. https://doi.org/10.1016/j.intfin.2006.05.001
Morana, C. (2008). International Stock Markets Comovements: the Role of Economic and Financial Integration. Empirical Economics, 35, 333-359. https://doi.org/10.1007/s00181-007-0161-2
Mylonidis, N., & Christos, K. (2010). Dynamic European Stock Market Convergence: Evidence from Rolling
Cointegration Analysis in the First Euro-Decade. Journal of Banking and Finance, 34, 2056-2064. https://doi.org/10.1016/j.jbankfin.2010.01.012

http://ibr.ccsenet.org International Business Research Vol. 10, No. 8; 2017
191
Panchenko, V., & Eliza, W. (2009). Time-Varying Market Integration and Stock and Bond Return Concordance
in Emerging Markets. Journal of Banking and Finance, 33, 1014-1021. https://doi.org/10.1016/j.jbankfin.2008.10.016
Pesaran, M. H., Davide, P., & Allan, T. (2006). Forecasting Time Series Subject to Multiple Structural Breaks. Review of Economic Studies, 73(4), 1057-1084. https://doi.org/10.1111/j.1467-937X.2006.00408.x
Phylaktis, K., & Lichuan, X. (2009). Equity Market Comovement and Contagion: A Sectoral Perspective. Financial Management, Summer, 381-409. https://doi.org/10.1111/j.1755-053X.2009.01040.x
Savva, C. S. (2009). International Stock Markets Interactions and Conditional Correlations. Journal of
International Financial Markets, Institutions & Money, 19, 645-661. https://doi.org/10.1016/j.intfin.2008.11.001
Syriopoulos, T., & Efthimios, R. (2009). Dynamic Correlations and Volatility Effects in the Balkan Equity
Markets. International Financial Markets, Institutions and Money, 19, 565-587. https://doi.org/10.1016/j.intfin.2008.08.002
Wongswan, J. (2006). Transmission of Information across International Equity Markets.” The Review of Financial Studies, 19(4), 1157-1189. https://doi.org/10.1093/rfs/hhj033
Worthington, A. C., & Helen, H. (2004). Transmission of Equity Returns and Volatility in Asian Developed and
Emerging Markets: a Multivariate GARCH Analysis. International Journal of Finance and Economics, 9, 71-80. https://doi.org/10.1002/ijfe.222
Copyrights
Copyright for this article is retained by the author(s), with first publication rights granted to the journal.
This is an open-access article distributed under the terms and conditions of the Creative Commons Attribution license (http://creativecommons.org/licenses/by/4.0/).