ASYMMETRIC INFORMATION AND THE - Brandeis …people.brandeis.edu/~cosler/documents/Assymetric... ·...
42
ASYMMETRIC INFORMATION AND THE FOREIGN-EXCHANGE TRADES OF GLOBAL CUSTODY BANKS Carol Osler a Brandeis University Tanseli Savaser b Williams College Thang Tan Nguyen c Brandeis University Abstract We analyze currency trading between custody banks and their client funds, a trading situation notable for extreme opacity and ongoing legal disputes about reputedly high markups. We propose a “shrouding” model of liquidity provision in which prices are set relative to the day’s extrema to preserve client uncertainty about execution costs. Using the complete 2006 currency trading record of a custody bank, we support this hypothesis with numerous tests. Our analysis of the client funds indicates that they recognize the high costs of standard custodial trades and raises the possibility that they trade through custodians to shroud execution-cost information from underlying investors. JEL Code: G15 Key words: Bid-ask spread, exchange rates, microstructure, shrouding, custody bank November 2012 a Corresponding author: Brandeis International Business School, Mailstop 32, Brandeis University, 415 South Street, Waltham, MA 02454. Tel: 781-736-4826. E-mail: [email protected]. b Department of Economics, Williams College, 24 Hopkins Hall Drive, Williamstown, MA 01267. Tel: (857) 891- 8406. E-mail: [email protected]. c Brandeis International Business School, Mailstop 32, Brandeis University, 415 South Street, Waltham, MA 02454. Tel: 781-736-2240. E-mail: [email protected]
-
Upload
dangnguyet -
Category
Documents
-
view
216 -
download
1
Transcript of ASYMMETRIC INFORMATION AND THE - Brandeis …people.brandeis.edu/~cosler/documents/Assymetric... ·...

ASYMMETRIC INFORMATION AND THE
FOREIGN-EXCHANGE TRADES OF GLOBAL CUSTODY BANKS
Carol Oslera
Brandeis University
Tanseli Savaserb
Williams College
Thang Tan Nguyenc
Brandeis University
Abstract
We analyze currency trading between custody banks and their client funds, a trading situation
notable for extreme opacity and ongoing legal disputes about reputedly high markups. We
propose a “shrouding” model of liquidity provision in which prices are set relative to the day’s
extrema to preserve client uncertainty about execution costs. Using the complete 2006 currency
trading record of a custody bank, we support this hypothesis with numerous tests. Our analysis of
the client funds indicates that they recognize the high costs of standard custodial trades and
raises the possibility that they trade through custodians to shroud execution-cost information
from underlying investors.
JEL Code: G15
Key words: Bid-ask spread, exchange rates, microstructure, shrouding, custody bank
November 2012
aCorresponding author: Brandeis International Business School, Mailstop 32, Brandeis University, 415 South Street,
Waltham, MA 02454. Tel: 781-736-4826. E-mail: [email protected]. bDepartment of Economics, Williams College, 24 Hopkins Hall Drive, Williamstown, MA 01267. Tel: (857) 891-
8406. E-mail: [email protected]. cBrandeis International Business School, Mailstop 32, Brandeis University, 415 South Street, Waltham, MA 02454.
Tel: 781-736-2240. E-mail: [email protected]
2
ASYMMETRIC INFORMATION AND THE
FOREIGN-EXCHANGE TRADES OF GLOBAL CUSTODY BANKS
Cross-border portfolio investing has grown rapidly in recent decades as savers seek higher returns
and greater diversification. International portfolio equity holdings as a share of stock market capitalization
rose from under 10 percent in 1987 to 20 percent by 2001 (Lane and Miles-Feretti, 2003). The vast
majority of portfolio holdings are administered by global custody banks who serve their clients,
institutional asset managers, by safeguarding assets, tracking and reporting asset values, repatriating
investment income, settling trades, and investing funds as directed. The world’s 10 largest custodians now
hold over $50 trillion in cross-border assets (Globalcustody.net, 2012). Institutional investors also rely on
custodians to handle the foreign-exchange trading required for repatriating dividend and interest income
as well as for their portfolio-allocation trades. This paper uses the complete foreign-exchange (forex)
trading record of a midsized global custody bank during 2006 to provide the first rigorous analysis of
custodial forex trading.
The pricing of custodial trades has been a focus of legal and media attention since 2009. Asset
managers had long suspected their custodians of setting extremely high markups on currency trades
(Galanek, 2010). The issue came to public prominence in October, 2009, with a lawsuit filed against State
Street by major California pension funds including CALPERS.1 The matter had simmered for many years
because documenting the magnitude of the markups is extremely difficult. As part of the normal custodial
relationship, asset managers outsource currency trading to the custody bank and learn their transaction
prices only after the funds change hands. Since reported trade information includes neither the bid-ask
spread nor the time of the trade, asset managers cannot identify exact execution costs on individual
transactions.
1 Additional lawsuits followed. The Attorneys General of Virginia and Florida are involved in similar suits against Bank of
New York/Mellon. State Street has been sued by the Arkansas Teachers Retirement Fund. Additional lawsuits have been filed
by private individuals under US whistle-blower laws.

3
Our highly detailed data, which include the exact dollar profits on each custodial forex trade,
enable us to confirm that markups on standard custodial trades are quite high: they average 24 basis
points, or eight times the markup on a standard OTC forex trade. Of course, this is not surprising given
the opacity of custodial trading. Green et al. (2007) show that opacity gives over-the-counter (OTC)
dealers a negotiating advantage that leads to higher markups. Since custodial trades are not negotiated and
the client funds never learn their execution costs, standard custodial trades are far more opaque than OTC
trades, and the wider markup follows logically.
As profit maximizers, all market makers have an incentive to set wide bid-ask spreads, but
custodial dealers face unique risks. Market makers in standard settings face the risk that inventory
acquired in serving a customer loses value before it can be unwound. This possibility could reflect pure
inventory risk associated with the randomness of returns (Stoll, 1978) or adverse-selection risk, meaning
the possibility that the dealer trades with a better-informed customer (Glosten and Milgrom, 1985). But
neither inventory nor adverse-selection risk matters for custodial forex trades because, given the opacity
of the custodial trading situation, custodial forex dealers can safely acquire the inventory needed to trade
with a customer before setting the customer’s price. The big risk facing custodial foreign-exchange
dealers is that of piercing the uncertainty surrounding their markups. A client observing a price beyond
the day’s trading range can infer that the bid-ask spread is at least twice the distance to the nearest
extremum. If that appears unreasonably large the custodian could experience costly pricing disputes or a
loss of business.
The primary contribution of this paper is to propose a “shrouding” model of custodial pricing on
forex trades in which prices are set relative to the day’s relevant extremum (the high for a customer buy,
the low for a customer sale) rather than to fundamental values. The behavior of markups under shrouding
diverges sharply from behavior under more familiar models of liquidity provision (e.g., Stoll, 1978;
Glosten and Milgrom, 1985). Shrouding implies, for example, that prices should generally be closer to the
day’s relevant extremum than to the middle of the day’s trading range, a pattern that holds for standard
custodial trades. Shrouding also implies that the custodial bank’s markups rise with volatility despite the
4
absence of inventory and adverse-selection risk, that operating costs are irrelevant, and that the markup is
smaller when the trade involves a second custodial bank despite the extra administrative costs. These
implications are supported by panel regressions based on over 70,000 transactions in 25 currencies against
the US dollar. Volatility has a strong, positive influence on markups for both OTC and non-OTC
custodial trades, but its influence is three times stronger for non-OTC trades. The presence of a
subcustodian raises markups on OTC trades by 6 basis points, as one might expect given their higher
administrative cost, but it reduces markups on non-OTC trades by 18 basis points.
Our analysis considers two other intriguing features of custodial forex trading, the first of which is
the lengthy delay associated with most non-OTC trades. Even for liquid currencies these delays average a
few hours, and for subcustodial currencies they average a few days. We suggest two possible reasons for
these delays, the first of which is shrouding. Delay permits dealers to estimate the day’s extrema with
greater precision, which has obvious advantages under shrouding. Alternatively, the delays could reflect
the dealers’ attempt to achieve cost efficiencies by consolidating or netting several individual transaction
requests into a larger trade. In the OTC market, where the custody bank acquires the inventory with which
to cover a client’s trade, bid-ask spreads are inversely related to trade size on deals under $1 million
(Osler et al., 2011). As an identification device we note that under shrouding the custodian’s dollar profits
rise with transaction size if delay permits a higher markup; by contrast, the dollar savings from netting fall
with transaction size. Small transactions are delayed by 78 minutes more than large transactions, implying
that netting is the dominant motive for delay.
We finish our analysis of custodial forex trading by investigating why client funds choose the
standard non-OTC custodial trading for 97 percent of their transactions even though the custodian trades
OTC with many clients and does so at far lower markups. Our evidence does not support the hypothesis
that funds have not “been doing basic best-execution due diligence” (Galanek, 2010) and are unaware of
the cost difference between OTC and non-OTC trades. Most of the funds in our sample qualify as
“sophisticated” according to U.S. regulatory standards (McGeehan, 2010). Further, client funds choose
between OTC and non-OTC trades in a manner that suggests they are aware of the cost differential: they

5
are significantly more likely to use a lower-markup approach for larger trades and for currencies where
the markup gap is widest.
We raise the possibility that information asymmetries between funds and their underlying
investors provide a rational motivation for funds to choose a trading approach with high markups. A fund
knows its cost structure, while its investors do not. If a fund shifts strongly towards OTC trading, thus
improving investor returns, the benefit to investors might be masked by random factors. Even if returns
improve noticeably, the underlying investors would be unlikely to connect that improvement to lower
transaction costs, given the opacity of these costs to the asset managers themselves.2 Though investors
might not recognize the benefits from a heavy reliance on OTC trading, they are very likely to notice the
costs, since OTC trading requires traders, technology, and trade-processing staff, all of which add to a
fund’s expense ratio and fees. Increased expense ratios and fees might also be misinterpreted as a sign of
poor fund management.
There are no other studies of custodial trading in the microstructure literature. The term shrouding
was introduced by Gabaix and Laibson (2006) to explain the way producers of certain consumer goods,
like computer printers, hide the prices of ancillary goods, like ink. Campbell (2006) discusses how
shrouding can explain the proliferation of complex mortgage products in the U.S. Green (2007) uses
shrouding to analyze the discount on newly issued municipal bonds.
The paper has five more sections. Section 2 describes our data. Section 3 describes and tests our
shrouding model of pricing for standard custody-bank currency trades. Section 4 examines why custodial
trades are typically delayed. Section 5 examines why custodial client funds rarely choose to trade OTC.
Section 6 concludes.
2. Data
Custody banks administer assets worth in excess of $110 trillion worldwide (Globalcustody.net,
2012). The business has expanded rapidly in recent decades, propelled by growth in the asset management
2 Transactions cost analysis (TCA), standard for equity and bond trades, is not well established in foreign exchange.

6
industry overall and by a 1974 law requiring U.S. pension funds to separate investment management and
custody management services. Global custody banks, which administer internationally-owned assets,
handle roughly 40% of the industry’s total (Globalcustody.net, 2012). Foreign-exchange trading is one of
the services provided by global custodians, and it has historically been highly lucrative. Extrapolation
from our database suggests that the custodial industry’s global revenues from foreign-exchange trading
are on the order of $13 billion annually.3
After a massive consolidation during the past decade, the industry is now dominated by a few
large banks; the top 15 custodian banks manage over 80% of total assets (Institutional Investor, 2007).
This consolidation presumably reflects, at least in part, the industry’s intense computational requirements
and consequent economies of scale. As shown in Schmeidel et al. (2006), doubling the assets under
management of a midsized European custody bank would increase its total costs by only 70 %. Cullinan
et al. (2005) reach a similar conclusion.
We analyze the complete record of foreign-exchange transactions between a midsized global
custody bank and its client funds during calendar year 2006. Like most global custodians, this one
provides a broad range of services to a broad range of asset managers and trust funds. For each transaction
the data include: (i) the two currencies, (ii) the amount traded in both currencies, (iii) the transaction price,
(iv) the time the trade was requested and the time the trade was carried out, (v) a variable indicating
whether the trade was for a special purpose such as repatriating investment income or corporate action
(meaning, for example, the exercise of warrants or participation in a tender offer), (vi) indicators for each
specific fund and – if one exists – a sponsoring asset manager; (vii) the fund’s assets under management
on December 31, 2006; (viii) an indicator of the fund’s asset class (equities, fixed-income securities,
currencies, or real estate, or some combination); (ix) an indicator of the fund’s orientation (active
management, index fund); and (x) the custody bank’s income from the transaction measured in US
dollars.
3 In our database, foreign-exchange trading volume represented 18% of fund net asset value and average markups were 19
basis points. Applying these fractions to the estimated net asset value at global custody banks in 2007,
$37 trillion, we infer that global custodians may have earned on the order of $13 billion.

7
We exclude all transactions that do not involve the US dollar (e.g., transactions between yen and
euro), trust-fund transactions, transactions of funds whose asset class is not listed, funds listed as having
assets below $1,000, currencies that account for less than 1% of all transactions, and corporate-action
transactions (which likewise account for only 1% of transactions). We also exclude transactions in the
Chilean peso and Korean won, due to the lack of available data on a key potential determinant of
markups, the interbank spread.
The final sample includes roughly 70,000 transactions in 25 currencies, worth in aggregate close
to $60 billion.4 Transaction sizes average roughly $800,000 and range widely; the largest single
transaction is worth over $600 million. As shown in Table 1, our sample of client funds includes roughly
500 individual asset managers with mean (median) assets under management of about $650 ($120)
million who placed on average about 150 trades during 2006. Most funds are actively managed, and half
are equity-focused. Roughly 91% of funds are sponsored by an umbrella asset management firm; the
average asset manager includes about 5 individual funds worth $3.5 billion in total.
Roughly 20% of transactions are in euro-dollar (EUR). Dollar-yen (JPY) and sterling-dollar
(GBP) each represent a further 13% of transactions. The Hong Kong dollar (HKD) represents 9% of
transactions. The currencies of Australia (AUD), Brazil (BRL), Canada (CAD), India (INR), and
Switzerland (CHF) each represent 4% to 5% of transactions; all other currencies represent less than 3%.
Transaction sizes for the 3 major currencies (EUR, JPY, GBP) are a bit more than twice as large as those
for other currencies.
We create four groups of currencies: 1. the three majors; 2. eight other liquid currencies; 3. five
illiquid currencies that are freely traded (“free illiquid currencies”); 4. nine illiquid currencies that are
traded through a subcustodian, in most cases due to exchange controls (“subcustodial currencies”). In
Brazil, for example, the involvement of a local subcustodian is essential because the government must
approve every trade and this requires documentation that a trade is associated with an underlying
investment transaction. For brevity we use the three-letter codes assigned to each currency in the market.
4 We leave some figures ambiguous to protect the anonymity of the custody bank.
8
Those not yet defined are listed here alphabetically by currency code: Danish krone (DKK), Hungarian
forint (HUF), Indonesian rupiah (IDR), Israeli shekel (ILS), Mexican peso (MXP), Malaysian ringgit
(MYR), Norwegian krone (NOK), New Zealand dollar (NZD), Philippine peso (PHP), Polish zloty
(PLN), Swedish krone (SEK), Singapore dollar (SGD), Thai baht (THB), Turkish lira (TRY), Taiwan
dollar (TWD), South African rand (ZAR).
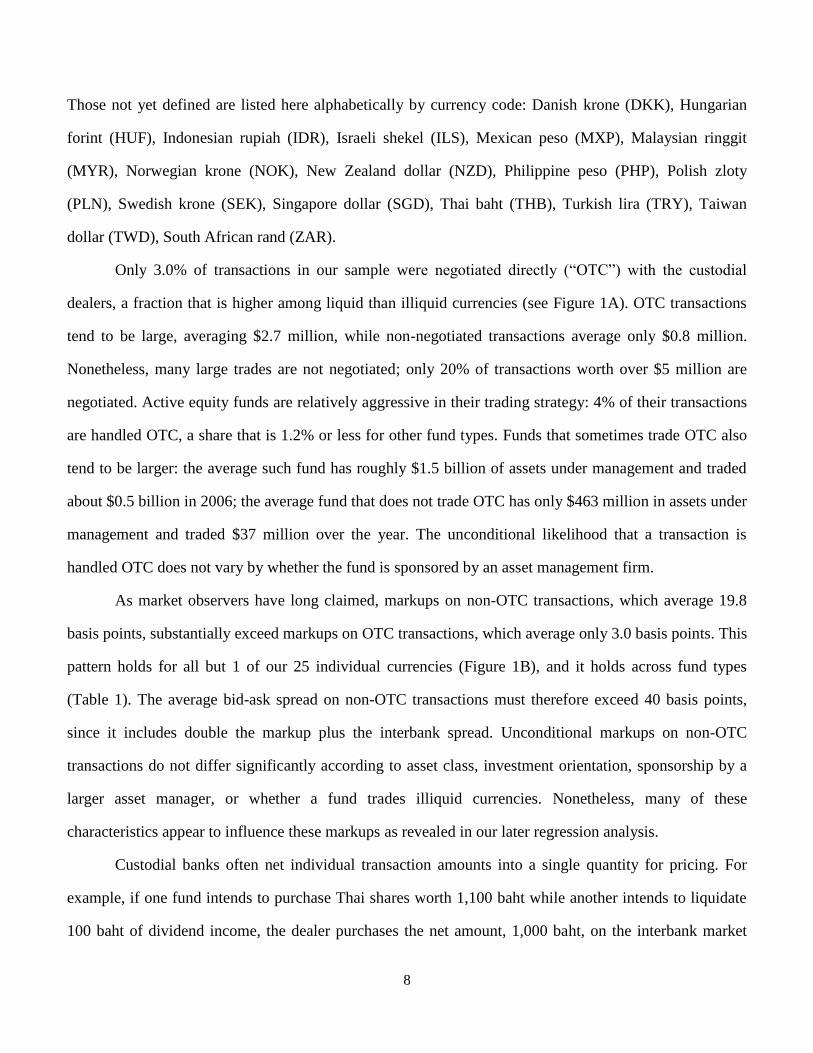
Only 3.0% of transactions in our sample were negotiated directly (“OTC”) with the custodial
dealers, a fraction that is higher among liquid than illiquid currencies (see Figure 1A). OTC transactions
tend to be large, averaging $2.7 million, while non-negotiated transactions average only $0.8 million.
Nonetheless, many large trades are not negotiated; only 20% of transactions worth over $5 million are
negotiated. Active equity funds are relatively aggressive in their trading strategy: 4% of their transactions
are handled OTC, a share that is 1.2% or less for other fund types. Funds that sometimes trade OTC also
tend to be larger: the average such fund has roughly $1.5 billion of assets under management and traded
about $0.5 billion in 2006; the average fund that does not trade OTC has only $463 million in assets under
management and traded $37 million over the year. The unconditional likelihood that a transaction is
handled OTC does not vary by whether the fund is sponsored by an asset management firm.
As market observers have long claimed, markups on non-OTC transactions, which average 19.8
basis points, substantially exceed markups on OTC transactions, which average only 3.0 basis points. This
pattern holds for all but 1 of our 25 individual currencies (Figure 1B), and it holds across fund types
(Table 1). The average bid-ask spread on non-OTC transactions must therefore exceed 40 basis points,
since it includes double the markup plus the interbank spread. Unconditional markups on non-OTC
transactions do not differ significantly according to asset class, investment orientation, sponsorship by a
larger asset manager, or whether a fund trades illiquid currencies. Nonetheless, many of these
characteristics appear to influence these markups as revealed in our later regression analysis.
Custodial banks often net individual transaction amounts into a single quantity for pricing. For
example, if one fund intends to purchase Thai shares worth 1,100 baht while another intends to liquidate
100 baht of dividend income, the dealer purchases the net amount, 1,000 baht, on the interbank market
9
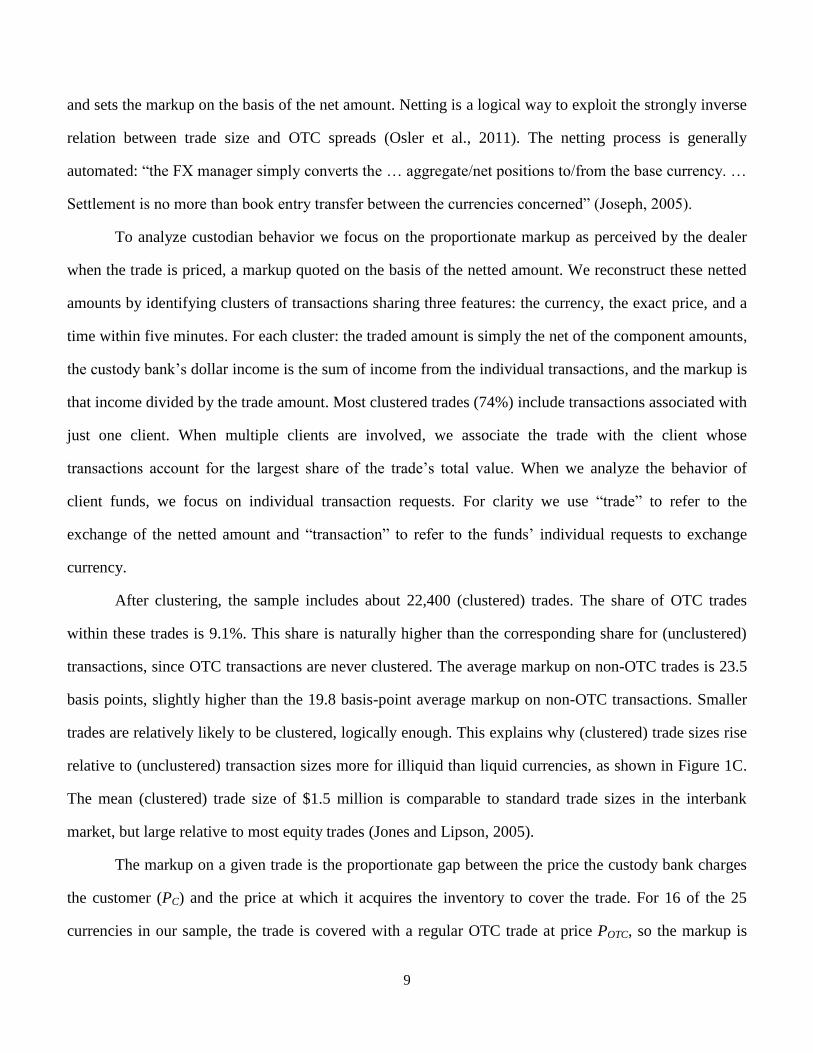
and sets the markup on the basis of the net amount. Netting is a logical way to exploit the strongly inverse
relation between trade size and OTC spreads (Osler et al., 2011). The netting process is generally
automated: “the FX manager simply converts the … aggregate/net positions to/from the base currency. …
Settlement is no more than book entry transfer between the currencies concerned” (Joseph, 2005).
To analyze custodian behavior we focus on the proportionate markup as perceived by the dealer
when the trade is priced, a markup quoted on the basis of the netted amount. We reconstruct these netted
amounts by identifying clusters of transactions sharing three features: the currency, the exact price, and a
time within five minutes. For each cluster: the traded amount is simply the net of the component amounts,
the custody bank’s dollar income is the sum of income from the individual transactions, and the markup is
that income divided by the trade amount. Most clustered trades (74%) include transactions associated with
just one client. When multiple clients are involved, we associate the trade with the client whose
transactions account for the largest share of the trade’s total value. When we analyze the behavior of
client funds, we focus on individual transaction requests. For clarity we use “trade” to refer to the
exchange of the netted amount and “transaction” to refer to the funds’ individual requests to exchange
currency.
After clustering, the sample includes about 22,400 (clustered) trades. The share of OTC trades
within these trades is 9.1%. This share is naturally higher than the corresponding share for (unclustered)
transactions, since OTC transactions are never clustered. The average markup on non-OTC trades is 23.5
basis points, slightly higher than the 19.8 basis-point average markup on non-OTC transactions. Smaller
trades are relatively likely to be clustered, logically enough. This explains why (clustered) trade sizes rise
relative to (unclustered) transaction sizes more for illiquid than liquid currencies, as shown in Figure 1C.
The mean (clustered) trade size of $1.5 million is comparable to standard trade sizes in the interbank
market, but large relative to most equity trades (Jones and Lipson, 2005).
The markup on a given trade is the proportionate gap between the price the custody bank charges
the customer (PC) and the price at which it acquires the inventory to cover the trade. For 16 of the 25
currencies in our sample, the trade is covered with a regular OTC trade at price POTC, so the markup is

10
|(PC −POTC)/PC|.5 For the other 9 countries a subcustodian purchases or sells the currency in the local
interbank market and charges the main custodian a marked-up price, PSC, so the main custodian’s markup
is |(PC −PSC)/PC|.
The markup is negative for 8.4% of the original transactions. For OTC trades, which are subject to
inventory risk, negative markups happen naturally. Green et al. (2007), for example, calculate a loss
frequency of 1.4% for OTC municipal bond trades. On non-OTC (clustered) trades, markups should never
be negative because dealers cover their positions before setting prices for the client. On non-OTC
individual transaction requests, by contrast, some markups will be negative whenever a transaction in one
direction is netted into a trade in the other direction. After clustering, only 1.4% of trades have negative
markups, of which only a few are non-OTC trades.
3. Custody bank behavior: What drives markups?
This section examines the forces that determine markups on custodial trades, contrasting standard
custodial trades with custodial OTC trades. Prices and markups on custodial OTC trades should behave
like those in the regular OTC currency market, since their relative transparency makes them subject to
competitive pressures. The behavior of OTC currency spreads can be explained using the Stoll (1978) and
Naik et al. (1999) models of liquidity provision. Dealers set prices relative to the asset’s conditional
expected value, and spreads include components for inventory risk, operating costs, and information
asymmetries. Inventory risk, meaning the risk that a dealer’s inventory loses value due to random price
changes, causes markups on OTC forex trades to rise with asset volatility (Stoll, 1978). Fixed operating
costs help explain why OTC spreads for currency customers are inversely related to trade size (Osler et
al., 2011; Ding, 2009). In the custodial setting, operating costs also vary across currencies and should be
higher for currencies traded through a subcustodian and for currencies facing exchange controls.
Information asymmetries are important for OTC currency spreads, but not due to adverse selection
or, equivalently, the risk of trading with better-informed customers. Instead, currency dealers appear to
5 The decision to use the customer price as the scale factor was the custodian’s.

11
widen spreads for the least sophisticated customers, who typically make smaller trades (Osler et al.,
2011); Green et al. (2007) document similar behavior in the municipal bond market. OTC currency
dealers also appear to strategically narrow spreads for sophisticated customers to learn whether they are
buying or selling (Naik et al., 1999; Ramadorai, 2008; Osler et al., 2011), information they exploit in
subsequent interdealer trades. These motivations would not apply to dealers at most custodial banks, who
do not speculate, but given competitive pressures, custodial OTC trades should conform to market norms.
As we show below, markups on OTC custodial trades behave consistently with markups on
regular OTC forex trades, which means they can both be explained by standard models of liquidity
provision. However, these models cannot explain markups on non-OTC custodial trades. Volatility should
have no influence on non-OTC markups under the OTC model, because inventory risk and information
asymmetries are irrelevant on such trades and opacity shields the dealers from competitive forces. But in
fact volatility and non-OTC markups are strongly positively correlated (correlation = 0.77). This
correlation can be appreciated through a visual comparison of markups by currency (Figure 1B) with
volatility by currency (Figure 2A). Hong Kong, which tightly controls its exchange rate around HKD 7.8
per USD, exemplifies this: both its currency volatility and its average non-OTC markup are two orders of
magnitude smaller than corresponding figures for other countries.
Under OTC pricing markups should be higher on subcustodial trades because they are
administratively costly, but the reverse is true as one can observe in Figure 1B. The average non-OTC
markup on subcustodial currencies is 11.0 basis points while the average non-OTC markup for free
emerging market currencies is 40.6 basis points.
We propose an entirely different pricing model for non-OTC custodial trades that focuses on their
opacity. Normally, a client fund intending to trade a foreign asset simply instructs its “fund accountant” at
the custodian to take care of it. That representative sends an instruction to the custodial foreign-exchange
trading floor specifying the currencies and the amount to trade; a dealer purchases the required currency
from a regular currency dealing bank; finally, the dealer prices the trade for the customer. The customer
knows neither the price nor the bid-ask spread at the time of the trade. The price paid is listed in the

12
client’s next regular summary of trading activity, which the fund receives days or weeks later. These
reports specify neither the spread nor the transaction time, so it is impossible for funds to calculate their
exact execution costs.6
This opaque trading structure is to some extent exogenous; it emerged along with the very
existence of custodial banks, because asset managers find it cost effective to outsource asset
administration and trade processing. The opacity nonetheless endows custodial dealers with a substantial
information advantage. As captured by Green et al.’s (2007) “market power” hypothesis, in opaque
markets dealers have more negotiating leverage relative to their customers and can charge wider bid-ask
spreads in equilibrium.
The opacity of the custodial trading structure is not entirely exogenous, however, because it can be
influenced by the dealer’s pricing strategy. Daily high and low interbank prices are available
inexpensively, and when the dealer sets a price beyond that range, a fund can identify a minimum markup.
If that minimum strikes the fund as unreasonably large, the funds could initiate a pricing dispute, shift
towards OTC trading, or shift its assets to another custodial bank.
The lawsuits against global custody banks suggest that the banks are aware of their own potential
influence on opacity. According to the original complaint filed against State Street Corporation, for
example:
When discussing inquiries by the Pension Funds about providing “transparency” in foreign-
exchange execution costs, one Senior Vice President with State Street California commented to
other State Street executives that, “[i]f providing execution costs will give [CalPERS] any insight
into how much we make off of FX [foreign-exchange] transactions, I will be shocked if [a State
Street V.P.] or anyone would agree to reveal the information.” (Complaint, p. 3).
Custodial trades thus face a risk that is unique to their trading situation: the possible loss of
opacity. We propose that custodial dealers protect their information advantage by shrouding, that is, by
setting prices to maintain client ignorance about markups. The concept of shrouding is introduced by
Gabaix and Laibson (2006) in the context of consumer products that must be complemented by ancillary
6 The difficulty in identifying execution costs on standard custodial trades is aptly illustrated by approaches adopted in the
lawsuits, which is to compare traded prices to daily price ranges or daily average prices.

13
features (e.g., computer printers and ink, hotel rooms and parking). They hypothesize that producers will
advertise a low price for the core product while setting a high but difficult-to-find price for the ancillary
products. In finance, Green (2007) identifies high retail search costs and shrouding as key to the apparent
under-pricing of new municipal bond issues. Campbell (2006) presciently stresses that shrouding could
explain why so many complex mortgage products emerged in the U.S. prior to the financial crisis.
To fix ideas, suppose without loss of generality that fund j is buying a currency, so it will pay the
custodial bank’s ask price, PA
C, and that the fund generally considers a markup in excess of Mj ≥ 0 to be
unreasonable. The fund infers an excessive markup if its price, PA
C, exceeds the day’s realized interbank
high, H, by a proportion of Mj or more. If so, the custodian bears costs per unit traded proportional to the
perceived excess: [PA
C−H(1+Mj)], ≥. The cost parameter, summarizes expenses involved in
dispute resolution, foregone currency trading income if the fund shifts towards more OTC trading, or
foregone custodial business of every sort if the fund moves its assets to another custodial bank. The cost
parameter could also capture risk aversion among custodial dealers.
The custodian covers the trade in the regular OTC market at price POTC and then sets PA
C to
maximize expected profits per unit traded:7
MaxP (PA
C − POTC) − E{[PA
C − H(1+Mj)]|PA
C ≥ H(1+Mj)} (1)
The custodial bank knows Mj but not the day’s interbank high. If h is the high up to the point of the trade,
the day’s realized interbank high has a uniform distribution over H[h(1−), h(1+)], 0 < 1. The
optimum price, PA
C*, is:
PA
C* = h(1−)(1+Mj)(1 + 2/) . (2)
The benchmark for this optimum price, h(1−)(1+Mj), is the lowest level that could possibly raise
concern at the client fund. This benchmark is adjusted upward by an amount that is inversely related to
the costs of excessive perceived markups, . The optimum price could be either above or below the
7 Note that the custodial bank itself may be treated as a customer, rather than another interbank dealer, when trading with
regular dealing banks.

14
current expected high for the day as the custodial bank trades off the certainty of higher revenue gained
from setting a higher price against the greater likelihood and cost of customer dissatisfaction.
For comparability with other econometric studies of dealer pricing, which focus on bid-ask
spreads, we analyze the dealer’s markup relative to the price at which it brings the funds into inventory.
For currencies free of exchange controls the covering price is the OTC ask price, PA
OTC, and we express
the markup on a customer purchase in logarithmic form for analytical convenience: MarkupjB =
ln(PA
C/PA
OTC); for subcustodial currencies the covering price is PA
SC and the markup is MarkupjB =
ln(PA
C/PA
SC). A subcustodian acquires the inventory in an OTC trade with some other bank and charges a
subcustodial markup MSC: MSC ln(PA
SC/PA
OTC). Continuing with the subcustodial case, which nests the
other, the primary custodian’s markup on customer j’s purchase (MarkupjB) is:
MarkupjB ln(P
AC/P
ASC) = ln[h(1−)(1+Mj)(1+2/)/P
ASC] (3a)
ln[h(1−)(1+Mj)(1+2/)] − ln[PA
OTC(1+MSC)] .
If the distribution for the day’s low price, L, is symmetric around the observed low when the trade is
priced, l, with dispersion parameter , the markup on a customer sale, MarkupjS, is:
MarkupjS ln(P
BSC /P
BC) = ln[P
BSC /l(1+)(1-Mj)(1−2/)] (3b)
ln[PB
OTC(1−MSC)] − ln[l(1+)(1-Mj)(1-2/)] .
To gain a direction-free expression for the main custodian’s markup we combine (3a) and (3b), assume
subcustodial markups are symmetric for purchases and sales, apply ln(1+x) x for small x, and divide by
2. This gives:
Markupj ln(h/l)/2 + (2/ −) + Mj − MSC − ln(PA
OTC/PB
OTC)/2. (4)
Equation (4) shows that shrouding predicts behavior inconsistent with the OTC pricing model:
Shrouded markups rise with the expected daily interbank price range, ln(h/l), and with a fund’s maximum
acceptable markup, Mj, and they fall when a subcustodian is involved. Shrouding also predicts that
markups are inversely related to: the cost of exceeding the opacity constraint, ; uncertainty about the

15
day’s range at the time a trade is priced, ; and the spread paid by the custodial bank, ln(PA
OTC/PB
OTC)/2,
which varies by currency and by trade size.
An individual fund’s Mj could vary according to its sophistication with respect to this market
context, meaning the extent to which it is capable of extracting execution costs from scattered trade
information and knowledgeable about normal markups. Sophistication, in turn, could vary according to
fund attributes. It has been claimed in the business press that equity funds pay wider markups on custodial
trades than bond or other funds because they are less familiar with the nature of foreign-exchange trading
(FXAll, 2006). The suggestion is that this reflects a lack of familiarity among equity asset managers with
currency trading conventions. Equities are typically traded through brokers, who act as agents and are
compensated by commission, rather than through dealers, who trade as principals and are compensated by
the bid-ask spread. Larger funds would presumably have greater market expertise and greater resources
for identifying execution costs, and therefore a smaller Mj. Expertise and resources could also be higher at
funds that are sponsored by a larger institution. Even so, centralized handling of trade processing at a
large asset manager could worsen opacity by imposing an additional layer of bureaucracy between fund
managers and execution-cost information.
Funds might also vary in the extent to which they react to perceived excessive markups, . Index
funds might react less if their existing investors follow buy-and-hold strategies and are relatively unlikely
to shift wealth from fund to fund. Alternatively, index funds might react more if they need aggressive cost
controls to achieve high returns and attract new investors, given that theirs is effectively a commodity
business.
3.1. Preliminary test: Pricing relative to extrema
Though our main empirical tests concern the implications of shrouding for markups, we first
highlight some ways in which shrouding can explain the behavior of price levels. Equation (2) shows that
shrouded non-OTC prices will be set relative to the day’s expected extrema (the extreme high for client
purchases, the extreme low for client sales). In this case, the proportionate distance between the client
price and the day’s relevant extremum should be = M−+2/. Let R≥0 represent the day’s expected

16
proportionate high-low range, so l = h(1−R), and the expected midpoint of the exchange rate’s range for
the day (the “midrange”) is (h+l)/2=h(2-R)/2. In this case, Equation (2) indicates that the proportionate
distance between the client price and midrange is M−+2/+R/2. This implies that, under shrouding,
distance-to-midrange exceeds the distance-to-extremum whenever the exchange rate moves during the
day (R>0). Equation (2) also suggests, though it does not formally require, that shrouded prices will
generally be closer to the relevant extremum for the day than to the market mid-quote at the time of the
trade. According to standard theory, the opposite should be true for normal OTC prices, which are set
relative to the asset’s expected true value.
To evaluate these implications of shrouding we calculate three distance measures. The distance-to-
extremum is the average (squared) distance between the price paid by the client and the relevant expected
extremum for the day. We use realized extrema as a proxy for the expected extrema, since the custodian
sets most prices late in the foreign-exchange trading day when the day’s extrema can usually be predicted
with accuracy. The distance-to-midrange is the average (squared) distance between the client price and
the average of the day’s high and low prices. The distance-to-midquote should ideally be the average
(squared) distance from the client’s price to the interbank mid-quote, but we have the prices at which the
custodian covered its trades rather than the mid-quote. Available estimates suggest that these two should
be fairly close for non-subcustodial currencies because regular OTC bid-ask spreads for financial
customers are generally small (Osler et al., 2011). To account for the custodian’s OTC execution costs,
we add to the markup a (very) conservative estimate of the minimum half-spread charged by a regular
dealing bank for financial customers, specifically 1 basis point for relatively liquid currencies and 3 basis
points for free emerging market currencies. For other currencies the custodian’s covering price differs
from the mid-quote not just due to the OTC spread but also due to the subcustodial markup, so we
exclude these currencies from this set of tests.
These distance measures highlight striking contrasts between OTC and non-OTC prices.
Focusing first on distance-to-midrange, we find that for OTC trades the distance-to-midrange is smaller
than the distance-to-extremum in all 16 non-subcustodial currencies, consistent with the idea that OTC

17
trades are priced relative to the asset’s fundamental value rather than to the day’s expected extrema. For
non-OTC trades, by contrast, the distance-to-midrange exceeds the distance-to-extremum for 14 of the 16
currencies, consistent with shrouding. We evaluate the statistical significance of this finding under the
(conservative) null hypothesis that the distance-to-extremum has an equal chance of being higher or lower
than the distance-to-midrange. Since each currency can be viewed as an independent observation, the
expected number of currencies for which distance-to-midrange exceeds distance-to-extremum has a
binomial distribution with p=0.5, n=16, and expected value = 8. If one distance exceeds the other for 14
currencies the null is rejected at a marginal significance level of 0.2 percent.
The shrouding hypothesis is also supported by comparisons between the distance-to-extrema and
distance-to-midquote. On OTC trades the distance-to-extremum is larger than the distance-to-midquote
for all 16 subcustodial currencies while the reverse holds for 14 of the 16 subcustodial currencies, a highly
significant finding as outlined above.
3.2. Regression analysis of markups: Methodology
Our core statistical analysis of shrouding involves regressions in which the dependent variable is
the markup for each trade t, Markupt, and the independent variables comprise economic determinants, Xt,
and day-of-the-week dummies, Zt. We allow the determining factors to influence OTC and non-OTC
trades separately by including an interaction term, XtDt, where Dt is a dummy variable for trade type (1 =
non-OTC).
Markupt = Xt + XtDt + Zt + t (4)
Table 2 provides descriptive statistics for our regression variables.
We measure volatility in terms of a day’s high and low range in the interbank market (data from
Oanda.com). To capture cross-sectional variation in expected volatility, CSVolc, we take each currency’s
average high-low range for calendar year 2006 (excluding weekends and major holidays). To capture
time-series variation, TSVolc, we take a 5-day lagged average of the high-low range divided by that
currency’s year-average level. Data on subcustodial markups are not available, so we include a dummy

18
variable for the subcustodial currencies. For thoroughness, we include dummies for other currency groups
(with the majors as the base).
The shrouding hypothesis predicts smaller markups when the custody bank itself pays a larger bid-
ask spread, but data on customer spreads are generally unavailable. In the regular OTC market customer
spreads are set relative to the interbank spread, but even these are difficult to obtain for a wide range of
currencies. We include the difference between daily exchange rates reported by Global Insight, which are
interbank mid-quotes, and by oanda.com, which are interbank ask quotes. These are noisy estimates even
of the interbank spread, so we use only their average over 2006. As shown in Figure 2B, these estimates
are generally narrower for liquid currencies (average 5 basis points) than illiquid currencies (average 21
basis points) and they range up to 45 basis points for TRY. Reassuringly, our estimates are somewhat
lower on average than those presented by Koutmos and Martin (2011) for the period 1996–2000,
consistent with the general down-trend in bid-ask spreads since 2000 (King, Osler, and Rime, 2012), and
yet highly correlated with that earlier set of estimates. To capture aspects of market liquidity beyond bid-
ask spreads, we note that Friday afternoons are notorious for light trading and low liquidity in the major
currencies, so we include day-of-the-week dummies with Monday as the baseline day.8
We include a variety of fund characteristics that might be associated with market sophistication or
intolerance of high markups: fund size, sponsorship by an asset manager, asset class, and investment
orientation. Fund size is measured two ways: total trading volume over 2006 and net asset value on
December 31, 2006. Sponsorship by an asset manager is captured three ways: a zero-one dummy
(sponsored = 1), the net asset value of the other funds in the asset manager’s umbrella, and the trading
volume of the other funds. We partition asset managers into equity funds, fixed-income funds, and funds
focused on other asset classes (which also includes balanced funds); for equities and bonds we distinguish
actively-managed from indexed funds.
8 We considered using trading volume per se as a proxy for liquidity, since traders may be sensitive to execution delays. Daily
trading figures are not published for currency markets, but market-wide trading volume is calculated in April of every third
year (Bank for International Settlements, 2010). We experimented with the inverse of this measure, but it proved highly
collinear with average interbank spreads.

19
The residuals in Equation (4) may be correlated for a given currency across days and within a
given day across currencies, so we allow standard errors to cluster simultaneously along the dimensions
of currency and time. Reported standard errors are also robust to heteroskedasticity and autocorrelation.
We apply the censored regression technique to account for negative and zero markups on non-OTC
trades. Our few dozen non-OTC transactions with negative markups could have been incorrectly recorded
since such trades are covered before being priced.
3.3. Regression analysis of markups: Results
Initial coefficients estimates for Equation (4) are presented in Table 3, columns 1 and 2. As our
baseline we use a slightly more streamlined regression, presented in columns 3 and 4, that excludes a few
variables that are conceptually marginal and consistently insignificant.
We begin our review of the estimated behavior of OTC markups. As anticipated, these behave
consistently with regular OTC bid-ask spreads: they rise with volatility, they are inversely related to trade
size, they are higher on Fridays, and they are higher for subcustodial currencies. At sample medians the
estimated markup is 7.1 basis points. (This corresponds to a transaction in a liquid currency by a modest-
sized active-equity fund that is sponsored by an asset manager). The influence of market competition on
these relatively transparent trades presumably explains why this figure is close to the estimated half-
spreads on financial-customer trades in the regular OTC market of comparable magnitude (Osler et al.,
2011, Tables V and VI). None of the fund characteristics have a significant influence on OTC markups,
which suggests that the dealers agree with Taylor and Farstrup (2006) that unleveraged asset managers do
not base international asset allocation decisions on informed exchange rate forecasts.
Turning to non-OTC markups, the estimates consistently support the shrouding hypothesis. These
markups are estimated to exceed OTC markups by 23 basis points, on average, consistent with these
trades’ relative opacity. Volatility has a strong, positive influence on non-OTC markups, with cross-
sectional and time-series dimensions of volatility contributing about equally. Indeed, non-OTC markups
are over twice as sensitive to volatility as OTC markups, despite the absence of inventory or adverse-

20
selection risk, and volatility is the single biggest contributor to the markup gap between non-OTC and
OTC trades.
Consistent with shrouding, markups on non-negotiated trades fall by 11.5 basis points when a
subcustodian is involved, despite those trades’ higher administrative costs.9 Coefficient point estimates
suggest that the spread paid by the custody bank when it covers the trade, which we proxy with
interdealer spreads, has a positive influence on OTC markups and a negative influence on non-OTC
markups, consistent with the shrouding hypothesis. Neither coefficient is significant, however, which
could reflect our difficulties in measuring this variable.
Markups on non-negotiated trades are highly sensitive to several fund characteristics that could
reflect sophistication and thus lower values of Mj. Fund size is important, with larger funds paying smaller
markups. A fund with net asset value 1 standard deviation larger than the median is typically charged a
markup that is 2.2 basis points smaller, other things equal. One might suspect that large funds get a
volume discount, but if so, markups on OTC trades would be negatively related to fund size which is not
supported by our evidence. The possibility that large funds are more sophisticated gains further support in
Section 5, where we show that larger funds are more likely to call in trades directly.
Sponsorship by a larger asset management institution brings a 12-basis-point reduction in
markups, which suggests that the umbrella organizations do bring valuable expertise and/or resources. On
the other hand, markups tend to rise with the size of the other funds under the asset manager’s umbrella.
This offsetting influence could emerge if trade processing and reporting are subject to economies of scale,
in which case the asset manager would be more likely to centralize these activities as the other funds
grow. When trade processing and reporting are centralized, it may be more difficult for an individual fund
to identify and control execution costs.
Asset class and investment orientation apparently matter little for non-OTC markups. According
to the point estimates, equity index funds pay higher non-OTC markups than active equity funds, but this
9 The figure of 11.5 is the sum of the coefficients on the subcustodial dummy and the subcustodial dummy interacted with the
non-OTC dummy: 11.5 = 17.5 - 6.0.
21
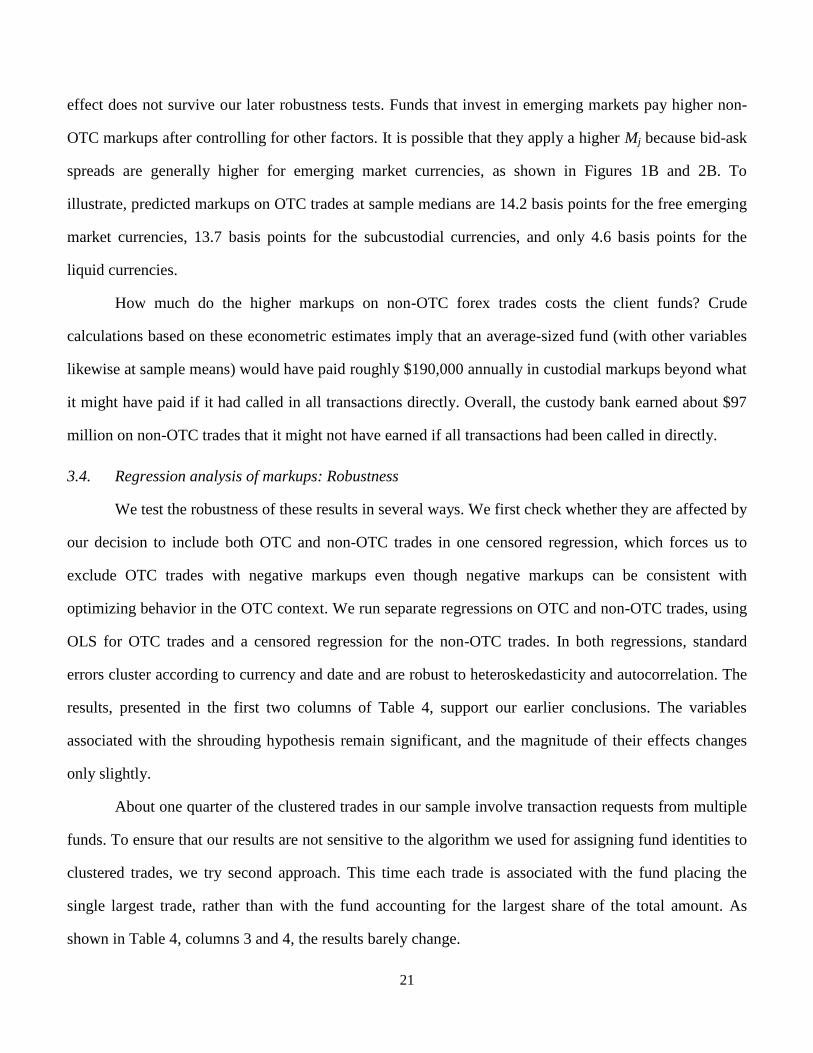
effect does not survive our later robustness tests. Funds that invest in emerging markets pay higher non-
OTC markups after controlling for other factors. It is possible that they apply a higher Mj because bid-ask
spreads are generally higher for emerging market currencies, as shown in Figures 1B and 2B. To
illustrate, predicted markups on OTC trades at sample medians are 14.2 basis points for the free emerging
market currencies, 13.7 basis points for the subcustodial currencies, and only 4.6 basis points for the
liquid currencies.
How much do the higher markups on non-OTC forex trades costs the client funds? Crude
calculations based on these econometric estimates imply that an average-sized fund (with other variables
likewise at sample means) would have paid roughly $190,000 annually in custodial markups beyond what
it might have paid if it had called in all transactions directly. Overall, the custody bank earned about $97
million on non-OTC trades that it might not have earned if all transactions had been called in directly.
3.4. Regression analysis of markups: Robustness
We test the robustness of these results in several ways. We first check whether they are affected by
our decision to include both OTC and non-OTC trades in one censored regression, which forces us to
exclude OTC trades with negative markups even though negative markups can be consistent with
optimizing behavior in the OTC context. We run separate regressions on OTC and non-OTC trades, using
OLS for OTC trades and a censored regression for the non-OTC trades. In both regressions, standard
errors cluster according to currency and date and are robust to heteroskedasticity and autocorrelation. The
results, presented in the first two columns of Table 4, support our earlier conclusions. The variables
associated with the shrouding hypothesis remain significant, and the magnitude of their effects changes
only slightly.
About one quarter of the clustered trades in our sample involve transaction requests from multiple
funds. To ensure that our results are not sensitive to the algorithm we used for assigning fund identities to
clustered trades, we try second approach. This time each trade is associated with the fund placing the
single largest trade, rather than with the fund accounting for the largest share of the total amount. As
shown in Table 4, columns 3 and 4, the results barely change.

22
We next recalculate our measures of cross-section and time-series measures of volatility using
realized volatility rather than the proportionate high-low range (in essence, we replace the day’s
proportionate range with the day’s return in the underlying calculations). The results, presented in Table
4, columns 5 and 6, continue to support the shrouding hypotheses for markups on non-OTC trades: the
average extra markup on non-OTC trades is 22 basis points; the markup rises with volatility; and the
markup is smaller for subcustodial currencies. For markups on OTC trades, however, the coefficients on
volatility become small and insignificant, which suggests that our original volatility variable is superior.
We next allow for differences in “the nature of the overall relationship” (Joseph, 2005) between a
fund and its global custodian, assuming that the relationship is managed at the level of sponsoring asset
manager when one exists. Some funds or asset managers prefer to compensate their custodian by paying
high up-front fees and low execution costs while others prefer the reverse, and these arrangements can
vary in other ways. To capture these idiosyncrasies we add dummies for individual asset managers
(leaving one out to avoid collinearity). The asset manager dummies are jointly statistically significant (F
statistic of 321.8 is significant at 1%). As shown in Table 4, columns 7 and 8, the coefficients on fund and
asset manager descriptors all become insignificant, as one might expect, but there is little change in the
main variables associated with the shrouding hypothesis, specifically volatility and the subcustodial
dummy.
We finish this section by examining whether our qualitative conclusions are sustained for
subsamples of the data. We focus first on funds that choose to negotiate transactions, since that choice
reveals strong concern about execution costs. The response of markups to the key variables changes only
slightly, as shown in Table 5, columns 1 and 2. When we run separate regressions for the liquid and
illiquid currencies, both regressions provide further support for shrouding. They also reveal that light
trading on Fridays affects the liquid currencies but not the illiquid currencies.
4. Custodial dealer behavior: Trade timing
Custodial forex trades are generally executed in the afternoon though they are generally requested
in the morning. Figure 3B shows average delays by currency for small and large trades. The average delay

23
between request and execution is 6 hours for currencies without exchange controls and 50 hours for
currencies with such controls. Since delays are not long for the three subcustodial currencies without
exchange controls (HKD, ILS, and PHP), one infers that dealing with governments is time consuming but
dealing with subcustodians is not.
Delays on non-subcustodial currencies are viewed by some practitioners as a manifestation of
shrouding. “[T]he custodian has a free option to set the price at the end of the day. At this point it already
knows the full trading range and is able, if it chooses, to pick any price from this range” (Collie, 2004, p.
3). In effect, waiting is presumed to provide additional precision to the dealer’s estimates of the day’s
price extrema, or equivalently to reduce . As indicated by Equation (4), this would bring higher average
markups on average.
Trade delays could alternatively be motivated by transaction economies of scale. By waiting a few
hours and aggregating transaction requests for a given currency, the dealer can exploit the inverse relation
between trade size and OTC bid-ask spreads when it covers the trades with a regular dealing bank.
Without economies of scale, netting would not be cost effective because it requires special software and it
increases the share of transactions on which the custodian loses money to customers. As noted in Section
2, buying and selling customers within a netted trade are assigned the same price, so the buying (selling)
customer in a sell-dominated (buy-dominated) trade enjoys negative transaction costs. Client funds
profited from 8.4% of their transaction requests.
To identify the relative importance of shrouding versus netting we compare delays for trades of
different sizes. If shrouding is the dominant motivation for delay, larger trades should face longer delays
because the custody bank’s absolute monetary benefit from a higher markup rises with trade size. If late-
day executions reflect netting, larger trades would face shorter delays because larger trades can be
executed at low cost without netting.
This comparison supports netting as the dominant motivation for execution delays. On average
across all currencies, large trades are delayed by 78 fewer minutes than small trades. Delays are shorter
for larger transactions in 23 of our 25 currencies (Figure 3B). Under the null hypothesis that trade size and
24
delay are unrelated, the number of currencies with shorter delays for larger trades has a binomial
distribution with n = 25 and p = 0.5 and the figure 23 out of 25 is highly significant.
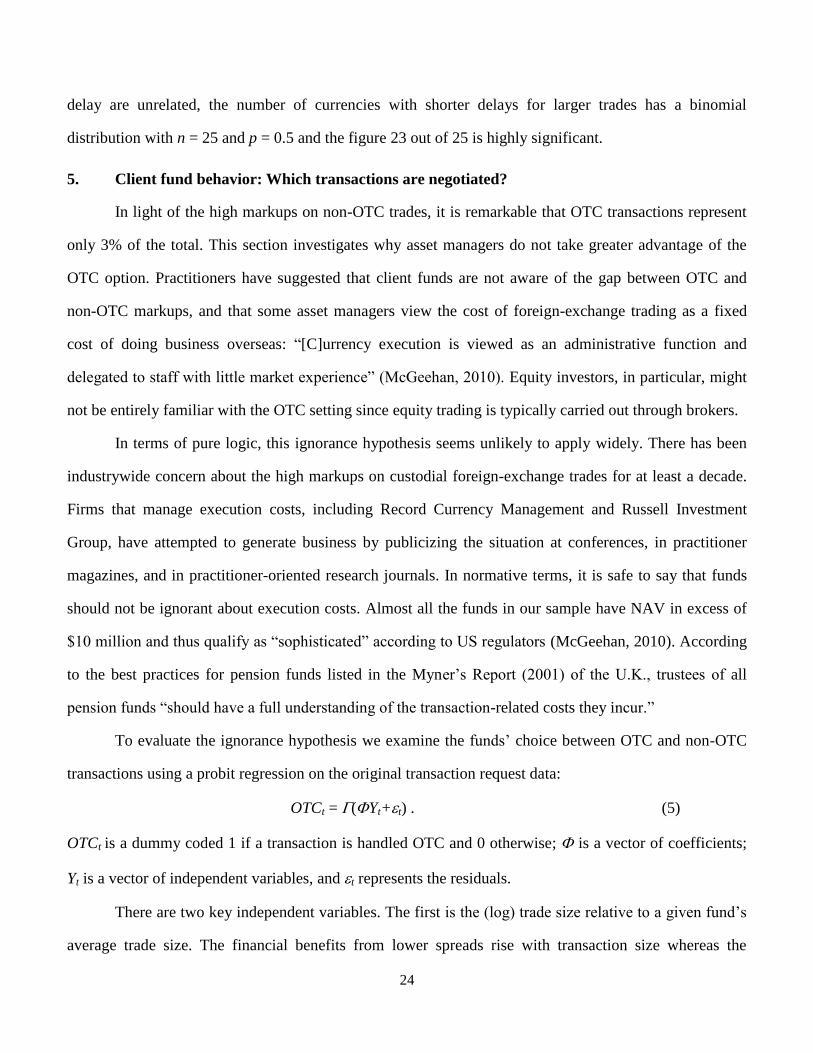
5. Client fund behavior: Which transactions are negotiated?
In light of the high markups on non-OTC trades, it is remarkable that OTC transactions represent
only 3% of the total. This section investigates why asset managers do not take greater advantage of the
OTC option. Practitioners have suggested that client funds are not aware of the gap between OTC and
non-OTC markups, and that some asset managers view the cost of foreign-exchange trading as a fixed
cost of doing business overseas: “[C]urrency execution is viewed as an administrative function and
delegated to staff with little market experience” (McGeehan, 2010). Equity investors, in particular, might
not be entirely familiar with the OTC setting since equity trading is typically carried out through brokers.
In terms of pure logic, this ignorance hypothesis seems unlikely to apply widely. There has been
industrywide concern about the high markups on custodial foreign-exchange trades for at least a decade.
Firms that manage execution costs, including Record Currency Management and Russell Investment
Group, have attempted to generate business by publicizing the situation at conferences, in practitioner
magazines, and in practitioner-oriented research journals. In normative terms, it is safe to say that funds
should not be ignorant about execution costs. Almost all the funds in our sample have NAV in excess of
$10 million and thus qualify as “sophisticated” according to US regulators (McGeehan, 2010). According
to the best practices for pension funds listed in the Myner’s Report (2001) of the U.K., trustees of all
pension funds “should have a full understanding of the transaction-related costs they incur.”
To evaluate the ignorance hypothesis we examine the funds’ choice between OTC and non-OTC
transactions using a probit regression on the original transaction request data:
OTCt = (Yt+t) . (5)
OTCt is a dummy coded 1 if a transaction is handled OTC and 0 otherwise; is a vector of coefficients;
Yt is a vector of independent variables, and t represents the residuals.
There are two key independent variables. The first is the (log) trade size relative to a given fund’s
average trade size. The financial benefits from lower spreads rise with transaction size whereas the
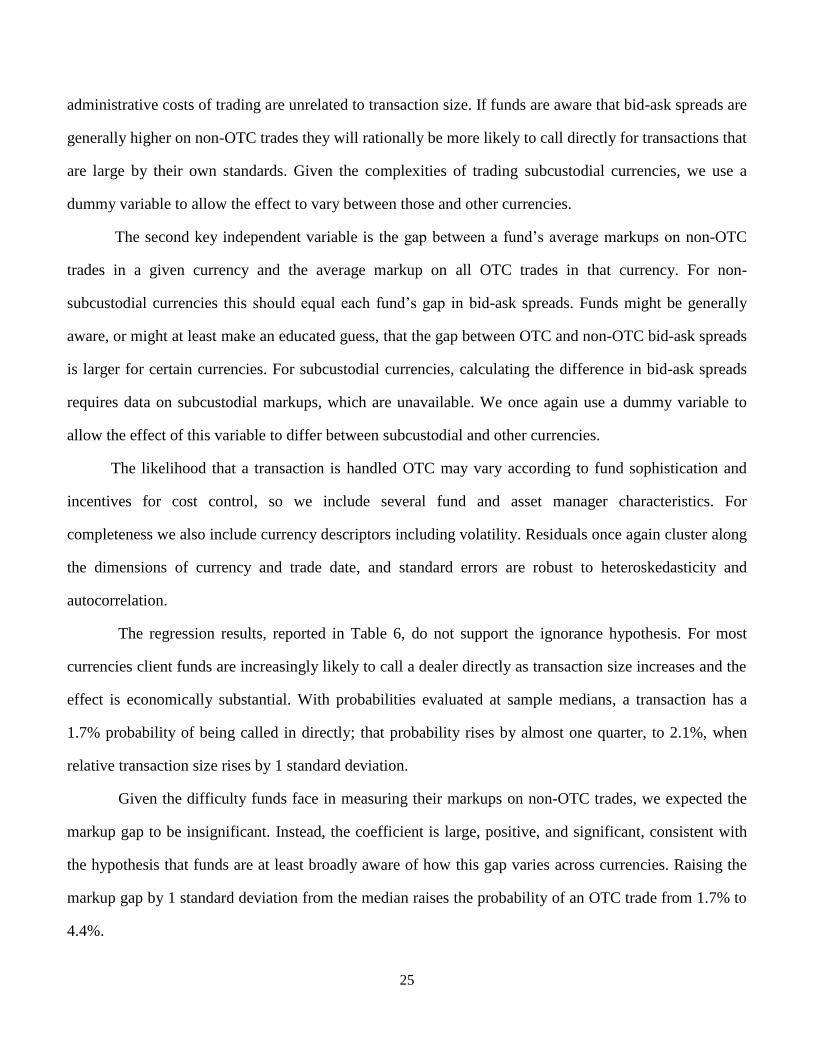
25
administrative costs of trading are unrelated to transaction size. If funds are aware that bid-ask spreads are
generally higher on non-OTC trades they will rationally be more likely to call directly for transactions that
are large by their own standards. Given the complexities of trading subcustodial currencies, we use a
dummy variable to allow the effect to vary between those and other currencies.
The second key independent variable is the gap between a fund’s average markups on non-OTC
trades in a given currency and the average markup on all OTC trades in that currency. For non-
subcustodial currencies this should equal each fund’s gap in bid-ask spreads. Funds might be generally
aware, or might at least make an educated guess, that the gap between OTC and non-OTC bid-ask spreads
is larger for certain currencies. For subcustodial currencies, calculating the difference in bid-ask spreads
requires data on subcustodial markups, which are unavailable. We once again use a dummy variable to
allow the effect of this variable to differ between subcustodial and other currencies.
The likelihood that a transaction is handled OTC may vary according to fund sophistication and
incentives for cost control, so we include several fund and asset manager characteristics. For
completeness we also include currency descriptors including volatility. Residuals once again cluster along
the dimensions of currency and trade date, and standard errors are robust to heteroskedasticity and
autocorrelation.
The regression results, reported in Table 6, do not support the ignorance hypothesis. For most
currencies client funds are increasingly likely to call a dealer directly as transaction size increases and the
effect is economically substantial. With probabilities evaluated at sample medians, a transaction has a
1.7% probability of being called in directly; that probability rises by almost one quarter, to 2.1%, when
relative transaction size rises by 1 standard deviation.
Given the difficulty funds face in measuring their markups on non-OTC trades, we expected the
markup gap to be insignificant. Instead, the coefficient is large, positive, and significant, consistent with
the hypothesis that funds are at least broadly aware of how this gap varies across currencies. Raising the
markup gap by 1 standard deviation from the median raises the probability of an OTC trade from 1.7% to
4.4%.

26
The probit estimates indicate that fund NAV and sponsorship by a larger asset manager are
associated with a higher probability of calling directly, consistent with our earlier inference that more
sophisticated funds tend to be larger and to be members of a larger asset management organization. Funds
that tend to trade larger amounts are also more likely to call directly, which seems rational since they have
greater incentives to control execution costs. Conditional on being sponsored by an asset manager, direct
calls are less likely for funds under larger fund umbrellas, a result that echoes our earlier finding that the
beneficial effect of sponsorship on non-OTC markups is mitigated by the size of the other funds under the
umbrella.
In the raw data, active equity funds are substantially more likely to call trades directly than other
fund types (Table 1, Column 1). This is supported by the estimated probability of an OTC trade at sample
medians, which is 1.7% for active equity funds, 0.07% for indexed equity funds, and 0.05% for active
equity funds. This cannot be explained by the influence of fund characteristics such as NAV and average
trade size, which point the other direction; the NAV and trade sizes of active equity funds tend to be
smaller than average. The positive marginal effect for the active equity dummy variable suggests that
active equity funds are inherently more aggressive about cost control. The coefficients also indicate that
indexed bond funds are relatively likely to call directly, but there are few trades in this category, so this
finding should be interpreted with caution. Funds that trade emerging market currencies are significantly
more likely than other funds to call directly and negotiate a price, other things equal.
One might wonder whether markups and transaction type are simultaneously determined, which
could undermine the reliability of these results. A quick review of trading logistics shows that
simultaneity is not possible. Suppose a client fund decides not to negotiate and sends the transaction
instruction directly to its fund accountant. Since it will only learn the actual transaction price some time
later, the markup – if it is ever actually identified – cannot influence the original decision between OTC
and non-OTC trading. Because the client funds do not know the markup at the time of a non-OTC trade,
the decision whether to trade OTC must be based on expected markups rather than realized markups. And

27
if a client calling to trade OTC is quoted a relatively unattractive price, it probably either knows or
suspects the price would be even less attractive in the non-OTC setting.
While institutional constraints prevent any simultaneous relation, there could certainly be a long-
run relation between markups and the choice of trading mode. A larger average non-OTC markup could
eventually increase the tendency of funds to rely on OTC transactions, and our evidence suggests just
such a response. This, in turn, might encourage custodial dealers to reduce non-OTC markups. If these
influences impart some bias to the coefficients, however, a straightforward analysis reveals that the bias
should be toward smaller estimated effects. We infer that our reported results are, if biased,
underestimates of the influence of the markup gap on the tendency of funds to choose OTC trading.
We again verify the robustness of our results by examining alternative methodologies and
splitting the sample. Our key qualitative findings, the positive and significant effect of trade size and the
markup gap on the likelihood of an OTC trade, are unchanged when absolute trade size replaces relative
trade size (Table 6, column 2) and when markup gaps vary across currencies but not across funds (Table
6, column 3). When we run our baseline regression on liquid and illiquid currencies separately, the
likelihood of a direct call once again rises with relative trade size and for liquid currencies that likelihood
also rises with the markup gap. For emerging markets the markup gap is insignificant, a finding that may
reflect the difficulty of measuring markups on such trades.
5.1. A closer look
The regressions reported in Table 6 could capture two distinct influences on the likelihood of a
direct trade. Many funds simply never call the custodial dealers directly; indeed, many may not be
authorized to call, since this is often negotiated as part of the “overall relationship” between client and
custodian. The regressions of Table 6 may simultaneously be reflecting the forces that influence the
decision to gain authorization and the decision to exploit that authorization for a given transaction.
To tease out these distinct influences we run two regressions. The first examines whether a give
client fund trades OTC at all (1 = direct-calling fund); the second examines the determinants of the OTC
transaction decision for funds that call directly at least once. The results are reported in Table 7.
28
Variables that previously appeared to point towards sophistication also seem to be associated with
the decision to gain authorization for direct trading. For example, the likelihood of at least one OTC trade
is higher for funds that trade more actively and for funds that are sponsored by a larger asset management
institution. That likelihood is also higher for active equity funds, indexed bond funds, and funds that trade
emerging market assets.
Funds that are authorized to call directly appear to be aware of the high markups on non-OTC
trades, since they are more likely to call directly for larger trades and for currencies where the additional
expense is greatest. In this restricted sample the measured sensitivity of this choice to these determinants
is far stronger than estimated for the whole sample, which seems logical. As before, the likelihood of an
OTC transaction rises with a fund’s average trade size, it is higher for active equity and indexed bond
funds, and it is higher for funds that trade emerging market currencies.
5.2. Shrouding by client funds
Since ignorance does not seem to explain the frequency with which funds choose to trade non-
OTC, it seems appropriate to suggest other reasons for the choice. We suggest that the choice may reflect
overall cost minimization at some funds and a second form of shrouding at others. To frame this
discussion it is important to note the difference between the markup and total trading expenses. OTC
trading on any scale involves substantial administrative expenses insofar as funds must hire traders,
provide them with appropriate technology, and ensure staff is available to handle back-office and
compliance responsibilities. For a fund of average size the cost of creating and maintaining an in-house
trading operation could easily exceed our earlier estimate of $190,000 in annual extra transaction costs for
non-OTC trading.
For funds that trade actively and for asset managers that centralize trade processing for multiple
funds, the higher in-house administrative expenses of OTC trading could be far smaller than the savings
on transaction expenses. In a world of perfect information we might expect investors in such funds to
enforce a shift to OTC trading by favoring funds with lower costs. But there is an asymmetry in the
investors’ perceptions of costs: total expense ratios and load fees are clearly delineated but trading

29
expenses are not. Given the difficulty asset managers face in identifying trading costs, it seems very
unlikely investors can estimate them even crudely. This opacity provides funds leeway to choose the
trading venue that most benefits the shareholders of their institution (as distinct from the owners of the
funds under management).
Returns to a fund’s shareholders generally rise with the number of investors, and investors could
be deterred by the higher in-house expenses associated with OTC trading. Published expense ratios would
rise, other things equal, or loads might rise. Investors are sensitive to both loads and expense ratios,
though apparently more sensitive to loads (Barber et al., 2005); and higher fees could be misinterpreted as
a signal of management inefficiency. Even investors sophisticated enough to consider how a fund’s return
history compares with its fees might not perceive the anticipated benefits from the shift in trading venue,
given randomness in returns. For these reasons, the higher tendency to rely on non-OTC trades among
apparently sophisticated investors could well be rational.
6. Conclusion
This paper examines foreign-exchange trades between dealers at global custody banks and their
client funds. The magnitude of the markups on such trades is the subject of a high-profile legal dispute.
Using the complete trading record of a midsized global custody bank during calendar year 2006, we
confirm that average markups on standard custodial trades are indeed quite high. We trace this to the
opacity of trading structure, and propose a shrouding model for pricing in which the dealer maximizes the
markup subject to the constraint that prices should not be far beyond the day’s extreme. Our econometric
evidence supports the key implications of this model: markups on standard custodial trades rise with
volatility even though such trades face zero inventory or adverse-selection risk; markups on such trades
are smaller for the currencies that are most administratively costly to trade; and markups on these trades
are lower for funds that appear to be more sophisticated.
The custodial bank’s client funds could choose to trade OTC with their custodian and pay far
smaller markups, but they do so only 3 percent of the time. We test and reject the hypothesis that funds
are ignorant of the relative markups by showing that funds are more likely to trade OTC for larger trades

30
and for currencies facing the biggest markup differential. We note that non-OTC trading might be optimal
for the investors of smaller funds, since OTC trading can involve high in-house administrative costs. Non-
OTC trading might also be optimal for the shareholders of larger funds, if not their investors. A fund that
shifts towards OTC trading will probably have to raise fees to cover the extra administrative expenses,
and investors might misinterpret the high fees as a sign of poor management. The shift is also risky
insofar as the lower markups might not be reflected in higher investor returns, given the randomness of
returns. For these reasons, fund shareholders might perceive a shift towards OTC trading as having
potentially high costs and risky benefits.
Future research on custody bank foreign-exchange trading could look more closely at the reasons
why funds choose not to trade OTC. It would also be useful to examine the extent to which markups have
changed in the aftermath of the lawsuits.
References
Bank for International Settlements, 2010.Triennial Central Bank Survey of Foreign Exchange and Derivatives
Market Activity in 2010. Basel, B.I.S., 2010.
Barber, B. M., Odean, T., Zheng, L., 2005. Out of Sight, Out of Mind: The Effect of Expenses on Mutual Fund
Flows. Journal of Business 78, 2095-2119.
Campbell, J. Y., 2006. Household Finance. Journal of Finance 56, 1553-1604.
Collie, R., 2004. It’s Time for More Choice in FX. Russell Investments. Accessed 10-1-2012.
https://www.russell.com/institutional/research_commentary/more_choice_in_fx.asp.
Complaint, People of the State of California versus State Street Corporation.
http://ag.ca.gov/cms_attachments/press/pdfs/n1823_october_20.pdf
Cullinan, C. P., Bline, D. M., 2005. An Analysis of Mutual Fund Custodial Fees. Journal of Applied Business
Research 21, 13-22.
Ding, L., 2009. Bid-Ask Spread and Order Size in the Foreign-exchange Market: An Empirical Investigation.
International Journal of Finance and Economics 14, 98105.
FXAll, 2006. Best Practice in Foreign-exchange Markets, 2nd
Ed. London: Euromoney Institutional Investor.
Gabaix, X., Laibson, D., 2006. Shrouded Attributes, Consumer Myopia, and Information Suppression in
Competitive Markets. Quarterly Journal of Economics 121, 505-540.
Galanek, J., 2010. The Search for Clarity: Exploring New Frontiers in FX TCA. Currency Investor Magazine.
www.currency-investor.net/transaction+cost+analysis.html.
Globalcustody.net, 2012. Assets Under Custody, Cross-border. Accessed Nov 21, 2012.
http://www.globalcustody.net/us/custody_assets_cross-border/

31
Glosten, L., Milgrom, P. R., 1985. Bid, Ask, and Transaction Prices in a Specialist Market with Heterogeneously
Informed Trades. Journal of Financial Economics 14, 71-100.
Green, R. C., 2007. Presidential Address: Issuers, Underwriter Syndicates, and Aftermarket Transparency. Journal
of Finance 62, 1529-1550.
Green, R. C., Hollifield, B., Schurhoff , N., 2007. Financial Intermediation and the Costs of Trading in an Opaque
Market. Review of Financial Studies 20, 275-314.
Institutional Investor Magazine, 2007. Global Custody Rankings.
http://www.iimagazinerankings.com/globalcustody/GlobalCustodyRanking.asp
Jones, C. M. Lipson, M. L., 2005. Are Retail Orders Different? Mimeo, Columbia University.
Joseph, P., 2005. Custody vs. 3rd
Party Foreign-exchange Execution. Global Money Management.
http://www.globalmoneymanagement.com/Article.aspx?ArticleID=1073746.
King, R. M., Osler, C. L., Rime, D., 2012. Foreign-exchange Market Structure, Players, and Evolution. In Jessica
James, Ian Marsh, and Lucio Sarno. (Eds.), Handbook of Exchange Rates. New York: John Wiley & Sons,
Inc., 3-44.
Koutmos, G., Martin, A., 2011. Currency Bid-Ask Spread Dynamics and the Asia Crisis: Evidence Across
Currency Regimes. Journal of International Money and Finance 30, 62-73.
Lane, P. R., Milesi-Ferretti, G. M., 2003. International Financial Integration. IMF Staff Papers 50, 82-113.
McGeehan, J., 2010. What Can Usain Bolt Teach Us About FX Transaction Costs Analysis?
www.fxtransparency.com/2010/04/what-can-usain-bolt-teach-us-about
Myner’s Report, 2001. http://www.icaew.com/en/library/subject-gateways/corporate-governance/codes-and-
reports/myners-report.
Naik, N. Y., Neuberger, A., Viswanathan, S., 1999. Trade Disclosure Regulation in Markets with Negotiated
Trades. Review of Financial Studies 12, 873-900.
Osler, C.L., Mende, A., Menkhoff, L., 2011. Price Discovery in Currency Markets. Journal of International Money
and Finance 30, 1696-1718.
Ramadorai, T., 2008. What Determines Transaction Costs in Foreign-exchange Markets? International Journal of
Finance and Economics 13, 14-25.
Schmeidel, H., Malkamaki, M., Tarkka, J., 2006. Economies of Scale and Technological Development in Securities
Depository and Settlement Systems. Journal of Banking and Finance 30, 1783-1806.
Stoll, H., 1978. The Supply of Dealer Services in Securities Markets. Journal of Finance 33, 1133-1151.
Taylor, A., Farstrup, A., 2006. Active Currency Management: Arguments, Considerations, and Performance for
Institutional Investors. Darien Connecticut: CRA RogersCasey International Equity Research.

32
Figure 1A
Share of direct trades by currency
Client funds of a global custody bank can call the bank’s currency dealers to trade OTC or simply instruct their
representative at the custodian to “take care of it.” A “transaction” is an individual trade request from a client fund.
A trade is a single quantity netted from several individual transaction requests that is priced as one deal. Sample
includes the complete foreign-exchange trade record for a midsized custody bank during calendar year 2006.
0%
5%
10%
15%
20%
25%
30%
35%
40%
45%
Percen
t o
f T
rad
es
in t
ha
t C
urr
en
cy
Share Direct Trades By Currency
By Transaction By Trade
Majors Other Developed Economies
Emerging MarketsNo Subcustodian
Emerging MarketsWith Subcustodian
Figure 1B
Custody-bank markups by currency
Figure shows the average proportionate markup for OTC and non-OTC transactions in the complete foreign-
exchange trade record for a midsized custody bank during calendar year 2006.

33
Figure 1C
Transaction and trade sizes by currency
We use transaction to refer to individual trade requests from client funds and trade to refer to the netted quantity
from several individual transaction requests that is priced as one deal. Sample includes the complete foreign-
exchange trade record for a midsized custody bank during calendar year 2006.

34
Figure 2A
Return volatility by currency
Average of daily proportionate high-low range during calendar year 2006. Data from Oanda.com.
Figure 2B
Interbank bid-ask spreads by currency
Figure shows the mean (log) difference between interbank ask prices provided by www.Oanda.com and interbank
mid-quotes provided by Global Insight. Daily data cover calendar year 2006.
0
10
20
30
40
50
Inte
rb
an
k S
pre
ad
s (B
asi
s P
oin
ts)
Mean Interbank Spreads
Majors Other Developed
EconomiesEmerging Markets
No Subcustodian
Emerging Markets
With Subcustodian

35
Figure 3A
Distribution of transaction request and execution times by currency
Transaction requests usually arrive in the morning. Trades, which often involve multiple individual transactions, are
typically executed in the afternoon. Sample includes the complete record of non-OTC trades for a midsized custody
bank during calendar year 2006.
Figure 3B
Delays between transaction request and execution times by currency. Asterix identifies currencies with exchange
controls.
* = Exchange Controls
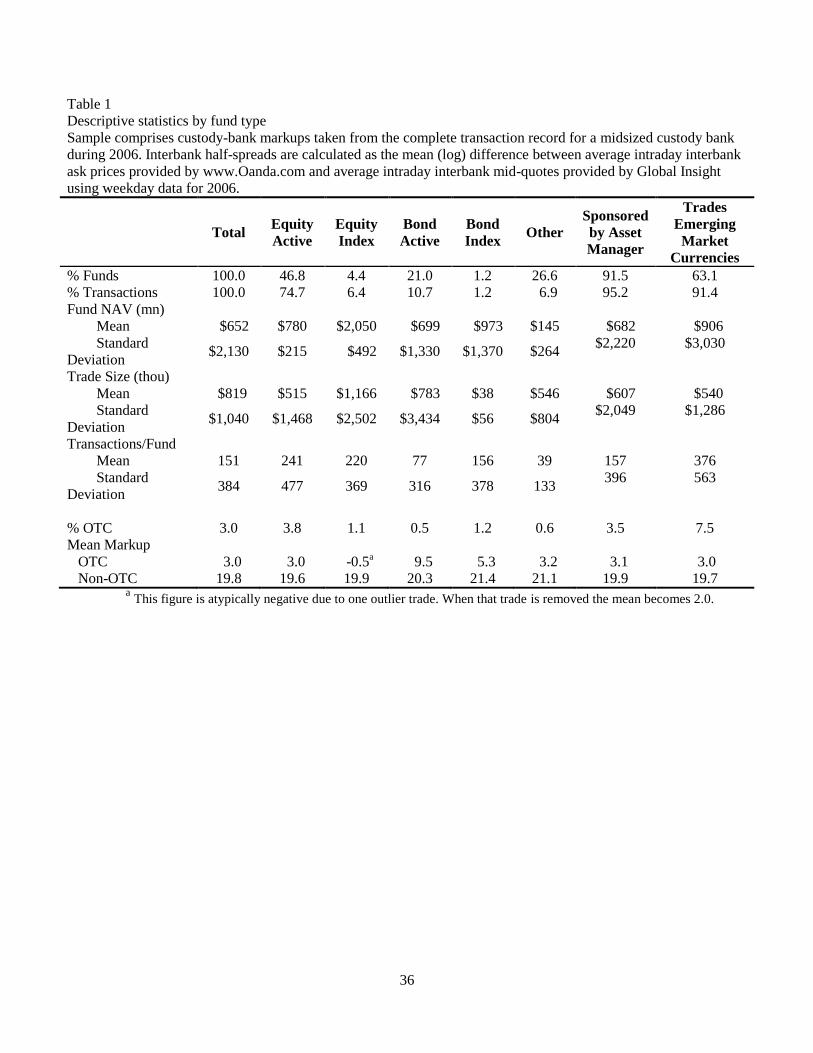
36
Table 1
Descriptive statistics by fund type
Sample comprises custody-bank markups taken from the complete transaction record for a midsized custody bank
during 2006. Interbank half-spreads are calculated as the mean (log) difference between average intraday interbank
ask prices provided by www.Oanda.com and average intraday interbank mid-quotes provided by Global Insight
using weekday data for 2006.
Total
Equity
Active
Equity
Index
Bond
Active
Bond
Index Other
Sponsored
by Asset
Manager
Trades
Emerging
Market
Currencies
% Funds 100.0 46.8 4.4 21.0 1.2 26.6 91.5 63.1
% Transactions 100.0 74.7 6.4 10.7 1.2 6.9 95.2 91.4
Fund NAV (mn)
Mean $652 $780 $2,050 $699 $973 $145 $682 $906
Standard
Deviation $2,130 $215 $492 $1,330 $1,370 $264
$2,220 $3,030
Trade Size (thou)
Mean $819 $515 $1,166 $783 $38 $546 $607 $540
Standard
Deviation $1,040 $1,468 $2,502 $3,434 $56 $804
$2,049 $1,286
Transactions/Fund
Mean 151 241 220 77 156 39 157 376
Standard
Deviation 384 477 369 316 378 133
396 563
% OTC 3.0 3.8 1.1 0.5 1.2 0.6 3.5 7.5
Mean Markup
OTC 3.0 3.0 -0.5a 9.5 5.3 3.2 3.1 3.0
Non-OTC 19.8 19.6 19.9 20.3 21.4 21.1 19.9 19.7 a
This figure is atypically negative due to one outlier trade. When that trade is removed the mean becomes 2.0.

37
Table 2
Descriptive statistics for regression variables
Sample comprises custody-bank markups taken from the complete transaction record for a midsized custody
bank during 2006. Interbank half-spreads are calculated as the mean (log) difference between average intraday
interbank ask prices provided by www.Oanda.com and average intraday interbank mid-quotes provided by
Global Insight using weekday data for 2006.
Mean Median Std. Dev. Skew Kurtosis
Dependent Variable
Markup on Trades (bps) 21.5 11.5 30.9 3.3 37.3
Independent Variables
Normal High-Low Range (bps) 0.91 0.80 0.50 2.1 10.0
Unusual High-Low Range 1.01 0.98 0.23 2.9 23.0
Interbank Half-Spread (bps) 8.66 5.71 9.64 1.5 4.6
Fund Trading Volume (mn)a
Log Fund Trading Volume
$119
14.3
$2
14.6
$870
3.7
15.0
-0.4
259.3
2.9
Fund NAV (mn)a
Log Fund NAV
$652
17.9
$130
18.7
$2,130
3.1
7.7
-1.3
73.2
4.7
Fund Average Trade Size (mn)a
Log Fund Average Trade Size
$0.6
11.3
$0.1
11.6
$2.0
2.4
9.6
-0.5
122.7
3.3
Sponsoring-Mgr. Extra NAV (mn)b
Log Sponsoring-Mgr. Extra NAV
$9,940
20.1
$3,820
22.1
$15,800
6.4
2.3
-2.5
7.4
8.2
Sponsoring-Mgr. Extra Trad. Vol. (mn)b
Log Sponsoring-Mgr. Extra Trad. Vol.
$2,600
17.6
$283
19.5
$6,580
6.2
3.0
-2.0
10.0
6.0
Clustered Trade Value (mn)
Log Trade Value
$1.5
12.1
$0.2
12.4
$6.7
2.4
29.5
-0.7
1,516.0
4.0
Transaction Value (mn)
Log Transaction Value
$0.8
10.9
$0.1
11.1
$10.4
2.5
42.2
-0.4
2,090.7
3.7
Relative Trade Size (mn) 0.99 0.35 2.52 24.9 1,283.2
Markup Gap on Transactions 16.3 16.0 13.2 1.0 7.6
a Fund characteristics presented for transactions.
b For funds that are not sponsored by a larger asset manager, extra NAV or extra trading volume are entered as “1”
so their log becomes 0.

38
Table 3
Determinants of custody-bank markups: Baseline regressions
Table shows the marginal effects from the following regression: Markupt = + Xt + XtDt + Zt + t ,where Xt
comprises variables relevant to information asymmetry, Dt comprises dummies for negotiated trades, and Zt
represents day-of-the-week dummies. Censored panel estimates are based on negotiated and non-negotiated
trades with non-negative markups. Standard errors are robust to simultaneous clustering by time and currency
and to heteroskedasticity and autocorrelation. Dependent variable measured in basis points. Sample comprises
trades in 25 currencies vis-à-vis USD the complete transaction record for a midsized custody bank during 2006.
Coefficients highlighted in bold are statistically significant; *, **, and *** indicate significance at the 10%, 5%,
and 1% levels, respectively.
Complete (censored) Streamlined (censored)
OTC Non-OTC
Interactions OTC
Non-OTC
Interactions
Constant -12.33 4.09 -9.42 -3.02
Average Volatility 7.12*** 12.65*** 7.10*** 12.68***
Unusual Volatility 7.20** 11.64*** 7.64** 11.23***
Interbank Half-Spread 0.10 -0.18 0.11 -0.20
Sub-Cust. Emerg. Mkts 6.13*** -5.72*** 5.97*** -17.50***
Free Emerg. Mkts -7.60*** -0.97 -8.67*** 0.21
Other Liquid Currencies 0.40 -0.63
Fund Trading Volume 0.26 -0.79
Fund NAV 0.09 -0.60 0.11 -0.76***
Sponsoring-Mgr. Trad. Vol. 0.74 -0.57
Sponsoring-Manager NAV -0.67 1.21 -0.03 0.65***
Sponsorship 1.14 -12.87** 1.70 -12.28***
Emerging-Mkts Fund 0.13 6.70*** 1.41** 4.46***
Equity -1.79 0.32 -0.63 -1.04
Equity-Index -3.72 4.52 -4.24* 5.26**
Bond -1.17 -1.40 0.42 -3.27
Bond-Index 4.33 -0.46 1.85 2.67
Trade Value -0.45* 1.34*** -0.52** 1.27***
Tuesday 0.05
Wednesday -0.87
Thursday 0.98
Friday 1.81** 1.76***
Pseudo or Actual R2 0.021 0.021
Number observations 22,374 22,374

39
Table 4
Determinants of custody-bank markups: Tests with alternative methodologies
Table shows the marginal effects from the following regression: Markupt = + Xt + XtDt + Ft + t, where Xt comprises variables that might
influence both OTC and non-OTC markups, Ft is a dummy for Fridays, and Dt comprises dummies for negotiated trades. After column 1, all
results are from censored panel regressions on trades with non-negative markup. Standard errors robust to simultaneous clustering by time and
currency, heteroskedasticity, and autocorrelation. Dependent variable measured in basis points. Sample comprises trades in 25 currencies vis-à-
vis USD from the complete transaction record for a midsized custody bank during 2006. Coefficients highlighted in bold are statistically
significant; *, **, and *** indicate significance at the 10%, 5%, and 1% levels.
OTC Non-OTC Alternative Fund Labels Alternative Volatility Incl. Asset-Mgr. Dummies
(OLS) (censored) OTC Non-OTC
Interactions OTC
Non-OTC
Interaction OTC
Non-OTC
Interaction
Constant -6.80 -12.47*** -0.84 -11.11*** 2.85 5.51 -16.82* -6.28
Average Volatility 6.58** 19.78*** 4.43** 15.58*** 0.93 12.81*** 6.28*** 12.90***
Unusual Volatility 7.63 18.88*** 2.58 16.3*** 1.15 1.82 7.87** 11.47***
Interbank Half-Spread 0.09 -0.09* 0.21 -0.30 0.27 -0.19 0.11 -0.18
Sub-Cust. Emerg. Mkts 5.07** -11.58*** 5.40** -16.85*** 2.70 -14.92*** 5.70*** -16.99***
Free Emerg. Mkts -7.72** -8.50*** -7.13** -1.26 -4.40** 1.98 -5.38* -3.27
Fund NAV 0.05 -0.65*** -0.22 -0.44** 0.05 -0.69*** 0.49 -0.52
Sponsoring-Manager
NAV 0.10 0.62*** 0.02 0.63*** -0.13 0.81*** -0.29 0.23
Sponsorship -1.44 -10.53*** 0.74 -11.27*** 4.11 -15.72*** 11.34 -6.59
Emerging Mkts Fund 1.45 5.88*** 0.82 5.17*** 0.88 5.50*** -0.70 2.72
Equity -0.87 -1.68** 0.61 -2.13* -0.83 -0.92 -4.26 6.14*
Equity-Index -7.06* 1.03 -4.11* 5.36** -2.68 3.50 -1.32 2.65
Bond 0.30 -2.88*** 0.19 -2.84 1.13 -3.99 -7.42 2.85
Bond-Index 0.76 4.57* 0.61 3.35 0.98 2.98 1.73 -1.45
Trade Value -0.49* 0.75*** -0.19 0.90*** -0.48* 1.17*** -0.39 1.03***
Friday -0.98* 1.97*** 1.88*** 1.64*** 1.69***
Pseudo R2 0.091 0.017 0.0219 0.0207 0.0244
Num. Observations 2,144 20,230 22,374 22,374 22,374

40
Table 5
Determinants of custody-bank markups: Subsample tests
Table shows the marginal effects from the following regression: Markupt = + Xt + XtDt + Ft + t, where Xt comprises variables that might
influence both OTC and non-OTC markups, Ft is a dummy for Fridays, and Dt comprises dummies for negotiated trades. All are censored panel
regressions on trades with non-negative markups. Standard errors robust to simultaneous clustering by time and currency, heteroskedasticity, and
autocorrelation. Dependent variable measured in basis points. Sample comprises trades in 25 currencies vis-à-vis USD from the complete
transaction record for a midsized custody bank during 2006. Coefficients highlighted in bold are statistically significant; *, **, and *** indicate
significance at the 10%, 5%, and 1% levels.
OTC-Trading Funds Liquid Currencies Illiquid Currencies
OTC Non-OTC
Interactions OTC
Non-OTC
Interactions OTC
Non-OTC
Interactions
Constant -9.11 -6.70 -14.39 -3.51 -9.24 -33.60
Average Volatility 7.06*** 11.68*** 9.27 24.59*** 1.50 15.04***
Unusual Volatility 7.63** 13.70*** 7.12* 10.71** 1.58 19.42
Interbank Half-Spread 0.10 -0.14 0.08 -0.27 -0.20 0.26
Sub-Cust. Emerg. Mkts 5.95*** -16.58*** na na 13.40** -20.41***
Free Emerg. Mkts -8.62*** 2.20 na na na na
Fund NAV 0.10 -0.99*** 0.43 -1.20*** -0.70 0.69
Sponsoring-Manager NAV -0.04 0.90*** -0.15 1.08*** 1.20* -1.02
Sponsorship 1.75** -23.26*** 4.01 -21.34*** -9.35 13.59
EM Fund 1.40** 15.41*** 0.89 3.90*** na na
Equity -0.73 -5.54 -0.91 -1.31 5.51 -1.53
Equity-Index -4.24* 0.03 -0.54 3.12 -10.04** 5.42
Bond 0.30 -5.74 -0.96 -5.43** 6.62 na
Bond-Index 1.80 -2.03 3.42 2.71 na na
Trade Value -0.51** 1.62*** -0.68** 1.31*** 0.33 0.89
Friday 1.30* 3.27*** -0.29
Pseudo R2 0.025 0.015 0.020
Number Obs. 12,989 14,870 5,620

41
Table 6
Which transactions are handled OTC?
Table shows the results from a probit regression examining the decision whether to handle a given
transaction OTC vs. non-OTC (1= OTC). Standard errors robust to simultaneous clustering by time and
currency, heteroskedasticity, and autocorrelation. Sample comprises trades in 25 currencies vis-à-vis USD
from the complete transaction record of a midsized custody bank during 2006. All marginal effects E+2.
*, **, and *** indicate significance at the 10%, 5%, and 1% levels.
Independent Variable:
Trade Type, OTC = 1
Baseline Alternative
Trade Size
Alternative
Markup
Liquid
Currencies
Illiquid
Currencies
Relative Trade Size 0.16*** 0.19*** 0.18*** 0.31***
Interact with Restricted -0.05** -0.79** na -0.54**
Baseline Markup Gap 0.14*** 0.29*** 0.20*** -0.01
Interact with Restricted -0.20* -0.19 na -0.03
Absolute Trade Size 0.69***
Interact with Restricted -0.58***
Alternative Markup Gap 0.11***
Interact with Restricted 0.01
Fund Descriptors
Fund Avg. Trade Size 3.01*** 2.60*** 4.39*** 3.48*** 1.28***
Fund NAV 0.28*** 0.29*** 0.36*** 0.29*** 0.16**
Fund Trading Vol. -1.62*** -1.75*** -2.65*** -1.69*** -0.54***
Sponsorship 5.45*** 5.84*** 4.81*** 7.15*** 1.78***
Sponsoring-Mgr. NAV -0.11* -0.10* -0.06 -0.15*** 0.02
Sponsoring-Mgr. Vol. -0.21*** -0.23*** -0.20*** -0.15** -0.16**
EM Fund 7.09*** 7.45*** 9.89*** 7.71*** na
Equity-Active 3.07*** 3.21*** 3.55*** 3.24*** 13.67***
Equity-Index -1.92*** -1.42** -1.50** -3.10*** 11.92***
Bond-Active -2.30** -2.46** -2.66*** -6.46*** 13.23***
Bond Index 5.77*** 6.63*** 8.02*** 7.06*** 14.02***
Currency Descriptors
Interbank Half-Spread 0.06** 0.06* -0.00 0.09 -0.02
Average Volatility 2.93*** -3.13*** -2.26** -9.23*** 0.11
Unusual Volatility -1.16** -1.03* -0.86 -0.56 -2.94***
Sub-Cust. Emerg. Mkts 0.21 6.38*** -0.40 na 0.72***
Free Emerg. Mkts -0.34*** -2.86*** -1.13 na na
Other Liquid Cntries -0.34 0.11 -0.29 -0.05 na
Pseudo-R2 0.300 0.325 0.279 0.342 0.177

42
Table 7
A closer look at which transactions are handled OTC
Table shows the results from two probit regressions. The first examines whether a given fund ever trades
OTC (1=At least one OTC transaction). The second examines, for those currencies that do trade OTC at
least once, the decision whether to handle a given transaction OTC vs. non-OTC (1= OTC). Standard
errors robust to simultaneous clustering by time, by currency, and by family as well as heteroskedasticity
and autocorrelation. Sample comprises trades in 25 currencies vis-à-vis USD from the complete
transaction record of a midsized custody bank during 2006. All marginal effects E+2. *, **, and ***
indicate significance at the 10%, 5%, and 1% levels.
Independent Variable
Trade OTC Ever?
(Yes = 1)
OTC for This Transaction?
(Yes = 1)
Relative Trade Size 0.47***
Interact with Restricted -0.01**
Baseline Markup Gap 0.23***
Interact with Restricted -0.03*
Fund Descriptors
Fund Avg. Trade Size 1.47 5.35***
Fund NAV 0.58 -0.24**
Fund Trading Vol. 2.10** -3.20***
Sponsorship 29.31** 0.66
Sponsoring-Mgr. NAV -1.36 0.54***
Sponsoring-Mgr. Vol. -0.24 -0.72**
EM Fund 17.01*** 8.75***
Equity-Active 12.33** 1.56*
Equity-Index 7.86 -5.79***
Bond-Active 2.88 -0.30
Bond Index 22.13** 2.41*
Currency Descriptors
Interbank Half-Spread -0.05
Average Volatility -5.40***
Unusual Volatility -2.88***
Sub-Cust. Emerg Mkts 0.42
Free Emerging Mkts -0.38**
Other Liquid Cntries -0.03
Pseudo-R2 0.379 0.335


![untitled 2 [people.brandeis.edu]people.brandeis.edu/~sekuler/papers/SekulerNature1997.pdf · Presentation ofsound Figure I Percentage of reports of stimulus bouncing. In each trial,](https://static.fdocuments.us/doc/165x107/5f4e7aa9b6f9633f2c3bd2e4/untitled-2-sekulerpaperssekulernature1997pdf-presentation-ofsound-figure.jpg)