ASVCP QA and Lab Standards Committee Quality Control ... · PDF fileASVCP QA and Lab Standards...
43
ASVCP QA and Lab Standards Committee Quality Control Guidelines: SCOPE Historical Perspective The ASVCP QA and Laboratory Standards Committee was formed in 1996 in response to concerns by ASVCP members about quality assurance and quality control in laboratories doing veterinary testing, a topic of ongoing importance that had been partially addressed by other committees in the past. The Committee was charged: "To encourage and promote the establishment of standards for the performance of laboratory procedures" on veterinary samples. Quality assurance and standards for veterinary laboratories is a broad topic and a large assignment. As an organization of clinical pathologists and individuals interested in clinical pathology we are in a unique position to provide leadership and direction in clinical laboratory diagnostics in veterinary medicine. Although government regulation controls many aspects of human clinical laboratories, the lack of such regulation for veterinary laboratories requires that we demonstrate a commitment to self-monitoring and regulation from within the discipline. By providing leadership in this area, we hope to raise the quality of veterinary laboratory medicine, and thereby improve the health of veterinary patients. These guidelines are not meant to be all-inclusive. This is a dynamic document that will undergo additional revisions and modifications based on periodic reviews conducted over time. There may be additional inclusions as topics are addressed on an ongoing basis. The topics covered, to date, include areas of perceived need, as well as areas which reflect the interests and expertise of various clinical pathology professionals participating as members of this Committee. To facilitate revisions to specific sections of the guideline and additions of new topics without revising the entire document, the guidelines were partitioned into subsections (eg, hematology, cytology, urinalysis, et al) within the preanalytic and analytic sections. These guidelines have undergone extensive review and comments by members of the Committee and the membership of ASVCP in order to provide information reflecting the membership of this society. The ASVCP is a nonprofit scientific organization dedicated to the promotion of scientific advancement, education, and standards in veterinary laboratory medicine. Purpose These guidelines provide minimum guidelines for quality assurance and quality control for veterinary laboratory testing. We use the Clinical Laboratory Improvement Amendments definitions for these terms. A guideline is a document developed through the consensus process describing criteria for a general operating practice procedure, or material for voluntary use. A guideline may be used as written or modified by the user to fit specific needs. This is slightly different and more flexible than a standard. A standard is a document developed through the consensus process that clearly identifies specific, essential requirements for material, methods, or practices for use in an unmodified form. A standard may, in addition, contain discretionary elements, which are clearly identified It is hoped that these guidelines will provide a basis for laboratories to assess their current practices, determine areas for improvement, and/or to guide continuing improvement or continuing professional development/education efforts.
Transcript of ASVCP QA and Lab Standards Committee Quality Control ... · PDF fileASVCP QA and Lab Standards...
ASVCP QA and Lab Standards Committee Quality Control Guidelines: SCOPE
Historical Perspective
The ASVCP QA and Laboratory Standards Committee was formed in 1996 in response to concerns by ASVCP members about quality assurance and quality control in laboratories doing veterinary testing, a topic of ongoing importance that had been partially addressed by other committees in the past.
The Committee was charged: "To encourage and promote the establishment of standards for the performance of laboratory procedures" on veterinary samples.
Quality assurance and standards for veterinary laboratories is a broad topic and a large assignment. As an organization of clinical pathologists and individuals interested in clinical pathology we are in a unique position to provide leadership and direction in clinical laboratory diagnostics in veterinary medicine. Although government regulation controls many aspects of human clinical laboratories, the lack of such regulation for veterinary laboratories requires that we demonstrate a commitment to self-monitoring and regulation from within the discipline. By providing leadership in this area, we hope to raise the quality of veterinary laboratory medicine, and thereby improve the health of veterinary patients.
These guidelines are not meant to be all-inclusive. This is a dynamic document that will undergo additional revisions and modifications based on periodic reviews conducted over time. There may be additional inclusions as topics are addressed on an ongoing basis. The topics covered, to date, include areas of perceived need, as well as areas which reflect the interests and expertise of various clinical pathology professionals participating as members of this Committee. To facilitate revisions to specific sections of the guideline and additions of new topics without revising the entire document, the guidelines were partitioned into subsections (eg, hematology, cytology, urinalysis, et al) within the preanalytic and analytic sections.
These guidelines have undergone extensive review and comments by members of the Committee and the membership of ASVCP in order to provide information reflecting the membership of this society. The ASVCP is a nonprofit scientific organization dedicated to the promotion of scientific advancement, education, and standards in veterinary laboratory medicine.
Purpose
These guidelines provide minimum guidelines for quality assurance and quality control for veterinary laboratory testing. We use the Clinical Laboratory Improvement Amendments definitions for these terms. A guideline is a document developed through the consensus process describing criteria for a general operating practice procedure, or material for voluntary use. A guideline may be used as written or modified by the user to fit specific needs. This is slightly different and more flexible than a standard. A standard is a document developed through the consensus process that clearly identifies specific, essential requirements for material, methods, or practices for use in an unmodified form. A standard may, in addition, contain discretionary elements, which are clearly identified
It is hoped that these guidelines will provide a basis for laboratories to assess their current practices, determine areas for improvement, and/or to guide continuing improvement or continuing professional development/education efforts.
Intended Audience
These standards are applicable to any laboratories doing veterinary testing (including in-clinic laboratories), but specific recommendations for statistical QC as described in this document are considered suitable for university, reference or commercial laboratories. This document is not meant to address pharmaceutical/toxicologic laboratory activities since these are regulated by Good Laboratory Practice (GLP), but does contain areas of overlap with these regulations.
Until recently, in-clinic instrument performance capability has not been well characterized to allow specific recommendations for QA and QC for in-practice laboratories. These are currently being addressed by a Subcommittee within this Committee and should be forthcoming by end of 2010.
2006 Revision: Finalized ACVP meeting, Monterey, CA, December 2009 1
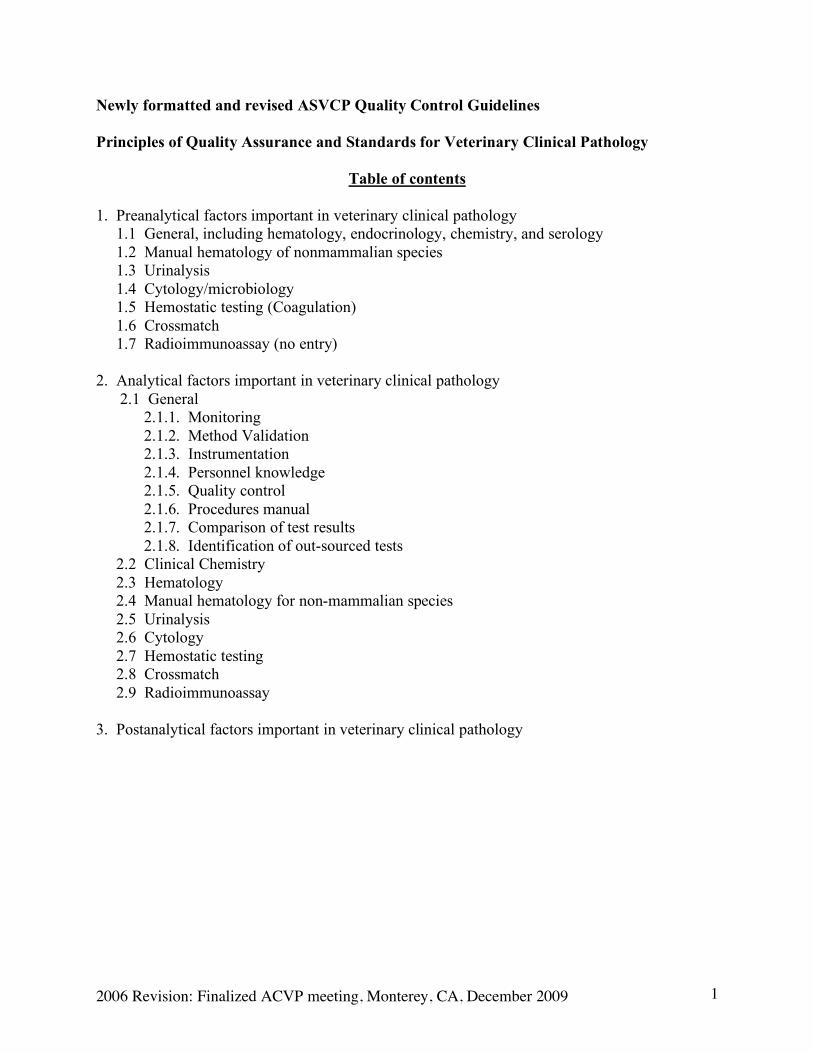
Newly formatted and revised ASVCP Quality Control Guidelines Principles of Quality Assurance and Standards for Veterinary Clinical Pathology
Table of contents 1. Preanalytical factors important in veterinary clinical pathology 1.1 General, including hematology, endocrinology, chemistry, and serology 1.2 Manual hematology of nonmammalian species 1.3 Urinalysis 1.4 Cytology/microbiology 1.5 Hemostatic testing (Coagulation) 1.6 Crossmatch 1.7 Radioimmunoassay (no entry) 2. Analytical factors important in veterinary clinical pathology 2.1 General 2.1.1. Monitoring
2.1.2. Method Validation 2.1.3. Instrumentation 2.1.4. Personnel knowledge 2.1.5. Quality control 2.1.6. Procedures manual 2.1.7. Comparison of test results 2.1.8. Identification of out-sourced tests
2.2 Clinical Chemistry 2.3 Hematology 2.4 Manual hematology for non-mammalian species 2.5 Urinalysis 2.6 Cytology 2.7 Hemostatic testing 2.8 Crossmatch 2.9 Radioimmunoassay 3. Postanalytical factors important in veterinary clinical pathology
2006 Revision: Finalized ACVP meeting, Monterey, CA, December 2009 2
1. Preanalytical Factors Important in Veterinary Clinical Pathology
1.1. General, including Hematology, Endocrinology, Chemistry and Serology
1.1.1. Specimen Collection, Handling and Transport to the Laboratory. Information concerning sample requirements, proper collection, handling, and delivery or shipping procedures for any assay performed in the laboratory should be available to clients electronically, in written materials (such as a laboratory services manual, special information sheets, journal or newsletter articles), or by personal telephone conversation. Samples should be collected according to standard practices. Instrument manufacturer’s package inserts have detailed descriptions of appropriate samples, including collection tubes and handling conditions. The specifications for sample submission should be provided to the client by each laboratory. The specimens should be handled carefully and transported to the laboratory in a timely manner under conditions appropriate for the type of sample and its stability. Type of specimen (e.g., whole blood, serum, plasma, urine) should be clearly stated on the specimen label. Deviation from recommended protocols can adversely affect test results. Contact manufacturers for specific details. a. Hematology
i. Blood films made in the clinic should not be refrigerated and should be protected from condensation and freezing during transport to the laboratory.
ii. Anticoagulated samples for hematology that are found to have macroclots that can be found upon visual inspection will produce variably erroneous results. The clinic should be contacted either in writing or by phone and informed that the sample will produce erroneous results. Because the varying degree of inaccuracy can’t be predicted, clotted samples are unsuitable for analysis and it is not recommended that these samples be analyzed. If samples of questionable or substandard quality are analyzed, any procedures and possible inaccuracies should be documented in writing by the laboratory. Additionally, any possibly inaccurate results should have easily seen comments on the report to the clinician that clearly state those values may be inaccurate and misleading.
1.1.2. Specimen Identification. Specimens should be identified with pertinent information
as determined by the laboratory, such as owner, species, animal signalment, name of clinic or doctor, address, telephone and fax numbers, e-mail address, location from which the specimen was collected, etc. Unique and matching identifiers should be located on both the submission form and container.
1.1.3. Test Identification. The requested test(s) should be clearly marked or stated on the
submission form. 1.1.4. Specimen Accessioning. The specimen information, identification and requested
tests should be correctly entered into the laboratory information system (LIS). Information entered into the LIS may be used to track the location and appropriate
2006 Revision: Finalized ACVP meeting, Monterey, CA, December 2009 3
storage of the sample, e.g., immunology vs. hematology section or frozen vs. refrigerated. Specimen aliquotting and delivery to the appropriate section within the laboratory or between several departments should be coordinated. Any problems with sample quality, including but not limited to hemolysis, lipemia, gelling of the sample, or other analytically significant problems should be recorded and reported to the clients and laboratory staff. If the degree of inaccuracy associated with sample quality is likely to be significant, testing should not be performed on the sample in question and/or results should not be reported. Problems with the reported or unreported results should be communicated to the client and, if possible, a new sample obtained.
1.1.5. Client Communication and Education. Communication between laboratory
personnel and clients (internal and external) should be timely and courteous regarding pre-analytical factors influencing laboratory test results (e.g., incomplete submission forms, inappropriate sample or sample handling, or poor sample quality). Clients should be informed of the expected time for receipt of preliminary and final reports. Similarly, feedback from clients to laboratory should be encouraged. All verbal or written complaints/feedback/suggestions should be documented and forwarded to the appropriate level of management. Management meetings, etc. must be documented and organizational reviews conducted to ensure timely and appropriate follow up on corrective actions.
1.1.6. Personnel Safety. Conditions should be comfortable and appropriate for computer
entry, data transcription, handling of specimens, specimen disposal, and all other tasks. Special consideration should be given for repetitive work. Personal protective equipment (PPE) should be appropriate for handling specimens and operating equipment in all areas of the clinical laboratory. Safety procedures for the disposal of all samples, waste, and other supplies should be appropriate for the type of material. Personnel should receive safety and biohazard training regarding exposure to potentially hazardous chemicals or infectious pathogens present in biological materials. Documentation of environmental, health and safety training should be available and readily accessible for each staff member. Training should include basic prevention of bacterial contamination as well as information on zoonotic diseases. All training should be documented.
1.1.7. Laboratory Environment. The laboratory environment should meet standard
requirements necessary for safe, rapid, efficient and effective performance. The workspace should be well-lit and organized in order to promote efficiency and safety. Equipment and instrumentation should be in working order. Up-to-date procedure protocols should be easily accessible for reference when needed. Laboratory facilities and operation should be in compliance with appropriate government agencies.
1.1.8. Personnel Requirements. Personnel should meet training requirements as indicated
for specific areas of the laboratory. Training, continuing education, and recertification for specialized tasks should be regularly scheduled and documented. The laboratory should be staffed appropriately to meet the workload.
2006 Revision: Finalized ACVP meeting, Monterey, CA, December 2009 4
1.1.9. Laboratory Information Systems (LIS). LIS are intended to improve work-flow
and efficiency of the laboratory. Prior to implementation, a LIS should be thoroughly evaluated, and the ability to maintain accurate records verified. Inefficient and unwieldy LIS should be updated or enhanced based on the needs of the laboratory. LIS should meet all governing legal regulations for medical record archives. Problems with sample accessioning or archival storage should be corrected immediately.
1.1.10. Identification of out-sourced tests (“send-outs”): Clients should be informed of
those tests that are referred to other laboratories.
1.2. Manual Hematology of Nonmammalian Species
1.2.1. Specimen Collection, Handling and Transport to the Laboratory. Acceptable transport times for avian blood are shorter than that for mammalian and reptilian blood. Controlled studies have shown that refrigerated avian blood deteriorates within twelve hours regardless of anticoagulant (Harr et al, 2005). Acceptable transport time for avian blood smears on glass slides is similar to reptilian and mammalian blood smears. Evidence of leukocyte/thrombocyte aggregation in the hemacytometer should be reported to indicate erroneous total WBC and differential cell counts. Hematology samples for shark species should be processed within 5 hours (Arnold, 2005). EDTA (7.5% or 1-2 mg/mL of blood) is acceptable for most animal species, but is not suitable for all. Blood from stingrays, some bony fishes and some avian species reacts atypically in commercially prepared EDTA tubes. Elasmobranch blood (shark, skates and rays) should be placed in a dry anticoagulant due to the high plasma osmolality values (~ 1000mmol/kg). Liquid anticoagulants may be used if adjusted for osmolality.
1.2.2. Personnel Requirements. Laboratory personnel should have specific training in
specimen handling and sample preparation for exotic species. Training should include basic prevention of bacterial contamination as well as information on zoonotic diseases including Chlamydophila, West Nile Virus, Salmonella, Avian Influenza and Giardia. Documentation of training, continuing education and periodic proficiency assessment should be at the discretion of the laboratory director.
1.3. Urinalysis
1.3.1. Specimen Collection, Handling and Transport to the Laboratory. Identification of the urine collection method is important when interpreting the presence and concentration of potential contaminants including blood and bacteria. The submitter should clearly state the method by which the urine was obtained, such as free flow (midstream, early, or late), catheterization, cystocentesis, or from the floor or metabolism cage. Clear specimen containers can be used to facilitate gross examination if urine will be examined within 30 minutes. However, if urinalysis will be delayed, urine should be protected from exposure to UV light to prevent
2006 Revision: Finalized ACVP meeting, Monterey, CA, December 2009 5
degradation of urine constituents (eg, bilirubin). Lids should be secure to prevent evaporation and/or volatilization of urine constituents (eg, ketones).
1.3.2. Urine Storage. Optimally, urine should be examined within 30 minutes of collection.
If immediate examination is not possible, urine should be stored at refrigerated temperatures to minimize changes in urine physical and chemical make up and to inhibit bacterial growth. Strict recommendations for duration of refrigerated storage cannot be made, because this depends on specific urine components. (Rabinovitch, 2009) Storage for a maximum of 24 hours in the refrigerator is generally recommended (Osborne cautiously suggests 6-8 hours), but urine may be stable for shorter or longer periods depending on its initial make up. Chemical constituents that are particularly unstable include bilirubin and glucose, and pH if bacteria are present. (Rabinovitch, 2009; Osborne, 1999) Stability of formed elements depends on urine pH and concentration. Crystals may form in vitro during storage at either room temperature or under refrigeration. (Albasan, 2003; Sturgess, 2001) If crystalluria is a clinical concern, freshly collected urine should be examined immediately. Refrigerated samples should be brought to room temperature prior to analysis. Because urinalysis results may be affected by storage duration and temperature, the time the urine was collected, the time it arrived in the laboratory, and method of storage should be recorded. Alternative methods of preservation are available for stabilization of urine chemistry, inhibition of bacterial growth, and preservation of formed elements. Manufacturer’s claims should be followed regarding intended use of particular preservative and duration of storage.
1.3.3. Microbiological Culture. Quantitative microbiologic culture techniques are
recommended for determining presence of significant bacteriuria. Urine specimens collected by cystocentesis are preferred, but specimens properly collected by catheterization and free-catch are acceptable if quantitative culturing methods are employed. Urine should be submitted for the microbiological culture prior to urinalysis procedure to avoid contamination of the specimen. Alternatively, a sterile aliquot can be set aside for possible microbiological culture subsequent to urinalysis procedure. Refrigerated urine samples are acceptable for microbiological culture for at least 6 hours and often up to 24 hours. Refrigeration of urine specimens for 24 hours may result in false negative culture results. (Padilla, 1981) If bacteriostatic transport media is used, urine samples do not need to be refrigerated.
1.4. Cytology/Microbiology 1.4.1. Specimen Collection, Handling and Transport to the Laboratory. Information
regarding cytologic/microbiologic submissions should be provided to the client in a laboratory service manual, special information sheet, journal or newsletter article, written material, or verbal instructions. Instructions should address issues such as collection techniques, appropriate containers (with or without anticoagulants), smear preparation and specimen fixation, if pertinent. Appropriate collection of cytologic/microbiologic specimens will increase the likelihood of a meaningful interpretation.
2006 Revision: Finalized ACVP meeting, Monterey, CA, December 2009 6
1.4.2. Unfixed cytologic specimens and air-dried, unstained cytology smears should be
protected from exposure to formalin and formalin fumes, which interfere with subsequent staining, by shipping in tightly sealed containers or shipping separately from formalin-fixed biopsy specimens.
1.4.3. Identification of the site, method and time of collection is of great importance in
determining optimal preparation and in interpretation. The veterinary cytologist or cytopathologist should be knowledgeable about the effects of different collection methods, delayed preparation and improper handling of cytology specimens, especially fluid samples, with regard to expected cytologic features and interpretation. For fluid samples, one or more direct smears should be made from the fluid sample before any concentration or fixation procedures are performed. The smear(s) can be stained or left unstained and should be submitted with the fluid sample. This will allow estimation of the cell count and proportions of various cell types. This may provide valuable information that influences the cytologic interpretation and provides additional QC by allowing the cytologist/cytopathologist to ensure that the cell counts reasonably match estimates made from these smear(s). This also avoids the situation in which extreme cell density of concentrated samples prevents optimal cytologic evaluation.
1.5. Hemostatic Testing (Coagulation) 1.5.1. Specimen Collection, Handling and Transport to the Laboratory. Compliance
with sample collection and storage requirements for coagulation is mandatory for accurate test results. Whole blood should be collected in trisodium citrate anticoagulant in a 9:1 ratio and thoroughly mixed. This typically is accomplished by filling to the indicated mark on the appropriate blood tube. Specimens that do not conform to this dilution should be rejected. (Adcock, 1998) Citrate volume may need to be adjusted for samples from very anemic and polycythemic animals.(Stockham and Scott, 2008, p. 277) For tests requiring plasma, the citrated tube is centrifuged and chilled to 2-8ºC. Plasma should be separated from blood cells and transferred to a plastic tube (not glass).(Fiebig, 2005, Kratz, 2006) Specimen stability at room or refrigerated temperature (2-8ºC) is 4 hours and 24 hours for APTT and PT, respectively. If testing is not performed within these time intervals, samples should be frozen at -20 ºC. (Adcock, 1998) Fresh citrated whole blood used for platelet function or other coagulation analyses should be ideally kept for <1 hour. (Giger, per communication). If samples are mailed into a laboratory for testing versus direct transport, plasma should be placed in a plastic tube then frozen, then be packed on ice and shipped to arrive frozen within 24 hours.
1.5.2. Please see laboratory information bulletin 1 1.5.1.A Additional detail was added
here as >90% of error in hemostatic assay results may be attributed to preanalytical factors of transport and handling.(Lippi, 2006; Valenstein, 2009; Bonini, 2002; Dale, 2002)
2006 Revision: Finalized ACVP meeting, Monterey, CA, December 2009 7
1.6. Crossmatch 1.6.1. Specimen Collection, Handling and Transport to the Laboratory. Sera or plasma
may be used for crossmatching; however, the animal species and particular procedure may influence this selection. Fresh sera could serve as a source of complement for use in detection of hemolysis in dogs and cats, but this is not typically performed. Samples for major crossmatch include serum (non-additive tube) or plasma (EDTA or citrated) from recipient and anti-coagulated (EDTA, ACD, or citrated) whole blood or packed red blood cell sample from the donor(s). Samples for minor crossmatch include anti-coagulated whole blood from recipient and sera or plasma from donor(s). Patient and donor samples should be less than 24 hours old when possible; donor samples may be as old as the unit of blood to be crossmatched. If not used immediately, samples should be stored at 4ºC. For some procedures, whole blood is used while others require a PBS-washed red cell suspension. General recommendations for sample collection, handling and transportation of hematology samples should be followed.
1.6.2. Specimen Identification. Specimens from the patient and donor(s) should be clearly labeled as patient and donor(s) with date and time and for identification of the patient and each donor sample submitted. Specific forms for submission should be considered to assure accurate assignment of patients and donors.
1.7. Radioimmunoassay (section left intentionally blank at this time)
Please see Hegstad-Davies, 2006 for a review of some of the literature.
2006 Revision: Finalized ACVP meeting, Monterey, CA, December 2009 8
2. Analytical factors important in veterinary clinical pathology
2.1. General
2.1.1. Monitoring a. Internal monitoring. Internal monitoring of all equipment with regards to electronic
safety, calibration, equipment maintenance and equipment performance is recommended. An Instrument Performance Log is recommended for each instrument, including information about any problems encountered and their investigation and resolution. Use of quality control materials for the purpose of monitoring internal performance is covered in detail in section 2.1.5. Quality control. Accumulated quality control results should be systematically reviewed on a regular schedule through use of Levey-Jennings plots, and appropriate actions taken when quality controls results exceed the limits or demonstrate undesirable trends.(Westgard, 2006)
b. External monitoring (Proficiency testing). External monitoring should include
participation in an external proficiency program that is specific to veterinary diagnostic laboratories. A more complete description of proficiency testing can be found in Bellamy and Olexson. (Bellamy, 2000)
i. All participating laboratories should analyze the same materials. ii. Results should be tabulated regularly (monthly, quarterly or annually) and
distributed to participants with statistical summaries expressing the closeness of individual laboratory results to the group mean.
iii. Means should be calculated and analyzed based on identification of the method (same methods compared).
iv. Each laboratory should carefully assess the validity of their reported performance. A marked deviation from the group mean should prompt an inquiry.
2.1.2. Method Validation. Prior to adopting a new test procedure or bringing a new
instrument on-line, method or instrument validation should be performed to ensure the procedure performs according to the laboratory’s standards and manufacturer’s claims. Method or instrument validation studies should assess linearity, precision, accuracy, analytical range, lower limit of detection (LLD)/biological limit of detection (BLD)/functional sensitivity (FS) of the method and examine the effects of interfering substances. Reference intervals and quality control procedures for the new method should be determined before patient testing is initiated. If there is limited data available for reference interval determination, this should be explained in an addendum to the test and the basis for the interpretation explained. (Linnet, 2006) Analytical quality requirements, such as total allowable error (TEa) or clinical decision limits should be established for each test prior to initiating method or instrument validation studies.(Westgard, 1974) These requirements serve as a benchmark for test performance. The total error inherent in the new method or
2006 Revision: Finalized ACVP meeting, Monterey, CA, December 2009 9
instrument, as determined during validation studies, must fall within these requirements or the new method should be rejected. (Westgard, 2006b)
Method or instrument validation procedures are listed in the order in which they are performed. Numerous commercial software programs are available to facilitate the statistical analysis of results collected during method validation studies. Additional information and graphing tools for method validation can be found at www.westgard.com.
a. Linearity study: determination of the reportable range of the method. i. Five levels of solutions are recommended and can be prepared as indicated.
Solutions with matrices that approximate real samples are preferable to water or saline dilution. (Westgard, 2008a) Level 1: close to the detection limit of the assay Level 2: 3 parts low pool plus 1 part high pool Level 3: 2 parts low pool and 2 parts high pool Level 4: 1 part low pool and 3 parts high pool Level 5: exceeding the expected upper limit of the assay
ii. Three to 4 replicate measurements on each specimen are recommended.(Westgard, 2008a)
iii. The mean value for each specimen is plotted on the y–axis and expected value on the x-axis. (Westgard, 2008a)
iv. The plot is visually inspected for outliers, linearity, and ‘best fit’ line. (Westgard, 2008a)
v. If the assay is not linear within the manufacturer’s recommended working range, the method should be rejected. Alternatively, the working range can be changed to lie within the linear region.
b. Short-term replication study (repeatability or within-run): estimation of the random
error (RE), or imprecision, of the method over a short time interval. Samples are analyzed during a single 8-hour shift or with-in a single analytical run. (Westgard, 2008c)
i. Standard solutions, commercially available control materials or pooled fresh patient samples can be used.
ii. The level of analyte should approximate important clinical decision levels. A minimum of two levels (normal and high) is recommended if the analyte is medically significant when increased. At least three levels are recommended (low, normal and high) if the analyte is medically significant when decreased or increased.
iii. A minimum of 20 replicates is recommended during the time interval of interest.
iv. Gaussian distribution is determined by plotting data on a histogram or normal plot. If Gaussian distribution is not present, data should be examined for outliers. The cause of outliers should be determined and corrected if possible. If Gaussian distribution is not achievable following elimination of possible
2006 Revision: Finalized ACVP meeting, Monterey, CA, December 2009 10
outliers, then transformation of the data may be required for additional statistical analyses.
v. Analysis of data includes calculation of the mean, SD and CV. vi. Compare the SD and CV, as measures of RE, to the laboratory standard (TEa
or clinical decision limit). If the SD or CV exceeds this standard, the method should be rejected. For this initial assessment, bias is assumed to be zero. Additional analyses including bias (determined from the Comparison of Methods Study) should be conducted after this information is available.
c. Long-term replication study (reproducibility or between-run): estimation of the
random error (RE), or imprecision, of the method over a longer time interval that approximates real working conditions. A minimum of 20 samples is analyzed during different shifts (and runs) over a minimum of 20 days. Sample selection and data analysis are the same as for the short-term replication experiment.
d. Comparison of Methods: estimation of bias, or systematic error (SE), of the test
(new) method as compared to the comparison method, if one exists. i. Choose the comparison (reference) method with consideration for known
accuracy and quality. The comparison method may be a definitive method, a reference method, or another field method as defined by Tietz. [Tietz 1979] Comparison to proficiency testing data may also be considered; however, careful attention to the known accuracy of such data is recommended.
ii. A minimum of 40 patient specimens tested by both methods is recommended.(Jensen, 2006; Westgard, 2008d)
iii. Specimens should represent the spectrum of results expected in clinical application of the method and span the entire working range with adequate sample number at ends of the range.(Jensen, 2006)
iv. Duplicate measurements by each method are desirable, but single measurements are acceptable.(Jensen, 2006) Results should be examined at the time they are performed. If a significant difference is detected in values obtained by the two methods, immediate retesting should be performed to determine if the discrepancy is repeatable or if an error occurred.
v. Specimens should be analyzed within two hours of each other (or sooner, depending upon analyte stability) by the test and comparative methods. Specimen handling should be defined to avoid extraneous variation between the methods. If samples are analyzed at different laboratories (>2 hour interval between testing), sample stability must be considered.
vi. The study should be conducted over 5-20 days with a preference for the longer time period; e.g., 2-5 specimens per day for 20 days.
vii. Analysis of data: 1. A comparison plot is recommended for visual inspection with the test
method and the comparative method plotted on the y-axis and the x-axis, respectively. Outliers should be re-analyzed if samples are fresh. A ‘best fit’ line can be drawn based on visual assessment of the data. (Jensen, 2006)
2006 Revision: Finalized ACVP meeting, Monterey, CA, December 2009 11
2. The calculation of a correlation coefficient (r) is used to determine which statistical equation should be used to estimate SE (bias) but is not acceptable as a measure of agreement. For analytes that vary over a wide range, regression statistics are typically used to determine SE (bias). (Jensen, 2006; Westgard, 2008d) For analytes that vary over a narrow range (electrolytes), t-test statistics are used to determine SE (bias). (Westgard 2008d)
• If r ≥ 0.99 for data with a broad range or >0.975 for data with a narrow
range, standard linear regression statistics can be used to estimate the SE (bias) at medical decision concentrations. (Jensen, 2006; Westgard 2008d; Stockl, 1998) The SE (bias) at a particular decision level (Xc) can be determined by calculating the corresponding y-value (Yc) from the regression line.
Yc = a(slope)Xc + b(y-intercept) SE (bias) = Yc – Xc
• If r < 0.99 (or <0.975), the data could be improved by collecting more
data points or decreasing variance by doing replicate measurements, or paired t-test statistics should be used to estimate the SE (bias) as the difference between the means of the results by the two methods.(Jensen, 2006; Westgard 2008d) Paired t-test, however, is not applicable in the presence of proportional error.(Westgard 2008e) Alternatively, Passing-Bablok or Deming regression analysis can be used. Subdivision of results into groups (below, within, or above the reference interval) may be used to provide additional evaluation of means in ranges that are clinically significant.(Jensen, 2006)
viii. Creation of a difference plot (Bland-Altman) is also recommended. The
difference between the test and comparative method is plotted on the y-axis, and the mean of both methods is plotted on the x-axis. The line of difference identifies SE (bias). For tests with no bias, results are scattered around the line of zero difference, with approximately ½ above and ½ below this line. (Bland, 1986; Jensen, 2006; Hyloft, 1997)
ix. Criteria for acceptable performance depend on the TEa for the test as determined by each laboratory. Calculated total error (TEcalc) includes SE (bias), as determined by the comparison experiment, and RE (S), as determined by the replication (long-term) experiment. TEcalc = Biasmeas + 3Smeas. Performance is considered acceptable if TEcalc < TEa. A Method Evaluation Decision Chart, which takes into account the TEa, SE and RE, also can be used to determine method acceptability.(Westgard, 2008b)
e. Interference study: estimation of systematic error caused by substances within the
specimen being analyzed. These errors are typically constant with the size of error proportional to the concentration of the interfering material.(Westgard, 2008f) Common interfering substances include hemolysis, lipemia and bilirubin.(Bellany,
2006 Revision: Finalized ACVP meeting, Monterey, CA, December 2009 12
2000) Additional comparisons may be made between heparin plasma vs. serum and serum samples collected in gel tubes vs. plain tubes or other possible interferents, as indicated by the test or instrument of interest.
i. Standard solutions, patient specimens or pooled patient samples can be used. The latter two are preferred because of their ready availability and complex matrix.(Westgard, 2008f) Samples with varying levels of the analyte that at least spans the clinical range should be chosen.(Westgard, 2006)
ii. Defined quantities of hemoglobin (from lysed RBC), lipid (commercially available solutions) and bilirubin (commercial standard solutions) are added to samples to reach an increased concentration that is anticipated to occur in patient samples.(Westgard, 2008f)
iii. The volume of interferent added should be minimized to avoid changes in the sample matrix.(Westgard, 2008f) Duplicate measurements on all samples are recommended. Small differences in the measured analyte caused by the interferent may be masked by random error inherent to the method. Duplicate measurements will help obviate this problem.(Westgard, 2008f)
iv. Measurements should be performed by both the new method and the comparative method, if one exists. If both methods show similar SE (bias) caused by the interferent, presence of bias alone may not be sufficient to reject the new method. (Westgard, 2008f)
v. Calculation of bias due to the interferent: (Westgard, 2008f) 1. Determine the mean for the duplicates of the interferent-containing sample
and the control. 2. Calculate the difference (bias) between the interferent-containing sample
and its control. Repeat for all pairs of samples. 3. Calculate the mean difference (bias) for all specimens with a given
concentration of interferent. vi. A paired t-test is recommended for comparing the results from the interferent-
containing sample and the unadulterated control. Regression statistics are not applicable. A t-test statistic of 2 is used as a standard cut-off. The t-test statistic estimates the number of standard deviations that the altered sample differs from the unaltered sample. (Westgard, 2008f)
vii. Criterion for acceptable performance is SEmeas < TEa. If the SEmeas > TEa, the laboratory should decide whether specimens likely to contain interfering substances can be readily identified and whether specimens should be rejected if potential interferents are present or if their effect can be quantitated or semi-quantitated based on additional studies.
f. Recovery Study: estimation of proportional systematic error (SE). Proportional SE
occurs when a substance within the sample matrix reacts with the analyte and competes for analytical reagent. The magnitude of SE increases as the concentration of the analyte increases. Proportional SE is determined by calculating the percent recovery of an amount of standard analyte added to a patient specimen. (Westgard, 2008f)
i. Standard solutions of high concentration are often used since they can be added in small amounts in order to minimize specimen dilution but still
2006 Revision: Finalized ACVP meeting, Monterey, CA, December 2009 13
achieve a recognizable, significant change in the analyte concentration. Dilution of the original specimen should not exceed 10%.
ii. The amount of analyte added should result in a sample that reaches the next medical decision level for that analyte. Similar to the interference experiment, small additions will be more affected by the inherent imprecision of the method than large additions.
iii. Replicate measurements of both adulterated and control specimens are recommended. Recovery samples should be analyzed by both the test and comparison methods. The number of patient specimens to be tested depends on the numbers and types of reactions anticipated to produce a systematic error.
iv. When a recovery study is being done as part of the evaluation of a new method, it should ideally be performed using both the new method and a comparison method if one exists.
v. Data calculation (For an example of the data calculations involved in a recovery study, see Westgard, 2008f or http://www.westgard.com/lesson27.htm#4 Accessed November 10, 2009) 1. Calculate amount of analyte added: Conc. stnd added x (ml stnd added/ml stnd added + ml sample) 2. Calculate the mean of the replicate measurements for all samples. 3. Calculate the difference between the adulterated sample and the control. 4. Calculate the recovery by dividing the difference by the amount added. 5. Calculate the mean of the recoveries of all the pairs tested. 6. Calculate the proportional SE as 100% - recovery%.
vi. Criterion for acceptable performance is SEmeas < TEa. Small amounts of proportional systematic error may be acceptable; however, the method should be rejected if large proportional systematic errors that are greater than the total allowable error are observed.
g. Reference interval for new method/instrument: Creation of a new reference
interval or validation of an existing reference interval is necessary for clinical decision making.
See New ASVCP Guidelines for Reference Interval and Decision Threshold Generation and Maintenance.
h. Detection limit study: estimation of the lowest concentration of an analyte that can
be measured. Detection limit verification is recommended for all assays in which a low value may be of clinical significance, e.g., forensic tests, therapeutic drug levels, TSH, immunoassays and cancer markers.(Westgard, 2008g)
i. A ‘blank’ sample that does not contain the analyte of interest and a ‘spiked’ sample containing a low concentration of the analyte are used. Several spiked samples, containing analyte at the detection concentration claimed by the manufacturer, may be required.
ii. 20 replicate measurements for each of the samples are recommended. iii. The blank solution measurements can be performed ‘within-run’ or ‘across-
run’ on the same day. However, the spiked sample should be analyzed over a
2006 Revision: Finalized ACVP meeting, Monterey, CA, December 2009 14
longer period of time to take into account day-to-day or between-run variation. A minimum of 5 days is commonly used. (Westgard, 2008g)
iv. Quantitative estimations may be reported as: 1. Lower Limit of Detection (LLD)/Limit of Quantification (LoQ) is the
mean of the blank + 2-3 x SD of the blank. 2. Biologic Limit of Detection is the mean of the blank + 2-3 SD of the
spiked sample. 3. Functional Sensitivity is the mean of the spiked sample that has CV of
20%. This represents the lowest limit at which quantitative information is reliable. Several spiked samples must be studied in order to determine the spiked sample with a 20% CV.
i. Selection of QC rules for the statistical monitoring of method performance (QC
Validation) i. QC validation can be done manually using normalized OpSpecs Charts, the
EZRUNS calculator (www.westgard.com) or other quality assurance programs. (Friedrichs, 2005)
ii. QC validation utilizes TEa requirement (or clinical decision interval) for the test, along with CV (RE) and bias (SE), determined from replication and comparison of methods experiments, to determine the possible control rules that can be applied for statistical QC.(Westgard, 2006)
iii. For most automated methods, a probability of error detection of 90% and probability of false rejection of <5% are sufficient. For extremely stable assays with few anticipated problems, a probability of error detection as low as 50% may be acceptable. (QP15 Frequently Asked Questions About Quality Planning. Available at:www.westgard.com. Accessed November 10, 2009.)
iv. Different QC rules may be required for different levels of a single analyte (multilevel QC). For example, more stringent multirule QC may be required to detect error at lower analyte levels than at higher analytes levels.
v. Adoption of a new method or calibration/maintenance of a method may require different (more stringent) QC rules than those applied during routine use of a method. This is referred to as multistage QC.
2.1.3. Instrumentation
a. Instrument performance: The instrumentation and methodologies used must be capable of providing test results within the laboratory’s stated performance characteristics. (Linnet, 2006) These include:
i. Analytical range including detection limit and linearity ii. Precision
iii. Accuracy iv. Analytical Specificity - Measurement of the target compound. This should
give an estimate and clearly define any interfering substances. Because interferences cannot always be avoided, consideration should be given to the development of interferographs that examine the effects of added lipid,
2006 Revision: Finalized ACVP meeting, Monterey, CA, December 2009 15
bilirubin, and hemoglobin on assay results. Inferences are species specific, ideally interferographs need to be created for each analyte and species tested
v. Analytical Sensitivity vi. Additional points to consider:
1. Instruments with adjustable settings for different substances and/or species should be carefully checked for compliance.
2. Laboratory and manufacturer defined performance characteristics should be compared and adjustments made as needed.
3. Make sure certain species differences are accommodated; the instrument manufacturer’s technical representatives generally assist in this portion of instrument qualification and setup.
b. Function checks i. Appropriate function checks of critical operating characteristics should be
made on all instruments. (i.e., stray light, zeroing, electrical levels, optical alignment, background checks, etc.)
ii. Prior to sample testing, laboratory personnel should perform QC and/or calibrate each instrument daily or once per shift. Instruments should be operated per manufacturer instructions
c. Calibration i. Instruments should be calibrated at least every 6 months. More frequent
calibrations may take place: (Westgard, 2008a) 1. According to manufacturer’s recommendation. 2. After major service. 3. When QC values are outside limits or troubleshooting indicates need. 4. When workload, equipment performance, or reagent stability indicate the
need for more frequent calibration. ii. After calibration, controls should be run according to SOP.
2.1.4. Personnel Knowledge. Laboratory personnel should have thorough working
knowledge of the equipment and its use, including, but not limited to the following topics.
a. Linearity differences in animal compared to human samples b. Effects of hemolysis, lipemia, icterus, carotenoid pigments (especially large animals),
and different anticoagulants on each assay c. Reportable ranges d. Species-specific or strain-specific reportable ranges and reference intervals e. Expected physiologic ranges. Repeat criteria may be established that triggers re-
analysis of a sample. Criteria for repeating a test should include any equipment generated error messages or flags, as well as results that are grossly outside of normal physiologic range. For the latter, consider use of ‘panic values’ pre-programmed into biochemistry analyzer operating system. Retesting to confirm an abnormal result should be communicated to the client as part of the report.
f. Common problems encountered with veterinary samples and appropriate steps to take with various error messages or flags.
g. Regular instrument maintenance schedule (daily, weekly, monthly, and as needed). h. Replacement of inadequate or faulty equipment
2006 Revision: Finalized ACVP meeting, Monterey, CA, December 2009 16
i. Problem-solving procedures (troubleshooting) j. Appropriate use of comments and species-specific criteria Comments and species-
specific criteria may be determined to be of interpretive benefit to clients. Direct communication with clients should be limited to those in the organization who are qualified to provide data interpretation in the context of clinical history and previous therapies.
2.1.5. Quality Control. Calibrators and controls should be identified appropriately, and their use and frequency should be documented as part of the quality plan to ensure accuracy of results.(Westgard, 1998) Documentation and generation of appropriate actions should follow rules and policies established for analysis of QC parameters. These may include confirmation of results and appropriate use of charts, graphs, and data entry, as determined by the laboratory for each department and/or type of equipment. There should be a reporting structure to inform management of QC issues, and problems requiring attention should be forwarded to appropriate locations within the organization. Controls on corrective actions should be in place to evaluate effectiveness.
a. Selection of QC rules for the statistical monitoring of method performance (QC
validation) i. QC validation can be done manually using normalised OpSpecs Charts, the
EZRUNS calculator (www.westgard.com) or other quality assurance programs.
ii. QC validation utilizes TEa requirement (or clinical decision interval) for the test with CV (RE) and bias (SE), from replication experiment and comparison of methods experiment, to determine the possible control rules that can be applied for statistical QC.
iii. For most automated methods, a probability of error detection of 90% and probability of false rejection of <5% are sufficient. For extremely stable assays with few anticipated problems, a probability of error detection as low as 50% may be acceptable.
iv. Different QC rules may be required for different levels of a single analyte (multilevel QC). For example, more stringent multirule QC may be required to detect error at lower analyte levels than at higher analytes levels.
v. Different QC rules may be desired during the adoption of a new method or after calibration and maintenance than those required during routine use of an established method (multistage QC). The former QC rules are typically more stringent than the latter.
b. Reagents and materials used for the procedures should be labeled with date received and date opened and stored according to manufacturer’s recommendations when applicable. Expiration dates should be observed. Expired reagents should be discarded appropriately. Analyte concentrations in control materials often represent low and high results with respect to human pathologic abnormalities in addition to normal human concentrations. If pathologic concentrations from animal species are significantly divergent from these levels, it may be necessary to include additional
2006 Revision: Finalized ACVP meeting, Monterey, CA, December 2009 17
control materials with analyte levels similar to animal pathologic concentrations or activities.
c. The selection of numbers of controls will depend, in part, on the performance of the equipment and is part of the process of QC validation. Traditionally, 2-3 control materials are commonly used, but additional QC data points may be needed in order to ensure a high probability of error detection and low probability of false rejection with some assays.
d. A maximum run length of 24 hours is recommended unless the instrument manufacturer recommends more frequent control runs.
e. Verification of reagent stability over the “run-length” should be done during method validation by assaying control materials multiple times throughout an entire “run-length” and comparing the resulting mean and SD with results from “with-in run” precision experiments.
f. Establish QC frequency with the following considerations i. Test frequency and throughput (number of tests performed during each run or
each day) ii. Degree to which method and quality requirements for the test depends on
precise technical performance iii. Analyte or reagent stability iv. Frequency of QC failures v. Training and experience of personnel
vi. Cost of QC (increasing frequency adds to cost-per-test) g. Quality control parameters:
i. Laboratories should establish criteria or verify manufacturer’s criteria for an acceptable range of performance for QC materials. Mean, SD, and CV should be calculated with a minimum 20 of measures. It is recommended that control materials come from the same lot number.
ii. Controls should be assayed in the same manner as patient specimens. iii. At least 1 level of control material should be run after a reagent lot is changed. iv. A mechanism should be in place to determine whether testing personnel
follow policies and procedures correctly. v. Use of Westgard multi-rule procedures or other rules based on QC validation
is recommended. vi. Accumulated quality control results should be systematically reviewed on a
regular schedule, for example through use of Levey-Jennings plots, and appropriate actions taken when quality controls results exceed the limits or demonstrate undesirable trends.
vii. Policies and procedures should be contained in a procedures manual. Annual (or more frequent) review of policy and procedures by staff should be documented.
viii. QC records should be reviewed frequently to ensure that suitable action is taken when QC results fail to meet the criteria for acceptability. Corrective action should be outlined for laboratory personnel.
ix. Control products, preferably from the same lot number, should be purchased commercially. If using calibrators as controls, use different lots for each
2006 Revision: Finalized ACVP meeting, Monterey, CA, December 2009 18
function. If pooled patient samples are used, establish the mean value of all analytes (minimum n = 10 to establish a mean).
x. Monitor results of clinical specimens for various sources of error by use of parameters such as anion gap, comparison of test results with previous submissions from same patient (delta checks), and investigation of markedly abnormal results (limit checks).
xi. Manufacturer’s instructions for routine maintenance (daily, weekly, monthly) and calibration should be followed unless laboratories have modified them for their own use and documented appropriate instructions. A log of instrument maintenance, calibration, or repair should be maintained in the laboratory or by a metrology unit.
2.1.6. Procedures Manual. See Westgard and Klee for an outline of recommended
procedure manual contents.(Westgard, 2006) Protocols may be organized as hard copies in manuals and/or stored in computers. All procedures currently in use should be included in a Procedures Manual that is easily accessible by all personnel performing the assay. Editing should be performed by an identified individual(s). The organization of the manual(s) will vary with the size, needs and requirements of the facility. Certain accrediting organizations may have specific requirements, and specific Standard Operating Procedures (SOPs) are recommended. Most laboratory procedures should be adequately covered by the categories list here. Upon completion of training of new personnel, a check-off list should be implemented to document competency in performing the assay and knowledge of related aspects of the assay. When the procedures document comes under revision, a review with applicable personnel is recommended to ensure that all are familiar with the revised procedures.
a. Index b. General Information
i. General Policies and Procedures ii. Quality Assurance information
iii. Sample Storage Length and Disposal iv. Raw Data Storage and Disposal v. Routine Send-Outs
1. Testing Facility information 2. Sample Requirements 3. Shipping guidelines 4. Turn-around time
c. Standard Operating Procedures (SOP) for each procedure The amount of information contained in an SOP may vary, but the following topics are recommended. (Westgard, 2006)
i. Title (include version date or number) ii. Purpose and application of the procedure
iii. Principles of the assay iv. Sample management
1. Patient preparation (e.g., species-specific information) 2. Specimen collection, processing and handling (e.g., minimum volume)
2006 Revision: Finalized ACVP meeting, Monterey, CA, December 2009 19
3. Criteria for rejection of samples v. Operational precautions and limitations
1. Hazards 2. Interferences with the method in use
• Hemolysis, icterus, lipemia • Anticoagulants • Drugs, etc.
3. Reportable range 4. Sensitivity and specificity if applicable
vi. Reagents 1. Storage location and conditions 2. Preparation 3. Open shelf-life 4. Manufacturer (e.g., contents)
vii. Equipment and supplies 1. Equipment or tools necessary to complete the procedure 2. Location of supplies 3. Actions to take when system is down (refer to Send-Out section or provide
additional information) viii. Calibration and quality control procedures
1. Materials 2. Frequency 3. Interpretation (when to verify, rerun, troubleshoot, etc.)
ix. Procedure (step-by-step instructions) x. Reference intervals for each appropriate species
xi. Interpretation and reporting: critical values (recommended actions) 1. Chain of communication
• In-house staff • Technical representative information
2. Troubleshooting steps • QC check • Rerun • Dilutions (appropriate diluent)
xii. Literature references xiii. Documentation
1. Name, date and signature of generator (date of implementation if different from generation)
2. Name, date and signature of reviewer (if applicable) 3. Training log
xiv. Appendices 1. Logs or worksheets
• Observation and troubleshooting log • Results log
2. Package inserts (Much of the above information may be obtained directly from the package insert. In that case, the SOP may refer to applicable sections of the insert.)
2006 Revision: Finalized ACVP meeting, Monterey, CA, December 2009 20
3. “Cheat sheets” • Quick reference guides • Title and version of procedure
2.1.7. Comparison of Test Results. If the laboratory performs the same test by more than
1 method, at more than 1 test site, or by a referral laboratory, comparisons should be run at least annually to define the relationships between methods and sites. Current Guidelines for Methods Comparison are under development. Please check the ASVCP website.
The following steps should be included: a. Compare a minimum of 20 samples that cover the analytical range.
i. Plot data on an x-y comparison plot ii. Calculate slope and intercept by a least squares method
iii. Use of a clinical pathology statistical software program, such as EP Evaluator, allows method comparison using set analytical ranges and CLIA acceptable performance targets.
b. Laboratory director or qualified personnel should define acceptable performance limits.
c. If individual test results performed on the same patient or material do not correlate with each other (e.g., urea nitrogen/creatinine, electrolyte balance), the cause should be investigated, the situation documented, and corrective action taken.
d. Enzyme verification should be compared across analyzers a minimum of every 6 months (biannually) and after any significant technical service or other problems. Enzyme verification is completed by performing a linearity study and comparing results among analyzers by linear regression.
2.2. Clinical Chemistry
2.2.1. Monitoring
a. Internal monitoring should include the following. i. Water quality (as specified by instrumentation and assays)
ii. Stability of electrical power (as specified by instrumentation). iii. Temperatures of water bath, refrigerator, and freezer (recommended daily).
Large equipment may be wired to an alarm system to alert users when temperatures are out of a specified range.
iv. Regular calibration of analytical balances and pipettes (recommended annually).
v. Maintenance of up-to-date SOP manuals with dates of initial implementation, and revision number clearly stated should be available. A system should be in place in which only updated copies are used and obsolete versions are archived but not available for inadvertent use and circulation.
vi. Proper storage, handling and maintenance of inventory. vii. Maintenance of a log containing procedural changes, problems with methods
or instruments, and actions taken to resolve problems. All entries should be clearly dated and signed by laboratory personnel. This function may be
2006 Revision: Finalized ACVP meeting, Monterey, CA, December 2009 21
performed by a metrology unit and maintained electronically for easy access during a regulatory or quality assurance inspection.
b. External monitoring – see General recommendations i. Method Validation – see General recommendations
ii. Instrumentation – see General recommendations iii. Personnel Knowledge – see General recommendations iv. Quality Control – see General recommendations v. Procedures Manual – see General recommendations
vi. Comparison of Tests – see General recommendations vii. Identification of Out-sourced Tests – see General recommendations
2.3. Hematology 2.3.1. Monitoring – see General recommendations 2.3.2. Method Validation – see General recommendations. Not all of the method
validation experiments listed in section 2.1.2. may be applicable to evaluation of automated hematology analyzers. Method validation experiments should be selected or modified as necessary to ensure that new methods/analyzers are functioning satisfactorily to meet the laboratory’s requirements and the manufacturer’s specifications.
2.3.3. Instrumentation – see General recommendations 2.3.4. Personnel Knowledge – see General recommendations 2.3.5. Quality Control for Hematology - see also General recommendations
a. Automated assays, calculated indices and microscopy i. Erythrocyte (RBC) count
ii. Hemoglobin concentration iii. Hematocrit iv. RBC morphology including RDW, HDW, MCV, MCH/*CH, and
MCHC/*CHCM (*direct laser measurement by Advia hematology analyzer) v. Total leukocyte (WBC) count
vi. WBC differential cell counts (microscopic or automated) vii. RBC and WBC morphology (microscopic)
viii. Platelet count ix. Platelet indices including MPV and PCT x. Reticulocyte counts (microscopic and automated)
xi. Blood smears should be prepared, stained, and held for microscopic examination at the discretion of the clinical pathologist
b. Recommendations i. Automated differentials should be verified by manual (microscopic)
evaluation of the blood smear. Establish criteria for situations that require microscopic examination of the blood smear to verify instrument counts (e.g., total WBC count >20,000/µL)
ii. Manual cell counts: Cell counts performed manually using a hemacytometer must be performed in duplicate. If there is >10% difference between the counts obtained, the chambers should be reloaded and counted again in
2006 Revision: Finalized ACVP meeting, Monterey, CA, December 2009 22
duplicate. If a control is used for manual WBC, RBC, or platelet counts, either one level of assayed material or procedural control (defined as following) should be analyzed each time this method is used or once each shift.
i. A procedural control is defined as one of the following: a. Duplicate dilutions of either assayed control or a
previously-assayed patient specimen. Results may be compared to previously defined acceptable limits for differences between duplicates. (This is the only acceptable procedural control for manual RBC counts.)
b. WBC and platelet counts may be compared with a value estimated from a peripheral blood smear.
iii. New methylene blue-stained smears may be evaluated for a microscopic reticulocyte count. If the counts are performed in duplicate (two smears), the results should not differ by >10%.
iv. Automated reticulocyte counts should correlate with proportion of polychromatophilic RBCs observed on a stained blood smear.
v. Spun hematocrits (PCV) should approximate hematocrit (Hct) calculated by an automated analyzer using MCV and RBC number. The laboratory should set the maximum acceptable difference, which may vary with species.
vi. Mean cell hemoglobin concentration (MCHC) may exceed the upper reference interval with sample hemolysis (pathologic or in vitro), lipemia and in the presence of Heinz bodies. In the absence of these conditions, a high MCHC may indicate instrument error.
2.3.6. Procedures Manual – see General recommendations 2.3.7. Comparison of Tests – see General recommendations 2.3.8. Identification of Out-sourced Tests – see General recommendations
2.4. Manual Hematology for Non-mammalian Species
2.4.1. Monitoring. Internal monitoring should include the following: monitor reagent
preparation for cell counting diluent (reagent grade water, verification of quality of new lot as compared with previous)
2.4.2. Method Validation – See also General recommendations. Analysts must be proficient in exotic animal hematology but will otherwise perform standard method validation tests. Not all of the method validation experiments listed in section 2.1.2. may be applicable to evaluation of exotic manual hematology methods. Method validation experiments should be selected or modified as necessary to ensure that new methods are functioning satisfactorily to meet the laboratory’s requirements and the manufacturer’s specifications.
2.4.3. Instrumentation – see also General recommendations. Equipment (e.g. hemacytometers, weighted hemacytometer cover slips, hand tallies, calibrated pipettes, differential cell counters) used for hematology procedures should be in good working order. Routine monitoring and regular maintenance of each piece of equipment (e.g. annual calibration of pipettes and balances) should be performed and documented. Records of maintenance, and malfunction and repairs should be kept.
2006 Revision: Finalized ACVP meeting, Monterey, CA, December 2009 23
Abbott Diagnostics, Inc. (Abbott Park, Illinois) has validated and supports automated cell counts on some non-mammalian species using the automated hematology analyzers, the Cell-Dyne 3500 or higher. Validation has been done at Sea World Laboratories.
2.4.4. Personnel Knowledge. Laboratory analysts must be proficient in cell identification for the species tests. Comprehensive knowledge of species variation when using flow cytometry is important to understand when verification by manual methods is required.
2.4.5. Quality Control. Manual WBC counts using a hemacytometer are imprecise and have coefficients of variation ranging from 20-40% (Schalm, Harr et al, 2005); therefore, quality control implementation and statistical analysis may yield significance or a lack of significance that is not relevant to daily operation. Method validation studies for shark species conducted by J. Arnold (2005) showed coefficients of variation comparable to manual hematology for human WBC counts as reported in the B-D product insert for Unopette 365855 when the sample was processed within 5 hours of collection.
a. Reagents and Materials. Documented protocols for cell counts include direct count using Methyl Violet (Natt & Herrick, 1952) to determine total RBC, WBC and thrombocyte counts, direct count with no dye (Hawkey, 1988) or an indirect method using Phloxine B dye (Campbell, 1988) for total WBC only. In the latter method, only the cells containing eosinophilic granules are stained and the total WBC is calculated based on the percent heterophils and eosinophils from the differential.
Reported method validation studies between the direct and indirect techniques are conflicting (Dein, 1994; Arnold, 1995) and require further investigation, preferably following Westgard’s guidelines for Method Validation, with a more representative number of animal species. The disparity in results may be due to the imprecision of each method. The diluent described by Natt and Herrick can be prepared in the laboratory and it is suitable for all non-mammalian vertebrate species, however, when this diluent is used for some chelonian (turtle) and elasmobranch species (sharks, skates and rays), additional salts are required to adjust the osmolality of the stock solution (Arnold, 2005). Hawkey’s technique utilized Becton Dickinson’s WBC Unopette. Campbell’s method using Phloxine B diluent is no longer available as Eosinophil Unopette 5877, but a comparable diluent can be prepared by the user.
b. Currently, commercially prepared control materials are not available for non-
mammalian blood cell counts. Procedural controls include: i. Duplicate dilutions from a patient specimen, performed within the acceptable
time limits for sample stability. ii. WBC Estimate from Blood Smear. Each institution should document a
protocol to achieve a reliable method for evaluating the accuracy of the hemacytometer counts. Estimated total WBC values may be difficult due to the similar morphology of lymphocytes and thrombocytes when viewed at lower magnifications typically used for WBC estimates of mammalian cells.
2006 Revision: Finalized ACVP meeting, Monterey, CA, December 2009 24
c. Proficiency testing for technologists should be documented annually, or more frequently as determined by the institution. Testing should include comparison counts from the same blood sample for total cell counts and for leukocyte differentials. Sample selection should be representative of patient population (avian, reptile, teleost, elasmobranch, etc.). Between technologists, hemacytometer counts should agree to within 15% and differential percentage results for each cell type should agree to within 95% confidence interval.
Direct Cell Count Method—Thrombocyte/Lymphocyte Error. It may be difficult to differentiate between thrombocytes and lymphocytes in the hemacytometer for newly trained technologists, or for experienced technologists when counting some animal species. A good quality control check is to count all of the non-erythrocytes in the nine large squares of the chamber and calculate the total number (this is not the actual value and must be corrected from the differential). Perform the differential twice - include the thrombocytes in the first differential and exclude them in the second. The latter is reported as the actual differential results. Using the percent thrombocytes from the first differential, calculate the absolute value and then subtract it from the total number to determine the total WBC. Example: Tally from hemacytometer with a 1:100 dilution = 750 non-erythrocytes cells; 750 × 1.1 × 100 = 82,500/µL for the total non-erythrocytes count. The first differential = Monocytes (1%), Lymphocytes (9%), Heterophils (8%) and Thrombocytes (82%) so the absolute value of the thrombocytes = 0.82 × 82,500 = 67,650. The total WBC = 82,500 – 67,650 = 14,850/µL.
2.4.6. Procedures Manual – see General recommendations 2.4.7. Comparison of Tests – see General recommendations 2.4.8. Identification of out-sourced tests – see General recommendations
2.5. Urinalysis
2.5.1. Monitoring – see General recommendations 2.5.2. Method Validation – see General recommendations. Not all of the method validation
experiments listed in section 2.1.2. may be applicable to evaluation of urinalysis. Method validation experiments should be selected or modified as necessary to ensure that new methods/analyzers are functioning satisfactorily to meet the laboratory’s requirements and the manufacturer’s specifications. Applicable method validation procedures may include, but are not limited to, comparison of methods, testing for interference (particularly how urine color effects ability to read strip result visually or by automated methods), and possibly detection limits.
2.5.3. Instrumentation - see General Recommendations. Instrumentation employed in urinalysis is limited but may include automated strip readers. Automated strip reader should be maintained and operated according to manufacturer’s specifications. Applicable function checks should be done as needed to ensure accurate instrument performance.
2.5.4. Personnel Knowledge. a. Understanding of the effects of specimen condition on test parameters, e.g., effect of
hemoglobinuria on protein determination.
2006 Revision: Finalized ACVP meeting, Monterey, CA, December 2009 25
b. Knowledge of species-specific crystalluria and expected findings. c. Knowledge of common problems encountered with veterinary urine specimens that
may lead to erroneous results, e.g., effects of preservatives on test results, urine specimen incorrectly run on serum settings
d. Knowledge of dip-stick methodology used in the laboratory and common interferences for that method.
e. Appropriate uses of retest criteria: Established by laboratory and based on clinical significance of test values, e.g., crystal identification, protein confirmation by semi- or analytic quantitation, glucose confirmation. Tablets methods may be required when intensely pigmented urine interferes with ability to read the dip-stick pads. Include documentation of retesting on worksheet and report or corrected reports (if necessary).
2.5.5. Quality Control – see also General recommendations a. Assays
i. Physical Tests (appearance [color, clarity], specific gravity [estimation by refractometry])
ii. Chemical Tests 1. ‘Dipstick’ tests 2. Confirmatory tests (glucose [tablet], bilirubin [tablet], ketones [powder or
tablet], sulfosalicylic acid precipitation for protein) b. Quality control procedures for dipstick and urine specific gravity. Urinalysis
control materials for human urine are available for testing accuracy of dipsticks. Frequency of QC testing of dipsticks depends on the number of procedures performed by the laboratory and may vary from daily QC testing to QC testing with each newly opened bottle of dipsticks. Accuracy of refractometers should be monitoring at regular intervals using distilled water (SG 1.000).(George, 2001)
c. Microscopic examination of sediment: standardization of procedure i. Microscopic sediment examination of veterinary urine specimens requires
training. Texts, charts and posters of formed elements in urine for a variety of species should be accessible to the analyst. The details of performing this task and the results to be reported may be outlined or detailed in a laboratory SOP.
ii. A standard volume of urine is used for preparing urine sediment (e.g., 5 or 10 mL), depending upon the species and the tests requested. Conical centrifugation tubes should be spun at low RPM, e.g., 400-500g for 5 minutes. High RCF and excessive centrifugation time destroys casts and cellular elements. RCF = 1.118x10⁻⁵ x radius of arm(cm) x revolutions/min.
iii. Supernatant is removed by decanting or pipetting, so that a constant volume of supernatant remains with the pellet (preferred volume 0.5 mL). Cellular elements are then resuspended by gentle mixing.
iv. Stain may be added to resuspended sediment to facilitate identification of sediment contents. A consistent number of drops should be added followed by gentle mixing. Additional dilution of cellular elements caused by volume of stain should be factored into final results. Alternatively, a constant sediment volume can be maintained by replacing some of the supernatant volume with stain.
2006 Revision: Finalized ACVP meeting, Monterey, CA, December 2009 26
v. A pipette is used to transfer one or two drops of sediment to a glass slide, depending upon the coverslip dimensions. It is important that the sediment volume, the number of drops of sediment and the coverslip size used are constant within a laboratory.
vi. Alternative methods of standardization of urine sediment are available (e.g., volumetric counting grids, automated methods), but are not frequently used in veterinary medicine. Adoption of any new methodology should be preceded by method validation studies.
d. Microscopic examination of sediment: enumeration of elements i. The sediment contents are examined at low magnification (x100 or LPF)
followed by high-dry magnification (x400 or HPF) and rarely oil immersion magnification (x1000 or oil). Several formats have been used for reporting grades and amounts of the formed elements. Absolute numbers have many advantages. The low and high amounts of each element observed in 10 fields, or the average, are reported. Alternatively, a 0 to 3+, or 0 to 4+, grading system may be used, if clear criteria are written for technologists to use. This information also should be provided to clinicians or customers. The urine sediment SOP should clearly describe procedures for examining and reporting sediment contents.
ii. Low power field (LPF) is used for enumeration of casts. Casts are reported by type and number per LPF. LPF also can be used for general assessment of the distribution of crystals, epithelial cells and background contents (mucus, sperm, fat, yeast, etc.).
iii. High power field (HPF) is used for reporting numbers of erythrocytes, leukocytes, and possibly crystals, epithelial cells, and bacteria when in high numbers.
iv. Oil magnification may be used for reporting concentration and morphology of bacteria or other cellular elements.
v. Observation of microorganisms (e.g., bacterial rods or cocci, yeast) in unstained or stained wet mounts should be confirmed with a quick stain or Gram stain on an air-dried slide made from straight or concentrated urine of the sediment.
2.5.6. Procedures Manual – see General recommendation 2.5.7. Comparison of Tests- see General recommendations 2.5.8. Identification of out-sourced tests – see General recommendations
2.6. Cytology 2.6.1. Monitoring. Equipment and reagents used for preparation and analysis of cytologic
specimens should be maintained in a manner consistent with good laboratory practices as detailed in the clinical chemistry and hematology sections of these Guidelines.
2.6.2. Method Validation – see General recommendations. Not all of the method validation experiments listed in section 2.1.2. may be applicable to evaluation of cytologic methods. Method validation experiments should be selected or modified as necessary
2006 Revision: Finalized ACVP meeting, Monterey, CA, December 2009 27
to ensure that new methods/analyzers are functioning satisfactorily to meet the laboratory’s requirements and the manufacturer’s specifications.
2.6.3. Instrumentation – see General recommendations 2.6.4. Laboratory Personnel Knowledge
a. Laboratory technical personnel should be proficient at examining samples grossly (e.g., fluid color and clarity) and performing all relevant tests (routine and special, i.e., mucin clot test).
b. Laboratory personnel should have knowledge of common problems encountered in sample preparation and have the ability to troubleshoot procedures for problem resolution.
c. The individual interpreting veterinary specimens, preferably a veterinary pathologist, should have documented cytopathology training and have knowledge of the cytologic findings from all species and cytologic specimen types expected to be assessed by the laboratory. .
d. Appropriate avenues should exist for a second opinion and additional review or consultation with a cytopathologist, if needed or requested.
e. Attempts to ascertain diagnostic accuracy of cytologic interpretations should be pursued. These may include but are not limited to:
i. Correlation of findings with histologic or additional cytologic specimens. ii. Follow-up information regarding the animal’s conditions and/or responses to
therapy. iii. Peer review of selected cytologic specimens by another
cytologist/cytopathologist to determine if there are features that have been overlooked, over-interpreted or under-interpreted.
iv. Correlation with other diagnostic modalities, e.g., radiography, ultrasound, microbiologic culture, etc. 1. The cytopathologist should be knowledgeable regarding ancillary
procedures. 2. The cytopathologist should review technical aspects of sample handling
and processing with laboratory personnel and provide guidance as needed. 3. The cytopathologist should be able to communicate with clients
concerning important pre-analytical, analytical and post-analytical factors. These may include:
v. Information about specimen adequacy vi. Suggested modifications of techniques
vii. Additional testing options viii. Diagnoses or differential diagnoses
ix. Prognosis or monitoring x. Treatment recommendations at a level based on experience or knowledge. If
the cytologist/cytopathologist is not experienced in treatment options, they should instruct the client to consult with a specialist.
2.6.5. Quality Control. See also General recommendations. Cytopathologists are critical to quality control, as they see most or all of the laboratory’s cytologic samples and preparations and depend upon the products reliability for their interpretations and recommendations. Therefore, the working relationship between laboratory staff and cytopathologists is critical. Quality control should
2006 Revision: Finalized ACVP meeting, Monterey, CA, December 2009 28
be appropriate for the types of specimens, stains and procedures included as part of cytology preparation and analysis. These may vary with each laboratory, type of cytologic preparations and preferences of the cytopathologist. Total nucleated cell counts from automated analyzer or manual method (hemacytometer) should be correlated with the cellular density on the slide if straight smears are made. Equipment utilized for determining total nucleated cell counts should be monitored as for hematologic analysis (see Hematology section).
2.6.6. Procedures Manual – see General recommendations 2.6.7. Comparison of Tests – see General recommendations 2.6.8. Identification of out-sourced tests – see General recommendations
2.7. Hemostatic Testing
2.7.1. Monitoring – see General recommendations 2.7.2. Method Validation – see General recommendations. Not all of the method validation
experiments listed in section 2.1.2. may be applicable to evaluation of coagulation analyzers. Method validation experiments should be selected or modified as necessary to ensure that new methods/analyzers are functioning satisfactorily to meet the laboratory’s requirements and the manufacturer’s specifications.
2.7.3. Instrumentation – see General recommendations 2.7.4. Personnel Knowledge – see General recommendations 2.7.5. Quality Control for Coagulation – see also General recommendations
a. Assays i. Platelet count and estimate
ii. Platelet morphology iii. Platelet function tests (adhesion, aggregations, secretion, PFA100,
BMBT, DNA tests) iv. Platelet antibody tests v. Activated partial thromboplastin time (APTT)
vi. Prothrombin time (PT) vii. Thrombin time (TT) or thrombin clot time (TCT)
viii. Fibrinogen concentration ix. Coagulation factor assay (functional, DNA) x. Von Willebrand factor assays (quantity ELISA, qualitative CBA,
multimere analysis, BMBT, related platelet function assays, )DNA mutation-specific
xi. Fibrin(ogen) degradation products (FDPs) and d-dimer concentrations xii. Antithrombin activity
xiii. Protein C and S assays xiv. Thromoboelastography, xv. Thrombin generation assay
xvi. Fibrinolysis assays b. Recommendations
i. Individual laboratories must define hours of operation and/or shift in order to accommodate coagulation assays. Thromboelastography studies should be prearranged prior to the analysis.
2006 Revision: Finalized ACVP meeting, Monterey, CA, December 2009 29
ii. Hand-held instruments are calibrated regularly according to manufacturer recommendations. If electronic QC is available, it should be performed as recommended by the manufacturer. External QC is recommended when there is a change in the lot number of reagent, rotor, etc., a change or damage to instrumentation, or any clinical concern. For benchtop instruments, at least 1 level of control material should be run on instruments each shift if a coagulation profile is requested. This may be performed prior to or concurrent with testing patient samples.
iii. Patient and control specimens may be tested in duplicate. iv. Data expressed in % of a pooled sample; Intervals are often provided
and % derived from a control is used.
2.7.6. Procedures manual – see General recommendations 2.7.7. Comparison of tests – see General recommendations 2.7.8. Outsourced tests – see General recommendations
2.8. Crossmatch
2.8.1. Monitoring – see General recommendations 2.8.2. Method Validation – see General recommendations. Not all of the method
validation experiments listed in section 2.1.2. may be applicable to evaluation of crossmatch methods. Method validation experiments should be selected or modified as necessary to ensure that new methods/analyzers are functioning satisfactorily to meet the laboratory’s requirements and the manufacturer’s specifications.
2.8.3. Instrumentation – see General recommendations 2.8.4. Personnel Knowledge – see General recommendations 2.8.5. Quality Control – see also General recommendations a. Assays
i. A major crossmatch consists of testing patient serum/plasma with a saline suspension of donor red blood cells.
ii. A minor crossmatch, available when donor whole blood has been submitted, consists of testing a saline suspension of patient red blood cells with donor sera/plasma.
b. Recommendations i. If sera is used for crossmatching, sera should be separated from red blood
cells as soon as possible after the sample has clotted. Samples should be examined for hemolysis and graded with 1+ hemolysis being mild and 4+ hemolysis being severe. Sera (or plasma) samples with 3+ or 4+ hemolysis should be rejected, though more stringent rejection criteria of 1+ hemolysis may be used. Hemolyzed sera/plasma may mask an incompatible hemolytic reaction. (Lippi, 2006; Giger, pers. Communication)
ii. Perform patient and donor autocontrols to ensure that reagents, such as diluent, and equipment are functioning properly. Autocontrols should be handled in parallel with and identical to the major and minor crossmatch samples.
2006 Revision: Finalized ACVP meeting, Monterey, CA, December 2009 30
1. Patient autocontrol consists of separated patient serum/plasma and a saline suspension of patient washed red blood cells.
2. When donor whole blood is submitted, the donor autocontrol consists of donor separated sera/plasma and a saline suspension of donor washed red blood cells.
iii. Avoid excessive shaking and tapping, which may yield false negative results by disrupting fragile agglutinates.
iv. Strong rouleaux may mimic true agglutination. Saline dilution can be performed to disburse rouleaux.
v. False positives may occur secondary to inadequate washing. vi. Because plasma may contain tiny fibrin clots that may result in
pseudoagglutination, false positives may occur when performing crossmatch reactions with plasma.
vii. False negatives may occur secondary to red blood suspensions that are too dilute or too concentrated.
2.8.6. Procedures Manual – see General recommendations. Procedures for crossmatch
vary with laboratory and species. Specific protocol recommendations are beyond the scope of these guidelines. Establishment of crossmatch procedures or adoption from another trusted laboratory is recommended.
2.8.7. Comparison of Tests – see General recommendations 2.8.8. Identification of Out-sourced Tests – see General recommendations
2.9. Radioimmunoassay 2.9.1. Government Regulations for RIA. Government regulations and licensing
requirements may vary with city, state, province and country. In general, minimum requirements for safe radioisotope handling are indicated. Requirements include personnel safety training, radioactive isotope monitoring, proper radioisotope disposal, and periodic inspection. Licensing is required for the purchase of radioactive isotopes. A laboratory considering performing RIAs should first determine whether it meets these standards and obtain licensure before establishing the procedures.
2.9.2. Monitoring – see General Recommendations 2.9.3. Method Validation. Any radioimmunoassay should be validated for the
species for which it will be used. Validation should include one of the methods out-lined below.
a. Articles in refereed veterinary journals for the particular test (if available) should be reviewed. It is not good practice to rely on the manufacturer’s testing alone. The test should be validated independently.
b. If the test cannot be substantiated through independent validation, then the following minimum evaluation is necessary:
i. Run-to-run precision - minimum of 10 data points. 20 data points may improve the accuracy of the estimate.
ii. Within-run precision - minimum of 10 data points. 20 data poins may improve the accuracy of the estimate.
2006 Revision: Finalized ACVP meeting, Monterey, CA, December 2009 31
iii. Recovery procedures - use a purified natural substance for each species, where possible. Recovery should be performed using both high end and low concentration samples.
iv. Evaluation of interfering substances such as hemolysis, lipemia, bilirubinemia, medication interactions, etc.
v. Parallelism - dilutions and details of linearity. vi. Reference intervals should be generated and maintained fro each test. Please
refer to the ASVCP Guidelines for Reference Intervals and Decision Thresholds
vii. Standard curves are needed for each test. Some gamma counters can store curves. If this is implemented in routine testing, validation of the procedure should be present.
2.9.4. Instrumentation – see General Recommendations 2.9.5. Personnel Knowledge – see General Recommendations 2.9.6. Quality Control
a. A minimum of 3 control materials should be assayed with each test. These can include commercial controls for high, normal and low values or samples developed in-house.
b. Interpretation of RIA results often depends on methodology and on reference values established in-house, making it difficult to use some types of external control systems. It is recommended that when using external control materials that in-house materials also be analyzed and interpretation compared.
c. External controls should be used and plotted at least quarterly. d. All control material results should be recorded and plots and values should be readily
accessible to personnel running the tests. Levy-Jennings plots are acceptable. e. An action plan must be in place that details acceptance or rejection of patient test
results based on control values. f. If the procedure, as detailed by the manufacturer or published articles is modified (ie,
only 1 tube per patient), documentation should be available to show that test precision and accuracy are still acceptable with the modification(s).
2.9.7. Procedures Manual – see General recommendations 2.9.8. Comparison of test results – see General Recommendations 2.9.9. Identification of out-sourced tests – see General recommendations
3. Postanalytical Factors Important in Veterinary Clinical Pathology
3.1. Review of Data. The laboratory should establish a procedure for appropriate 2-tech review, supervisor review and/or pathologist’s review of specimens and/or results. Review may be specific for problematic tests, specimen parameters, and/or clinical significance of test results.
3.2. Data Entry and Reporting. Reports should be accurate whether created manually or electronically in a database. Data should be presented in a standard format as established by the laboratory. If clinically significant inaccuracy is known, results should clearly define error or results should not be reported.
3.3. Report Generation. Reports should be in a format that is readable and easily understood with appropriate references or explanations as needed. They should be generated in a timely manner relative to preanalytical and analytical components.
2006 Revision: Finalized ACVP meeting, Monterey, CA, December 2009 32
The laboratory should keep a copy of all reports as well as any accompanying worksheets. Reports should be initialed and dated by the technician or pathologist involved in performing or interpreting any stage of the procedure.
3.3.1. Identification of out-sourced tests (“send-outs”): Clients should be informed of those tests that are referred to other laboratories.
3.3.2. Any possibly inaccurate results should have clear and easily seen comments on the report to the clinician that clearly state those values may be inaccurate and misleading as well as detailing why.
3.4. Report Delivery. Report delivery should be timely, to the correct client, and in a manner agreed upon by the client and the laboratory.
3.5. Specimen Storage. Specimens should be stored under appropriate conditions for a pre-established time period, as determined by specimen stability, laboratory policy and/or certification/accreditation requirements. Stained microscopic slides may be held indefinitely, whereas samples such as urine, whole blood, or cavity fluid have limited storage life. In general, avian hematology samples should not be stored (including transport) for longer than twelve hours while reptilian sample can be stored for 24 hours. Whole blood samples may be frozen to -20ºF for DNA analysis and -70ºF for RNA analysis. Samples in frost-free-freezers may be degraded by repeated freeze-thaw cycles.
3.6. Specimen Disposal. Laboratories should dispose of biohazardous and non-biohazardous materials and specimens appropriately and safely. This should include timely emptying of all containers and trash bins.
3.7. Personnel Safety – see Preanalytical recommendations 3.8. Laboratory Environment. Upon completion of a procedure, the laboratory space
should be cleaned and organized in preparation for subsequent procedures. Equipment should be well-maintained so that it will be ready at all times. See the Preanalytical section for additional recommendations.
3.9. Personnel Requirements – see Preanalytical section 3.10. Miscellaneous. Once analyses in the laboratory are complete, reagent and supply
inventory should be evaluated, and depleted items should be re-ordered. A well maintained inventory system and list of approved suppliers ensures that quality materials are available at all times.
2006 Revision: Finalized ACVP meeting, Monterey, CA, December 2009 33
References
Links www.aacc.org American Association for Clinical Chemistry; also found here the DACC -
Division of Animal Clinical Chemistry www.aavld.org American Association of Veterinary Laboratory Diagnosticians www.acvim.org American College of Veterinary Internal Medicine www.acvp.org Americal College of Veterinary Pathologists www.asvcp.org American Society for Veterinary Clinical Pathology www.avma.org American Veterinary Medical Association www.bloodgas.org www.clsi.org Clinical and Laboratory Standards Institute; formerly known as NCCLS www.esvcp.com European College/Society of Veterinary Clinical Pathology www.isacp.org International Society for Animal Clinical Pathology www.labtestsonline.org www.scireg.com Science & Regulatory Consultants www.sqa.org Society of Quality Assurance www.toxpath.org Society of Toxicologic Pathology www.westgard.com Westgard QC
Regulatory Agencies www.fda.gov US Food and Drug Administration www.cdc.gov/clia Clinical Laboratory Improvement Ammendments http://wwwn.cdc.gov/clia/regs/toc.aspx Current CLIA Regulations (2004) http://wwwn.cdc.gov/clia/pdf/42cfr493_2004.pdf Part 493 Laboratory Requirements http://www.gpoaccess.gov/cfr/index.html Alternative site for Part 493 (CFR)
Publications 1. Good Laboratory Practice Regulations for Nonclinical Laboratory Studies Guidelines.
Title 21 Code of Federal Register, subchapter A, part 58. Federal Drug Administration (FDA), US Dept. of Health and Human Services (USHHS) http://www.nal.usda.gov/awic/legislat/21cfr97.htm
2. Environmental Protection Agency, Good Laboratory Practice Standards: 40 CFR part 792 (Toxic Substance Control Act) http://law.justia.com/us/cfr/title40/40-31.0.1.1.3.html
3. Environmental Protection Agency, Expert in Laboratory Management; Quality Assurance/Control: 40 CFR part 160 (Federal Insecticide, Fungicide, and Rodenticide Act) http://www.intota.com/expert-consultant.asp?bioID=605165&perID=717458
4. Guidance for Industry, E6 Good Clinical Practice: Consolidated Guidance. USHHS-FDA. Covering recent topics such as Immunotoxicology Evaluation of Investigational New Drugs, General Principles of Software Validation, Bioanalytical Method Validation, and Part 11, Electronic Records; Electronic Signatures -- Scope and Application.
2006 Revision: Finalized ACVP meeting, Monterey, CA, December 2009 34
http://www.fda.gov/cder/guidance/959fnl.pdf 5. Guide for the Care and Use of Laboratory Animals. US Dept. of Health and Human
Services, Public Health Service, National Institutes of Health, NIH Publication No. 86-23, Revised 1996. http://www.nap.edu/catalog.php?record_id=5140
6. Office of Laboratory Animal Welfare website http://grants.nih.gov/grants/olaw/references/phspol.htm
Referenced Articles
1. Adcock D, Kressin D, Marlar RA. 1998. The effect of time and temperature variables on routine coagulation tests. Blood Coagul Fibrinolysis 9:463–470.
2. Adcock DM, Kressin DC, Marlar RA.1998. Minimum specimen volume requirements for routine coagulation testing: dependence of citrate concentration. Am J Clin Pathol 09:595–599.
3. Albasan H, Lulich JP, Osborne CA, et al. Effects of storage time and temperature on pH, specific gravity, and crystal formation in urine samples from dogs and cats. J Amer Vet Med Assoc 2003;222:176-179.
4. Allen TA, Jones RL, Purvance J. Micribiologic evaluation of canine urine: direct microscopic examination and preservation of specimen quality for culture.
5. Arnold, J. Hematology of the Sandbar shark, Carcharhinus plumbeus: standardization of complete blood count techniques for elasmobranchs. J Vet Clin Path; 2005; 34:115-123.
6. Arnold, J. White blood cell count discrepancies in Atlantic loggerhead sea turtles: Natt-Herrick vs. Eosinophil Unopette®. Proc Assoc Zoo Vet Tech Conf. 1994:15-26.
7. Arnold, J., Gargan, C, Belovarac, J. Method Validation Study for Total White Blood Cell Counts: Natt-Herrick versus Eosinophil Unopette ® Methods. Proc Assoc Zoo Vet Tech Conf. 2007: 49.
8. Bland JM, Altman DG. Statistical methods for assessing agreement between two methods of clinical measurement. Lancet 1986; i:307-310.
9. Bonini P, Plebani M, Ceriotti F, Rubboli F. 2002. Errors in laboratory medicine. Clin Chem 48:691–698.
10. Boral L, JB Henry. The Crossmatch. In: Clinical Diagnosis and Management by Laboratory Methods. Bernard and Henry, 18th ed. 1991.
11. Carter JM, Klausner JS, Osborne CA, Bates FY. Comparison of collection techniques for quantitative urine culture in dogs. J Amer Vet Med Assoc 1978;173(3):296-8.
12. Dale JC, Novis DA. 2002. Outpatient phlebotomy success and reasons for specimen rejection. Arch Pathol Lab Med 126:416–419.
13. Dein, FJ, Avian Leukocyte Counting Using the Hemacytometer, J Zoo Wild Anim Med; 1994; 25:3.
14. Fiebig EW, Etzell JE, Ng VL. 2005 Clinically relevant differences in prothrombin time and INR values related to blood sample collection in plastic vs glass tubes. Am J Clin Pathol 124:902–909.
15. Friedrichs KR, Young KM. Using an independent quality control software program, EZ Runs, to monitor quality control procedures for a bench-top coagulation analyzer. Veterinary Clinical Pathology 2005; 34(3):218-223
2006 Revision: Finalized ACVP meeting, Monterey, CA, December 2009 35
16. George JW. Refractometers in veterinary laboratory medicine: an historical and technical review. Vet Clin Pathol 2001;30:201-210.
17. Glick, M., Ryder, K., & Glick, S. Interferographs: User’s Guide to Interferences in Clinical Chemistry Instruments. 1991. Indianapolis, IN: Science Enterprises, Inc.
18. Goulden BE. Assessment of the usefulness of the examination of a gram smear of fresh uncentrifuged urine in the determination of significant bacteriuria in dogs. N Z Vet J 1968;16(1-2):1-2.
19. Harr KE, Raskin R, Heard DJ. 2005. Temporal Hematologic and Biochemical Effects of Three Commonly Used Anticoagulants on Macaw (Ara sp.) and Burmese Python (Python molurus bivittatus) Blood. Vet Clin Pathol. 34(4):383-388.
20. Hegstad-Davies, RL. 2006. A review of sample handling considerations for reproductive and thyroid hormone measurement in serum or plasma. Theriogenology. 66(3):592-598.
21. Hyloft-Peterson P, Stöckl D, Blaabjerg O, Petersen B, Birkemose E, Thenpont L, Flensted Lassen J, Kjeldsen J. Graphical itnerepretation of analytical data from comparison of a field method with a reference method by use of difference plots (opinion). Clinical Chemistry. 1997; 43:2039-2046.
22. Jensen AL, Kjelgaard-Hansen M. Method comparison in the clinical laboratory. Veterinary Clinical Pathology 2006; 35(3):276-286.
23. Kratz A, Stanganelli N, Van Cott EM.2006. A comparison of glass and plastic blood collection tubes for routine and specialized coagulation assays: a comprehensive study. Arch Pathol Lab Med 130:39–44.
24. Lippi, G, Franchini, Montagnana, M, et al., 2006. Quality and reliability of routine coagulation testing: can we trust that sample? Blood Coagula Fibrinolysis 17:1-7.
25. Natt MP, Herrick, CA. New blood diluent for counting the erythrocytes and leucocytes of the chicken. Poult Sci. 1952; 31:735-738.
26. Osborne CA, Stevens JB. Urinalysis: A clinical guide to compassionate patient care. Shawnee Mission, KS: Bayer Corporation;1999:17-24, 51-62, and 125-131.
27. Padilla J, Osborne CA, Ward GE. Effects of storage time and temperature on quantitative culture of canine urine. J Amer Vet Med Assoc 1981;178(10):1077-81.
28. Rabinovitch A, Arzoumanian L, Curcio KM, Dougherty B, Halim A. Urinalysis – approved guideline, 3rd ed. Clinical and Laboratory Standards Institute document GP16-A3, 2009.
29. Raskin RE, Murray KA, Levy JK. Comparison of home monitoring methods for feline urine pH measurement. Vet Clin Path 2002;31:51-55.
30. Stöckl D, Dewitte K, Thienpont M. Validity of linear regression in method comparison studies: limited by the statistical model of the quality of the analytical data? Clinical Chemistry. 1998; 44(11):2340-2346
31. Sturgess, CP, Hesford A, Owen H and Privett R. An investigation into the effects of storage on the diagnosis of crystalluria in cats. J Fel Med Surg 2001;3:81-85.
32. Swenson CL, Boisvert AM, Kruger JM, gibbons-Burgener SN. Evaluation of modified Wright-staining of urine sediment as a method for accurate detection of bacteriuria in dogs. J Amer Vet Med Assoc 2004;224(8):1282-9.
33. Tietz NW. A model for a comprehensive measurement system in clinical chemistry. Clinical Chemistry. 1979; 25(6):833-839.
34. Valenstein PN, Sirota RL. 2004. Identification errors in pathology and laboratory medicine. Clin Lab Med 24:979–996.
2006 Revision: Finalized ACVP meeting, Monterey, CA, December 2009 36
35. Westgard JO, Cary RN, Sold S. Criteria for judging precision and accuracy in method development and evaluation. Clinical Chemistry. 1974; 20(7):825-833.
Books/Chapters 1) Belford, C. and Lumsden, J.H. Cytopathology. In: Manual of Small Animal Clinical
Pathology. Davidson, M, Else, R.E. and Lumsden, J. (eds). British Small Animal V Veterinary Association, Cheltenham, 2998.
2) Bellamy JEC, Olexson DW. Quality Assurance Handbook for Veterinary Laboratories. Ames, IA. Iowa State University Press, 2000:101 pages total.
3) Burtis CA, Ashwood ER, Bruns D, eds. Tietz Textbook of Clinical Chemistry, 4th ed. Philadelphia, PA: WB Saunders Company; 2005.
4) Campbell, TW. Avian Hematology. In: Avian Hematology and Cytology. Ames, IA: Iowa State University Press; 1988:6-13.
5) Cowell RL, Tyler RD, Meinkoth JH and DeNicola D. Diagnostic Cytology and Hematology of the Dog and Cat, 3rd ed. St. Louis, MO: Mosby, Inc.; 2007.
6) Day M, Mackin A, Littlewood J, eds. Manual of Canine and Feline Haematology and Transfusion Medicine. Quedgeley, Gloucester, UK: British Small Animal Veterinary Association; 2000.
7) Feldman BF, Zinkl JG, Jain NC, ed. Schalm’s Veterinary Hematology 5th ed. Malden, MA; Blackwell; 2000.
8) Freeman, K.P. Veterinary Cytology: Dog, Cat, Horse and Cow. Manson Publishing/The Veterinary Press, London; 2008.
9) Fudge AM, ed. Laboratory Medicine: Avian and exotic pets. Philadelphia, PA: WB Saunders Company; 2000.
10) Harvey JW. Atlas of Veterinary Hematology: Blood and bone marrow of domestic animals. Philadelphia, PA: WB Saunders Company; 2001.
11) Hawkey, C. M, Clinical Laboratory Medicine: The value of clinical hematology in exotic birds, Exotic Animals, Jocobson, Kollias, Churchill Livingstone; 1988.
12) Kaneko JJ, Harvey JW, Bruss ML, eds. Clinical Biochemistry of Domestic Animals 6th ed. San Diego, CA: Academic Press; 2008.
13) Latimer KS, Mahaffey EA, Prasse KW. Veterinary Laboratory Medicine: Clinical Pathology 4th ed. Malden, MA; Wiley-Blackwell; 2003.
14) Linnet K, Boyd JC. Selection and analytical evaluation of methods—with statistical techniques. In Burtis CA, Ashwood ER, Bruns DE (eds.) Tietz Textbook of Clinical Chemistry and Molecular Diagnostics. 4th ed. Philadelphia, PA: Elsevier Inc.; 2006:353-407
15) Loeb WF, Quimby FW, eds. The Clinical Chemistry of Laboratory Animals 2nd ed. Philadelphia, PA: Taylor & Francis; 1999.
16) Meyer DJ, Harvey JW. Veterinary Laboratory Medicine: Interpretation & diagnosis. 2nd. ed. Philadelphia, PA: WB Saunders Company; 1998.
17) Osborne CA, Stevens JB. Urinalysis: A Clinical Guide to Compassionate Patient Care. Shawnee Mission, KS: Bayer Corporation, Agricultural Division, Animal Health; 1999.
18) Raskin RE, Meyer DJ. Atlas of Canine and Feline Cytology. Philadelphia, PA: WB Saunders Company; 2001.
2006 Revision: Finalized ACVP meeting, Monterey, CA, December 2009 37
19) Reagan WJ, DeNicola DB, Irizarry Rovira A. Veterinary Hematology: Atlas of common domestic species, 2nd ed. Malden, MA: Blackwell Publishing: 2008.
20) Stockham SL, Scott MA. Fundamentals of Veterinary Clinical Pathology, 2nd ed. Walden, MA: Wiley-Blackwell; 2008.
21) Thrall, MA et al. Veterinary Hematology and Clinical Chemistry. Philadelphia, PA: Lippincott Williams & Wilkins; 2004.
22) Westgard JO. Basic QC Practices Training in Statistical Quality Control for Healthcare Laboratories. 2nd ed. Madison, WI: Westgard QC, Inc.; 2002.
23) Westgard, JO. Method validation: the experimental plan. In: Westgard. JO, ed. Basic Method Validation, Madison, WI: Westgard QC; 1999:48-55.
24) Westgard JO, Klee GC. Quality management. In Burtis CA, Ashwood ER, Bruns DE (eds.) Tietz Textbook of Clinical Chemistry and Molecular Diagnostics. 4th ed. Philadelphia, PA: Elsevier Inc.; 2006:485-529.
25) (a)Westgard JO, Quam E. Method validation: the linearity or reportable range experiment. In Westgard JO (ed.) Basic Method Validation, 3rd ed. Madison, WI: Westgard QC, Inc.; 2008:102-112. (b)Westgard JO. Method validation: the decision on method performance. In Westgard JO (ed.). Basic Method Validation. 3rd edition. Madison, WI: Westgard QC, Inc.; 2008:188-196. (c)Westgard JO. Method validation: the replication experiment. In Westgard JO (ed.) Basic Method Validation. 3rd ed. Madison, WI: Westgard QC, Inc.; 2008:114-122. (d)Westgard JO. Method validation: the comparison of methods experiment. In Westgard JO (ed.). Basic Method Validation. 3rd ed. Madison, WI: Westgard QC, Inc.; 2008:124-136. (e)Westgard JO. Method validation: statistical sense, sensitivity, and significance. In Westgard JO (ed.). Basic Method Validation. 3rd ed. Madison WI: Westgard QC, Inc.; 2008:138-152. (f)Westgard JO. Method validation: the interference and recovery experiments. In Basic Method Validation. 3rd ed. Madison, WI: Westgard QC, Inc.; 2008:154-166. (g)Westgard JO. Method validation: the detection limit experiment. In Westgard JO (ed.) Basic Method Validation. 3rd ed. Madison, WI: Westgard QC, Inc.; 2008:168-176.
26) Westgard JO. What are control materials and what characteristics are important? In Westgard JO (ed.) Basic QC Practices. 1st ed. Madison,WI: Westgard QC, Inc.;1998:33-46.
27) Wied, G. L., Bibbo, M. and Keeb ler, C.M. Diagnostic Quality Assurance in C Cytopathology. In: Comprehensive Cytopathology, 2nd ed. Bibbo, M. (ed). W.B. Saunders Co, London, 1997.
Journals – General References which frequently contain relevant quality assurance information.
1) Clinical Chemistry, official publication of the American Association of Clinical Chemistry
2) Journal of Feline Medicine Surgery 3) Journal of the American Veterinary Medical Association 4) Journal of Veterinary Diagnostic Investigation, official publication of the American
Association of Veterinary Laboratory Diagnosticians
2006 Revision: Finalized ACVP meeting, Monterey, CA, December 2009 38
5) New Zealand Veterinary Journal 6) Toxicologic Pathology, official publication of the Society of Toxicologic Pathology 7) Veterinary Clinical Pathology, official publication of the American Society for
Veterinary Clinical Pathology and the European Society for Veterinary Clinical Pathology
8) Veterinary Pathology, official publication of the American College of Veterinary Pathologists
2006 Revision: Finalized ACVP meeting, Monterey, CA, December 2009 39
Contributors to the original guidelines and past and present members of the Quality Assurance and Standards Committee Dr. Jim Bellamy Pat Benson Karen Curd Dr. Jean Dodds Dr. Ellen Evans Dr. Susan Friend Sue Gallagher Karen Getzy Julie Gruenwaldt Dr. James Klaassen Dr. Sally Lester Dr. Peter Lording Dr. John Lumsden Mike Mahoney Dr. Larry McGill Dr. Joanne Messick Pam Miller Dr. Scott Moroff Dr. Fran Moore Loretta Moore Dr. Karen Russel Dr. Carolyn Sink Dr. Linda Vap Dr. Gail Walter Dr. Ellen Ziemer Current and past members contributing to the revisions and additions to these Guidelines, 2008 Jill Arnold Kirstin Barnhart Julia Blanco Rebecca Davies Deborah Davis Bente Flatland Kathy Freeman Kristen Friedrichs Rebekah Gunn-Christie Kendal Harr Helen Kocmarek David Korcal Jim Matthews Joanne Messick Renee Pearson
2006 Revision: Finalized ACVP meeting, Monterey, CA, December 2009 40
Shannon Pedersen Connie Peterson Kristiina Ruotsala Lynne Shanahan Balazs Szladovits Linda Vap
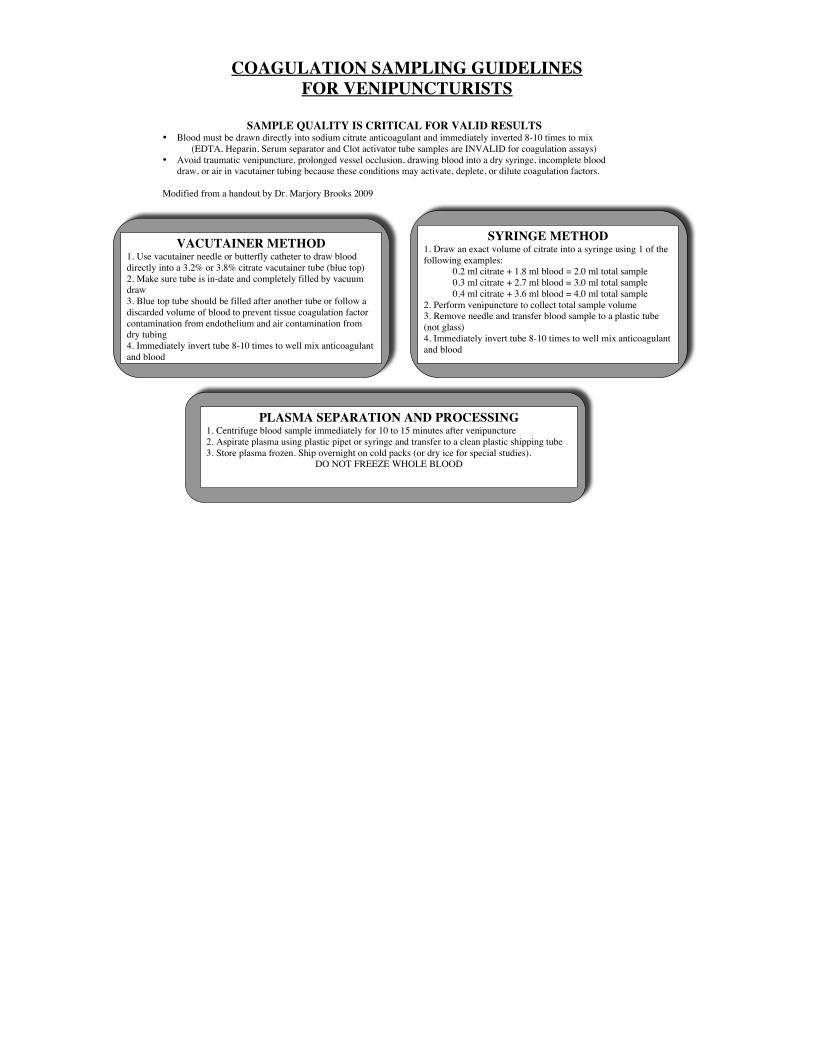
COAGULATION SAMPLING GUIDELINES FOR VENIPUNCTURISTS
VACUTAINER METHOD 1. Use vacutainer needle or butterfly catheter to draw blood directly into a 3.2% or 3.8% citrate vacutainer tube (blue top) 2. Make sure tube is in-date and completely filled by vacuum draw 3. Blue top tube should be filled after another tube or follow a discarded volume of blood to prevent tissue coagulation factor contamination from endothelium and air contamination from dry tubing 4. Immediately invert tube 8-10 times to well mix anticoagulant and blood
SYRINGE METHOD 1. Draw an exact volume of citrate into a syringe using 1 of the following examples: 0.2 ml citrate + 1.8 ml blood = 2.0 ml total sample 0.3 ml citrate + 2.7 ml blood = 3.0 ml total sample 0.4 ml citrate + 3.6 ml blood = 4.0 ml total sample 2. Perform venipuncture to collect total sample volume 3. Remove needle and transfer blood sample to a plastic tube (not glass) 4. Immediately invert tube 8-10 times to well mix anticoagulant and blood
PLASMA SEPARATION AND PROCESSING 1. Centrifuge blood sample immediately for 10 to 15 minutes after venipuncture 2. Aspirate plasma using plastic pipet or syringe and transfer to a clean plastic shipping tube 3. Store plasma frozen. Ship overnight on cold packs (or dry ice for special studies).
DO NOT FREEZE WHOLE BLOOD
SAMPLE QUALITY IS CRITICAL FOR VALID RESULTS • Blood must be drawn directly into sodium citrate anticoagulant and immediately inverted 8-10 times to mix (EDTA, Heparin, Serum separator and Clot activator tube samples are INVALID for coagulation assays) • Avoid traumatic venipuncture, prolonged vessel occlusion, drawing blood into a dry syringe, incomplete blood
draw, or air in vacutainer tubing because these conditions may activate, deplete, or dilute coagulation factors. Modified from a handout by Dr. Marjory Brooks 2009