
Astronomy c ESO 2016 Astrophysics - University of …atreya/Articles/2016AA_Mars... · Astrophysics...
12
A&A 586, A62 (2016) DOI: 10.1051/0004-6361/201527018 c ESO 2016 Astronomy & Astrophysics A map of D/H on Mars in the thermal infrared using EXES aboard SOFIA T. Encrenaz 1 , C. DeWitt 2 , M. J. Richter 2 , T. K. Greathouse 3 , T. Fouchet 1 , F. Montmessin 4 , F. Lefèvre 4 , F. Forget 5 , B. Bézard 1 , S. K. Atreya 6 , M. Case 2 , and N. Ryde 7 1 LESIA, Observatoire de Paris, CNRS, PSL, UPMC, UPD, 92195 Meudon, France e-mail: [email protected] 2 Dept. of Physics, University of California Davis, CA 95616, USA 3 SwRI, Div. 15, San Antonio, TX 78228, USA 4 LATMOS, IPSL, 75252 Paris Cedex 05, France 5 LMD, IPSL, 75252 Paris Cedex 05, France 6 Dept. of Atmospheric, Oceanic & Space Sciences, University of Michigan, Ann Arbor, MI 48109-2143, USA 7 Department of Astronomy and Theoretical Physics, Lund Observatory, Lund University, Box 43, 221 00 Lund, Sweden Received 21 July 2015 / Accepted 30 November 2015 ABSTRACT On a planetary scale, the D/H ratio on Mars is a key diagnostic for understanding the past history of water on the planet; locally, it can help to constrain the sources and sinks of water vapor through the monitoring of condensation and sublimation processes. To obtain simultaneous measurements of H 2 O and HDO lines, we have used the Echelle Cross Echelle Spectrograph (EXES) instrument aboard the Stratospheric Observatory for Infrared Astronomy (SOFIA) facility to map the abundances of these two species over the Martian disk. High-resolution spectra (R = 6 × 10 4 ) were recorded in the 1383-1390 cm -1 range (7.2 μm) on April 08, 2014. Mars was very close to opposition and near northern summer solstice (Ls = 113 ◦ ). Maps of the H 2 O and HDO mixing ratios were retrieved from the line depth ratios of weak H 2 O and HDO transitions divided by a weak CO 2 line. As expected for this season, the H 2 O and HDO maps show a distinct enhancement toward polar regions, and their mixing ratios are consistent with previous measurements and with predictions by the global climate models, except at the north pole where the EXES values are weaker. We derive a disk- integrated D/H ratio of 6.8 (+1.6, -1.0) × 10 -4 . It is higher than the value in Earth’s oceans by a factor 4.4 (+1.0, -0.6). The D/H map also shows an enhancement from southern to northern latitudes, with values ranging from about 3.5 times to 6.0 times the VSMOW (Vienna standard mean ocean water) value. The D/H distribution shows a depletion over the Tharsis mountains and is consistent with observed latitudinal variations. The variations in D/H with latitude and altitude agree with the models and with the isotope fractionation expected from condensation and sublimation processes. Key words. planets and satellites: atmospheres – planets and satellites: composition – planets and satellites: terrestrial planets – infrared: planetary systems 1. Introduction Measuring the D/H ratio in the Martian atmosphere is important for two reasons. On a global scale, the disk-integrated estimate of this ratio, compared with its value in past measurements in the most ancient SNC meteorites and/or in clays at the Martian surface is a tracer of the abundance of the early content of water on Mars (Greenwood et al. 2008; Mahaffy et al. 2015). Indeed, the main mechanism responsible for the deuterium enrichment in the Martian atmosphere is expected to be fractionation through differential escape rates, the HDO molecule being heavier than H 2 O and confined at low altitude by condensation (Bertaux & Montmessin 2001). The HDO molecule was first detected on Mars by Owen et al. (1988) who from near-infrared ground-based observations inferred a disk-averaged ratio for D/H in water enriched by a factor of 6+/-3 relative to the value in Earth’s oceans (the VSMOW is 1.556 × 10 -4 ). The second measurement of D/H in Mars water (from the Kuiper Airborne Observatory) sampled CO 2 , HDO, and H 2 O simultaneously in the 2.7 μm region and found that D/H was enriched by a factor of 5.2+/-0.2 relative to the VSMOW (Bjoraker et al. 1989). Again in the near-infrared range, Krasnopolsky et al. (1997) inferred a D/H enrichment of 5.2+/-2.0 times the VSMOW. Encrenaz et al. (1991, 2001) de- tected HDO in the millimeter range and derived a D/H ratio of six (+6, -3) times the VSMOW in the northern hemisphere at northern summer solstice. Attempts to map D/H on Mars as a function of location, al- titude, and season were reported by Mumma et al. (2003) us- ing data from 1997 through 2000 and by Novak et al. (2011) using data obtained from 2008 to 2010. They were completed by Villanueva et al. (2015), who mapped D/H over a broad lati- tude range between the northern spring equinox and the northern summer solstice. From data obtained between 2007 and 2015, Krasnopolsky (2015) also recorded latitudinal variations of D/H for different times around northern spring. As discussed by Owen et al. (1988) and Owen (1992), a deu- terium enrichment of 5 × VSMOW or greater, compared to the terrestrial value, requires the destruction and escape of most of the water originally present on the Martian surface. This process, however, would imply that the early hydrogen escape was much faster than observed today (McElroy et al. 1977). Another open question is related to the very large amount of liquid water appar- ently required to account for the erosional features observed on Article published by EDP Sciences A62, page 1 of 12
Transcript of Astronomy c ESO 2016 Astrophysics - University of …atreya/Articles/2016AA_Mars... · Astrophysics...

A&A 586, A62 (2016)DOI: 10.1051/0004-6361/201527018c© ESO 2016
Astronomy&
Astrophysics
A map of D/H on Mars in the thermal infrared using EXES aboardSOFIA
T. Encrenaz1, C. DeWitt2, M. J. Richter2, T. K. Greathouse3, T. Fouchet1, F. Montmessin4, F. Lefèvre4, F. Forget5,B. Bézard1, S. K. Atreya6, M. Case2, and N. Ryde7
1 LESIA, Observatoire de Paris, CNRS, PSL, UPMC, UPD, 92195 Meudon, Francee-mail: [email protected]
2 Dept. of Physics, University of California Davis, CA 95616, USA3 SwRI, Div. 15, San Antonio, TX 78228, USA4 LATMOS, IPSL, 75252 Paris Cedex 05, France5 LMD, IPSL, 75252 Paris Cedex 05, France6 Dept. of Atmospheric, Oceanic & Space Sciences, University of Michigan, Ann Arbor, MI 48109-2143, USA7 Department of Astronomy and Theoretical Physics, Lund Observatory, Lund University, Box 43, 221 00 Lund, Sweden
Received 21 July 2015 / Accepted 30 November 2015
ABSTRACT
On a planetary scale, the D/H ratio on Mars is a key diagnostic for understanding the past history of water on the planet; locally,it can help to constrain the sources and sinks of water vapor through the monitoring of condensation and sublimation processes. Toobtain simultaneous measurements of H2O and HDO lines, we have used the Echelle Cross Echelle Spectrograph (EXES) instrumentaboard the Stratospheric Observatory for Infrared Astronomy (SOFIA) facility to map the abundances of these two species over theMartian disk. High-resolution spectra (R = 6 × 10⁴) were recorded in the 1383−1390 cm−1 range (7.2 µm) on April 08, 2014. Marswas very close to opposition and near northern summer solstice (Ls = 113◦). Maps of the H2O and HDO mixing ratios were retrievedfrom the line depth ratios of weak H2O and HDO transitions divided by a weak CO2 line. As expected for this season, the H2O andHDO maps show a distinct enhancement toward polar regions, and their mixing ratios are consistent with previous measurementsand with predictions by the global climate models, except at the north pole where the EXES values are weaker. We derive a disk-integrated D/H ratio of 6.8 (+1.6, −1.0) × 10−4. It is higher than the value in Earth’s oceans by a factor 4.4 (+1.0, −0.6). The D/H mapalso shows an enhancement from southern to northern latitudes, with values ranging from about 3.5 times to 6.0 times the VSMOW(Vienna standard mean ocean water) value. The D/H distribution shows a depletion over the Tharsis mountains and is consistentwith observed latitudinal variations. The variations in D/H with latitude and altitude agree with the models and with the isotopefractionation expected from condensation and sublimation processes.
Key words. planets and satellites: atmospheres – planets and satellites: composition – planets and satellites: terrestrial planets –infrared: planetary systems
1. Introduction
Measuring the D/H ratio in the Martian atmosphere is importantfor two reasons. On a global scale, the disk-integrated estimateof this ratio, compared with its value in past measurements inthe most ancient SNC meteorites and/or in clays at the Martiansurface is a tracer of the abundance of the early content of wateron Mars (Greenwood et al. 2008; Mahaffy et al. 2015). Indeed,the main mechanism responsible for the deuterium enrichment inthe Martian atmosphere is expected to be fractionation throughdifferential escape rates, the HDO molecule being heavier thanH2O and confined at low altitude by condensation (Bertaux &Montmessin 2001).
The HDO molecule was first detected on Mars by Owenet al. (1988) who from near-infrared ground-based observationsinferred a disk-averaged ratio for D/H in water enriched bya factor of 6+/−3 relative to the value in Earth’s oceans (theVSMOW is 1.556 × 10⁻⁴). The second measurement of D/Hin Mars water (from the Kuiper Airborne Observatory) sampledCO2, HDO, and H2O simultaneously in the 2.7 µm region andfound that D/H was enriched by a factor of 5.2+/−0.2 relative tothe VSMOW (Bjoraker et al. 1989). Again in the near-infrared
range, Krasnopolsky et al. (1997) inferred a D/H enrichment of5.2+/−2.0 times the VSMOW. Encrenaz et al. (1991, 2001) de-tected HDO in the millimeter range and derived a D/H ratio ofsix (+6,−3) times the VSMOW in the northern hemisphere atnorthern summer solstice.
Attempts to map D/H on Mars as a function of location, al-titude, and season were reported by Mumma et al. (2003) us-ing data from 1997 through 2000 and by Novak et al. (2011)using data obtained from 2008 to 2010. They were completedby Villanueva et al. (2015), who mapped D/H over a broad lati-tude range between the northern spring equinox and the northernsummer solstice. From data obtained between 2007 and 2015,Krasnopolsky (2015) also recorded latitudinal variations of D/Hfor different times around northern spring.
As discussed by Owen et al. (1988) and Owen (1992), a deu-terium enrichment of 5 × VSMOW or greater, compared to theterrestrial value, requires the destruction and escape of most ofthe water originally present on the Martian surface. This process,however, would imply that the early hydrogen escape was muchfaster than observed today (McElroy et al. 1977). Another openquestion is related to the very large amount of liquid water appar-ently required to account for the erosional features observed on
Article published by EDP Sciences A62, page 1 of 12

A&A 586, A62 (2016)
the surface of Mars. These results have been discussed by severalauthors (Carr 1986, 1990, 1996; Jakosky 1990; Krasnopolskyet al. 1997; Lasue et al. 2013; Wordsworth et al. 2015).
In their recent analysis, Villanueva et al. (2015) estimate thewater amount contained in the initial reservoir MP using the fol-lowing equation:
MP/MC = [IC/IP] exp[1/(1 − f )]
where MC is the current water reservoir, IP and IC are the initialand current isotopic ratios, respectively, and f is the fractiona-tion escape rate. Using f = 0.02 from Lyα measurements byKrasnopolsky et al. (1998), IC = 8 and IP = 1.275 (using theSNC meteorite analysis of Usui et al. 2012), the authors derive[IP/IC] = 6.4. Using for MC, a value of 21 m GEL (global equiv-alent layer) inferred from the polar layered deposits by Zuberet al. (1998) and Plaut et al. (2007), they derive an initial waterreservoir of 137 m GEL. This result is consistent with the ideaof an ancient northern ocean covering about 20% of the Martiansurface, as also suggested by the MARSIS radar observations ofMars Express (Mouginot et al. 2012).
Another estimate of the lost water is derived byKrasnopolsky (2015), who infers a value of 80 m GEL froman update of earlier analyses (Krasnopolsky & Feldman 2001;Krasnopolsky 2002). Krasnopolsky (2015) also suggests that,because the liquid water ocean may be insufficient to drivehydrodynamical escape, another more efficient hydrodynami-cal mechanism could be the escape of hydrogen released inthe reaction of water with iron just after the planet’s accre-tion. Using a fractionation factor of 0.8 in this case (Zahnleet al. 1990), an initial water abundance of 1200 m is in-ferred by Krasnopolsky (2015), confirming an earlier analysisby Krasnopolsky & Feldman (2001).
An important result is the measurement by the SAM (sam-ple analysis at Mars) experiment aboard the Curiosity roveron ancient clays, aged about 3 Ga. The inferred D/H value,3.0+/−0.2 times the VSMOW (Mahaffy et al. 2015), is inter-mediate between the primordial and present values, which sug-gests a continuous hydrogen escape over the history of theplanet. However, the analysis of ancient SNC meteorites (inparticular D/H = 4 VSMOW in ALH84001, aged over 4 Gy;Greenberg et al. 2008) instead suggested an early massive out-gassing (Boctor et al. 2003; Greenwood et al. 2008). Thus, thehistory of water outgassing on Mars is still an open question.
On a local scale, the measurement of D/H on Mars as a func-tion of altitude, location, and season can provide important con-straints on the mechanisms responsible for the sources and sinksof water vapor on the Martian surface. The main mechanismis the so-called vapor pressure isotopic effect (VPIE), a frac-tionation mechanism associated with condensation/sublimationprocesses. At thermochemical equilibrium, the HDO/H2O ratioin ice, as compared with the gas phase, decreases as tempera-ture increases (Merlivat & Leaf 1967). At condensation, D/H isthus enriched in the ice phase, as compared with the gas phase.The D/H ratio in water vapor is expected to be maximum at thenorth pole at northern summer solstice, following the massiveoutgassing of the northern water ice cap. In the same way, this ra-tio is expected to increase with the water vapor content and withthe temperature, as condensation effects are minimized in thiscase. This behavior has been modeled by Fouchet & Lellouch(2000) and introduced in the GCM by Montmessin et al. (2005).The positive correlation of D/H with the temperature and thewater vapor content has been confirmed by the observations ofVillanueva et al. (2015) and Krasnopolsky (2015).
Ground-based observations of Mars water are limitedto times of adequate Doppler shift (generally greater than10 km s−1), but also permit much higher angular resolution andmore frequent observations than are feasible with airborne ob-servatories. On the other hand, they cannot be performed nearopposition when the size of Mars is maximum, since the Dopplershift is then close to zero. The high-resolution cross-dispersedinfrared spectrometers permit simultaneous detections and map-ping of multiple species, including CO2, H2O, and HDO. Inparticular, the Echelon Cross Echelle Spectrograph (EXES)instrument aboard the Stratospheric Observatory for InfraredAstronomy (SOFIA) facility offers this possibility.
We used this instrument during its commissioning flight onApril 8, 2014. A short spectral interval at 1383−1390 cm−1
(7.2 µm) was recorded over the Martian disk at high spectralresolution (R = 6 × 10⁴). The line depths of weak transitions ofH2O and HDO were divided by the line depth of a weak CO2transition in order to retrieve the H2O and HDO mixing ratiosover the Martian disk. Such a method was successfully usedwith the Texas Echelon Cross Echelle Spectrograph (TEXES)instrument, mounted at the InfraRed Telescope Facility (IRTF),to retrieve the H2O2 and HDO mixing ratios on Mars (Encrenazet al. 2004, 2012, 2015). The D/H ratio is derived by ratioing theHDO and H2O mixing ratios, taking into account that the D/H ra-tio is one-half of the HDO/H2O value. In this specific case, theanalysis can be done independently of the atmospheric structureretrieval. Indeed it has been shown (Encrenaz et al. 2015) that,for all thermal profiles expected during daily conditions (whichcorresponds to the EXES observations), the line depth ratios (ortheir equivalent widths, which give a similar result) provide agood estimate of the mixing ratio of the two species considered;thus, measuring the line depth ratio (or the equivalent width)HDO/H2O leads to a good estimate of D/H. In our analysis, how-ever, we also get estimates of the H2O/CO2 and HDO/CO2 mix-ing ratios independently, in order to check the consistency of ourresults with respect to previous observations and models.
In this paper, we present the analysis of the EXES spectraof Mars. Section 2 describes the observations and the radiativetransfer model used in our analysis. Section 3 describes the re-trieval of the terrestrial atmospheric transmission associated withour observations, a key parameter in our retrieval of the mix-ing ratios of H2O and HDO on Mars. The results are presentedin Sect. 4. The validity of the linearity method is discussed inSect. 5, and uncertainties are estimated in Sect. 6. Our resultsare discussed in Sect. 7 and compared with other observationsand models.
2. Observations and modeling
2.1. Observations
EXES is an infrared imaging spectrometer derived from theTEXES instrument in operation at the NASA IRTF (Lacyet al. 2002). EXES operates between 4.5 and 28.3 µm(350−2220 cm−1) in three different modes: high resolution (R =50 000−100 000), medium resolution (R = 5000−20 000), andlow resolution (R = 1000−3000). The instrument is equippedwith a 1024 × 1024 Si:As detector array. The high-resolutionmode is provided by a steeply blazed aluminum reflection grat-ing used as an echelon, associated with an echelle grating tocross-disperse the spectrum (Richter et al. 2010).
We selected the 1383−1390 cm−1 interval because it containsboth weak and strong transitions of H2O, HDO, and CO2. Weused the instrument in the high-resolution mode. Observations
A62, page 2 of 12

T. Encrenaz et al.: A map of D/H on Mars
EXES data Model CO2
Model HDO Model H2O Standard atmospheric transmission (shi8ed by -‐ 0.3)
Fig. 1. Spectrum of Mars between 1383.5 and 1390.0 cm−1 (thick blackline), integrated over the Martian disk, recorded with EXES (Ls = 113◦,normalized radiance). Synthetic models of the Martian atmosphere:contributions from CO2 (purple), H2O (300 ppmv, blue), and HDO(467 ppbv, green). Thin black line (in absolute units shifted by −0.30):standard transmission from the terrestrial atmosphere, computed withthe EXES model. The EXES spectrum shows an offset of 0.1 in thecore of the strong water line at 1387.5 cm−1, while the terrestrial atmo-spheric transmission is expected to be zero at this frequency.
of Mars took place on April 8, 2014. SOFIA was flying at analtitude of 11.58 km. Mars was very close to opposition with adiameter of 15.07 arcsec, an illumination factor of 99.98%, anda Doppler velocity of −2.70 km s−1. The season was just afternorthern summer solstice (Ls = 113◦), corresponding to a maxi-mum amount of water vapor in the northern region. The latitudeand longitude of the disk center were 21.6 N and 205.0 E, respec-tively. The coordinates of the subsolar point were 23.0 N and204.8 E. It must be noted that, unfortunately, the image qualityof the SOFIA telescope is limited to about 3 arcsec. The im-age quality of 3 arcsec implies a longitudinal resolution of about25 deg at the sub-Earth point. The slit was oriented at a posi-tion angle of 332 east of north and had a length of 14.2 arc-sec (0.206 arcsec/pix) and a width of 1.44 arcsec. Because ofthe large size of the planet, we recorded two successive maps ofopposite hemispheres of Mars that included significant overlap.The first scan was taken between 05:03:02 and 05:11:00 UTCwith an initial offset from disk center of 8.16 arcsec W and7.68 arcsec N. The scan was then performed taking 35 stepsat 0.38 arcsec E and 0.55 arcsec S per step. The second scanwas taken between 05:13:34 and 05:21:28 UTC with an initialoffset from disk center of 3.12 arcsec W and 12.63 arcsec Nand the same number and spacing for the steps as the first map.The final pixel size is 1.25 arcsec, i.e. more than twice smallerthan the image quality of the SOFIA telescope. At 1387 cm−1,the Doppler velocity of Mars corresponds to a Doppler shift of0.0125 cm−1, slightly smaller than the spectral resolution in thebest case (0.0139 cm−1).
Figure 1 shows the disk-integrated spectrum of Marsbetween 1383 and 1390 cm−1. Synthetic spectra of Mars includ-ing CO2, H2O, and HDO are shown for comparison with a stan-dard spectrum of the terrestrial atmospheric transmission, calcu-lated for SOFIA observations. It can be seen that the spectrumof Mars is dominated by a regular series of CO2 doublets. Twostrong telluric absorption features due to H2O (with a weak con-tribution of HDO) at 1386.5 cm−1 and 1387.5 cm−1 are superim-posed on the Mars spectrum. Between 1387.8 and 1389.2 cm−1,
EXES data Model CO2 Model HDO (D/H=5) Model H2O (300 ppm) Atmospheric transmission (shi>ed by + 0.2)
HDO CO2 H2O CO2 HDO CO2
l l l l l l l l l
Fig. 2. Spectrum of Mars between 1387.8 and 1390.0 cm−1 (thick blackline), integrated over the Martian disk, recorded with EXES (Ls =113◦, normalized radiance). Synthetic models of the Martian atmo-sphere: contributions from CO2 (purple), H2O (300 ppmv, blue), HDO(467 ppbv, green). The EXES spectrum and the models are enlarge-ments of Fig. 1. Thin black line (in absolute units shifted by +0.20):standard transmission from the terrestrial atmosphere computed withthe EXES model.
weak isolated lines of H2O and HDO appear in the Mars spec-trum (Fig. 2). In the center of the strong H2O lines at 1386.5 and1387.5 cm−1, the EXES spectrum of Mars is completely domi-nated by the terrestrial absorption (Fig. 1). For this reason, weselected the 1387.8−1389.2 cm−1 for our analysis of the H2Oand HDO mixing ratios.
Figure 1 shows that the flux of the EXES spectrum in thecore of the strong H2O line at 1387.5 cm−1 is not equal to zero,while the terrestrial atmosphere is expected to be fully opaqueat this frequency. This residual flux might be due to scatteredlight within the EXES instrument. In the present study, we re-move it from the EXES spectra for comparison with the Martiansynthetic spectra.
The retrieval of the H2O and HDO mixing ratios on Marscritically depends upon the precise measurement of the terres-trial absorption contribution in the weak transitions used in ouranalysis. To obtain a precise measurement of the terrestrial con-tribution in these H2O and HDO lines, we model the Earth’s at-mosphere and adjust the terrestrial temperature, pressure, andwater content to obtain the best fit of the strong terrestrial ab-sorption at 1386−1388 cm−1. This method can be used because(1) H2O is the main absorber in the telluric absorption; and (2)in this spectral range, the contribution of the Martian spectrumis very small as compared to the terrestrial absorption. For com-parison with the EXES data, we use the integrated spectrum ofMars shown in Figs. 1 and 2 (after removal of the scattered com-ponent), in order to optimize its signal-to-noise ratio. The inte-grated spectrum can be used for this purpose because the terres-trial opacity is not expected to vary over the Martian disk.
2.2. Atmospheric modeling
To model the Martian synthetic spectrum, we use the ra-diative transfer code developed for our analysis of theTEXES data of Mars (Encrenaz et al. 2004, 2012, 2015).Spectroscopic data are extracted from the GEISA moleculardatabase (Jacquinet-Husson et al. 2008). In the case of CO2, the
A62, page 3 of 12

A&A 586, A62 (2016)
Table 1. Spectroscopic parameters of the H2O and HDO transitions used for the D/H retrieval.
Molecule Wavenumber QN(band) QN(line) S E Broad. coef. n
(cm−1) (cm mol−1) (cm−1) (cm−1 atm−1)H2O 1388.484 010 000 615 642 1.68 × 10⁻²² 757.8 0.105 0.46HDO 1387.976 010 000 000 101 7.10 × 10⁻²⁴ 15.5 0.206 0.69HDO 1389.128 010 000 313 312 2.52 × 10⁻²⁴ 116.5 0.192 0.67CO2 1388.187 100 01 000 01 R15E 4.09 × 10⁻²⁶ 90.9 0.102 0.68CO2 1388.950 100 01 000 01 R16E 4.09 × 10⁻²⁶ 103.0 0.101 0.68
self-broadening coefficients of the lines are given in the GEISAtable. To account for their variation in temperature, we use thecalculations of Rosenmann et al. (1988). In the case of H2O andHDO, we use their broadening coefficients by CO2 and theirtemperature dependences as described in Delaye et al. (1989).Table 1 shows the spectroscopic parameters of weak transitionsof CO2, H2O and HDO in the 1387.8−1389.2 cm−1 range thatare used in our calculations to map the species and to fit thespectra. As shown in Fig. 2, there is one available H2O lineat 1388.48 cm−1, and there are two available HDO lines, at1387.98 cm−1 and at 1389.13 cm−1. At the positions of the twoHDO lines, our inferred transmission function indicates compa-rable absorptions; however, the standard atmospheric transmis-sion curve indicates a stronger absorption at 1387.98 cm−1 thanat 1389.13 cm−1, which indicates the possible presence of an-other contribution in the Earth atmosphere. Indeed, the EXESspectra show that the HDO line at 1387.98 cm−1 is systemati-cally stronger than the other HDO line. For this reason, we adoptthe HDO line at 1389.13 cm−1 in the following analysis. ForCO2, we use the weak transition at 1388.95 cm−1, between theH2O and HDO transitions selected for our analysis.
To correct the terrestrial absorption contribution in our spec-tra, we first consider the disk-integrated spectrum of Mars. Formodeling this spectrum, we use the same temperature profile asEncrenaz et al. (2015) used for modeling the TEXES observa-tions of March 1, 2014 (Ls = 96◦); indeed, the GCM predictionsat the disk center are very similar between March 1 and April 8.In this thermal profile, temperatures are 230 K, 170 K, and 145 Kat altitude levels of 0 km, 20 km, and 40 km, respectively, withan isothermal profile above 40 km. We then adjust the surfacepressure and temperature on Mars to obtain the best fit in theCO2 lines of the EXES disk-integrated spectrum, because theselines are not affected by telluric contamination (Figs. 1 and 2).The derived disk-averaged surface pressure and surface bright-ness temperature on the surface of Mars are 6 mb and 255 K, re-spectively. It must be noted that these parameters, averaged overthe Martian disk, are simply used to model the disk-integratedspectrum of Mars. The Martian atmospheric profile used in ourmodeling is not the only one that fits the CO2 spectral lines but,as discussed in Encrenaz et al. (2015), the exact retrieval of thetrue Martian profile is not needed for our analysis, because itdoes not affect the line depth ratios as long as the CO2 Martianlines are properly fitted. We also use the CO2 lines to determinethe spectral resolution of our data. Figure 3 shows different pro-files (Gaussian and sinc2) with FWHM values of 0.024 cm−1
and 0.028 cm−1. We note that none of them is fully adapted tothe EXES data because the EXES instrumental function exhibitsbroader wings. As a best fit, we use a FWHM of 0.024 cm−1, cor-responding to a resolving power of about 60 000 with a Gaussianprofile (almost identical to the sinc2 function).
In our nominal model of the disk-integrated spectrum ofMars (Figs. 1 and 2), we use, as a first try, mixing ratios of
0.5
0.6
0.7
0.8
0.9
1
1.1
1.2
1388.1 1388.15 1388.2 1388.25 1388.3 1388.35
Nor
mal
ized
radi
ance
Wavenumber (cm-1)
Fig. 3. Spectrum of Mars between 1388.10 and 1388.35 cm−1 (thickblack line), integrated over the Martian disk, recorded with EXES (Ls =113◦, normalized radiance). Synthetic models of the Martian atmo-sphere with the CO2 contribution for a FWHM value of 0.028 cm−1 witha Gaussian profile (green), a FWHM of 0.024 cm−1 with a Gaussianprofile (red) and a FWHM of 0.024 cm−1 with a sinc2 profile (blue).The two profiles with FWHM = 0.024 cm−1 are almost identical. TheFWHM of 0.024 cm−1 with a Gaussian shape is adopted in our analysis.
300 ppmv for H2O and 467 ppbv for HDO, corresponding toa Martian D/H of 5 (Encrenaz et al. 2015). Then, we divide theobserved disk-integrated EXES spectrum by this model, and weadjust the parameters of the terrestrial absorption model to ob-tain the best fit in the regions of strong terrestrial absorption,where the contribution of Mars is almost negligible (see below,Sect. 3). Then, we multiply the inferred terrestrial transmissionfunction with the Martian synthetic models for comparison withthe EXES spectra and determination of the H2O and HDO mix-ing ratios (see below).
3. Retrieval of the terrestrial atmospherictransmission
Two main factors determine the shape of the terrestrial atmo-spheric transmission in the H2O and HDO absorptions: the pres-sure level above which the calculation is made, and the watervertical distribution above this level. We calculated a grid ofspectra for different values of these parameters, and we com-pared the product of these curves with our nominal model ofMars to compare with the disk-integrated EXES spectrum ofMars. Calculations were done at high resolution (with a stepof 0.001 cm−1), taking the Doppler shift of Mars into account,and were convolved at the EXES spectral resolution for com-parison with the EXES disk-integrated spectrum. The best fittransmission curve is shown in Fig. 4, compared with the stan-dard transmission shown in Figs. 1 and 2. This transmission
A62, page 4 of 12

T. Encrenaz et al.: A map of D/H on Mars
Standard transmission func/on
Retrieved transmission func/on for EXES data
0
0.2
0.4
0.6
0.8
1
1.2
1386.5 1387 1387.5 1388 1388.5 1389
Nor
mal
ized
radi
ance
Wavenumber (cm-1)
Fig. 4. Standard terrestrial atmospheric transmission (thick black line,also shown in Figs. 1 and 2) compared with our retrieved transmissionfunction applicable for the EXES data of Mars. Our transmission curvewas inferred from the best fit between the observed spectrum of Mars(after removal of the offset due to scattered light) and the product ofthe nominal synthetic model of Mars by the transmission function (seeFig. 5). The terrestrial atmospheric transmission is zero in the core ofthe strong water line at 1387.5 cm−1.
-0.2
0
0.2
0.4
0.6
0.8
1
1.2
1384 1385 1386 1387 1388 1389 1390
Norma
lized ra
diance
Wavenumber (cm-1)
-0.2
0
0.2
0.4
0.6
0.8
1
1.2
1386.2 1386.4 1386.6 1386.8 1387 1387.2 1387.4 1387.6 1387.8
Normal
ized rad
iance
Wavenumber (cm-1)
Fig. 5. Spectrum of Mars integrated over the Martian disk (thick blackline), recorded with EXES on April 8, 2014 (Ls = 113◦, normalized ra-diance). Red line: best-fit model of Mars multiplied by our inferred ter-restrial atmospheric transmission function. Top: 1383.5−1390.1 cm−1;bottom: 1386.2−1387.8 cm−1. The radiance is zero at 1387.5 cm−1, asexpected from the opacity of the terrestrial atmosphere at this frequency.
curve corresponds to an altitude level of 11 km (consistent withthe flight altitude of SOFIA of 11.6 km), a pressure of 0.17 bar,and a temperature of 185 K at this level. The terrestrial watermixing ratio ranges from 8 × 10⁻⁵ at the 11 km level to 2 × 10⁻⁵
at an altitude of 16 km and 5 × 10⁻⁶ at an altitude of 21 km.Figure 5 shows the disk-integrated EXES spectrum of Mars
compared with the product of our Martian model with the re-trieved terrestrial atmospheric transmission. It can be seen thatthe agreement is quite satisfactory over the whole spectral range,in particular in the 1386.5 cm−1 and 1387.5 cm−1 water bandswhere the effect of the Martian spectrum is almost negligible. Inwhat follows, we compare the EXES data with the Martian syn-thetic spectra multiplied by our retrieved transmission function,
Fig. 6. Continuum maps of Mars with TEXES. Top: continuum radi-ance map of the Martian disk recorded at 1388.10 cm−1 (Ls = 113◦)with EXES. Bottom: surface temperatures, assuming a maximum sur-face temperature of 280 K at the disk center, as predicted by the GCM.The absolute radiance scale is derived assuming that the brightness tem-perature is equal to the surface temperature, i.e.; that the surface emis-sivity is 1.0. The maps extend over 11 pixels in diameter, and the sizeof the pixel is 1.4 arcsec. The subsolar point is indicated by a white dot.
taking the Martian Doppler shift into account, and convolvedwith the EXES spectral resolution.
4. Mapping Mars
Figure 6 shows a map of the continuum radiance of Mars at1388.60 cm−1 after removal of the scattered light. In the absenceof absolute calibration available on the EXES instrument for ourMars data, we have retrieved a brightness temperature scale us-ing the maximum surface temperature value expected at the diskcenter by the GCM (Forget et al. 1999) for the EXES observ-ing conditions. We note that these temperature are actually up-per limits to the actual brightness temperature, since our conver-sion assumes a surface emissivity of 1.0. We note that, in thecase of our TEXES observations of Mars on March 1, 2014, anemissivity of 60% was inferred, corresponding to a drop of thebrightness temperature by a few percent. The brightness temper-ature of 280 K is consistent with the GCM prediction (Forgetet al. 1990), which indicates a maximum surface temperature of290 K for our observing conditions. We did not consider the pos-sible effects of dust aerosols on Mars. Since CO2 has a differentvertical distribution than H2O and HDO, the presence of aerosolsmight affect the H2O and HDO mixing ratios; however, because
A62, page 5 of 12
A&A 586, A62 (2016)
EXES data, April 8, 2014 Ls = 113° CO2 1388.95 cm-‐1
H2O – 1388.47 cm-‐1 HDO – 1389.13 cm-‐1
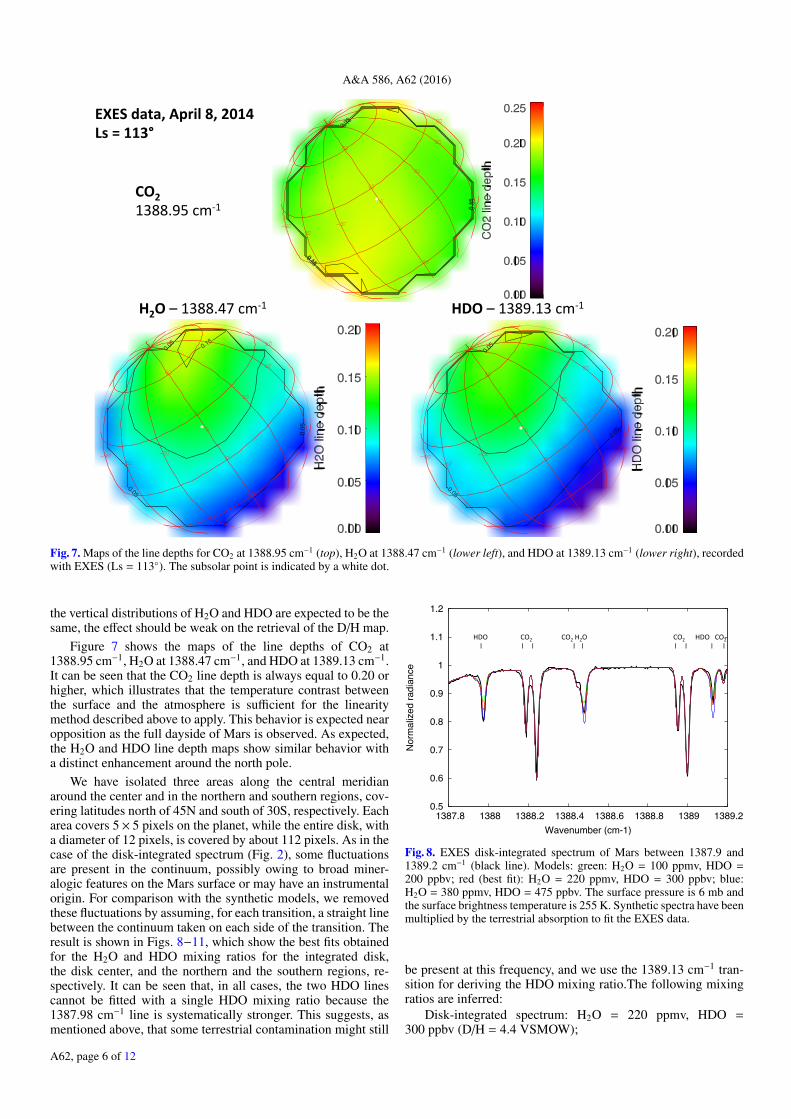
Fig. 7. Maps of the line depths for CO2 at 1388.95 cm−1 (top), H2O at 1388.47 cm−1 (lower left), and HDO at 1389.13 cm−1 (lower right), recordedwith EXES (Ls = 113◦). The subsolar point is indicated by a white dot.
the vertical distributions of H2O and HDO are expected to be thesame, the effect should be weak on the retrieval of the D/H map.
Figure 7 shows the maps of the line depths of CO2 at1388.95 cm−1, H2O at 1388.47 cm−1, and HDO at 1389.13 cm−1.It can be seen that the CO2 line depth is always equal to 0.20 orhigher, which illustrates that the temperature contrast betweenthe surface and the atmosphere is sufficient for the linearitymethod described above to apply. This behavior is expected nearopposition as the full dayside of Mars is observed. As expected,the H2O and HDO line depth maps show similar behavior witha distinct enhancement around the north pole.
We have isolated three areas along the central meridianaround the center and in the northern and southern regions, cov-ering latitudes north of 45N and south of 30S, respectively. Eacharea covers 5× 5 pixels on the planet, while the entire disk, witha diameter of 12 pixels, is covered by about 112 pixels. As in thecase of the disk-integrated spectrum (Fig. 2), some fluctuationsare present in the continuum, possibly owing to broad miner-alogic features on the Mars surface or may have an instrumentalorigin. For comparison with the synthetic models, we removedthese fluctuations by assuming, for each transition, a straight linebetween the continuum taken on each side of the transition. Theresult is shown in Figs. 8−11, which show the best fits obtainedfor the H2O and HDO mixing ratios for the integrated disk,the disk center, and the northern and the southern regions, re-spectively. It can be seen that, in all cases, the two HDO linescannot be fitted with a single HDO mixing ratio because the1387.98 cm−1 line is systematically stronger. This suggests, asmentioned above, that some terrestrial contamination might still
HDO CO2 CO2 H2O CO2 HDO CO2 l l l l l l l l l
0.5
0.6
0.7
0.8
0.9
1
1.1
1.2
1387.8 1388 1388.2 1388.4 1388.6 1388.8 1389 1389.2
Nor
mal
ized
radi
ance
Wavenumber (cm-1)
Fig. 8. EXES disk-integrated spectrum of Mars between 1387.9 and1389.2 cm−1 (black line). Models: green: H2O = 100 ppmv, HDO =200 ppbv; red (best fit): H2O = 220 ppmv, HDO = 300 ppbv; blue:H2O = 380 ppmv, HDO = 475 ppbv. The surface pressure is 6 mb andthe surface brightness temperature is 255 K. Synthetic spectra have beenmultiplied by the terrestrial absorption to fit the EXES data.
be present at this frequency, and we use the 1389.13 cm−1 tran-sition for deriving the HDO mixing ratio.The following mixingratios are inferred:
Disk-integrated spectrum: H2O = 220 ppmv, HDO =300 ppbv (D/H = 4.4 VSMOW);
A62, page 6 of 12

T. Encrenaz et al.: A map of D/H on Mars
HDO CO2 CO2 H2O CO2 HDO CO2 l l l l l l l l l
0.4
0.5
0.6
0.7
0.8
0.9
1
1.1
1.2
1387.8 1388 1388.2 1388.4 1388.6 1388.8 1389 1389.2
Nor
mal
ized
radi
ance
Wavenumber (cm-1)
Fig. 9. EXES spectrum of Mars around the disk center between 1387.9and 1389.2 cm−1 (black line). Models: green: H2O = 150 ppmv, HDO =250 ppbv; red (best fit): H2O = 275 ppmv, HDO = 400 ppbv; blue:H2O = 400 ppmv, HDO = 550 ppbv. The surface pressure is 7.5 mband the surface brightness temperature is 280 K. The airmass is 1.0.Synthetic spectra have been multiplied by the terrestrial absorption tofit the EXES data.
HDO CO2 CO2 H2O CO2 HDO CO2 l l l l l l l l l
0.5
0.6
0.7
0.8
0.9
1
1.1
1.2
1387.8 1388 1388.2 1388.4 1388.6 1388.8 1389 1389.2
Nor
mal
ized
radi
ance
Wavenumber (cm-1)
Fig. 10. EXES spectrum of Mars in the northern region between 1387.9and 1389.2 cm−1. Models: green: H2O = 250 ppmv, HDO = 400 ppbv;red (best fit): H2O = 375 ppmv, HDO = 550 ppbv; blue: H2O =600 ppmv, HDO = 950 ppbv. The surface pressure is 6 mb, and thesurface brightness temperature is 240 K. The airmass is 1.75. Syntheticspectra have been multiplied by the terrestrial absorption to fit the EXESdata.
Disk center: H2O = 275 ppmv, HDO = 400 ppbv (D/H =4.7 VSMOW);
Northern region: H2O = 375 ppmv, HDO = 550 ppbv (D/H =(D/H = 4.7 VSMOW);
Southern region: H2O = 125 ppmv, HDO = 150 ppbv(D/H = 3.9 VSMOW).
To check the consistency of our results in the northern andsouthern areas over the whole spectral range, we show the ob-served EXES spectra in Fig. 12 compared with the best-fit mod-els multiplied by our transmission functions in the spectral rangewhere the terrestrial absorption is maximum (1386−1388 cm−1).These curves have to be compared with Fig. 5 for the full disk. Itcan be seen that the agreement is very satisfactory for the south-ern region, but not as good for the northern region. This may
0.5
0.6
0.7
0.8
0.9
1
1.1
1.2
1387.8 1388 1388.2 1388.4 1388.6 1388.8 1389 1389.2
Nor
mal
ized
radi
ance
Wavenumber (cm-1)
HDO CO2 CO2 H2O CO2 HDO CO2 l l l l l l l l l
Fig. 11. EXES spectrum of Mars in the southern region between 1387.9and 1389.2 cm−1 (black line). Models: green: H2O = 0 ppmv, HDO =0 ppbv; red (best fit): H2O = 125 ppmv, HDO = 150 ppbv; blue: H2O =300 ppmv, HDO = 300 ppbv. The surface pressure is 5 mb and thesurface brightness temperature is 235K. The airmass is 1.5. Syntheticspectra have been multiplied by the terrestrial absorption to fit the EXESdata.
NORTH EXES data Best fit model
SOUTH EXES data Best fit model
0
0.2
0.4
0.6
0.8
1
1.2
1386.2 1386.4 1386.6 1386.8 1387 1387.2 1387.4 1387.6 1387.8
Norma
lized ra
diance
Wavenumber (cm-1)
0
0.2
0.4
0.6
0.8
1
1.2
1386.2 1386.4 1386.6 1386.8 1387 1387.2 1387.4 1387.6 1387.8
Norma
lized ra
diance
Wavenumber (cm-1)
Fig. 12. Observed spectrum of Mars in the spectral range of maximumtelluric absorption (1386.2−1387.8 cm−1), compared with the best-fitmodel (red line, see Figs. 9 and 11). Top: northern region; bottom:southern region. The same plot is shown in Fig. 5 (bottom) for the ob-served disk-integrated spectrum.
imply that the surface continuum shows variations in the north-ern hemisphere. Unfortunately, we have no way to account forthese minor fluctuations. It can be noted that the HDO line ap-pearing at 1386.55 cm−1 in the wing of the strong H2O line cen-tered at 1386.50 cm−1 is well fit in both regions.
Figure 13 shows the maps of the H2O and HDO mixing ra-tios relative to CO2, inferred from the line depth ratios of the1388.47 cm−1 H2O line and the 1389.13 cm −1 HDO line, di-vided by the 1388.95 cm−1 CO2 line. The linearity relationshipbetween the line depth ratios (ldr) and the volume mixing ratios(vmr) are derived from the best-fit model for the disk center andare defined as follows:
vmr(H2O)(ppmv) = 509.2 × ldr(H2O/CO2)vmr(HDO)(ppbv) = 723.7 × ldr(HDO/CO2).
A62, page 7 of 12
A&A 586, A62 (2016)
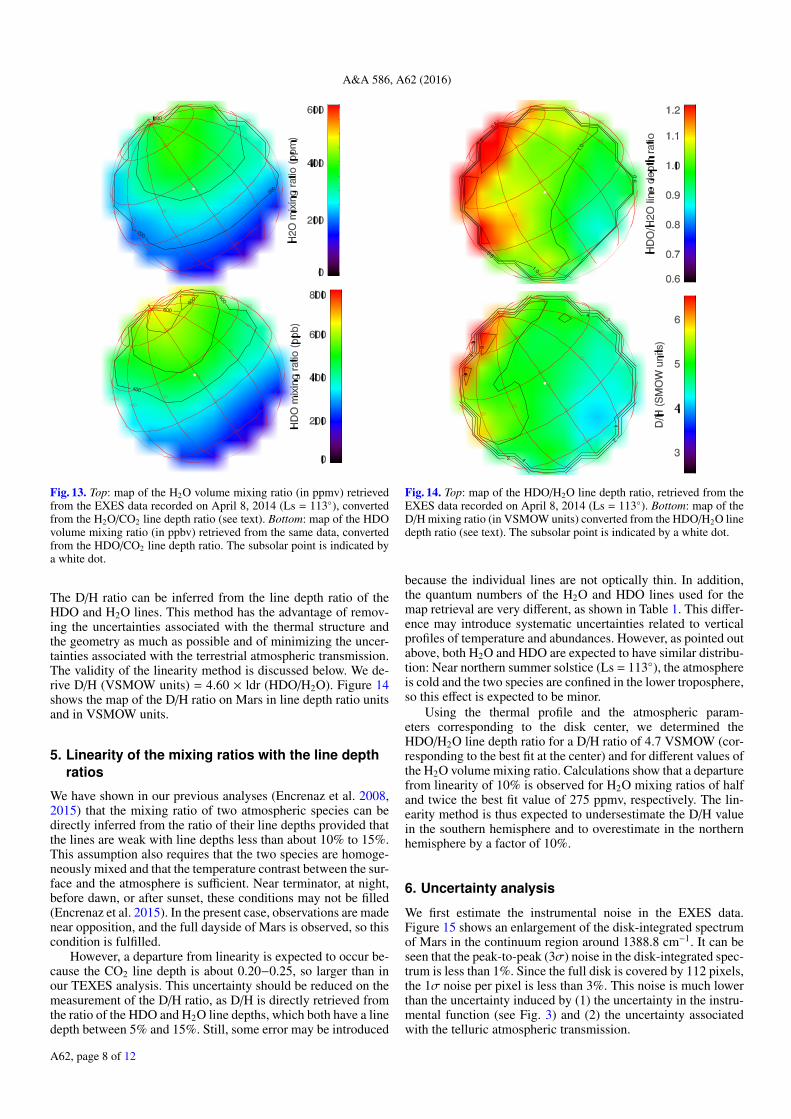
Fig. 13. Top: map of the H2O volume mixing ratio (in ppmv) retrievedfrom the EXES data recorded on April 8, 2014 (Ls = 113◦), convertedfrom the H2O/CO2 line depth ratio (see text). Bottom: map of the HDOvolume mixing ratio (in ppbv) retrieved from the same data, convertedfrom the HDO/CO2 line depth ratio. The subsolar point is indicated bya white dot.
The D/H ratio can be inferred from the line depth ratio of theHDO and H2O lines. This method has the advantage of remov-ing the uncertainties associated with the thermal structure andthe geometry as much as possible and of minimizing the uncer-tainties associated with the terrestrial atmospheric transmission.The validity of the linearity method is discussed below. We de-rive D/H (VSMOW units) = 4.60 × ldr (HDO/H2O). Figure 14shows the map of the D/H ratio on Mars in line depth ratio unitsand in VSMOW units.
5. Linearity of the mixing ratios with the line depthratios
We have shown in our previous analyses (Encrenaz et al. 2008,2015) that the mixing ratio of two atmospheric species can bedirectly inferred from the ratio of their line depths provided thatthe lines are weak with line depths less than about 10% to 15%.This assumption also requires that the two species are homoge-neously mixed and that the temperature contrast between the sur-face and the atmosphere is sufficient. Near terminator, at night,before dawn, or after sunset, these conditions may not be filled(Encrenaz et al. 2015). In the present case, observations are madenear opposition, and the full dayside of Mars is observed, so thiscondition is fulfilled.
However, a departure from linearity is expected to occur be-cause the CO2 line depth is about 0.20−0.25, so larger than inour TEXES analysis. This uncertainty should be reduced on themeasurement of the D/H ratio, as D/H is directly retrieved fromthe ratio of the HDO and H2O line depths, which both have a linedepth between 5% and 15%. Still, some error may be introduced
Fig. 14. Top: map of the HDO/H2O line depth ratio, retrieved from theEXES data recorded on April 8, 2014 (Ls = 113◦). Bottom: map of theD/H mixing ratio (in VSMOW units) converted from the HDO/H2O linedepth ratio (see text). The subsolar point is indicated by a white dot.
because the individual lines are not optically thin. In addition,the quantum numbers of the H2O and HDO lines used for themap retrieval are very different, as shown in Table 1. This differ-ence may introduce systematic uncertainties related to verticalprofiles of temperature and abundances. However, as pointed outabove, both H2O and HDO are expected to have similar distribu-tion: Near northern summer solstice (Ls = 113◦), the atmosphereis cold and the two species are confined in the lower troposphere,so this effect is expected to be minor.
Using the thermal profile and the atmospheric param-eters corresponding to the disk center, we determined theHDO/H2O line depth ratio for a D/H ratio of 4.7 VSMOW (cor-responding to the best fit at the center) and for different values ofthe H2O volume mixing ratio. Calculations show that a departurefrom linearity of 10% is observed for H2O mixing ratios of halfand twice the best fit value of 275 ppmv, respectively. The lin-earity method is thus expected to undersestimate the D/H valuein the southern hemisphere and to overestimate in the northernhemisphere by a factor of 10%.
6. Uncertainty analysis
We first estimate the instrumental noise in the EXES data.Figure 15 shows an enlargement of the disk-integrated spectrumof Mars in the continuum region around 1388.8 cm−1. It can beseen that the peak-to-peak (3σ) noise in the disk-integrated spec-trum is less than 1%. Since the full disk is covered by 112 pixels,the 1σ noise per pixel is less than 3%. This noise is much lowerthan the uncertainty induced by (1) the uncertainty in the instru-mental function (see Fig. 3) and (2) the uncertainty associatedwith the telluric atmospheric transmission.
A62, page 8 of 12

T. Encrenaz et al.: A map of D/H on Mars
0.95
0.96
0.97
0.98
0.99
1
1.01
1387.8 1388 1388.2 1388.4 1388.6 1388.8 1389 1389.2
Nor
mal
ized
radi
ance
Wavenumber (cm-1)
Fig. 15. Spectrum of Mars between 1387.8 and 1389.2 cm−1 (thickblack line), integrated over the Martian disk, recorded with EXES (Ls =113◦, normalized radiance). Red line: synthetic spectrum of the Martianatmosphere corresponding to the best fit (Fig. 8): H2O = 220 ppmv,HDO = 300 ppbv.
In the first case, the error is maximum in the retrieval of theH2O line depth at 1388.47 cm−1 because of the limited quality ofthe fit of the weak neighboring CO2 line at 1388.44 cm−1. Owingto the uncertainty in the continuum level between the CO2 andH2O lines at 1388.455 cm−1, we estimate that the absolute erroron the H2O line depth is about 20% for the disk-integrated spec-trum, 15% for the center and the northern region, and 30% forthe southern region. The measurement of the HDO line depth at1389.13 cm−1 is not affected by this effect.
To estimate the uncertainty associated with the retrieval ofthe terrestrial atmospheric transmission, we took two extremecases for the terrestrial contribution in the H2O and HDO linedepths. With the retrieved atmospheric transmission curve usedin this study, the terrestrial contribution (in depth) is 0.065 forthe H2O line at 1388.47 cm−1 and 0.026 for the HDO line at1389.13 cm−1, which is 0.4 times its value for H2O (see Fig. 4).The total depth of the H2O line (including the terrestrial con-tribution) in the EXES spectrum of the southern region is 0.10.We estimated that the terrestrial contribution in this line cannotbe more than 0.075 in order to avoid negligible (and unreason-ably low) values of the Martian H2O in this region. We scaledthe terrestrial contribution HDO accordingly at 0.030. For thelower limits of terrestrial absorption, we assumed 0.055 for theH2O line and 0.022 for the HDO lines.
The uncertainties on the H2O and HDO mixing ratios onMars can be estimated as follows. For the disk-integrated spec-trum of Mars, the H2O nominal line depth (without the terrestrialcontribution) is about 0.10 (Figs. 7 and 8). In the case of H2O,using the two extreme values of the terrestrial contribution leadsto extreme line depths ranging from 0.09 to 0.11, correspondingto an uncertainty of 10%. The associated uncertainty is 7% forthe northern region and 20% for the southern region. These un-certainties have to be combined quadratically with the error as-sociated with the poor quality of the fit as discussed above. Theresulting uncertainties on the H2O mixing ratio are 22% for thedisk-integrated value, 17% for the center and the northern re-gion, and 36% for the southern region.
In the case of HDO, the line depth in the disk-integratedspectrum (without the terrestrial contribution) is about 0.10. Itbecomes 0.096 if the terrestrial absorption is maximum and0.104 in the opposite case. The associated uncertainty is then
4%. It becomes 3% at the center and in the northern region and10% in the southern region.
Because the terrestrial absorption contribution has no effecton the CO2 line depth, its uncertainty is minor compared withthe H2O and HDO line depths. The final results are thus thefollowing:
Disk-integrated spectrum: H2O = 220+/−48 ppmv, HDO =300+/−12 ppbv;
Disk center: H2O = 275+/−47 ppmv, HDO =400+/−12 ppbv;
Northern region: H2O = 375+/−64 ppmv, HDO =550+/−17 ppbv;
Southern region: H2O = 125+/−45 ppmv, HDO =150+/−15 ppbv.
It should be noted that these error bars are systematic. Therelative error bars on the H2O and HDO maps (Figs. 12) aremuch lower and only due to the signal-to-noise ratio of the EXESspectrum in one pixel. As discussed above, the 1σ associateduncertainty is 3%.
The absolute uncertainty on the D/H ratio is obtained by as-sociating, on one hand, the maximum values of H2O and HDOmixing ratios and, on the other, their minimum values. The resultis the following:
Disk-integrated spectrum: D/H = 4.4 (+1.0, −0.6) VSMOW;Disk center: D/H = 4.7 (+0.8, −0.6) VSMOW;Northern region: D/H = 4.7 (+0.8, −0.6) VSMOW;Southern region: D/H = 3.9 (+ 1.5, −0.8) VSMOW.The relative uncertainty on the D/H variations shown in the
D/H map (Fig. 13) is the quadratic combination of the errors onthe H2O and HDO line depths. The 1σ uncertainty is thus 4.2%.
7. Discussion
Our observation of Mars with EXES leads to a disk-integratedvalue of 4.4 (+1.0, −0.6) times the VSMOW value. This valuetends to be slightly lower than most of the previous disk-integrated determinations, although still consistent with mostof them taking the error bars into account (Owen et al. 1988;Krasnopolsky et al. 1997). Part of the difference can be explainedby the fact that, at the time of our observations, the Tharsisplateau was in the field of view; indeed, lower D/H values areexpected in high-altitude regions where the water vapor con-tent is lower. Figure 16 show a closer comparison of our datawith the maps obtained by Villanueva et al. (2015) for Ls = 80and 83◦. The D/H ratio above the Tharsis region is clearly de-pleted in our map, which is in good agreement with the dataof Villanueva et al. (2015). The poor spatial resolution of ourmap is a consequence of the poor image quality of the SOFIAtelescope, which is limited to about 3 arcsec, corresponding totwo pixels on our map. We thus confirm the low D/H values forhigh-altitude regions of Mars. However, at latitudes higher thanthe Tharsis plateau, our D/H is uniformly close to 5 VSMOWwhile, in the map shown by Villanueva et al. (2015), it reachesabout seven times the VSMOW at 60N north of Olympus Mons,over a region that is larger than our spatial resolution (Fig. 16).Independently of its limited spatial resolution, the EXES mapseems to show less variability than the data of Villanueva et al.(2015).
Our D/H measurement can also be compared withKrasnopolsky’s result for the same season. For Ls = 110◦,Krasnopolsky’s value of D/H is about four VSMOW in thenorthern hemisphere, in agreement with our result. We note thatthe longitude range for Krasnopolsky’s measurements (CentralMeridian at 253 E) was different from the conditions of the
A62, page 9 of 12

A&A 586, A62 (2016)
140 170 200 230 260
EXES
CRIRES/NIRSPEC
Fig. 16. Top: map of the D/H ratio in VSMOW units retrieved from the EXES data recorded on April 8, 2014 (Ls = 113◦, same as Fig. 13, bottom).Bottom: map of the D/H mixing ratio (in VSMOW units) retrieved by Villanueva et al. (2015) in January 2014 for Ls = 80 deg and 83 deg. Theleft map of Villanueva et al. (2015) matches the longitude range covered by the EXES observations.
EXES observations (Central Meridian at 205 E). The meanglobal D/H reported by Krasnopolsky (2015), integrated overthe disk and over time, is 4.6+/−0.7 VSMOW, in good agree-ment also with the EXES result.
The EXES maps of HDO and H2O can be compared with theGCM predictions and with previous observations. In the caseof the HDO map, a comparison can be made with the resultsrecorded by the TEXES imaging spectrometer on the IRTF onMarch 1, 2014 (Encrenaz et al. 2015) for Ls = 96◦. The map ofthe HDO mixing ratio was obtained from the line depth ratio ofa weak HDO transition at 1237.08 cm−1 (8.08 µm) divided bya weak nearby CO2 line at 1241.58 cm−1 (8.05 µm). Figure 17shows a comparison of the TEXES and EXES maps, separatedin time by five weeks and in areocentric longitude by 17◦. Theoverall agreement is satisfactory, both for the HDO mixing ratioand its global distribution over the disk. Figure 17 also showsa comparison of the two HDO maps with the predictions of theGCM (Montmessin et al. 2005). For both the EXES and TEXES
data, the agreement is satisfactory except at the north pole wherethe GCM prediction is higher than the observed one (by bothTEXES and EXES) by a factor of 1.5 to 2 over a region as largeas the EXES spatial resolution.
Our H2O map can also be compared with previous obser-vations. The EXES map of H2O is consistent with the map ofVillanueva et al. (2015) for Ls = 80−83◦. For Ls = 113◦, theTES data aboard Mars Global Surveyor (Smith 2004) indicatean H2O column density ranging from 4 pr-µm at 30S latitudeto 12 pr-µm at the equator and 40 pr-µm at 60N latitude. Inour model, these numbers correspond to 77 ppmv, 204 ppmv,and 680 ppmv at 30S, 0, and 70N latitudes, respectively. At30S and 0 latitude, these numbers are consistent with our re-sults, taking the error bars into account. At high northern lat-itudes, the TES value is higher than our result by about 30%.The same comment applies to the comparison of our EXES mapwith the predictions of the GCM (Forget et al. 1999, Fig. 18).The EXES values are consistent with the GCM values, except in
A62, page 10 of 12

T. Encrenaz et al.: A map of D/H on Mars
April 8, 2014, Ls = 113°
March 1, 2014, Ls = 96°
TEXES HDO/CO2 mixing ra3o GCM HDO/CO2 mixing ra3o
EXES HDO/CO2 mixing ra3o GCM HDO/CO2 mixing ra3o
Fig. 17. Top left: map of the HDO/CO2 volume mixing ratio, retrieved from the EXES data recorded on April 8, 2014 (Ls = 113◦). Top right: GCMprediction for the same observing conditions (after Montmessin et al. 2005). Bottom left: map of the HDO/CO2 volume mixing ratio retrieved fromthe TEXES data on March 1, 2014 (Ls = 96◦). Bottom right: GCM prediction for the same observing conditions (Encrenaz et al. 2015).
TEXES H2O/CO2 mixing ra2o GCM H2O/CO2 mixing ra2o !"#$%&'(&)*'+&,&-.&/&012&
!!!!!!!!!"#$#%! ! ! ! ! ! ! !!!!!!!!!!!!!!!!&'(!
)*+!,-.-/0!1234! ! ! ! ! !!!!!!!!!!!!!!!!)*+!,-.-/0!1234!!!!!!!!!!!!!!!!!!!!!!!!!!!!!!!!!!!
!"#$%&'(&)*'+&,&-.&/&012&
!!!!!!!!!"#$#%! ! ! ! ! ! ! !!!!!!!!!!!!!!!!&'(!
)*+!,-.-/0!1234! ! ! ! ! !!!!!!!!!!!!!!!!)*+!,-.-/0!1234!!!!!!!!!!!!!!!!!!!!!!!!!!!!!!!!!!!
O
EXES H2O/CO2 mixing ra2o GCM H2O/CO2 mixing ra2o April 8, 2014, Ls = 113°
March 1, 2014, Ls = 96°
Fig. 18. Top left: map of the H2O/CO2 volume mixing ratio, retrieved from the EXES data recorded on April 8, 2014 (Ls = 113◦). Top right: GCMpredictions for the same observing conditions. Bottom left: map of the H2O/CO2 volume mixing ratio retrieved from the TEXES data on March 1,2014 (Ls = 96◦, left), assuming a uniform D/H ratio of 5 VSMOW. Bottom right: GCM prediction for the same observing conditions (Encrenazet al. 2015).
A62, page 11 of 12

A&A 586, A62 (2016)
the northern region where they are significantly weaker. We notethat the TEXES map of H2O was inferred using a D/H meanvalue of 5 VSMOW, so slightly higher than the EXES value,which explains the lower values of the TEXES H2O map withrespect to the EXES map (Fig. 18).
The H2O latitudinal distribution observed by EXES can alsobe compared with the result reported by Krasnopolsky (2015)for Ls = 110◦. Krasnopolsky (2015) derives a H2O column den-sity of about 15 pr-µm and 35 pr-µm at latitudes of 20 N and80 N, respectively. Using our model, these numbers translateinto 255 ppmv and 600 ppmv, which is consistent with the EXESresult. The departure from the GCM in the water vapor map athigh northern latitudes is thus observed by the different ground-based observations, which might suggest that some adjustmentis required in the GCM to fit the data better around the northpole.
From the water vapor spatial distribution shown in Figs. 13and 17, it is possible to estimate the D/H map expected ifthe VPIE is the main mechanism responsible for fractionation.Following Fouchet & Lellouch (2000), we consider an opencloud system, where the solid phase condenses in isotopic equi-librium with the water phase and leaves the cloud by precipita-tion immediately after its formation (Dansgaard 1964). In thiscase we expect
1 + δ = [nV/nV0] exp(α − 1),
where δ is the isotopic departure with respect to the referenceD/H value, nV0 is the reference (maximum) water vapor con-tent, and α the fractionation coefficient, which is the ratio ofthe D/H ratio in the condensed phase to the ratio in the vaporphase (Merlivat & Nief 1967). Following Fouchet & Lellouch(2000), we adopt α = 1.24, corresponding to a temperature of230 K. We calculate the expected D/H value in the southern re-gion, using nV = 125 ppmv (as derived from the EXES data),and as reference values, the water vapor volume mixing ratioand the D/H value inferred from EXES in the northern region(nV0 = 375 ppmv, D/H = 4.7 × VSMOW). Using these pa-rameters, we infer, for the southern region, a D/H ratio of 3.6 ×VSMOW, in good agreement with the EXES value. We concludethat the EXES results are fully consistent with the VPIE mecha-nism being responsible for the deuterium fractionation on Mars.We also note that the above calculation gives an upper limit ofthe deuterium fractionation expected from the VPIE, consideringthat the open cloud assumption is an extreme case (because it as-sumes that the solid phase leaves the cloud immediately after itsformation). Thus, assuming the VPIE process, we do not expectstronger D/H variations than observed in our map (Fig. 13).
Our analysis confirms the expected behavior of the D/H ra-tio as a function of altitude and as a function of the H2O abun-dance, previously illustrated by Villanueva et al. (2015) andKrasnopolsky (2015). We cannot confirm the high global valueof the D/H enrichment over the seasonal cycle inferred by theauthors. Indeed, our observations covered a longitude rangewhere low values of D/H were expected. Other observations withEXES aboard SOFIA will be needed for different seasons of theMartian cycle to infer a global value of the D/H ratio, averagedover the whole seasonal cycle.
Acknowledgements. This article is based on observations made with theNASA/DLR Stratospheric Observatory for Infrared Astronomy (SOFIA).SOFIA is jointly operated by the Universities Space Research Association,Inc. (USRA), under NASA contract NAS2-97001, and the Deutsches SOFIAInstitut (DSI) under DLR contract 50 OK 0901 to the University of Stuttgart.Financial support for this work was provided by NASA. We wish to thank theSOFIA and EXES staff for the support of EXES observations. We are grateful toM. J. Mumma for helpful comments regarding this paper. T.K.G. acknowledgessupport of NASA Grant NNX14AG34G. T.E. and B.B. acknowledge supportfrom CNRS and Programme National de Planétologie. T.F. acknowledges sup-port from UPMC. T.E. acknowledges support from Jet Propulsion Laboratory asa Distinguished Visiting Scientist.
ReferencesBertaux, J.-L., & Montmessin, F. 2001, J. Geophys. Res., 106, 32879Bjoraker, G. L., Mumma, M. J., & Larson, H. P. 1989, BAAS, 21, 991Boctor, N. Z., Alexander, C. M. O. D., Wang, J., & Hauri, E. 2003, Geochim.
Cosmochim. Acta, 67, 3971Carr, M. H. 1986, Icarus, 68, 187Carr, M. H. 1996, Water on Mars (Oxford: Oxford University Press)Carr, M. 1990, Icarus, 87, 210Dansgaard, W. 1964, Tellus, 16, 436Delaye, C., Hartmann, J. M., & Taine 1989, J. Appl. Opt., 28, 5085Encrenaz, T., Lellouch, E., Rosenqvist, J., et al. 1991, Ann. Geophys., 9, 797Encrenaz, T., Lellouch, E., Paubert, G., et al. 2001, Plan. Space Sci., 49, 731Encrenaz, T., Bézard, B., Greathouse, T. K., et al. 2004, Icarus, 170, 424Encrenaz, T., Greathouse, T. K., Richter, M. J., et al. 2008, Icarus, 195, 547Encrenaz, T., Greathouse, T. K., Lefèvre, F., et al. 2012, Plan. Space Sci., 68, 3Encrenaz, T., Greathouse, T. K., Lefèvre, F., et al. 2015, A&A, 578, A127Forget, F., Hourdin, F., Fournier, R., et al. 1999, J. Geophys. Res., 104, 24155Fouchet, T., & Lellouch, E. 2000, Icarus, 144, 114Jacquinet-Husson, N., Scott, N., Chedin, A., et al. 2008, J. Quant. Spectr. Rad.
Transf., 109, 1043Jakosky, B. M. 1990, J. Geophys. Res., 95, 1475Krasnopolsky, V. A. 2002, J. Geophys. Res., 107, 5128Krasnopolsky, V. A. 2015, Icarus, 257, 377Krasnopolsky, V. A., & Feldman, P. D. 2001, Science, 294, 1914Krasnopolsky, V. A., Bjoraker, G. L., Mumma, M. J., & Jenning, D. E. 1997, J.
Geophys. Res., 102, 6525Krasnopolsky, V. A., Mumma, M. J., & Gladstone, R. G. 1998, Science, 280,
1576Lacy, J. H., Richter, M. J., Greathouse, T. K., et al. 2002, PASP, 114, 153Lasue, J., Mangold, N., Hauber, E., et al. 2013, Space Sci. Rev., 174, 155Mahaffy, P. R., Webster, C. R., & Stern, J. C. 2015, Science, 347, 412Merlivat, L., & Nief, G. 1967, Tellus, 19, 122Montmessin, F., Fouchet, T., & Forget, F. 2005, J. Geophys. Res., 110, E03006Mouginot, J., Pommerol, A., Beck, P., et al. 2012, Geophys. Res. Let., 39,
L02202Mumma, M. J., Novak, R. E., Disanti, M. A., et al. 2003, Sixth International
Conference on Mars, Pasadena, CA, July 2003, abstract #3186Owen, T. 1992, The composition and early history of the atmosphere of Mars. In
Mars, eds. H. H. Kieffer, et al. (Tucson: University of Arizona Press)Owen, T., Maillard, J.-P., de Bergh, C., & Lutz, B. L. 1988, Science, 240, 1767Plaut, J. J., Picardi, G., Safaeinili, A., et al. 2007, Science, 316, 92Richter, M. J., Ennico, K. A., Mc Kelvey, M. E., & Seifhart, A. 2010, Proc.
SPIE7735 “Ground-based and Airborne Instrumentation for Astronomy –III”, eds. I. S. McLean, S. Ramsay, & H. Takami, San Diego, Ca, USA, June2010
Rosenmann, L., Hartmann, J. M., Perrin, M. Y., & Taine 1988, J. Appl. Opt., 27,3902
Smith, M. D. 2004, Icarus, 167, 148Usui, T., Alexander, C. M. O., Wang, J., Simon, J. I., & Jones, J. H. 2012, 43rd
Lunar and Planetary Science Conference, 43, 1341Villanueva, G. L., Mumma, M. J., Novak, R. E., et al. 2015, Science, 348, 218Wordsworth, R. D., Kerber, L., Pierrehumbert, R. T., et al. 2015, J. Geophys.
Res. DOI: 10.1002/2015JE004787Zahnle, K., Kasting, J. F., & Pollack, J. B. 1990, Icarus, 84, 502Zuber, M. T., Smith, D. E., Solomon, S. C., et al. 1998, Science, 282, 2053
A62, page 12 of 12