ASTRONOMY AND The luminosity function of white dwarfs...
12
Astron. Astrophys. 336, 883–894 (1998) ASTRONOMY AND ASTROPHYSICS The luminosity function of white dwarfs and M dwarfs using dark nebulae as opaque outer screens ? L. Festin Astronomical Observatory, Box 515, S-751 20 Uppsala, Sweden ([email protected]) Received 28 January 1998 / Accepted 9 June 1998 Abstract. By using dark nebulae as opaque outer screens, the luminosity function of white dwarfs and M dwarfs has been studied. High-extinction areas towards the Orion A, Serpens and ρ Oph cloud complexes were observed, covering a volume corresponding to 464 pc 3 in the solar neighbourhood, complete to M V ∼ 16.5. Foreground stars were selected by V RI pho- tometry and photometric parallaxes. The resulting foreground sample consists of 21 M dwarfs and 7 white dwarfs. The derived M-dwarf luminosity function is consistent with previous studies, showing no substantial upturn beyond M V = 16. The 7 white dwarfs imply a local density of 0.013 (±0.005)M pc -3 (∼ 15 % of the dynamical mass in the solar neighbourhood) supporting other recent results but obtained with a completely different method. For the clouds, foreground-star data were used to derive independent cloud distances, while the background stars and a simple model of the Milky Way gave reliable cloud extinctions. Key words: stars: late-type; low-mass; brown dwarfs; lumi- nosity function; mass function; white dwarfs – Galaxy: solar neighbourhood; stellar content 1. Introduction The dark matter affects astronomy on all distance scales, single galaxies, groups of galaxies and the Universe as a whole. The dynamical mass in the solar vicinity has recently been deter- mined from Hipparcos data to 0.076 ± 0.015 M pc -3 (Cr´ ez´ e et al. 1997), leaving little space for local dark matter, since the visible matter in form of stellar-like objects and the interstellar medium comprise ∼ 0.08 M pc -3 . The stellar contribution to the local mass density derived by Jahreiss & Wielen (1997) is 0.039 M pc -3 , which agrees within errors with most other recent figures (e.g. 0.042 ± 0.008 in M´ era et al. (1996), 0.05 ± 0.01 in Kroupa et al. (1993) and 0.034 in Gould et al. (1996)). Similar amounts of matter have been suggested to reside in the interstellar medium, ∼ 0.04 Send offprint requests to: L. Festin ? Based on observations collected at the European Southern Ob- servatory (ESO), La Silla, Chile and at the Nordic Optical Telescope (NOT), La Palma M pc -3 (Haywood et al. 1997; Cr´ ez´ e et al. 1997; Bahcall et al. 1992 and references therein). However, present estimates of the local surface density of the interstellar medium range from 6 to 13 M pc -2 , indicating a substantial uncertainty also in the space density. The photometric surveys by Gould et al. (1996) and Kirk- patrick et al. (1994) give 0.011 M pc -3 for M dwarfs in the mass interval 0.1–0.5 M . For the nearby stars the correspond- ing numbers are 0.013 and 0.015 M pc -3 respectively for Reid & Gizis (1997) (hereafter RG97) and Jahreiss & Wielen (1997). The discrepancy between the photometric and the nearby sam- ples is significant and has been suggested to arise from unre- solve d binarity (Kroupa 1995) and structure in the M V vs V -I relation that has not been taken into account (RG97). For the white dwarf (WD) mass density, the 0.003 WDs pc -3 (∼ 0.002 M pc -3 ) given in Liebert et al. (1988) (hereafter LDM88), is less than 3 % of the local dynamical mass. There are, however, recent investigations that point to a much higher mass hidden in WDs. Ruiz & Takamiya (1995) (hereafter RT95) derived, from a large proper motion survey, a factor three higher space density than in LDM88. A similar value was obtained by Oswalt et al. (1996) from WDs in binaries. This revision of the WD space density (supported also by this paper) indicates that as much as 15 % of the local dynamical mass can be hidden in WDs. Thus, although the bulk of the local mass seems to be iden- tified, the role of the late M dwarfs and WDs in this context is still not clear and remains a question to discuss. In this paper the subject is addressed in a survey of opaque nebulae, obtaining volume limited and dynamically unbiassed samples of foreground M dwarfs and WDs. This method was first proposed by Herbst & Dickman (1983) and has previously been used by Jarrett (1992,1995) and Jarrett et al. (1994) (here- after JDH94), whose results will be discussed in Sect. 8.1. The present survey covers a volume corresponding to 464 pc -3 in the solar neighbour hood and is complete to M V ∼ 16.5. The completeness limit is 2 magnitudes deeper than the previous surveys by Jarrett and the volume twice as large. In § 2 the selection of the target clouds is described. § 3 out- lines the observations and reduction procedures. The extinctions of the clouds are derived in § 4. The selection of foreground stars, including colour-colour analysis and photometric parallaxes is decribed in § 5. Constraints on our foreground sample obtained
Transcript of ASTRONOMY AND The luminosity function of white dwarfs...

Astron. Astrophys. 336, 883–894 (1998) ASTRONOMYAND
ASTROPHYSICS
The luminosity function of white dwarfs and M dwarfsusing dark nebulae as opaque outer screens?
L. Festin
Astronomical Observatory, Box 515, S-751 20 Uppsala, Sweden ([email protected])
Received 28 January 1998 / Accepted 9 June 1998
Abstract. By using dark nebulae as opaque outer screens, theluminosity function of white dwarfs and M dwarfs has beenstudied. High-extinction areas towards the Orion A, Serpensandρ Oph cloud complexes were observed, covering a volumecorresponding to 464 pc3 in the solar neighbourhood, completeto MV ∼ 16.5. Foreground stars were selected byV RI pho-tometry and photometric parallaxes.
The resulting foreground sample consists of 21 M dwarfsand 7 white dwarfs. The derived M-dwarf luminosity function isconsistent with previous studies, showing no substantial upturnbeyondMV = 16. The 7 white dwarfs imply a local densityof 0.013 (±0.005) M pc−3 (∼ 15 % of the dynamical massin the solar neighbourhood) supporting other recent results butobtained with a completely different method.
For the clouds, foreground-star data were used to deriveindependent cloud distances, while the background stars and asimple model of the Milky Way gave reliable cloud extinctions.
Key words: stars: late-type; low-mass; brown dwarfs; lumi-nosity function; mass function; white dwarfs – Galaxy: solarneighbourhood; stellar content
1. Introduction
The dark matter affects astronomy on all distance scales, singlegalaxies, groups of galaxies and the Universe as a whole. Thedynamical mass in the solar vicinity has recently been deter-mined from Hipparcos data to0.076 ± 0.015 M pc−3 (Crezeet al. 1997), leaving little space for local dark matter, since thevisible matter in form of stellar-like objects and the interstellarmedium comprise∼ 0.08 M pc−3.
The stellar contribution to the local mass density derivedby Jahreiss & Wielen (1997) is 0.039 M pc−3, which agreeswithin errors with most other recent figures (e.g.0.042 ± 0.008in Mera et al. (1996),0.05 ± 0.01 in Kroupa et al. (1993) and0.034 in Gould et al. (1996)). Similar amounts of matter havebeen suggested to reside in the interstellar medium,∼ 0.04
Send offprint requests to: L. Festin? Based on observations collected at the European Southern Ob-
servatory (ESO), La Silla, Chile and at the Nordic Optical Telescope(NOT), La Palma
M pc−3 (Haywood et al. 1997; Creze et al. 1997; Bahcall etal. 1992 and references therein). However, present estimates ofthe local surface density of the interstellar medium range from6 to 13 M pc−2, indicating a substantial uncertainty also inthe space density.
The photometric surveys by Gould et al. (1996) and Kirk-patrick et al. (1994) give 0.011 M pc−3 for M dwarfs in themass interval 0.1–0.5 M. For the nearby stars the correspond-ing numbers are 0.013 and 0.015 M pc−3 respectively for Reid& Gizis (1997) (hereafter RG97) and Jahreiss & Wielen (1997).The discrepancy between the photometric and the nearby sam-ples is significant and has been suggested to arise from unre-solve d binarity (Kroupa 1995) and structure in theMV vsV −Irelation that has not been taken into account (RG97). For thewhite dwarf (WD) mass density, the 0.003 WDs pc−3 (∼ 0.002M pc−3) given in Liebert et al. (1988) (hereafter LDM88), isless than 3 % of the local dynamical mass. There are, however,recent investigations that point to a much higher mass hidden inWDs. Ruiz & Takamiya (1995) (hereafter RT95) derived, froma large proper motion survey, a factor three higher space densitythan in LDM88. A similar value was obtained by Oswalt et al.(1996) from WDs in binaries. This revision of the WD spacedensity (supported also by this paper) indicates that as much as15 % of the local dynamical mass can be hidden in WDs.
Thus, although the bulk of the local mass seems to be iden-tified, the role of the late M dwarfs and WDs in this context isstill not clear and remains a question to discuss.
In this paper the subject is addressed in a survey of opaquenebulae, obtaining volume limited and dynamically unbiassedsamples of foreground M dwarfs and WDs. This method wasfirst proposed by Herbst & Dickman (1983) and has previouslybeen used by Jarrett (1992,1995) and Jarrett et al. (1994) (here-after JDH94), whose results will be discussed in Sect. 8.1. Thepresent survey covers a volume corresponding to 464 pc−3 inthe solar neighbour hood and is complete toMV ∼ 16.5. Thecompleteness limit is 2 magnitudes deeper than the previoussurveys by Jarrett and the volume twice as large.
In § 2 the selection of the target clouds is described.§ 3 out-lines the observations and reduction procedures. The extinctionsof the clouds are derived in§ 4. The selection of foreground stars,including colour-colour analysis and photometric parallaxes isdecribed in§ 5. Constraints on our foreground sample obtained
884 L. Festin: The luminosity function of white dwarfs and M dwarfs using dark nebulae as opaque outer screens
from other sources are given in§ 6. The M-dwarf luminosityfunction (LF) and WD space densities, including correctionsfor multiplicity and galactic density gradients are derived in§ 7.In § 8 the results of this paper are compared to other recent find-ings, with special emphasis on the dark cloud survey describedin JDH94. The conclusions and some ideas for the future aregiven in§ 9.
2. Selecting target clouds
A suitable target cloud should fulfill certain criteria. Its dis-tance has to be known in order to match integration times tothe faintest stars at the cloud’s edge. It has to be sufficientlyopaque (AV >∼ 5 mag) to screen out the vast majority of back-ground stars and galaxies. The high extinction areas must belarge enough to provide a reasonable number of foregroundstars. It is also desirable to avoid the immediate neighbourhoodof star-forming regions, since young overluminous stars within,or just in front of, the cloud may be mistaken as nearby o lderfield M dwarfs.
The final selection includes the following cloud complexes,Orion A (southern part of L1641, 480 pc,l = 213, b = −19),Serpens (∼ 4 south from the Serpens cloud core, 200–250 pc,l = 27, b = 3) and two separate areas inρ Oph (L1688 andL1689, 160 pc,l = 354, b = 16). Cloud distances for theoriginal selection were taken from Hilton & Lahulla (1995).
2.1. Cloud distances
The photometric distances and the total number of M dwarfsin front of Orion A indicate a distance of 400 rather than 480pc. This result is consistent with the 390 pc in Anthony–Twarog(1982), derived from a subsample in the Warren & Hesser (1978)catalogue of stars associated with the Orion complex. In orderto confirm this finding, the Hipparcos catalogue (ESA 1997)was searched, resulting in parallaxes with standard errors lessthan 1 mas for 92 of the Warren s tars, showing a well-definedpeak at∼ 400 pc.
For Serpens, Straizys et al. (1996) gave a mean distance of259 pc for 18 stars associated to the cloud. Their total sampleconsists of 99 stars, foreground, embedded and background. Thelow-extinction part of their sample indicates an extinction wallat ∼ 255 pc. Of the 99 stars, 13 were measured by Hipparcos,revealing a few cases of misclassified luminosity classes, butbasically confirming a distance of∼ 260 pc.
Eleven of the stars that were assigned a high probability tobe associated with theρ Oph complex by Elias (1978) wereidentified in the Hipparcos catalogue and show a sharp peak at150 pc.
The distances finally adopted in this paper are 400, 255 and150 pc respectively to the Orion A, Serpens andρ Oph com-plexes. Note that these clouds are extended irregular objects farfrom being sheet-like or spherical. The distances above werederived from observations of optically visible stars, and there-fore mainly probe the front edge of the cloud, which though issufficient for the purpose of this paper. The errors in the cloud
distances are expected to be on the order of 10 %, giving a cor-respo nding volume uncertainty of∼ 30%.
3. Observations and reductions
The main body of data consists ofV RI photometry and wascollected at the ESO NTT 3.55 m telescope at La Silla, Chile.The Serpens andρ Oph areas were observed in Jun28–Jul01,1995 and cover 536 and 816 arcmin2 respectively. The OrionA field, observed in Jan24–26 1996, covers 158 arcmin2. Thesame instrumental setup was used in both runs, EMMI REDwith CCD #36, TEK2048, each pixel corresponding to 0.27′′.The unvignetted field of view was 8.6’ x 9.15’. Bias and flatfieldcorrections were done in a standard way with IRAF1.
The transformations to the JohnsonV and Kron-CousinsRI systems were based on standard stars selected from Landolt(1992). Since the observations were aimed at M dwarfs in thefirst place, care was taken to include the reddest dwarf stars inthis list, G45-20 (V − I = 4.00), G156-31 (V − I = 3.68),G12-43 (V − I = 3.48), G10-50 (V − I = 2.97) and G44-40 (V − I = 2.79). The transformation to the standard systemincludes corrections for extinction, zero-point offsets and linearcolour terms. The rms of the standard star residuals across thewhole fitted colour range (0 < V − I < 4) is 0.02 mag inV Rand 0.03 mag inI.
3.1. Complementary NOT observations
For Orion A, part of theV RI photometric candidates weremeasured inJ using ARNICA, a NICMOS3 near-IR array atthe Nordic Optical Telescope (NOT), La Palma, in Sep 1996.The J calibrations were made via standard stars provided bythe ARNICA team (Hunt et al. 1995). The Hunt transformationwas adopted:JCIT = JARNICA+ zero-point offset. The final1 σ error in the calibration of theJ magnitudes is 0.07 mag.
Low-resolution spectra of the two brightest WD candidateswere obtained at the NOT in Nov 1997, using the ALFOSC, alow-resolution spectrograph/focal reducer combination instru-ment. Standard reductions were carried out with IRAF. It wasnot possible to apply a meaningful flux calibration, since thetargets were always at airmasses between 2 and 3.5, leading toa substantial loss of light in the blue end of the spectra.
Since this survey was designed for detecting M dwarfs, theoriginal I exposure times were set rather short. The discov-ered WDs are bluer than the M dwarfs, resulting in uncertainI magnitudes in the original data. The WDI photometry wasimproved by ALFOSC observations at the NOT in Nov 1997.Again standard methods were used in the reductions.
All instrumental magnitudes were extracted by an empiricalgrowth-curve method outlined in Festin (1997).
1 IRAF (Image Reduction and Analysis Facility) is distributed byNational Optical Astronomy Observatories (NOAO), which is operatedby the Association of Universities for Research in Astronomy, Inc.,under contract with the National Science Foundation.
L. Festin: The luminosity function of white dwarfs and M dwarfs using dark nebulae as opaque outer screens 885
0 5 10 0 5 10 0 5 102
4
6
8
10
extinction in V (mag)
MV (
peak
in b
ackg
r. d
istr
.)
Serpens
M v = 3.2Av1 = 4.7
ρOphiuchus
M v = 6.9Av1 = 1.1
Orion
M v = 5Av1 = 4.9
|||| ||||
Fig. 1. MV at the peak in the through-shining background dwarf dis-tribution as a function of the cloud’s visual extinction. The solid lineis a polynomial least-square fit to the calculated points (asterisks). Therings mark the three reference fields at the extinctionAV1 as derivedin Fig. 3
0 0.4 0.8 1.2 1.6 20
0.5
1
1.5
2
2.5Av1 = 4.5step 1:
1
Av2 = 2.0step 2:
2turn−off point
G3V −unreddened
R−I
V−
R
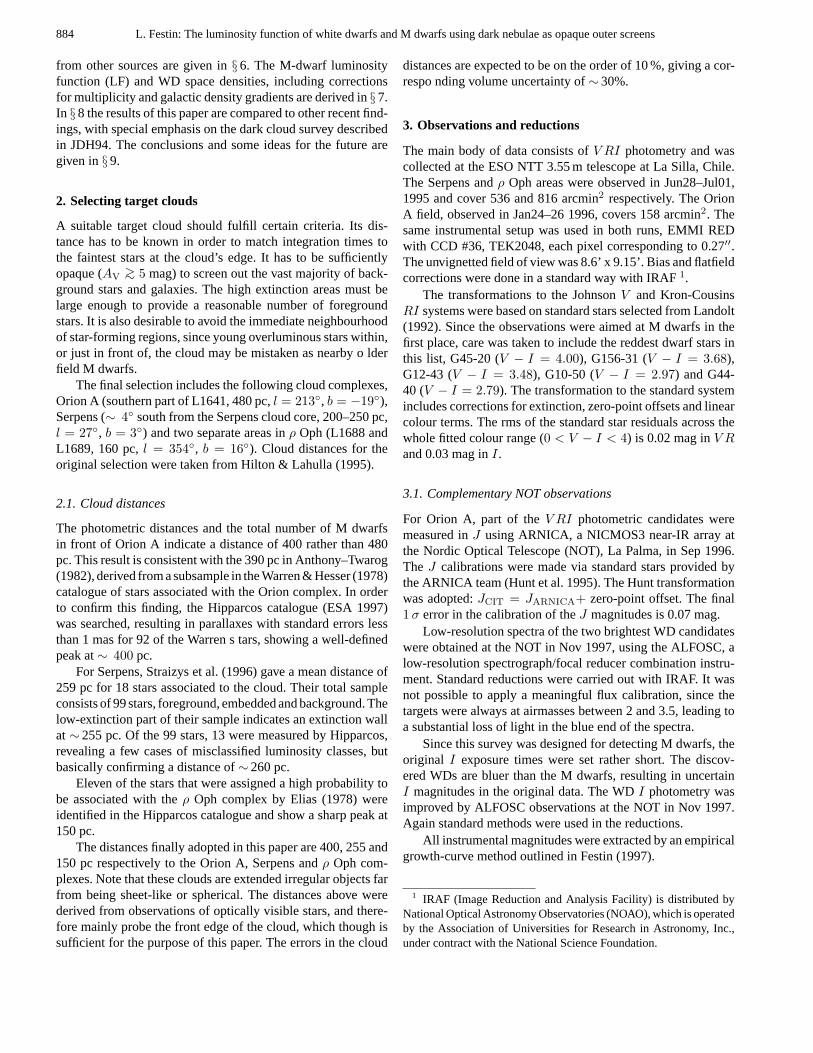
Fig. 2.The two-step extinction estimation. The dashed line is the mainsequence. The solid line is the G0V reddening curve in Jarrett (1992).Each dot is a 0.5 mag step inAV. The arrowed solid lines show thedereddening steps. The rings demonstrate the location of a fictious setof stars
TheMV completeness limit of the survey was set by theVdata, as the magnitude at which the mean of the internal magni-tude errors in a field equals 0.12 mag. This limit was justified bya star-count analysis in a previous study of the Pleiades (Festin1998). Table 1 gives completeness limits and positions for allthe observed fields.
4. Star counts and cloud extinctions
The extinction offsets relative to a reference field were derivedfor each field by the method of star counts (Dickman 1978).Since there are more background stars present in theI fieldsthan inV or R, theI band was used for the star counts. Thederived extinction inI is transformed toV by the relation inWinkler (1997),AV = 1.69AI.
0 1 0 1 0 1
1
2
3
R−I
V−
R
Serpens
A v1 = 4.7A v2 = 2.2
ρOphiuchus
A v1 = 1.1A v2 = 1.3
Orion
A v1 = 4.9A v2 = 1.9
||||||| |||||||
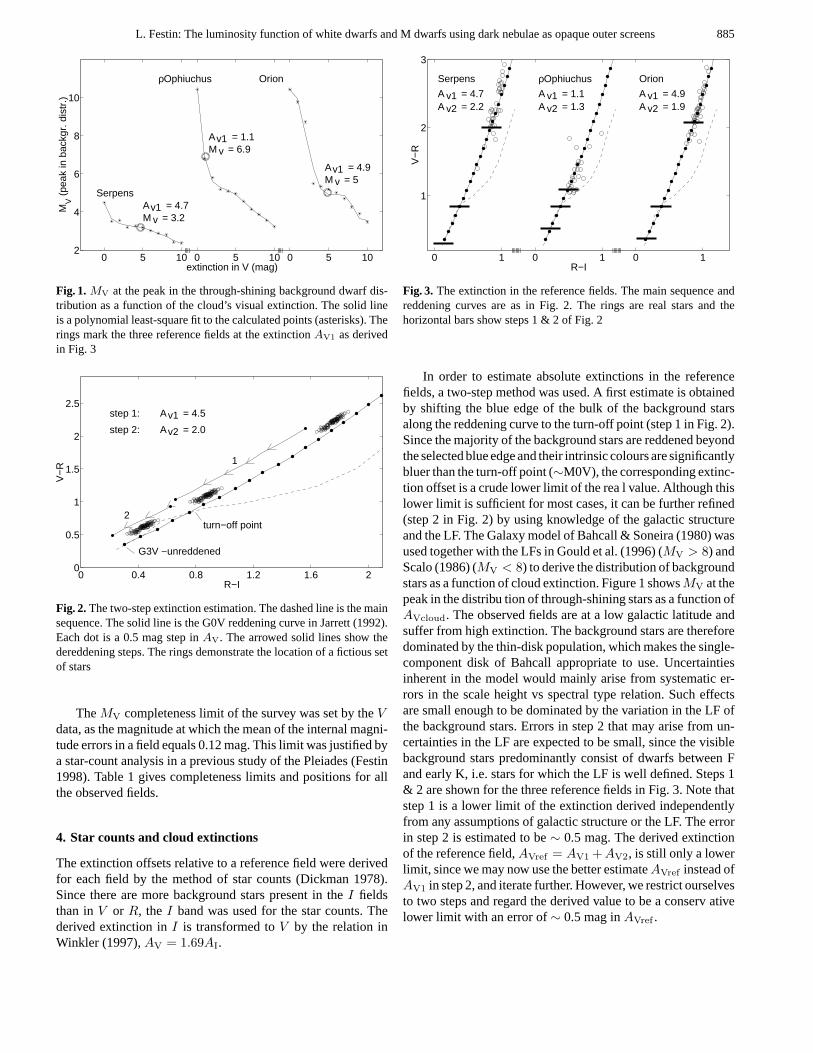
Fig. 3. The extinction in the reference fields. The main sequence andreddening curves are as in Fig. 2. The rings are real stars and thehorizontal bars show steps 1 & 2 of Fig. 2
In order to estimate absolute extinctions in the referencefields, a two-step method was used. A first estimate is obtainedby shifting the blue edge of the bulk of the background starsalong the reddening curve to the turn-off point (step 1 in Fig. 2).Since the majority of the background stars are reddened beyondthe selected blue edge and their intrinsic colours are significantlybluer than the turn-off point (∼M0V), the corresponding extinc-tion offset is a crude lower limit of the rea l value. Although thislower limit is sufficient for most cases, it can be further refined(step 2 in Fig. 2) by using knowledge of the galactic structureand the LF. The Galaxy model of Bahcall & Soneira (1980) wasused together with the LFs in Gould et al. (1996) (MV > 8) andScalo (1986) (MV < 8) to derive the distribution of backgroundstars as a function of cloud extinction. Figure 1 showsMV at thepeak in the distribu tion of through-shining stars as a function ofAVcloud. The observed fields are at a low galactic latitude andsuffer from high extinction. The background stars are thereforedominated by the thin-disk population, which makes the single-component disk of Bahcall appropriate to use. Uncertaintiesinherent in the model would mainly arise from systematic er-rors in the scale height vs spectral type relation. Such effectsare small enough to be dominated by the variation in the LF ofthe background stars. Errors in step 2 that may arise from un-certainties in the LF are expected to be small, since the visiblebackground stars predominantly consist of dwarfs between Fand early K, i.e. stars for which the LF is well defined. Steps 1& 2 are shown for the three reference fields in Fig. 3. Note thatstep 1 is a lower limit of the extinction derived independentlyfrom any assumptions of galactic structure or the LF. The errorin step 2 is estimated to be∼ 0.5 mag. The derived extinctionof the reference field,AVref = AV1 + AV2, is still only a lowerlimit, since we may now use the better estimateAVref instead ofAV1 in step 2, and iterate further. However, we restrict ourselvesto two steps and regard the derived value to be a conserv ativelower limit with an error of∼ 0.5 mag inAVref .
886 L. Festin: The luminosity function of white dwarfs and M dwarfs using dark nebulae as opaque outer screens
Table 1.Observed areas and completeness limits. The photometric system isRI Kron-Cousins (KC) andV Johnson (J)
field id field centres completeness limitsRA (2000) DEC (2000) l b IKC RKC VJ MV
Serpens A 18:27:29.1 -3:42:21 26.8931 3.6223 22.1 23.2 24.2 17.2Serpens B 18:28:04.4 -3:42:21 26.9610 3.4921 22.0 23.3 24.4 17.4Serpens C 18:28:03.3 -3:49:57 26.8463 3.4377 20.4 22.3 23.9 16.9Serpens F 18:27:52.4 -3:34:16 27.0576 3.5986 21.3 22.5 23.7 16.7Serpens J 18:28:23.2 -3:34:18 27.1164 3.4847 21.3 22.9 23.4 16.4Serpens K 18:28:39.4 -3:45:28 26.9821 3.3390 21.5 22.9 24.3 17.3Serpens L 18:29:13.7 -3:45:28 27.0480 3.2125 22.2 23.6 24.5 17.5ρ Oph E E 16:31:56.7 -24:27:53 353.8780 15.9224 21.5 22.6 23.5 17.6ρ Oph E F 16:32:49.3 -24:29:24 353.9928 15.7544 21.4 22.7 23.7 17.8ρ Oph E G 16:32:48.2 -24:38:01 353.8765 15.6643 21.5 22.6 23.5 17.6ρ Oph E H 16:33:22.5 -24:40:14 353.9349 15.5415 21.5 22.7 23.7 17.8ρ Oph E I 16:33:24.6 -24:32:29 354.0423 15.6192 21.5 22.5 23.6 17.7ρ Oph E J 16:33:23.3 -24:25:16 354.1341 15.7009 21.4 22.6 23.6 17.7ρ Oph W B 16:28:00.1 -24:36:09 353.1580 16.5100 21.4 22.4 23.5 17.6ρ Oph W D 16:27:42.4 -24:43:33 353.0152 16.4791 20.3 21.0 22.4 16.5ρ Oph W D’ 16:27:42.3 -24:28:45 353.2084 16.6420 21.3 22.5 23.4 17.6ρ Oph W E 16:27:27.7 -24:36:09 353.0736 16.6023 20.9 22.6 23.5 17.7ρ Oph W G 16:27:09.1 -24:27:49 353.1339 16.7469 20.0 21.5 22.6 16.7Orion A F1 5:41:22.6 -8:34:35 212.7511 -19.4421 21.5 23.4 24.5 16.5Orion A F2 5:41:22.6 -8:25:57 212.6138 -19.3793 21.5 23.4 24.5 16.5
4.1. Orion A
The whole area has a high roughly constant extinction. Thetwo-step procedure was applied to the entire field, resulting inAVref > 6.8. From 13CO data in Fukui & Mizuno (1991) anindependent value ofAV ∼ 7 was derived using theAV−13COrelation in Bally et al. (1991).
4.2. Serpens andρ Oph
The fields were divided into overlapping squares of 1′ x 1′, sep-arated by 15′′. The number of stars within each square wassummed in 0.1 mag bins, providing the extinction relative tothe reference field.
The results for Serpens andρ Oph respectively areAVref >6.9 andAVref > 2.4. The same reference field was used forboth areas inρ Oph, since they are separated by only1.
The extinctions at the centres of the two areas inρ Oph wereestimated from13CO column densities in Loren (1989). Usingthe sameAV–13CO relation as in the Orion case,AV ∼ 11 wasdeduced. The present survey gives a lower limit ofAV = 7.5.For the reference field, the13CO gaveAV ∼ 3, whereas thissurvey gives a lower limit ofAVref = 2.4.
For both Orion A andρ Oph, the lower limits from thepresent survey are in good agreement with independent valuesderived from13CO data. This shows that reliable lower limitson the extinction can be obtained directly from theV RI data.The Serpens extinction, derived using the same method as forOrion andρ Oph, is therefore likely to be a reliable lower limitas well.
5. Selecting foreground stars
To really make use of the clouds as screens, crowded regionsmust be avoided. A conservative upper limit on the averagesurface density of stars brighter than the completeness limitswas set at 4 per arcmin2. The remaining areas are forρ Oph689 arcmin2 and for Serpens 412 arcmin2, 84 and 77 % ofthe respective original fields. For Orion A the entire field (158arcmin2) is sufficiently sparse.
Figures of the target areas, including selected foregroundstars and excluded regions are shown in App. A.
5.1. Colour-colour analysis
The reddened background stars separate from the foregroundmain sequence atV − R = R − I = 0.9 (M0V), resulting intwo parallell sequences separated by∼ 0.5 mag inV −R (Fig. 4).All stars within 0.15 mag of the empirical main sequence wereconsidered as foreground candidates by colour and had theirphotometric parallaxes measured (see Sect. below). The result-ing foreground M-dwarf sample is shown in Figs. 4 - 6togetherwith all reddened background stars bri ghter than the complete-ness limit.
In ρ Oph a number of bright stars fall inbetween the mainsequence and the reddened background stars. This is not a resultof systematic photometric errors, since in the same field thereare many stars lying perfectly on the reddening sequence. Theseobjects are preferably found inρ Oph W. Since they are absentfrom the Serpens area at a lower galactic latitude, reddenedM giants are not a likely explanation. Most probably they arerecently formed stars, still embedded in the nebula (see also Sect. 6 and Fig. 10).

L. Festin: The luminosity function of white dwarfs and M dwarfs using dark nebulae as opaque outer screens 887
R−I
V−
R
0.8 1 1.2 1.4 1.6 1.8 2 2.2 2.4
0.8
1.2
1.6
2
2.4
Fig. 4. Star brighter than the completeness limit, including the finalforeground M dwarfs in the Orion A area. Errors are 1σ. The dashedline is the main sequence. The solid line is a fit to the reddened back-ground stars inρ Oph and Serpens. Double ring objects are the fi-nally accepted sample of foreground candidates, fitting as such bothby colour and photometric distance. The two reddest final candidateswere also measured inJ and thereby confirmed to be unreddened ob-jects
R−I
V−
R
0.8 1 1.2 1.4 1.6 1.8 2 2.2 2.4
0.8
1.2
1.6
2
2.4
Fig. 5. Star brighter than the completeness limit, including the finalforeground M dwarfs in the Serpens area. Symbols are as in Fig. 4.Single rings are foreground candidates by colour, but not by distance
As photometric WD candidates those objects lying approx-imately in the region of the WDs in Bergeron et al. (1997) wereconsidered (Fig. 7). These objects are distinctly separated fromother stars and form a well-defined isolated group. Note that thereddest WDs systematically fall below the empirical sequence.This is probably caused by the increasingly different spectra in
R−I
V−
R
0.8 1 1.2 1.4 1.6 1.8 2 2.2 2.4
0.8
1.2
1.6
2
2.4
Fig. 6. Star brighter than the completeness limit, including the finalforeground M dwarfs in theρ Oph area. Symbols are as in Fig. 4 & 5
J−113
R−I
V−
R
0 0.4 0.8 1.2 1.6
0
1
2
Fig. 7.Photometric WD candidates. Symbols are as in Figs. 4- 6. Newsymbols: The shaded area outlines the WDs of Bergeron et al. (1997).Errorbars are 1σ. J-113 is a WD from JDH94
WDs as compared to the standard stars towards cooler temper-atures.
5.2. Photometric parallaxes
Photometric distances, although suffering from a large spread intheMV vsV −I relation, are used here as an additional tool forcleaning out background stars. As a bonus, cloud distances getindependent consistency checks. Note the lack of stars between400 and 500 pc for Orion A in Fig. 8, clearly indicating thatd = 480 pc is an overestimate of the distance.

888 L. Festin: The luminosity function of white dwarfs and M dwarfs using dark nebulae as opaque outer screens
5
5
11Orion
Serpens
ρOph
d (pc)
Nst
ars/
bin
200 400 600 8000
5
0
5
0
5
Fig. 8. Photometric mean distances to the photometric foreground M-dwarf candidates. The solid bars show the adopted cloud distances
To check possible foreground extinction, stars within7
from the target areas were selected from the UBV catalogueMermilliod (1987) via SIMBAD.EB−V was determined by theQ method for stars earlier than A0 (see e.g. Mihalas & Binney(1981)). Later stars with known spectral types were also used.For all three areas it was concluded that foreground extinctionis too small to affect the results of this paper.
5.2.1. M dwarfs
Each object was assigned a mean, min and max distance. Themean distance is derived from the composedMV vs V − Irelation in RG97. Min and max values come from their cor-responding1 σ spread . A histogram of the mean distances tothe colour-colour foreground candidates marked in Figs. 4- 6 isshown in Fig. 8. Stars consistent with being foreground objectsare distinctly sorted out. The final sample of probable fore-ground M dwarfs consists of 21 stars (Table 2).
5.2.2. White dwarfs
Photometric distances were estimated via a linear least-squarefit of MV vs V − I of the WDs in Bergeron et al. (1997) withparallax errors less than 30 % :
MV = 12.67 + 2.48 (V − I) (σ = 0.3)
This functional form provides only a rough estimate of theWD absolute magnitude. One should keep in mind that thereare WDs like ESO439-26 (Ruiz et al. 1995) that do not followthis relation in the least.
It is possible, although unlikely, that these WD candidatesare reddened background stars. Since the background extinctionat the position of the WD candidates in all cases is estimated to
hz21
serpwd3
G93−48
serpwd1
wavelength (Å)
norm
aliz
ed li
near
flux
4000 4500 5000 5500 6000 6500
Fig. 9. Low-resolution spectra of two of the Serpens WDs. The dottedlines show HeI lines, dased lines are HeII and solid lines H. Note thesky lines atλλ5890, 6867 (Na D, and atmospheric B band)
exceed 6.8 mag inV (Table 2), a through-shining star of thesame colour as our reddest WD candidate (V − I ∼ 1.5) wouldhave an unreddened colour(V − I)0 < −1.2. There are nosuch stars. Suppose that they are indeed early-type stars shiningthrough low-extinction windows. A B1V star behind OrionAwould th en have to be at a distance of about 0.5 Mpc to fitthe observed magnitudes, i.e 160 kpc above the galactic plane,which is unrealistic. The simplest answer is that these objectsare indeed foreground WDs.
5.2.3. Spectroscopic confirmation of white dwarfs
In Fig. 9, spectra taken at the NOT of the two brightest WDsare compared with two spectrophotometric standard stars. Hz21is a He-rich WD of type DO, while G93-48 is of type DA.The serpwd3 spectrum is classified as type DB, since it onlyshows HeI lines (Dreizler & Werner 1996). The second WDis serpwd1, showing a rather noisy spectrum due to its faintmagnitude. However, the absence of prominent spectral featuresin combination with its magnitude and colour makes it a verylikely WD.
6. Constraints on foreground candidates from othersurveys
The Orion A area (L1641) has been extensively surveyed inthe infrared (Strom et al. (1989, 1993); Ali & Depoy 1995). InStrom et al. (1989) there is one overlapping object, howevernot a foreground one. The other two surveys are deeper butunfortunately do not overlap.
In ρ Oph, the western area was entirely covered inJHKin a survey by Barsony et al. (1997). There are 30 overlap-ping sources brighter than our completeness limits, includingall three foreground candidates in this area (ophmd3–5 in Ta-ble 2). In Fig. 10 the appearance of the overlapping sample inV RI is compared toIJK. Ophmd3 and 4 are confirmed asforeground by the additionalJHK data. For ophmd5, the threeindependentJHK measurements are not consistent, implying

L. Festin: The luminosity function of white dwarfs and M dwarfs using dark nebulae as opaque outer screens 889
Table 2.Final foreground candidates. Photometric errors are internal and 1σ. The photometric system isRI Kron-Cousins (KC) andV Johnson(J). Upper and lower distance limits are also 1σ (σ originating mainly from cosmic spread in theMV - V − I relation.AV is the lower limit ofthe background extinction at each star’s position. The last column is the weighted count each star gets when reduced to the solar neighbourhood
id RA (2000) DEC (2000) IKC RKC − IKC VJ − IKC MV dm d+ d− AV w.ct.omd 1 5:41:22.7 -8:22:21 15.77 0.01 1.50 0.01 2.64 0.01 11.6 230 195 270 6.8 1.32omd 2 5:41:38.6 -8:30:18 15.95 0.01 1.26 0.01 2.29 0.01 10.6 346 295 407 6.8 1.32omd 3 5:41:14.0 -8:38:19 15.99 0.01 1.30 0.01 2.38 0.01 10.8 324 276 381 6.8 1.32omd 4 5:41:17.5 -8:29:44 16.10 0.01 1.50 0.01 2.65 0.01 11.7 267 228 314 6.8 1.32omd 5 5:41:04.5 -8:38:23 17.26 0.01 1.53 0.01 2.74 0.01 12.2 381 308 471 6.8 1.32omd 6 5:41:14.8 -8:25:45 17.34 0.01 1.58 0.01 2.89 0.01 13.0 290 235 358 6.8 1.32omd 7 5:41:19.8 -8:30:48 17.87 0.01 1.62 0.01 2.89 0.01 13.0 370 300 458 6.8 1.32omd 8 5:41:31.8 -8:22:39 18.09 0.01 1.83 0.01 3.27 0.01 14.3 262 232 295 6.8 1.32omd 9 5:41:23.7 -8:35:42 18.35 0.01 1.81 0.01 3.21 0.01 14.2 300 266 338 6.8 1.32omd10a 5:41:21.5 -8:23:09 19.63 0.02 2.00 0.02 3.72 0.06 15.5 382 339 430 6.8 1.32omd11b 5:41:18.9 -8:27:39 20.12 0.01 2.33 0.04 4.17 0.11 16.6 358 317 403 6.8 1.32
serpmd1 18:27:10.8 -3:43:59 16.66 0.01 1.64 0.01 2.94 0.01 13.2 186 151 230 7.6 1.03serpmd2 18:27:57.2 -3:31:37 15.02 0.01 1.25 0.01 2.21 0.01 10.3 241 205 283 11.3 1.03serpmd3 18:27:53.8 -3:36:53 16.10 0.01 1.68 0.01 3.02 0.01 13.6 125 110 140 8.9 1.03serpmd4 18:28:32.8 -3:34:53 16.81 0.01 1.61 0.01 2.91 0.01 13.1 212 171 262 9.9 1.03serpmd5 18:29:20.3 -3:44:15 17.29 0.01 1.66 0.01 3.03 0.01 13.7 212 189 240 12.1 1.03
ophmd1 16:33:02.6 -24:30:14 14.60 0.01 1.54 0.01 2.84 0.01 12.7 88 71 108 4.8 1.09ophmd2 16:32:42.8 -24:26:55 15.93 0.01 1.67 0.01 3.08 0.01 13.8 109 97 123 6.6 1.09ophmd3 16:27:30.4 -24:32:34 14.43 0.01 1.38 0.01 2.48 0.01 11.1 143 122 168 7.8 1.09ophmd4 16:27:36.5 -24:28:33 13.46 0.01 1.42 0.01 2.47 0.01 11.1 92 78 108 7.8 1.09ophmd5 16:27:26.6 -24:25:54 15.99 0.01 2.09 0.01 3.93 0.01 16.0 60 53 68 7.8 1.09
IKC RKC VJ
owd 1 5:41:37.7 -8:36:09 22.00 0.14 22.78 0.06 23.25 0.04 15.8 313 269 365 6.8 1.32owd 2 5:41:04.0 -8:23:09 21.24 0.03 21.89 0.03 22.38 0.02 15.5 238 207 273 6.8 1.32owd 3 5:41:22.6 -8:22:50 22.83 0.10 23.55 0.15 24.08 0.12 15.8 459 393 537 6.8 1.32
serpwd1 18:28:05.6 -3:40:02 20.38 0.02 20.79 0.01 21.14 0.01 14.6 208 181 239 9.6 1.03serpwd2 18:27:45.0 -3:46:01 20.51 0.02 20.98 0.02 21.47 0.01 15.0 192 167 221 9.9 1.03serpwd3 18:27:41.6 -3:40:38 17.88 0.01 17.90 0.01 17.87 0.01 12.6 111 96 127 12.6 1.03serpwd4 18:28:26.3 -3:43:52 21.14 0.05 21.96 0.04 22.61 0.02 16.3 181 157 208 11.6 1.03
a JCIT = 17.77 (0.06)b JCIT = 18.08 (0.07)
either variability or a problem in the photometry. The fact thatophmd5 does not keep its position relative to the bulk of thebackground stars betweenV RI andIJK supports it being aforeground star of spectral type about M6V.
Theρ Oph E area was covered inV RI by Jarrett (JDH94+ thesis). Both our candidates in this area (ophmd1–2) havemagnitudes consistent with theirs, and are considered as pos-sible foreground stars in Jarrett (1992). Ophmd2, though, wasrejected from the foreground candidates in JDH94. Both starsare slightly redder than the main sequence inV − R (Fig. 6),but are still regarded as foreground stars. See Sect. 8.1 for athorough comparison to Jarrett’s results.
In our Serpens field, no complementary photometric datacould be found.
7. The luminosity function
A simplified version of theVmax method (Felten 1976),outlined below, was used to derive the LF. In a photometricsurvey each star has a maximum distance,dmax, at which itstill can be detected. The corresponding maximum volume,Vmax, is defined by the survey area anddmax. Each star’scontribution to the LF is thenV −1
max. In order to compensatefor galactic density gradients and reduce the derived LF to thesolar neighbourhood,Vmax must be replaced byVmax,gen, ageneralized volume (Tinney 1993):
Vmax,gen = Ω∫ dmax
0 r2e−rsin|b|/hdr,
where Ω denotes the angular area of the field,h the diskscale height andb the galactic latitude. The distances involvedhere are small enough to neglect the radial density gradient

890 L. Festin: The luminosity function of white dwarfs and M dwarfs using dark nebulae as opaque outer screens
I−J
I−K
M3V
M5VM6V
1 2 3 4
2
4
6
8
R−I
V−
R
M3V
M5V
M6V
1.4 1.8 2.2 2.6
1
2
3
Fig. 10.Overlapping near-IR sources. The two earliest foreground can-didates are represented in the upper panel by mean values of theJKmagnitudes given in Barsony et al. (1997), Strom et al. (1995) andGreene et al. (1992). Individual values were used for the latest candi-date, triangle ( Barsony), pentagram (Strom) and box (Greene). Dashedlines are the corresponding main sequences and the solid lines showthe empirical reddening sequences
in the Galaxy. Both the M-dwarf and WD distribution wasapproximated by the old disk population, with a scale heighth = 350 pc (Bahcall & Soneira 1980). DerivingVmax is atrivial operation in a dark cloud survey, since for all starsbrighter than the completeness limit (in absolute magnitude)dmax = dcloud. This is an important point of this paper, thesurvey volume not being derived through a colour-magnituderelation having a large cosmic spread. Table 3 gives thephysical and generalized values of the foreground volumes.The last column in Table 2 shows the weighted count foreach foreground star ded uced asVmax/Vmax,gen. Errors in thedistances to the clouds are expected to be on the order of 10 %,implying volume uncertainies of∼ 30 %. This uncertinty hasnot been included in the further analysis.
7.1. M dwarfs, main sequence
The majority of foreground stars are early-type M dwarfs,2.5 <V −I < 3.2, reflecting the well-known peak in the LF. The lownumber of M dwarfs (21) implied a rather coarse binning in the
Table 3.Observed volumes in pc3
area Vmax Vmax,gen
Orion A 285 216Serpens 193 188ρ Oph 66 60
total 544 464
Table 4. The foreground M-dwarf sample binned into 1-mag bins inMV. The 2nd last bin is complete in 70 % of the volume and the lastbin in 26 %. No correction for incompleteness has been applied
bin systems binary correctedMV N Ngen cum Ngen cum10-11 3 3.67 3.67 4.49 4.4911-12 4 4.82 8.49 6.19 10.6812-13 2 2.41 10.90 4.46 15.1413-14 7 7.85 18.75 9.30 24.4514-15 2 2.64 21.39 4.20 28.6515-16 1 1.32 22.71 2.62 31.2716-17 2 2.41 25.12 3.06 34.3317-18 0 0 25.12 0.80 35.13
LF. Table 4 gives the LF in 1-mag bins, while in Fig. 11 2-magbins were chosen. The agreement with previously determinedLFs is satisfactory.
For stars brighter thanMV = 10 (∼ M1V) the number thatis lost due to saturation starts to become significant. These starsare therefore not considered further.
The large spread in the faint bins in Fig. 11 illustrates thepresent uncertainty in the stellar LF. The Poissonian 1σ uncer-tainties in Jahreiss & Wielen (1997) and RG97 are about 30 %in the last two bins.
7.1.1. Lost companions
RG97 found that the number of lost unresolved companionsapproximately is compensated for by distant stars spread into amagnitude limited sample via Malmquist bias. This will not bethe case in this survey, since the foreground sample is strictlyvolume limited and there is a dark cloud preventing distant starsfrom interfering. The number of lost companions was estimatedfrom the binary distribution in the nearby stars in RG97. Afterapplying the correction for galactic structure 10 companionswere expect ed to have been lost. These were distributed as thelost binary companions in Fig. 12 of RG97 and added to oursystem LF. The resulting companion-corrected LF is shown inFig. 11 and Table 4.
7.2. White dwarfs
The sample of WDs is too small to derive any details in the WDLF. Seven WDs were found, 0.015 (±0.006) pc−3 (Poissonianerrors), which is a significantly higher number than expected

L. Festin: The luminosity function of white dwarfs and M dwarfs using dark nebulae as opaque outer screens 891
MV
1000
(st
ars
V−
mag
−1 p
c−3 )
10 11 12 13 14 15 16 17 18
8
16
24
20
40
60 cumulative LF
normal LF
Fig. 11.The M-dwarf luminosity function. The dashed line is the sys-tem LF and the solid line the single-star LF derived after binary correc-tion. Diamonds and stars show the LF of Kirkpatrick et al. (1994) andGould et al. (1996) respectively. Asterisks and circles outline the LF ofthe nearby stars in RG97 and Jahreiss & Wielen (1997) respectively.The error bars show Poisson errors of the generalized counts before bi-nary correction. Errors i n the LF arising from uncertain cloud distanceshave not been included (expected to be∼ 30 %). The incompletenessin the last bin (see Table 4) has not been corrected for
from LDM88 (0.003 pc−3), but in better agreement with RT95and Oswalt et al. (1996), who both give∼ 0.008 pc−3. Thesenumbers will be dicussed in more detail in Sect. 8.2.
8. Dicussion, comparison to other works
For the M-dwarf part, the agreement with other photometric sur-veys is satisfactory (Fig. 11). It is clear that any contaminationof the M-dwarf sample from background stars and/or stars asso-ciated with the clouds must be small and that the opaque-nebulamethod works reliably also in a purely photometric version,provided that the photometry is sufficiently accurate.
The main advantage in comparison to other methods is thatthe survey volume does not rely on photometric parallaxes. Eventhough the individual absolute magnitudes do suffer from cos-mic spread in the colour-magnitude relation, each star’s contri-bution to the space density does not.
If the distance to the cloud is not known a priori, it can eitherbe estimated from the photometric distances of the foregroundobjects or by their integrated number in a well-known part ofthe LF. In this context it would be useful to obtain more data forforeground stars brightwards of the peak in the LF atMV = 12.
J220
J221J74
J19
J218
J43
1.4 1.6 1.8 2 2.2 2.4
1.2
1.4
1.6
1.8
2
2.2
2.4
R−I
V−
R
Fig. 12. A comparison with JDH94. The dashed line marks the mainsequence and the dots outline the reddening sequence. The + signs markthe overlapping objects with 1σ errorbars. The JDH94 counterparts aremarked with Jx, x indicating the id in Table 3 in JDH94. The dotted linesshow the deduced colour differences. For J74 there are two independentmeasurements in our survey
The derived samples are volume limited and unaffected bydynamical bias. Finally, the dark clouds effectively screen back-ground galaxies and giant stars from the foreground population.
Among the drawbacks are that the selected foreground ob-jects in general will be too distant for binaries to be resolvedand therefore the derived LF must be corrected for by an a pri-ori known binary distribution function. The dark clouds are notevenly spread across the sky, which means that the availableareas are restricted. On the other hand, they do provide a toolfor probing areas near the Milky Way plane.
8.1. The Jarrett paper
We compare our result with that of JDH94. The generalizedvolume sampled in that paper is 52 pc3 (ρ Oph) + 101 pc3
(Taurus), totally 153 pc3. A striking difference as compared toour survey is their excess of late foreground candidates, seen alsoin the Barnard 5 survey (Jarrett 1995). The comparison here wasmade inρ Oph E, where part of our surveys overlap. Five of theirsix foreground candidates that were cross identified lie perfectlyon the reddening sequence in o ur data and are definitely notforeground objects (Fig. 12). Since our data for the bright J43are consistent, the photometric calibration is likely to be correct.A possible explanation of the colour discrepancy is that thesesources were spread into the JDH94 foreground sample as aresult of their lower signal-to-noise ratio. Our data reach∼ 2magnitudes deeper than JDH94. It may also be that the JDH94photometry is subject to systematically discrepant correctionsfor atmospheric correction, since their data were acquired athigh air masses (∼ 2, Jarrett, priv comm.). The tendency thatvery faint stars, barely measurable, scatter into the M-dwarfzone is seen also in our data, and was the mai n reason forincluding objects only to the completeness limit and not all the
892 L. Festin: The luminosity function of white dwarfs and M dwarfs using dark nebulae as opaque outer screens
way down to the detection limit of the survey, about 1 magfainter.
8.2. White dwarfs
A local number density of 0.015 (±0.006) WDs pc−3 was de-rived from the 7 WDs discovered in this survey. This is a factor 5more than predicted from LDM88. RT95 found 0.008 (±0.003)WDs pc−3 in a proper motion survey, consistent with our re-sult, but as in our case the numbers are small. An interestingresult is that Ruiz et al. (1993) found a factor 2 more stars withµ > 0.5” yr−1 than present inLHS (Luyten 1976) for over-lapping areas. The LDM88 sample was drawn fromLHS andwould also be affected by this proposed incompleteness, a factthat may explain the discrepancy in the LDM88 WD density ascompared to more recent results.
Oswalt et al. (1996) used yet another approach and arrivedat 0.0053+.0035
−0.0007 WDs pc−3 for WDs in wide binaries. Theyadded the single-WD LF in LDM88 (0.0023 WDs pc−3) andconcluded that the total space density of WDs in the solar neigh-bourhood is0.0076+.0037
−0.0007 WDs pc−3. Our results and RT95show that the LDM88 sample is likely to suffer from a ratherlarge incompleteness, suggesting that adding 0.0023 WDs pc−3
to the binary part results in a subs tantial underestimation of thetotal WD space density.
Our sample of WDs includes neither wide nor narrow bina-ries, except possible double WDs. If we add our WD density tothe Oswalt binaries the result is 0.02 (±0.007) WDs pc−3, cor-responding to 0.013 (±0.005) M pc−3 if we assume a meanmass of 0.65 M per WD. The WD fraction of the dynami-cal mass would then be 17 (±7) %. Objects like ESO 439-20(RT95) and WD 0346+246 (Hambly et al. 1997) suggest thatthe WD density may be even larger.
The results of the MACHO micro lensing experiment (Al-cock et al. 1997) have given a mean mass of the lensing objectsof ∼ 0.5 M, although strongly model dependent. The MA-CHO mass density in the solar neighbourhood is on the order of0.005 M pc−3, which in fact is consistent with the proposedincrease of the WD space density. However, more definite re-sults will have to await a larger volume limited sample of WDs.
9. Conclusions and future prospects
The space density of M dwarfs and WDs has been studied asvolume limited samples in front of dark high extinction nebulae,a method that efficiently reduces the impact of Malmquist bias,since the survey is volume limited and the LF not dependeningon individual photometric distance estimates. Areas towards themolecular cloud complexesρ Oph, Serpens and Orion A wereobserved. The survey covers a volume corresponding to 464 pc3
in the solar neighbourhood, complete toMV ∼ 16.5. In to tal21 M dwarfs and 7 WDs were identified as foreground objects.
Although details are hard to resolve due to the limited sam-ple, our M-dwarf LF is consistent with previous photometricresults, and after binary correction also with the nearby stars.Our survey does not show any signs of the reported upturn in
39´o
−8
36´o
−8
33´o
−8
30´o
−8
27´o
−8
24´o
−8
21´o
−8
0541sm
1541sm
2541sm
3541smh
5
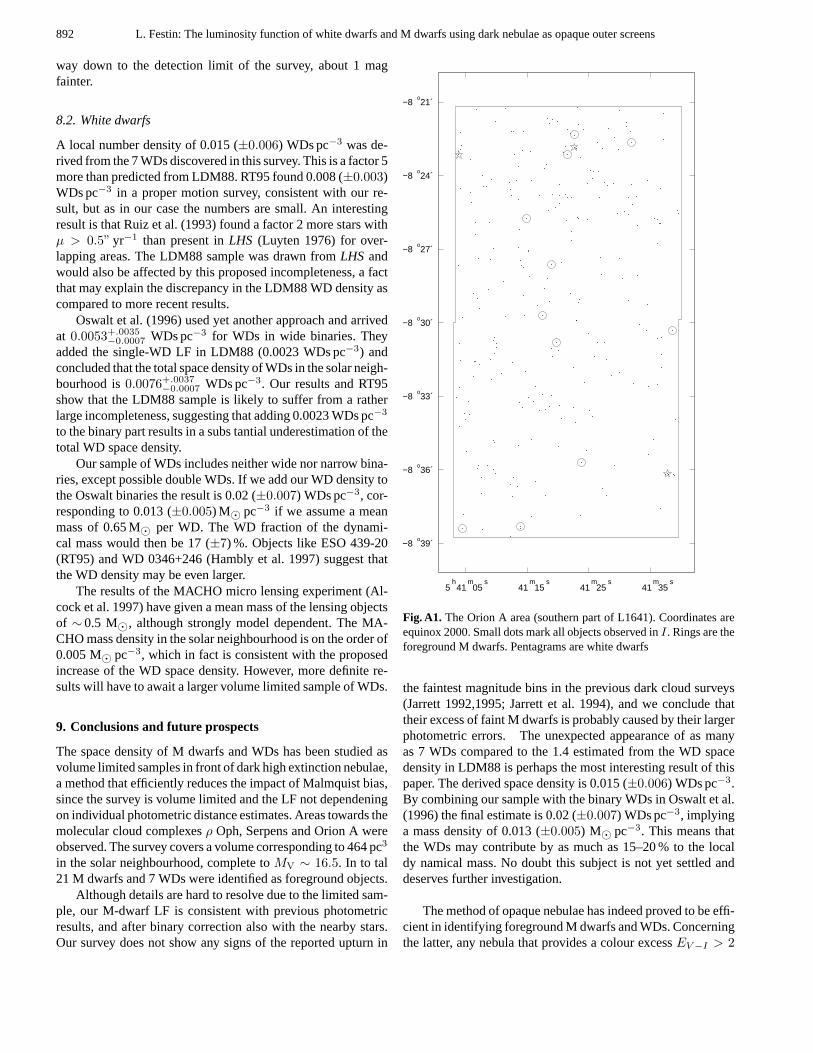
Fig. A1. The Orion A area (southern part of L1641). Coordinates areequinox 2000. Small dots mark all objects observed inI. Rings are theforeground M dwarfs. Pentagrams are white dwarfs
the faintest magnitude bins in the previous dark cloud surveys(Jarrett 1992,1995; Jarrett et al. 1994), and we conclude thattheir excess of faint M dwarfs is probably caused by their largerphotometric errors. The unexpected appearance of as manyas 7 WDs compared to the 1.4 estimated from the WD spacedensity in LDM88 is perhaps the most interesting result of thispaper. The derived space density is 0.015 (±0.006) WDs pc−3.By combining our sample with the binary WDs in Oswalt et al.(1996) the final estimate is 0.02 (±0.007) WDs pc−3, implyinga mass density of 0.013 (±0.005) M pc−3. This means thatthe WDs may contribute by as much as 15–20 % to the localdy namical mass. No doubt this subject is not yet settled anddeserves further investigation.
The method of opaque nebulae has indeed proved to be effi-cient in identifying foreground M dwarfs and WDs. Concerningthe latter, any nebula that provides a colour excessEV −I > 2

L. Festin: The luminosity function of white dwarfs and M dwarfs using dark nebulae as opaque outer screens 893
54´o
−3
48´o
−3
42´o
−3
36´o
−3
30´o
−3
00sm
30sm
00sm
30sm
00sm
30sm
27 27 28 28 29 29h
18
Fig. A2. Serpens (∼ 4 south of the Serpens cloud core). Coordinates are equinox 2000. Symbols as in Fig. A1. Filled areas were rejected fromthe survey due to high stellar density (Sect. 5)
48´o
−24
42´o
−24
36´o
−24
30´o
−24
24´o
−24
00sm
30sm
00sm
30sm
31 32 33 33h
1600sm
30sm
00sm
27 27 28h
16
Fig. A3. ρ Oph W (left, L1688) andρ Oph E (right, L1689). Coordinates are equinox 2000. Symbols as in Figs. A1 - A2

894 L. Festin: The luminosity function of white dwarfs and M dwarfs using dark nebulae as opaque outer screens
(AV > 5) ensures that also the bluest main sequence stars get areddened colour beyond the reddest known WDs (V −I ∼ 1.5).Already for Orion A the available area is∼ 50 times larger thanour field, enclosing a volume that would host∼ 150 WDs and∼ 550 M dwarfs, numbers that certainly are sufficien t for amore detailed analysis of the corresponding LFs. The increasedavailability of large field CCDs and CCD mosaics provides theideal tools for this kind of survey. We have also shown that thedistance to the clouds and the cloud extinction may be reliablyderived from theV RI data alone, an important point if a futurelarge-scale survey of this kind is to be carried out.
Acknowledgements.I wish to thank the ESO OPC for allocating ob-serving time for this exciting project. This work was supported by theNordic Optical Telescope Scientific Association and the Swedish Nat-ural Science Research Council (NFR). This research has made use ofthe Simbad database, operated at CDS, Strasbourg, France
Appendix A: the observed areas: see Figs. A1-A3
References
Alcock C., Allsman R. A., Alves D., et al. 1997, ApJ 486, 697Ali B., DePoy D. L. 1995, AJ 109, 709Anthony-Twarog B. J. 1982, AJ 87, 1213Bahcall J. N., Soneira R. M. 1980, ApJS 44, 73Bahcall J. N., Flynn C., Gould A. 1992, ApJ 389, 234Bally J., Langer W. D., Liu W. 1991, ApJ 383, 645Barsony M., Kenyon S. J., Lada E. A., Teuben P. J. 1997, ApJS 112,
109Bergeron P., Ruiz M. T., Leggett S. K. 1997, ApJS 108, 339Creze M., Chereul E., Bienayme O., Pichon C. 1997, in: B. Battrick
(ed.), Hipparcos Venice ’97, p. 669, ESA SP-402Dickman R. L. 1978, AJ 83, 363Dreizler S., Werner K. 1996, A&A 314, 217Elias J. H. 1978, ApJ 224, 857ESA 1997, The Hipparcos and Tycho Catalogues, ESA SP-1200Felten J.E. 1976, ApJ 207, 700Festin L. 1997, A&A 322, 455Festin L. 1998, A&A 333, 497Fukui Y., Mizuno A. 1991, in: E. Falgarone, F. Boulanger, G. Duvert
(eds.), Fragmentation of Molecular Clouds and Star Formation:IAU Symp. 147, p. 275
Gould A., Bahcall J. N., Flynn C. 1996, ApJ 465, 759Greene T. P., Young E. T. 1992, ApJ 395, 516Hambly N. C., Smartt S. J., Hodgkin S. T. 1997, ApJ 489, L157Haywood M., Robin A. C., Creze M. 1997, A&A 320, 440Herbst W., Dickman R. L. 1983, in: A. G. Davis Philip, A. R. Upgren
(eds.), The Nearby Stars and the Stellar Luminosity Function: IAUColl. 76, p. 187
Hilton J. & Lahulla J. F. 1995, A&AS 113, 325Hunt L. K., Migliorini S., Testi L., et al. 1995, AJ, submittedJahreiss H., Wielen R. 1997, in: B. Battrick (ed.), Hipparcos Venice
’97, p. 675, ESA SP-402Jarrett T. H. 1992, Ph.D. thesis, Massachusetts Univ., Amherst.Jarrett T. H., Dickman R. L., Herbst W. 1994, ApJ 424, 852Jarrett T. H. 1995, in: C. G. Tinney (ed.), The bottom of the main
sequence -and beyond, Springer, Berlin, p. 187Kirkpatrick J. D., McGraw J. T., Hess T. R., Liebert J., McCarthy Jr.
D. W. 1994, ApJS 94, 749Kroupa P. 1995, ApJ 453, 358
Kroupa P., Tout C., Gilmore G. 1993, MNRAS 262, 545Landolt A. U. 1992, AJ 104, 340Liebert J., Dahn C. C., Monet D. G. 1988, ApJ 332, 891Loren R. B. 1989, ApJ 338, 902Luyten W. J. 1976, The LHS Catalogue, University of MinnesotaMera D., Chabrier G., Baraffe I. 1996, ApJ 459, L87Mermilliod J. C. 1987, A&AS 71, 119Mihalas D. & Binney J. 1981, in: Galactic astronomy: Structure and
kinematics /2nd edition/, W. H. Freeman and Co., San FranciscoOswalt T. D., Smith J. A., Wood M. A., Hintzen P. 1996, Nat 382, 692Reid I. N., Gizis J. E. 1997, AJ 113, 2246Ruiz M. T., Takamiya M. Y. 1995, AJ 109, 2817Ruiz M. T., Bergeron P., Leggett S. K., Anguita C. 1995, ApJ 455,
L159Ruiz M. T., Takamiya M. Y., Mendez R., Maza J., Wishnjewsky M.
1993, AJ 106, 2575Scalo J. M. 1986, Fund. Cosm. Phys. 11, 1Straizys V., Cernis K., Bartasiute S. 1996, Baltic Astronomy 5, 125Strom K. M., Kepner J., Strom S. E. 1995, ApJ 438, 813Strom K. M., Newton G., Strom S. E., et al. 1989, ApJS 71, 183Strom K. M., Strom S. E., Merrill K. M. 1993, ApJ 412, 233Tinney C. G. 1993, ApJ 414, 254Warren W. H., Hesser J. E. 1978, ApJS 36, 497Winkler, H., 1997, MNRAS 287, 481


![Contents · Web view2018-08-09 · Submissions should be emailed in Word format to . ... 24 381 012. C. Average staff [C = A / B] 0.003. 0.003. 0.003. ... allowances relating to](https://static.fdocuments.us/doc/165x107/5ca060a688c993c5178d1719/contents-web-view2018-08-09-submissions-should-be-emailed-in-word-format-to.jpg)