Astronomical calibration of Gauss to Matuyama...
19
226 Earth and Planetary Science Letters, 104 (1991) 226-244 Elsevier Science Publishers B.V., Amsterdam [XLeP] Astronomical calibration of Gauss to Matuyama sapropels in the Mediterranean and implication for the Geomagnetic Polarity Time Scale F.J. Hilgen Department of Geology, Institute of Earth Scienees, Budapestlaan 4, 3584 CD Utrecht, The Netherlands Received July 26, 1990; revision accepted March 1, 1991 ABSTRACT The late Pliocene-early Pleistocene sapropel-bearing sequences exposed in the Vrica, Semaforo, Singa and Punta Piccola sections of southern Italy and the Francocastello section on Crete have been calibrated to the new astronomical solutions for the precession of the equinox and the eccentricity of the Earth's orbit using inferred phase relationships between these orbital cycles and the sapropel cycles. A new Mediterranean Precession-Related Sapropel (MPRS) coding is introduced according to which sapropels are coded after the correlative peak of the precession index as numbered from the Recent. These sapropels can now be dated with an accuracy of 1 ka by taking a time lag of 4 ka between orbital forcing, and maximum climate response and sapropel formation into account. This tuning further results in ages for the Pliocene-Pleistocene boundary (1.81 Ma), the top of the Olduvai (1.79 or 1.84). the bottom of the Olduvai (1.95 _+0.01), the Reunion (2.14-2.15), the Gauss/Matuyama (2.59/2.62) and the top of the Kaena (3.02 _+0.01). These ages are remarkably similar to the astronomically calibrated ages obtained independently by Shackleton et al. based on ODP Site 677 ([1], Trans. R. Soc. Edinb., 81, 1990), but deviate considerably from those provided by Ruddiman et al. ([2], Paleoceanography, Vol. 4) and Raymo et al. based on DSDP Site 607 ([3], Paleoceanography, Vol. 4). The constant discrepancy of 130 ka with the time scale of Ruddiman et al. and Raymo et al. is explained by the new age of 0.78 instead of 0.73 Ma for the Brunhes/Matuyama, as recently proposed by Shackleton et al., and the fact that Ruddiman et al. missed two obliquity related cycles in the Brunhes/Matuyama to top Olduvai interval. Our astronomically calibrated ages do not confirm the conventional radiometric ages of the reversal boundaries, but, on the contrary, imply that K/Ar radiometric dating yields ages that are consistently too young by 5-7%. 1. Introduction The Olduvai Subchron was originally defined as the event of normal polarity within the reversed Matuyama Chron, which was recorded in basalts and tufts intercalated in the basal part of the sedimentary succession in the Olduvai Gorge in Tanzania [4,5]. Based on numerous radiometric (K/At) datings from different localities, it is pre- sently assumed that the Olduvai Subchron lasted from 1.87 to 1.67 Ma [6]. By approximation, these ages also appear in widely used polarity time scales which are essentially based on linear inter- polation between radiometrically dated age calibration points in marine magnetic anomaly sequences [7,8]. 0012-821x/91/$03.50 © 1991 - Elsevier Science Publishers B.V. At present, an alternative method is being de- veloped which can be used to assign absolute ages to geomagnetic polarity reversals, i.e. the tuning of proxy records climatic to the astronomical solu- tions for the variations in the Earth's orbit. The primary goal of these tuning procedures was to evaluate the orbital theory of the Pleistocene ice ages and to develop a high-resolution time scale for the last 780,000 years [9]. At the same time, this tuning procedure may provide very accurate, absolute ages for polarity reversals if a detailed magnetostratigraphy of these proxy records can be determined. This tuning is already well established for records spanning the last 700,000 years [9-12], and application of this procedure to immediately older sequences yielded ages for the reversal
Transcript of Astronomical calibration of Gauss to Matuyama...
226 Earth and Planetary Science Letters, 104 (1991) 226-244 Elsevier Science Publishers B.V., Amsterdam
[XLeP]
Astronomical calibration of Gauss to Matuyama sapropels in the Mediterranean and implication for the Geomagnetic
Polarity Time Scale
F . J . H i l g e n
Department of Geology, Institute of Earth Scienees, Budapestlaan 4, 3584 CD Utrecht, The Netherlands
Received July 26, 1990; revision accepted March 1, 1991
ABSTRACT
The late Pliocene-early Pleistocene sapropel-bearing sequences exposed in the Vrica, Semaforo, Singa and Punta Piccola sections of southern Italy and the Francocastello section on Crete have been calibrated to the new astronomical solutions for the precession of the equinox and the eccentricity of the Earth's orbit using inferred phase relationships between these orbital cycles and the sapropel cycles. A new Mediterranean Precession-Related Sapropel (MPRS) coding is introduced according to which sapropels are coded after the correlative peak of the precession index as numbered from the Recent. These sapropels can now be dated with an accuracy of 1 ka by taking a time lag of 4 ka between orbital forcing, and maximum climate response and sapropel formation into account.
This tuning further results in ages for the Pliocene-Pleistocene boundary (1.81 Ma), the top of the Olduvai (1.79 or 1.84). the bottom of the Olduvai (1.95 _+ 0.01), the Reunion (2.14-2.15), the Gauss/Matuyama (2.59/2.62) and the top of the Kaena (3.02 _+ 0.01). These ages are remarkably similar to the astronomically calibrated ages obtained independently by Shackleton et al. based on ODP Site 677 ([1], Trans. R. Soc. Edinb., 81, 1990), but deviate considerably from those provided by Ruddiman et al. ([2], Paleoceanography, Vol. 4) and Raymo et al. based on DSDP Site 607 ([3], Paleoceanography, Vol. 4). The constant discrepancy of 130 ka with the time scale of Ruddiman et al. and Raymo et al. is explained by the new age of 0.78 instead of 0.73 Ma for the Brunhes/Matuyama, as recently proposed by Shackleton et al., and the fact that Ruddiman et al. missed two obliquity related cycles in the Brunhes/Matuyama to top Olduvai interval. Our astronomically calibrated ages do not confirm the conventional radiometric ages of the reversal boundaries, but, on the contrary, imply that K /Ar radiometric dating yields ages that are consistently too young by 5-7%.
1. Introduction
T h e O l d u v a i S u b c h r o n was o r ig ina l ly d e f i n e d
as the even t o f n o r m a l po l a r i t y w i th in the r eve r sed
M a t u y a m a C h r o n , wh ich was r e c o r d e d in basa l t s
a n d tuf ts i n t e r c a l a t e d in the basa l pa r t o f the
s e d i m e n t a r y success ion in the O l d u v a i G o r g e in
T a n z a n i a [4,5]. Based on n u m e r o u s r a d i o m e t r i c
( K / A t ) da t ings f r o m d i f f e r en t local i t ies , it is pre-
sent ly a s s u m e d tha t the O l d u v a i S u b c h r o n las ted
f r o m 1.87 to 1.67 M a [6]. By a p p r o x i m a t i o n , these
ages also a p p e a r in w ide ly used po l a r i t y t ime
scales wh ich are essen t ia l ly ba sed on l inear in te r -
p o l a t i o n b e t w e e n r a d i o m e t r i c a l l y d a t e d age
c a l i b r a t i o n p o i n t s in m a r i n e m a g n e t i c a n o m a l y
s equences [7,8].
0012-821x/91/$03.50 © 1991 - Elsevier Science Publishers B.V.
A t p resen t , an a l t e r n a t i v e m e t h o d is be ing de-
v e l o p e d wh ich can be used to ass ign a b s o l u t e ages
to g e o m a g n e t i c p o l a r i t y reversa ls , i.e. the t u n i n g of
p r o x y r eco rds c l i m a t i c to the a s t r o n o m i c a l solu-
t ions for the v a r i a t i o n s in the E a r t h ' s orbi t . T h e
p r i m a r y goa l o f these t u n i n g p r o c e d u r e s was to
e v a l u a t e the o rb i t a l t h e o r y of the P l e i s tocene ice
ages and to d e v e l o p a h i g h - r e s o l u t i o n t ime scale
for the last 780,000 years [9]. A t the s a m e t ime,
this t u n i n g p r o c e d u r e m a y p r o v i d e ve ry accura te ,
a b s o l u t e ages for p o l a r i t y reversa ls if a de t a i l ed
m a g n e t o s t r a t i g r a p h y of these p r o x y r eco rds c a n be
d e t e r m i n e d . Th i s t u n i n g is a l r e ady wel l e s t ab l i shed
for r eco rds s p a n n i n g the last 700,000 years [9-12] ,
a n d a p p l i c a t i o n of this p r o c e d u r e to i m m e d i a t e l y
o lde r s e q u e n c e s y i e lded ages for the reversa l

A S T R O N O M I C A L C A L I B R A T I O N O F G A U S S TO M A T U Y A M A S A P P R O P E L S 227
40 ° 50 ° 20 °
i
Y
i
I
10 ° 0 o 10 ° 20 ° 30 ° 4 0 ° 50 °
Fig. 1. Locat ion of land sections and deep-sea cores used in this study. PP = Pun ta Piccola; Se = Semaforo; Si = Singa; V = Vrica;
Fc = Francocastel lo .
boundaries which, except for the bottom of the Olduvai, fall within the uncertainty range of the radiometric dating [2,3,13]. Johnson [14] and Shackleton [15], on the other hand, reported ages for the B r u n h e s / M a t u y a m a and Jaramillo boundaries older than those obtained by radio- metric dating. Concurrent with, but independent of, the present study Shackleton et al. [1] con- structed an astronomically calibrated time scale with significantly older ages for all the major reversal boundaries down to the Gauss /Matuyama boundary.
In this paper, we first establish the astronomi- cally calibrated age of the Olduvai Subchron as recorded in the Pliocene-Pleistocene boundary stratotype section of Vrica. This is done by corre- lating cyclic sapropel (brownish, often laminated interbeds) patterns in the Vrica section and in the sections Semaforo, Singa, Punta Piccola and Francocastello to the astronomical solutions, using inferred phase relationships between the sapropel and orbital cycles. The resultant ages for the Olduvai, as well as for older reversal boundaries, are then compared with both conventional as well as other orbitally tuned ages for these polarity transitions,
2. The position of the Olduvai in the Pl iocene- Pleistocene boundary stratotype section of Vrica
The Vrica section, in northern Calabria (Fig. 1), was formally designated as the Pliocene-Pleisto- cene boundary stratotype [16] after it had been intensely studied for a decade [e.g. 17-23]. The boundary was defined at the base of the homoge- neous claystones which conformably overlie the sapropelic layer coded e in this section [16] (sapropel coding after [18], see also Fig. 2).
Initial paleomagnetic measurements on the Vrica section were carried out by Nakagawa et al. [19] who used the for this type of sediment less suitable alternating field demagnetization method [22]. Tauxe et al. [22] demonstrated that an inter- val of normal polarity is present in the Vrica section, which in combination with biostrati- graphic evidence [23] was shown to represent the Olduvai. In addition, normal polarities were ob- served in the top part of the section.
Recent paleomagnetic investigations [24], how- ever, showed that the top of the Vrica section contains reversed polarities only. The normal polarities reported earlier [22] are caused by a secondary overprint due to weathering. In ad-

oo
PLI
OC
EN
E
M
P L
4
I M
P
L5
MN
N
16a
.-"
1M
~7
I /
~-
/ I
/
I / /
~ ~
F.CASTELLO
# //~
/ I
I /
I /
/ SI
NGA
II
" ,' ,!~,~]I----_. .
P. PIOOOLA
\L
X
M
P L
6
o0 M
NN
18
IM
NN
19a
L1M
NN
MNN1
9c
MNN1
9d
\\
\ \
\ \
\
/ /
~,
~I/I I
lll II\,ll
l II
PLE
ISTO
CE
NE
~o
[ G
. co
ria
coe
ns/
s G
/ob
oro
to/i
o
tru
nco
tu//
no
/de
s e
xce
/so
19
e
__
M
NN
19
f M
NN
M
NN
21
\ /
/ /
/ /
/
/Ill
III II
II lU
III Il
l S,.G
A ,V
::f,
!J!!II
_ III
II III/
SE
.AFOR
O
/ III
I ~
ii((((J
( Sii i
}iti
~ o
MAT
UYAM
A G
AUSS
~,
__+_
_~__
]I~__
~__r
__,_
_,__
+__~
__r_
_t__
t__t
__,_
_~
b ~
b o
STAGE
plun
kton
ic
fora
min
ife
ra
calc
areo
us
nann
ofos
sils
ODP
65
5A
CORE
656
RC
9-18
1
AIb
189
RC
9-18
5
POLARITY
CHRON
AGE
N
0 ~,0
Z L~
0 C~ t~ I C~
0 ~Q
E~
"n
O

A S T R O N O M I C A L C A L I B R A T I O N O F G A U S S T O M A T U Y A M A S A P P R O P E L S 229
dition, the stratigraphic position of the rather in- accurately defined lower boundary of the Olduvai is now more precisely located. The posit ion of the top of the Olduvai, however, remains ambiguous. The new and very detailed paleomagnetic data show that reversed polarities are present in the top part of the normal polari ty zone, resulting in two options for the exact position of the upper Olduvai [24]. In opt ion I, the boundary coincides with sapropel d [18], implying a short normal polari ty subchron slightly above the Olduvai. In opt ion II, the boundary is located substantially higher in the succession, i.e. between sapropels e and f , and implies that an interval of reversed polari ty is present in the upper part of the Olduvai. As a consequence, the Pl iocene-Pleis tocene boundary defined on top of the sapropelic marker bed e is posit ioned either within or slightly above the Olduvai [24].
3. Tuning the sapropels to the astronomical solu- tions
In the Vrica section, a total of 21 sapropelic layers have been distinguished (Fig. 2). In ad- dition, sapropels are not only found in the Vrica section, but they occur frequently and are widespread in marine depositional sequences of the Mediterranean Neogene and Quaternary [e.g. 25,26]. Generally, they are not distributed evenly throughout the stratigraphic record but occur in distinct clusters on various scales: large-scale clus- ters usually comprise a number (2 to 3) of small- scale clusters which in turn contain 2 to 4 individ- ual sapropels. The resulting patterns are complex and have been interpreted as superimposed sedi- mentary cycles connected with the Earth 's orbital cycles, more precisely with those of precession
(individual sapropels) and eccentricity (sapropel clusters) [26]. The reflection of the obliquity cycle is seemingly absent in the sedimentary record, which has been related to the relatively low (paleo-)latitudinal posit ion of the Mediterranean [26].
In order to tune the sapropel sequence of the Vrica section to the astronomical solutions, it is necessary to determine the phase relationships be- tween the sedimentary and orbital cycles. These phase relationships can be established by correlat- ing the most recently deposited sapropels of late Pleistocene age in the Medi terranean to the astro- nomical solutions, using oxygen isotope stage boundaries for age calibration (Fig. 3). This corre- lation shows that individual sapropels correlate to min imum peak values of the precession index and that small- and large-scale sapropel clusters corre- late to eccentricity maxima connected with the 100 and 400 ka eccentricity cycles respectively.
On the basis of these phase relationships, pro- gressively older sapropel-bearing sequences can then be calibrated to the astronomical records by extending the tuning until the Vrica sequence is reached. However, at present this procedure is not possible due to the lack of a coherent and continu- ous record of middle Pleistocene sapropels, both from land sections and from deep-sea cores (Fig. 2). Al though this missing interval has recently been recovered at O D P Site 653, it did not yield a sufficiently detailed sapropel record (see Fig. 2). Considering the location of this site (Tyrrhenian Sea), this is not surprising because sapropels are more frequent and widespread in the eastern Medi terranean [e.g. 27]. Unfortunately, results of deep-sea drilling in the eastern basin have also been unsuccessful because of serious coring dis- turbance and the sometimes poor core recovery [27,28].
Fig. 2. Review of the most relevant sapropel-bearing sequences of late Pliocene-Pleistocene age in land-based sections and deep-sea cores of the Mediterranean. Lithostratigraphy of deep-sea cores is based on Cita et al. [48], Murat and Got [49] and the Shipboard Scientific Party of ODP Leg 107 [50]. Lithostratigraphy of the land sections from Hilgen [26,31], Verhallen [29], Zachariasse et al. [33,51] and Zijderveld et al. [24]. Sapropel coding after Ryan [25] for the late Pleistocene and Selli et al. [18], Verhallen [29] and Zijderveld et al. [24] for the late Pliocene-early Pleistocene. Biozonations used are those of Cita [52] and Spaak [53] for the planktonic foraminifera and Raffi and Rio [54] for the calcareous nannofossils. Biostratigraphic data are taken from Backman et al. [23], Zijderveld et al. [24], Driever [30], Zachariasse et al, [33,51] and Gla~on et al. [55]. Also shown is the calibration to the Geomagnetic Polarity Time Scale (the conventional scale of Berggren et al. [8]) based on first-order magnetostratigraphic records (Punta Piccola section--Zachariasse et al. [33,51]; Semaforo section--Tauxe et al. [22]; Singa and Vrica sections--Zijderveld et al.
[24]). Solid lines mark lithostratigraphic and magnetostratigraphic correlations, dashed lines biostratigraphic correlations.

Below this hiatus in the sapropel record, a coherent and distinctly cyclic sapropel pattern emerges again in late Pliocene-early Pleistocene sequences exposed onland. In these land sections, four successive large-scale clusters of sapropels are distinguished, separated by relatively thick inter- vals of homogeneous sediments. In stratigraphic order, these clusters have been coded informally as O, A, B and C ([29,30]; see Fig. 2). The Vrica section contains the uppermost sapropels of the B-cluster and the C-cluster [31]. Both in the Vrica and the Singa sections (located in nearby southern Calabria, see Fig. 1), the C-cluster contains a very conspicious small-scale cluster. This key-cluster
CORE RC 9 - 1 8 1
contains four sapropels which are extraordinarily thick.
From the established phase relationships be- tween the late Pleistocene sapropels and the orbital cycles (Fig. 3), it can be inferred that this promi- nent key-cluster corresponds not only to a 100 ka eccentricity maximum, but also to a maximum of the 400 ka eccentricity cycle, because it contains more and thicker sapropels than the adjacent small-scale clusters. In the time interval consid- ered, 400 ka eccentricity maxima occur at 1.4 and 1.8 Ma in the astronomical solutions [32]. How- ever, these ages do not correspond to the conven- tional (radiometric) age of 1.67 Ma for the top of
~3 U3
- 8:80 Ld E n 2 0 C. r u b e r "8 O~ g ~L (Vergnaud Grazzini et el., 1977)
Of) +2.0 0.0 -2.0 %0
$1
PRECESSION
>- A S T R O N O M I C A L CYCLES ( B e r g e r , 1 9 7 8 ) (_9 o
c EL ~) z 0 o ~ r"r"
,,, ~ z
0 Ld 0
1 % 2 s5 ~ - -0.1
$4' ' @
4- $6 ~
$7
6- -0 .3 -
7- S lO ' '
- 0 . 4 8-$11
9- m $ 1 2 - - ~ -
÷
m - 0 . 2 - - - - , -
R
ECCENTRICITY
rain max
230 v.z H1LGEN
Fig. 3. Determination of phase relationships between sapropel cycles and the orbital cycles of precession and eccentricity based on the correlation of the upper Pleistocene sapropel sequence of standard core RC 9-18l in the eastern Mediterranean to the astronomical solutions. Sapropel chronology has been established according to a procedure outlined by Rossignol-Strick [46] using oxygen isotope stage boundaries 6.0, 8.0 and 10.0 dated at 128, 245 and 339 ka [9] for age calibration. The oxygen isotope record is based on Vergnaud-Grazzini et al. [47]. The astronomical records are based on the old solution of Berger [34] which is considered
more accurate than the new solution for the last 1 Ma (Berger, pers. commun.)

ASTRONOMICAL CALIBRATION OF GAUSS TO MATUYAMA SAPPROPELS 231
the Olduvai [6], located either within (option I) or nearly on top (option II) of this key-cluster. The correlations of the sapropels in the lower parts of the Vrica and Singa IV sections according to both eccentricity maxima are presented in Fig. 4. Start- ing from the 1.4 Ma maximum, the tuning results in an age of 1.41 (option II) or 1.46 Ma (option I) for the top of the Olduvai and of 1.57 Ma for the bot tom of the Olduvai. If we start from the 1.8 Ma maximum, the age for the top of the Olduvai arrives at 1.79 (option II) or 1.84 Ma (option I) and the age for the bot tom of the Olduvai at 1.95 Ma (Fig. 4B). This correlation is preferred because the small-scale sapropel cluster which underlies
the prominent key-cluster is more clearly reflected in the astronomical record if we use the 1.8 Ma maximum.
To determine more conclusively which of both correlations is correct, we must consider the older part of the late Pliocene-early Pleistocene sapro- pel record as well. The most remarkable feature in this older part of the record is the deviating pat- tern of sapropels found in the large-scale A-cluster (Fig. 2). This A-cluster contains a single small- scale sapropel cluster which in turn comprises no less than six successive individual sapropels. Note that the youngest but one sapropel of this cluster is missing in the Singa section. However, the pres-
ASTRONOMICAL ASTRONOMICAL SOLUTIONS PLIO-PLEISTOCENE BOUNDARY SECTIONS SOLUTIONS
ECCENTRICITY PRECESSION SINGA Ill/IV VRICA A/B PRECESSION ECCENTRICITY c
MIN MAX - + A (1.4 Ido) B (1.8 Ido) - + MIN MAX "~
? 3.6
1.3- ~ -1.7
1.4- EIS
1.6- I ~
1.8. l--I om' 1.9-
Fig. 4. The two possible alternatives for correlating the pattern of sapropels in the lower parts of the Plio-Pteistocene boundary sections of Vrica and Singa IV to the new astronomical solutions for precession and eccentricity [35] based on the established phase relationships between sapropel and orbital cycles. (A) The distinct small-scale key-cluster of four sapropels ( b - e according to the coding of [18]; C3-C6 after [29]; see also Fig. 2) correlates with the maximum in eccentricity of the 400 ka eccentricity cycle dated around 1.4 Ma. (B) This key-cluster correlates with the successive older maximum of the 400 ka cycle of eccentricity dated around 1.8 Ma. Lithostratigraphy, biostratigraphy and magnetostratigraphy after [24,29,30]. Biostratigraphic correlations shown: 1 = G. inflata
influx; 2 = G. truncatulinoides FOD and influx; 3 = G. inflata reapearance; 4 = D. brouwer i LOD; 5 = C. rnacintyrei FOD. Hatching in magnetostratigraphic records denotes inconclusive paleomagnetic results or lack of data [see 24]. Astronomical records are based on the new solutions of Berger and Loutre [32; version B E R - 90]. The original data by Berger and Loutre [32] cannot be reproduced
without their permission.

232 F.J . H I L G E N
GEOLOGICAL
TIME SCALE LAND SECTIONS ASTRONOMICAL
0 ( 3 o ~ d ,.o _> 5
o
o m z ~. ~: o < ~ --- 0 Z I-- Z
I ~ n
SOLUTION
- £ < ~
Ld 0 z ~ 5
+ [ rain m a x
Fig. 5. Correlation of upper Pliocene-lower Pleistocene sapropel sequences to the new astronomical solutions for precession and eccentricity [32] using corresponding aberrations in the pattern of sapropels (the A-cluster) and the precession record for calibration.
The original data by Berger and Loutre [32] cannot be reproduced without their permission. See further explanation in Fig. 2.

ASTRONOMICAL CALIBRATION OF GAUSS TO MATUYAMA SAPPROPELS 233
ence of pyritic lumps and framboids at a time- equivalent level indicates that lowered bottom- water oxygen conditions, which are responsible for the deposition of sapropels, also persisted at Monte Singa at that time [33]. At Punta Piccola, the two lowermost beds of this cluster do not contain true sapropelic sediments but merely consist of dark- coloured marly clays. The Francocastello section on Crete, on the other hand, reveals an additional (seventh) sapropel. Close inspection of the astro- nomical solutions reveals a remarkably similar deviation in the record of the precession index connected with the 400 ka eccentricity maximum at 2.60 Ma. In this interval, the amplitude varia- tions of the precession index lack the usual pro- nounced modulation by the 100 ka eccentricity cycle, resulting in 6-7 successive, high-amplitude excursions of the precession index to negative values. The six sapropels of the A-cluster can now be calibrated to the astronomical record in such a way that the most prominently developed sapro- pels in the Singa section (A2 and A5; see also [33]) correlate with the most negative excursions of the precession index (Fig. 5). It is emphasized that the use of the new astronomical solutions of Berger and Loutre [32] is of decisive importance here. The new calculations start to deviate significantly
from the old, less accurate solutions of Berger [34] at 1.5 Ma, The aberrant pattern in the precession record at 2.6 Ma is crucial to the astronomical calibration of our sapropels and it is not found in the old solution. Instead, an essentially similar deviation was observed before at 1.85 Ma.
Based on the calibration to the new solution, the remaining part of the sapropel record can be correlated straightforwardly to the astronomical record (Fig. 5). This correlation results in ages of 1.95 (+_0.01) Ma for the bottom of the Olduvai, 1.84 (option I) or 1.79 Ma (option II) for the top of the Olduvai and 1.81 Ma for the Pliocene- Pleistocene boundary. It confirms that the small- scale key-cluster in the large-scale C-cluster in- deed correlates with the 400 ka eccentricity maxi- mum at 1.8 Ma. In addition, ages are obtained for the Reunion (2.14-2.15), the Gauss /Matuyama (2.59/2.62) and the top of the Kaena (3.02 _+ 0.01), because detailed magnetostratigraphic records are presently available for the majority of these land sections (Fig. 5).
Nevertheless, some discrepancies remain, the most important of which is the correlation of the sapropels in the upper part of the Vrica section to the astronomical record. This correlation is severely hampered for several reasons. Firstly, pre-
T A B L E 1
Old coding and new precession-related M P R S coding for sapropels in the Medi te r ranean . 1 ~ af ter Ryan
[25]; 2 = after Selli et al. [18]; 3 = after Verhal len [29]. M P R S coding and lagged age using the correla t ive
peak of the precession index as n u m b e r e d f rom the Recent. Aster isk denotes u n n a m e d or u n n u m b e r e d
sapropel
1 2 MPRS- age lagged 2 3 MPRS- abe lagged 3 MPRS- age lagged Cod i ng abe Cod ing abe Cod i ng age
S1 $2 $3 S4 $5 $6 $7 $8 $9
S10 SI1 S12
2 0.012 0.008 r ? B5 208 2.141 2.137 6 0.060 0.056 q C13 ? 134 212 2.191 2.187 8 0.083 0.079 p C12 ? B3 214 2.213 2.209 10 0.106 0.102 o CII ? B2 216 2.235 2.231 12 0.127 0.123 n CI0 ? * 218 2.257 2.253 16 0.176 0.172 h C9 168 1.719 1.715 BI 222 2.306 2.302 18 0.198 0.194 f C8 170 1.741 1.737 A5 250 2.593 2.589 20 0.220 0.216 * C'/ 172 1.762 1.758 * 252 2.616 2.612 22 0.242 0.238 e C6 176 1.812 1.808 A4 254 2.639 2.635 30? 0.335 0.331 d C5 178 1.834 1.830 A3' 256 2.663 2.659 387 0.409 0.405 c C4 180 1.855 1.851 A2 258 2.686 2.682 46? 0.485 0.481 b C3 182 1.877 1.873 AI 260 2.708 2.704
? a C2 186 1.928 1.924 O* 280 2.928 2.924 ? C1 188 1.949 1.945 O* 282 2.950 2.946 ? CO 190 1.969 1.%5 O* 284 2.972 2.968 ? 137 204 2.098 2.094 O* 288 3.021 3.017 ? B6 206 2.120 2.116 O* 290 3.042 3.038

234 f.J HILGEN
liminary attempts to correlate the frequency distri- bution of sinistrally coiled neogloboquadrinids to the northern Atlantic DSDP Site 607 suggest that an hiatus is present in the top part of the Vrica section. Secondly, the characteristic cyclicity in the sapropel pat tern--re la ted to precession and eccentricity--is probably distorted in this particu- lar interval by the following factors:
(1) The additional influence of obliquity on the distribution of the sapropels.
(2) the steady increase in the number of sapro- pels per large-scale cluster. This trend, which may be related to a gradual lowering of some threshold value for sapropel formation, eventually results in the disappearance of the distinct, eccentricity-re- lated pattern in the distribution of the sapropels.
(3) Changes in sediment accumulation rate. Current research is focussed on the solution of
these problems by combining the complex sapro- pel pattern with a very detailed record of the frequency distribution of sinistral neogloboquad- rinids. This record contains additional informa- tion on the influence of the obliquity cycle and will be reported on in a forthcoming paper. These forthcoming results will most probably not affect the calibration of the older sapropels to the astro- nomical record.
It is important to note that our present solution differs markedly from an earlier attempt to corre- late the sapropels in the Vrica and Semaforo sec- tions to summer insolation curves for this latitude [35]. This attempt was severely hindered by the assumption that a stratigraphic gap is present between both sections, whereas they actually proved to contain a considerable overlap [31]. Moreover, the insolation curve used by Com- bourieu-Nebout [35] was based on astronomical solutions which presently are considered to be less accurate for this interval of time [32].
4. A new integrated Mediterranean sapropel coda- tion
In Table 1, we formalize our sapropel correla- tion to the astronomical record by introducing new coding for sapropels in the Mediterranean Pliocene-Pleistocene. In existing coding, sapropels are continuously numbered [18,25,29]. Our new Mediterranean Precession Related Sapropel (MPRS) coding is based on coding sapropels after
the correlative peak of the precession index as numbered from the Recent. This MPRS coding has the distinct advantage that newly found sapropels can always be incorporated. More im- portantly, all coded sapropels can be dated with an accuracy of 1 ka by reference to the corre- sponding peak in the precession record (Table 1). For a truely accurate dating of the sapropels, a time lag of 4 ka between orbital forcing and maximum climate response and sapropel deposi- tion must be taken into account. This time lag is based on the age of 9 -6 ka for the youngest sapropel in the eastern Mediterranean ($1; [36,37]) as compared with the age of 11.5 ka for the correlative negative peak of the precession index. A time lag of 4 ka agrees well with other time lags inferred for the climate response to orbital forcing by precession [38-40].
5. Discussion
The correlation of sapropels to the astronomi- cal solutions results in ages for the top of the Olduvai (1.79 or 1.84 Ma), the bottom of the Olduvai (1.95 +0.01), the Reunion (2.14-2.15), the Gauss /Matuyama (2.59/2.62) and the top of the Kaena (3.02 _+ 0.01). These ages deviate con- siderably from conventional ages which are either based on K / A r radiometric dating only [6] or on linear interpolation between radiometrically dated calibration points in marine anomaly sequences [e.g. 8]. In addition, they also differ from ages which have been established previously by orbital tuning procedures and which have essentially con- firmed the radiometric datings [2,3,13] (see Table 2). It is easily shown that no apparent relation- ships exist between our sapropel pattern and the precession record if we use either the conventional polarity time scale of Berggren et al. [8] or the orbitally tuned polarity time scale of Ruddiman and Raymo [2,3] (Fig. 6).
On the other hand, the ages reported here are almost identical to those obtained recently by Shackleton et al. ([1]; table 2). Both time scales have been established using totally independent data-sets and basically the same orbital tuning method. The time scale of Shackleton et al. [1] was contructed on the basis of the high-resolution oxygen isotope record from ODP Site 677, located in the low-latitude eastern Pacific, whereas we

A S T R O N O M I C A L CALIBRATION OF G A U S S TO M A T U Y A M A SAPPROPELS 235
SAPROPEL GEOCHRONOLOGY
Berggren ef al. Rayrno ef al. this paper ~v
L"_- =+ '"_ + 7
z - c _c0 _ - =
3.0 "0" ~__~ "i" " --3.0 -, ~ " _
Fig. 6. Sapropel chronologies for the late Pliocene-early Pleistocene according to the different time scales. Our chronology is based on the correlation of sapropels to the astronomical solutions shown in Fig. 5. In the case of the polarity time scales of Berggren et al. [8] and Raymo et al. [3], the sapropel chronology is based on linear inter- or extrapolation of sediment accumulation rates using magnetostratigraphic datum planes for age calibration. The Singa section was employed for the interval between the base of the A-cluster to the base of the C-chister. From the base of the C-cluster onward, we used the Vrica section instead; note that for the time scales of Berggren et al. [8] and Raymo et al. [3] two alternative sapropel chronologies are shown for this interval based on the two different options (I and II) for the position of the top of the Olduvai. The Punta Piccola section was used for the lowermost
sapropels (O-cluster). The original data by Berger and Loutre [32] cannot be reproduced without their permission.
u sed the s a p r o p e l r e c o r d in t he M e d i t e r r a n e a n .
H o w e v e r , ou r t u n i n g p r o c e d u r e s t r o n g l y r e s e m b l e s
the p r o c e d u r e fo l l owed by S h a c k l e t o n et al. [1] in
e m p l o y i n g the p r e c e s s i o n r a t h e r t h a n the o b l i q u i t y
c o m p o n e n t in c l i m a t i c p r o x y r eco rd s . T h e la t t e r
has b e e n u s e d in o t h e r a t t e m p t s to e s t ab l i sh an

236 v J. HILGEN
T A B L E 2
Ages for po la r i ty reversals accord ing to the different t ime scales. M&D = M a n k i n e n and Da l rymple [6]; R&R = R u d d i m a n et al. [2] and R a y m o et al. [3]
reversal boundary M&D, Berggren R&R, Shackleton this 1979 et al., 1985 1989 et al., in press paper
Bmnhes/Matuyama 0.73 0.73 0.73 0.78 Olduvai top 1.67 1.66 1.65 1.77
Olduvai bottom 1.87 1.88 1.82/1.83 1.95 Reunion 1 top 2.01 1.98/2.00 Reunion 1 bottom 2.04 2.02 Reunion 2 top 2.12 Reunion 2 bottom 2.14 GausslMatuyama 2.48 2.47 2.48/2.49 2.60 top Kaena 2.92 2.92
1.79 (II) 1.84 (1)
1.95 2.14 2.15
2.59/2.62 3.02
astronomically calibrated time scale for the late Pliocene to early Pleistocene [2,3,13], but is con- sidered less suitable because of the regular char- acter of the obliquity cycle. The precession signal, on the other hand, displays a far more distinctive pattern due to its modulation by eccentricity. A difference in the procedures followed is that Shackleton et al. [1] employed the Recent as a fixed calibration point, while we established our time scale independently of the Recent by corre- lating similar deviating patterns in the geological and astronomical records.
5.1. Discrepancies with other astronomically calibrated time scales A comparison of the astronomically calibrated
polarity time scale of Ruddiman et al. [2] and Raymo et al. [3] and ours shows that the age discrepancy for the reversal boundaries is re- markably constant, i.e. 130 ka. An exception is the older age for the top of the Olduvai in our time scale (option I in Table 2) in which case the discrepancy is even larger. This constant dis- crepancy, and the resulting younger ages of the sapropels according to their time scale (Fig. 6), cannot be explained by a lag effect of approxi- mately 100 ka connected with the 400 ka ec- centricity cycle because the expression of ec- centricity in our sapropel record merely reflects the modulation of precession by eccentricity (see also the remarks on p. 432 in [3]). Also, the correlation of late Pleistocene sapropels to the astronomical record (Fig. 3) does not reveal any indication of the existence of such a time lag. It is therefore anticipated that the origin of this dis-
crepancy must be found in the interval younger than the Olduvai. According to our time scale, the age of the top of the Olduvai is either 1.84 (option I) or 1.79 Ma (option II), which in both cases departs markedly from the age of 1.65 Ma ob- tained by Ruddiman et al. [2]. As a consequence, the durat ion of the interval between the Brunhes /Matuyama and the top of the Olduvai differs from 0.92 Ma [2] to 1.06 or even 1.11 Ma (our options II and I) if we also use an age of 0.73 Ma for the Brunhes /Matuyama boundary. In order to explain this discrepancy, we have re-ex- amined the records of Site 607 on which Ruddi- man et al. [2] and Raymo et al. [3] based their time scale.
Ruddiman et al. [2] proceeded from an age of 0.73 Ma for the Brunhes /Matuyama boundary to establish an orbitally tuned (polarity) time scale for the older part of the Pleistocene by extrapolat- ing the 41 ka quasi-period of obliquity as the periodicity of distinct cyclic changes in their 6180 and CaCO 3 records. This approach, however, de- pends critically on neither skipping cycles nor adding extra ones [2, p. 359]. It is not surprising that, if their obliquity-tuned time scale is used for calibration (according to this tuning procedure, the cycles in the original records are either slightly stretched or compressed to fit the 41 ka period), spectral analysis applied on the records from Site 607 yields a single dominant peak corresponding exactly to a periodicity of 41 ka (fig. 13 in [2]). If, on the other hand, the conventional magnetic polarity time scale is used, the resulting spectrum shows that this peak has shifted to slightly higher frequencies (fig. 4 in [41]). We also applied spec-

A S T R O N O M I C A L C A L I B R A T I O N O F G A U S S T O M A T U Y A M A S A P P R O P E L S 237
tral analysis to the 8~SO and CaCO 3 records of Site 607, using the conventional ages of 0.73 and 1.66 Ma for the Brunhes/Matuama and the top of
the Olduvai [8]. For our purpose, we used a spec- tral analysis program in which the Fourier trans- form is applied to the autocorrelation function
-I
41
I[
/
~2-
-1
- 2
- 3 -
B
1,.- 23
_ y , , , , Nf
0 o l o I I I I I I I
Z
90
10 20 30 40 50 60 70 80 90 0 10 20 30 40 50 60 70 80 90
N ° of h a r m o n i c s N ° of h a r m o n i c s
Fig. 7. Representative spectra based on the 8180 (A and C) and CaCO 3 (B and D) records from DSDP Site 607 as published in Ruddiman et al. [2] and Raymo et al. [3]. (A) and (B) based on the interval between the B r u n h e s / M a t u y a m a and the top of the Olduvai using the conventional ages of 0.73 and 1.66 Ma of the respective reversal boundaries [8] for age calibration. (C) and (D) based on the interval between the G a u s s / M a t u a y a m a and the bot tom of the Olduvai using the respective conventional ages of 2.47 and 1.88 Ma for calibration. The periodicity of the dominant peak in the obliquity frequency domain is shown in ka. Also indicated are the positions of frequencies corresponding to the main quasi-periods of the orbital cycles. Nf = Nyquist frequency of original time series using twice the average time spacing. The 80% confidence interval is shown as a small vertical bar on the right-hand side
of each spectrum.

238 v.J. HILQEN
[42] of an equally spaced time series of the original record. By slightly changing the number of lags of that part of the autocorrelation function on which the Fourier transform is employed, the exact posi- tion of the spectral peaks can be accurately de- termined. Figure 7A shows that the most promi- nent peak of the 6180 spectrum has indeed shifted to a higher frequency and matches a periodicity of 37.4 _+ 0.1 ka. The CaCO 3 spectrum is more com- plex and yields two separate peaks with periodici- ties of 34.9 + 0.1 and 37.9 _+ 0.1 ka. In addition, a less prominent and significant peak is found at a frequency corresponding to a periodicity of 43.6 ka. Nevertheless, the CaCO 3 spectrum too shows a strong tendency to shift to higher frequencies (Fig. 7B).
This shift in the dominant spectral peak(s) in the obliquity frequency band to a higher frequency than that of the dominant quasi-period of obliqu- ity can be explained by assuming that the interval between the Brunhes /Matuyama and the top of the Olduvai lasted longer than suggested by the conventional ages of 0.73 and 1.66 Ma for these reversal boundaries. If we correct for this frequency shift so that the corresponding periodic- ity matches the main 41 ka quasi-period, the estimate of the amount of time in this interval increases from 0.93 to 1.02 Ma, an increase of 90 ka. A repetition of this procedure, using the ages of 0.73 and 1.65 Ma of Ruddiman et al. [2], results in a corresponding increase from 0.92 to 1.02 Ma. At the same time, these results imply that Ruddi- man et al. [2] failed to notice at least two obliqu- ity-related cycles in this particular interval. Close inspection of the 8180 and CaCO 3 records from Site 607 indeed reveals that the stratigraphic dis- tance between their glacial stages 20 and 22 and between 34 and 36 is almost twice the distance
normally observed in this interval, indicating that two extra cycles are present but not distinctly manifested. The reflection of these extra cycles, however, is clearly detectable in the records of Site 609 (fig. 2 in [41]; fig. 11 in [2]). To provide further support for this alternative interpretation, we applied a Tukey band-pass filter centred at a frequency of 0.0267 cycles per year (i.e. corre- sponding to a periodicity of 37.4 ka as indicated by the results of our spectral analysis) to the conventional time-series of the records from Site 607. The filtered components clearly reveal the two extra obliquity-related cycles missed by Rud- diman et al. (Fig. 8A). Moreover, comparison with the actual, but lagged record of obliquity confirms that these components contain two extra cycles in this interval (Fig. 8B). Essentially the same results are obtained if we apply a band-pass filter centred at the main orbital frequency of obliquity of 0.0244 cycles per year (a periodicity of 41 ka). Conse- quently, the estimate of 0.92 Ma of Ruddiman et al. [2] for the duration of this interval would increase by 82 ka to 1.0 Ma. Shackleton et al. [1] independently arrived at more or less the same conclusion although they interpreted Stage 21 to contain three precession peaks rather than two obliquity peaks.
Although this re-examination of Site 607 re- veals that as much as 1.02 Ma may be present between the Brunhes /Matuyama and the top of the Olduvai, this still does not agree with our estimates of 1.06 (option II) or 1.11 Ma (option I). It must be remembered, however, that our esti- mates depended on an age of 0.73 Ma for the Brunhes /Ma tuyama boundary. Following the earlier ideas of Johnson [14], Shackleton et al. [1] convincingly demonstrated that the (orbitally tuned) age of 0.73 Ma is too young and that the
Fig. 8. Time-series of the variations in 8180 and CaCO 3 and their filtered obliquity components for the interval between the Brunhes/Matuyama and the top of the Olduvai at DSDP Site 607 using either the conventional ages of 0.73 and 1.66 Ma [8] (A) or the new astronomically calibrated ages of 0.78 [1] and 1.79 Ma (C) of these reversal boundaries. The Tukey band-pass filters were centred at frequencies of 0.0267 (dotted line in (A); bandwidth = 0.104) and 0.0244 (dashed lines in (A) and (C); bandwidth = 0.095) cycles per year. The former corresponds to a periodicity of 37.4 ka, as indicated by the results of spectral analysis (see Fig. 7), the latter to the main 41 ka quasi-period of obliquity. Arrows mark the obliquity-related cycles missed by Ruddiman et al. [2]. Note that the 8180 and CaCO 3 records have been detrended and averaged around zero. Variations in obliquity and the corresponding frequency components of 6180 and CaCO 3 at DSDP Site 607 for the Brunhes/Matuyama to top Olduvai interval are also shown. Frequency components taken from Fig. 8A are shown in (B) and those from Fig. 8C are shown in (D). Solid line shows 8 ka lagged versions of actual obliquity after the new astronomical solutions [32]. The original data by Berger and Loutre [32] cannot be
reproduced without their permission. Note that the filtered components have been normalized to obliquity.

ASTRONOMICAL CALIBRATION OF GAUSS TO MATUYAMA SAPPROPELS 239
0.9-
1.0-
1.1
1.2 <
1.3-
1.4-
1.5
1.6-
1.7
1,8
0.8-
0 . 7 -
0.8-
0.9-
1.0
1.1-
1.2 o <
1.3-
1.4-
1.5-
1.6
1.7-
1.8-
1.9
a180 A
0.0-
0 .7 -
08-
I:O ols olo .0'.8 .1'.0 (f i l tered) ~5180
C a180
1.0 015 0'.0 -0'.5 -1'.0 (f i l tered) ~,180
-40 -20
-40
C a C O 3 %
0 20 (f i l tered) CaC03%
C a C O 3 %
.~o ~ 2 ' o (f i l tered) CaCO %
B 0.6
0.7-
0.8-
08
10-
1.1 ]
o= 1.2[ <~
1,3 ~
1.4 ~
1.5~
1.8
1.7
0.6-
0.7
0.8-
0.9-
1.0
1.1
1.2
< 1.3-
1.4-
1.5-
1.6
13
1.8
1.9
f i l t e r e d a180
2'~ ' 2'3 2', ' 2's obl iqui ty
D f i l t e r e d a180
i i i 22 2'3 2~, ' 2'~
obliquity
f i l t e r e d C a C O 3 %
obliquity
f i l t e r e d C a C O 3 %
2'2 ' 2'3 r 2~4 ' 2~5 obliquity
240 F.J. HILGEN
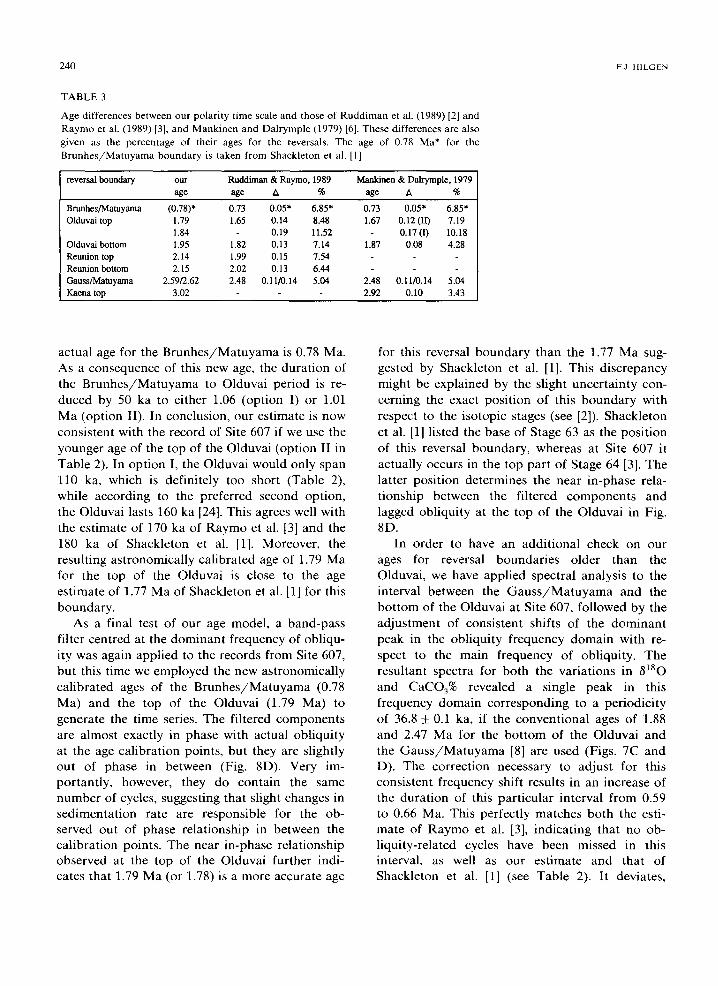
T A B L E 3
Age differences between our po la r i ty t ime scale and those of R u d d i m a n et al. (1989) [2] and R a y m o et al. (1989) [3], and M a n k i n e n and Da l rymple (1979) [6]. These differences are also
given as the percen tage of their ages for the reversals. The age of 0.78 Ma* for the
B r u n h e s / M a t u y a m a b o u n d a r y is taken from Shackle ton et al. [1]
reversal boundary our Ruddiman & Raymo, 1989 Mankinen & Dalrymple, 1979 age age A % age ~k %
Brunhes/Matuyama (0.78)* 0.73 0.05* 6.85* Olduvai top 1.79 1.65 0.14 8.48
1.84 0.19 11.52 Olduvai bottom 1.95 1.82 0.13 7.14 Reunion top 2.14 1.99 0.15 7.54 Reunion bottom 2.15 2.02 0.13 6.44 Gauss/Matuyama 2.59/2.62 2.48 0.11/0.14 5.04 Kaena top 3.02
0.73 0.05* 6.85* 1.67 0.12 (I1) 7.19
0.17 (I) 10.18 1.87 0.08 4.28
2.48 0.11/0.14 5.04 2.92 0.10 3.43
actual age for the Brunhes /Matuyama is 0.78 Ma. As a consequence of this new age, the duration of the Brunhes /Matuyama to Olduvai period is re- duced by 50 ka to either 1.06 (option I) or 1.01 Ma (option II). In conclusion, our estimate is now consistent with the record of Site 607 if we use the younger age of the top of the Olduvai (option II in Table 2). In option I, the Olduvai would only span 110 ka, which is definitely too short (Table 2), while according to the preferred second option, the Olduvai lasts 160 ka [24]. This agrees well with the estimate of 170 ka of Raymo et al. [3] and the 180 ka of Shackleton et al. [1]. Moreover, the resulting astronomically calibrated age of 1.79 Ma for the top of the Olduvai is close to the age estimate of 1.77 Ma of Shackleton et al. [1] for this boundary.
As a final test of our age model, a band-pass filter centred at the dominant frequency of obliqu- ity was again applied to the records from Site 607, but this time we employed the new astronomically calibrated ages of the Brunhes /Matuyama (0.78 Ma) and the top of the Olduvai (1.79 Ma) to generate the time series. The filtered components are almost exactly in phase with actual obliquity at the age calibration points, but they are slightly out of phase in between (Fig. 8D). Very im- portantly, however, they do contain the same number of cycles, suggesting that slight changes in sedimentation rate are responsible for the ob- served out of phase relationship in between the calibration points. The near in-phase relationship observed at the top of the Olduvai further indi- cates that 1.79 Ma (or 1.78) is a more accurate age
for this reversal boundary than the 1.77 Ma sug- gested by Shackleton et al. [1]. This discrepancy might be explained by the slight uncertainty con- cerning the exact position of this boundary with respect to the isotopic stages (see [2]). Shackleton et al. [1] listed the base of Stage 63 as the position of this reversal boundary, whereas at Site 607 it actually occurs in the top part of Stage 64 [3]. The latter position determines the near in-phase rela- tionship between the filtered components and lagged obliquity at the top of the Olduvai in Fig. 8D.
In order to have an additional check on our ages for reversal boundaries older than the Olduvai, we have applied spectral analysis to the interval between the G a u s s / M a t u y a m a and the bot tom of the Olduvai at Site 607, followed by the adjustment of consistent shifts of the dominant peak in the obliquity frequency domain with re- spect to the main frequency of obliquity. The resultant spectra for both the variations in ~ S o and CaCO3% revealed a single peak in this frequency domain corresponding to a periodicity of 36.8 + 0.1 ka, if the conventional ages of 1.88 and 2.47 Ma for the bot tom of the Olduvai and the G a u s s / M a t u y a m a [8] are used (Figs. 7C and D). The correction necessary to adjust for this consistent frequency shift results in an increase of the duration of this particular interval from 0.59 to 0.66 Ma. This perfectly matches both the esti- mate of Raymo et al. [3], indicating that no ob- liquity-related cycles have been missed in this interval, as well as our estimate and that of Shackleton et al. [1] (see Table 2). It deviates,

A S T R O N O M I C A L C A L I B R A T I O N O F G A U S S T O M A T U Y A M A S A P P R O P E L S 241
OLOBAL POLARITY TIME SCALES
o ~ "~ I :~ I
- ~ ~ c I < 2
BRUNHES
MATUYAMA
GAUSS
GILBERT
Fig. 9. Comparison of the extended astronomical time scale with other polarity time scales.
however, considerably from the duration of this interval according to the more conventional time scales [6,8].
5.2. Discrepancies between radiometric ages for polarity reversals The discrepancies between our astronomically
calibrated polarity time scale and the conventional time scales (Tables 2 and 3, Fig. 9), which for this period of time rely heavily on K / A r radiometric dating, are more difficult to explain. Although we cannot provide a solution to this problem, a com- parison between these methodologically totally different time scales shows that the discrepancy is, proportionally, fairly constant if only the radio- metrically more accurately dated Brunhes /Matu- yama and Gauss /Matuyama Chron boundaries are considered (5-7%; see Table 3). Possible errors
in the radiometric dating method include the inac- curacy of the decay constants (note that these constants were readjusted in 1979 which resulted in an increase in the K / A r ages by 2.66% for the period of time under consideration [43]), the im- perceptible loss of radiogenic argon and the (pos- sible) lack of sensitivity in accurately measuring low concentrations of radioactive decay gas at such young levels. It is expected that new radio- metric methods, such as single crystal laser dating, will give more insight into the accuracy of the K / A r ages and thereby in the origin of the dis- crepancy between the radiometric and astronomi- cally calibrated ages for reversal boundaries.
5.3. Extension of the astronomically calibrated time scale to the Miocene/Pliocene boundary The procedure of tuning climatic proxy records
to the new astronomical solutions is a very prom- ising tool for constructing a truely high-resolution time scale for at least the last 5-10 Ma, i.e. the period of time for which the astronomical solu- tions are now considered to be reliable [32]. At present, this time scale can be extended back to the Miocene/Pliocene boundary if we also take the detailed record of small-scale, precession-re- lated CaCO 3 cycles in the Trubi Formation on Sicily [44] into account. For these Trubi marls, we also found a remarkably consistent shift in spec- tral peaks to frequencies higher than the orbital frequencies. This shift has been explained by as- suming that the conventional ages assigned to reversal boundaries were not sufficiently accurate. In addition, an alternative time scale was provided for the major part of the Gilbert and Gauss Chrons by extrapolating an average quasi-period of 21.7 ka of the precession cycle [45] as the periodicity of these small-scale cycles, using the Gi lber t /Gauss Chron boundary dated radiometrically at 3.40 Ma as a fixed age reference point. The thus obtained age of 2.84 Ma for the top of the Kaena, however, is significantly younger than our present age of 3.02 Ma for this boundary, By adding this dif- ference of 180 ka to the ages assigned to reversal boundaries by Hilgen and Langereis [44], our orbitally tuned polarity time scale is extended back to the Miocene/Pliocene boundary (Fig. 8). This results in an age of 3.58 Ma for the Gi lber t /Gauss boundary, which is 5.3% older than the conventional radiometric age of 3.40 Ma. This

242 F.J. HILGEN
confirms the proportional constancy of the age discrepancy between our time scale and the radio- metric scale. The extension of the astronomically calibrated time scale to the Miocene/Pliocene boundary will be presented in more detail in a separate paper.
6. Conclusions
The calibration of cyclic sapropel patterns of late Pliocene to early Pleistocene age to the new astronomical solutions for precession and ec- centricity [32] results in ages for the top of the Olduvai (1.79 Ma), the bottom of the Olduvai (1.95 4-0.01), the Reunion (2.14-2.15), the Gauss /Matuyama (2.59-2.62) and the top of the Kaena (3.02 + 0.01). The age for the Pl iocene/ Pleistocene boundary arrives at 1.81 Ma.
This tuning furthermore provides an excellent opportunity for introducing a Mediterranean Pre- cession-Related Sapropel (MPRS) coding accord- ing to which sapropels in the Mediterranean Plio- cene-Pleistocene are coded using the correlative peak of the precession index as numbered from the Recent. These sapropels can be dated with an accuracy of 1 ka if we consider a time lag of 4 ka between orbital forcing and maximum climate re- sponse and sapropel formation, as observed for the youngest, Holocene sapropel.
Our ages are remarkably identical to the inde- pendently established, astronomically calibrated ages of Shackleton et al. [1]. The age discrepancy of 130 ka between our new polarity time scale and that of Ruddiman et al. [2] and Raymo et al. [3] is explained by the age of 0.78 instead of 0.73 Ma for the Brunhes /Matuyama (50 ka), in combina- tion with the finding that Ruddiman et al. [2] most probably missed two obliquity-related cycles (80 ka) in the interval between the Brunhes /Matu- yama and the top of the Olduvai in the records from DSDP Site 607.
A proportionally constant age discrepancy is found between our polarity time scale and the conventional polarity time scales which depend primarily on K / A r radiometric dating. This dis- crepancy of 5-7% cannot easily be explained at present and must await further research.
In order to confirm our age model, it is neces- sary to complete the sapropel record of the Medi- terranean Pliocene-Pleistocene by the recovery of
continuous and relatively undisturbed marine se- quences from the eastern Mediterranean, prefer- ably by hydraulic piston coring of multiple holes. Continued work in the Mediterranean is especially relevant because the Mediterranean is a marginal sea, which is particularly sensitive to the climatic effect of precession due to its low latitudinal posi- tion, its basin configuration and the related hydro- logical conditions. Due to the modulation by ec- centricity, the precession signal is far more distinc- tive than that of the more regular obliquity cycle. We therefore consider the precession-dominated sedimentary record of the Mediterranean more suitable for the construction of an astronomically calibrated time scale than the isotope records from DSDP Site 607 or even ODP Site 677, which primarily reflect the dominant control of the ob- liquity cycle on global ice volume.
Finally, our astronomically calibrated time scale can be extended back to the Miocene/Pliocene boundary by incorporating the time scale of Hilgen and Langereis [44] for the major part of the Gil- bert and Gauss Chrons and adding the difference of 180 ka for the age of the top of the Kaena to the ages assigned to the older reversal boundaries in Hilgen and Langereis' time scale.
Acknowledgements
T. van Hinte skillfully made the drawings. A. Berger and M.F. Loutre kindly provided their new astronomical records. The stimulating discussions with A. Berger, W.A. Berggren, P. de Boer, C.G. Langereis, L. Lourens, M.F. Loutre, N.J. Shackle- ton and W.J. Zachariasse are gratefully acknowl- edged and they led to considerable improvement of the manuscript. J. Imbrie and an anonymous reviewer are thanked for their reviews. This study was partly funded by the Netherlands Organiza- tion for Scientific Research (NWO).
References
1 N.J. Shackleton, A. Berger and W.R. Peltier, An alternative astronomical calibration of the Lower Pleistocene time scale based on ODP Site 677, Trans. R. Soc. Edinb., 81, 251-261, 1990.
2 W.F Ruddiman, M.E. Raymo, D.G. Martinson, B.M. Cle- ment and J. Backman, Pleistocene evolution: Northern hemisphere ice sheets and Nor th Atlant ic Ocean, Paleoceanography 4, 353-412, 1989.
A S T R O N O M I C A L C A L I B R A T I O N OF G A U S S TO M A T U Y A M A S A P P R O P E L S 243
3 M.E. Raymo, W.F. Ruddiman, J. Backman, B.M. Clement and D.G. Martinson, Late Pliocene variation in northern Hemisphere ice sheets and North Atlantic deep water circu- lation, Paleoceanography 4, 413-446, 1989.
4 C.S. Gromme and R.L. Hay, Magnetization of basalt bed I, Olduvai Gorge, Tanganyika, Nature 200, 560-561, 1963.
5 C.S. Gromme and R.L. Hay, Geomagnetic polarity epochs: Age and duration of the Olduvai normal polarity event, Earth Planet. Sci. Lett. 10, 179-185, 1971.
6 E.A. Mankinen and G.B. Dalrymple, Revised geomagnetic polarity time scale for the interval 0-5 m.y.B.P., J. Geo- phys. Res. 84, 615-626, 1979.
7 W.B. Harland, A.V. Cox, P.G. Llewellyn, A.G. Smith and R. Walters, A geological time Scale, Cambridge University Press, Cambridge, 127 pp. 1982.
8 W.A. Berggren, D.V. Kent, J.J. Flynn and J.A. Van Couvering, Cenozoic geochronology, Geol. Soc. Am. Bull., 96, 1407-1418, 1985.
9 J. Imbrie, J.D. Hays, D.G. Martinson, A. Mclntyre, A.C. Mix, J.J. Morley, N.G. Pisias, W.L. Prell and N.J. Shackle- ton, The orbital theory of Pleistocene climate: Support from a revised chronology of the marine 61SO record, in: Milankovitch and Climate, NATO ASI Ser. C, 126, A.L. Berger et al., eds., Reidel, Dordrecht, pp. 269-305, 1984.
10 J.D. Hays, J. Imbrie and N.J. Shackleton, Variations in the earth's orbit: Pacemaker of the ice ages, Science 194, 1121 1132, 1976.
11 J.J. Morley and J.D. Hays, Towards a high-resolution, global, deep-sea chronology for the last 750,000 years, Earth Planet. Sci. Lett. 53, 279 295.
12 D.G. Martinson, N.G. Pisias, J.D. Hays, J. Imbrie, T.C. Moore and N.J. Shackleton, Age dating and the orbital theory of the ice ages: Development of a high-resolution 0 to 300,000-year chronostratigraphy, Quat. Res. 27, 1-29, 1987.
13 N.G. Pisias and T.C. Moore, The evolution of Pleistocene climate: A time series approach, Earth Planet. Sci. Lett. 52, 450 458, 1981.
14 R.G. Johnson, Brunhes-Matuyama dated at 790,000 yr B.P. by marine astronomical correlations, Quat. Res. 17, 135-147, 1982.
15 N.J. Shackleton, A case for revising the astronomical calibration for the Brunhes-Matuyama and Jaramillo boundaries, Terra Abstr. 1, 185, 1989.
16 E. Aquirre and G. Pasini, The Pliocene-Pleistocene boundary, Episodes 8, 116-120, 1985.
17 G. Pasini, R. Selli, R. Tampieri, M.L. Colalonga, S. d'Onofrio, A.M. Borsetti and F. Cati, The Vrica section, in: The Neogene-Quaternary Boundary, II Symp. Bologna- Crotone, Excursion Guide-book, R. Selli, ed., pp. 62 72, 1975.
18 R. Selli, C.A. Accorsi, M. Bandini Mazzanti, D. Bertolani Marchetti, G. Bigazzi, F.P. Bonnadonna, A.M. Borsetti, F. Cati, M.-L. Colalonga, S. d'Onofrio, W. Landini, E. Menesini, R. Mezzeti, G. Pasini, G. Savelli and R. Tampieri, The Vrica section (Calabria). A potential Neogene- Quaternary boundary stratotype, G. Geol. 41, 181 204, 1977.
19 H. Nakagawa, N. Niitsuma, T. Takayama, S. Tokunaga, H. Kitazato and I. Koizumi, Preliminary results of magneto-
and biostratigraphy of the Vrica section (Calabria, southern Italy), Proc. 2nd Symp. Neogene/Quaternary Boundary (U.S.S.R., 1977), pp. 145-156, 1980.
20 H. Nakagawa, Neogene/Quaternary boundary and correla- tion of Vrica section, Proc. Neogene/Quaternary Boundary Field Conference (India, 1979), pp. 107-111, 1981.
21 J.D. Obradovitch, C.W. Naeser, G.A. Izett, G. Pasini and G. Bigazzi, Age constraints on the proposed Plio-Pleisto- cene boundary stratotype at Vrica, Italy, Nature 298, 55-59, 1982.
22 L. Tauxe, N.D. Opdyke, G. Pasini and C. Elmi, Age of the Plio-Pleistocene boundary in the Vrica section, southern Italy, Nature 304, 125-129, 1983.
23 J. Backman, N.J. Shackleton and L. Tauxe, Quantitative nannofossil correlation to open ocean deep-sea sections from Plio-Pleistocene boundary at Vrica, Italy, Nature 304, 156 158, 1983.
24 J.D.A. Zijderveld, F.J. Hilgen, C.G. Langereis, P.J.J.M. Verhallen and W.J. Zachariasse, Integrated magnetostratig- raphy and biostratigraphy of the Upper Pliocene-Lower Pleistocene from the Monte Singa and Crotone areas in Calabria (Italy), Earth Planet. Sci. Lett., submitted, 1991.
25 W.B.F. Ryan, Stratigraphy of Late Quaternary sediments in the eastern Mediterranean, in: The Mediterranean Sea: A Natural Sedimentation Laboratory, D.J. Stanley, ed., Dowden, Hutchinson and Ross, Stroudsburg, Pa., pp. 146- 169, 1972.
26 F.J. Hilgen, Sedimentary rhythms and high-resolution chro- nostratigraphic correlations in the Mediterranean Pliocene, Newslett. Stratigr. 17, 109-127, 1987.
27 R.B. Kidd, M.B. Cita and W.B.F. Ryan, The stratigraphy of eastern Mediterranean sapropel sequences as recovered by DSDP leg 42A and their paleoenvironmental signifi- cance, Init. Rep. DSDP 42A, 421-443, 1978.
28 R.C. Thunell, D.F. Williams and P.R. Belyea, Anoxic events in the Mediterranean Sea in relation to the evolution of Late Neogene climates, Mar. Geol. 59, 105 134, 1984.
29 P.J.J.M. Verhallen, Early development of Bulimina marginata in relation to paleoenvironmental changes in the Mediterranean, Proc. K. Ned. Akad. Wetensch., B 90, 161-180, 1987.
30 B.W.M. Driever, Calcareous nannofossil biostratigraphy and paleoenvironmental interpretation of the Mediter- ranean Pliocene, Utrecht Micropaleontol. Bull. 36, pp. 245, 1988.
31 F.J. Hilgen, Closing the gap in the Plioopleistocene boundary stratotype sequence of Crotone (southern Italy), Newslett. Stratigr. 22, 43-51, 1990.
32 A. Berger and M.F. Loutre, New insolation values for the climate of the last 10 Myr, Inst. Astron. Geophys. G. Lemaitre, Univ. Cathol. Louvain, Intern. Rep., 1988.
33 W.J. Zachariasse, L. Gudjonsson, F.J. Hilgen, C.G. Lan- gereis, L.J. Lourens, P.J.J.M. Verhallen and J.D.A. Zijder- veld, Late Gauss to early Matuyama invasions of Neoglo- boquadrina atlantica in the Mediterranean and associated record of climatic change, Paleoceanography 5, 239-252, 1990.
34 A. Berger, Long term variations of daily insolation and Quaternary climatic changes, J. Atmos. Sci. 35, 2362-2367, 1978.

244 F.J. HILGEN
35 N. Combourieu-Nebout, Les premiers cycles glaciaire-in- terglaciaire en region mediterran4enne d'apr~s l'analyse palynologique de la s4rie Crotone (Italie meriodionale), Thesis, Univ. Sci. Tech. Languedoc, Montpellier, 1987.
36 C. Vergnaud-Grazzini, M. Devaux and J. Znaidi, Stable isotope "anomalies" in Mediterranean Pleistocene records, Mar. Micropaleontol. 10, 35-69, 1986.
37 F.J. Jorissen, K. van der Borg, A.M. Borsetti, L. Gudjons- son, F.J. Hilgen, S. Iaccarino, A.F.M. de Jong, E.J. Ro- hling, J.P. de Visser and W.J. Zachariasse, Late Quaternary high-resolution biochronology for the central Mediter- ranean, Mar. Micropaleontol. in press, 1991.
38 W.L. Prell, Monssonal climate of the Arabian Sea during the late Quaternary; A response to changing solar radia- tion, in: Milankovitch and Climate, NATO ASI Ser. C, 126, A.L. Berger et al., eds., Reidel, Dordrecht, pp. 349-366, 1984.
39 D.A. Short and J.G. Mengel, Tropical climatic lags and Earth's precession cycle, Nature 323, 48 50, 1986.
40 A. McIntyre, W.F. Ruddiman, K. Karlin and A.C. Mix, Surface water response of the equatorial Atlantic Ocean to orbital forcing, Paleoceanography 4, 19-55, 1989.
41 W.F. Ruddiman, A. Mclntyre and M. Raymo, Matuyama 41,000-year cycles: North Atlantic Ocean and northern hemisphere ice sheets, Earth Planet. Sci. Lett. 80, 117 129, 1986.
42 J.C. Davis, Statistics and data analysis in geology, Wiley, New York, 1973.
43 R.H. Steiger and E. Jager, Subcommision on geochronol- ogy: Convention on the use of decay constants in geo- and cosmochronology, Earth Planet. Sci. Lett. 36, 359-362, 1977.
44 F.J. Hilgen and C.G. Langereis, Periodicities of CaCO 3 cycles in the Mediterranean Pliocene: Discrepancies with the quasi-periods of the Earth's orbital cycles?, Terra Nova 1,409-415, 1989.
45 A.L. Berger, Accuracy and frequency stability of the Earth's
orbital elements during the Quaternary, in: Milankovitch and Climate, NATO ASI Ser. C, 126, A.L. Berger et al., eds., Reidel, Dordrecht, pp. 3-39, 1984.
46 M. Rossignol-Strick, African monsoons, an immediate climatic response to orbital insolation, Nature 303, 46-49, 1983.
47 C. Vergnaud-Grazzini, W.B.F. Ryan and M.B. Cita, Stable isotope fractionation, climatic change and episodic stagna- tion in the eastern Mediterranean during the Late Quaternary, Mar. Micropaleontol. 2, 353-370, 1977.
48 M.B. Cita, C. Vergnaud-Grazzini, C. Robert, H. Chamley, N. Ciaranfi and S. d'Onofrio, Paleoclimatic record of a long deep-sea record from the eastern Mediterranean, Quat. Res. 8, 205-235, 1978.
49 A. Murat and H. Got, Middle and Late Quaternary deposi- tional sequences and cycles in the eastern Mediterranean, Sedimentology 34, 885-899, 1987.
50 Shipboard Scientific Party, Site 653, Proc. Init. Rep. (Pt. A) ODP 107, 599-745, 1987.
51 W.J. Zachariasse, J.D.A. Zijderveld, C.G. Langereis, F.J. Hilgen and P.J.J.M. Verhallen, Early Late Pliocene bio- chronology and surface water temperature variations in the Mediterranean, Mar. Micropaleontol. 14, 339-355, 1989.
52 M.B. Cita, Planktonic foraminiferal biozonation of the Mediterranean Pliocene deep sea record. A revision, Riv. Ital. Paleontol. Stratigr. 81,527-544, 1975.
53 P. Spaak, Accuracy in correlation and ecological aspects of the planktonic foraminiferal zonation of the Mediterranean Pliocene, Utrecht Micropaleontol. Bull. 28, 1-160, 1983.
54 I. Raffi and D. Rio, Calcareous nannofossil biostratigraphy of DSDP Site 132-Leg 13 (western Mediterranean), Riv. Ital. Paleontol. Stratigr. 85, 127-172, 1979.
55 G. Gla~on, D. Rio and R. Sprovieri, Calcareous plankton Pliocene-Pleistocene biostratigraphy in the Tyrrhenian Sea (western Mediterranean, Leg 107), Proc. ODP, Sci. Results 107, 683-693, 1990.