ASTM SpA Half-year interim report and accounts 30 June 2007
91
ASTM SpA Half-year interim report and accounts 30 June 2007
Transcript of ASTM SpA Half-year interim report and accounts 30 June 2007
ASTM SpA
Half-year interim report and accounts
30 June 2007

2
Contents
page
General Information 4
CONSOLIDATED INTERIM REPORT FOR 30 JUNE 2007
Report on Activities 7
Significant events in the first six months of 2007 7
Group Revenues, Expenses And Profits 10
Group Cash flow 12
Analysis of the half-year results 2007: Holding Company and main subsidiaries 13
Segment Information: Group performance by Sector and Geographical Area 26
Significant Post-Balance Sheet Events 26
Short-Term Prospects 26
Balance Sheet 28
Income Statement 29
Cash Flow Statement 30
Schedule of Changes in Shareholders’ Equity 31
Schedule of reconciliation between ASTM SpA Shareholders’ Equity and Profit for
the Period and the corresponding figures for the ASTM Group 32
Principles of consolidation and valuation criteria 34
Notes to the Accounts – Scope of consolidation 44
Notes to the Accounts – Details by sector 46
Notes to the Accounts – Details of the Balance Sheet 47
Notes to the Accounts – Details of the Income Statement 61
Other information 71
INTERIM ACCOUNTS OF THE HOLDING COMPANY: 30 JUNE 2007
Balance Sheet 75
Income Statement 76
Cash flow Statement 77
Schedule of Changes in Shareholders’ Equity 78
INDEPENDENT AUDITORS’ REPORT 80
3
AUTOSTRADA TORINO-MILANO Società per Azioni [plc]
Issued capital €44m, fully paid-in
Tax Registration and Turin
Company Register No.: 00488270018
Registered Office 165, Corso Regina Margherita, Turin
Website: http://www.autostradatomi.it
e-mail:[email protected]
Subject to direction and coordination by Argo Finanziaria SpA
COMPANY OFFICERS Chairman
Riccardo Formica
Vice Chairman
Daniela Gavio
Managing Director
Alberto Sacchi
Directors
Giovanni Angioni (1)
Enrico Arona
Alfredo Cammara
Ernesto Maria Cattaneo (1) (2)
Nanni Fabris
Cesare Ferrero (2)
Giuseppe Garofano
Vittorio Rispoli
Alvaro Spizzica (1) (2)
Agostino Spoglianti
Secretary
Cristina Volpe
(1) Member of the Remuneration Committee
(2) Member of the Internal Control Committee
BOARD OF STATUTORY AUDITORS Chairman
Alfredo Cavanenghi
Full Auditors
Enrico Fazzini
Lionello Jona Celesia
Alternate Auditors
Massimo Berni
Roberto Coda

4
MANAGEMENT Manager General
Graziano Settime
INDEPENDENT AUDITORS PricewaterhouseCoopers SpA
TERM OF OFFICE
The Board of Directors was appointed by the General Meeting of Shareholders held on 10 May 2007 for three financial years, i.e. until the
AGM’s approval of the Financial Statement for 2009.
The Board of Statutory Auditors was appointed by the General Meeting of Shareholders held on 29 April 2005 for three financial years, i.e. until
the AGM’s approval of the Financial Statement for 2007.
The Independent Auditors were appointed by the General Meeting of Shareholders held on 28 April 2006 for three financial years, i.e. until the
AGM’s approval of the Financial Statement for 2008.
POWERS OF COMPANY OFFICERS
The Chairman, appointed by the AGM on 10 May 2007, is authorized under Art. 24 of the Articles of Association to represent the company in
law, and has the executive powers conferred by Board of Directors resolution dated 10 May 2007, subject to the restrictions provided for in law
and by the Articles of Association.
The Vice Chairman, appointed by the Board of Directors on 10 May 2007, has the same powers as the Chairman, to be exercised in the event of
the latter’s absence or incapacity.
The Managing Director, (appointed by Board of Directors resolution dated 10 May 2007) has the same powers as the Chairman.
5
General information
Autostrada Torino-Milano Società per Azioni (ASTM SpA) is a company incorporated under Italian
law.
ASTM SpA operates in Italy as an industrial holding company. Through its controlled subsidiaries it
is mainly engaged in the construction and operation of motorway networks under licence.
The company’s registered office and headquarters are at 165, Corso Regina Margherita, Turin, Italy.
Its ordinary shares are listed on the MTA exchange operated by Borsa Italiana SpA, and are included
in the basket of mid-cap stocks that make up the MIDEX index.
The Consolidated Interim Report of the ASTM Group for the six months ended 30 June 2007, and the
Interim Accounts of the holding company for 30 June 2007 were approved by the Board of Directors
on 12 September 2007.

6
CONSOLIDATED INTERIM REPORT
FOR 30 JUNE 2007

7
Introduction
The present Interim Report of the ASTM Group for the first six months of 2007 has been drawn up in
accordance with the combined provisions of Civil Code Article 2428(iii) and Article 81 of CONSOB
Resolution No. 11971 of 14 May 1999, as amended. The report also takes account of CONSOB’s
requirements concerning Financial Statement layout and company disclosure (Resolution No. 15519
of 27 July 2006 and Notice No. DEM/6064293 of 28 July 2006).
In accordance with the provisions of Article 82(ii)(a) of CONSOB Resolution No. 11971 dated 14
May 1999, as amended, the company has chosen not to publish a quarterly interim report for the three
months to 30 June 2007 since the present half-year report has been published within sixty-five days of
the end of the six month period.
This document consists of the Consolidated Interim Report of the ASTM Group for the six months
ended 30 June 2007, and the Interim Accounts of the Holding Company (ASTM SpA) for 30 June
2007.
This interim half-year report is accompanied, in accordance with CONSOB Resolution No. 10867 of
31 July 1997, by the report of the Independent Auditors.
8
REPORT ON ACTIVITIES
The first-half results for the ASTM Group, as given in the interim Income Statement figures, show a
profit of €53.1m after providing €34.4m for amortization on its intangible and tangible fixed assets
(including the “non-compensated reversionary assets”).
SIGNIFICANT EVENTS IN THE FIRST SIX MONTHS OF 2007
Company reorganisation project: present situation
On 28 May 2007 the Board of Directors of ASTM SpA decided to implement the reorganisation
project in accordance with the outline approved at the Board meeting of 21 December 2006.
Developments in terms of the individual stages of the project’s implementation have been as follows:
• the Extraordinary General Meeting of Shareholders of SIAS SpA held on 29 June 2007 approved
the increase in the share capital (from €63,750,000 to €113,750,000) by issuing – in return for
ASTM’s contribution in the form of its shareholdings in SATAP SpA (99.874% of the share
capital) and in Road Link Holdings Ltd (20% of the share capital) – of 100,000,000 shares of
nominal value €0.50 each (at an issue premium of €9.69), reserved to ASTM SpA as the
contributor in accordance with Article 2441(iv) of the Civil Code;
• on 3 July 2007 the Deed contributing these shareholdings held by ASTM SpA was signed,
following which on 5 July 2007, once that Deed had been registered with the Turin Company
Register, the 100,000,000 shares in SIAS SpA were issued;
• on 6 July 2007 ASTM SpA sold the following shareholdings to Holding Piemonte and Valle
d’Aosta - HPVdA SpA (a company formed on 22 June 2007 with a share capital of €350,000,000
subscribed in full by SIAS SpA),:
- 2,642,622 shares in ATIVA SpA (41.17% of the share capital) for €113.8m;
- 15,620,425 shares in SAV SpA (65.085% of the share capital) for €95.7m;
- 4,602,895 shares in SITAF SpA (36.531% of the share capital) for €134.1m, together with
228,273 bonds convertible into ordinary shares of SITAF SpA, for €3.9m.
• on 31 July 2007 the Board of Directors of SIAS SpA completed, as required under Civil Code
2343, its check on the valuation made by the Expert Valuer appointed by the Court of Turin, and
decided there was no reason to revise the estimates and valuations on the basis of which the
capital increase had been resolved on;
• CONSOB is currently conducting its assessment before issuing its approval of the Prospectus
drawn up by SIAS with a view to a listing for the 100,000,000 newly-issued SIAS shares.
As part of this reorganisation process, moreover, ASTM SpA has purchased a total of 230,000 shares
in SINECO SpA (46% of the share capital) from SALT SpA, ADF SpA, SAV SpA and SATAP SpA
for a total of €12.8m, and also 205,997 shares in SINA SpA (5.079% of the share capital) from
SATAP SpA for €4.4m.
ASTM SpA has also purchased 9,792,264 SIAS bonds convertible into ordinary shares from SATAP
SpA, for a total consideration of €108.1m.
9
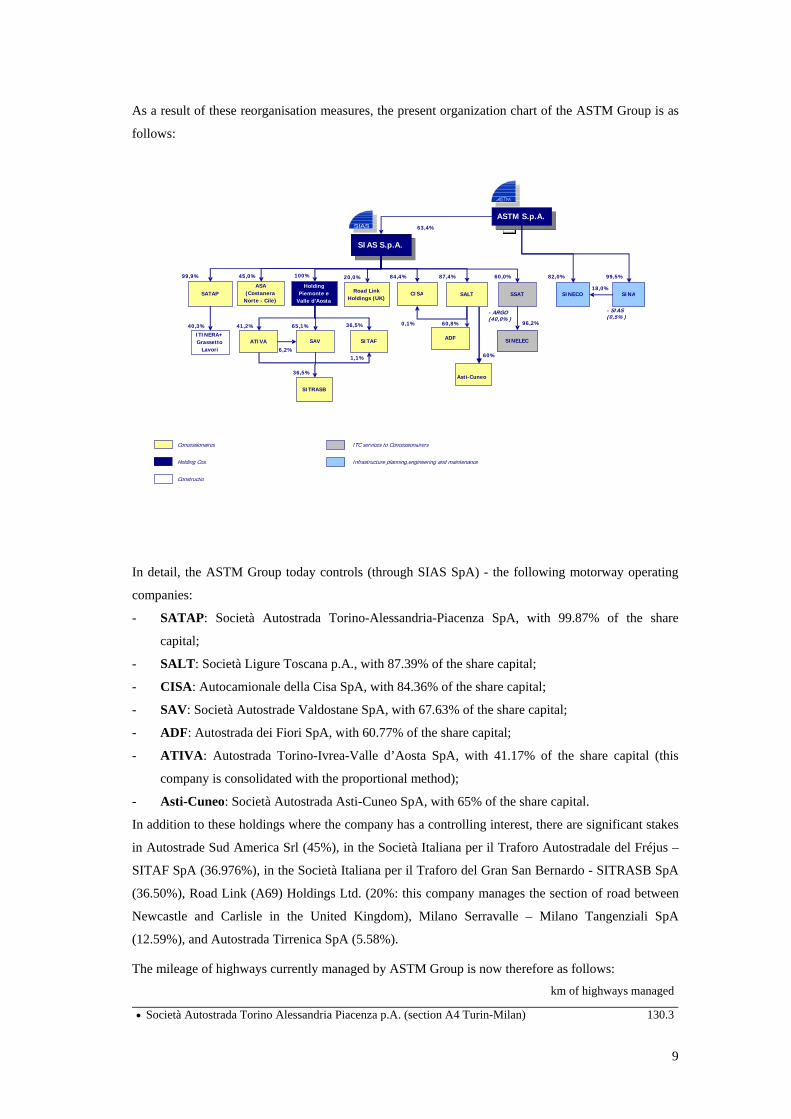
As a result of these reorganisation measures, the present organization chart of the ASTM Group is as
follows:
In detail, the ASTM Group today controls (through SIAS SpA) - the following motorway operating
companies:
- SATAP: Società Autostrada Torino-Alessandria-Piacenza SpA, with 99.87% of the share
capital;
- SALT: Società Ligure Toscana p.A., with 87.39% of the share capital;
- CISA: Autocamionale della Cisa SpA, with 84.36% of the share capital;
- SAV: Società Autostrade Valdostane SpA, with 67.63% of the share capital;
- ADF: Autostrada dei Fiori SpA, with 60.77% of the share capital;
- ATIVA: Autostrada Torino-Ivrea-Valle d’Aosta SpA, with 41.17% of the share capital (this
company is consolidated with the proportional method);
- Asti-Cuneo: Società Autostrada Asti-Cuneo SpA, with 65% of the share capital.
In addition to these holdings where the company has a controlling interest, there are significant stakes
in Autostrade Sud America Srl (45%), in the Società Italiana per il Traforo Autostradale del Fréjus –
SITAF SpA (36.976%), in the Società Italiana per il Traforo del Gran San Bernardo - SITRASB SpA
(36.50%), Road Link (A69) Holdings Ltd. (20%: this company manages the section of road between
Newcastle and Carlisle in the United Kingdom), Milano Serravalle – Milano Tangenziali SpA
(12.59%), and Autostrada Tirrenica SpA (5.58%).
The mileage of highways currently managed by ASTM Group is now therefore as follows: km of highways managed
• Società Autostrada Torino Alessandria Piacenza p.A. (section A4 Turin-Milan) 130.3
ASTM S.p.A.
SIAS S.p.A.
63,4%
SATAP
SAV ATIVA
SITRASB 36,5%
SITAF
1,1%6,2%
Road Link Holdings (UK)
65,1% 41,2% 36,5%
99,9%
ITINERA+ Grasset
40,3%
SINA - SIAS (0,5%)
SINECO 9 5% 9,
Holding Piemonte e
Valle d'Aosta
20,0% 82,0% SALTCISA
84,4% 87,4%
SSAT18,0%
60,0%100% ASA
(Costanera Norte - Cile)
45,0%
toLavori
60,8%
- ARGO (40,0%)
96,2%0,1%
ADF SINELEC
60%
Asti-Cuneo
Concessionaires Holding Cos. Constructio
n
ITC services to Concessionairers
Infrastructure planning,engineering and maintenance

10
• Società Autostrada Torino Alessandria Piacenza p.A. (section A21 Turin-Piacenza) 167.7
• Società Autostrada Ligure Toscana p.A. 154.9
• Autocamionale della Cisa SpA 182.0 (1)
Società Autostrade Valdostane SpA 59.5
• Autostrada dei Fiori SpA 113.2
• Società Autostrada Asti-Cuneo SpA 90.0 (2)
• Autostrada Torino-Ivrea-Valle d’Aosta SpA 155.8
Total managed by controlled subsidiaries (a) 1,053.4
• Autostrade Sud America Srl 43.0 (3)
• SITAF SpA 94.0
• SITRASB SpA 12.8
• Road Link Holdings Ltd 84.0
Total managed - directly or indirectly – by subsidiaries (b) 233.8
TOTAL (a+b) 1,287.2
(1) Including the 81 km Parma – Nogarole Rocca link (not yet constructed)
(2) Under construction
(3) This company controls, the Chilean concessionaire Costanera Norte S.A. through the sub-holding Autopista do Pacifico S.A
Relations with the public concession authority
So far as relations with the public concession authority ANAS are concerned, and the changes to the
legal and regulatory framework of the industry, the reader is invited to refer to the full account given
in the Annual Report for the year ended 31 December 2006.
In connection with the Group’s new shape following the reorganisation, it should be noted that the
agreement with ANAS in respect of Autostrada Asti-Cuneo SpA (which has now come under
ASTM’s control) for completion of its motorway portions and the operation of the whole motorway
section was signed on 1 August 2007.
Once this agreement has been registered with the Corte dei Conti, this company (60% owned by
SALT SpA, 5% by ITINERA SpA and the remaining 35% by ANAS) will be in a position to start
work on constructing the final 53km of motorway, for which there is a four-year completion schedule:
work is due to end in 2010 or 2011. On the basis of this agreement, the operating concession is to be
for 23 years and 6 months from completion of the work.
As to the remaining motorway concession companies indirectly controlled by ASTM SpA,
discussions with the public concession authority are continuing with a view to renewal of the
Financial Plans that have now expired.

11
The figures for 30 June 2007 given below concern the situation as it was before the reorganisation
GROUP REVENUES, EXPENSES AND PROFITS
The key income and expenditure figures for the first six months of 2007 (with the corresponding
proforma1 figures for the same period last year for comparison) can be summarised as follows: (€000s) First half 2007 First half 2006
(proforma)
Change
Motorway Sector revenue 160,621 154,502 6,119
Construction sector revenue 787 2,214 (1,427)
Engineering Sector revenue 12,928 14,554 (1,626)
Other revenues 17,848 14,550 3,298
Operating costs (92,933) (96,256) 3,323
Capitalised costs on fixed assets 12,044 9,472 2,572
Gross operating margin 111,295 99,036 12,259
Significant exceptional items 1,738 - 1,738
Gross operating margin, adjusted 113,033 99,036 13,997
Amortization and other provisions,
net of drawings
(34,395) (21,378) (13,017)
Operating profit 78,638 77,658 980
Financial income 4,358 6,209 (1,851)
Financial charges (13,534) (14,483) 949
Net dividend income from subsidiaries
valued by the Shareholders’ Equity method 14,427
16,933 (2,506)
Net financial income 5,251 8,659 (3,408)
Profit before taxes 83,889 86,317 (2,428)
Income taxes (current and deferred) (29,816) (28,137) (1,679)
Profit (loss) for the period 54,073 58,180 (4,107)
Minority interests’ share 960 1,699 (739)
Group’s share 53,113 56,481 (3,368)
Despite the partial and tardy application of the toll rate adjustments due, and the rise in the concession
payments to ANAS, good turnover and a lowering of operating costs have meant that the Motorway
Sector improved its operating profit significantly (+12.4% compared with the pro-forma comparable
period last year).
Motorway Sector revenue rose by some €6.1m; this increase, of 4%, is due to the increase in lease
income from service areas (+€1m) and in toll receipts (+€5.1m); the latter change is due to the rise in
1 In order to provide comparable figures following the removal of ITINERA SpA from the scope of consolidation (from 1 July
2006) and its consequent valuation by the Shareholders’ Equity method, proforma statements of profit and loss accounts have
been drawn up in which, for the first half of 2006, the figures for this shareholding are included under the heading “Net
dividend income from subsidiaries valued by the Shareholders’ Equity method”

12
traffic volumes and the adjustment of toll rates which took effect on some of the Group’s sections on
15 March 2007.
Construction sector revenue were lower as the amount of work done by Strade Co.Ge. SpA was less.
The change in revenue from the Engineering Sector reflects the type of work done in these six months,
less being done for non-Group organizations and more on behalf of companies within the ASTM
Group (as shown by the in the item “Capitalised costs on fixed assets”).
The increase in the figure for Other Revenues is for the most part due to a greater amount of work
done by SATAP SpA on behalf of the CAV.TO.MI consortium (which is building the High Capacity
line between Turin and Milan); this increase almost exactly matches a corresponding rise in operating
costs.
Operating costs themselves, despite the rise in the concession payments and the greater activity of the
firms operating in the Engineering Sector, as well as the increase in work done for the CAV.TO.MI.
consortium, were lower overall by about €3.3m, mainly due to two factors: a revised scheduling of
maintenance operations, and a significant reduction in winter services costs following the clement
weather conditions of early 2007.
For all the above reasons, Gross Operating Margin grew by some €12.3m (+12.4%).
“Significant exceptional items” refers to the non-recurring adjustment to the actuarial value of the
superannuation funds (or TFR), arising from the changes made by the Pensions Reform Act (Law No.
296 of 27 December 2006) and its Implementing Orders.
“Amortization and other provisions, net of drawings” rose by about €13m because of the greater
amortization provided for by the Financial Plans associated with the current concession agreements
and the greater sums set aside for the rehabilitation/replacement of non-compensated reversionary
assets; this item also includes the impairment of €2.7m in the goodwill on the motorway concession
company ATIVA.
Financial Income refers to the dividends received from shareholdings and the proceeds of investing
available cash. The smaller figure for this item is because of the capital gains made in the first six
months of 2006 on the sale of shares (about €2.1m).
In spite of the greater financial exposure connected with the progress of the Group’s significant
programme of investment in motorway assets, Financial Charges as a whole fell by some €0.9m
because of the higher capitalisation associated with this.
“Net dividends received from companies valued by the Shareholders’ Equity method” includes the
Group’s share of the profits earned by its subsidiaries SIAS SpA, SITAF SpA and Road Link Ltd.; the
reduction this year is mainly due to a smaller contribution from the part-owned subsidiary ITINERA
SpA.
In view of all the above, the Group’s share of total Profit for the period was €53.1m (€56.5m in the
first six months of 2006).
13
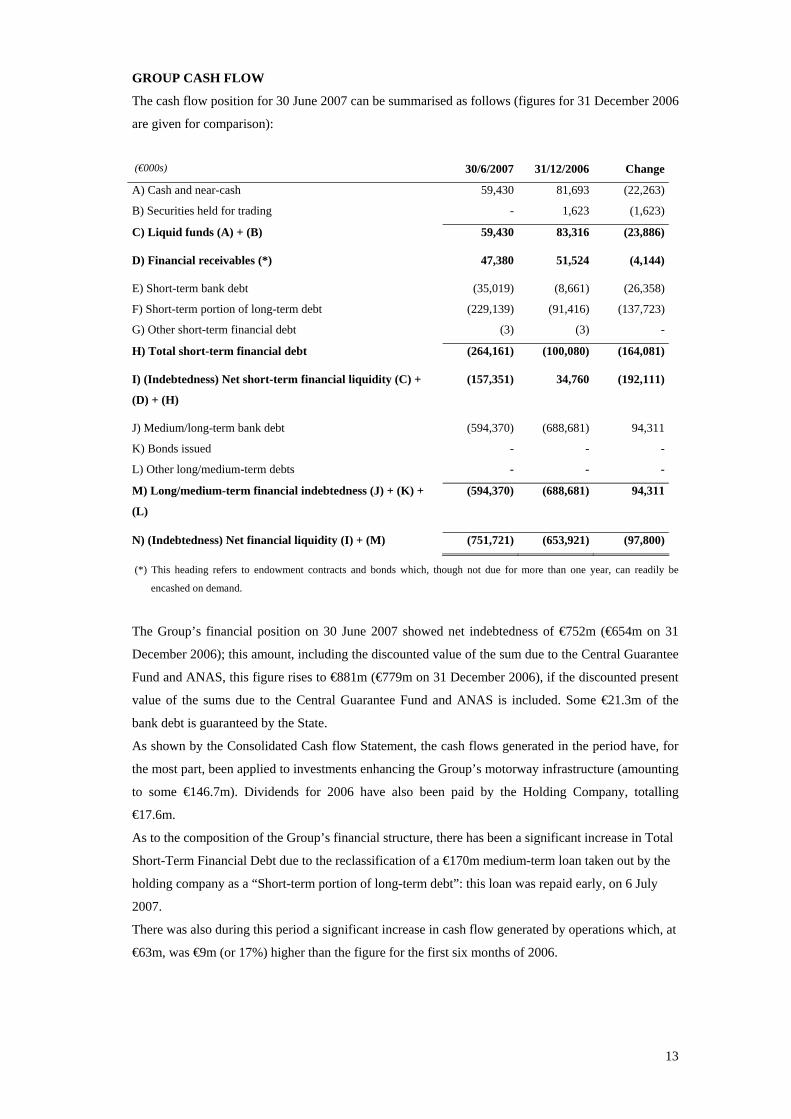
GROUP CASH FLOW
The cash flow position for 30 June 2007 can be summarised as follows (figures for 31 December 2006
are given for comparison):
(€000s) 30/6/2007 31/12/2006 Change
A) Cash and near-cash 59,430 81,693 (22,263)
B) Securities held for trading - 1,623 (1,623)
C) Liquid funds (A) + (B) 59,430 83,316 (23,886)
D) Financial receivables (*) 47,380 51,524 (4,144)
E) Short-term bank debt (35,019) (8,661) (26,358)
F) Short-term portion of long-term debt (229,139) (91,416) (137,723)
G) Other short-term financial debt (3) (3) -
H) Total short-term financial debt (264,161) (100,080) (164,081)
I) (Indebtedness) Net short-term financial liquidity (C) +
(D) + (H)
(157,351) 34,760 (192,111)
J) Medium/long-term bank debt (594,370) (688,681) 94,311
K) Bonds issued - - -
L) Other long/medium-term debts - - -
M) Long/medium-term financial indebtedness (J) + (K) +
(L) (594,370) (688,681) 94,311
N) (Indebtedness) Net financial liquidity (I) + (M) (751,721) (653,921) (97,800)
(*) This heading refers to endowment contracts and bonds which, though not due for more than one year, can readily be
encashed on demand.
The Group’s financial position on 30 June 2007 showed net indebtedness of €752m (€654m on 31
December 2006); this amount, including the discounted value of the sum due to the Central Guarantee
Fund and ANAS, this figure rises to €881m (€779m on 31 December 2006), if the discounted present
value of the sums due to the Central Guarantee Fund and ANAS is included. Some €21.3m of the
bank debt is guaranteed by the State.
As shown by the Consolidated Cash flow Statement, the cash flows generated in the period have, for
the most part, been applied to investments enhancing the Group’s motorway infrastructure (amounting
to some €146.7m). Dividends for 2006 have also been paid by the Holding Company, totalling
€17.6m.
As to the composition of the Group’s financial structure, there has been a significant increase in Total
Short-Term Financial Debt due to the reclassification of a €170m medium-term loan taken out by the
holding company as a “Short-term portion of long-term debt”: this loan was repaid early, on 6 July
2007.
There was also during this period a significant increase in cash flow generated by operations which, at
€63m, was €9m (or 17%) higher than the figure for the first six months of 2006.
14
ANALYSIS OF RESULTS FOR THE FIRST SIX MONTHS OF 2007: HOLDING
COMPANY AND MAIN SUBSIDIARIES
Autostrada Torino-Milano SpA
The breakdown of the parent company’s interim Income Statement for 30 June 2007 reflects its core
business: that of an industrial holding company. In the first six months of 2007 the company made a
profit of €15.1m (€364.8m in the same period of 2006); it will be recalled that the figure for the first
six months of 2006 was boosted by an extraordinary dividend of €344.9m distributed by SATAP SpA
because of significant capital gains that company had made from the sale of financial assets.
The financial position on 30 June 2007 shows net indebtedness of about €155.1m (€149.4m on 31
December 2006). The cash flow from receipt of dividends from shareholdings (€18m) has been used
to buy shares in Road Link Holdings Ltd (€2m) and to pay the final dividend for 2006 (€17.6m), as
well as €4.5m of interest due on the loan from Banca di Roma SpA.
The Schedule of Reconciliation between ASTM SpA Shareholders’ Equity and Profit for the Period
and the corresponding figures for the ASTM Group (as required by CONSOB Notice No.
DEM/6064293 of 28 July 2006) is included in the “Consolidated Accounts”.
15
Motorway Sector
On 30 June 2007, Autostrada Torino – Milano SpA controlled the following motorway operating
companies:
- S.A.T.A.P.: Società Autostrada Turin – Alessandria – Piacenza SpA, with 99.874% of the share
capital;
- S.A.V.: Società Autostrade Valdostane SpA, with 67.634% of the share capital;
- ATIVA: Autostrada Turin – Ivrea – Valle d’Aosta SpA, with 41.17% of the share capital (this
company is consolidated with the proportional method);
Furthermore it has a considerable influence over four other companies, though owning only a minority
stake: Società Italiana per il Traforo Autostradale del Fréjus (S.I.T.A.F. SpA: 36.976%), Società
Italiana per il Traforo del Gran San Bernardo (SITRASB SpA: 36.50%), Società Iniziative
Autostradali e Servizi (SIAS SpA: 34.734%), and 20% of Road Link (A69) Holdings Ltd., which
manages the stretch of road between Newcastle and Carlisle in the United Kingdom.
For the Group structure as it results from the current corporate reorganisation, reference should be
made to the account in Part One of this Report.
SATAP – Società Autostrada Torino – Alessandria – Piacenza SpA
The company manages the stretches of motorway between Turin and Milan (A4) and Turin –
Alessandria – Piacenza (A21); it is controlled by the Group, which owned 99.874% of the share
capital on 30 June 2007.
The key income and expenditure figures for the first six months of 2007 can be summarised as follows
(figures for the same period last year are given for comparison):
(€000s) First half 2007 First half 2006 Change
Motorway Sector revenue 116,645 112,917 3,728
Other revenues 13,212 9,859 3,353
Operating costs (51,239) (55,679) 4,440
Gross operating margin 78,618 67,097 11,521
Significant exceptional items 1,151 - 1,151
Gross operating margin, adjusted 79,769 67,097 12,672
Amortization and other provisions, net of drawing (29,541) (21,577) (7,964)
Operating profit 50,228 45,520 4,708
Financial income 3,922 18,614 (14,692)
Financial charges (2,716) (5,377) 2,661
Net financial income 1,206 13,237 (12,031)
Profit before taxes 51,434 58,757 (7,323)
Income current taxes and deferred (22,404) (20,477) (1,927)
16
Half-Year Profit 29,030 38,280 (9,250)
***
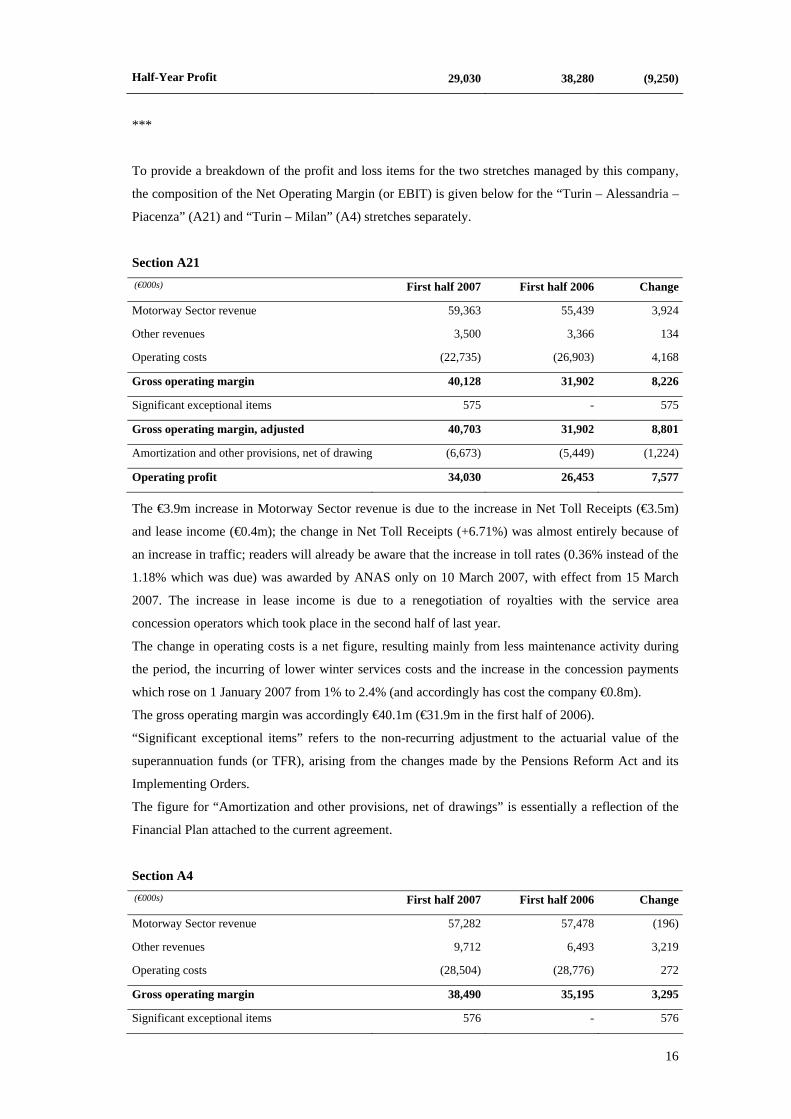
To provide a breakdown of the profit and loss items for the two stretches managed by this company,
the composition of the Net Operating Margin (or EBIT) is given below for the “Turin – Alessandria –
Piacenza” (A21) and “Turin – Milan” (A4) stretches separately.
Section A21 (€000s) First half 2007 First half 2006 Change
Motorway Sector revenue 59,363 55,439 3,924
Other revenues 3,500 3,366 134
Operating costs (22,735) (26,903) 4,168
Gross operating margin 40,128 31,902 8,226
Significant exceptional items 575 - 575
Gross operating margin, adjusted 40,703 31,902 8,801
Amortization and other provisions, net of drawing (6,673) (5,449) (1,224)
Operating profit 34,030 26,453 7,577
The €3.9m increase in Motorway Sector revenue is due to the increase in Net Toll Receipts (€3.5m)
and lease income (€0.4m); the change in Net Toll Receipts (+6.71%) was almost entirely because of
an increase in traffic; readers will already be aware that the increase in toll rates (0.36% instead of the
1.18% which was due) was awarded by ANAS only on 10 March 2007, with effect from 15 March
2007. The increase in lease income is due to a renegotiation of royalties with the service area
concession operators which took place in the second half of last year.
The change in operating costs is a net figure, resulting mainly from less maintenance activity during
the period, the incurring of lower winter services costs and the increase in the concession payments
which rose on 1 January 2007 from 1% to 2.4% (and accordingly has cost the company €0.8m).
The gross operating margin was accordingly €40.1m (€31.9m in the first half of 2006).
“Significant exceptional items” refers to the non-recurring adjustment to the actuarial value of the
superannuation funds (or TFR), arising from the changes made by the Pensions Reform Act and its
Implementing Orders.
The figure for “Amortization and other provisions, net of drawings” is essentially a reflection of the
Financial Plan attached to the current agreement.
Section A4 (€000s) First half 2007 First half 2006 Change
Motorway Sector revenue 57,282 57,478 (196)
Other revenues 9,712 6,493 3,219
Operating costs (28,504) (28,776) 272
Gross operating margin 38,490 35,195 3,295
Significant exceptional items 576 - 576
17
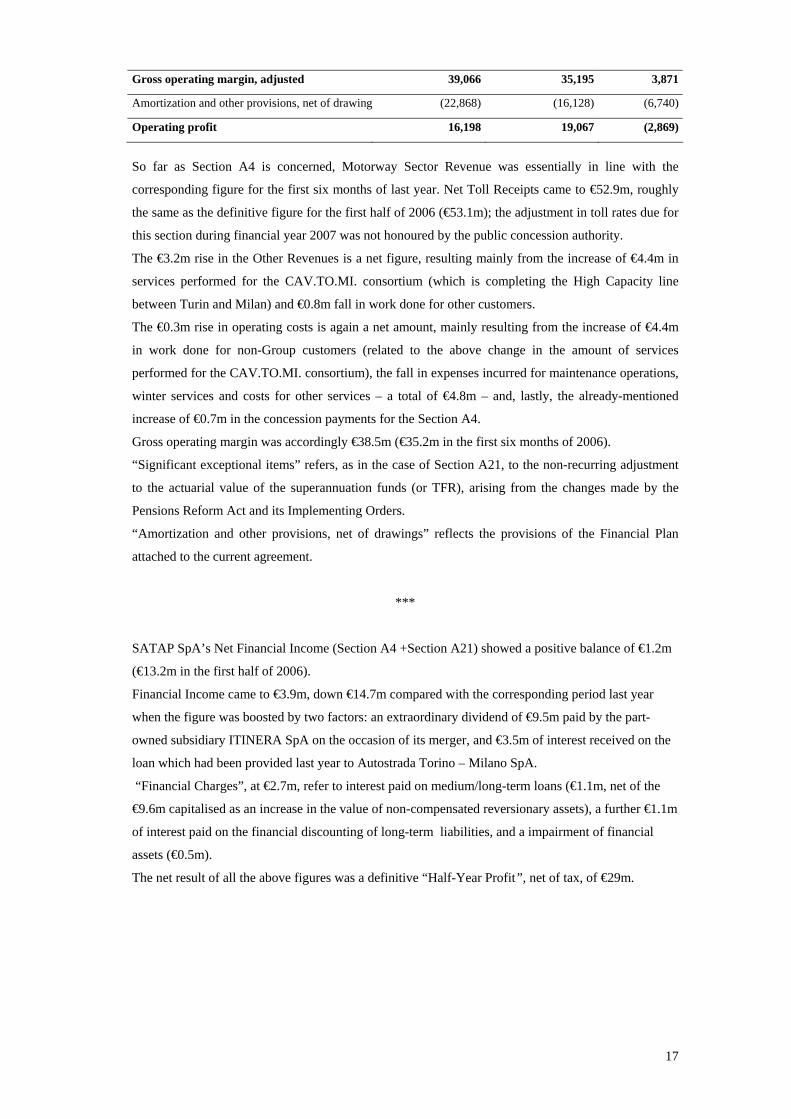
Gross operating margin, adjusted 39,066 35,195 3,871
Amortization and other provisions, net of drawing (22,868) (16,128) (6,740)
Operating profit 16,198 19,067 (2,869)
So far as Section A4 is concerned, Motorway Sector Revenue was essentially in line with the
corresponding figure for the first six months of last year. Net Toll Receipts came to €52.9m, roughly
the same as the definitive figure for the first half of 2006 (€53.1m); the adjustment in toll rates due for
this section during financial year 2007 was not honoured by the public concession authority.
The €3.2m rise in the Other Revenues is a net figure, resulting mainly from the increase of €4.4m in
services performed for the CAV.TO.MI. consortium (which is completing the High Capacity line
between Turin and Milan) and €0.8m fall in work done for other customers.
The €0.3m rise in operating costs is again a net amount, mainly resulting from the increase of €4.4m
in work done for non-Group customers (related to the above change in the amount of services
performed for the CAV.TO.MI. consortium), the fall in expenses incurred for maintenance operations,
winter services and costs for other services – a total of €4.8m – and, lastly, the already-mentioned
increase of €0.7m in the concession payments for the Section A4.
Gross operating margin was accordingly €38.5m (€35.2m in the first six months of 2006).
“Significant exceptional items” refers, as in the case of Section A21, to the non-recurring adjustment
to the actuarial value of the superannuation funds (or TFR), arising from the changes made by the
Pensions Reform Act and its Implementing Orders.
“Amortization and other provisions, net of drawings” reflects the provisions of the Financial Plan
attached to the current agreement.
***
SATAP SpA’s Net Financial Income (Section A4 +Section A21) showed a positive balance of €1.2m
(€13.2m in the first half of 2006).
Financial Income came to €3.9m, down €14.7m compared with the corresponding period last year
when the figure was boosted by two factors: an extraordinary dividend of €9.5m paid by the part-
owned subsidiary ITINERA SpA on the occasion of its merger, and €3.5m of interest received on the
loan which had been provided last year to Autostrada Torino – Milano SpA.
“Financial Charges”, at €2.7m, refer to interest paid on medium/long-term loans (€1.1m, net of the
€9.6m capitalised as an increase in the value of non-compensated reversionary assets), a further €1.1m
of interest paid on the financial discounting of long-term liabilities, and a impairment of financial
assets (€0.5m).
The net result of all the above figures was a definitive “Half-Year Profit”, net of tax, of €29m.
18
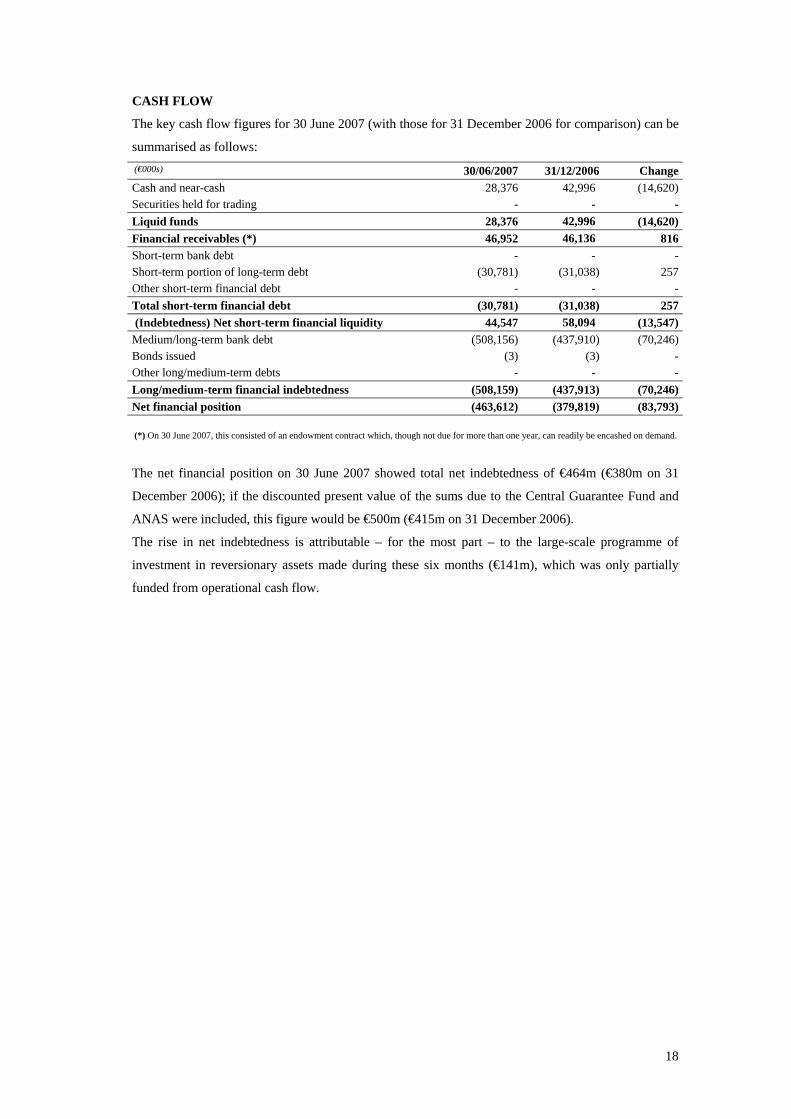
CASH FLOW
The key cash flow figures for 30 June 2007 (with those for 31 December 2006 for comparison) can be
summarised as follows: (€000s) 30/06/2007 31/12/2006 ChangeCash and near-cash 28,376 42,996) (14,620)Securities held for trading - -) -Liquid funds 28,376 42,996) (14,620)Financial receivables (*) 46,952 46,136) 816Short-term bank debt - -) -Short-term portion of long-term debt (30,781) (31,038) 257Other short-term financial debt - -) -Total short-term financial debt (30,781) (31,038) 257 (Indebtedness) Net short-term financial liquidity 44,547 58,094) (13,547)Medium/long-term bank debt (508,156) (437,910) (70,246)Bonds issued (3) (3) -Other long/medium-term debts - -) -Long/medium-term financial indebtedness (508,159) (437,913) (70,246)Net financial position (463,612) (379,819) (83,793) (*) On 30 June 2007, this consisted of an endowment contract which, though not due for more than one year, can readily be encashed on demand.
The net financial position on 30 June 2007 showed total net indebtedness of €464m (€380m on 31
December 2006); if the discounted present value of the sums due to the Central Guarantee Fund and
ANAS were included, this figure would be €500m (€415m on 31 December 2006).
The rise in net indebtedness is attributable – for the most part – to the large-scale programme of
investment in reversionary assets made during these six months (€141m), which was only partially
funded from operational cash flow.
19
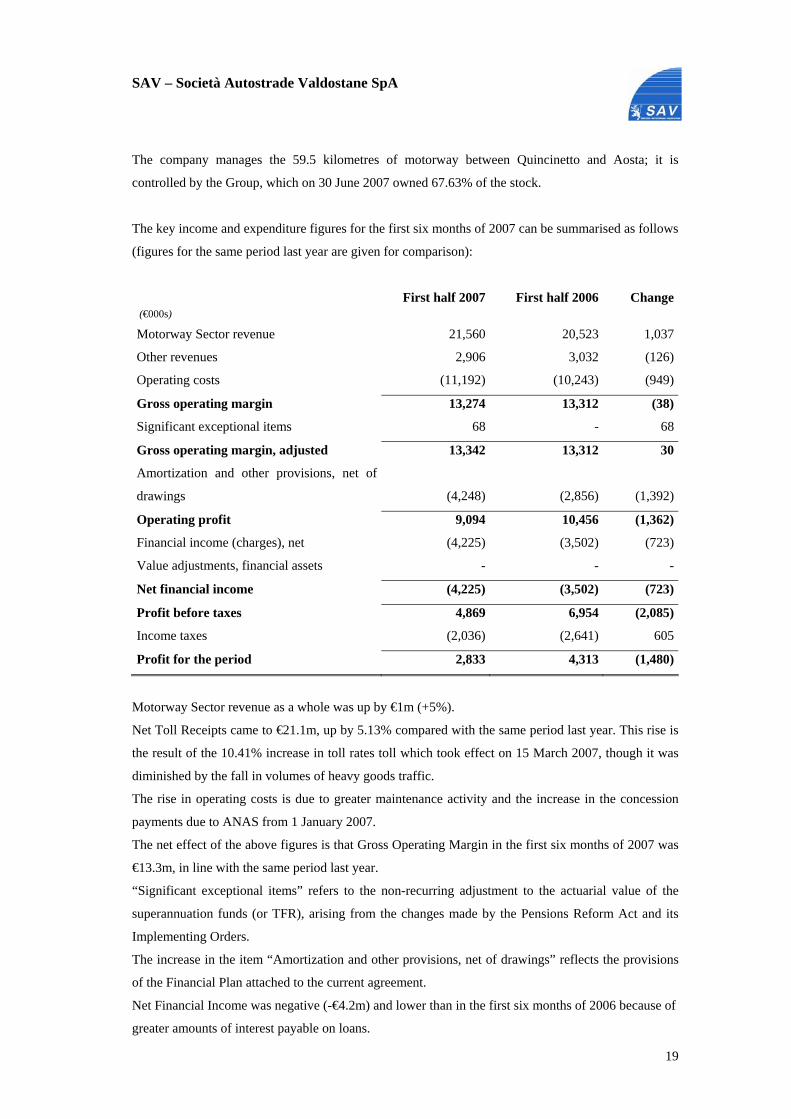
SAV – Società Autostrade Valdostane SpA
The company manages the 59.5 kilometres of motorway between Quincinetto and Aosta; it is
controlled by the Group, which on 30 June 2007 owned 67.63% of the stock.
The key income and expenditure figures for the first six months of 2007 can be summarised as follows
(figures for the same period last year are given for comparison):
(€000s) First half 2007 First half 2006 Change
Motorway Sector revenue 21,560 20,523 1,037
Other revenues 2,906 3,032 (126)
Operating costs (11,192) (10,243) (949)
Gross operating margin 13,274 13,312 (38)
Significant exceptional items 68 - 68
Gross operating margin, adjusted 13,342 13,312 30
Amortization and other provisions, net of
drawings (4,248) (2,856) (1,392)
Operating profit 9,094 10,456 (1,362)
Financial income (charges), net (4,225) (3,502) (723)
Value adjustments, financial assets - - -
Net financial income (4,225) (3,502) (723)
Profit before taxes 4,869 6,954 (2,085)
Income taxes (2,036) (2,641) 605
Profit for the period 2,833 4,313 (1,480)
Motorway Sector revenue as a whole was up by €1m (+5%).
Net Toll Receipts came to €21.1m, up by 5.13% compared with the same period last year. This rise is
the result of the 10.41% increase in toll rates toll which took effect on 15 March 2007, though it was
diminished by the fall in volumes of heavy goods traffic.
The rise in operating costs is due to greater maintenance activity and the increase in the concession
payments due to ANAS from 1 January 2007.
The net effect of the above figures is that Gross Operating Margin in the first six months of 2007 was
€13.3m, in line with the same period last year.
“Significant exceptional items” refers to the non-recurring adjustment to the actuarial value of the
superannuation funds (or TFR), arising from the changes made by the Pensions Reform Act and its
Implementing Orders.
The increase in the item “Amortization and other provisions, net of drawings” reflects the provisions
of the Financial Plan attached to the current agreement.
Net Financial Income was negative (-€4.2m) and lower than in the first six months of 2006 because of
greater amounts of interest payable on loans.

20
The net result of all the above figures was a definitive profit for the period of €2.8m (€4.3m in the first
six months of 2006).
CASH FLOW
The key cash flow figures for 30 June 2007 can be summarised as follows (with those for 31
December 2006 for comparison):
(€000s) 30/6/2007 31/12/2006 Change
A) Cash and near-cash 1,156 3,947 (2,791)B) Securities held for trading - - -
C) Liquid funds (A)+ (B) 1,156 3,947 (2,791)D) Financial receivables - - -E) Short-term bank debt (26,084) (14,950) (11,134)F) Short-term portion of long-term debt (23,388) (20,203) (3,185)G) Other short-term financial debt - - -
H) Total short-term financial debt (49,472) (35,153) (14,319)
I) (Indebtedness) Net short-term financial liquidity (C)+ (D)+ (H) (48,316) (31,206) (17,110)
J) Medium/long-term bank debt (47,906) (60,923) 13,017K) Bonds issued - - -L) Other long/medium-term debts - - -
M) Long/medium-term financial indebtedness (J)+ (K)+ (L) (47,906) (60,923) 13,017
N) (Indebtedness) Net financial liquidity (I)+ (M) (96,222) (92,129) (4,093)
The financial position on 30 June 2007 showed total net indebtedness of about €96.2m; if the
discounted present value of the sums due to the Central Guarantee Fund and ANAS were included,
this figure would be €170.3m (€164.1m on 31 December 2006). Some €21.3m of the bank debt is
guaranteed by the State.
The cash flows generated by operations have been applied to investments enhancing the Group’s
motorway infrastructure (€1.4m) and to the payment of the dividend for 2006 (€4.1m).
21
ATIVA – Autostrada Torino-Ivrea-Valle d’Aosta SpA
The company manages Turin’s system of bypasses, the extension as far as Quincinetto, the Ivrea -
Santhià link and the Turin – Pinerolo motorway, a total of 155.8 kilometres. It is under the joint
control of the Group and another party; the Group’s stake is 41.17%. ATIVA SpA and its subsidiaries
are consolidated by the proportional method (in proportion to the Group’s percentage of the stock).
The company’s key income and expenditure figures can be summarised as follows:
(€000s) First half 2007 First half 2006 Change
Motorway Sector revenue 54,448 51,372 3,076
Other revenues 3,310 2,336 974
Operating costs (23,863) (26,122) 2,259
Gross operating margin 33,895 27,586 6,309
Significant exceptional items 592 - 592
Gross operating margin, adjusted 34,487 27,586 6,901
Amortization and other provisions, net of draw (9,223) (7,027) (2,196)
Operating profit 25,264 20,559 4,705
Financial income 933 2,740 (1,807)
Financial charges (3,682) (3,328) (354)
Net financial income (2,749) (588) (2,161)
Profit before taxes 22,515 19,971 2,544
Income taxes (8,736) (7,232) (1,504)
Profit for the period 13,779 12,739 1,040
Motorway Sector revenue totalled €54.4m, up by about €3.1m compared with the same period of
2006. Net Toll Receipts came to €49.1m, an increase of 4.3% compared with that period. This
increase was mainly caused by the increase in the traffic; the 0.74% rise in toll rates awarded by
ANAS came into effect only from 15 March 2007.
Operating costs for the first six months of 2007 were €23.9m, an overall drop of €2.2m mainly due to
lower costs incurred for services.
The net effect of the above figures is that the gross operating margin was €33.9m, up by €6.3m
compared with the same period last year (+22.9%). “Significant exceptional items” refers to the non-recurring adjustment to the actuarial value of the
superannuation funds (or TFR), arising from the changes made by the Pensions Reform Act and its
Implementing Orders.
“Amortization and other provisions, net of drawings” rose by some €2.2m because of the greater
amortization and the greater sums set aside for the rehabilitation/replacement of non-compensated
reversionary assets.
Net financial charges were €2.2m greater, because of lower dividends distributed by controlled
subsidiaries and greater financial costs.

22
The net result of all the above figures was a definitive profit for the period of €13.8m, up by about
€1m compared with the same period last year.
CASH FLOW
The key cash flow figures for 30 June 2007 can be summarised as follows (with those for 31
December 2006 for comparison):
(€000s) 30/6/2007 31/12/2006 Change
A) Cash and near-cash 7,952 8,359 (407)B) Securities held for trading - - -
C) Liquid funds (A)+ (B) 7,952 8,359 (407)D) Financial receivables (*) - 15,024 (15,024)E) Short-term bank debt - - -F) Short-term portion of long-term debt (11,098) (10,868) (230)G) Other short-term financial debt - - -
H) Total short-term financial debt (11,098) (10,868) (230)
I) (Indebtedness) Net short-term financial liquidity (C)+ (D)+ (H) (3,146) 12,515 (15,661)J) Medium/long-term bank debt (92,895) (98,491) 5,596K) Bonds issued - - -L) Other long/medium-term debts - - -
M) Long/medium-term financial indebtedness (J)+ (K)+ (L) (92,895) (98,491) 5,596
N) (Indebtedness) Net financial liquidity (96,041) (85,976) (10,065)
(*) On 31 December 2006, this heading contained endowment contracts and government securities which, though not due for more than one year, can readily be encashed on demand
The financial position on 30 June 2007 showed total net indebtedness of €96m (€86m on 31
December 2006); if the discounted present value of the sums due to the Central Guarantee Fund and
ANAS were included, this figure would be €141.1m (€129.9m on 31 December 2006).
The change in the net financial position compared with 31 December 2006 is mainly related to
continuing investment in motorway fabric (€9.3m invested during the period) and the paying of the
final dividend for 2006 (€10.3m).
SIAS – Società Iniziative Autostradali e Servizi SpA
The Group owns 34.7% of this company on 30 June 2007.
The gross operating margin of the whole SIAS Group for the first six months of 2007 was €131.1m
(€5.4m up, or 4.3%).

23
The Group’s share of SIAS’ profit was €31.5m (some €2.7m higher than the corresponding figure for
2006).
The Consolidated Financial Position on 30 June 2007 showed total net indebtedness of €442.4m
(€436.2m on 31 December 2006).
SITAF – Società Italiana per il Traforo Autostradale del Fréjus SpA
SITAF SpA manages the stretch of motorway between Turin and Bardonecchia (A32) and the
international Fréjus Tunnel (T4). The Group owns 36.9% of the stock.
Net Toll Receipts in the first six months of 2007 came to €57.7m, up by €3.9m compared with the
same period last year.
The company earned a profit of €7.9m in the first six months of 2007 (€8.9m in the first six months of
2006).
SITRASB – Società Italiana Traforo del Gran San Bernardo SpA
The company manages the international tunnel of the same name. The Group owns 36.5% of the
stock.
Motorway Sector Revenue came to €3.2m (€3.4m in the first six months of 2006).
The first six months of 2007 ended with a profit of €0.1m, in line with the corresponding figure last
year (€0.2m).
The financial position on 30 June 2007 showed a net positive balance of €8.9m (against a positive
balance of €9.5m on 31 December 2006).
S.A.Bro.M. – Società Autostrada Broni – Mortara SpA
On 23 March 2007 SATAP SpA bought from Milano Serravalle – Milano Tangenziali SpA a further
30% tranche of S.A.Bro.M. SpA (a company whose Object is the drafting of the preliminary project
for the regional motorway known as the “Broni – Pavia – Mortara Trunk Road”) for a consideration of
€750,000. The Group’s present stake in this firm is accordingly 82% of the share capital.
24
S.A.Bro.M. SpA, which is currently at the start–up stage, ended the first six months of 2007 with a
loss of €0.1m. Net indebtedness on 30 June 2007 was €8.4m (€4m on 31 December 2006).
25
Engineering Sector
Società Iniziative Nazionali Autostradali – SINA SpA
This company is engaged in the research, design and superintendence of railway and motorway
works; it is under the control of the Group, which owned 99.5% of the share capital on 30 June 2007.
The company’s key income and expenditure figures can be summarised as follows:
(€000s) First half 2007 First half 2006 Change
Engineering Sector revenue 18,043 16,612 1,431
Operating costs (15,243) (13,509) (1,734)
Gross operating margin 2,800 3,103 (303)
Significant exceptional items 158 - 158
Gross operating margin, adjusted 2,958 3,103 (145)
Amortization and other provisions, net of draw (57) (60) 3
Operating profit 2,901 3,043 (142)
Financial income 2,568 1,345 1,223
Financial charges (49) (12) (37)
Value adjustments, financial assets - - -
Net financial income 2,519 1,333 1,186
Profit before taxes 5,420 4,376 1,044
Income taxes (1,555) (1,369) (186)
Profit for the period 3,865 3,007 858
In the first six months of 2007 the increase in design business, mainly for Group companies, raised
total revenue by some €1.4m, to about €18m.
As a result of this greater activity, operating costs rose to €15.2m (€13.5m in the first six months of
2006).
As a result, the gross operating margin for the first six months of 2007 was €2.8m (€3.1m in the first
six months of 2006).
“Significant exceptional items” refers to the non-recurring adjustment to the actuarial value of the
superannuation funds (or TFR), arising from the changes made by the Pensions Reform Act and its
Implementing Orders.
The financial position was boosted by a €1.5m capital gain arising from the sale to the parent
company ASTM SpA of the stake in Road Link Holdings Ltd.
The net result of all the above figures was a definitive profit for the period of €3.9m (€3m in the first
six months of 2006).

26
The net financial position on 30 June 2007 shows a positive balance of €5.7m (€4.7m on 31 December
2006), consisting of the company’s current account balances and short term bonds encashable on
demand.
SINECO SpA The company is engaged in the business of monitoring and inspecting the state of conservation of the
transport infrastructure within its area; it is controlled by the Group, which owned 90% of the share
capital on 30 June 2007.
The company’s key income and expenditure figures can be summarised as follows:
(€000s) First half 2007 First half 2006 Change
Engineering Sector revenue 8,136 7,220 916
Operating costs (5,748) (4,790) (958)
Gross operating margin 2,388 2,430 (42)
Significant exceptional items 117 - 117
Gross operating margin, adjusted 2,505 2,430 75
Amortization and other provisions, net of draw (121) (99) (22)
Operating profit 2,384 2,331 53
Financial income 59 42 17
Financial charges (28) (12) (16)
Net financial income 31 30 1
Profit before taxes 2,415 2,361 54
Income taxes (1,105) (982) (123)
Profit/ (Loss) for the period 1,310 1,379 (69)
Revenue in the first half of 2007 came to €8.1m, an increase of about €0.9m compared with the same
period of 2006.
Operating costs totalled €5.7m, up on the 2006 figure by €1m.
As a result, the gross operating margin was €2.4m, essentially in line with the corresponding figure
last year.
“Significant exceptional items” refers to the non-recurring adjustment to the actuarial value of the
superannuation funds (or TFR), arising from the changes made by the Pensions Reform Act and its
Implementing Orders.
The net result of all the above figures was a definitive profit for the period of €1.3m (€1.4m in the first
six months of 2006).
27
The net financial position on 30 June 2007 shows a positive balance of €2m (€2.8m on 31 December
2006), consisting of the company’s current account balances and short term bonds encashable on
demand.
The lower cash flow compared with last year is mainly due to the payment of the dividend for 2006
(€2m).

28
SEGMENT INFORMATION: DETAILS OF GROUP PERFORMANCE BY SECTOR AND
GEOGRAPHICAL AREA
In accordance with CONSOB Notice No. 98084143 of 27 October 1998, it should be explained that,
as already explained under “Group’s Composition and Areas of Business” above, the Group’s primary
area of business is the operation of motorway networks under concession, and related activities: the
Income Statement and Balance Sheet headings of its Consolidated Accounts are accordingly for the
most part accounted for by this kind of activity.
As required under IAS 14 a breakdown of the Group figures by area of business is given in the Notes
to the Accounts which accompany the Consolidated Accounts: see the special section entitled “Details
by Sector”.
Reporting by “geographical region” does not apply, since the business of the companies including in
the scope of consolidation of the ASTM Group is essentially carried on within Italy.
SIGNIFICANT POST-BALANCE SHEET EVENTS
Apart from developments mentioned already in this report, there have been no significant events since
30 June 2007.
SHORT-TERM PROSPECTS
Implementation of the corporate reorganisation project has entailed a takeover by ASTM SpA of a
controlling interest in SIAS SpA.
Concentrating the motorway concession companies within the SIAS Group will bring significant
benefits in terms of size, and at the same time enable the whole Group to considerably increase its
own “critical mass”, resulting – as early as second half of 2007 – in improvements in profitability;
these beneficial effects will be directly reflected in ASTM SpA’s performance.
For the full 2007 financial year, therefore, we expect a further consolidation of the ASTM Group’s
operating profit as a result of higher earnings by both the Motorway and the Engineering Sectors.
The final figures for this financial year will of course be affected by developments in all the factors
mentioned above.
Turin, 12 September 2007
<sig>
Dr. Riccardo Formica, Chairman
for the Board of Directors
29
Consolidated Interim Accounts
30
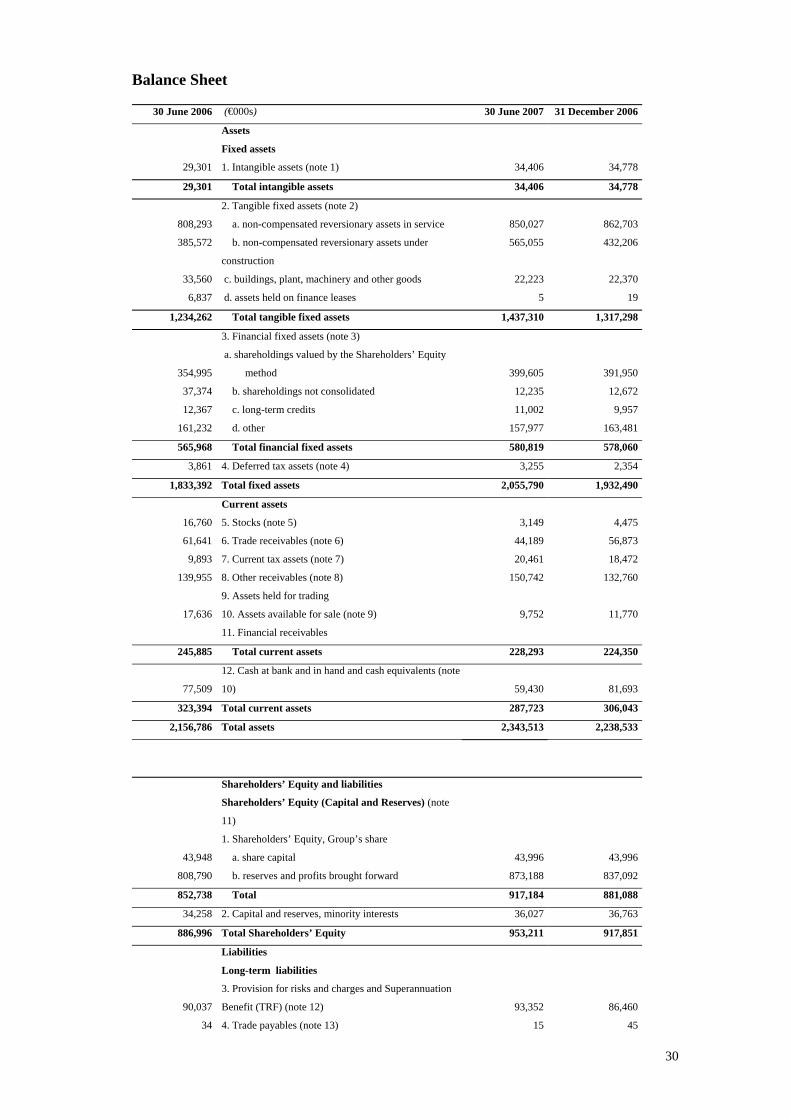
Balance Sheet
30 June 2006 (€000s) 30 June 2007 31 December 2006
Assets
Fixed assets
29,301 1. Intangible assets (note 1) 34,406 34,778
29,301 3. Total intangible assets 34,406 34,778
2. Tangible fixed assets (note 2)
808,293 3. a. non-compensated reversionary assets in service 850,027 862,703
385,572 3. b. non-compensated reversionary assets under
construction
565,055 432,206
33,560 c. buildings, plant, machinery and other goods 22,223 22,370
6,837 d. assets held on finance leases 5 19
1,234,262 3. Total tangible fixed assets 1,437,310 1,317,298
3. Financial fixed assets (note 3)
354,995
a. shareholdings valued by the Shareholders’ Equity
method 399,605
391,950
37,374 3. b. shareholdings not consolidated 12,235 12,672
12,367 3. c. long-term credits 11,002 9,957
161,232 3. d. other 157,977 163,481
565,968 3. Total financial fixed assets 580,819 578,060
3,861 4. Deferred tax assets (note 4) 3,255 2,354
1,833,392 Total fixed assets 2,055,790 1,932,490
Current assets
16,760 5. Stocks (note 5) 3,149 4,475
61,641 6. Trade receivables (note 6) 44,189 56,873
9,893 7. Current tax assets (note 7) 20,461 18,472
139,955 8. Other receivables (note 8) 150,742 132,760
9. Assets held for trading
17,636 10. Assets available for sale (note 9) 9,752 11,770
11. Financial receivables
245,885 3. Total current assets 228,293 224,350
77,509
12. Cash at bank and in hand and cash equivalents (note
10) 59,430 81,693
323,394 Total current assets 287,723 306,043
2,156,786 Total assets 2,343,513 2,238,533
Shareholders’ Equity and liabilities
Shareholders’ Equity (Capital and Reserves) (note
11)
1. Shareholders’ Equity, Group’s share
43,948 1. a. share capital 43,996 43,996
808,790 2. b. reserves and profits brought forward 873,188 837,092
852,738 3. Total 917,184 881,088
34,258 2. Capital and reserves, minority interests 36,027 36,763
886,996 Total Shareholders’ Equity 953,211 917,851
Liabilities
Long-term liabilities
90,037
3. Provision for risks and charges and Superannuation
Benefit (TRF) (note 12) 93,352
86,460
34 4. Trade payables (note 13) 15 45

31
269,082 5. Other debts (note 14) 257,137 257,139
601,131 6. Bank debt (note 15) 594,370 688,681
2,366 7. Other financial debts - -
9,762 8. Deferred tax liabilities (note 16) 23,927 23,551
972,412 Total long-term liabilities 968,801 1,055,876
Current liabilities
79,082 9. Trade payables (note 17) 82,909 80,960
102,337 10. Other debts (note 18) 63,449 74,823
104,000 11. Bank debt (note 19) 264,158 100,077
1,903 12. Other financial debts (note 20) 3 3
10,056 13. Current tax liabilities (note 21) 10,982 8,943
297,378 Total current liabilities 421,501 264,806
1,269,790 Total liabilities 1,390,302 1,320,682
2,156,786 Total Shareholders’ Equity and liabilities 2,343,513 2,238,533
32
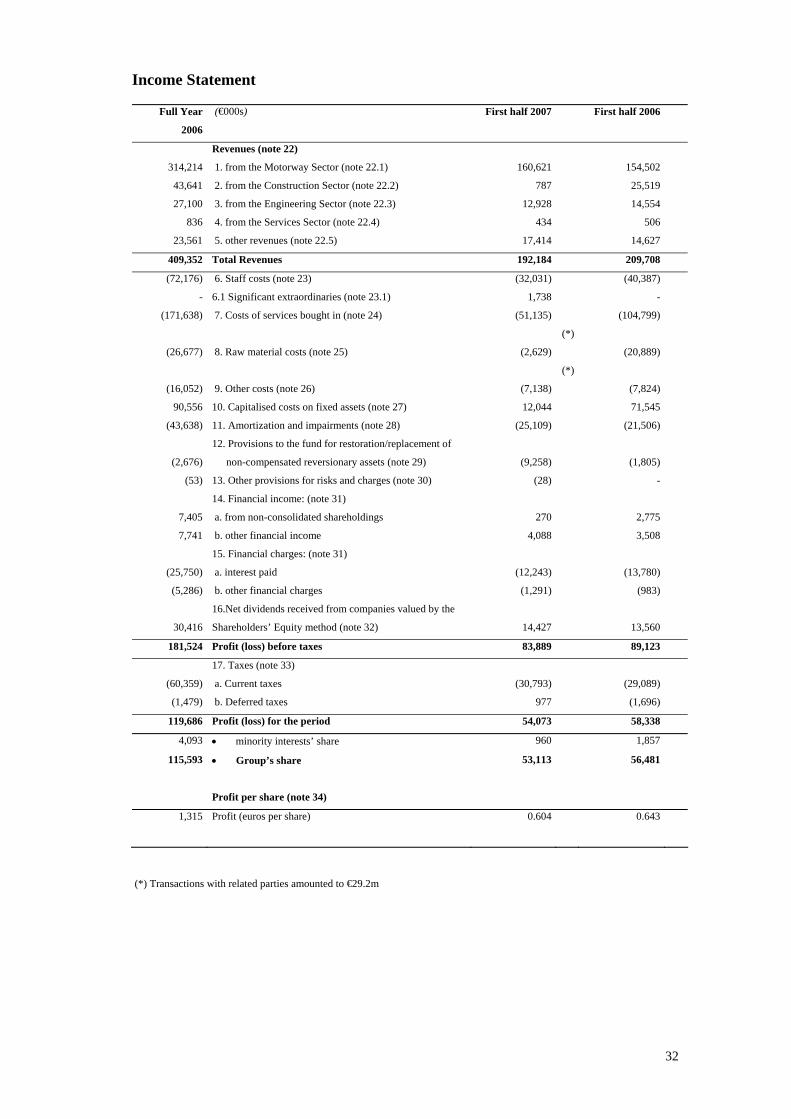
Income Statement
Full Year
2006
(€000s) First half 2007 First half 2006
Revenues (note 22)
314,214 1. from the Motorway Sector (note 22.1) 160,621 154,502
43,641 2. from the Construction Sector (note 22.2) 787 25,519
27,100 3. from the Engineering Sector (note 22.3) 12,928 14,554
836 4. from the Services Sector (note 22.4) 434 506
23,561 5. other revenues (note 22.5) 17,414 14,627
409,352 Total Revenues 192,184 209,708
(72,176) 6. Staff costs (note 23) (32,031) (40,387)
- 6.1 Significant extraordinaries (note 23.1) 1,738 -
(171,638) 7. Costs of services bought in (note 24) (51,135)
(*)
(104,799)
(26,677) 8. Raw material costs (note 25) (2,629)
(*)
(20,889)
(16,052) 9. Other costs (note 26) (7,138) (7,824)
90,556 10. Capitalised costs on fixed assets (note 27) 12,044 71,545
(43,638) 11. Amortization and impairments (note 28) (25,109) (21,506)
(2,676)
12. Provisions to the fund for restoration/replacement of
non-compensated reversionary assets (note 29) (9,258)
(1,805)
(53) 13. Other provisions for risks and charges (note 30) (28) -
14. Financial income: (note 31)
7,405 a. from non-consolidated shareholdings 270 2,775
7,741 b. other financial income 4,088 3,508
15. Financial charges: (note 31)
(25,750) a. interest paid (12,243) (13,780)
(5,286) b. other financial charges (1,291) (983)
30,416
16.Net dividends received from companies valued by the
Shareholders’ Equity method (note 32) 14,427
13,560
181,524 Profit (loss) before taxes 83,889 89,123
17. Taxes (note 33)
(60,359) a. Current taxes (30,793) (29,089)
(1,479) b. Deferred taxes 977 (1,696)
119,686 Profit (loss) for the period 54,073 58,338
4,093 • minority interests’ share 960 1,857
115,593 • Group’s share 53,113 56,481
Profit per share (note 34)
1,315 Profit (euros per share) 0.604 0.643
(*) Transactions with related parties amounted to €29.2m

33
Cash flow Statement
Full Year 2006 (€000s) First half 2007 First half 2006
93,747 Opening cash at bank and in hand and cash equivalent 81,693 93,747
(637) Change in scope of consolidation (*)
93,110 Opening cash at bank and in hand and cash equivalent,
“adjusted” (a)
81,693 93,747
Operational activities:
119,686 Profit (loss) 54,073 58,338
Adjustments
43,638 Amortization 25,109 21,506
2,676
Net provision (drawings), fund for restoration/replacement of non-
compensated reversionary assets
9,258 1,805
1,843 Net provision (drawings), superannuation fund (TFR) (630) 1,916
53 Provision for risks 28 -
(30,416) Dividends from companies valued by the Shareholders’ Equity
method
(14,427) (4,315)
900 Impairments (revaluations) of financial assets 381 -
(1,347) Net change in deferred tax assets and liabilities (1,074) 1,665
(41,645) Change in net circulating capital (note 35.1) (7,967) (23,477)
(4,519) Other changes generated by operational activities (note 35.2) (1,764) (3,591)
91,869 Liquidity generated (absorbed) by operational activities (b) 62,987 53,847
Investment activities:
(3,159) Investments in buildings, plant, machinery and other goods (1,083) (4,552)
(233,021) Investments in reversionary assets (146,722) (106,123)
(7,988) Investments in intangible assets (2,536) (162)
(5,776) Investments in financial fixed assets (23) (11,804)
144 Net divestment: buildings, plant, machinery and other goods 172 772
5 Net divestment: reversionary assets - 1
60 Net divestment: intangible assets 10 -
28,736 Net divestment: financial fixed assets 7,549 13,198
(220,999) Liquidity generated (absorbed) by investment activities (c) (142,633) (108,670)
Financial assets:
167,351 Net change in medium/long-term financial debts 69,768 61,565
10,381 Changes in current financial assets 7,127 6,505
(14,747) Changes in other financial debt (including the Central Guarantee
Fund)
- -
- Changes in Shareholders’ Equity, minority interests (371) -
1,704- Changes in Shareholders’ Equity, Group’s share - sale of treasury
shares
- 59
(43,971) Dividends (including interim dividends) distributed by the Holding
Company
(17,600) (26,371)
(3,005) Dividends (including interim dividends) distributed to minority
interests by fully-consolidated subsidiaries
(1,541) (3,173)
117,713 Liquidity generated (absorbed) by financial activities (d) 57,383 38,585
81,693 Closing cash at bank and in hand and cash equivalent
(a+b+c+d)
59,430 77,509

34
(*) removal of ITINERA SpA and its subsidiaries from the scope of consolidation (from 1 July 2006)
Supplementary information:
65,181 Taxes paid during this financial period 25,278 41,160
29,034 Financial charges paid during this financial period 18,534 11,429
· For the Group’s Net Cash Flow, please refer to the relevant paragraph of the Report.

35
Schedule of Changes in Shareholders’ Equity
€000s Share capital Reserves and profits
brought forward
Shareholders’ Equity,
Group’s share
Capital and reserves, minority interests
Total Shareholders’
Equity
31 December 2005 43,946 779,507 823,453 35,574 859,027
2005 final dividend distribution
(€0.30 per share)
(26,371) (26,371) (2,945) (29,316)
2006 interim dividend distribution
(€0.20 per share)
(17,600) (17,600) (60) (17,660)
Adjustment of financial assets to Fair
Value
606 606 101 707
Sale of treasury shares 50 1,655 1,705 - 1,705
Net provisions (drawings), fund for
exchange gains and losses
(900) (900) - (900)
Other changes (*) (15,398) (15,398) - (15,398)
Profit for the period 115,593 115,593 4,093 119,686
31 December 2006 43,996 837,092 881,088 36,763 917,851
2006 final dividend distribution
(€0.20 per share)
(17,600) (17,600) (1,541) (19,141)
Net provisions (drawings), fund for
exchange gains and losses
(254) (254) - (254)
Adjustment of financial assets to Fair
Value
837 837 216 1,053
Other changes (buying shares from
minority interests)
- - (371) (371)
Profit for the period 53,113 53,113 960 54,073
30 June 2007 43,996 873,188 917,184 36,027 953,211
The composition of the item “Reserves and profits carried forward” is as follows:
€000s Issue premium
reserve
Revaluation
reserves
Statutory reserves
Fair Valuation
reserves
Reserve for
exchange gains and
losses
Profits (losses)
brought forward
Profit (loss) for the period
Total
31 December 2005 25,861 9,325 10,538 29,966 (26) 476,069 227,774 779,507
Allocation of profit(loss) for 2005 201,403 (201,403) -
2005 final dividend distribution (€0.30 per share) (26,370) (26,370)
2006 interim dividend distribution (€0.20 per
share)
(17,600) (17,600)
Adjustment of financial assets to Fair Value 606 606
Sale of treasury shares 1,654 1,654
Adjustment reserve exchange gains and losses (900) (900)
Other changes (15,398) (15,398)
Profit for the period 115,593 115,593
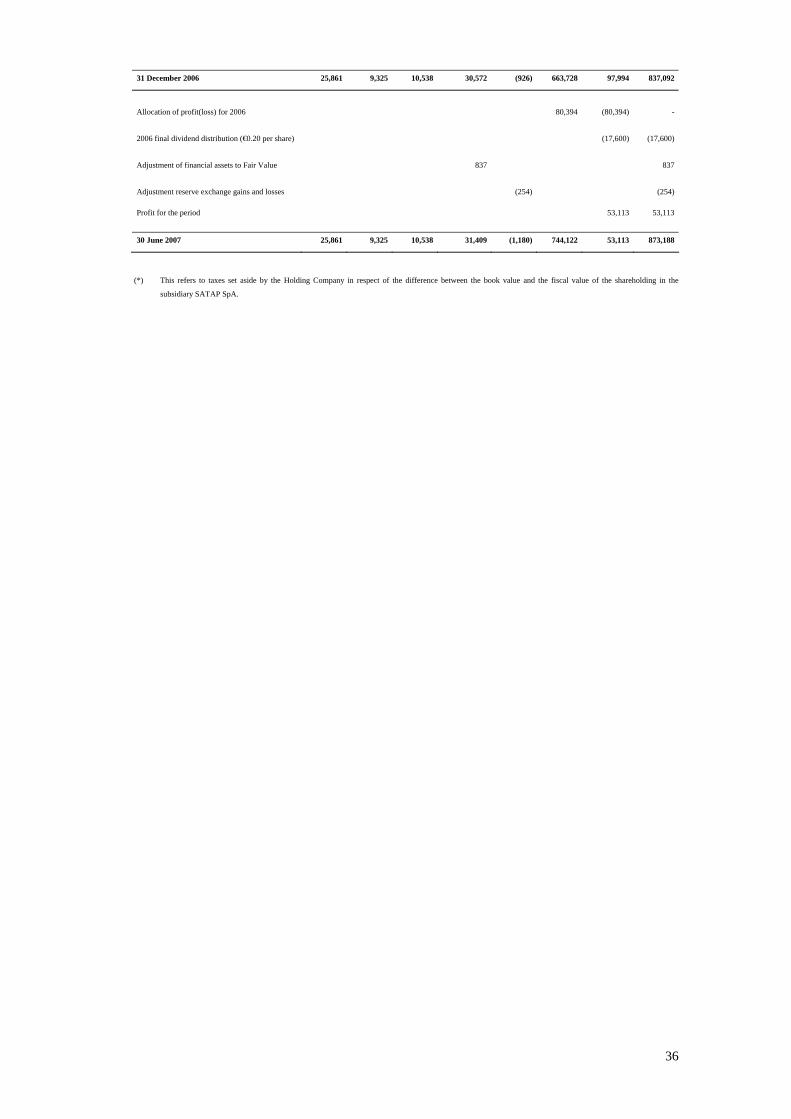
36
31 December 2006 25,861 9,325 10,538 30,572 (926) 663,728 97,994 837,092
Allocation of profit(loss) for 2006 80,394 (80,394) -
2006 final dividend distribution (€0.20 per share) (17,600) (17,600)
Adjustment of financial assets to Fair Value 837 837
Adjustment reserve exchange gains and losses (254) (254)
Profit for the period 53,113 53,113
30 June 2007 25,861 9,325 10,538 31,409 (1,180) 744,122 53,113 873,188
(*) This refers to taxes set aside by the Holding Company in respect of the difference between the book value and the fiscal value of the shareholding in the
subsidiary SATAP SpA.

37
Schedule of reconciliation between ASTM SpA Shareholders’ Equity and Profit for the Period
and the corresponding figures for the ASTM Group
(€m) Shareholders’ Equity Profit
ASTM SpA on 30 June 2007 945.3 15.1
Shareholders’ Equity and profits of consolidated companies 560.9 49.4
Book values of consolidated companies (589.0)
Reclassification of dividends received from controlled subsidiaries and
minority holdings
- (11.4)
ASTM Group on 30 June 2007 917.2 53.1
(€m) Shareholders’ Equity Profit
ASTM SpA on 31 December 2006 947.9 421.9
Shareholders’ Equity and profits of consolidated companies 522.2 118.0
Book values of consolidated companies (589.0) -
Reclassification of dividends received from controlled subsidiaries and
minority holdings
- (424.3)
ASTM Group on 31 December 2006 881.1 115.6
38
Principles of consolidation
Valuation criteria
Notes to the Accounts
39
Principles of consolidation and valuation criteria
Principles of consolidation
In addition to the Half-year Accounts of the holding company Autostrada Torino-Milano SpA, the
Consolidated Accounts of the ASTM Group cover the accounts of companies subject to its control
(such accounts having first been appropriately adjusted/reclassified to make them compatible with the
rules for drafting Financial Statements enshrined in the IAS/IFRS International Accounting
Standards).
“Control” applies where the Group directly or indirectly owns over 50% of the voting stock, or has the
power to determine the company’s financial and operating policies. Controlled subsidiaries’ accounts
are included in the Consolidated Accounts from the date when the parent company takes control until
the date when such control ceases.
Subsidiaries under joint control on the basis of agreements with others have been consolidated using
the “proportional method”.
Companies over whose financial and operating policies the parent company exercises “considerable
influence” have been consolidated and valued with the Shareholders’ Equity method.
It should also be pointed out that the controlled subsidiaries INPAR SpA (in liquidation) and
Tangenziale Est Srl have been valued with the Shareholders’ Equity method in view of their small
size. Full consolidation of these companies would not have had any significant effect on the
Consolidated Accounts of the Group.
The section below entitled “Scope of consolidation” gives details of all consolidated shareholdings.
Consolidation procedures
Full consolidation
Briefly, consolidation with the “full” (or “line by line”) method consists of including all the assets and
liabilities, costs and revenues of the companies consolidated, regardless of the stake held by non-
Group shareholders (the “minority interests”), but then making separate provision for those interests
under a special heading within the Capital and Reserves for their share, known as “Capital and
reserves, minority interests”, and likewise providing in the Income Statement for their share of the
profits.
The main adjustments that have been made on consolidation are as follows:
1. Shareholdings in firms included in the scope of consolidation have been eliminated, and the
corresponding fractions of their Shareholders’ Equity removed, while the individual items of their
Balance Sheet assets and liabilities have been incorporated, line by line, at their value on the date
when control was first acquired; any residual difference, if positive, has been entered under Assets
as “Goodwill” (provided the conditions for this are met); if negative the difference is charged to
the Income Statement.
Any amount paid in excess of the corresponding fraction of Shareholders’ Equity, arising from
acquisition of further shares in controlled subsidiaries, is allocated to Goodwill.
2. Sums owed by one firm within the consolidation to another, and also revenues and charges
40
appearing in their accounts for transactions with each other, are eliminated, as are any non-trivial
gains and losses arising from any operation between such firms and relating Balance Sheet or
Income Statement items.
In the case of capitalised work done in-house on non-compensated reversionary assets, margins
generated within the Group have not been eliminated because wherever such margins have been of
any importance the contracts on which they were earned have been awarded at arm’s length and at
market prices following public tender.
3. Dividends received from consolidated companies have been eliminated.
Consolidation under the proportional method
Consolidation in accordance with the proportional method essentially consists of incorporating into
each item of the Consolidated Accounts the proportional amount of the corresponding asset, liability,
revenue or cost heading in the accounts of the subsidiary.
In the case of proportional consolidation only that portion of the subsidiary’s value which belongs to
the Group is included, not its entire value; but on the other hand the only portion of the Group’s
Shareholders’ Equity eliminated is that which corresponds to the value of the shareholdings: there are
no separate entries for “Shareholders’ Equity, Minority Interests” or (in the Income Statement)
“Minority interests' share of profit”: those amounts have been automatically excluded.
Gains and losses within the Group are moreover eliminated proportionally, and all other consolidation
adjustments are made on a similar basis.
Valuation of shareholdings under the Shareholders’ Equity method
The shareholding is initially entered at cost, and the book value is increased or diminished as a
function of the holding company’s share of all profits and/or losses made by the subsidiary after the
date of acquisition. Any amounts of goodwill included in the shareholding’s value are subjected to an
“impairment test”. The holding company’s proportion of the subsidiary’s profit or loss for each period
is included in the holding company’s Income Statement for that period; but any excess of the
subsidiary’s losses beyond the shareholding’s book value is not recognized, since the Group is not
liable to account for it. The book value of shareholdings in these subsidiaries falls when the shares go
“ex-dividend”.
Valuation criteria
Intangible assets
Goodwill
This intangible asset is not amortized, but instead the prospect of recovering the book value is checked
in an “impairment test” at least once a year, or on any occurrence giving grounds to suspect a loss of
value. This test applies to every single “cash generating unit” of any significance to which an element
of goodwill has been assigned and from which the company management looks for a return.
Impairments, once booked, are not reversed.
Other intangible assets
41
Other intangible assets are entered at cost and systematically amortized on the basis of the period over
which the asset is expected to be used by the firm.
Costs of development activities are capitalised if intended to produce products (or processes) that the
Group can put to operational or commercial use, and where the Group has sufficient resources to
complete the activity in question itself. These intangible assets are amortized over a period of not
more than five years.
Whenever an event occurs which gives grounds for presuming a reduction in an intangible asset’s
value, the difference between its book value and its “recoverable value” is charged to the Income
Statement.
Costs of research activities are shown in the Income Statement for the period in which the expense
was incurred.
Tangible fixed assets
These goods are entered at the cost of purchase or production, including directly-attributable ancillary
costs and any financial charges which must be paid if the asset is to be available for use. The book
value of some tangible assets include, as provided for in IFRS 1, the revaluations made on the basis of
specific provisions of the law prior to the changeover to IFRS, on the grounds that these revaluations
can, taken all together, be held to be part of the asset’s fair value.
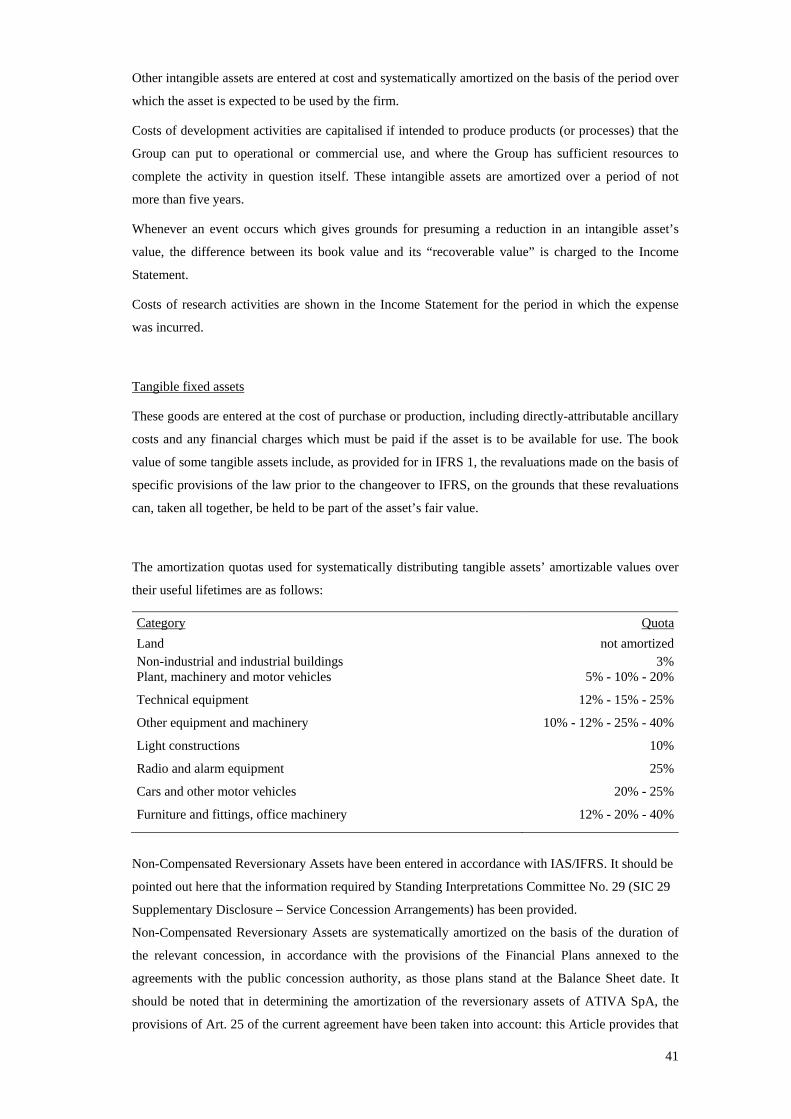
The amortization quotas used for systematically distributing tangible assets’ amortizable values over
their useful lifetimes are as follows:
Category QuotaLand not amortizedNon-industrial and industrial buildings 3%Plant, machinery and motor vehicles 5% - 10% - 20%
Technical equipment 12% - 15% - 25%
Other equipment and machinery 10% - 12% - 25% - 40%
Light constructions 10%
Radio and alarm equipment 25%
Cars and other motor vehicles 20% - 25%
Furniture and fittings, office machinery 12% - 20% - 40%
Non-Compensated Reversionary Assets have been entered in accordance with IAS/IFRS. It should be
pointed out here that the information required by Standing Interpretations Committee No. 29 (SIC 29
Supplementary Disclosure – Service Concession Arrangements) has been provided.
Non-Compensated Reversionary Assets are systematically amortized on the basis of the duration of
the relevant concession, in accordance with the provisions of the Financial Plans annexed to the
agreements with the public concession authority, as those plans stand at the Balance Sheet date. It
should be noted that in determining the amortization of the reversionary assets of ATIVA SpA, the
provisions of Art. 25 of the current agreement have been taken into account: this Article provides that
42
in the case of “new works” (as identified in its subpara. 2) a retiring concession operator is entitled to
compensation from an incoming one for the portion of such works that has been carried out and not
yet amortized at the end of the concession (known as the “ terminal value”).
In the case of non-compensated reversionary assets, the accumulated amortization and the provision
for restoration or replacement costs together ensure adequate cover for the following charges:
• uncompensated restoration to the State upon expiry of the concession of all reversionary assets
whose useful lifetime is longer than that concession’s duration;
• restoration and replacement of all components of reversionary assets liable to wear and tear;
• recovery of sums invested, including investment in new works provided for in the Financial
Plans.
Whenever an event occurs which gives grounds for suspecting that a tangible asset has fallen in value,
the difference between its book value and its recoverable value is charged to the Income Statement.
The costs involved in the ordinary maintenance of tangible assets are shown in the Income Statement
for the period in which they are incurred.
Leased assets
Finance leases
Assets acquired through a finance lease are entered as Balance Sheet assets at their fair value or, if
lower, the present value of any remaining lease instalments required for their purchase discounted at
the rate of interest implied in the lease; as a counter-entry the amount of the debt to the lessor is
included among the liabilities. Any direct costs incurred on the lease contract (e.g. costs of negotiating
and completing the finance lease transaction) are included in the asset’s initial book value. Leased
assets are systematically amortized at the same rate as that used for goods of the same type. If there is
no reasonable certainty that the asset will be purchased at the end of the lease then it is fully amortized
over the duration of the lease or its useful lifetime, whichever is shorter.
Lease instalments are divided into capital repaid and financial charges recognized in the Income
Statement for the period in which they accrue.
Operating leases
Instalments paid on operating leases are entered in the Income Statement as equal amounts over the
whole duration of the underlying lease.
Stocks
Raw materials, parts, consumables, semi-finished goods, finished products and goods
These are valued at the lower of their cost – determined by the Mean Weighted Cost method – and
their Net Realizable Value.

43
Work in progress on orders received
These are valued on the basis of the payments agreed, in accordance with the state of progress of their
construction or manufacture on the Balance Sheet date under the Percentage of Completion method.
Advances paid by commissioning parties are subtracted from the value of stocks or work in progress,
up to the limit of the fees actually accrued; any excess is entered as a liability. Known losses to
Completion, if any, are charged to the Income Statement.
Claims for additional fees arising from alterations to contractually-agreed works, and other claims
arising, for instance, from costs increased by the commissioning party’s actions, are entered in the
Financial Statement as part of total fees to the extent that they are likely to be admitted.
Financial assets held for trading
These are entered at fair value on the transaction date; gains or losses arising from any subsequent
changes in the fair value are entered in the Income Statement. Where the fair value cannot be reliably
determined, the financial assets is valued at cost, adjusted on any impairment.
The original value is restored in later financial periods if and when the reason for the impairment
ceases to apply.
Financial assets held to maturity
These are booked, when acquired, on the basis of the cost incurred (inclusive of purchasing expenses).
They are subsequently valued at amortized cost using the “real interest” criterion, any impairment
being charged to the Income Statement.
The original value is restored in later financial periods if and when the reason for the impairment
ceases to apply.
Loans and receivables
These are initially recognized at their fair value (inclusive of costs of purchase or issue) on the
transaction date. They are subsequently valued at amortized cost using the “real interest” criterion, any
impairment being charged to the Income Statement.
The original value is restored in later financial periods if and when the reason for the impairment
ceases to apply.
Financial assets available for sale
These are entered at fair value on the transaction date; gains or losses arising from any subsequent
changes in their fair value are entered with a corresponding counter-entry in Shareholders’ Equity
until the asset is disposed of and the real gain booked accordingly to the Income Statement. Where the
fair value cannot be reliably determined, financial assets are valued at cost, adjusted where there are
grounds for an impairment.

44
The original value is restored in later financial periods if and when the reason for the impairment
ceases to apply.
Cash at bank and in hand and cash equivalents
Cash at bank and in hand comprises ready money including cheques, and bank account credit balances
payable on demand. “Cash equivalent” consists of short term financial assets (three months or less
remaining to maturity on the date of purchase) that are readily convertible into cash and carry a
negligible risk of any change in their value.
These items are entered at their fair value; gains or losses arising from any changes in the fair value
are entered in the Income Statement.
Loans and other debts
These are stated, at the time the obligation is incurred, net of any attributable expenses. They are
subsequently valued at amortized cost using the “real interest” criterion.
Sums due to ANAS and the Central Guarantee Fund
These debts refer to action taken by these organizations in the past on behalf of the concession
operators SATAP SpA, SAV SpA and ATIVA SpA for the settlement of certain loan repayments and
trade payables. The Financial Plans annexed to the various concession agreements provided, in order
to preserve the economic and financial balance of those agreements, for these debts to be repaid,
interest-free, over the lifetime of the concessions.
The present value of these debts has accordingly been determined on the basis of a specific discount
rate for each concession operator, determined, as IAS 39 requires, by reference to other financial
instruments with substantially the same terms and characteristics. The difference between the original
amount of the debt and its present value has been entered in Liabilities under “Deferred Income”.
The cost determined by the discounting process has been booked as a financial charge in the Income
Statement; at the same time the amount entered last year under “Deferred Income” now appears in the
Income Statement under “Other Revenues”.
Provision for risks and charges
Provision for risks and charges concerns costs and charges whose nature is known and whose
existence is certain or likely, but whose amount or date of payment is uncertain as of the closing date
of the period to which the Financial Statement refers. Such provisions are made when: (i) it is likely
that a present obligation arising from a past event exists or is implied in law; and (ii) it is likely that its
performance will have a cost; and (iii) its total cost can be estimated reliably.
The provisions made represent the best estimate of the total amount that will be needed to discharge
the obligation or transfer it to another party, as of the closing date of the period to which the Financial

45
Statement refers. Where the financial effect of the timing is significant and the date(s) on which
payment will be required can be reliably estimated, the provisions are discounted appropriately.
Fund for restoration or replacement of non-compensated reversionary assets
Provision for restoration or replacement of non-compensated reversionary assets is made in
accordance with the contractual obligations under the Financial Plans annexed to concession
agreements currently in force; they cover the amounts needed, as of the reporting date, to ensure that
the motorway fabric is maintained in the next financial period and thereafter as necessary to ensure its
proper functioning, safety and security.
The Notes to the Accounts give further details of any potential liabilities represented by: (i) possible
but unlikely obligations arising from past events, which would only become real liabilities on the
occurrence or non-occurrence of one or more future events which are at present uncertain and not
entirely under the control of Group companies; (ii) present obligations arising from past events, whose
cost to the firm either cannot be reliably estimated or which are unlikely to involve a cost.
Staff benefits: Superannuation Benefit (TRF)
The liability relating to the Superannuation Benefit Fund (a “defined-benefits” scheme) is determined
on the basis of actuarial assumptions and entered under the accruals principle in accordance with the
period of employment needed to obtain the benefits; the liabilities are valued with the help of an
independent actuary.
Actuarial gains and losses on these schemes, arising from changes in the actuarial assumptions used or
in the scheme rules, are shown in the Income Statement.
Treasury shares
Treasury shares are entered, at purchase cost, as a reduction of Shareholders’ Equity. The proceeds
arising from their disposal have also been entered as an adjustment to Shareholders’ Equity, with no
entry in the Income Statement.
Revenues
Revenues are recognized – on the basis of the accruals principle – as soon as it is probable that the
Group will actually gain the future economic benefits and their value can be reliably determined;
details are given below.
Toll receipts
These are entered on the basis of the corresponding journeys and are shown net of the State royalties

46
provided for by Art. 15 of Law No. 531 of 12 August 1982 as amended by Art. 11(ii) of Law No. 407
of 29 December 1990.
Lease income and royalties
Lease income and royalties are valued on the basis of the rents and royalties payable under the various
leases and contracts signed.
Revenues from sales
Revenues from the sale of products are entered when the risks are transferred to the purchaser, which
is generally the time of dispatch/delivery.
Revenues for services rendered
Revenues for services rendered are entered on the basis of the accrued amount of fees, &c.
Revenues for design and construction work
Revenues accrued in the period relating to work in progress on orders received are entered on the
basis of the progress payments agreed in accordance with the Percentage of Completion method.
Dividends
Dividends paid by companies outside the scope of consolidation are booked as soon as entitlement to
the payment is established on the basis of the dividend distribution resolution taken by the company’s
AGM.
Any interim dividend is booked as soon as the company’s Board of Directors has decided on its
distribution.
Subsidies
Subsidies are included in the accounts once it is reasonably certain that they will be received and that
all their conditions will be met. Capital subsidies are entered in the Balance Sheet as an adjustment to
the book values of the assets to which they refer. Operating subsidies are entered as revenue,
distributed systematically over the various financial periods in which they mitigate the corresponding
cost items.
Financial charges
Financial charges are entered as costs in the period during which they are incurred, with the exception
of those which are directly due to the construction of non-compensated reversionary or other assets, in
which case such costs are capitalised as an integral part of the cost of production. The start point for
the capitalisation of these financial costs is the start of the activities involved in preparing the asset for
use, and its end point is when these activities are essentially completed.
Income taxes
Current and deferred taxes are entered in the Income Statement if not related to transactions directly
recognized or to be recognized in the Shareholders’ Equity.
47
Corporate income taxes are entered on the basis of an estimate of the taxable income for the period, in
accordance with the regulations in force at the time.
“Deferred tax liabilities” and “Credits for taxes paid in advance” are calculated – in accordance with
IAS 12 – on the temporary differences between the fiscal value of an asset or liability and its Balance
Sheet value, where it is probable that the difference will reverse in the foreseeable future. The amount
of the “deferred tax liabilities”, or of the “Credits for taxes paid in advance” is determined on the basis
of the tax rates which – according to the tax regulations in force on the accounting entry reference date
– will apply at the time when the tax asset will be realised or the tax liability will be due.
Deferred tax assets are only recognized if likely to be recovered.
Credits for taxes paid in advance are offset against liabilities for deferred taxes where this is allowed
by law.
The tax effects arising from adjustments made to consolidated firms’ Accounts when applying the
Group’s standard valuation criteria have also been taken into account.
Derivatives
Derivatives (both assets and liabilities) are recognized at fair value.
They are classified as hedging instruments when the relationship between the derivative and the
hedged item is formally documented and the effectiveness of hedging (checked periodically) is high.
Hedging derivatives whose purpose is to provide a “Fair Value hedge”, for instance against changes in
the fair value of fixed-rate assets/liabilities, are carried at fair value and their effects entered in the
Income Statement; the values of the hedged instruments are accordingly adjusted to reflect changes in
the fair value associated with the risk covered. In the case of derivatives used as “cash flow hedges”,
for instance against changes in cash yields from variable-rate assets/liabilities, changes in the fair
value of these derivatives are initially recognized in Shareholders’ Equity and subsequently charged to
the Income Statement in accordance with the hedge’s income effects. Changes in the fair value of
derivatives which do not qualify as hedges are entered in the Income Statement.
Estimates and valuations
The drafting of the present Consolidated Interim Report & Accounts and the Notes to the Accounts
has required the making of estimates and assumptions affecting the stated values of the assets and
liabilities and the details of potential assets and liabilities as of the reporting date. The definitive
figures may be different from these estimates. Items for which estimates are used include the Fair
Valuation of the assets available for sale, and also the figures for amortization, asset impairments, and
provisions for risks. These estimates and assumptions are periodically revised and the effects of any
changes entered in the Income Statement.
Certain valuation processes, especially the more complicated ones such as the determination of any
impairments in losses of value of fixed assets, are generally carried out in full only on the occasion of
drawing up the full-year Financial Statement, when all the necessary information is available.
Nevertheless, where there is reason to suspect potential losses of value an impairment test is carried
out, and any such loss of value reflected in the individual book values.

48
So far as the valuation of the motorway concession operators is concerned, the impairment tests are
based on the Financial Plans approved by the commissioning authority or submitted for its approval.
***
The valuation criteria described above have been applied in a consistent and coherent manner in the drafting of
the present Consolidated Interim Report & Accounts.
As provided for in Art. 5(ii) of Legislative Order No. 38 of 28 February 2005 and in accordance with para. 46
of IAS 1, it should be explained that the present Consolidated Interim Report has been drawn up in euros, and
the figures in tables are expressed in thousands of euros. For the ASTM Group the euro is the “operating
currency” and also the reporting currency.
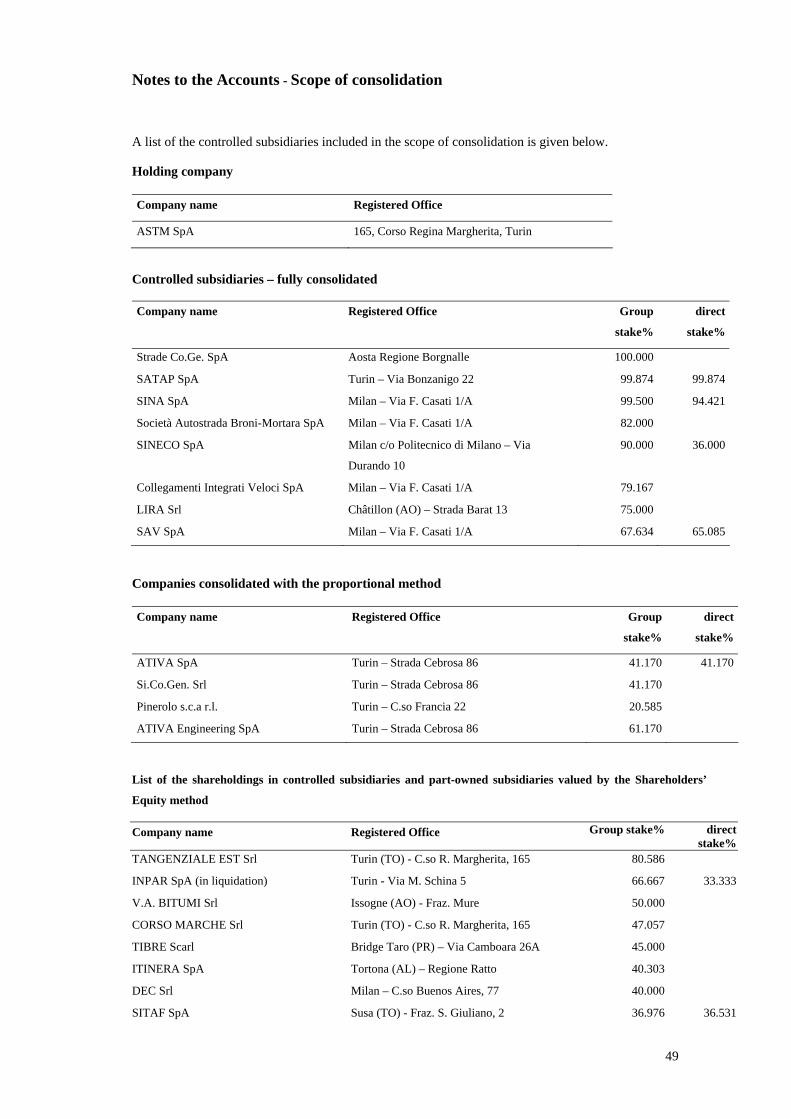
49
Notes to the Accounts - Scope of consolidation
A list of the controlled subsidiaries included in the scope of consolidation is given below.
Holding company
Company name Registered Office
ASTM SpA 165, Corso Regina Margherita, Turin
Controlled subsidiaries – fully consolidated
Company name Registered Office Group
stake%
direct
stake%
Strade Co.Ge. SpA Aosta Regione Borgnalle 100.000
SATAP SpA Turin – Via Bonzanigo 22 99.874 99.874
SINA SpA Milan – Via F. Casati 1/A 99.500 94.421
Società Autostrada Broni-Mortara SpA Milan – Via F. Casati 1/A 82.000
SINECO SpA Milan c/o Politecnico di Milano – Via
Durando 10
90.000 36.000
Collegamenti Integrati Veloci SpA Milan – Via F. Casati 1/A 79.167
LIRA Srl Châtillon (AO) – Strada Barat 13 75.000
SAV SpA Milan – Via F. Casati 1/A 67.634 65.085
Companies consolidated with the proportional method
Company name Registered Office Group
stake%
direct
stake%
ATIVA SpA Turin – Strada Cebrosa 86 41.170 41.170
Si.Co.Gen. Srl Turin – Strada Cebrosa 86 41.170
Pinerolo s.c.a r.l. Turin – C.so Francia 22 20.585
ATIVA Engineering SpA Turin – Strada Cebrosa 86 61.170
List of the shareholdings in controlled subsidiaries and part-owned subsidiaries valued by the Shareholders’
Equity method
Company name Registered Office Group stake% direct stake%
TANGENZIALE EST Srl Turin (TO) - C.so R. Margherita, 165 80.586
INPAR SpA (in liquidation) Turin - Via M. Schina 5 66.667 33.333
V.A. BITUMI Srl Issogne (AO) - Fraz. Mure 50.000
CORSO MARCHE Srl Turin (TO) - C.so R. Margherita, 165 47.057
TIBRE Scarl Bridge Taro (PR) – Via Camboara 26A 45.000
ITINERA SpA Tortona (AL) – Regione Ratto 40.303
DEC Srl Milan – C.so Buenos Aires, 77 40.000
SITAF SpA Susa (TO) - Fraz. S. Giuliano, 2 36.976 36.531
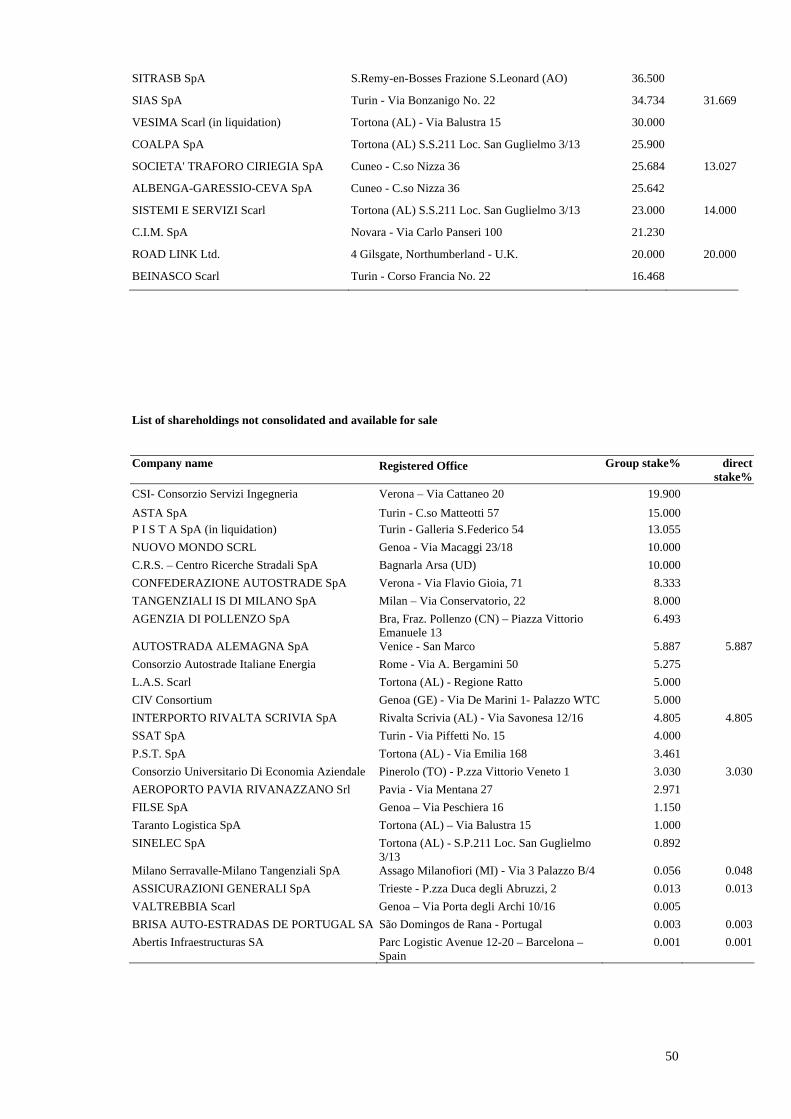
50
SITRASB SpA S.Remy-en-Bosses Frazione S.Leonard (AO) 36.500
SIAS SpA Turin - Via Bonzanigo No. 22 34.734 31.669
VESIMA Scarl (in liquidation) Tortona (AL) - Via Balustra 15 30.000
COALPA SpA Tortona (AL) S.S.211 Loc. San Guglielmo 3/13 25.900
SOCIETA' TRAFORO CIRIEGIA SpA Cuneo - C.so Nizza 36 25.684 13.027
ALBENGA-GARESSIO-CEVA SpA Cuneo - C.so Nizza 36 25.642
SISTEMI E SERVIZI Scarl Tortona (AL) S.S.211 Loc. San Guglielmo 3/13 23.000 14.000
C.I.M. SpA Novara - Via Carlo Panseri 100 21.230
ROAD LINK Ltd. 4 Gilsgate, Northumberland - U.K. 20.000 20.000
BEINASCO Scarl Turin - Corso Francia No. 22 16.468
List of shareholdings not consolidated and available for sale
Company name Registered Office Group stake% direct
stake%CSI- Consorzio Servizi Ingegneria Verona – Via Cattaneo 20 19.900ASTA SpA Turin - C.so Matteotti 57 15.000P I S T A SpA (in liquidation) Turin - Galleria S.Federico 54 13.055NUOVO MONDO SCRL Genoa - Via Macaggi 23/18 10.000C.R.S. – Centro Ricerche Stradali SpA Bagnarla Arsa (UD) 10.000CONFEDERAZIONE AUTOSTRADE SpA Verona - Via Flavio Gioia, 71 8.333TANGENZIALI IS DI MILANO SpA Milan – Via Conservatorio, 22 8.000AGENZIA DI POLLENZO SpA Bra, Fraz. Pollenzo (CN) – Piazza Vittorio
Emanuele 13 6.493
AUTOSTRADA ALEMAGNA SpA Venice - San Marco 5.887 5.887Consorzio Autostrade Italiane Energia Rome - Via A. Bergamini 50 5.275L.A.S. Scarl Tortona (AL) - Regione Ratto 5.000CIV Consortium Genoa (GE) - Via De Marini 1- Palazzo WTC 5.000 INTERPORTO RIVALTA SCRIVIA SpA Rivalta Scrivia (AL) - Via Savonesa 12/16 4.805 4.805SSAT SpA Turin - Via Piffetti No. 15 4.000P.S.T. SpA Tortona (AL) - Via Emilia 168 3.461Consorzio Universitario Di Economia Aziendale Pinerolo (TO) - P.zza Vittorio Veneto 1 3.030 3.030AEROPORTO PAVIA RIVANAZZANO Srl Pavia - Via Mentana 27 2.971FILSE SpA Genoa – Via Peschiera 16 1.150Taranto Logistica SpA Tortona (AL) – Via Balustra 15 1.000SINELEC SpA Tortona (AL) - S.P.211 Loc. San Guglielmo
3/13 0.892
Milano Serravalle-Milano Tangenziali SpA Assago Milanofiori (MI) - Via 3 Palazzo B/4 0.056 0.048ASSICURAZIONI GENERALI SpA Trieste - P.zza Duca degli Abruzzi, 2 0.013 0.013VALTREBBIA Scarl Genoa – Via Porta degli Archi 10/16 0.005BRISA AUTO-ESTRADAS DE PORTUGAL SA São Domingos de Rana - Portugal 0.003 0.003Abertis Infraestructuras SA Parc Logistic Avenue 12-20 – Barcelona –
Spain 0.001 0.001
51
Changes of the scope of consolidation
There were no changes in the scope of consolidation in this half year.

52
Notes to the Accounts - Details by sector
The business of the ASTM Group is almost entirely conducted within the territory of the Italian
republic; in accordance with IAS 14, therefore, details are given by sector.
Sectors
The Group’s activity is divided into four main sectors:
a. Motorway Sector
b. Construction Sector
c. Engineering Sector
d. Services Sector
Details of the assets, liabilities, revenues and expenses of each sector are given in the table below.
Transactions between sectors have been stripped out and entered in the separate column headed
“Eliminated”.
Sector
Motorway Operation Construction Engineering Services
Eliminated Consolidated
2007 2006 2007 2006 2007 2006 2007 2006 2007 2006 2007 2006
Revenue from outside
sector:
Motorway Operation
(tolls)
149,884 144,771 149,884 144,771
Other motorway revenue 10,737 9,731 10,737 9,731
Construction 787 25,519 787 25,519
Engineering 12,928 14,554 12,928 14,554
Services 434 506 434 506
Other 17,067 12,988 131 1,449 106 110 190 17,414 14,627
Total revenue from
outside sector
177,688 167,490 918 26,968 13,034 14,554 544 696 192,184 209,708
Revenues from within
sector
382 976 2,521 142,652 14,848 9,912 2,195 2,149 (19,946) (155,689) - -
Total revenues 178,070 168,466 3,439 169,620 27,882 24,466 2,739 2,845 (19,946) (155,689) 192,184 209,708
Operating costs (72,286) (74,204) (3,413) (163,124) (22,489) (18,314) (2,647) (2,401) 19,946 155,689 (80,889) (102,354)
Gross Operating Margin
for sector
105,784 94,262 26 6,496 5,393 6,152 92 444 - - 111,295 107,354 (**)
Extraordinaries (*) 1,463 275 1,738
Amortization and
provisions (33,989) (20,982)
(106)
(2,038) (187) (166) (113) (125) - - (34,395) (23,311)
Operating profit 78,638 84,043
Financial charges (13,534) (14,763)
Financial income 4,358 6,283
Share of net profits of
part-owned subsidiaries 179 (26)
(44)
(363) 957 970 13,335 12,979 14,427 13,560
Income taxes (29,816) (30,785)
Net profit before
minority interests
54,073 58,338
Sector Eliminated Consolidated
Motorway Operation Construction Engineering Services
2007 2006 2007 2006 2007 2006 2007 2006 2007 2006 2007 2006
Assets of sector 1,780,292 1,659,856 7,447 16,819 81,812 82,711 894,187 895,704 (819,830) (808,507) 1,943,908 1,846,583
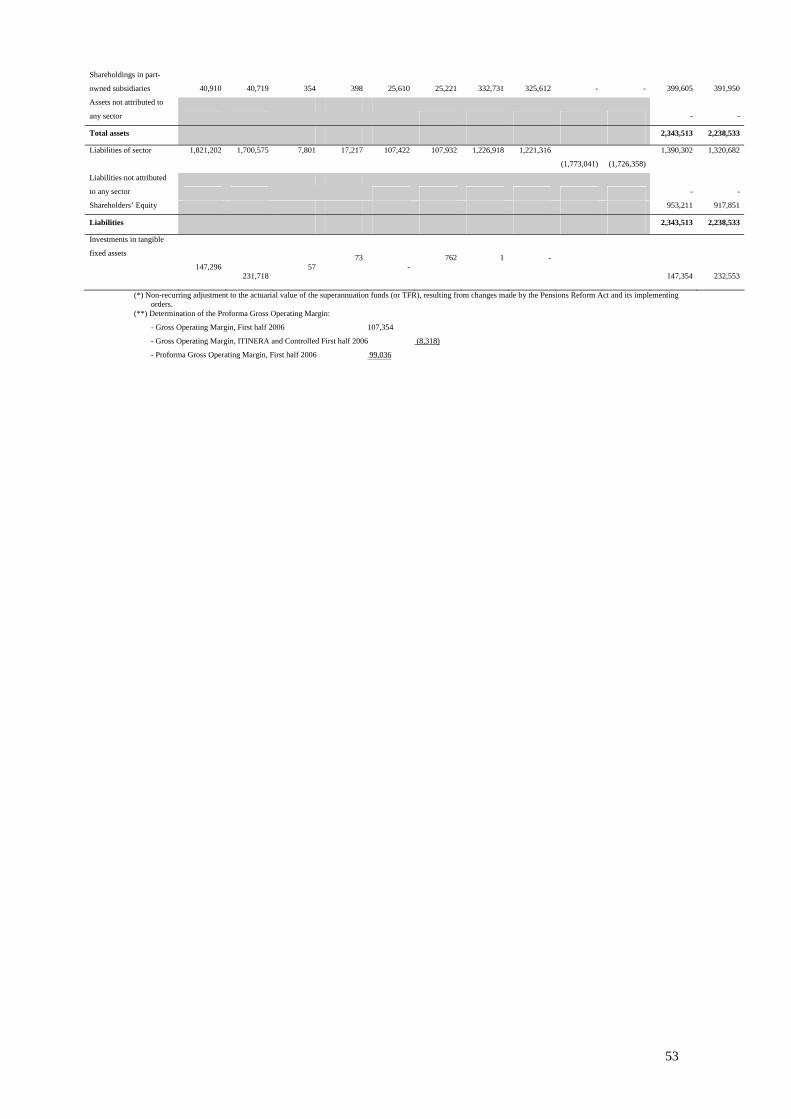
53
Shareholdings in part-
owned subsidiaries 40,910 40,719
354
398
25,610
25,221 332,731 325,612 - - 399,605 391,950
Assets not attributed to
any sector
- -
Total assets 2,343,513 2,238,533
Liabilities of sector 1,821,202 1,700,575 7,801 17,217 107,422 107,932 1,226,918 1,221,316
(1,773,041)
(1,726,358)
1,390,302 1,320,682
Liabilities not attributed
to any sector
- -
Shareholders’ Equity 953,211 917,851
Liabilities 2,343,513 2,238,533
Investments in tangible
fixed assets
147,296
231,718
57
73
-
762
1
-
147,354 232,553
(*) Non-recurring adjustment to the actuarial value of the superannuation funds (or TFR), resulting from changes made by the Pensions Reform Act and its implementing orders.
(**) Determination of the Proforma Gross Operating Margin:
- Gross Operating Margin, First half 2006 107,354
- Gross Operating Margin, ITINERA and Controlled First half 2006 (8,318)
- Proforma Gross Operating Margin, First half 2006 99,036
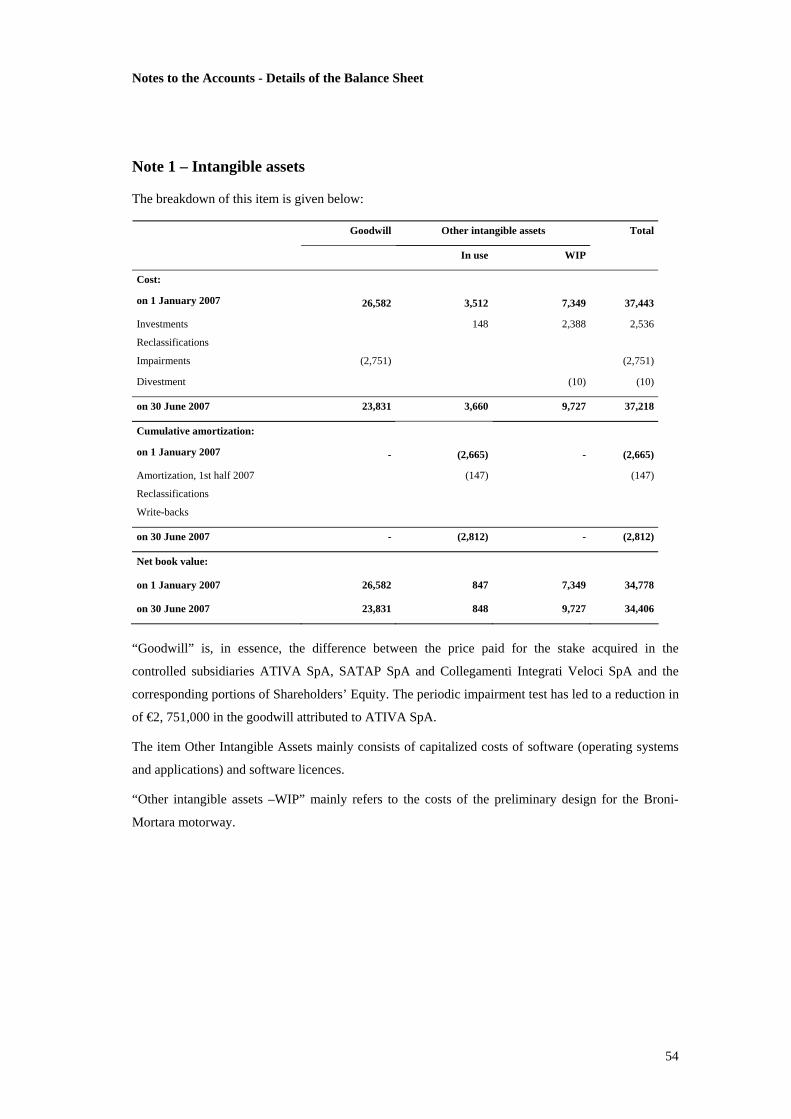
54
Notes to the Accounts - Details of the Balance Sheet
Note 1 – Intangible assets
The breakdown of this item is given below:
Goodwill Other intangible assets
In use WIP
Total
Cost:
on 1 January 2007 26,582 3,512
7,349 37,443
Investments 148 2,388 2,536
Reclassifications
Impairments (2,751) (2,751)
Divestment (10) (10)
on 30 June 2007 23,831 3,660 9,727 37,218
Cumulative amortization:
on 1 January 2007 - (2,665)
- (2,665)
Amortization, 1st half 2007 (147) (147)
Reclassifications
Write-backs
on 30 June 2007 - (2,812) - (2,812)
Net book value:
on 1 January 2007 26,582 847
7,349 34,778
on 30 June 2007 23,831 848 9,727 34,406
“Goodwill” is, in essence, the difference between the price paid for the stake acquired in the
controlled subsidiaries ATIVA SpA, SATAP SpA and Collegamenti Integrati Veloci SpA and the
corresponding portions of Shareholders’ Equity. The periodic impairment test has led to a reduction in
of €2, 751,000 in the goodwill attributed to ATIVA SpA.
The item Other Intangible Assets mainly consists of capitalized costs of software (operating systems
and applications) and software licences.
“Other intangible assets –WIP” mainly refers to the costs of the preliminary design for the Broni-
Mortara motorway.

55
Note 2 – Tangible fixed assets
The breakdown of this item is given below:
Non-compensated reversionary assets
Motorways in service Motorways under
construction
Total
Cost:
on 1 January 2007 1,846,316 470,821
2,317,137
Investments 2,086 144,636 146,722
Reclassifications 6,377 (6,377) -
Divestment
on 30 June 2007 1,854,779 609,080 2,463,859
Provision for capital subsidies:
on 1 January 2007 (156,983) (38,615) (195,598)
Increases - (5,410) (5,410)
on 30 June 2007 (156,983) (44,025) (201,008)
Cumulative amortization:
on 1 January 2007 (826,630) (826,630)
Amortization, 1st half 2007 (21,139) (21,139)
Reclassifications
Write-backs
on 30 June 2007 (847,769) (847,769)
Net book value:
on 1 January 2007 862,703 432,206 1,294,909
on 30 June 2007 850,027 565,055 1,415,082
The total cost of the Group’s motorway fabric, €2,463.9m, includes €338.7m of capitalised financial
charges (€329.2m on 31 December 2006).
“Non-compensated reversionary assets” refers to the following motorway concessions:
Concession operator Motorway section Concession expires
SATAP SpA Turin – Milan 31 December 2026
SATAP SpA Turin – Piacenza 30 June 2017
SAV SpA Quincinetto – Aosta 31 December 2032
ATIVA SpA Turin Bypass, Turin – Quincinetto, Ivrea – Santhià and Turin –
Pinerolo
31 August 2016
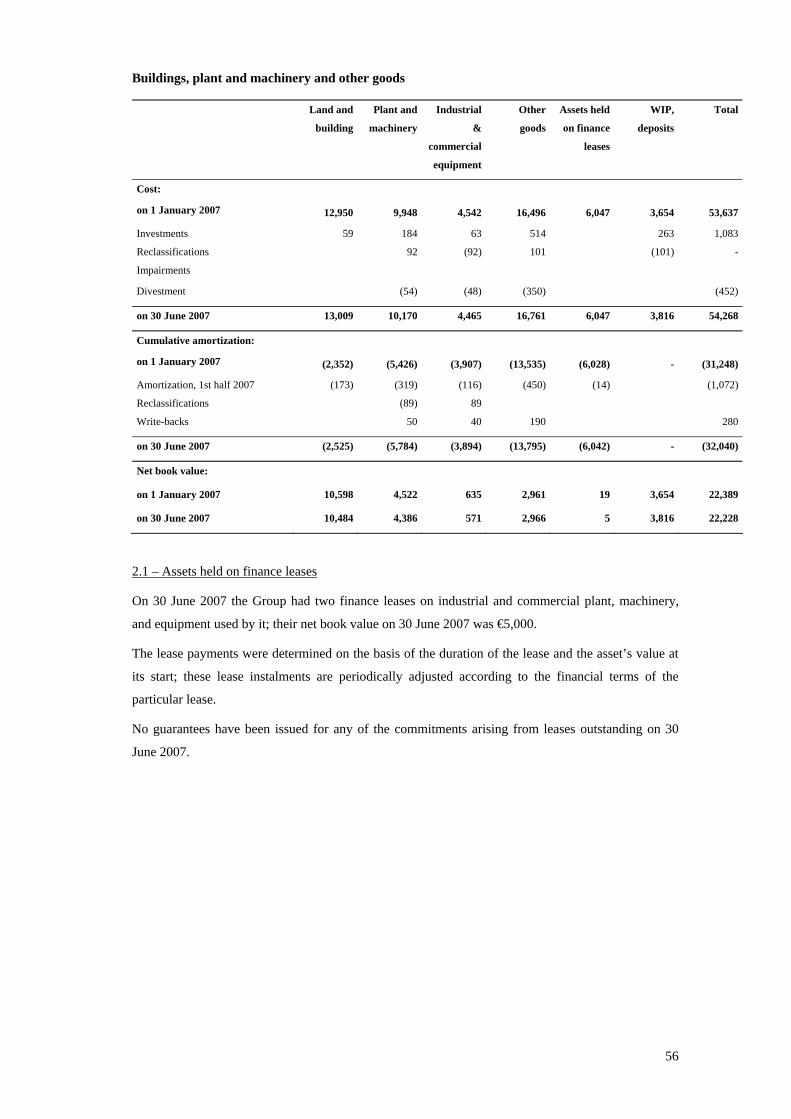
56
Buildings, plant and machinery and other goods
Land and
building
Plant and
machinery
Industrial
&
commercial
equipment
Other
goods
Assets held
on finance
leases
WIP,
deposits
Total
Cost:
on 1 January 2007 12,950 9,948 4,542 16,496
6,047 3,654 53,637
Investments 59 184 63 514 263 1,083
Reclassifications 92 (92) 101 (101) -
Impairments
Divestment (54) (48) (350) (452)
on 30 June 2007 13,009 10,170 4,465 16,761 6,047 3,816 54,268
Cumulative amortization:
on 1 January 2007 (2,352) (5,426) (3,907) (13,535)
(6,028) - (31,248)
Amortization, 1st half 2007 (173) (319) (116) (450) (14) (1,072)
Reclassifications (89) 89
Write-backs 50 40 190 280
on 30 June 2007 (2,525) (5,784) (3,894) (13,795) (6,042) - (32,040)
Net book value:
on 1 January 2007 10,598 4,522 635 2,961
19 3,654 22,389
on 30 June 2007 10,484 4,386 571 2,966 5 3,816 22,228
2.1 – Assets held on finance leases
On 30 June 2007 the Group had two finance leases on industrial and commercial plant, machinery,
and equipment used by it; their net book value on 30 June 2007 was €5,000.
The lease payments were determined on the basis of the duration of the lease and the asset’s value at
its start; these lease instalments are periodically adjusted according to the financial terms of the
particular lease.
No guarantees have been issued for any of the commitments arising from leases outstanding on 30
June 2007.
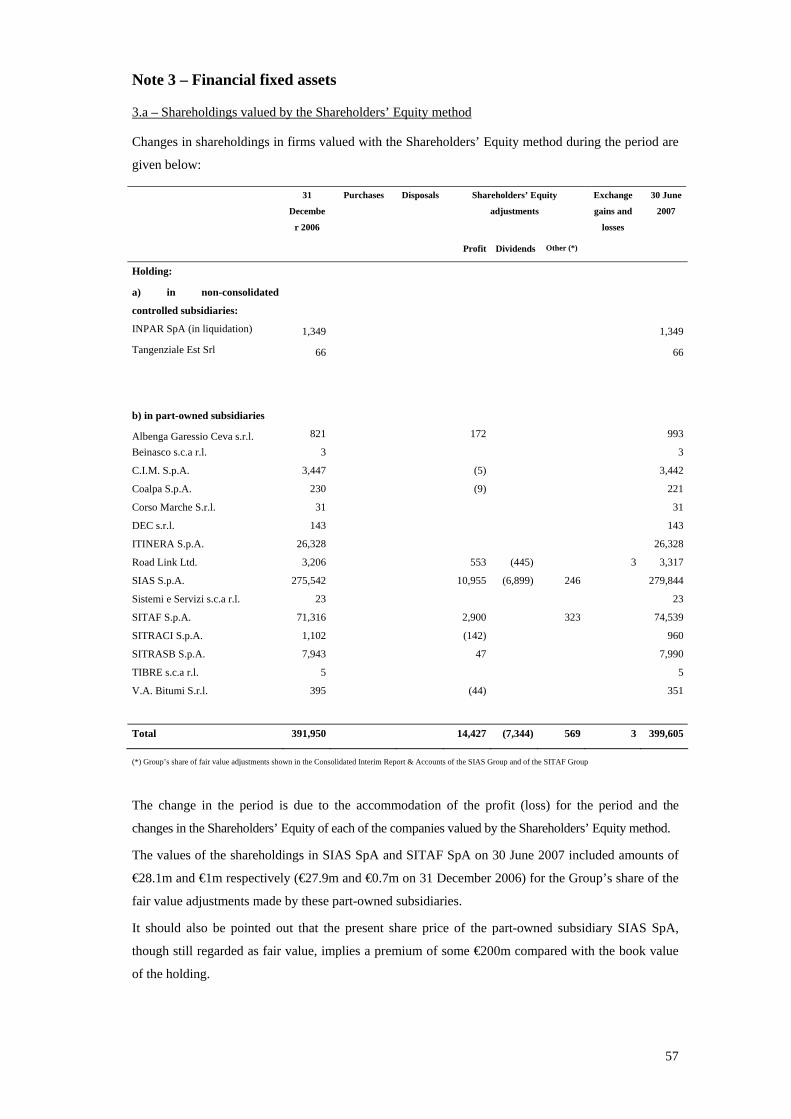
57
Note 3 – Financial fixed assets
3.a – Shareholdings valued by the Shareholders’ Equity method
Changes in shareholdings in firms valued with the Shareholders’ Equity method during the period are
given below:
31
Decembe
r 2006
Purchases Disposals Shareholders’ Equity
adjustments
Exchange
gains and
losses
30 June
2007
Profit Dividends Other (*)
Holding:
a) in non-consolidated
controlled subsidiaries:
INPAR SpA (in liquidation) 1,349 1,349
Tangenziale Est Srl 66 66
b) in part-owned subsidiaries
Albenga Garessio Ceva s.r.l. 821 172 993
Beinasco s.c.a r.l. 3 3
C.I.M. S.p.A. 3,447 (5) 3,442
Coalpa S.p.A. 230 (9) 221
Corso Marche S.r.l. 31 31
DEC s.r.l. 143 143
ITINERA S.p.A. 26,328 26,328
Road Link Ltd. 3,206 553 (445) 3 3,317
SIAS S.p.A. 275,542 10,955 (6,899) 246 279,844
Sistemi e Servizi s.c.a r.l. 23 23
SITAF S.p.A. 71,316 2,900 323 74,539
SITRACI S.p.A. 1,102 (142) 960
SITRASB S.p.A. 7,943 47 7,990
TIBRE s.c.a r.l. 5 5
V.A. Bitumi S.r.l. 395 (44) 351
Total 391,950 14,427 (7,344) 569 3 399,605
(*) Group’s share of fair value adjustments shown in the Consolidated Interim Report & Accounts of the SIAS Group and of the SITAF Group
The change in the period is due to the accommodation of the profit (loss) for the period and the
changes in the Shareholders’ Equity of each of the companies valued by the Shareholders’ Equity method.
The values of the shareholdings in SIAS SpA and SITAF SpA on 30 June 2007 included amounts of
€28.1m and €1m respectively (€27.9m and €0.7m on 31 December 2006) for the Group’s share of the
fair value adjustments made by these part-owned subsidiaries.
It should also be pointed out that the present share price of the part-owned subsidiary SIAS SpA,
though still regarded as fair value, implies a premium of some €200m compared with the book value
of the holding.

58
3.b – Non-consolidated shareholdings - available for sale
Changes in other shareholdings during the period are detailed below:
31 December 2006 Changes during the period 30 June 2007
Original
value
Fair Value
adjustments
Total Purchase
s
Disposals
/ changes
in scope
Fair Value
adjustments
Other /
Impairme
nts
Original
value
Fair Value
adjustments
Total
Holding:
Abertis Infraestructuras 56 111 167 3 56 114 170
Aeroporto Pavia Rivanazzano s.r.l.
57 57 57 57
Agenzia di Pollenzo S.p.A. 1,500 1,500 1,500 1,500
Assicurazioni Generali S.p.A. 4,172 1,154 5,326 (85) 4,172 1,069 5,241
ASTA S.p.A. 490 490 23 513 513
Autostrada Alemagna S.p.A. 18 18 18 18
Brisa – Autostrada - S.A. 36 60 96 3 36 63 99
Consorzio Autostrade Italiane Energia
4 4 4 4
Consorzio COCIV 1,177 1,177 1,177 1,177
Cons. Univ. di Economia Aziendale
- - - -
Coop Agricola Forza e Luce - - - -
CRS Centro Ricerche Stradali S.p.A.
52 52 52 52
FILSE S.p.A. 259 259 259 259
Interporto Rivalta Scrivia S.p.A. 576 576 576 576
LAS – Licis ABC Strade S.c.a r.l. 1 1 1 1
Milano Serravalle – Milano Tangenziali S.p.A.
70 610 680 70 610 680
Nuovo Mondo S.c.a r.l. 1 1 1 1
P I S T A S.p.A. 322 322 322 322
P.S.T. S.p.A. 166 166 166 166
SINELEC S.p.A. 14 14 14 14
Società Confederazione Autostrade S.p.A.
500 500 500 500
S.S.A.T. S.p.A. 336 336 336 336
Taranto Logistica S.p.A. 130 130 130 130
Tangenziali Esterne di Milano
S.p.A.
800 800 (381) 419 419
Valtrebbia S.c.a r.l. - - - -
Total 10,737 1,935 12,672 23 (79) (381) 10,379 1,856 12,235
The main changes during the period are given below:
• subscription (by SATAP SpA) of the Group’s share of the increase in the share capital of ASTA
SpA;
• impairment of the holding in Tangenziali Esterne di Milano SpA;
• Fair Value adjustments relating to the first six months of 2007.
The value of shareholdings available for sale on 30 June 2007 included an amount of about €1.9m
(€1.9m on 31 December 2006) relating to the Fair Value adjustment of those holdings.
$$$3.c – Receivables
These are as follows:
30 June 2007 31 December 2006
Loans:

59
• Loans to part-owned subsidiaries 1,853 1,828
Receivables:
• due from INA 1,008 1,091
• cautionary deposits with suppliers 261 251
• tax credit on TFR 82 104
• other receivables 7,798 6,683
Total 11,002 9,957
“Loans to subsidiaries” refers to the total of €1, 837,200 lent by the Holding Company and SATAP
SpA to INPAR SpA (in liquidation), and the €16,000 lent by Strade Co.Ge SpA to Nuovo Mondo
SCRL (in liquidation).
The sum receivable from the privatised insurance company INA represents an amount set aside in the
past for guaranteeing the Severance Indemnities of some of the staff of SATAP SpA and SAV SpA.
“Other receivables” refer to the recognition by Autostrada dei Fiori SpA of €4.8m due in relation to
the valuation of the contractually-defined supplementary consideration on the holding company’s
transfer in the first half of 2005 of shares in Milano Serravalle – Milano Tangenziali SpA. This item
also includes a total of €2m for the Fair Value adjustment of the interest rate swap entered into by
SAV SpA (€1.2m relating to these six months).
3.d – Other
This item is made up as follows:
30 June 2007 31 December 2006
• SITAF convertible bond 6,440 6,418
• SIAS convertible bond 104,157 105,539
• Insurance policies 46,952 50,721
• Debt securities and other assets 428 803
Total 157,977 163,481
“SITAF convertible bonds” refers to bonds issued by SITAF SpA with an option to convert into stock
between 31 December 2001 and 30 June 2009.
“SIAS convertible bond” is the purchase cost of bonds issued by SIAS SpA (the “SIAS Bond Loan
2.625% 2005 – 2017”).
Insurance policies relate to SATAP SpA’s endowment policy with Eurovita Assicurazioni SpA – BPI
Group. This policy was terminated by encashment in July 2007.
“Debt securities” mainly concern bonds issued by the Banco di Sicilia.
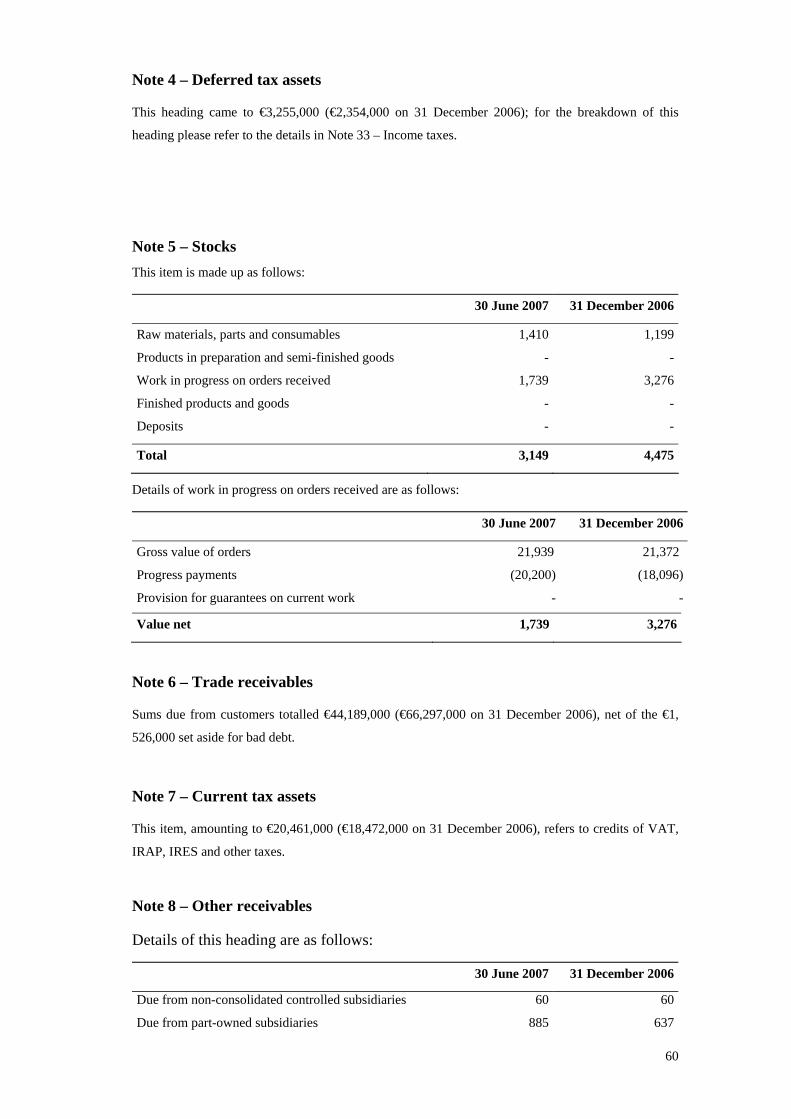
60
Note 4 – Deferred tax assets
This heading came to €3,255,000 (€2,354,000 on 31 December 2006); for the breakdown of this
heading please refer to the details in Note 33 – Income taxes.
Note 5 – Stocks This item is made up as follows:
30 June 2007 31 December 2006
Raw materials, parts and consumables 1,410 1,199
Products in preparation and semi-finished goods - -
Work in progress on orders received 1,739 3,276
Finished products and goods - -
Deposits - -
Total 3,149 4,475
Details of work in progress on orders received are as follows:
30 June 2007 31 December 2006
Gross value of orders 21,939 21,372
Progress payments (20,200) (18,096)
Provision for guarantees on current work - -
Value net 1,739 3,276
Note 6 – Trade receivables
Sums due from customers totalled €44,189,000 (€66,297,000 on 31 December 2006), net of the €1,
526,000 set aside for bad debt.
Note 7 – Current tax assets
This item, amounting to €20,461,000 (€18,472,000 on 31 December 2006), refers to credits of VAT,
IRAP, IRES and other taxes.
Note 8 – Other receivables
Details of this heading are as follows:
30 June 2007 31 December 2006
Due from non-consolidated controlled subsidiaries 60 60
Due from part-owned subsidiaries 885 637

61
Due from parent companies 1,967 4,714
Due from fellow operators 78,752 64,438
Capital subsidies due from commissioning authorities 52,856 47,446
Capital subsidies due from other public bodies 3,126 2,442
Other receivables 9,550 9,495
Pre-paid expenses 3,546 3,528
Total 150,742 132,760
Receivables due from controlled subsidiaries mainly concern services performed for INPAR SpA (in
liquidation).
Receivables due from minority holdings mainly concern SINA SpA’s credit balance with Coalpa SpA
(€752,000) and those of the Holding Company with SIAS SpA, SITAF SpA and Road Link Ltd.
(€75,000).
“Due from parent companies” mainly refers to the credit balances of ASTM Group companies with
Aurelia SpA following their inclusion in Aurelia’s Consolidated Tax Accounting scheme.
The heading “Due from fellow operators” represents sums owed by non-Group organizations arising
from tolls collected by them on behalf of Group concession operators and awaiting payment on the
Balance Sheet date.
“Capital subsidies due from commissioning authorities” relate to known subsidies for work carried out
by SATAP SpA for the construction of the Novara-Malpensa link and the motorway access to the
New Milan Rho-Pero Exhibition Centre; the increase this year is related to the progress of these
works.
“Capital subsidies due from other public bodies” refers to the Group’s share in subsidies awarded to
ATIVA SpA on work done for the Regional and Provincial governments.
Note 9 – Assets available for immediate sale This item is made up as follows:
30 June 2007 31 December 2006
FNM SpA 9,403 9,798
IRI Management SpA 349 349
Bonds, funds and government stock - 1,623
Sitech SpA - -
Total 9,752 11,770
The Group holds 659,312 shares in Sitech SpA (6.603% of the share capital); these shares have been
written off in earlier financial periods.
The change in the Group’s stake in FNM SpA relates to the Fair Value adjustment of this holding.
On 30 June 2007, the book value of the stake in the FNM SpA was written down by approximately
€0.7m to adjust it to its fair value.
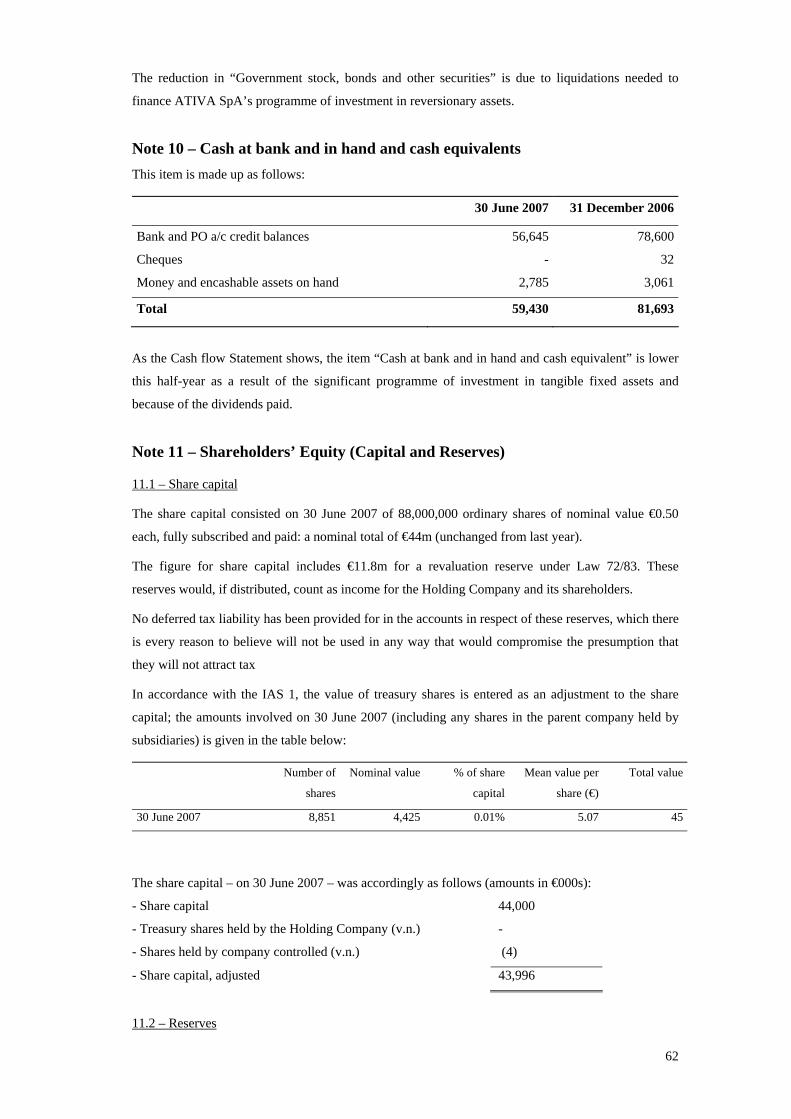
62
The reduction in “Government stock, bonds and other securities” is due to liquidations needed to
finance ATIVA SpA’s programme of investment in reversionary assets.
Note 10 – Cash at bank and in hand and cash equivalents This item is made up as follows:
30 June 2007 31 December 2006
Bank and PO a/c credit balances 56,645 78,600
Cheques - 32
Money and encashable assets on hand 2,785 3,061
Total 59,430 81,693
As the Cash flow Statement shows, the item “Cash at bank and in hand and cash equivalent” is lower
this half-year as a result of the significant programme of investment in tangible fixed assets and
because of the dividends paid.
Note 11 – Shareholders’ Equity (Capital and Reserves)
11.1 – Share capital
The share capital consisted on 30 June 2007 of 88,000,000 ordinary shares of nominal value €0.50
each, fully subscribed and paid: a nominal total of €44m (unchanged from last year).
The figure for share capital includes €11.8m for a revaluation reserve under Law 72/83. These
reserves would, if distributed, count as income for the Holding Company and its shareholders.
No deferred tax liability has been provided for in the accounts in respect of these reserves, which there
is every reason to believe will not be used in any way that would compromise the presumption that
they will not attract tax
In accordance with the IAS 1, the value of treasury shares is entered as an adjustment to the share
capital; the amounts involved on 30 June 2007 (including any shares in the parent company held by
subsidiaries) is given in the table below:
Number of
shares
Nominal value % of share
capital
Mean value per
share (€)
Total value
30 June 2007 8,851 4,425 0.01% 5.07 45
The share capital – on 30 June 2007 – was accordingly as follows (amounts in €000s):
- Share capital 44,000
- Treasury shares held by the Holding Company (v.n.) -
- Shares held by company controlled (v.n.) (4)
- Share capital, adjusted 43,996
11.2 – Reserves

63
11.2.1 – Share issue premium reserves
This amounted to €25,861,000 (unchanged from 31 December 2006).
11.2.2 – Revaluation reserves
These totalled €9,325,000 (unchanged from 31 December 2006).
The revaluation reserves would, if distributed, count as part of the income of the Holding Company
and its shareholders.
In accordance with IAS 12, no deferred tax liability has been provided for in the accounts in respect of
these reserves, which there is every reason to believe will not be used in any way that would
compromise the presumption that they will not attract tax.
The same applies to the reserves for suspended tax liabilities relating to fully-consolidated companies.
11.2.3 – Statutory reserve
This amounted to €10,538,000, unchanged from 31 December 2006 since it exceeds the threshold
prescribed by Art. 2430 of the Civil Code.
11.2.4 – Fair Valuation reserve
This reserve has been set up as the direct accounting counterpart of the appropriate proportion (under
the Shareholders’ Equity method) of the “Fair Valuation” adjustment of the minority holdings in SIAS
SpA (€28.1m) and SITAF SpA (€1m), of the financial assets classified as “available for sale” (€1.1m)
and of the Interest Rate Swap belonging to the controlled subsidiary SAV SpA (€2m). On 30 June
2007 it came to €31,409,000 (€30,572,000 on 31 December 2006), net of the effect of deferred tax and
minority interests.
11.2.5 – Reserve for exchange gains and losses
This item totalling -€1,180,000 (-€926,000 on 31 December 2006), represents the net exchange-rate
gain (here a loss) for Shareholders’ Equity in respect of the minority holdings in Road Link (UK) and
SIAS SpA.
11.2.6 – Profits carried forward
On 30 June 2007 this heading totalled €744,122,000 (€663,728,000 on 31 December 2006); it
includes amounts arising from changes in accounting practice on the date of transition to IFRS (1
January 2004), due to the adjustments that had to be made to the Financial Statement figures drawn up
on that date under Italian accounting standards. This reserve has risen as a result of an allocation from
the profits for the 2006 financial period.
11.3 – Profit for the period
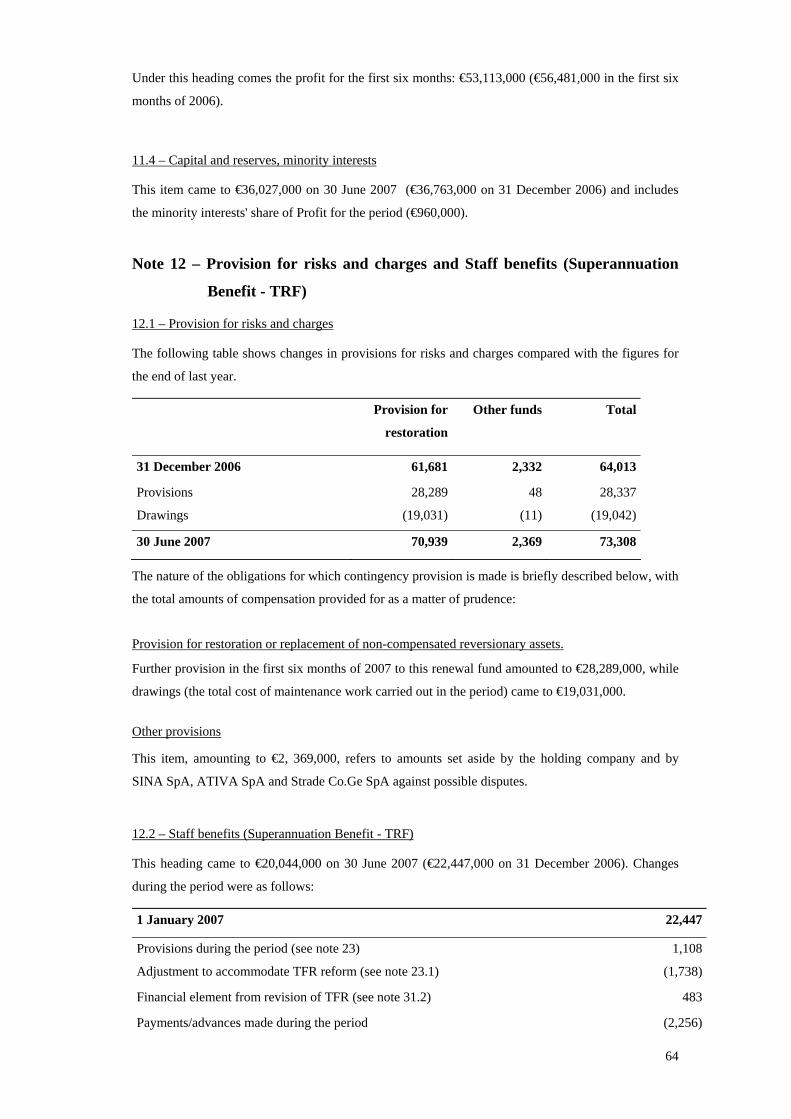
64
Under this heading comes the profit for the first six months: €53,113,000 (€56,481,000 in the first six
months of 2006).
11.4 – Capital and reserves, minority interests
This item came to €36,027,000 on 30 June 2007 (€36,763,000 on 31 December 2006) and includes
the minority interests' share of Profit for the period (€960,000).
Note 12 – Provision for risks and charges and Staff benefits (Superannuation
Benefit - TRF)
12.1 – Provision for risks and charges
The following table shows changes in provisions for risks and charges compared with the figures for
the end of last year.
Provision for
restoration
Other funds Total
31 December 2006 61,681 2,332 64,013
Provisions 28,289 48 28,337
Drawings (19,031) (11) (19,042)
30 June 2007 70,939 2,369 73,308
The nature of the obligations for which contingency provision is made is briefly described below, with
the total amounts of compensation provided for as a matter of prudence:
Provision for restoration or replacement of non-compensated reversionary assets.
Further provision in the first six months of 2007 to this renewal fund amounted to €28,289,000, while
drawings (the total cost of maintenance work carried out in the period) came to €19,031,000.
Other provisions
This item, amounting to €2, 369,000, refers to amounts set aside by the holding company and by
SINA SpA, ATIVA SpA and Strade Co.Ge SpA against possible disputes.
12.2 – Staff benefits (Superannuation Benefit - TRF)
This heading came to €20,044,000 on 30 June 2007 (€22,447,000 on 31 December 2006). Changes
during the period were as follows:
1 January 2007 22,447
Provisions during the period (see note 23) 1,108
Adjustment to accommodate TFR reform (see note 23.1) (1,738)
Financial element from revision of TFR (see note 31.2) 483
Payments/advances made during the period (2,256)

65
30 June 2007 20,044
The “Adjustment to accommodate TFR reform” reflects the changes made to this institution by the
Pensions Reform Act and its Implementing Orders.
In particular, since TFR contribution quotas due after 1 January 2007 will be going to supplementary
pension schemes or the national social security fund INPS, steps have been taken, on the basis of
actuarial calculations, to re-calculate the total liability of the Superannuation Benefit fund (TRF) on
31 December 2006 by excluding the element relating to future pay increases.
The tables below set out the economic, financial and demographic assumptions used in the actuarial
valuation of the liability in question.
Economic and financial assumptions
Annual discount rate 4.25%
Annual rate of inflation 2.0%
Annual rate of increase in TFR 3.0%
Demographic assumptions
Mortality ISTAT
Disability INPS Tables, by age and sex
Retirement age On meeting requirements
advances, weighted % 2.0% - 4.0%
Staff turnover 1.0% - 7.0%
Note 13 – Trade payables (long-term)
Amounts owed to suppliers in the longer term totalled €15,000 (€45,000 on 31 December 2006).
Note 14 – Other long-term debts
These are as follows:
30 June 2007 31 December 2006
Due to ANAS & Central Guarantee Fund 121,199 117,741
Accrued liability (on discounting of the debt to
ANAS & Central Guarantee Fund) 130,086 133,544
Sums advanced by TAV to COCIV, CIV SpA’s share 4,335 4,335
Other amounts payable 1,517 1,519
Total 257,137 257,139

66
The item “Due to ANAS & Central Guarantee Fund” refers to action taken by these organizations in
the past on behalf of the concession operators SATAP SpA, SAV SpA and ATIVA SpA for the
settlement of certain loan repayments and trade payables. The present value of this debt has been
arrived at on the basis of the repayment plans specified in the individual concession agreements
The item “Accrued liability (on discounting of the debt to ANAS & Central Guarantee Fund)” is
included to account for the difference between the original amount of the debt and its present value;
the charge determined by the discounting process has been booked as a financial charge in the Income
Statement; at the same time the amount entered last year under “Deferred Income” now appears in the
Income Statement under “Other Revenues”.
The maturity breakdown of the various debts listed above is as follows:
One to five
years
Over five
years
Total
Owed to ANAS - Central Guarantee Fund 34,932 86,267 121,199
Accrued liability on discounting the above debt 33,254 96,832 130,086
Other debts 5,852 - 5,852
Total 74,038 183,099 257,137
Note 15 – Bank debt (long-term)
Bank debt totalled €594,370,000 (€560,154,000 on 31 December 2006).; the amount is lower because
of the reclassification of one medium-term loan: please refer to Note 19 below.
Almost all the Group’s medium/long-term loan agreements on 30 June 2007 stipulate certain
covenants (usual for loans of this kind) concerning profit and financial parameters; as of 30 June 2007
these were fully satisfied.
The maturity breakdown of bank debt was as follows:
One to five
years
Over five
years
Total
Owed to banks 422,552 171,818 594,370
Note 16 – Deferred tax liabilities
This heading came to €23,927,000 (€23,551,000 on 31 December 2006): for its breakdown, please
refer to the details in Note 33 – Taxes.
Note 17 – Trade payables (current)
Trade payables totalled €82,909,000 (€80,960,000 on 31 December 2006).
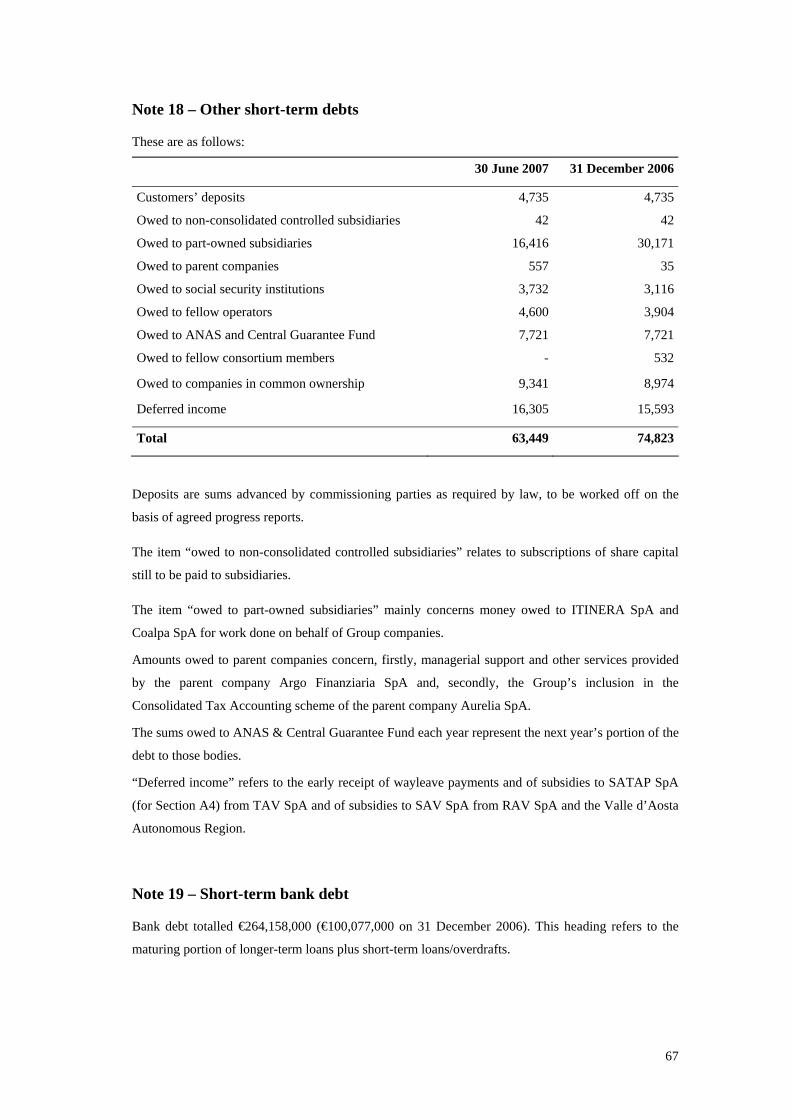
67
Note 18 – Other short-term debts
These are as follows:
30 June 2007 31 December 2006
Customers’ deposits 4,735 4,735
Owed to non-consolidated controlled subsidiaries 42 42
Owed to part-owned subsidiaries 16,416 30,171
Owed to parent companies 557 35
Owed to social security institutions 3,732 3,116
Owed to fellow operators 4,600 3,904
Owed to ANAS and Central Guarantee Fund 7,721 7,721
Owed to fellow consortium members - 532
Owed to companies in common ownership 9,341 8,974
Deferred income 16,305 15,593
Total 63,449 74,823
Deposits are sums advanced by commissioning parties as required by law, to be worked off on the
basis of agreed progress reports.
The item “owed to non-consolidated controlled subsidiaries” relates to subscriptions of share capital
still to be paid to subsidiaries.
The item “owed to part-owned subsidiaries” mainly concerns money owed to ITINERA SpA and
Coalpa SpA for work done on behalf of Group companies.
Amounts owed to parent companies concern, firstly, managerial support and other services provided
by the parent company Argo Finanziaria SpA and, secondly, the Group’s inclusion in the
Consolidated Tax Accounting scheme of the parent company Aurelia SpA.
The sums owed to ANAS & Central Guarantee Fund each year represent the next year’s portion of the
debt to those bodies.
“Deferred income” refers to the early receipt of wayleave payments and of subsidies to SATAP SpA
(for Section A4) from TAV SpA and of subsidies to SAV SpA from RAV SpA and the Valle d’Aosta
Autonomous Region.
Note 19 – Short-term bank debt
Bank debt totalled €264,158,000 (€100,077,000 on 31 December 2006). This heading refers to the
maturing portion of longer-term loans plus short-term loans/overdrafts.

68
€21.3m of total long- and short-term bank debt is guaranteed by the State.
The significant increase in this half year is due to the reclassification as “short term” of a medium-
term loan taken out by the holding company (€170m on 30 June 2007); the loan was in fact repaid
early on 6 July 2007.
Note 20 – Other short-term financial debt
This item of €3,000 (€3,000 on 31 December 2006) relates to the remainder of bonds issued and not
yet redeemed by SATAP SpA.
Note 21 – Current tax liabilities
Current tax liabilities totalled €10,982,000 (€8,943,000 on 31 December 2006) and consist of sums
due for IRES, IRAP, VAT, IRPEF by way of substitute tax, and also for State royalties under Law
531/82.
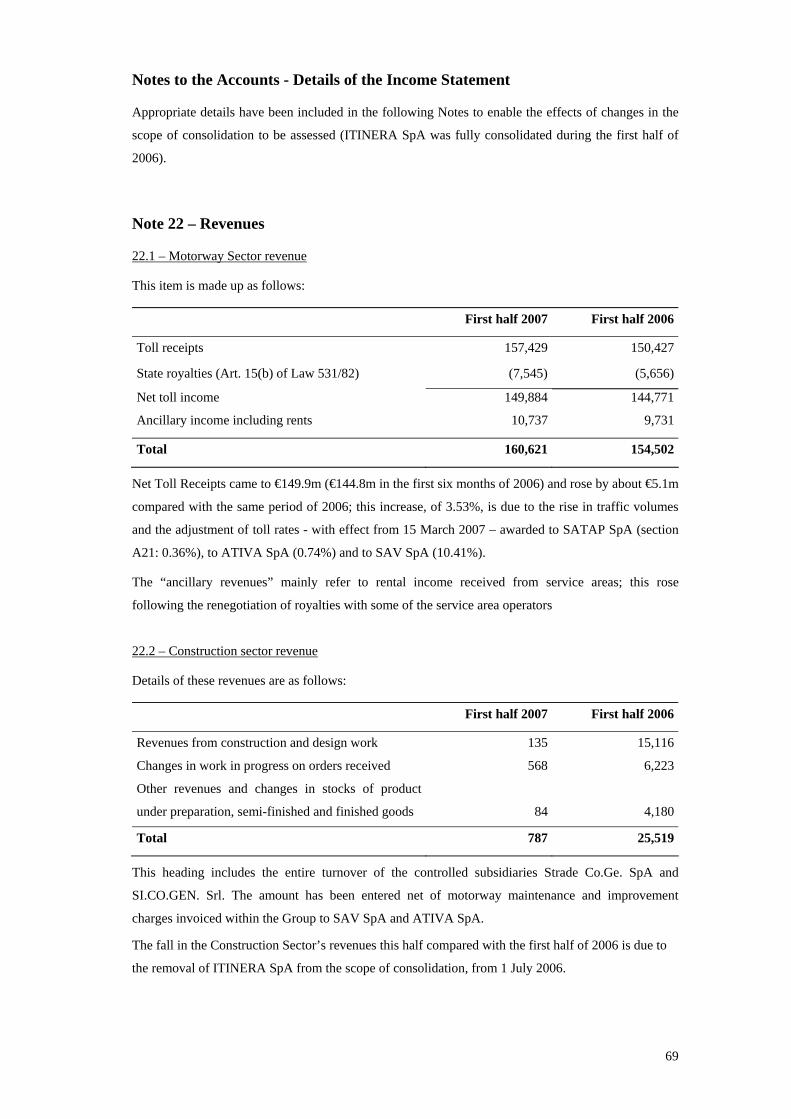
69
Notes to the Accounts - Details of the Income Statement
Appropriate details have been included in the following Notes to enable the effects of changes in the
scope of consolidation to be assessed (ITINERA SpA was fully consolidated during the first half of
2006).
Note 22 – Revenues
22.1 – Motorway Sector revenue
This item is made up as follows:
First half 2007 First half 2006
Toll receipts 157,429 150,427
State royalties (Art. 15(b) of Law 531/82) (7,545) (5,656)
Net toll income 149,884 144,771
Ancillary income including rents 10,737 9,731
Total 160,621 154,502
Net Toll Receipts came to €149.9m (€144.8m in the first six months of 2006) and rose by about €5.1m
compared with the same period of 2006; this increase, of 3.53%, is due to the rise in traffic volumes
and the adjustment of toll rates - with effect from 15 March 2007 – awarded to SATAP SpA (section
A21: 0.36%), to ATIVA SpA (0.74%) and to SAV SpA (10.41%).
The “ancillary revenues” mainly refer to rental income received from service areas; this rose
following the renegotiation of royalties with some of the service area operators
22.2 – Construction sector revenue
Details of these revenues are as follows:
First half 2007 First half 2006
Revenues from construction and design work 135 15,116
Changes in work in progress on orders received 568 6,223
Other revenues and changes in stocks of product
under preparation, semi-finished and finished goods 84 4,180
Total 787 25,519
This heading includes the entire turnover of the controlled subsidiaries Strade Co.Ge. SpA and
SI.CO.GEN. Srl. The amount has been entered net of motorway maintenance and improvement
charges invoiced within the Group to SAV SpA and ATIVA SpA.
The fall in the Construction Sector’s revenues this half compared with the first half of 2006 is due to
the removal of ITINERA SpA from the scope of consolidation, from 1 July 2006.
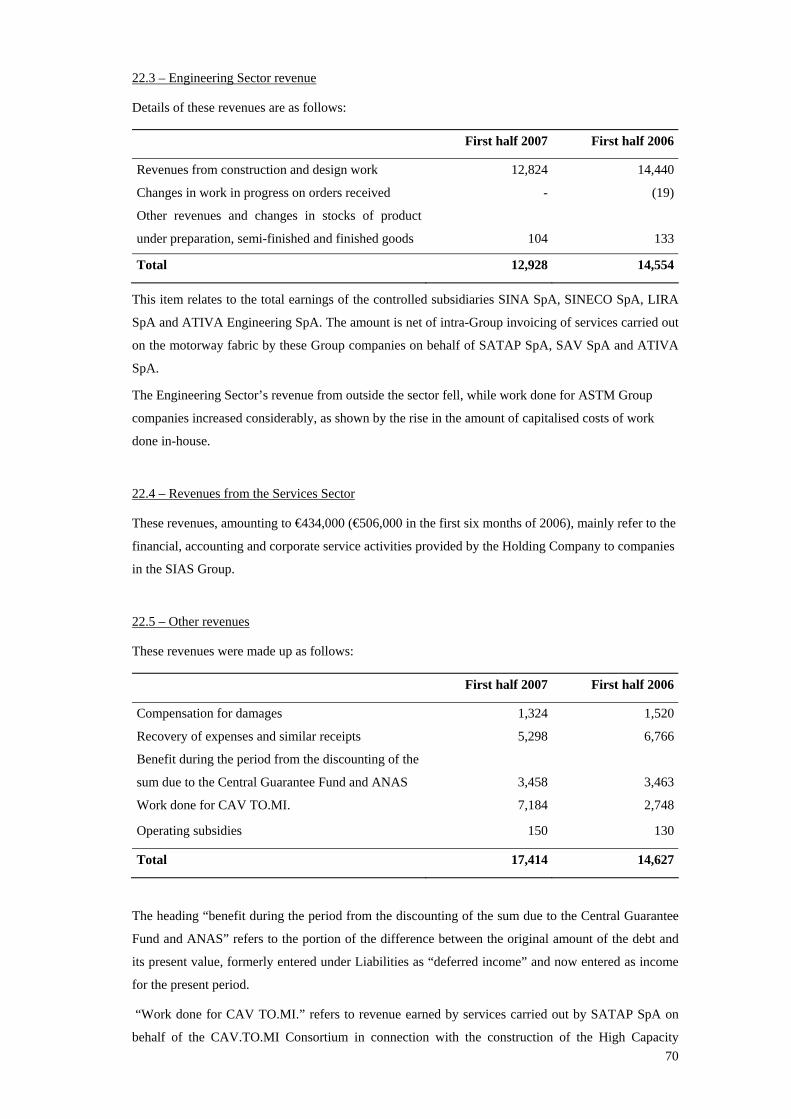
70
22.3 – Engineering Sector revenue
Details of these revenues are as follows:
First half 2007 First half 2006
Revenues from construction and design work 12,824 14,440
Changes in work in progress on orders received - (19)
Other revenues and changes in stocks of product
under preparation, semi-finished and finished goods 104 133
Total 12,928 14,554
This item relates to the total earnings of the controlled subsidiaries SINA SpA, SINECO SpA, LIRA
SpA and ATIVA Engineering SpA. The amount is net of intra-Group invoicing of services carried out
on the motorway fabric by these Group companies on behalf of SATAP SpA, SAV SpA and ATIVA
SpA.
The Engineering Sector’s revenue from outside the sector fell, while work done for ASTM Group
companies increased considerably, as shown by the rise in the amount of capitalised costs of work
done in-house.
22.4 – Revenues from the Services Sector
These revenues, amounting to €434,000 (€506,000 in the first six months of 2006), mainly refer to the
financial, accounting and corporate service activities provided by the Holding Company to companies
in the SIAS Group.
22.5 – Other revenues
These revenues were made up as follows:
First half 2007 First half 2006
Compensation for damages 1,324 1,520
Recovery of expenses and similar receipts 5,298 6,766
Benefit during the period from the discounting of the
sum due to the Central Guarantee Fund and ANAS 3,458 3,463
Work done for CAV TO.MI. 7,184 2,748
Operating subsidies 150 130
Total 17,414 14,627
The heading “benefit during the period from the discounting of the sum due to the Central Guarantee
Fund and ANAS” refers to the portion of the difference between the original amount of the debt and
its present value, formerly entered under Liabilities as “deferred income” and now entered as income
for the present period.
“Work done for CAV TO.MI.” refers to revenue earned by services carried out by SATAP SpA on
behalf of the CAV.TO.MI Consortium in connection with the construction of the High Capacity

71
railway line between Turin and Milan. The increase compared with the same period last year is due to
greater quantity of services carried out on behalf of the Consortium; there is a corresponding rise in
the item “costs for services bought in” because of services received from subcontractors.
Note 23 – Staff costs
Details of this item are as follows:
First half 2007 First half 2006
Wages and salaries 22,802 28,465
Social sec. & pension costs 7,229 9,459
Actuarial adjustment to TFR 1,108 1,443
Other costs 892 1,020
Total 32,031 40,387
€7.8m of the change in staff costs is due to the removal of ITINERA SpA from the scope of
consolidation.
Mean employee numbers by category for this year and last are given below:
First half 2007 First half 2006Senior managers 29 38
Middle managers 40 41
Employees 1,033 1,165
Workers 116 358
Total 1,218 1,602
311staff members were employed by ITINERA SpA on 30 June 2006.
The staff composition of the ATIVA Group (consolidated with the proportional method) is given below: First half 2007 Total First half 2007 pro-
quota (41.17%) Senior managers 9 4 Middle managers 15 6 Employees 325 134 Workers 85 35 Total 434 179
23.1 Significant extraordinaries
In the first six months of 2007 this item was €1,738,000; it refers to the windfall arising from the
adjustment made to accommodate the TFR reform; this adjustment – as explained in Note 12.2 –
reflects the changes made to this compulsory superannuation scheme by the Pensions Reform Act and
its Implementing Orders.
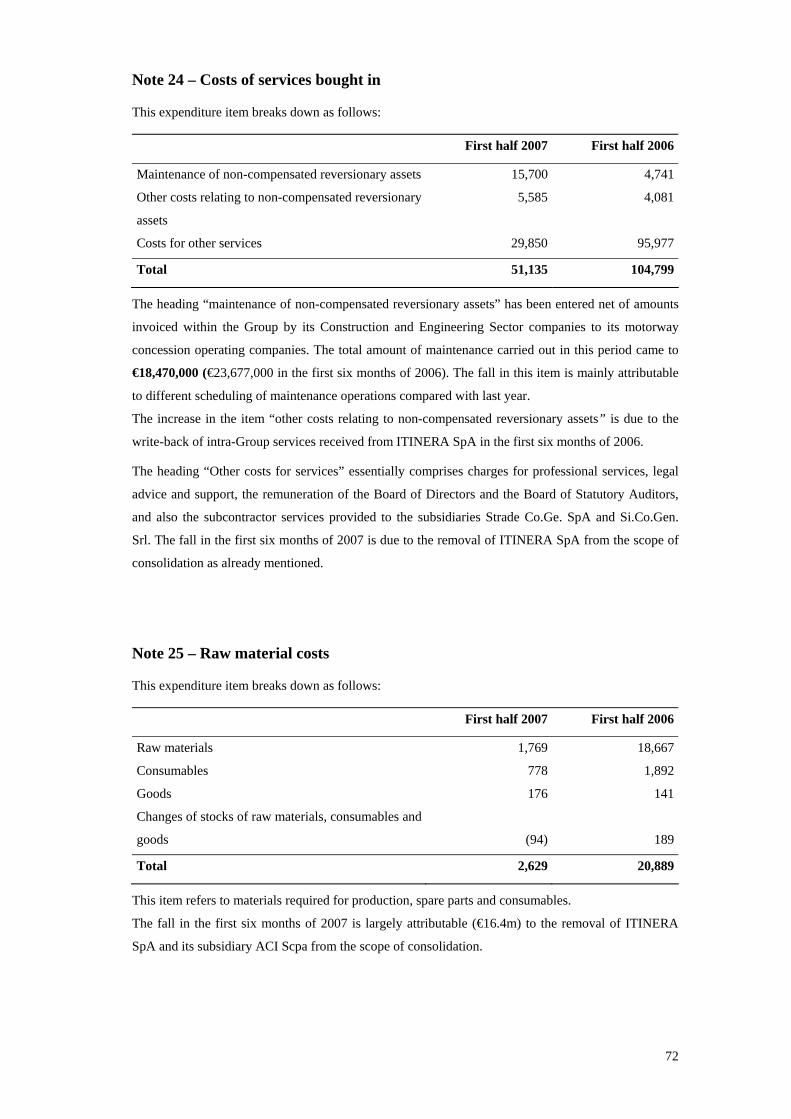
72
Note 24 – Costs of services bought in
This expenditure item breaks down as follows:
First half 2007 First half 2006
Maintenance of non-compensated reversionary assets 15,700 4,741
Other costs relating to non-compensated reversionary
assets
5,585 4,081
Costs for other services 29,850 95,977
Total 51,135 104,799
The heading “maintenance of non-compensated reversionary assets” has been entered net of amounts
invoiced within the Group by its Construction and Engineering Sector companies to its motorway
concession operating companies. The total amount of maintenance carried out in this period came to
€18,470,000 (€23,677,000 in the first six months of 2006). The fall in this item is mainly attributable
to different scheduling of maintenance operations compared with last year.
The increase in the item “other costs relating to non-compensated reversionary assets” is due to the
write-back of intra-Group services received from ITINERA SpA in the first six months of 2006.
The heading “Other costs for services” essentially comprises charges for professional services, legal
advice and support, the remuneration of the Board of Directors and the Board of Statutory Auditors,
and also the subcontractor services provided to the subsidiaries Strade Co.Ge. SpA and Si.Co.Gen.
Srl. The fall in the first six months of 2007 is due to the removal of ITINERA SpA from the scope of
consolidation as already mentioned.
Note 25 – Raw material costs
This expenditure item breaks down as follows:
First half 2007 First half 2006
Raw materials 1,769 18,667
Consumables 778 1,892
Goods 176 141
Changes of stocks of raw materials, consumables and
goods (94) 189
Total 2,629 20,889
This item refers to materials required for production, spare parts and consumables.
The fall in the first six months of 2007 is largely attributable (€16.4m) to the removal of ITINERA
SpA and its subsidiary ACI Scpa from the scope of consolidation.

73
Note 26 – Other operating costs
This expenditure item breaks down as follows:
First half 2007 First half 2006
Rental and hire costs 1,917 4,015
Concession payments 3,812 1,645
Other operating expenses 1,409 2,164
Total 7,138 7,824
“Rental and hire costs” mainly refers to operating leases on cars and other motor vehicles, computers,
printers, and premises used by Group companies; the amount is lower following the removal of
ITINERA SpA from the scope of consolidation.
The significant increase in “concession payments” reflects the rise in these payments from 1% to 2.4%
of total net toll receipts ordered with effect from 1 January 2007.
Note 27 – Capitalised costs for in-house work
This item, amounting to €12,044,000 (€71,545,000 in the first six months of 2006), mainly relates to
the capitalisation of in-house work carried out within the Group and capitalised as an increase in Non-
Compensated Reversionary Assets. The change compared with the same period last year is for the
most part the net result of the removal of ITINERA SpA from the scope of consolidation (€62.1m)
and of the greater amount of work done by the subsidiaries SINA SpA and SINECO SpA on the
motorway fabric (€2.6m, now capitalised).
Note 28 – Amortization and impairments
This item is made up as follows:
First half 2007 First half 2006
Intangible assets:
• Other fixed intangible assets 147 119
Tangible assets:
• Buildings and excavations 173 708
• Plant and machinery 319 620
• Industrial and commercial equipment 116 362
• Other goods 450 452
• Assets held on finance leases 14 1,244
• Non-compensated reversionary assets 21,139 18,001
Total amortization 22,358 21,506
Impairments 2,751 -
Total amortization and impairments 25,109 21,506
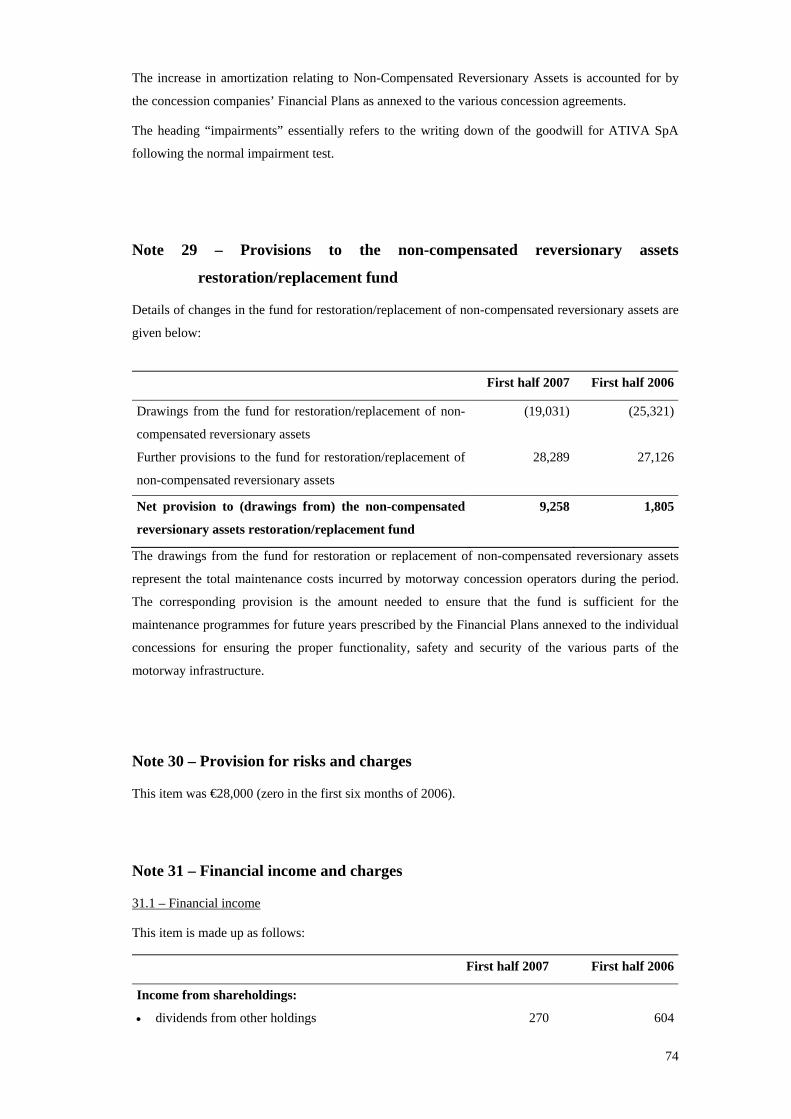
74
The increase in amortization relating to Non-Compensated Reversionary Assets is accounted for by
the concession companies’ Financial Plans as annexed to the various concession agreements.
The heading “impairments” essentially refers to the writing down of the goodwill for ATIVA SpA
following the normal impairment test.
Note 29 – Provisions to the non-compensated reversionary assets
restoration/replacement fund
Details of changes in the fund for restoration/replacement of non-compensated reversionary assets are
given below:
First half 2007 First half 2006
Drawings from the fund for restoration/replacement of non-
compensated reversionary assets
(19,031) (25,321)
Further provisions to the fund for restoration/replacement of
non-compensated reversionary assets
28,289 27,126
Net provision to (drawings from) the non-compensated
reversionary assets restoration/replacement fund
9,258 1,805
The drawings from the fund for restoration or replacement of non-compensated reversionary assets
represent the total maintenance costs incurred by motorway concession operators during the period.
The corresponding provision is the amount needed to ensure that the fund is sufficient for the
maintenance programmes for future years prescribed by the Financial Plans annexed to the individual
concessions for ensuring the proper functionality, safety and security of the various parts of the
motorway infrastructure.
Note 30 – Provision for risks and charges
This item was €28,000 (zero in the first six months of 2006).
Note 31 – Financial income and charges
31.1 – Financial income
This item is made up as follows:
First half 2007 First half 2006
Income from shareholdings:
• dividends from other holdings 270 604

75
• capital gains from disposal of shareholdings - 2,171
Interest received and other financial income
• from banks 1,635 1,101
• from financial assets 2,453 2,361
• other - 46
Total 4,358 6,283
The heading “dividends from other holdings” refers to dividends decided on by the minority holdings
SSAT SpA (€121,000), Generali Assicurazioni SpA (€120,000), Sinelec SpA (€24,000) and Abertis
Infraestructuras and Brisa Auto-Extrada de Portugal S.A. (€5,000 together).
31.2 – Financial charges
This item is made up as follows:
First half 2007 First half 2006
Interest paid to banks:
• on loans 17,795 11,222
• on current accounts 99 148
Other interest paid:
• on financial discounting of financial fixed assets 3,941 4,016
• on finance leases - 59
• costs of interest rate swap - -
Other financial charges:
• Other financial charges 1,291 983
Total 23,126 16,428
Capitalised financial charges (1) (9,592) (1,665)
Total 13,534 14,763
(1) As described in Note 2 – Tangible Fixed Assets, an amount of €9.6m has been capitalised under the heading “non-compensated reversionary
assets”.
The rise in financial charges in the first six months of 2007 is due to two factors: the additional
borrowing needed to fund the Group’s major motorway investment programme, and an increase in
interest rates.
Interest paid on financial discounting of financial fixed assets consisted of €3,458,000 paid on the
amounts owed to the Central Guarantee Fund and ANAS, and €483,000 for the finance element of the
provision to the Employees’ Severance Indemnity Fund.
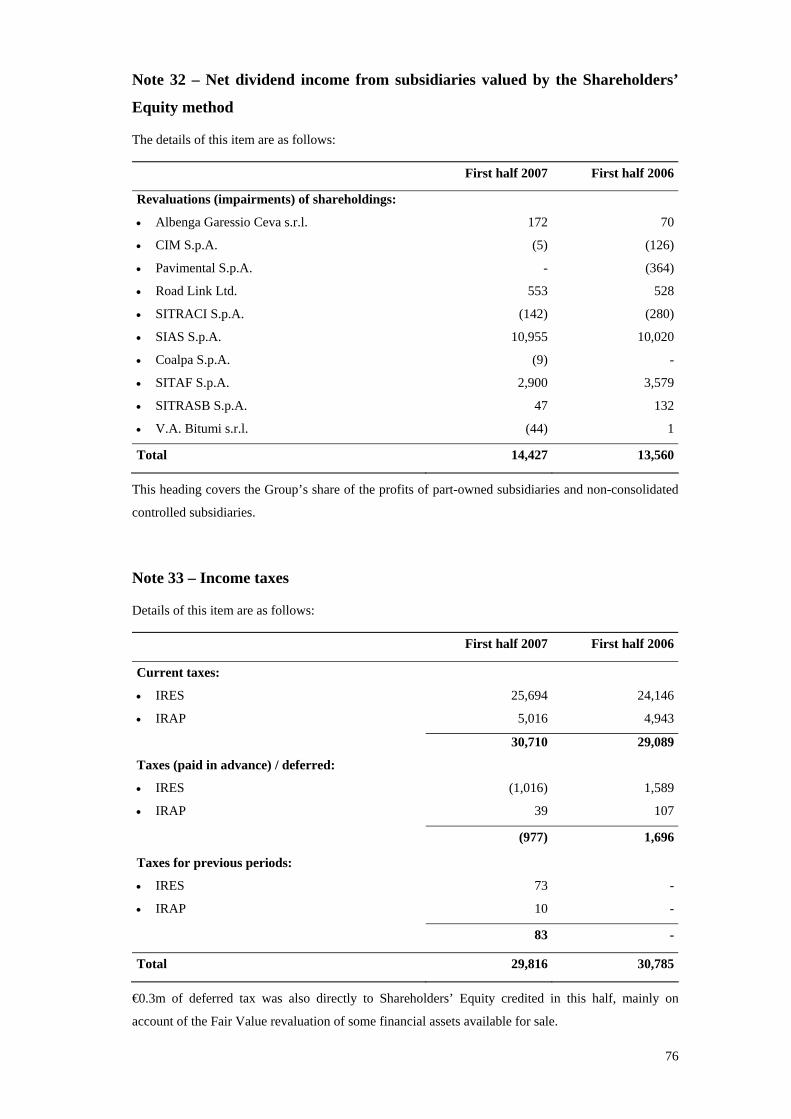
76
Note 32 – Net dividend income from subsidiaries valued by the Shareholders’
Equity method
The details of this item are as follows:
First half 2007 First half 2006
Revaluations (impairments) of shareholdings:
• Albenga Garessio Ceva s.r.l. 172 70
• CIM S.p.A. (5) (126)
• Pavimental S.p.A. - (364)
• Road Link Ltd. 553 528
• SITRACI S.p.A. (142) (280)
• SIAS S.p.A. 10,955 10,020
• Coalpa S.p.A. (9) -
• SITAF S.p.A. 2,900 3,579
• SITRASB S.p.A. 47 132
• V.A. Bitumi s.r.l. (44) 1
Total 14,427 13,560
This heading covers the Group’s share of the profits of part-owned subsidiaries and non-consolidated
controlled subsidiaries.
Note 33 – Income taxes
Details of this item are as follows:
First half 2007 First half 2006
Current taxes:
• IRES 25,694 24,146
• IRAP 5,016 4,943
30,710 29,089
Taxes (paid in advance) / deferred:
• IRES (1,016) 1,589
• IRAP 39 107
(977) 1,696
Taxes for previous periods:
• IRES 73 -
• IRAP 10 -
83 -
Total 29,816 30,785
€0.3m of deferred tax was also directly to Shareholders’ Equity credited in this half, mainly on
account of the Fair Value revaluation of some financial assets available for sale.
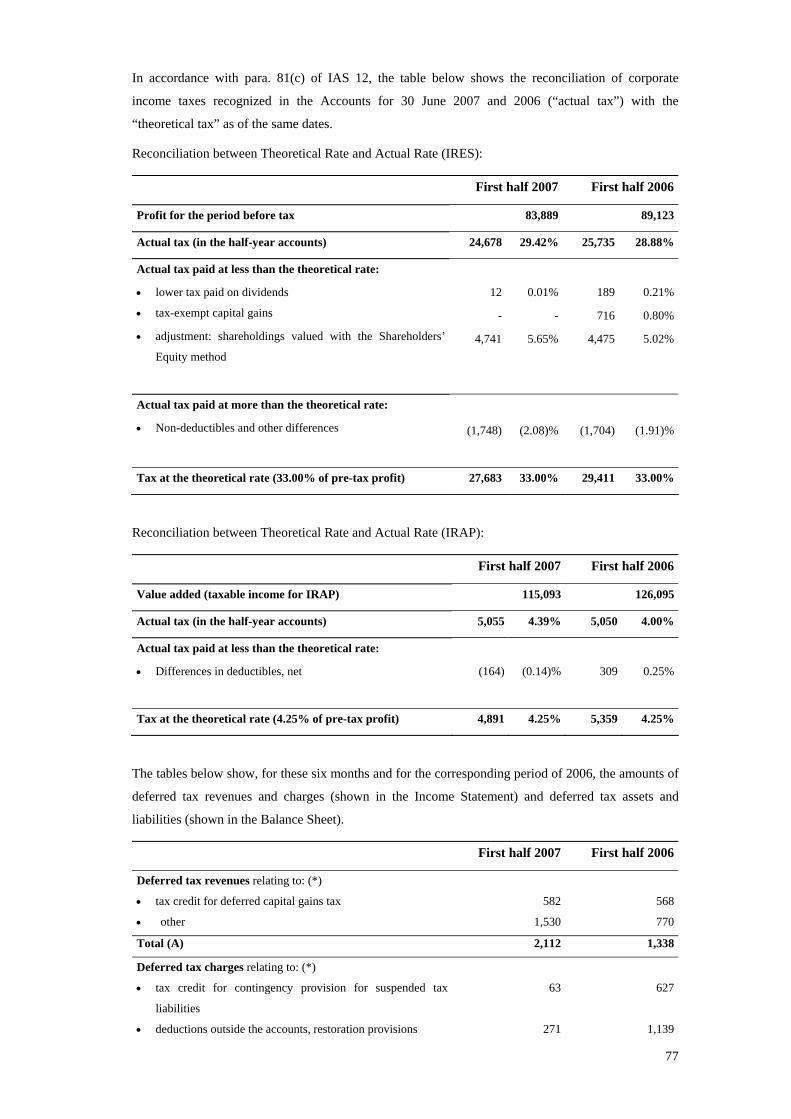
77
In accordance with para. 81(c) of IAS 12, the table below shows the reconciliation of corporate
income taxes recognized in the Accounts for 30 June 2007 and 2006 (“actual tax”) with the
“theoretical tax” as of the same dates.
Reconciliation between Theoretical Rate and Actual Rate (IRES):
First half 2007 First half 2006
Profit for the period before tax 83,889 89,123
Actual tax (in the half-year accounts) 24,678 29.42% 25,735 28.88%
Actual tax paid at less than the theoretical rate:
• lower tax paid on dividends 12 0.01% 189 0.21%
• tax-exempt capital gains - - 716 0.80%
• adjustment: shareholdings valued with the Shareholders’
Equity method 4,741 5.65% 4,475 5.02%
Actual tax paid at more than the theoretical rate:
• Non-deductibles and other differences (1,748) (2.08)% (1,704) (1.91)%
Tax at the theoretical rate (33.00% of pre-tax profit) 27,683 33.00% 29,411 33.00%
Reconciliation between Theoretical Rate and Actual Rate (IRAP):
First half 2007 First half 2006
Value added (taxable income for IRAP) 115,093 126,095
Actual tax (in the half-year accounts) 5,055 4.39% 5,050 4.00%
Actual tax paid at less than the theoretical rate:
• Differences in deductibles, net (164) (0.14)% 309 0.25%
Tax at the theoretical rate (4.25% of pre-tax profit) 4,891 4.25% 5,359 4.25%
The tables below show, for these six months and for the corresponding period of 2006, the amounts of
deferred tax revenues and charges (shown in the Income Statement) and deferred tax assets and
liabilities (shown in the Balance Sheet).
First half 2007 First half 2006
Deferred tax revenues relating to: (*)
• tax credit for deferred capital gains tax 582 568
• other 1,530 770
Total (A) 2,112 1,338
Deferred tax charges relating to: (*)
• tax credit for contingency provision for suspended tax
liabilities
63 627
• deductions outside the accounts, restoration provisions 271 1,139

78
• Assets held on finance leases 4 3
• actuarial re-calculation of superannuation fund (TFR) 537 -
• other 260 1,265
Total (B) 1,135 3,034
Total (B) – (A) (977) 1,696
(*) (*) These deferred tax revenues and charges have been calculated on the basis of the tax rates in force at the time when
they are expected to be paid or re-credited
30 June 2007 31 December
2006
Deferred tax assets relating to: (*)
• intangible assets not to be capitalized under IAS/IFRS 486 644
• contingency provision for suspended tax liabilities 665 869
• maintenance costs in excess of the deductible proportion 43 64
• other 2,061 777
Total 3,255 2,354
Deferred tax liabilities relating to: (*)
• deductions made outside the accounts (8,370) (7,395)
• Assets held on finance leases (16) (20)
• deferred taxes on the difference between the book value and
fiscal value of SATAP SpA
(15,398) (15,398)
• other (143) (738)
Total (23,927) (23,551)
(*) These deferred tax revenues and charges have been calculated on the basis of the tax rates in force at the time when
(*) they are expected to be paid or re-credited
As explained in the Financial Statement for the year ended 31 December 2006, the heading “deferred
tax liabilities” includes a provision made by the Holding Company for the difference between the
book value and the fiscal value of its stake in SATAP SpA.
Note 34 – Profit per share
Profit per share is calculated, in accordance with IAS 33, by dividing the net profit (Group's share) by
the mean number of shares in circulation during the period. The mean number shares is calculated
taking into account the mean number of treasury shares held by the Holding Company and by
controlled subsidiaries.
(€000s) First half 2007 First half 2006
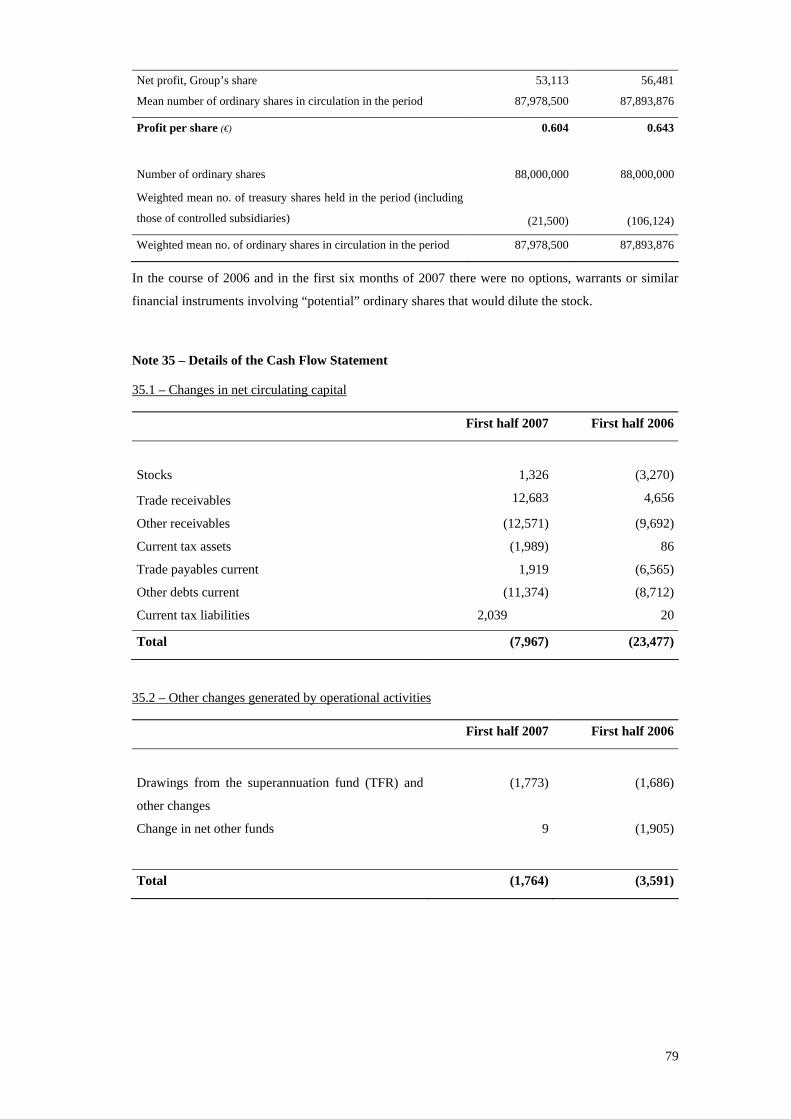
79
Net profit, Group’s share 53,113 56,481
Mean number of ordinary shares in circulation in the period 87,978,500 87,893,876
Profit per share (€) 0.604 0.643
Number of ordinary shares 88,000,000 88,000,000
Weighted mean no. of treasury shares held in the period (including
those of controlled subsidiaries)
(21,500) (106,124)
Weighted mean no. of ordinary shares in circulation in the period 87,978,500 87,893,876
In the course of 2006 and in the first six months of 2007 there were no options, warrants or similar
financial instruments involving “potential” ordinary shares that would dilute the stock.
Note 35 – Details of the Cash Flow Statement
35.1 – Changes in net circulating capital
First half 2007 First half 2006
Stocks 1,326 (3,270)
Trade receivables 12,683 4,656
Other receivables (12,571) (9,692)
Current tax assets (1,989) 86
Trade payables current 1,919 (6,565)
Other debts current (11,374) (8,712)
Current tax liabilities 2,039 20
Total (7,967) (23,477)
35.2 – Other changes generated by operational activities
First half 2007 First half 2006
Drawings from the superannuation fund (TFR) and
other changes
(1,773) (1,686)
Change in net other funds 9 (1,905)
Total (1,764) (3,591)

80
Other information
Information is given below relating to the determination of fair value, undertakings entered into by
Group companies, and dealings with Related Parties; for information about the company, Post-
Balance Sheet events and Future Prospects, please refer to the details given earlier in this Interim
Report.
Details of the determination of fair value
The fair value criterion is used in valuing financial assets and liabilities where such values can be
reliably determined.
In the case of financial assets and liabilities listed in active markets, Fair Value is determined by
reference to the market price on the date of recognition and/or later valuations of the asset/liability.
Where no official market price is available, Fair Value is determined by reference to the prices
obtained in the latest similar transaction (purchase, sale or redemption of the financial asset or
liability).
The fair value of trade receivables and payables is the same as their book value, mainly because they
are generally short-term term and so do not require the application of discounting techniques, &c.
Memorandum accounts: undertakings entered into by Group companies
These are as follows:
• The guarantee which ASTM SpA gave to ANAS SpA when transferring an entire company
division to its subsidiary SATAP SpA; this guarantee of €75.1m, corresponding to the value
of assets available for ASTM SpA’s use but not forming part of the corporate assets
transferred, exceeds 10% of ASTM SpA’s Net Worth as shown in the Financial Statement
for 31 December 2003.
• The surety in the sum of €3.1m, provided by SATAP SpA to TAV SpA to guarantee the
redesign, creation and maintenance work on ANAS’ spur linking the Novara bypass and the
connection of the new station (this surety will be renewed annually until ANAS has formally
accepted delivery of the work).
• The surety in the sum of €0.8m provided by ASTM SpA to Banca Intesa-San Paolo SpA on
behalf of Edilrovaccio2 Srl guaranteeing the sum due under a mortgage loan (this guarantee
is renewed annually).
• the surety to Banca di Roma (Group’s share €9.5m) provided by SATAP SpA together with
the other members of S.A.Bro.M SpA to guarantee the latter’s obligations in connection with
its preliminary design for the section of motorway between Broni and Mortara (presented on
9 October 2006), and for a loan.
Undertaking to ANAS
Following the transfer by ASTM SpA of the company division consisting of the A4 Turin-Milan
motorway section to SATAP SpA on 3 December 2004, SATAP SpA and ASTM SpA signed an
agreement with ANAS arranging for SATAP SpA to replace ASTM SpA without a break as party to

81
the agreement entered into by ASTM SpA for the construction and operation of A4 motorway.
Article 7 of the 3 December 2004 agreement provided that ASTM SpA would retain a controlling
stake in SATAP SpA.
Recently, while transferring its stake in SATAP SpA to SIAS SpA, ASTM SpA acquired control of
SIAS SpA itself, accordingly retaining control of SATAP SpA, though now indirectly. ASTM SpA
has undertaken, before reducing its stake in SIAS SpA below the “legal control” threshold, to make a
shareholders’ pact with its own parent company Aurelia SpA enabling the two to act jointly in
exercising their voting rights as shareholders in SIAS SpA, of which the two together wield a
majority of the share capital. Furthermore SIAS SpA itself is bound under the same Article 7, in the
event that this shareholders’ pact should not be renewed or should become ineffective, or the joint
shareholding fall below the threshold for legal control of SIAS SpA, to sell a controlling stake in
SATAP SpA to ASTM SpA (ASTM SpA is likewise bound to purchase that stake).
Information on dealings with Related Parties As provided for in CONSOB Order No. 98015375 of 27 February 1998 and DEM/6064293 of 28 July
2006, as well as by IAS 24, details of transactions with related parties during the period in question
are summarised below (€m):
Transactions with
related parties (A) Total revenues
(B)
Proportion
(A) / (B)%
Revenues 9.3 192.2 4.8%
Operating costs 29.2 91.3 32.0%
Increases in Intangible/Tangible Fixed Assets 84.0 1,437.3 5.8%
In view of the large proportion of Operating Costs consisting of transactions with related parties, this
financial year’s Consolidated Income Statement indicates the amount of these transactions separately
for each relevant heading, as required by CONSOB Resolution No. 15519 of 27 July 2006.
Details are given below of the main dealings with related parties, by Financial Statement heading.
Revenues
♦ professional services provided by SINECO SpA to SALT SpA, Autostrada dei Fiori SpA,
Autocamionale della Cisa SpA, Interstrade SpA and ABC Costruzioni SpA: €4m; (2) (3)
♦ research and other professional services provided by SINA SpA to SALT SpA, Autostrada dei
Fiori SpA, Autocamionale della Cisa SpA, and Autostrada Asti-Cuneo SpA: €3.4m; (2)
♦ services provided by Strade Co.Ge SpA to LAS Scarl and ITINERA SpA: €0.8m; (2)
Costs
♦ managerial support and consultancy services provided by the parent company Argo Finanziaria
SpA to Group companies, for a total amount of approximately €0.8m; (1)
♦ services and supplies provided by SEA SpA to SATAP SpA, SAV SpA, SINA SpA and Strade
Co.Ge SpA: €1.2m; (2)
♦ insurance services provided by the broker PCA Srl to the holding company and to SATAP SpA,
SAV SpA and ATIVA SpA: €1m; (3)
82
♦ services provided by Euroimpianti Electronic SpA to SATAP SpA: €1.4m; (2)
♦ IT support and maintenance services for toll-collecting equipment provided by Sinelec SpA to
SATAP SpA, SAV SpA, SINA SpA, ATIVA SpA and Ativa Engineering SpA: a total amount of
approximately €4.2m; (2)
♦ services provided by ITINERA SpA to SATAP SpA: €19.1 (2)
Increases in Tangible/Intangible Fixed Assets
♦ services provided by Euroimpianti Electronic SpA to SATAP SpA and SAV SpA: €1.3m; (2)
♦ services provided by SEA SpA to SATAP SpA and SAV SpA: €0.4m; (2)
♦ services provided by LAS Scarl to SAV SpA: €0.6m; (2)
♦ services provided to SATAP SpA by ITINERA SpA and ACI Scpa in the second half: €80.8m; (2)
♦ Sinelec SpA’s supplies of toll-collecting equipment to SATAP SpA and ATIVA SpA:
approximately €0.6m; (2)
In addition to the dealings shown above there are relationships among Group companies involving
transactions under the general motorway toll collection system.
All the transactions listed above were conducted on normal market terms.
For the purposes of Civil Code Art. 2391-bis it should be explained that transactions with related
parties, whether direct or through controlled subsidiaries, are carried out in accordance with rules
which, being based on the general principles prescribed by CONSOB and the corporate governance
provisions of the company’s adopted Self-Regulation Code, guarantee that they are transparent and
entirely proper in both substance and procedure.
(1) Dealings with parent companies (2)Dealings with other firms controlled by the same parent company/ies (3) Dealings with other associated parties

83
Interim Accounts
of the holding company
for 30 June 2007
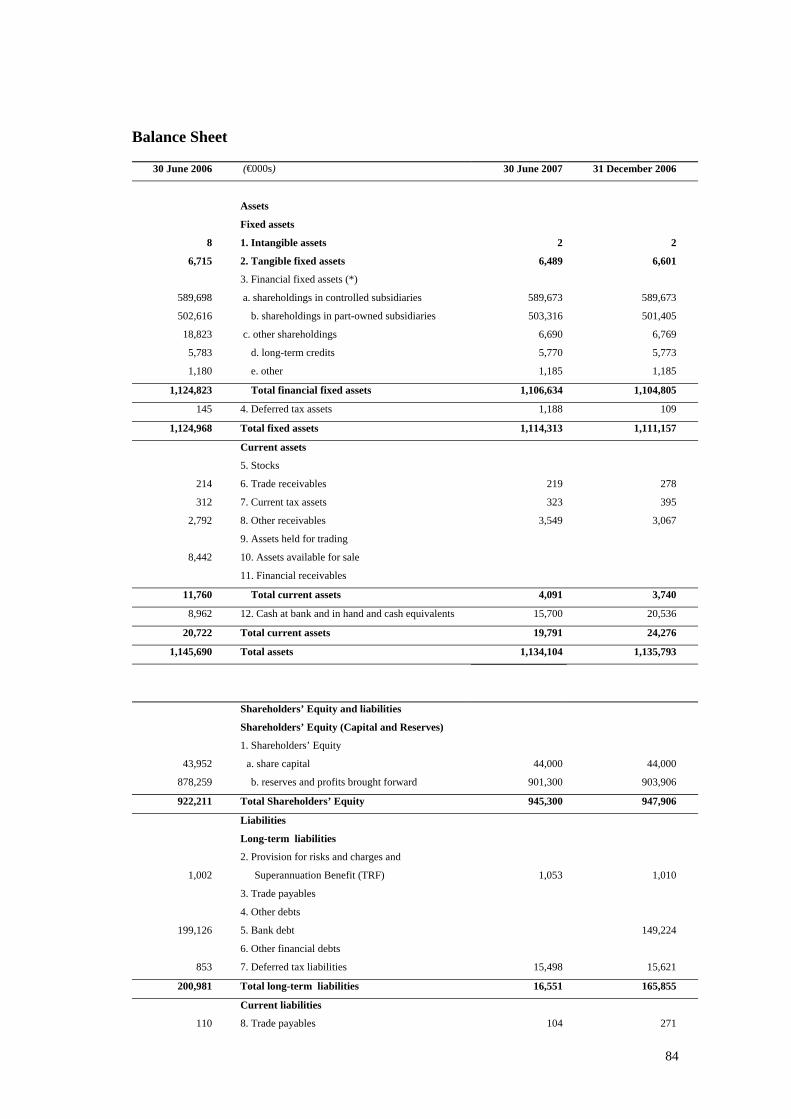
84
Balance Sheet
30 June 2006 (€000s) 30 June 2007 31 December 2006
Assets
Fixed assets
8 1. Intangible assets 2 2
6,715 2. Tangible fixed assets 6,489 6,601
3. Financial fixed assets (*)
589,698 a. shareholdings in controlled subsidiaries 589,673 589,673
502,616 3. b. shareholdings in part-owned subsidiaries 503,316 501,405
18,823 c. other shareholdings 6,690 6,769
5,783 3. d. long-term credits 5,770 5,773
1,180 3. e. other 1,185 1,185
1,124,823 3. Total financial fixed assets 1,106,634 1,104,805
145 4. Deferred tax assets 1,188 109
1,124,968 Total fixed assets 1,114,313 1,111,157
Current assets
5. Stocks
214 6. Trade receivables 219 278
312 7. Current tax assets 323 395
2,792 8. Other receivables 3,549 3,067
9. Assets held for trading
8,442 10. Assets available for sale
11. Financial receivables
11,760 3. Total current assets 4,091 3,740
8,962 12. Cash at bank and in hand and cash equivalents 15,700 20,536
20,722 Total current assets 19,791 24,276
1,145,690 Total assets 1,134,104 1,135,793
Shareholders’ Equity and liabilities
Shareholders’ Equity (Capital and Reserves)
1. Shareholders’ Equity
43,952 (a. share capital 44,000 44,000
878,259 2. b. reserves and profits brought forward 901,300 903,906
922,211 Total Shareholders’ Equity 945,300 947,906
Liabilities
Long-term liabilities
1,002
2. Provision for risks and charges and
Superannuation Benefit (TRF)
1,053
1,010
3. Trade payables
4. Other debts
199,126 5. Bank debt 149,224
6. Other financial debts
853 7. Deferred tax liabilities 15,498 15,621
200,981 Total long-term liabilities 16,551 165,855
Current liabilities
110 8. Trade payables 104 271
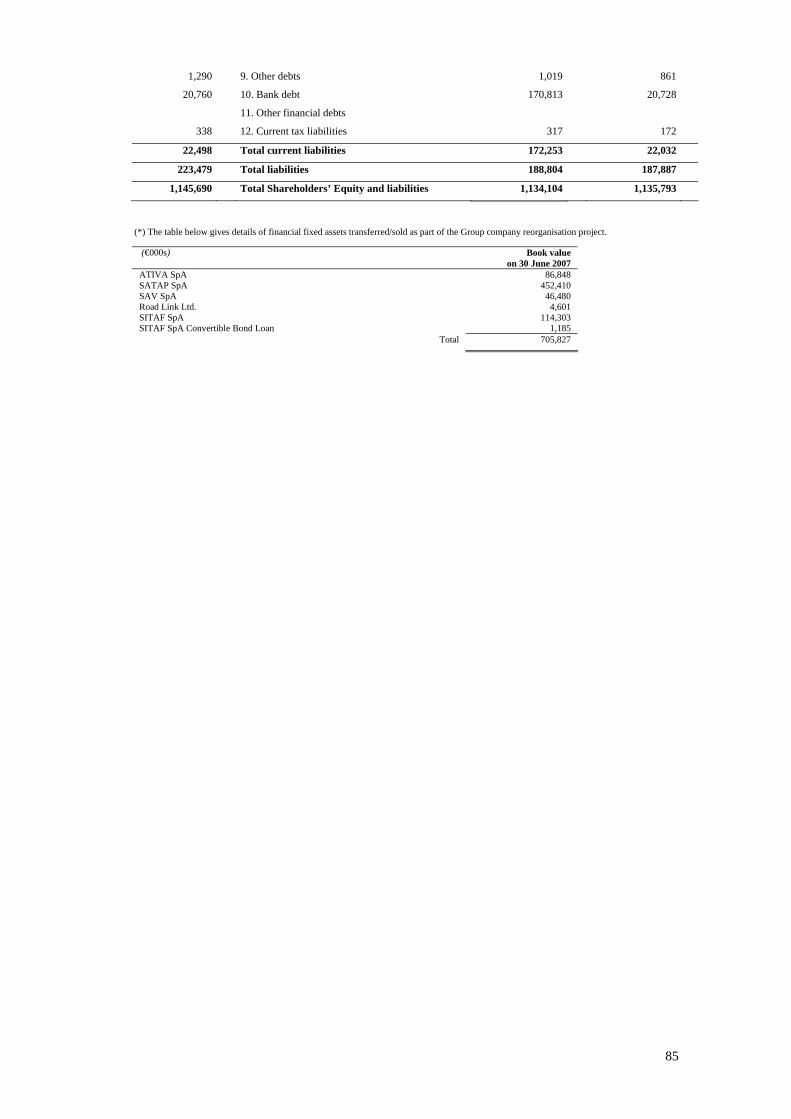
85
1,290 9. Other debts 1,019 861
20,760 10. Bank debt 170,813 20,728
11. Other financial debts
338 12. Current tax liabilities 317 172
22,498 Total current liabilities 172,253 22,032
223,479 Total liabilities 188,804 187,887
1,145,690 Total Shareholders’ Equity and liabilities 1,134,104 1,135,793
(*) The table below gives details of financial fixed assets transferred/sold as part of the Group company reorganisation project.
(€000s) Book value on 30 June 2007
ATIVA SpA 86,848 SATAP SpA 452,410 SAV SpA 46,480 Road Link Ltd. 4,601 SITAF SpA 114,303 SITAF SpA Convertible Bond Loan 1,185
Total 705,827

86
Income Statement
Full Year
2006
(€000s) First half 2007 First half 2006
Financial income and charges
1. Income from shareholdings:
409,505 1. a. from controlled subsidiaries 11,433 357,816
16,468 2. b. from minority holdings 6,429 8,506
4,563 c. from other holdings 125 3,777
430,536 Total income from investments 17,987 370,099
725 2. Other financial income 407 346
(11,005) 3. Interest paid and other financial charges (4,430) (6,951)
420,256 Total net financial income (A) 13,964 363,494
Value adjustments, financial assets
- 1. Revaluations - -
(166) 2. Impairments (72) (142)
(166) Total value adjustments of financial assets (B) (72) (142)
5,609 Other operating revenue (C) 2,739 2,845
Other operating costs
(2,386) a. staff costs (1,338) (1,237)
(1,839) b. costs of services bought in (986) (876)
(20) c. raw material costs (11) (12)
(610) d. other costs (312) (276)
(245) e. amortization and impairments (113) (125)
f. other provisions for risks and charges
(5,100) Total other operating costs (D) (2,760) (2,526)
420,599 Profit (loss) before taxes (A+B+C+D) 13,871 363,671
17. Taxes
1,184 a. Current taxes - -
153 b. Deferred taxes 1,198 1,085
421,936 Profit (loss) for the period 15,069 364,756
Note: in view of the fact that ASTM SpA’s core business is that of an industrial holding company, the accounting
layout used is that provided for in CONSOB Notice No. 94001437 of 23 February 1994 for this type of
company, and is accordingly different from that used for the ASTM Group.

87
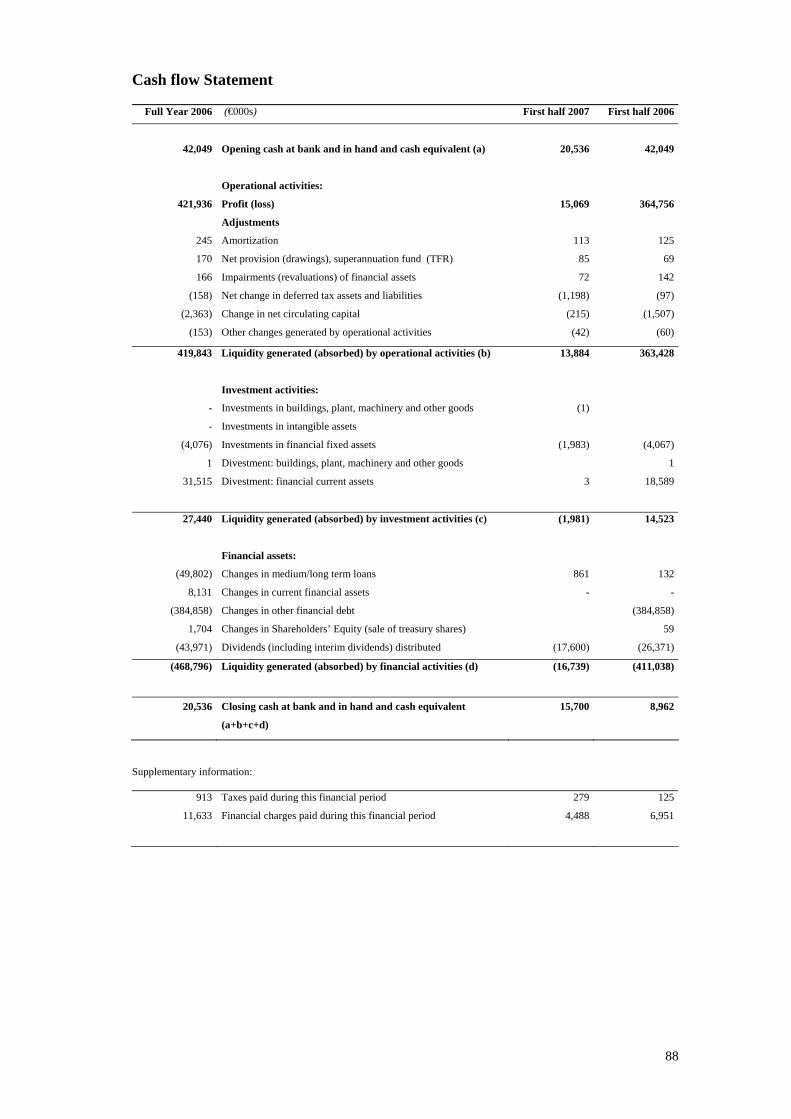
88
Cash flow Statement
Full Year 2006 (€000s) First half 2007 First half 2006
42,049 Opening cash at bank and in hand and cash equivalent (a) 20,536 42,049
Operational activities:
421,936 Profit (loss) 15,069 364,756
Adjustments
245 Amortization 113 125
170 Net provision (drawings), superannuation fund (TFR) 85 69
166 Impairments (revaluations) of financial assets 72 142
(158) Net change in deferred tax assets and liabilities (1,198) (97)
(2,363) Change in net circulating capital (215) (1,507)
(153) Other changes generated by operational activities (42) (60)
419,843 Liquidity generated (absorbed) by operational activities (b) 13,884 363,428
Investment activities:
- Investments in buildings, plant, machinery and other goods (1)
- Investments in intangible assets
(4,076) Investments in financial fixed assets (1,983) (4,067)
1 Divestment: buildings, plant, machinery and other goods 1
31,515 Divestment: financial current assets 3 18,589
27,440 Liquidity generated (absorbed) by investment activities (c) (1,981) 14,523
Financial assets:
(49,802) Changes in medium/long term loans 861 132
8,131 Changes in current financial assets - -
(384,858) Changes in other financial debt (384,858)
1,704 Changes in Shareholders’ Equity (sale of treasury shares) 59
(43,971) Dividends (including interim dividends) distributed (17,600) (26,371)
(468,796) Liquidity generated (absorbed) by financial activities (d) (16,739) (411,038)
20,536 Closing cash at bank and in hand and cash equivalent
(a+b+c+d)
15,700 8,962
Supplementary information:
913 Taxes paid during this financial period 279 125
11,633 Financial charges paid during this financial period 4,488 6,951
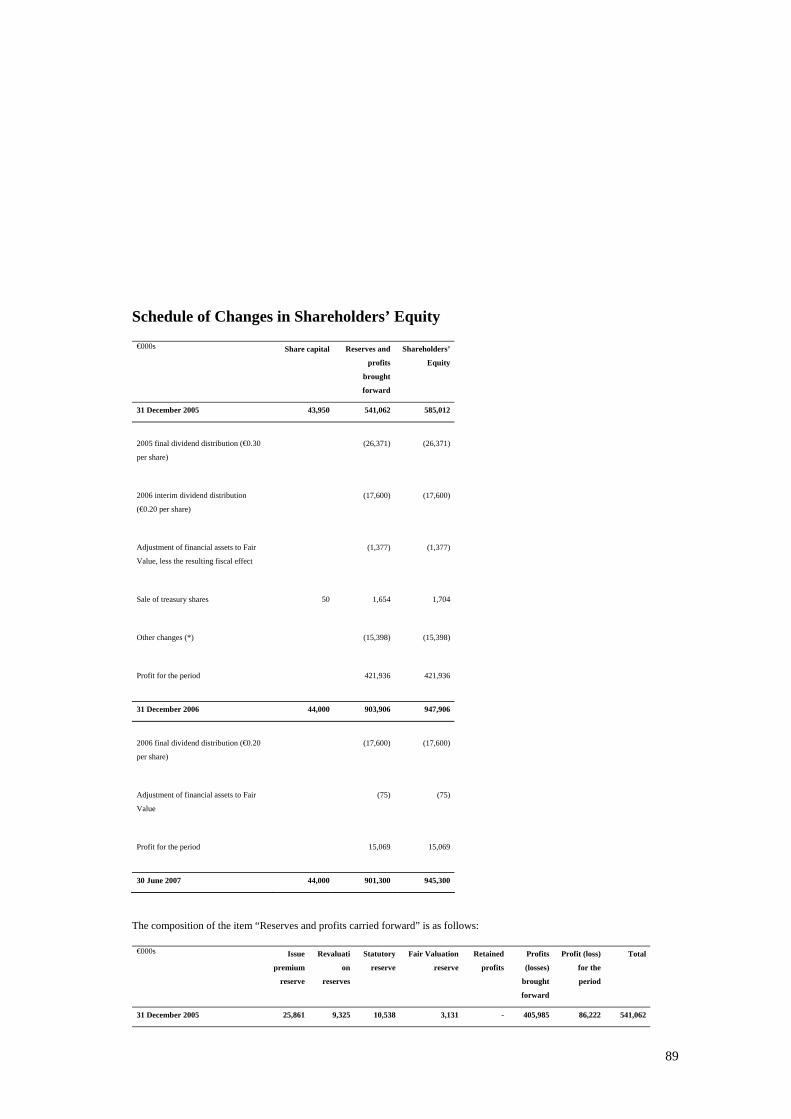
89
Schedule of Changes in Shareholders’ Equity
€000s Share capital Reserves and
profits
brought
forward
Shareholders’
Equity
31 December 2005 43,950 541,062 585,012
2005 final dividend distribution (€0.30
per share)
(26,371) (26,371)
2006 interim dividend distribution
(€0.20 per share)
(17,600) (17,600)
Adjustment of financial assets to Fair
Value, less the resulting fiscal effect
(1,377) (1,377)
Sale of treasury shares 50 1,654 1,704
Other changes (*) (15,398) (15,398)
Profit for the period 421,936 421,936
31 December 2006 44,000 903,906 947,906
2006 final dividend distribution (€0.20
per share)
(17,600) (17,600)
Adjustment of financial assets to Fair
Value
(75) (75)
Profit for the period 15,069 15,069
30 June 2007 44,000 901,300 945,300
The composition of the item “Reserves and profits carried forward” is as follows:
€000s Issue
premium
reserve
Revaluati
on
reserves
Statutory
reserve
Fair Valuation
reserve
Retained
profits
Profits
(losses)
brought
forward
Profit (loss)
for the
period
Total
31 December 2005 25,861 9,325 10,538 3,131 - 405,985 86,222 541,062

90
Allocation of profit(loss) for 2005 59,851 (59,851) -
2005 final dividend distribution
(€0.30 per share)
(26,371) (26,371)
2006 interim dividend distribution
(€0.20 per share)
(17,600) (17,600)
Sale of treasury shares 1,654 1,654
Adjustment of financial assets to Fair
Value
(1,377) (1,377)
Other changes (*) (15,398) (15,398)
Profit for the period 421,936 421,936
31 December 2006 25,861 9,325 10,538 1,754 - 452,092 404,336 903,906
Allocation of profit(loss) for 2006 386,736 (386,736) -
2006 final dividend distribution
(€0.20 per share)
(17,600) (17,600)
Adjustment of financial assets to Fair
Value
(75) (75)
Profit for the period 15,069 15,069
30 June 2007 25,861 9,325 10,538 1,679 - 838,828 15,069 901,300
(*) This refers to taxes set aside in respect of the difference between the book value and the fiscal value of the
shareholding in the subsidiary SATAP SpA

91
Independent Auditor’s Report