Asthma Capitals Report 2015 Rankings
7
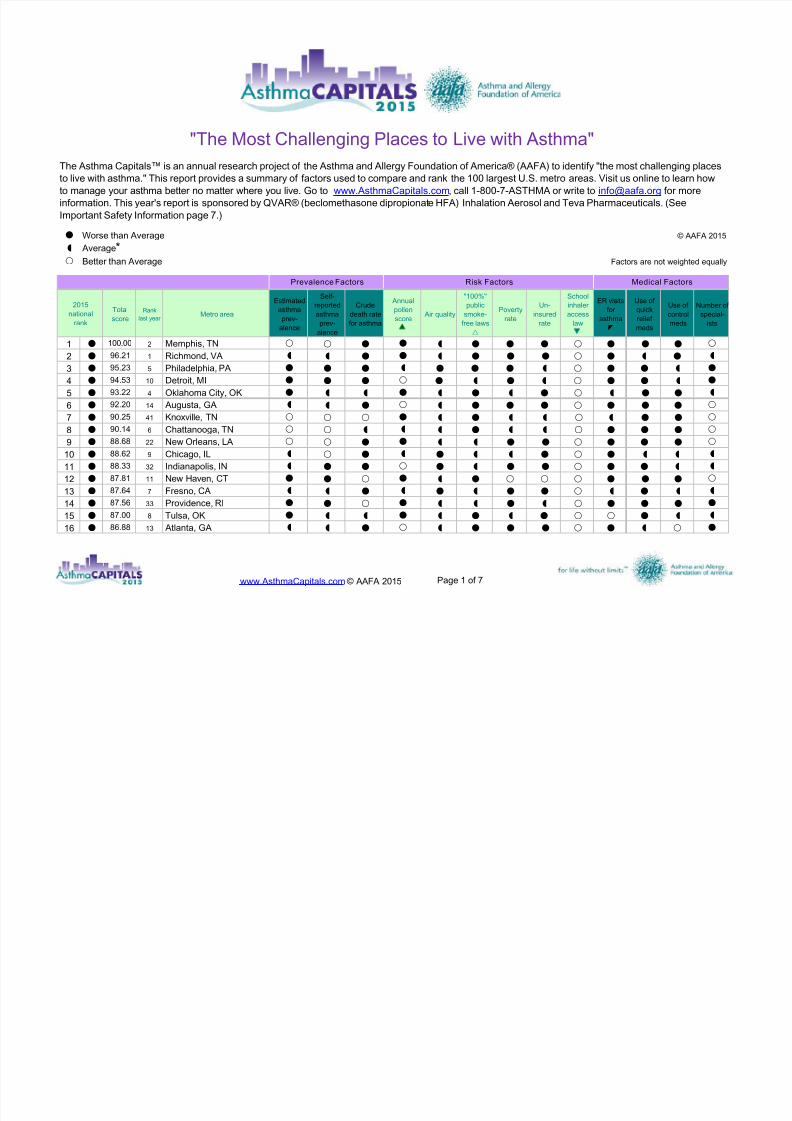
www.AsthmaCapitals.com © AAFA 2015 Page 1 of 7 Total score Rank last year Metro area Estimated asthma prev- alence Self- reported asthma prev- alence Crude death rate for asthma Annual pollen score Air quality "100%" public smoke- free laws Poverty rate Un- insured rate School inhaler access law ER visits for asthma Use of quick relief meds Use of control meds Number of special- ists 1 100.00 2 Memphis, TN 2 96.21 1 Richmond, VA 3 95.23 5 Philadelphia, PA 4 94.53 10 Detroit, MI 5 93.22 4 Oklahoma City, OK 6 92.20 14 Augusta, GA 7 90.25 41 Knoxville, TN 8 90.14 6 Chattanooga, TN 9 88.68 22 New Orleans, LA 10 88.62 9 Chicago, IL 11 88.33 32 Indianapolis, IN 12 87.81 11 New Haven, CT 13 87.64 7 Fresno, CA 14 87.56 33 Providence, RI 15 87.00 8 Tulsa, OK 16 86.88 13 Atlanta, GA © AAFA 2015 Factors are not weighted equally Risk Factors Medical Factors "The Most Challenging Places to Live with Asthma" The Asthma Capitals™ is an annual research project of the Asthma and Allergy Foundation of America® (AAFA) to identify "the most challenging places to live with asthma." This report provides a summary of factors used to compare and rank the 100 largest U.S. metro areas. Visit us online to learn how to manage your asthma better no matter where you live. Go to www.AsthmaCapitals.com, call 1-800-7-ASTHMA or write to [email protected] for more information. This year's report is sponsored by QVAR® (beclomethasone dipropionat e HFA) Inhalation Aerosol and Teva Pharmaceuticals. (See Important Safety Information page 7.) Worse than Average Average* Better than Average Prevalence Factors 2015 national rank
-
Upload
minervastanciu -
Category
Documents
-
view
214 -
download
0
Transcript of Asthma Capitals Report 2015 Rankings
7/25/2019 Asthma Capitals Report 2015 Rankings
http://slidepdf.com/reader/full/asthma-capitals-report-2015-rankings 1/7
www.AsthmaCapitals.com © AAFA 2015 Page 1 of 7
Total
score
Rank
last year Metro area
Estimated
asthma
prev-
alence
Self-
reported
asthma
prev-
alence
Crude
death rate
for asthma
Annual
pollen
score Air quality
"100%"
public
smoke-
free laws
Poverty
rate
Un-
insured
rate
School
inhaler
access
law
ER visits
for
asthma
Use of
quick
relief
meds
Use of
control
meds
Number of
special-
ists
1 100.00 2 Memphis, TN
2 96.21 1 Richmond, VA
3 95.23 5 Philadelphia, PA
4 94.53 10 Detroit, MI
5 93.22 4 Oklahoma City, OK
6 92.20 14 Augusta, GA
7 90.25 41 Knoxville, TN
8 90.14 6 Chattanooga, TN
9 88.68 22 New Orleans, LA
10 88.62 9 Chicago, IL
11 88.33 32 Indianapolis, IN
12 87.81 11 New Haven, CT
13 87.64 7 Fresno, CA
14 87.56 33 Providence, RI
15 87.00 8 Tulsa, OK
16 86.88 13 Atlanta, GA
© AAFA 2015
Factors are not weighted equally
Risk Factors Medical Factors
"The Most Challenging Places to Live with Asthma"The Asthma Capitals™ is an annual research project of the Asthma and Allergy Foundation of America® (AAFA) to identify "the most challenging places
to live with asthma." This report provides a summary of factors used to compare and rank the 100 largest U.S. metro areas. Visit us online to learn how
to manage your asthma better no matter where you live. Go to www.AsthmaCapitals.com, call 1-800-7-ASTHMA or write to [email protected] for more
information. This year's report is sponsored by QVAR® (beclomethasone dipropionate HFA) Inhalation Aerosol and Teva Pharmaceuticals. (See
Important Safety Information page 7.)
Worse than Average
Average*Better than Average
Prevalence Factors
2015
national
rank

7/25/2019 Asthma Capitals Report 2015 Rankings
http://slidepdf.com/reader/full/asthma-capitals-report-2015-rankings 2/7
www.AsthmaCapitals.com © AAFA 2015 Page 2 of 7
Total
score
Rank
last year Metro area
Estimated
asthma
prev-
alence
Self-
reported
asthma
prev-
alence
Crude
death rate
for asthma
Annual
pollen
score Air quality
"100%"
public
smoke-
free laws
Poverty
rate
Un-
insured
rate
School
inhaler
access
law
ER visits
for
asthma
Use of
quick
relief
meds
Use of
control
meds
Number of
special-
ists
17 86.83 3 McAllen, TX
18 86.79 21 Dayton, OH
19 86.63 12 Allentown, PA
20 86.58 23 Cleveland, OH
21 86.15 16 Louisville, KY
22 86.09 19 Milwaukee, WI
23 85.87 18 Springfield, MA
24 85.07 25 Toledo, OH
25 84.97 20 Jacksonville, FL
26 84.64 26 St. Louis, MO
27 84.59 15 Pittsburgh, PA
28 84.58 27 Little Rock, AR
29 84.47 38 Nashville, TN
30 84.20 42 Jackson, MS
31 83.45 31 Akron, OH
32 83.14 35 Wichita, KS
33 82.66 39 Hartford, CT
34 82.44 34 Cincinnati, OH
35 82.34 61 New York, NY
36 80.98 28 Bridgeport, CT
37 80.92 17 Bakersfield, CA
38 80.84 45 Youngstown, OH
39 79.83 43 Dallas, TX
40 79.79 54 Las Vegas, NV
41 79.52 47 Scranton, PA 42 79.51 24 Stockton, CA
43 79.08 37 Harrisburg, PA
44 78.75 48 Birmingham, AL
45 78.61 30 El Paso, TX
46 77.22 40 Phoenix, AZ
47 77.04 85 Albuquerque, NM
48 76.65 51 Washington, DC
49 76.64 46 Columbus, OH
50 76.57 29 Riverside, CA
Medical FactorsPrevalence Factors Risk Factors
2015
national
rank
7/25/2019 Asthma Capitals Report 2015 Rankings
http://slidepdf.com/reader/full/asthma-capitals-report-2015-rankings 3/7
www.AsthmaCapitals.com © AAFA 2015 Page 3 of 7
Total
score
Rank
last year Metro area
Estimated
asthma
prev-
alence
Self-
reported
asthma
prev-
alence
Crude
death rate
for asthma
Annual
pollen
score Air quality
"100%"
public
smoke-
free laws
Poverty
rate
Un-
insured
rate
School
inhaler
access
law
ER visits
for
asthma
Use of
quick
relief
meds
Use of
control
meds
Number of
special-
ists
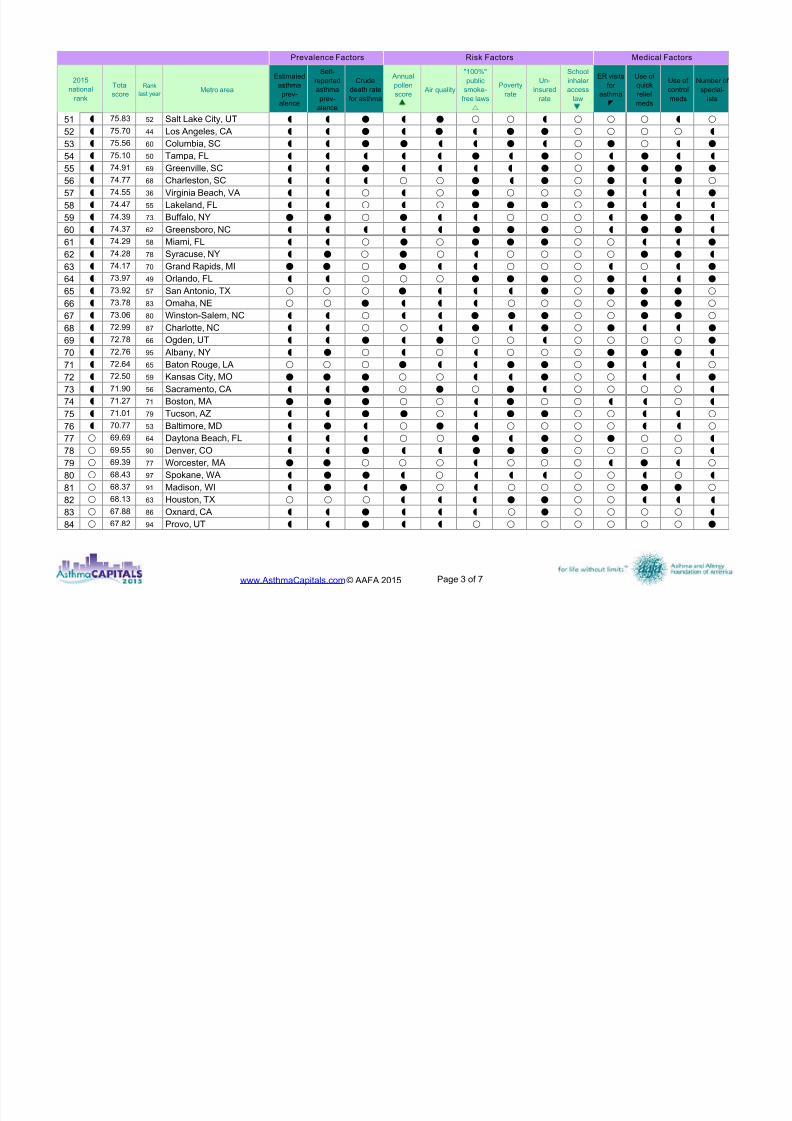
51 75.83 52 Salt Lake City, UT
52 75.70 44 Los Angeles, CA
53 75.56 60 Columbia, SC
54 75.10 50 Tampa, FL
55 74.91 69 Greenville, SC
56 74.77 68 Charleston, SC
57 74.55 36 Virginia Beach, VA
58 74.47 55 Lakeland, FL
59 74.39 73 Buffalo, NY
60 74.37 62 Greensboro, NC
61 74.29 58 Miami, FL
62 74.28 78 Syracuse, NY
63 74.17 70 Grand Rapids, MI
64 73.97 49 Orlando, FL
65 73.92 57 San Antonio, TX
66 73.78 83 Omaha, NE
67 73.06 80 Winston-Salem, NC
68 72.99 87 Charlotte, NC
69 72.78 66 Ogden, UT
70 72.76 95 Albany, NY
71 72.64 65 Baton Rouge, LA
72 72.50 59 Kansas City, MO
73 71.90 56 Sacramento, CA
74 71.27 71 Boston, MA
75 71.01 79 Tucson, AZ 76 70.77 53 Baltimore, MD
77 69.69 64 Daytona Beach, FL
78 69.55 90 Denver, CO
79 69.39 77 Worcester, MA
80 68.43 97 Spokane, WA
81 68.37 91 Madison, WI
82 68.13 63 Houston, TX
83 67.88 86 Oxnard, CA
84 67.82 94 Provo, UT
2015
national
rank
Medical FactorsPrevalence Factors Risk Factors
7/25/2019 Asthma Capitals Report 2015 Rankings
http://slidepdf.com/reader/full/asthma-capitals-report-2015-rankings 4/7
www.AsthmaCapitals.com © AAFA 2015 Page 4 of 7
Total
score
Rank
last year Metro area
Estimated
asthma
prev-
alence
Self-
reported
asthma
prev-
alence
Crude
death rate
for asthma
Annual
pollen
score Air quality
"100%"
public
smoke-
free laws
Poverty
rate
Un-
insured
rate
School
inhaler
access
law
ER visits
for
asthma
Use of
quick
relief
meds
Use of
control
meds
Number of
special-
ists
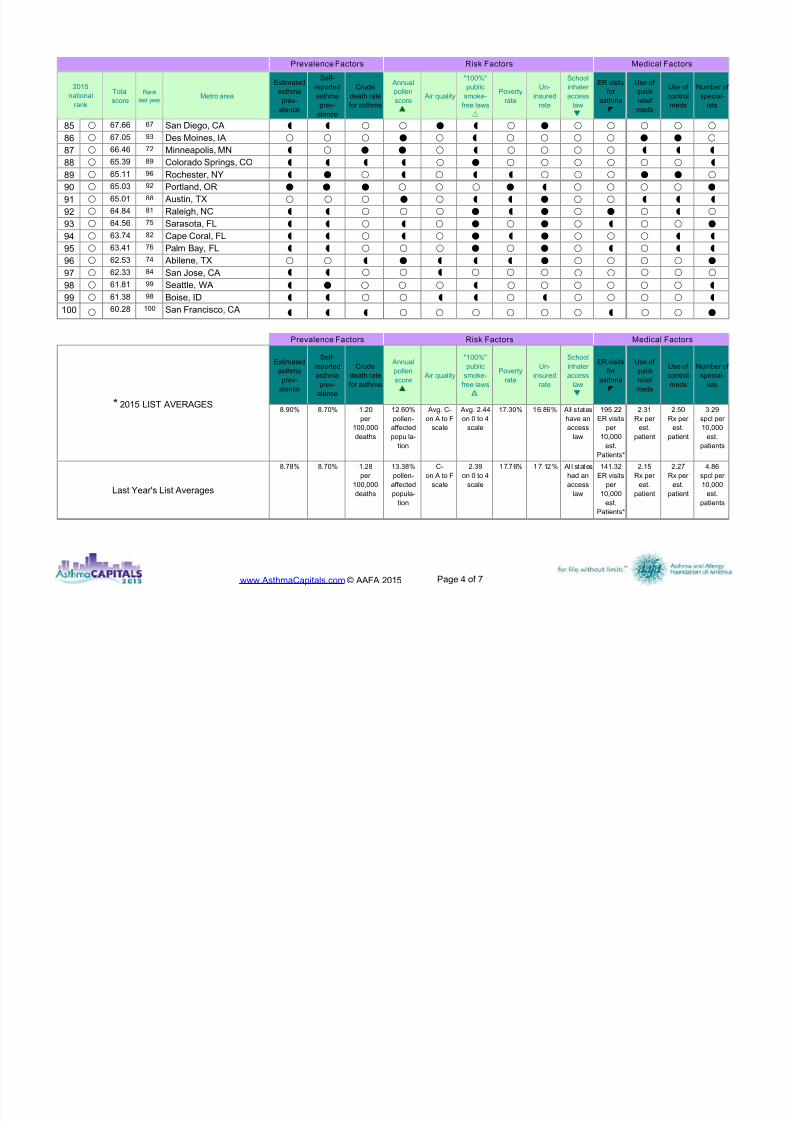
85 67.66 67 San Diego, CA
86 67.05 93 Des Moines, IA 87 66.46 72 Minneapolis, MN
88 65.39 89 Colorado Springs, CO
89 65.11 96 Rochester, NY
90 65.03 92 Portland, OR
91 65.01 88 Austin, TX
92 64.84 81 Raleigh, NC
93 64.56 75 Sarasota, FL
94 63.74 82 Cape Coral, FL
95 63.41 76 Palm Bay, FL
96 62.53 74 Abilene, TX
97
62.3384
San Jose, CA
98 61.81 99 Seattle, WA
99 61.38 98 Boise, ID
100 60.28 100 San Francisco, CA
Estimated
asthma
prev-
alence
Self-
reported
asthma
prev-
alence
Crude
death rate
for asthma
Annual
pollen
score Air quality
"100%"
public
smoke-
free laws
Poverty
rate
Un-
insured
rate
School
inhaler
access
law
ER visits
for
asthma
Use of
quick
relief
meds
Use of
control
meds
Number of
special-
ists
8.78% 8.70% 1.28
per
100,000
deaths
13.38%
pollen-
affected
popula-
tion
C-
on A to F
scale
2.39
on 0 to 4
scale
17.76% 17.12% Al l states
had an
access
law
141.32
ER visits
per
10,000
est.
Patients*
2.15
Rx per
est.
patient
2.27
Rx per
est.
patient
4.86
spcl per
10,000
est.
patients
Prevalence Factors Risk Factors Medical Factors
3.29
spcl per
10,000
est.
patients
195.22
ER visits
per
10,000
est.
Patients*
Last Year's List Averages
Avg. 2.44
on 0 to 4
scale
17.30%
2015
national
rank
Prevalence Factors
16.86% All states
have an
access
law
Medical FactorsRisk Factors
2.31
Rx per
est.
patient
2.50
Rx per
est.
patient
* 2015 LIST AVERAGES8.90% 8.70% 1.20
per
100,000
deaths
12.60%
pollen-
affected
popu la-
tion
Avg. C-
on A to F
scale

7/25/2019 Asthma Capitals Report 2015 Rankings
http://slidepdf.com/reader/full/asthma-capitals-report-2015-rankings 5/7
www.AsthmaCapitals.com © AAFA 2015 Page 5 of 7
Total
Score
2015
national
rank
Metro area
Estimated
asthma
prev-
alence
Self-
reported
asthma
prev-
alence
Crude
death rate
for asthma
Annual
pollen
score Air quality
"100%"
public
smoke-
free laws
Poverty
rate
Un-
insured
rate
School
inhaler
access
law
ER visits
for
asthma
Use of
quick
relief
meds
Use of
control
meds
Number of
special-
ists
1 94.53 4 Detroit, MI
2 88.62 10 Chicago, IL
3 88.3311
Indianapolis, IN 4 86.79 18 Dayton, OH
5 86.58 20 Cleveland, OH
Total
Score
2015
national
rank
Metro area
1 95.23 3 Philadelphia, PA
2 87.81 12 New Haven, CT
3 87.56 14 Providence, RI
4 86.63 19 Allentown, PA
5 85.87 23 Springfield, MA
Total
Score
2015
nationa
l rank
Metro area
1 100.00 1 Memphis, TN
2 96.21 2 Richmond, VA
3 93.22 5 Oklahoma City, OK
4 92.20 6 Augusta, GA
5 90.25 7 Knoxville, TN
Total
Score
2015
national
rank
Metro area
1 87.64 13 Fresno, CA
2 80.92 37 Bakersfield, CA
3 79.79 40 Las Vegas, NV
4 79.51 42 Stockton, CA
5 77.22 46 Phoenix, AZ
Prevalence Factors Risk Factors Medical Factors
2015
regional
rank
2015
regional
rank
Northeast
South
West
2015
regional
rank
2015
regional
rank
Midwest
REGIONAL RANKINGS (Top-5)

7/25/2019 Asthma Capitals Report 2015 Rankings
http://slidepdf.com/reader/full/asthma-capitals-report-2015-rankings 6/7
www.AsthmaCapitals.com © AAFA 2015 Page 6 of 7
2015 Asthma Capitals™ Methodology
The U.S. Asthma Capitals™ research and ranking is reported annually by the Asthma and Allergy Foundation of America® (AAFA). The ranking is based on analysis of
data from the 100 most-populated Consolidated Metropolitan Statistical Areas (MSAs) in the U.S. including 13 individual factors grouped into three primary areas: (I)
Prevalence Factors, (II) Risk Factors and (III) Medical Factors. Weights are applied to each set of data in each factor group by researchers and medical specialists,
reflecting each factor’s relative effect on the quality of life for people with asthma. Factors are not equally weighted. Total scores are calculated as a composite of all
factors, and cities are ranked from highest total score (city rank #1) to lowest total score (city rank #100).
(I) PREVALENCE FACTORS – Quantitative data including morbidity statistics f rom the most recently available sources of estimated asthma prevalence, self-reported
prevalence and crude death rates for asthma.
*Estimated Prevalence for Asthma – predicted population with asthma (adult and pediatric)
*Self-Reported Prevalence for Asthma – self-reported population with asthma (adult, state-level only)
*Crude Death Rate from Asthma – recorded metro area death rates f rom asthma (adult and pediatric)
(II) RISK FACTORS – Qualitative and quantitative data from the most recently available sources of comprehensive annual pollen measurements, average length of
peak pollen seasons, outdoor air quality (including number of ozone days and annual levels of pollution particulate matter [pm]), poverty rates, uninsured rates, state
school inhaler access laws and primary MSA city/county/state laws prohibiting smoking in public places (including workplaces, restaurants, bars and/or cars with
minors).
*Annual Pollen Score – reported “Pollen Score” for each metro area
*Annual Air Quality – pollution levels and number of unhealthy outdoor ozone days, scored on a scale of: A (best) to F (worst)
*Public Smoking Laws – number of "100% smoke-free" public smoking bans (bars, restaurants, workplaces and/or cars with minors) *Poverty Rate – reported percent of metro area population in poverty
*Uninsured Rate – reported percent of metro area population without health insurance
*School Inhaler Access Laws – state laws ensuring student access to inhalers
(III) MEDICAL FACTORS – Quantitative data from the most recently available sources in the 100 most populated U.S. cities for the number of ER visits for asthma per
10,000 patients, number of asthma rescue and controller medication prescriptions per patient, and the number of adult and pediatric specialists per 10,000 patients with
their primary Board Certification in allergy & immunology and/or pulmonary medicine.
*ER Visits for Asthma – number of out-patient plus in-patient Medicare and non-Medicare emergency room visits for asthma per patient
*Rescue Medication Use – number of rescue medication prescriptions per patient prevalence
*Controller Medication Use – number of controller medication prescriptions per patient prevalence
*Number of Asthma Specialists – number of Board Certified adult/pediatric allergists/immunologists and pulmonologists per patient
Pollen Score is a comprehensive index of the population at risk of being affected by airborne allergenic pollen ("pollen-affected population") derived from actual
pollen counts, allergy prevalence for each pollen type and related factors. Public smoke-free laws recognized by this report are "100%" public bans only; partial
public smoking bans or bans with exceptions are not included. State school inhaler access laws recognized by this report refer to states having a single state-wide
law protecting students' rights to carry and access asthma medications at school.
7/25/2019 Asthma Capitals Report 2015 Rankings
http://slidepdf.com/reader/full/asthma-capitals-report-2015-rankings 7/7
www.AsthmaCapitals.com © AAFA 2015 Page 7 of 7
Abo ut QVA R ®
QVAR® (beclomethasone dipropionate HFA) Inhalation Aerosol is used in the ongoing treatment of asthma as preventative therapy in patients five years of age or older. QVAR is also used
for asthma patients who require systemic corticosteroid administration, where adding QVAR may reduce or eliminate the need for systemic corticosteroids.
You are encouraged to report negative side effects of prescription drugs to the FDA. Visit www.fda.gov/medwatch , or call 1-800-FDA-1088.
• The most common side effects of QVAR include: headache, throat irritation, and sinus irritation.
Please see full Prescribing Inform ation www.qvar.com/PI
Sources: Most Current Available Local-Level Data Used fo r the 2015 Asthma Capitals™
Decennial U.S. Census 2000, U.S. Department of Commerce, Census Bureau, and 2014 Population Estimate Updates
National Annual Pollen Index Measurements and Reports, IMS Health Inc., Pollen.com Database, 2014
Local Tobacco Control Ordinance Database, American Nonsmokers’ Rights Foundation, 2015
AAFA's Annual State Honor Roll of Asthma and Allergy School Policies, 2014
National Prescription Tracking Database, IMS Health Inc., 2014
National Medical Specialist Database, American Board of Medical Specialties, 2015
Small Area Income & Poverty Estimates, U.S. Department of Commerce, Economics and Statistics Administration, 2013
Small Area Health Insurance Estimates, U.S. Department of Commerce, Economics and Statistics Administration, 2013
Mortality Statistics Database, U.S. Centers for Disease Control and Prevention, CDC Wonder, 1999-2013National Health Interview Survey (NHIS), U.S. Centers for Disease Control and Prevention, 2013
National Center for Health Statistics, Behavioral Risk Factor Surveillance System (BRFSS), "Adult Self-Reported Current Asthma Prevalence Rate,” 2012
Air Quality System (AQS) Air Quality and Ozone Data, U.S. Environmental Protection Agency, 2010-2012
CMS Hospital Outpatient Prospective Payment System (OPPS) and Provider of Service Files, 2013
CMS MEDPAR Hospital (National), 2013
Thompson Reuters Medicare Database, 2013
American Hospital Association Annual Survey Database, 2014
Boston Scientific Master Hospital List, 2014 e
(AAFA thanks Boston Scientific for their in-kind donation of asthma ER data for this annual report)
© 2015-AAFA - Neither this report nor its contents may be reproduced or used for commercial purposes without permission, Updated 5/4/15
o Fungal infections (thrush). Tell your healthcare provider if you have any redness or white-colored patches in your mouth or throat. Rinse your mouth after using QVAR to help
prevent an infection in your mouth or throat
o Worsening asthma or sudden asthma attacks. After using your rescue inhaler, contact your healthcare provider right away if you do not get relief from your sudden asthma attacks
o Decreased adrenal function. This potentially life-threatening condition can happen when you stop taking oral corticosteroid medicines and start using QVAR. Tell your healthcare
provider right away about any symptoms such as: tiredness, weakness, nausea and vomiting, and dizziness or faintness
o Immune system effects or infection. Tell your healthcare provider about any signs or symptoms, such as: fever, pain, body aches, chills, feeling tired, nausea, or vomiting
o Increased wheezing right after QVAR use. Always have a rescue inhaler with you to treat sudden wheezingo Serious allergic reactions. Stop using QVAR and call your healthcare provider or get emergency medical help right away if you get any of the following: hives; swelling of your lips,
tongue, or face; rash; or breathing problems
o Slowed growth in children. Children should have their growth checked regularly while using QVAR
o Lower bone density. This may be a problem for people who already have a higher chance for this condition
o Eye problems. If you have had glaucoma or cataracts in the past, you should have regular eye exams while using QVAR
Important Safety Information
• QVAR® does not replace quick-relief inhalers for sudden symptoms
• Do not use QVAR if you are allergic to beclomethasone dipropionate or any of the ingredients in QVAR.
• Do not use QVAR more often than it is prescribed. Do not stop taking QVAR abruptly without talking to your healthcare provider.
• QVAR may cause serious side effects, including: