A*STAR F d d IEDS P j tA*STAR Funded IEDS...
38
A*STAR F d d IEDS P j t A*STAR Funded IEDS Project Microgrid Energy Management Systems presented by PI: H B Gooi Co-PIs: PL So, FL Luo and DM Vilathgamuwa School of Electrical & Electronic Engineering School of Electrical & Electronic Engineering Nanyang Technological University, Singapore 3 June 2010
Transcript of A*STAR F d d IEDS P j tA*STAR Funded IEDS...

A*STAR F d d IEDS P j tA*STAR Funded IEDS Project Microgrid Energy Management Systems
presented by
PI: H B GooiCo-PIs: PL So, FL Luo and DM Vilathgamuwa School of Electrical & Electronic EngineeringSchool of Electrical & Electronic Engineering Nanyang Technological University, Singapore
3 June 2010
Outline
● Introduction
● Proposed Microgrid Energy Management Systems (MEMS)(MEMS)
● MEMS at Lab for Clean Energy Research (LaCER), gy ( ),NTU
● Future Project Direction

MEMSMEMS–– All loads in district are All loads in district are
aggregatedaggregatedaggregated aggregated –– Renewable and Renewable and
traditional generation traditional generation systems CHP CCHPsystems CHP CCHPsystems CHP, CCHPsystems CHP, CCHP
–– Central control of heat Central control of heat and air conditioningand air conditioningMEMS would collectMEMS would collect–– MEMS would collect MEMS would collect data and make data and make decisions for control & decisions for control & optimizationoptimizationoptimizationoptimization

What MEMS can offer?What MEMS can offer?Features
– The MEMS will be responsible for decisionsThe MEMS will be responsible for decisions• When to commit and dispatch each generator• When to store energy • P h d l ith t t k• Purchase and sale with upstream networks • Manage load priority and security of microgrid
– Incorporate renewable sources and control DERs– Combine electricity, hot water and air conditioner (district
cooling) loads – Handle offers/bids submitted by DGs and price responsive y p p
elastic loads – Participate in the wholesale energy and reserve market.
Advantages of MEMSAdvantages of MEMS
– Open up scope for new services and new opportunitiesp p p pp– Improve energy efficiency as a single entity– Potential thermal energy utilization – Responsive to changes in market – Power management at district (distribution) level – Process optimization and improve reliability– Could offer islanding operation and enhance power
qualityquality
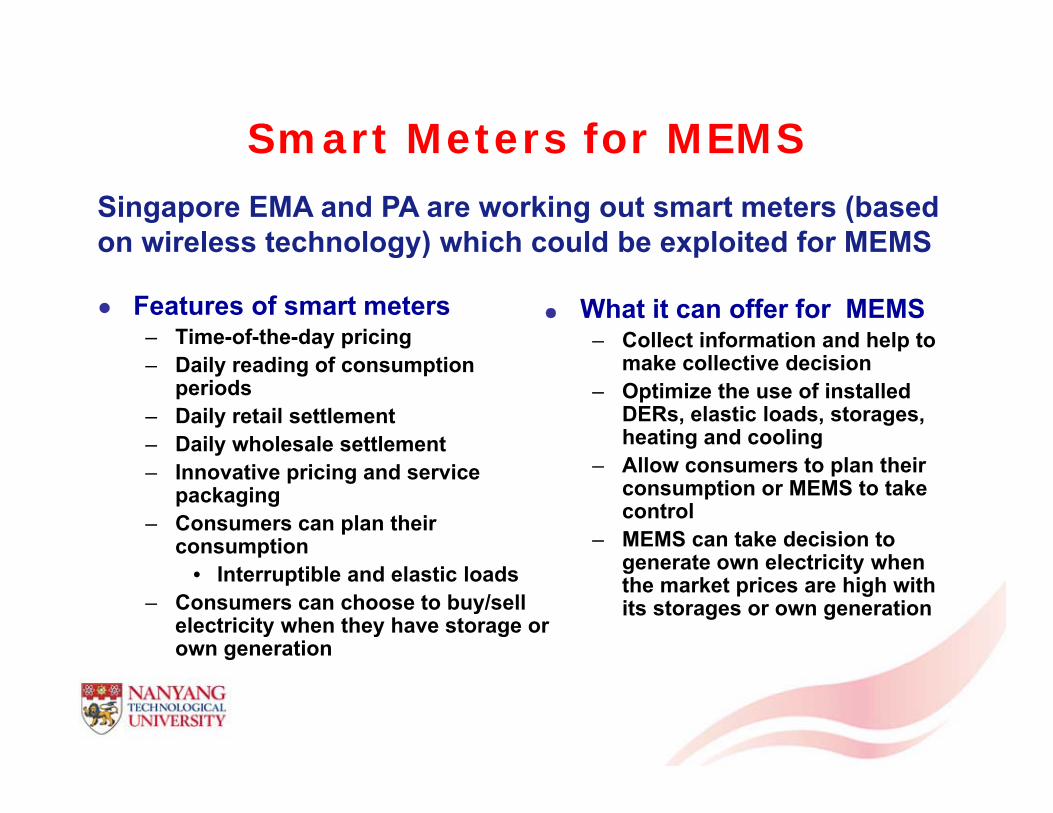
Smart Meters for MEMSSmart Meters for MEMSSingapore EMA and PA are working out smart meters (based on wireless technology) which could be exploited for MEMS
● Features of smart meters– Time-of-the-day pricing
● What it can offer for MEMS– Collect information and help to
k ll ti d i i
gy) p
– Daily reading of consumption periods
– Daily retail settlement– Daily wholesale settlement
make collective decision– Optimize the use of installed
DERs, elastic loads, storages, heating and cooling All t l th i– Innovative pricing and service
packaging– Consumers can plan their
consumption
– Allow consumers to plan their consumption or MEMS to take control
– MEMS can take decision to generate own electricity when• Interruptible and elastic loads
– Consumers can choose to buy/sell electricity when they have storage or own generation
generate own electricity when the market prices are high with its storages or own generation

A*STAR Funded Intelligent Energy Distribution System (IEDS) Projects at
NTU● Power Converter & Grid Architectural Design for Future
Intelligent Energy Distribution Networks (S$0.96 million), PI: Andrew Loh.
● Microgrid Energy Management System (S1.32 million), PI: Gooi HB.
● Open Architecture for Intelligent Power Quality Monitoring &● Open Architecture for Intelligent Power Quality Monitoring & Evaluation System (S$0.6 million), PI: Choi SS.
● Intelligent Trading/Metering/Billing System for Future Smart Distribution System (S$0 48 million) PI: Wang PDistribution System (S$0.48 million), PI: Wang P.
Total Grant is S$3.36 million.

MEMS OBJECTIVESMEMS OBJECTIVES To design software algorithms and control schemes for
minimizing schedule cost or maximizing revenue of MEMS while ensuring its secure operation.
Economic aspect: Predict total customer loads and perform economic scheduling of distributed energy resources (DERs).
Security aspect: Monitor & control MEMS. To design hardware controllers and demonstrate how proposed
prototype can coordinate and schedule one or more DERs and price-sensitive loads.
To develop a web-based GUI and incorporate sensing and communication devices for interfacing with local DERs and loads, distribution networks and market operators.
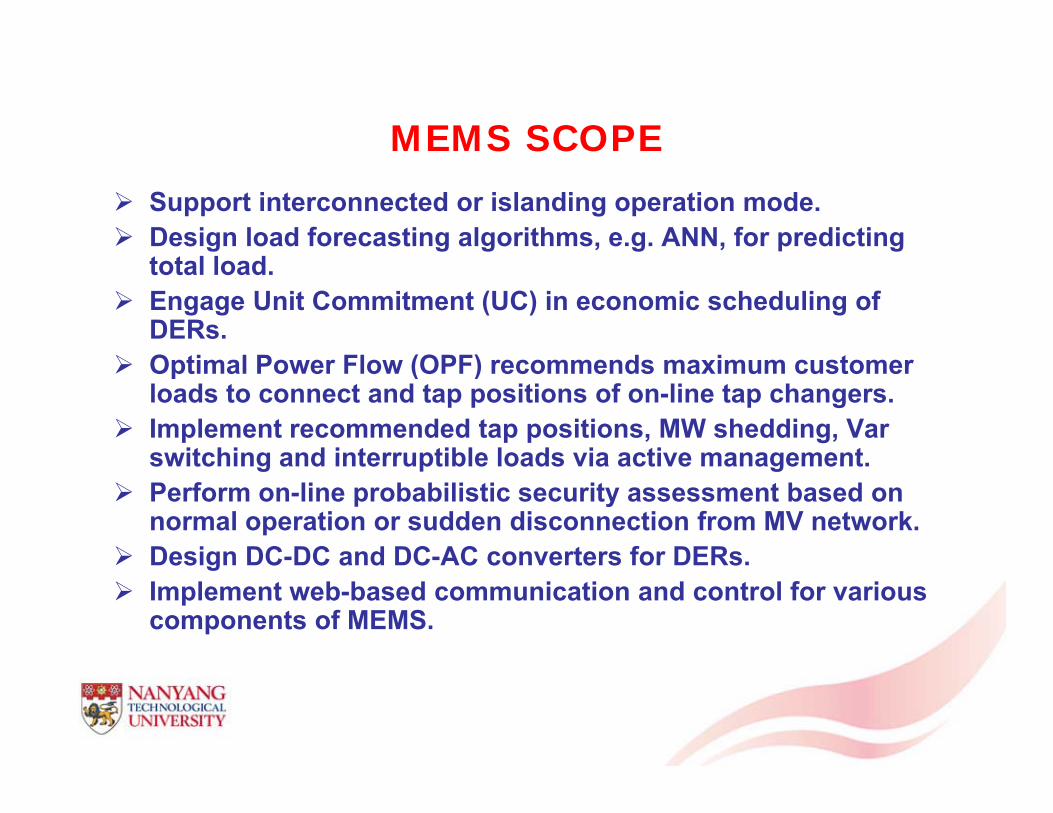
MEMS SCOPEMEMS SCOPE Support interconnected or islanding operation mode. Design load forecasting algorithms, e.g. ANN, for predicting
total load. Engage Unit Commitment (UC) in economic scheduling of
DERs. O ti l P Fl (OPF) d i t Optimal Power Flow (OPF) recommends maximum customer
loads to connect and tap positions of on-line tap changers. Implement recommended tap positions, MW shedding, Var
switching and interruptible loads via active managementswitching and interruptible loads via active management. Perform on-line probabilistic security assessment based on
normal operation or sudden disconnection from MV network. Design DC-DC and DC-AC converters for DERs Design DC DC and DC AC converters for DERs. Implement web-based communication and control for various
components of MEMS.
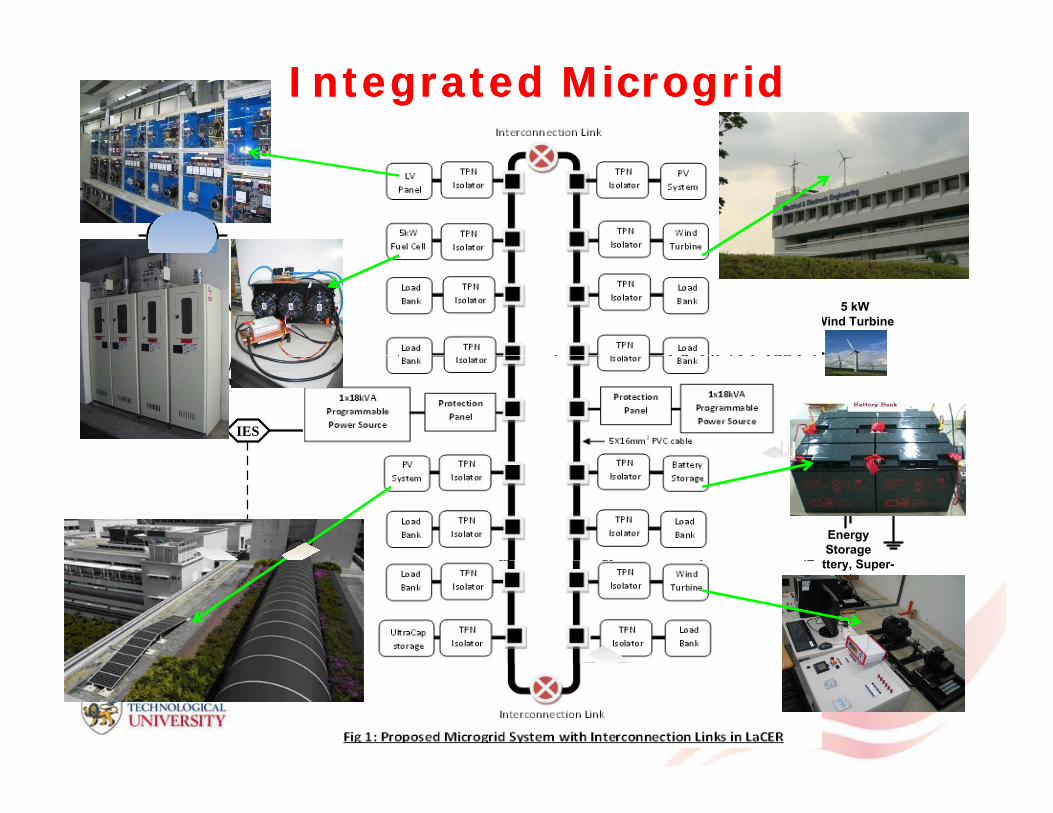
Integrated MicrogridIntegrated Microgrid
DC
ACDSO
HDB Housing Load
ConverterMV: Medium Voltage
5 kWp PV
DSO: Distribution System Operator
MEMS: Microgrid Energy Management System
IES: Intelligent Energy Sensor
SM: Smart Meter
IES
IES
SM
1 MVA
LV: Low Voltage
MV
LV
Circuit BreakerConverter
5 kWWind Turbine
DCAC
IES
IES
SM
IES22/0.4 kV
Transformer
IndustrialLoad
IESAC Grid: 3-phase 400V
DCAC
DCAC
IES
EnergyStorage
(B tt S
IES
Converter
IES
DCAC
`SM
CommercialLoad
(Battery, Super-Capacitor or
Flywheel)
MEMSConverter
Load5 kW
Fuel Cell© School of EEE, NTU, 2008
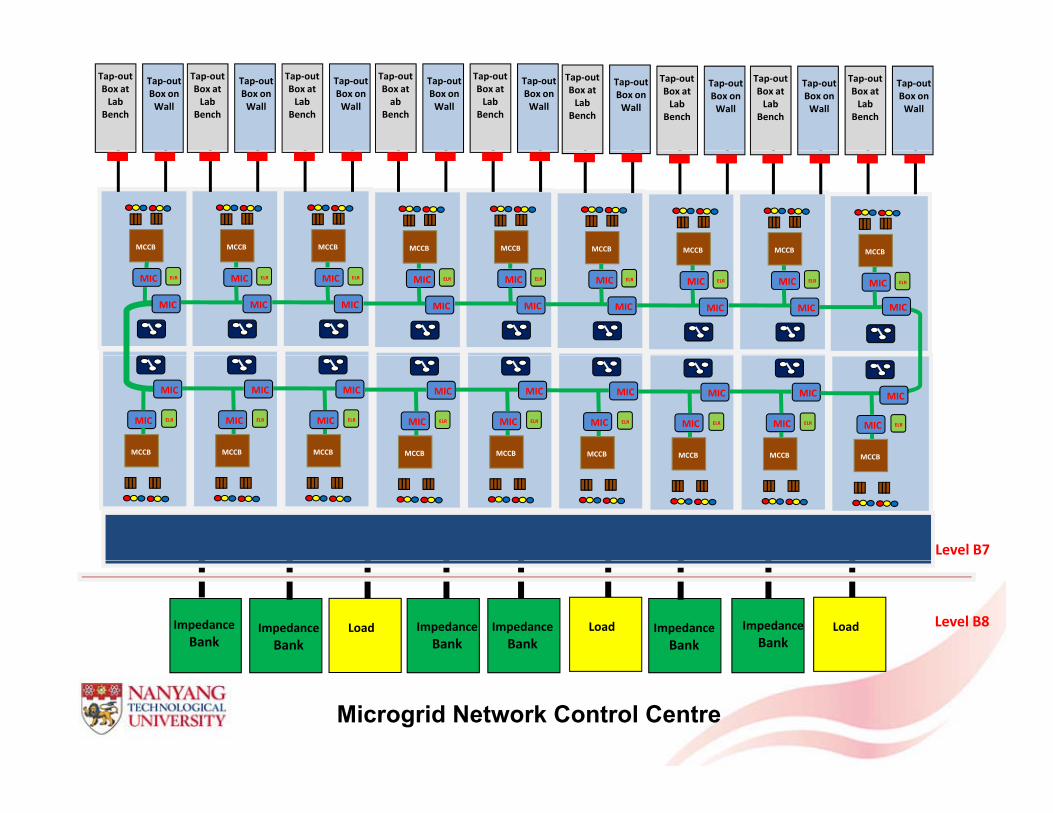
Tap‐out Box at ab
Bench
Tap‐out Box on Wall
Tap‐out Box at Lab
Bench
Tap‐out Box on Wall
Tap‐out Box at Lab
Bench
Tap‐out Box on Wall
Tap‐out Box at Lab
Bench
Tap‐out Box on Wall
Tap‐out Box at Lab
Bench
Tap‐out Box on Wall
Tap‐out Box at Lab
Bench
Tap‐out Box on Wall
Tap‐out Box at Lab
Bench
Tap‐out Box on Wall
Tap‐out Box at Lab
Bench
Tap‐out Box on Wall
Tap‐out Box at Lab
Bench
Tap‐out Box on Wall
MCCB MCCB MCCB MCCB MCCB MCCB MCCB MCCB MCCB
MIC ELR
MIC
MIC ELR
MIC
MIC ELR
MIC
MIC ELR
MIC
MIC ELR
MIC
MIC ELR
MIC
MIC ELR
MIC
MIC ELR
MIC
MIC
MCCB
ELR
MIC
MIC
MCCB
ELR
MIC
MIC
MCCB
ELR
MIC
MIC
MCCB
ELR
MIC
MIC
MCCB
ELR
MIC
MIC
MCCB
ELR
MIC
MIC
MCCB
ELR
MIC
MIC
MCCB
ELR
MIC
MIC
MCCB
ELR
MIC
MIC
MCCB
ELR
MIC
MCCB
Level B7
Level B8ImpedanceBank
ImpedanceBank
ImpedanceBank
ImpedanceBank
ImpedanceBank
ImpedanceBank
LoadLoadLoad
Microgrid Network Control Centre
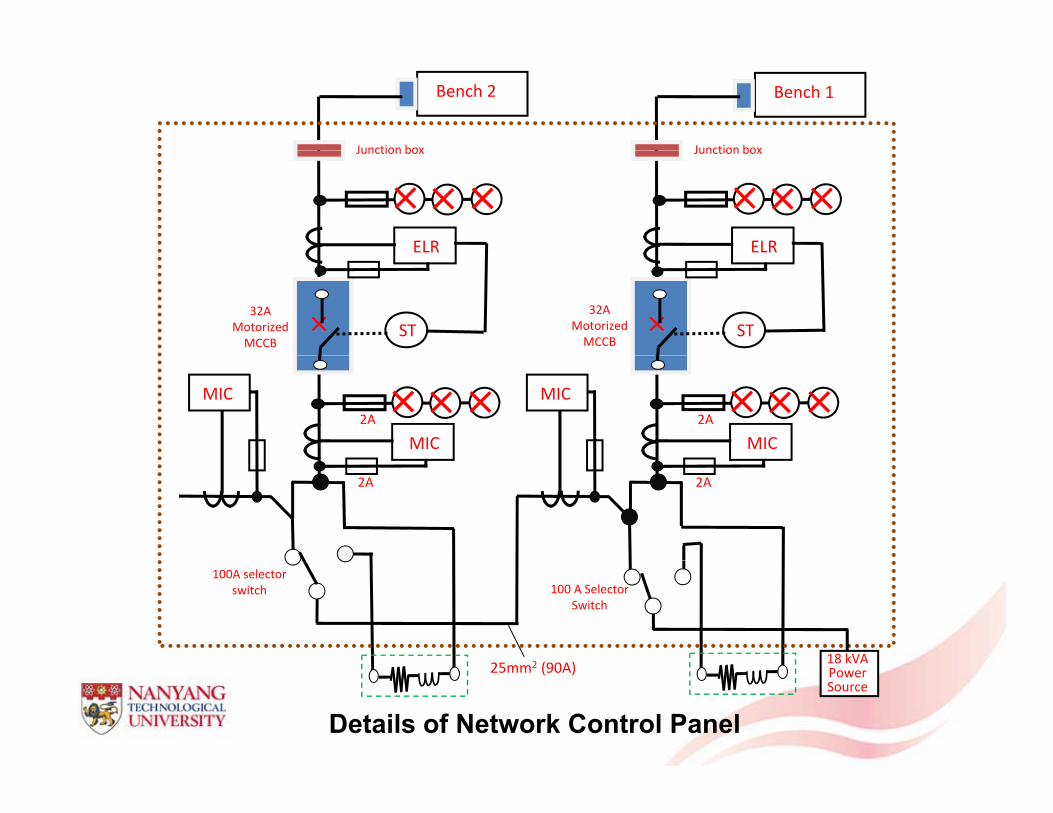
Bench 2
Junction box
Bench 1
Junction box
ELR
Junction box
ELR
Junction box
ST 32A Motorized MCCB
ST32A
Motorized MCCB
MIC
MIC2A
MIC
MIC2A
2A 2A
100 A Selector Switch
100A selector switch
25 2 (90A) 18 kVA25mm2 (90A) 18 kVAPowerSource
Details of Network Control Panel

Microgrid Network Control PanelDesigned network control board is tested and commissioned at Laboratory for Clean Energy Research (LaCER).
R Y B R Y B R Y B R Y B R Y B R Y B
LV Panel
Power Grid
Inductor Load Bank
Resistive Load Bank
Battery Energy Storgae
AC
Ultra‐Cap Storage
5kWFuel Cell
DCACDC
AC
30 kW Micro Turbine
Ai205
R Y B
R Y B
Ai205
R Y B
R Y B
Ai205
R Y B
R Y B
Ai205
R Y B
R Y B
Ai205
R Y B
R Y B
Ai205
R Y B
R Y B
Ai205
SYN
Power Grid
R Y B
32A TP MCB
40A 4P RCCB
R Y B
32A TP MCB
40A 4P RCCB
R Y B
63A TP MCB
63A 4P RCCB
R Y B
63A TP MCB
63A 4P RCCB
R Y B
32A TP MCB
40A 4P RCCB
R Y B
32A TP MCB
40A 4P RCCB
40A Motorized MCCB
40A Motorized MCCB
63A TPN Motorized MCCB
63A TPN Motorized MCCB
40A TPN Motorized MCCB
40A TPN Motorized MCCB
3 nos. 30/5A CT Ai205
3 nos. 30/5A CT Ai205
3 nos. 60/5A CT Ai205 3 nos.
60/5A CT Ai205 3 nos. 30/5A CT Ai205
3 nos. 30/5A CT Ai205
2 mH
2 mH
2 mH
2 mH
2 mH
2 mH
2 mH
2 mH
2 mH
2 mH
2 mH
2 mH
2 mH
2 mH
2 mH
2 mH
2 mH
2 mH
OC & EF
R Y B
ST
Power Grid
PMU7560
R Y B
100A TPN MotorizedMCCB
4 nos. 100/5A CT
3 nos. 100/5A CT
3 nos. 100/5A CT
3 nos. 100/5A CT
3 nos. 100/5A CT
3 nos. 100/5A CT
3 nos. 100/5A CT
3 nos. 100/5A CT
100A TPN Motorized MCCB
3 nos. 100/5A CT
2 mH
2 mH
2 mH
60 kVAIsolating
transformer
R Y B
R Y B
7.5 kW Wind Simulator
ACDC
DCAC
7.5 kW Wind Simulator
ACDC
DCAC
PV System
DCAC
Battery Storage sytsem
2.4 kW Wind Turbine
Resistive Load Bank
Ai205
R Y B
R Y B
Ai205
R Y B
R Y B
3 nos. 100/5A CT
3 nos. 100/5A CT
100A TPN Motorized MCCB
100A TPN Motorized MCCB
2 mH
2 mH
2 mH
AC Mircogrid in Water & Energy
Research Laboratory
Ai2053 nos. 100/5A CT
R Y BR Y B R Y B R Y BR Y B R Y B18 kVA Programmable
Ai205
R Y B
R Y B
ST
OC & EF
18 kVA Programmable
PMU7560
R Y B
R Y B
ST
OC & EF
R Y B
R Y B
32A TP MCB
40A 4P RCCB
R Y B
R Y B
32A TP MCB
40A 4P RCCB
R Y B
R Y B
63A TP MCB
63A 4P RCCB
R Y B
R Y B
32A TP MCB
40A 4P RCCB
R Y B
R Y B
32A TP MCB
40A 4P RCCB
R Y B
R Y B
32A TP MCB
40A 4P RCCB
230V
230V
63A TPN M t i d
40A TPN M t i d
40A TPN M t i d
40A TPN M t i d
40A TPN M i d
40A TPN M t i d
4 nos. 100/5A CT
100A TPN MotorizedMCCB
4 nos. 100/5A CT
3 nos. 100/5A CT
100A TPN MotorizedMCCB 3 nos.
100/5A CT
2 mH
2 mH
2 mH3 nos.
30/5A CT Ai2053 nos.
30/5A CT Ai2053 nos.
30/5A CT Ai2053 nos.
60/5A CT Ai205 3 nos. 30/5A CT Ai205
3 nos. 30/5A CT Ai205
Ai205
R Y B
Ai205
R Y B
Ai205
R Y B
Ai205
R Y B
Ai205
R Y B
Ai205
R Y BSYN
2 mH
2 mH
2 mH
2 mH
2 mH
2 mH
2 mH
2 mH
2 mH
2 mH
2 mH
2 mH
Power Source No. 1
R Y B
R Y B
ST
OC & EF
Power Grid
Power Source No. 2
R Y B
R Y B
ST
OC & EF
Power Grid
Ai205
Motorized MCCB
Motorized MCCB
Motorized MCCB
Motorized MCCB
Motorized MCCB
Motorized MCCB
3 nos. 100/5A CT
3 nos. 100/5A CT
3 nos. 100/5A CT
3 nos. 100/5A CT
3 nos. 100/5A CT
3 nos. 100/5A CT
3 nos. 100/5A CT 4 nos.
100/5A CT
100A TPN MCCB
4 nos. 100/5A CT
100A TPN MCCB
100A TPN Motorized MCCB
3 nos. 30/5A CT
2 mH2 mH2 mH2 mH2 mH2 mH
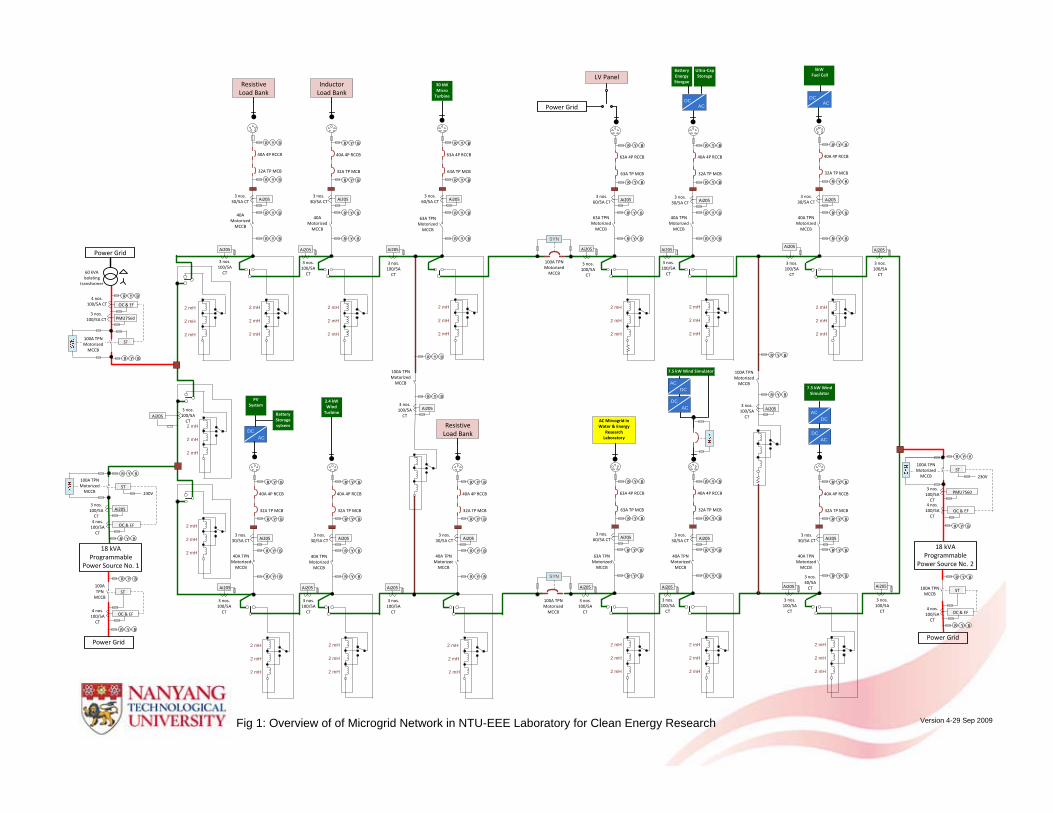
Fig 1: Overview of of Microgrid Network in NTU-EEE Laboratory for Clean Energy Research Version 4-29 Sep 2009
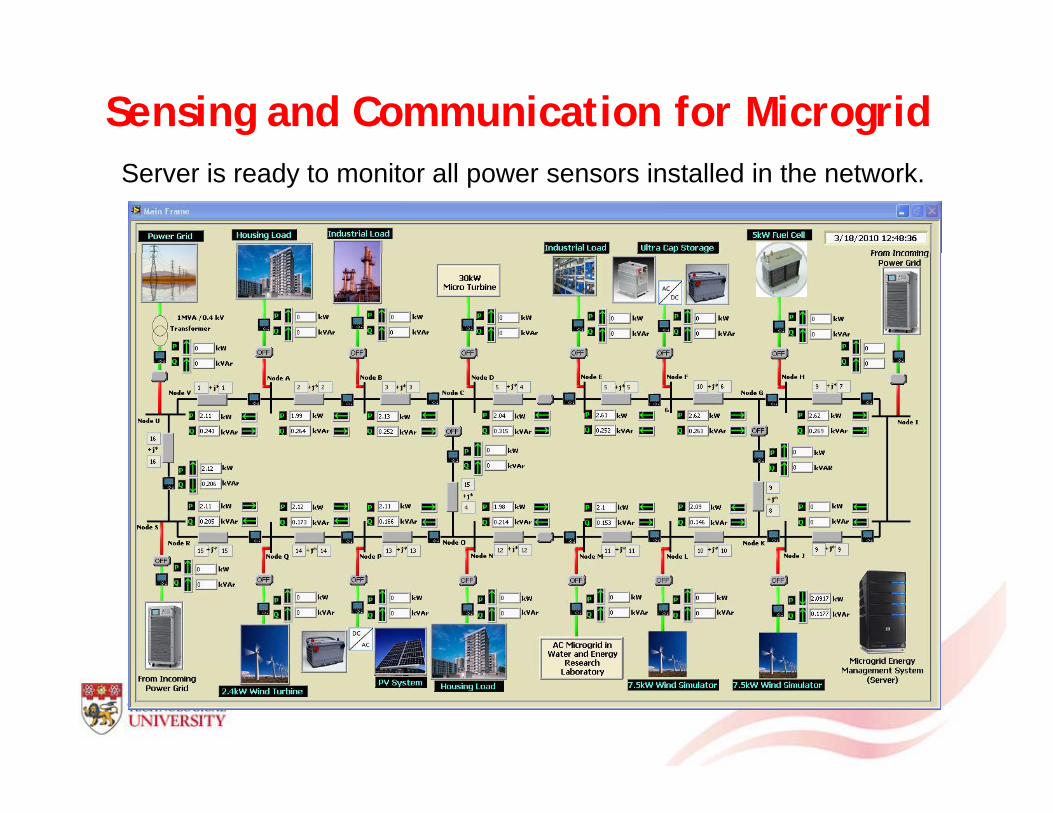
Sensing and Communication for MicrogridServer is ready to monitor all power sensors installed in the network.
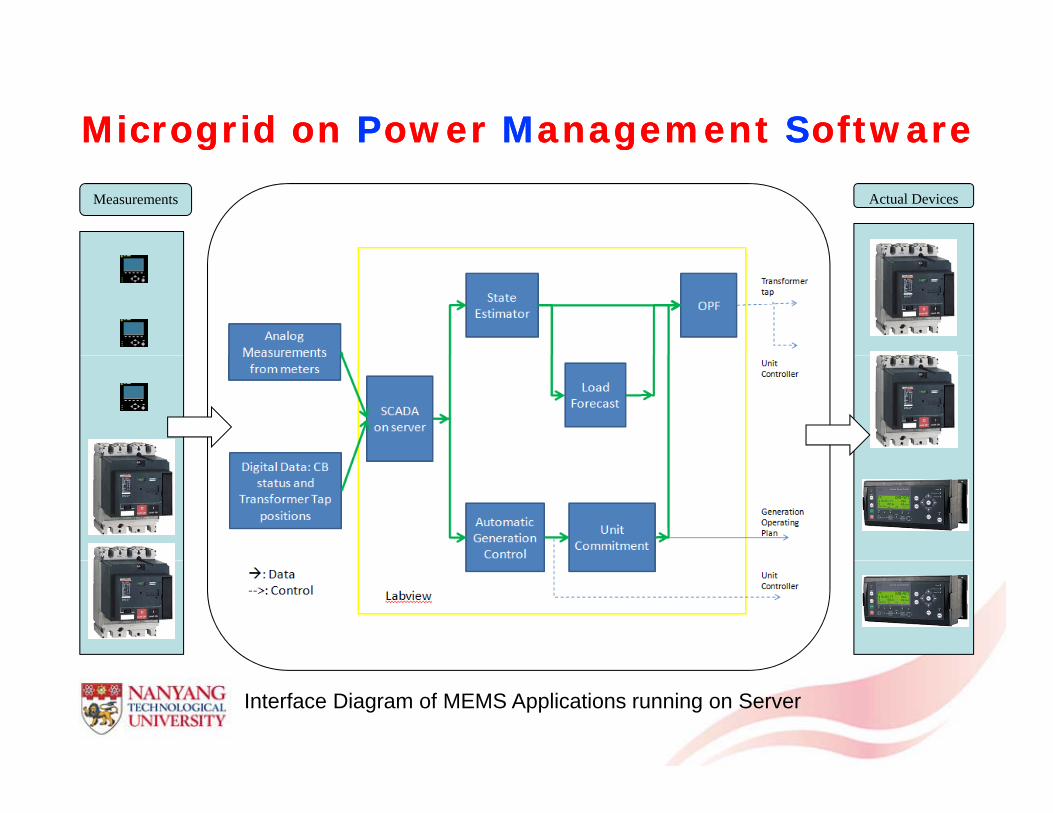
MicrogridMicrogrid on on PPower ower MManagement anagement SSoftwareoftwareMeasurements Actual Devices
Interface Diagram of MEMS Applications running on Server

SE solutionR SE 30 b t kRun SE on 30-bus networkBUS VOLTAGES 1 - Power Flow, 2 - Traditional Method, 3 – Fast Decoupled
V1 V2 V3 V4 -------------------------------------------------1 0600 | 1 0586 | 1 0600 | 1 0470 |
VOLTAGE PHASE ANGLES , and 4 - New Fast Decoupled
Delta1 Delta2 Delta3 Delta4 -----------------------------------------------------------
0 0000 | 0 0000 | 0 0000 | 0 0000 |1.0600 | 1.0586 | 1.0600 | 1.0470 |1.0330 | 1.0457 | 1.0477 | 1.0336 |1.0133 | 1.0242 | 1.0261 | 1.0120 |1.0026 | 1.0158 | 1.0178 | 1.0036 |1.0000 | 1.0119 | 1.0139 | 0.9995 |1.0002 | 1.0171 | 1.0191 | 1.0048 |0.9908 | 1.0069 | 1.0089 | 0.9945 |1.0000 | 1.0222 | 1.0242 | 1.0099 |1 0304 | 1 0428 | 1 0446 | 1 0307 |
0.0000 | 0.0000 | 0.0000 | 0.0000 |-5.2213 | -5.3765 | -5.3933 | -5.5224 |-7.5092 | -7.5991 | -7.5837 | -7.7754 |-9.2647 | -9.3543 | -9.3328 | -9.5747 |
-14.2212 | -14.1360 | -14.0905 | -14.4703 |-11.0413 | -11.1481 | -11.1180 | -11.4099 |-12.8557 | -12.8939 | -12.8513 | -13.1946 |-11.8068 | -11.9736 | -11.9387 | -12.2534 |14 0901 | 14 1346 | 14 0851 | 14 4586 |1.0304 | 1.0428 | 1.0446 | 1.0307 |
1.0136 | 1.0252 | 1.0271 | 1.0129 |1.0720 | 1.0825 | 1.0843 | 1.0709 |1.0450 | 1.0520 | 1.0538 | 1.0398 |1.0710 | 1.0714 | 1.0732 | 1.0594 |1.0267 | 1.0347 | 1.0365 | 1.0223 |1.0192 | 1.0280 | 1.0299 | 1.0156 |1.0244 | 1.0334 | 1.0352 | 1.0211 |1 0114 | 1 0222 | 1 0241 | 1 0099 |
-14.0901 | -14.1346 | -14.0851 | -14.4586 |-15.7164 | -15.7279 | -15.6736 | -16.0909 |-14.0901 | -14.1346 | -14.0851 | -14.4586 |-15.2183 | -15.1665 | -15.1126 | -15.5078 |-15.2183 | -15.1665 | -15.1126 | -15.5078 |-16.1010 | -16.0444 | -15.9871 | -16.4060 |-16.0918 | -16.0534 | -15.9968 | -16.4183 |-15.6998 | -15.6705 | -15.6156 | -16.0293 |15 9255 | 15 9203 | 15 8649 | 16 2879 |1.0114 | 1.0222 | 1.0241 | 1.0099 |
1.0048 | 1.0147 | 1.0166 | 1.0022 |0.9994 | 1.0100 | 1.0119 | 0.9975 |1.0022 | 1.0130 | 1.0149 | 1.0005 |1.0006 | 1.0118 | 1.0137 | 0.9994 |1.0039 | 1.0157 | 1.0176 | 1.0034 |1.0011 | 1.0121 | 1.0140 | 0.9997 |0.9909 | 1.0029 | 1.0048 | 0.9905 |0 9942 | 1 0067 | 1 0086 | 0 9950 |
-15.9255 | -15.9203 | -15.8649 | -16.2879 |-16.6864 | -16.6400 | -16.5812 | -17.0228 |-16.8410 | -16.7985 | -16.7392 | -17.1863 |-16.6186 | -16.5881 | -16.5297 | -16.9712 |-16.2788 | -16.2693 | -16.2128 | -16.6460 |-16.0341 | -16.0371 | -15.9828 | -16.4097 |-16.2930 | -16.2803 | -16.2237 | -16.6573 |-16.3615 | -16.3493 | -16.3001 | -16.7357 |16 1261 | 16 0911 | 16 0741 | 16 5063 |0.9942 | 1.0067 | 1.0086 | 0.9950 |
0.9761 | 0.9884 | 0.9903 | 0.9767 |1.0051 | 1.0182 | 1.0201 | 1.0068 |0.9983 | 1.0177 | 1.0197 | 1.0050 |0.9848 | 0.9983 | 1.0002 | 0.9866 |0.9731 | 0.9867 | 0.9887 | 0.9749 |
-16.1261 | -16.0911 | -16.0741 | -16.5063 |-16.5658 | -16.4964 | -16.4887 | -16.9359 |-15.7017 | -15.6805 | -15.6734 | -16.0935 |-11.7076 | -11.8316 | -11.7999 | -12.1056 |-16.9775 | -16.9226 | -16.9109 | -17.3645 |-17.8943 | -17.8138 | -17.7987 | -18.2773 |
Maximum error of SE method 1 is 2.22 percent in voltage and 2.97 percent in phase angle (CPU time = 0.0221 s).Maximum error of SE method 1 is 2.22 percent in voltage and 2.97 percent in phase angle (CPU time 0.0221 s).
Maximum error of SE method 2 is 2.42 percent in voltage and 3.29 percent in phase angle (CPU time = 0.0158 s).
Maximum error of SE method 3 is 1.23 percent in voltage and 5.77 percent in phase angle (CPU time = 0.0082 s).
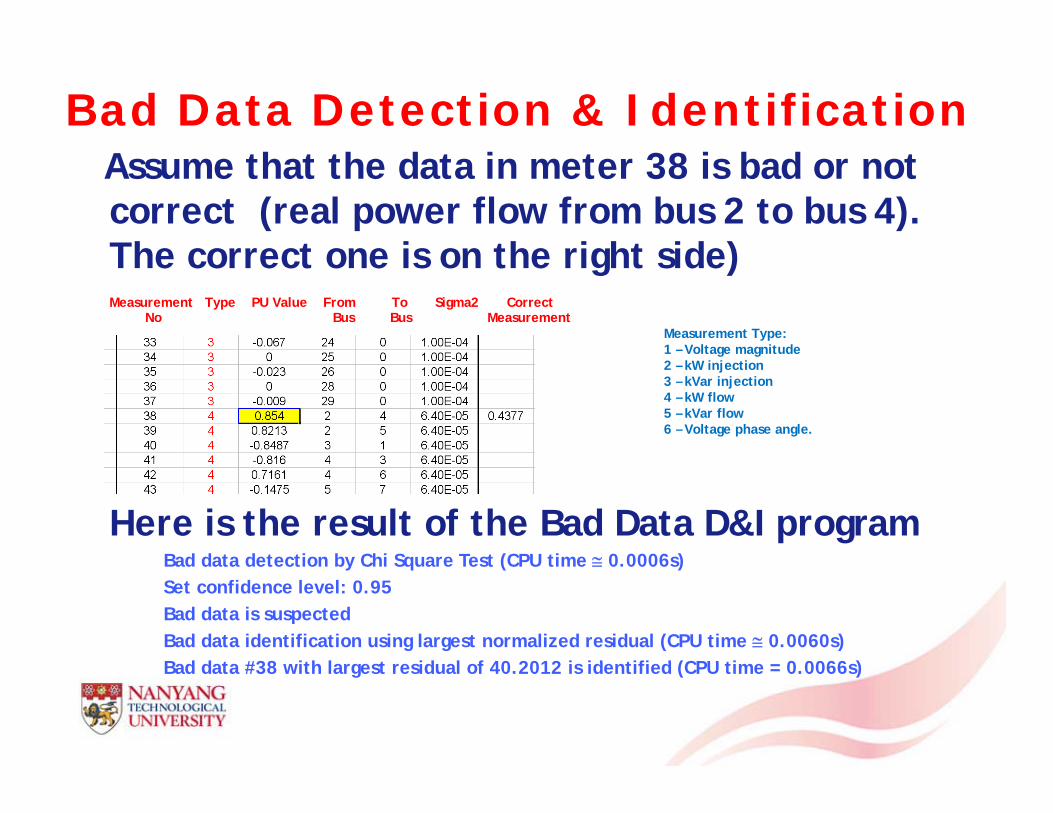
Bad Data Detection & IdentificationAssume that the data in meter 38 is bad or not correct (real power flow from bus 2 to bus 4). The correct one is on the right side)The correct one is on the right side)Measurement Type PU Value From To Sigma2 Correct
No Bus Bus MeasurementMeasurement Type:1 – Voltage magnitudeg g2 – kW injection 3 – kVar injection 4 – kW flow 5 – kVar flow6 – Voltage phase angle.
Here is the result of the Bad Data D&I programBad data detection by Chi Square Test (CPU time 0 0006s)Bad data detection by Chi Square Test (CPU time 0.0006s)Set confidence level: 0.95Bad data is suspected Bad data identification using largest normalized residual (CPU time 0.0060s)B d d t #38 ith l t id l f 40 2012 i id tifi d (CPU ti 0 0066 )Bad data #38 with largest residual of 40.2012 is identified (CPU time = 0.0066s)
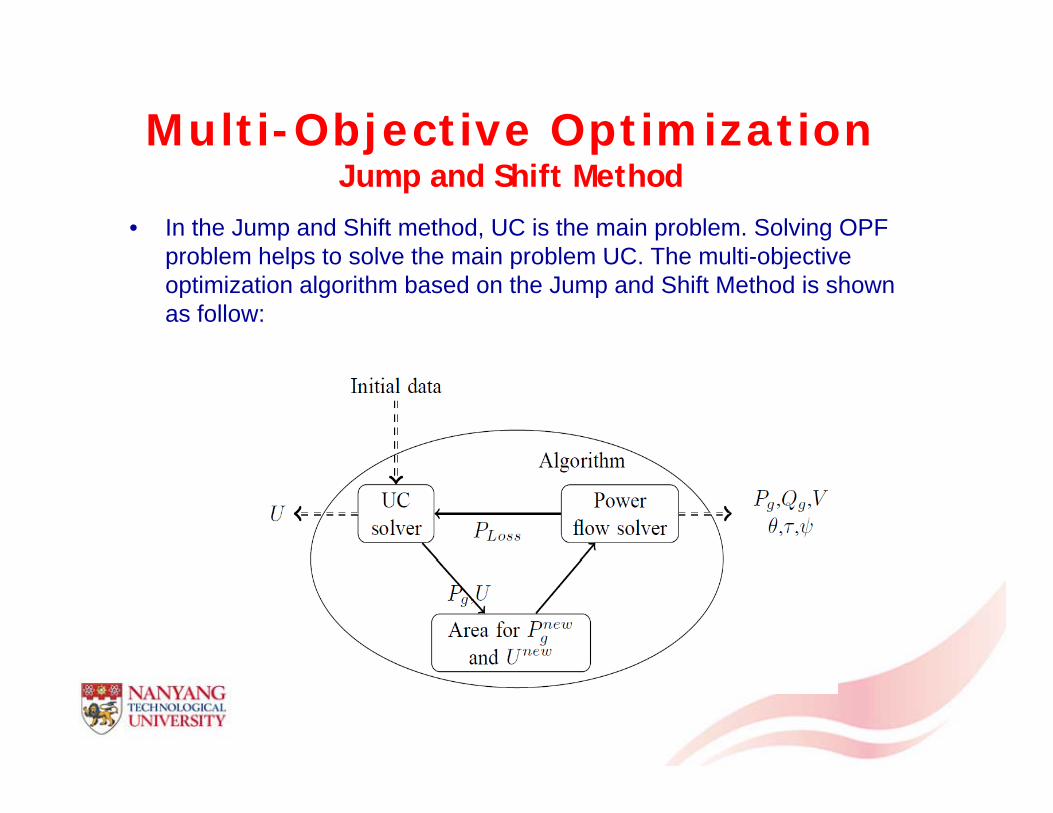
Multi-Objective Optimizationj pJump and Shift Method
• In the Jump and Shift method, UC is the main problem. Solving OPF problem helps to solve the main problem UC The multi objectiveproblem helps to solve the main problem UC. The multi-objective optimization algorithm based on the Jump and Shift Method is shown as follow:
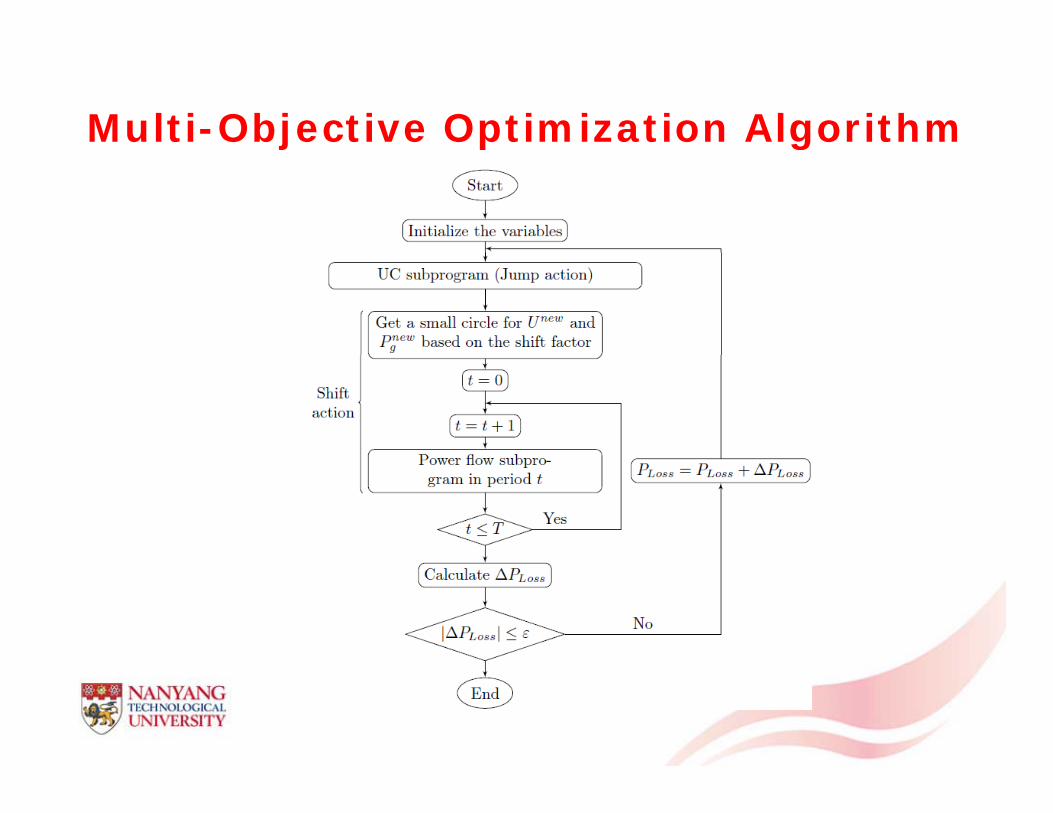
Multi-Objective Optimization Algorithm

Optimization Results on 14-Bus SystemT f iTransformer tap ratios
Total power loss at each solution step
Real power balance and output of ESS

System Configuration and Operation
• Preliminary microgrid is setup using single synchronous generator, active PV generation system and resistive bank to emulate the load
• PV system is made dispatchable by connecting a battery• PV system is made dispatchable by connecting a battery bank
• The system is operated in three modes – Isolated PV system – Grid connected mode– Islanded mode
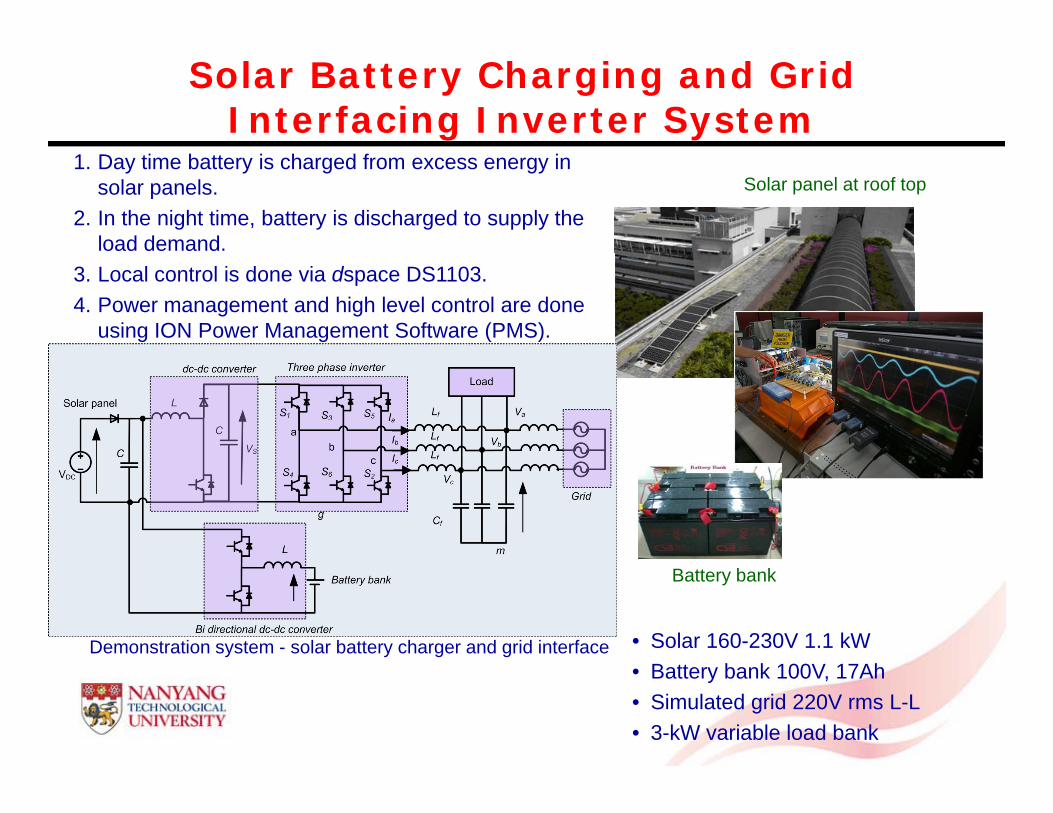
Solar Battery Charging and Grid Interfacing Inverter System
1. Day time battery is charged from excess energy in solar panels.
2. In the night time, battery is discharged to supply the load demand.
Solar panel at roof top
3. Local control is done via dspace DS1103.4. Power management and high level control are done
using ION Power Management Software (PMS).
Power converter
Demonstration system - solar battery charger and grid interface • Solar 160-230V 1.1 kW
Battery bank
• Battery bank 100V, 17Ah• Simulated grid 220V rms L-L• 3-kW variable load bank

Isolated PV System
• PV system is isolated from the rest of the system. It feeds the local load and maintain constant voltage and frequency.
• Synchronous generator is connected to grid.
• By clicking the Solar MCCB in the PMS diagram, the y g gPV system can be put into grid connected mode.
• The inverter controller would adjust the angle and voltage magnitude to match the grid values.
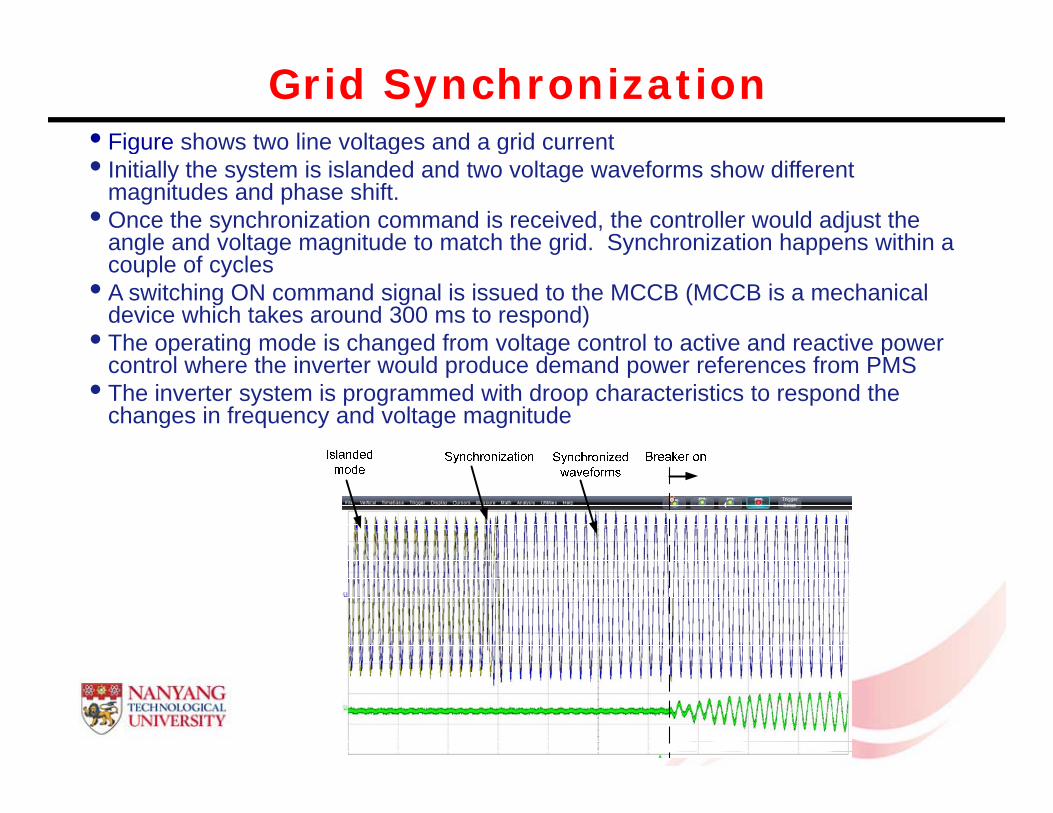
Grid Synchronization • Figure shows two line voltages and a grid currentg g g• Initially the system is islanded and two voltage waveforms show different
magnitudes and phase shift. • Once the synchronization command is received, the controller would adjust the
angle and voltage magnitude to match the grid. Synchronization happens within a g g g g y ppcouple of cycles
• A switching ON command signal is issued to the MCCB (MCCB is a mechanical device which takes around 300 ms to respond)
• The operating mode is changed from voltage control to active and reactive power g g gcontrol where the inverter would produce demand power references from PMS
• The inverter system is programmed with droop characteristics to respond the changes in frequency and voltage magnitude
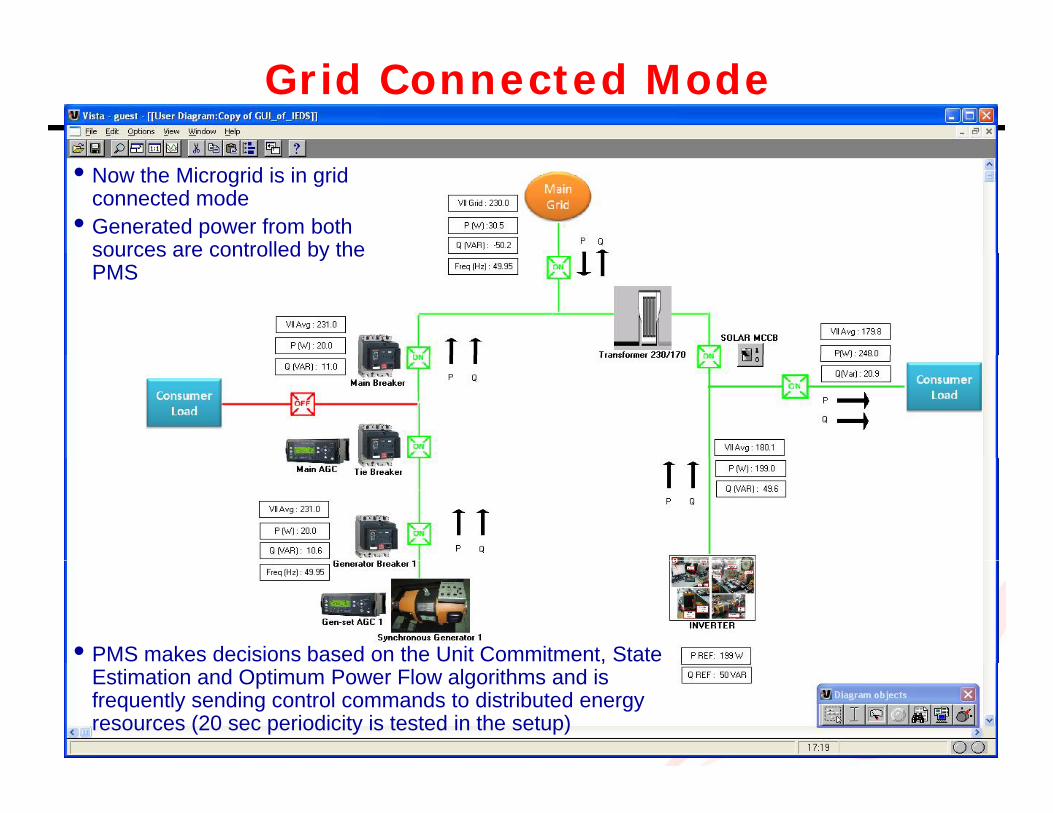
Grid Connected Mode
• Now the Microgrid is in grid connected mode
• Generated power from both sources are controlled by thesources are controlled by the PMS
• PMS makes decisions based on the Unit Commitment, State ,Estimation and Optimum Power Flow algorithms and is frequently sending control commands to distributed energy resources (20 sec periodicity is tested in the setup)

Islanded Mode
• Microgrid is put into islanded mode by disconnecting from grid. Frequency is maintained by the AGC and Economic Dispatch will decide the power dispatchdecide the power dispatch between the PV system and the synchronous generator.
• The PV system would respond to any fast changes in load However slow responding generator would finallyload. However slow responding generator would finally take over the excess load demand by slowly adjusting the frequency.

Fuel Cell System
• Acquire hydrogen supply to power the 5-KW fuel cell system• Design high boost converter topologies for interface
Four new families of ZSI are proposed with extended boosting capability particularly for Fuel cell systems
– Diode assisted C i i d
5-kW Fuel Cell Proposed Hydrogen
– Capacitor assisted– Continuous current– Discontinuous current
Diode assisted continuous current qZSI Storage at S2-B7
Capacitor assisted discontinuous current qZSI
DCSS
S VDD
v
121
1ˆ2ˆˆ S
xvMv
1 SS 2
DCS
S VD
v311ˆ
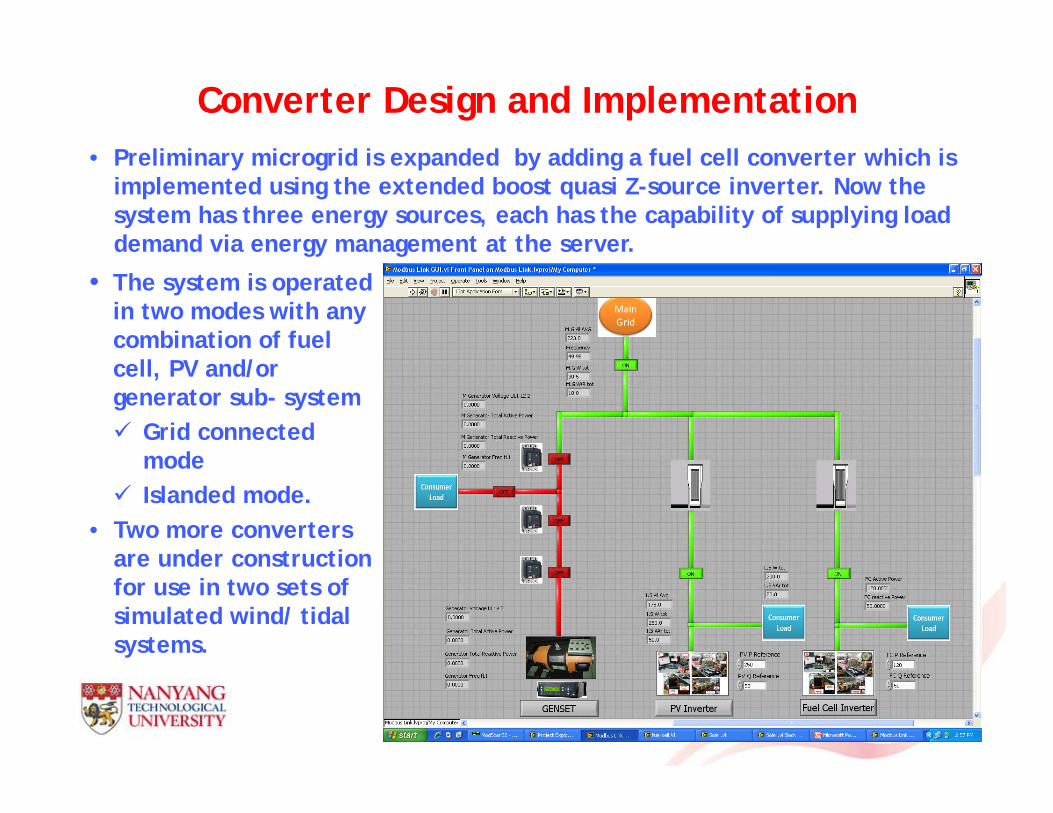
Converter Design and Implementation P li i i id i d d b ddi f l ll t hi h i • Preliminary microgrid is expanded by adding a fuel cell converter which is implemented using the extended boost quasi Z-source inverter. Now the system has three energy sources, each has the capability of supplying load demand via energy management at the server.gy g
• The system is operated in two modes with any combination of fuel cell, PV and/or generator sub- system Grid connected
modemode Islanded mode.
• Two more converters are under construction are under construction for use in two sets of simulated wind/ tidal systems.
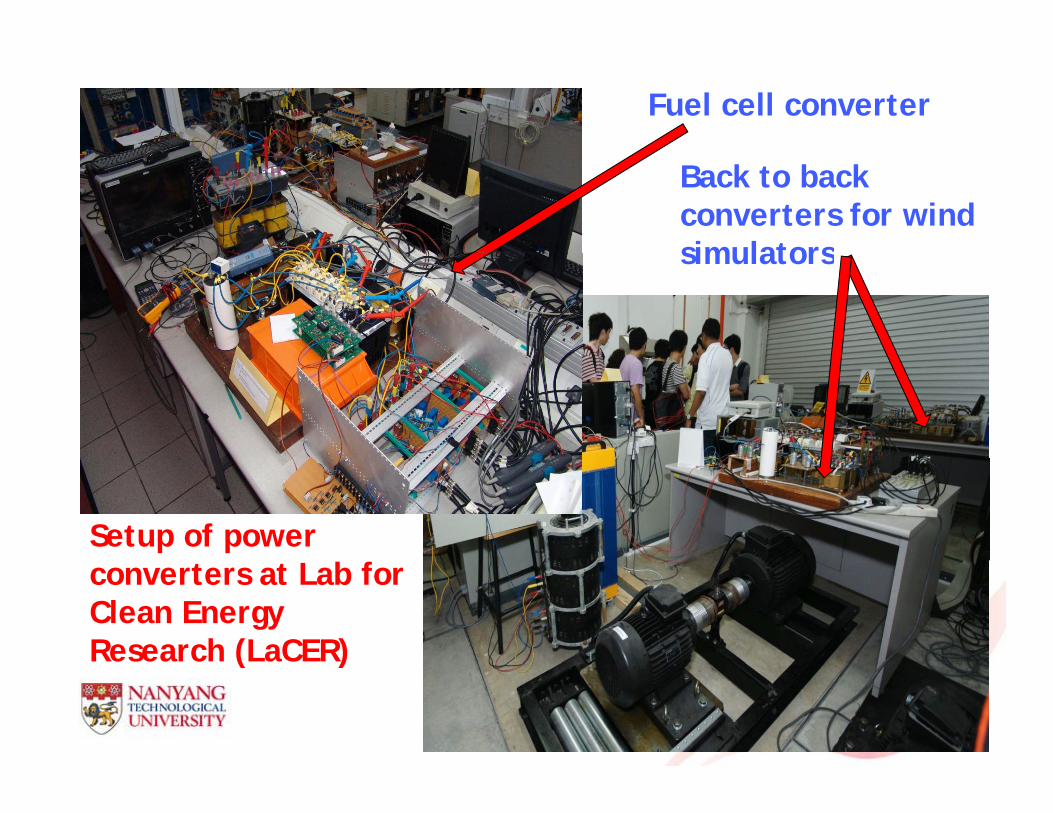
Fuel cell converter
Back to back converters for wind simulatorssimulators
Setup of power converters at Lab for Clean Energy Research (LaCER)( )
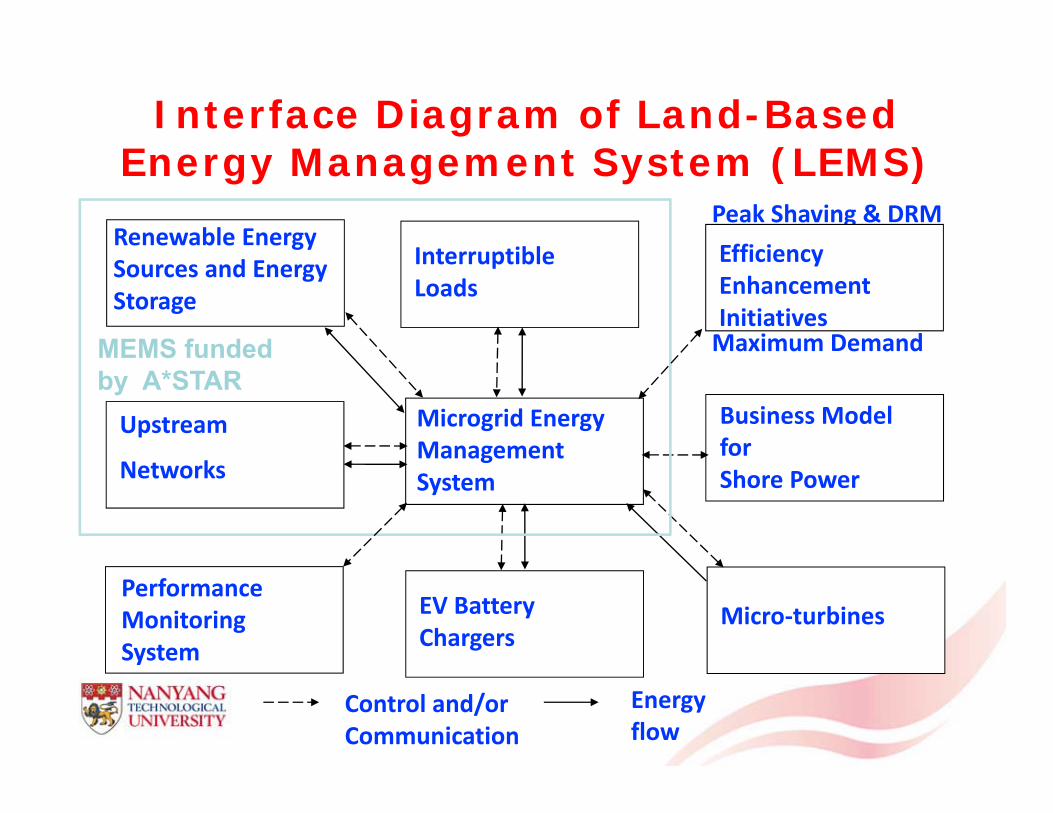
Interface Diagram of Land-Based E M t S t (LEMS)
Peak Shaving & DRM
Energy Management System (LEMS)
EfficiencyRenewable Energy
Interruptible
Maximum Demand
Efficiency Enhancement Initiatives
Sources and Energy Storage
Interruptible Loads
MEMS funded
Microgrid Energy Management
Upstream Business Model for
MEMS funded by A*STAR
Management System Networks Shore Power
Micro‐turbinesEV Battery Chargers
Performance Monitoring System
Control and/or Communication
Energy flow
y

LEMS Research Conceptp
• IMO limits the sulphur content of marine fuels to less than 4.5% effective from now (2010), 3.5% by 2012 andthan 4.5% effective from now (2010), 3.5% by 2012 and 0.5% by 2020.
• We could switch to shore power when ships are at berth.• Shore power is usually derived from land based electrical• Shore power is usually derived from land-based electrical
generation system powered by cleaner fuels.• We propose a generation system comprises renewable
energy resources such as PVs, CHP or CCHP micro turbines and energy storage system, e.g. Li-ion technology.technology.
• To manage all the above energy resources, a LEMS is needed.

LEMS Research Concept - Contd• LEMS incorporatesLEMS incorporates
- Optimization of Own Power Generation based onLEMS load forecast and upstream electricity tariffEffi i E h t I iti ti h- Efficiency Enhancement Initiatives such as powerloss, reactive power management and power factorcorrection for each electrical load facility
- Demand Response Management to facilitate load control or short term load reduction during periods ofhigh TOU electricity priceshigh TOU electricity prices
- Peak Shaving via use of energy storage system andown LEMS generationMaximum Demand Management to avoid paying- Maximum Demand Management to avoid paying uncontracted capacity charge (can be as high as 50%)
Contracted and uncontracted capacity charges are 6.96 and 10.44 $/kW/month; kWh peak and off peak kVARh charges are 21 50 12 95 and 0 59 centskWh peak and off-peak, kVARh charges are 21.50, 12.95 and 0.59 cents
LEMS Research Concept - Contd
• LEMS incorporates - Business Model for shore power and revenue
ti b lli l t i l t hi t b thgeneration by selling electrical power to ships at berth - Renewable Energy Sources for greener shipyard and
lower carbon footprintp- Performance Monitoring System to trackperformance statistics for each electrical load facility, e.g.dry dockdry dock
- EV Battery Chargers for hybrid forklifts and hybridcherry pickers after conversionMi t bi f CCHP CHP i ti- Micro-turbines for CCHP or CHP, i.e. power generation,cooling and heating

EMA Smart Energy Challenge•• On16 November 2009, EMA)has launched the Smart Energy Challenge
(SEC) to provide seed funding of up to S$5 million per project for innovative energy ideas that meet Singapore’s energy needs.
•• Through the SEC, the EMA aims to support new energy solutions that (i) enhance our energy security through fuel diversification, (ii) achieve higher energy efficiency and (iii) boost the development of the energy
tsector.• The SEC will focus on innovative energy solutions in three key areas: (a)
Power Generation, (b) Energy for Transport and (c) Energy Efficiency for I d tIndustry.
• The SEC is open to all Singapore-based Institutes of Higher Learning, public sector agencies, not-for-profit organizations/research laboratories
d i t t i ll ffili t d hand private sector companies, as well as company-affiliated research laboratories/institutions with an interest in R&D and test-bedding technologies and solutions. The closing date for the submission of proposals is 20 February 2010proposals is 20 February 2010.

EMA Launched IES Projectto be implemented at NTU, CleanTech Park at Jln Bahar, & selected residential commercial and industrial& selected residential, commercial and industrial buildings.

Intelligent Micro-Grid with Renewable Energy Technologies for Pulau Ubingy g
• The off-grid concept will displace the diesel generators currently being used by organizations, small businesses and individual g y ghomes on the island.
• The project will showcase how clean and renewable energy can be deployed in an environmentally socially and economicallybe deployed in an environmentally, socially and economically sustainable manner for an off-grid community.
• Pulau Ubin will also host a number of plug and play test-bedding facilities for various clean and renewable energy solutions. This will help elevate Singapore as a “living laboratory” to research, develop and demonstrate new energy y p gytechnologies.
• The design and construction of the agreed concept plan, and is targeted to be completed by April 2011targeted to be completed by April 2011.

Q & A SessionQ & A Session